Distribution, Enrichment and Transport of Trace Metals in Sediments from the Dagu River Estuary in the Jiaozhou Bay, Qingdao, China


1
College of Earth Science and Engineering, Shandong University of Science and Technology, Qingdao 266590, China
2
Laboratory for Marine Geology, Qingdao National Laboratory for Marine Science and Technology, Qingdao 266061, China
3
Key Laboratory of Marine Environmental Geology, Ministry of Natural Resources, Qingdao Institute of Marine Geology, Qingdao 266071, China
*
Authors to whom correspondence should be addressed.
Minerals 2019, 9(9), 545; https://doi.org/10.3390/min9090545
Submission received: 8 August 2019
/
Revised: 7 September 2019
/
Accepted: 8 September 2019
/
Published: 10 September 2019
(This article belongs to the Special Issue Metallic Elements in Sediments)
Abstract
:26 river bank sediments and 15 estuary seafloor sediments were sampled from the Dagu River and the estuary of Northwestern Jiaozhou Bay to determine contaminations of heavy metals and metalloids (Cu, Pb, Zn, Cr, Cd, Hg and As). The trace metal contents in sediment from the estuary area were much higher than those of the river. Correlation analysis showed that except for Pb, the metals were mainly controlled by the grain size, and enriched by adsorption of aluminosilicate minerals, Fe/Mn oxides and organic matter in river and estuary sediments. In addition to Cu in some stations, the metals met the requirements of the marine organism and humans for the quality of the marine environment. The concentrations of Cu, Pb, Cr, Hg and As were between the threshold effect level (TEL) and probable effect level (PEL), indicating those metals might have occasional adverse effects. Results of Enrichment Factor values revealed that the entire study area was enriched in Pb and Hg, at moderate environmental risk, but the estuary was more significant. Pb and Hg contaminations in this area were mainly from coal combustion and automobile emissions. River runoff and atmospheric deposition dominated the metals distribution and enrichment in the study area. Contaminants in sediments entering the estuary were further transported to the south and east under the river runoff and reciprocating current in the Jiaozhou Bay.
1. Introduction
The coastal zone is the region most closely related to human survival and development in the ocean and also a key area for studying global change, which plays an increasingly important role in modern society [1,2,3]. With rapid population agglomeration, urban expansion, economic development, the contradiction between the population and environment has become increasingly prominent and many coastal areas in China face serious environmental risks [4,5,6,7]. Rivers play an important role in the development of the regional economy. However, excessive human activities such as industrial production, agricultural irrigation and domestic water use has caused the river to become a discharge channel for industrial and domestic pollutants [8,9]. Coupled with runoff and sediment load that has drastically reduced, the dilution and absorptive capacity of the river has correspondingly dropped, and environmental risks are becoming increasingly severe. As a consequence, the economic development and ecological environment of the region has been seriously affected due to the large amounts of industrial and agricultural and domestic wastewater discharged into the sea [4,5]. Heavy metals and metalloids are defined as metallic elements that can cause toxicity at lower levels [10]. If they accumulate and reside in sediments for a long time, they will endanger human health through the food chain [11,12]. In recent years, people have been paying increasing attention to the contamination of these metals in the environment. Therefore, understanding the concentration changes and contamination status of heavy metals and metalloids is essential for regional contamination control and environmental restoration.
There has also been a large number of heavy metals and metalloids studies in the study area. Hg, Cu, Ni and Zn in the Dagu River were present far more than what is allowed according to the standards of the Florida Department Environmental Protection (FDEP) [13]. Cd, As, and Pb contamination occurred in the eastern catchment of the Jiaozhou Bay [8]. In the Jiaozhou Bay, Cd and Sb in sediments were in relatively higher enrichment levels, and Cu, Ni, Cd and Zn were at low to medium risks [14]. Over 40.0% of Cu and As came from anthropogenic emissions from the 1950s [15]. However, previous studies did not use river-estuary-bay as a source-sink system for heavy metals and metalloids research in the region of the Jiaozhou Bay. The aims of our study were to: (1) elucidate the distribution of heavy metals and metalloids (Cu, Pb, Zn, Cr, Cd, Hg and As) in sediments from the Dagu River and the estuary; (2) evaluate sediment environmental quality and metal contaminations; (3) reveal the sources and transportation of trace metals. The study will be of help in fully understanding the enrichment characteristics of heavy metals and metalloids in coastal river systems, and also provide references for environmental quality.
2. Materials and Methods
2.1. Study Area
Qingdao is a coastal hilly city (Figure 1) located on the Southeast coast of Shandong Province, with a population of 9.39 million in 2018, covering an area of 11,282 km2. Its terrain is high in the east and low in the west. It is located in the sub-tectonic unit of the Xinhuaxia uplift zone—the Northeastern margin of the Jiaonan uplift and the South-central part of the Jiaolai depression [16,17,18,19,20,21,22]. The entire Paleozoic strata and some Mesozoic strata are missing in the area, but the volcanic strata of the Cretaceous Qingshan Formation are well developed and widely exposed. The magmatic rocks are mainly composed of the Yuejishan gneissic granite in the Jiaonanian period of the Proterozoic, and the Aishan granodiorite and the Laoshan granite in the late Yanshanian period of the Mesozoic [23,24,25,26,27,28,29,30].
The Jiaozhou Bay (JZB) is located off the Southern coast of Shandong Peninsula in China, which is a semi-closed bay, connecting to the Yellow Sea (Figure 1). It covers an area of 397 km2 with an average water depth of 7 m, deepening from the Northwest to Southeast [31,32,33,34]. The annual amount of river sediments discharged into the bay is about 1.5 × 10⁴ tons, mainly from the Dagu River [34]. The Dagu River is 179.9 km long and has a drainage area of 4161.9 km2. The river sediments entering the sea are mainly deposited in the Northwestern part of the bay. The tides in the Jiaozhou Bay are semi-diurnal (average tidal range: 2.80 m) [32]. The tidal current velocity of the flood tide is greater than that of the ebb tide, which is generally 10–15 cm/s in the bay. Since the 1980s, the construction of dams or reservoirs in river basins and climate change has dramatically reduced river loads [33], resulting in bay sediment transport that is mainly affected by tidal currents [35]. The Jiaozhou Bay Bridge with a total length of 26.7 km was built in 2011, across the east and west coasts of the Jiaozhou Bay (Figure 1).
2.2. Sampling
Forty-one samples were collected from the upper layers of sediments in the Dagu River (Qingdao, China) and the estuary (Figure 1). Among them, 26 river beach sediments covering upstream and downstream of the whole river were collected by a wooden shovel in the natural banks as much as possible to avoid human influence. 15 seafloor sediments were collected using a grab sampler in the Dagu River Estuary of Northwestern Jiaozhou Bay. All samples were packed in plastic bags and transported to the laboratory.
2.3. Analytical Methods
All samples were sub-packed for grain size analysis and elemental analysis. The subsamples were first immersed in 15 mL distilled water, 5 mL 10% hydrogen peroxide (H2O2) and 5 mL 0.1 mol/L hydrochloric acid (HCl) to remove organic matter, calcium carbonate and other impurities. Then, 5 mL of 0.5 mol/L sodium hexametaphosphate (Na(PO3)6) was used to disperse the particles sufficiently [1,2]. Grain size was tested by a laser particle size analyzer (Mastersizer-2000, Malvern, UK). Millimetre unit (mm) of grain diameter (d) was converted to the equivalent Phi unit (Φ) according to the formula , and then classified based on the Udden-Wentworth classification. Grain size parameters were calculated following the formula of Folk and Ward [36].
The subsamples for element analysis were dried and ground to a powder less than 200 meshes. About 0.2 g samples were placed in a teflon digestion vessel, a mixed solution of HNO3 + HCl + HF (5:4:1) was added and allowed to digest, then the samples were heated to 120 °C for 12 h on a heating plate. The samples were then moved to an oven dry, and then extracted with HNO3. Al, Fe and Mn was measured with an X-ray fluorescence spectrometer (XRF, Axios PW4400, Almelo, The Netherlands). Cu, Pb, Zn, Cd and Cr were measured with inductively coupled plasma mass spectrometry (ICP-MS, Thermo X series, Waltham, MA, USA). As and Hg were measured with an atomic fluorescence spectrometer (AFS-920, Beijing, China). 115In was used as an internal standard element (unit: 10 ppb) during the analysis process of ICP-MS. The total organic carbon (TOC) was measured with an elemental analyzer (Vario EL-III, Langenselbold, Germany) [4,5]. The analyses for data QA/QC were used with GBW07345, GSD9, and GSD4 [37]. The recoveries ranged from 90% to 110%, except for Cr (99 to 113%). The relative error was less than 5%, and the precision for replicate samples was controlled below 10% [37].
2.4. Assessment of Sediment Contamination
The primary criteria (MSQ-1) from the Chinese marine sediment quality criteria (GB 18668-2002) [38] is suitable for assessing the effects of the metal toxicity on marine organism and humans [4]. The criteria were established by the Administration of Quality Supervision, Inspection and Quarantine (AQSIQ, 2002), and widely used for the assessment of estuarine-nearshore environmental quality [38].
The sediment quality guidelines (SQGs) are also applied to assess the sediment-associated chemical status that might adversely affect aquatic organisms [39,40,41]. Chemical concentrations below the threshold effect level (TEL) represent adverse biological effects that rarely occur, and concentrations above the probable effect level (PEL) represent adverse biological effects that are more frequently observed [40,41].
Enrichment factor (EF) is used to estimate contamination status of heavy metals and metalloids and distinguish between the anthropogenic source and natural origin. In order to eliminate the particle size effect, Al is often used for elimination [4,42,43]. The EF values were calculated using the following formula:
where, (Me/Al)sample and (Me/Al)baseline are the ratios of one metal to Al in the sample measured and natural background value, respectively. The evaluation grade is divided as follows: no enrichment (0.5 < EF < 1.5), minor enrichment (EF = 1.5–3), moderate enrichment (EF = 3–5), moderately severe enrichment (EF = 5–10), severe enrichment (EF = 10–25), very severe enrichment (EF = 10–25) and extremely severe enrichment (EF > 50) [44,45]. The average metal concentrations of the upper continental crust in North China [46] were used as the background metal values (Cu = 25, Pb = 15, Zn = 61, Cr = 90, Cd = 0.091, Hg = 0.0094 and As = 5.6, concentration unit: mg kg−1).
EF = (Me/Al)sample/(Me/Al)baseline
2.5. Geostatistical Methods
Pearson correlation analysis is used to measure the degree of linear association between two variables, with a range of r coefficient values from −1 to +1 and is widely used in natural science research. The closer the r coefficient is to ±1, the stronger the linear relationship between the two variables. In addition, to evaluate the total metal variability in sediments, we also used factor analysis based on the principal component method and used a rotated orthogonal factor matrix for metal values. Pearson correlation analysis and factor analysis were both carried out using the SPSS software (IBM, Armonk, NY, USA) [47].
The analysis of the grain-size trends modified by Gao and Collins (1992) were used to obtain a net transport trend of sediments in the estuary, which transformed “trend vectors” into “transport vectors”, representing the net transport paths [48]. The trend vectors were defined based on the two specific trends proposed by McLaren and Bowles (1985), which dominates along the transport path. One is that the sediments will become finer, better sorted and more negatively skewed, the other is that the sediments will become coarser, better sorted and more positively skewed [49]. The approach obtains a trend vector by comparing the grain size parameters (mean grain size, sorting coefficient and skewness) of each sampling site to the neighbouring site. If the spatial distance between any two sites is less than the characteristic distance (Dcr, representing the space-scale of sampling in the grid of sampling sites), they are considered as neighbouring sites and their grain-size parameters are compared. The determination of the characteristic distance needs to comprehensively consider the sampling intervals and the spatial differentiation eigenvalues of the grain size parameters [48]. Grain size trends were obtained using the Gao-Collins model [50] and were drawn using the Surfer software (Golden, Lakewood, CA, USA).
3. Results
3.1. Sediment Characteristics
According to Folk’s classification [51], all 41 sediment samples were identified. The river sediment types were mainly composed of coarse particles such as sandy gravel, gravelly sand and gravelly mud with very poor sorting. The mean grain size (Mz) in the river sediments ranged between −1.6Φ and 6.8Φ (average 1.5Φ), and the mud contents (>4Φ) varied between 0.1% and 96.2% (average 22.7%), indicating that the sediment particle sizes varied greatly at different sites in the river basin, but were mainly dominated by sand components (Figure 2). Moreover, the downstream sediment particles were significantly finer than those upstream, especially in the region closer to the estuary. The surface sediment types in the Dagu River Delta were mainly characterized by mud deposits such as sandy silt, sandy mud, mud and clay with poor sorting. The Mz values in the estuary delta sediments varied between 2.0Φ and 6.3Φ (average 4.5Φ), and the mud contents (>4Φ) ranged between 77.3% and 98.0% (average 87.4%), indicating that the sediments were fine-grained and mainly consisted of silt components. It can be seen that the estuary delta sediments were finer in size and had much higher mud contents than those of the river, indicating that the estuary delta was the main sedimentary area of fine particles (Figure 2).
3.2. Heavy Metals and Metalloids Concentrations
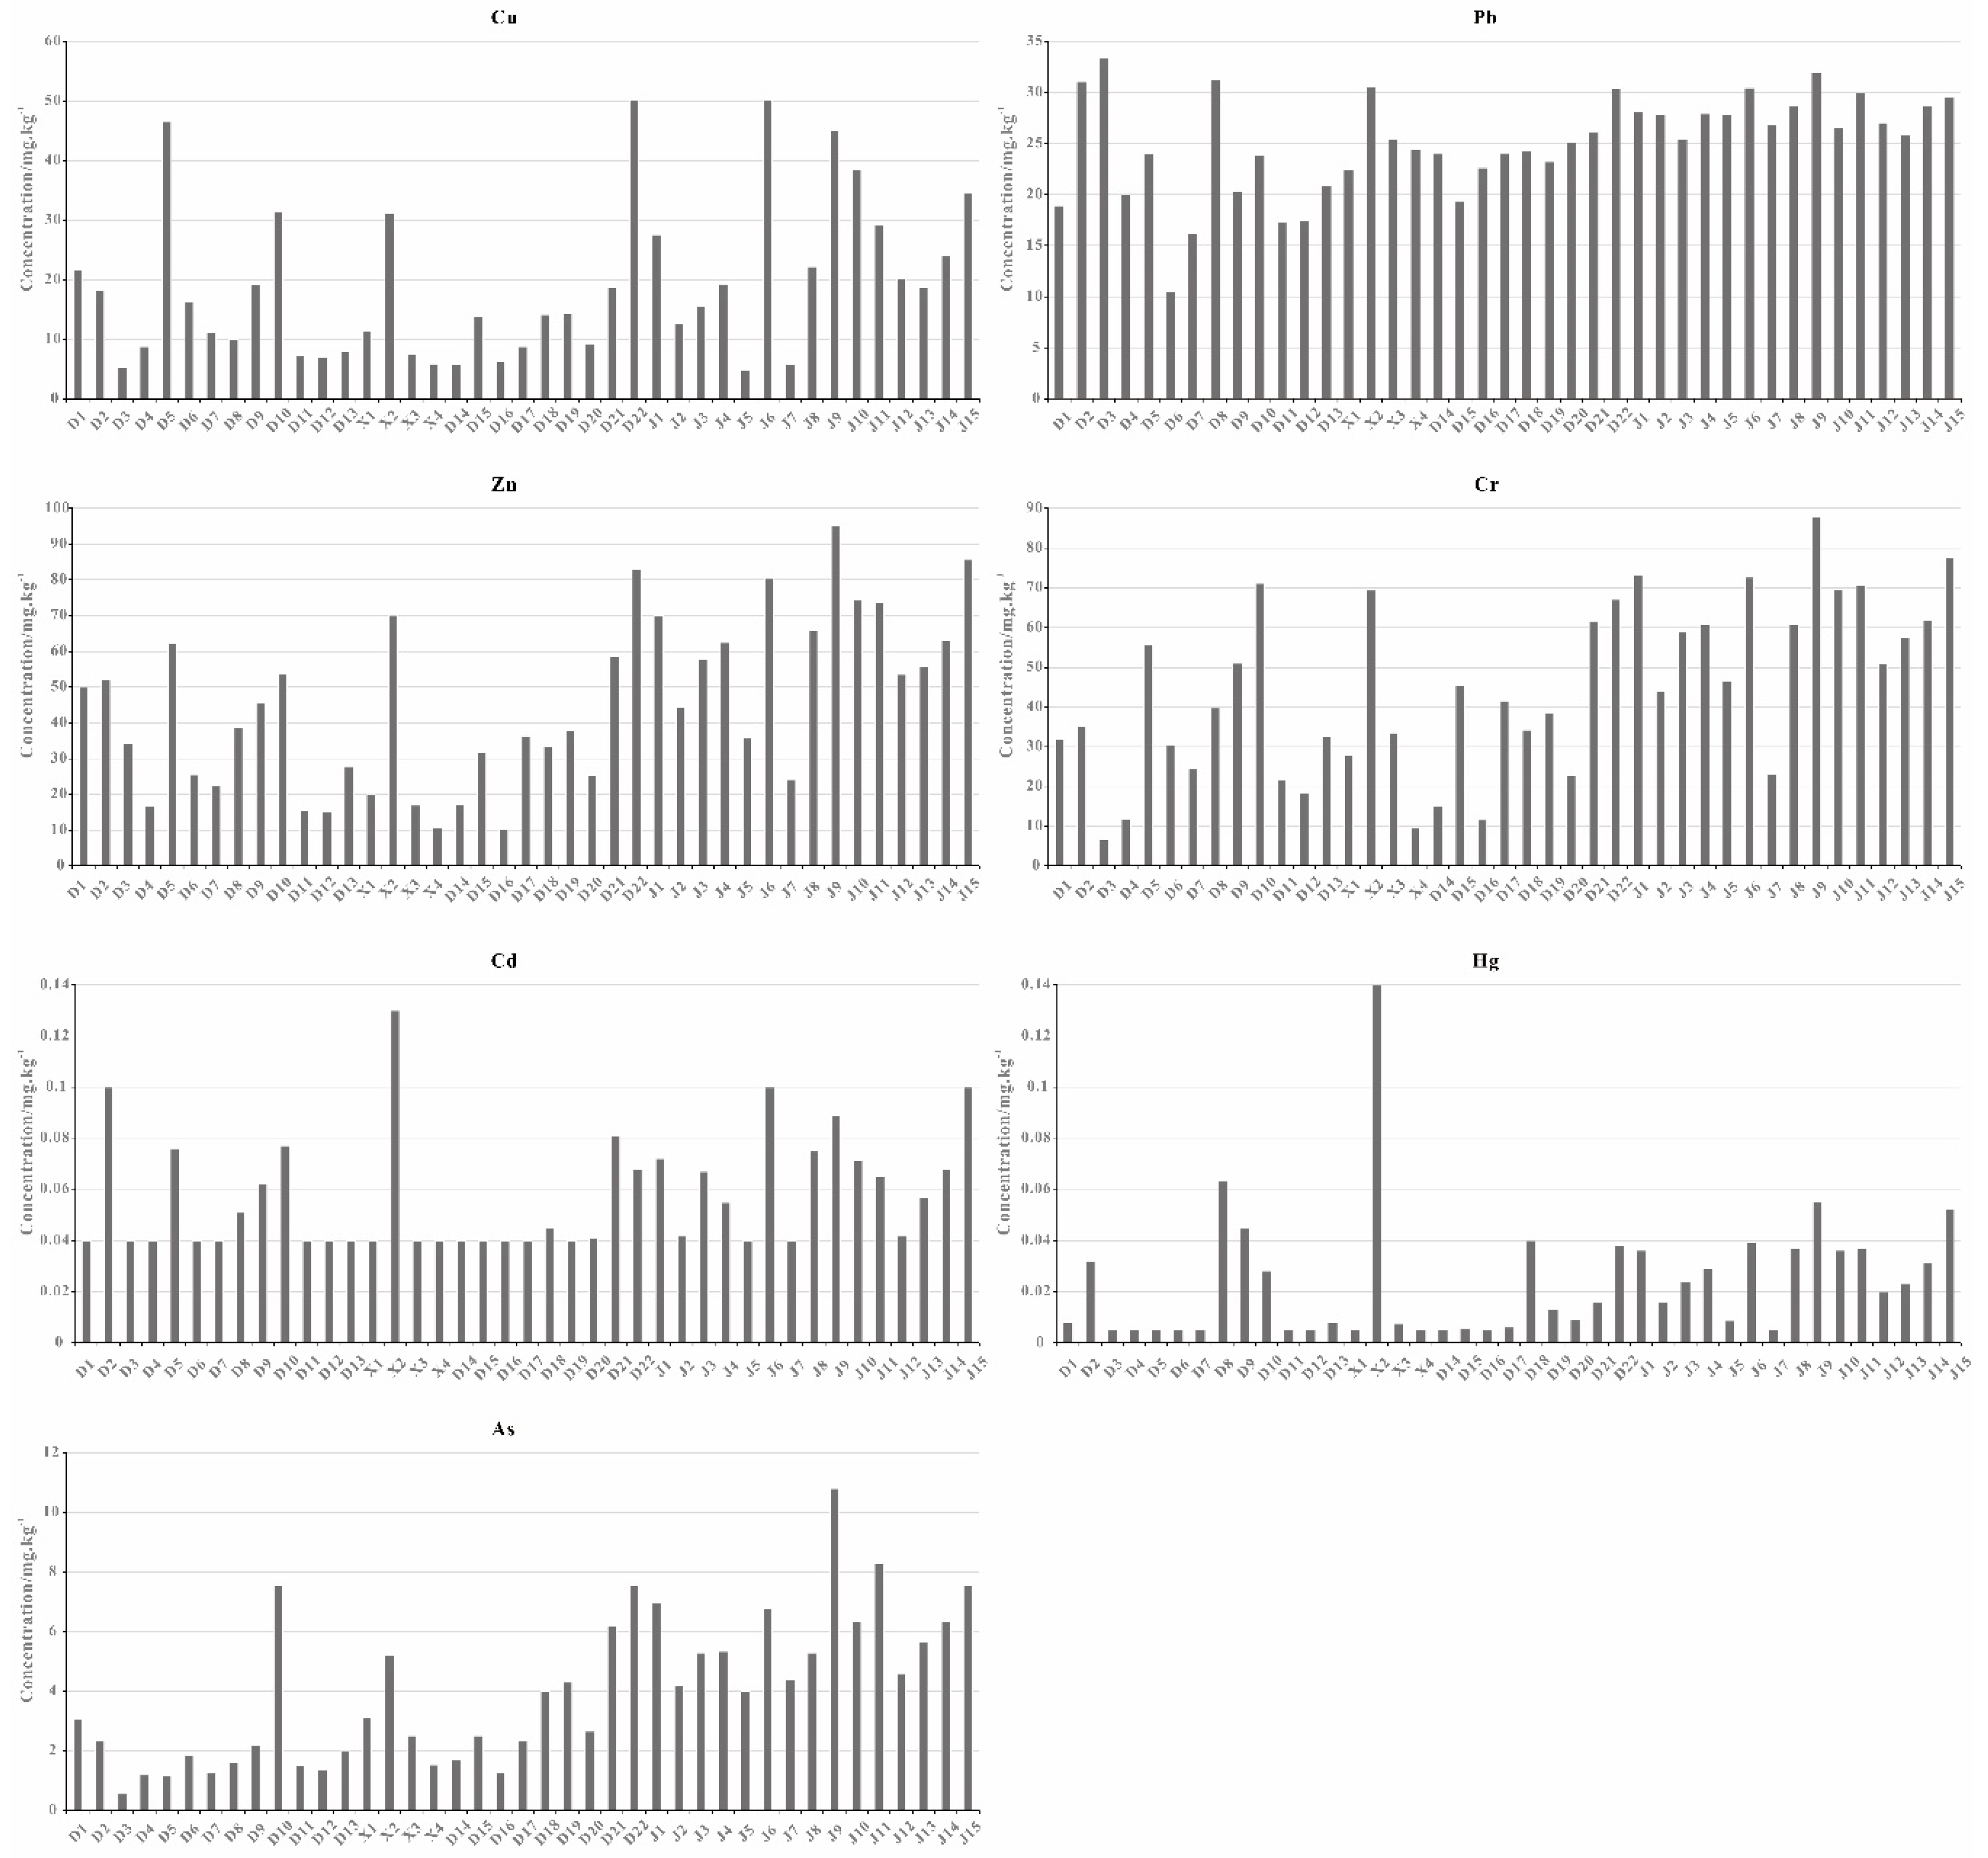
As shown in Table 1, the contents (mg kg−1) of the heavy metals and metalloids in the Dagu River were as follows: Cu (5.2–50.2, average: 15.7), Pb (10.5–33.3, average: 23.3), Zn (10.2–83.0, average: 33.0), Cr (6.7–71.2, average: 34.9), Cd (0.04–0.13, average: 0.05), Hg (0.005–0.14, average: 0.02) and As (0.56–7.56, average: 2.79). In the estuary area, the concentrations of the heavy metals and metalloids were as follows: Cu (4.9–50.1, average: 24.6), Pb (25.4–31.9, average: 28.1), Zn (24.2–95.1, average: 62.8), Cr (23.0–87.8, average: 61.1), Cd (0.04 to 0.10, average: 0.07), Hg (0.005–0.055, average: 0.03) and As (4.0–10.8, average: 6.1). Obviously, the metal contents in sediments from the estuary area were much higher than those of the river (Figure 3).
We compared the metal concentrations from the Dagu River estuary area to those of other estuaries and coastal areas (Table 1). The metal concentrations in the Dagu River Estuary were much lower than those in the intertidal Jiaozhou Bay [9], Coastal Bohai Bay [52], Changjiang River Estuary [53] except for Pb, and Pearl River Estuary [54]. However, they were significantly higher than those found in Liaodong Bay for Cu and Cr [43], Luanhe River Estuary for Cu, Zn, Cr and Hg [4], Laizhou Bay for Cu, Pb, Zn, Cr [55], and Changjiang River Estuary for Pb.

Table 1.
Comparison of heavy metals and metalloids concentrations in the surface sediments of the Dagu River Estuary and other representative areas (unit: mg) kg−1).
Table 1.
Comparison of heavy metals and metalloids concentrations in the surface sediments of the Dagu River Estuary and other representative areas (unit: mg) kg−1).
| Locations | Cu | Pb | Zn | Cr | Cd | As | Hg | References |
|---|---|---|---|---|---|---|---|---|
| Dagu River | 15.68 (5.20~50.20) | 23.30 (10.50~33.30) | 35.01 (10.20~83.00) | 34.94 (6.69~71.20) | 0.05 (0.04~0.13) | 2.79 (0.56~7.56) | 0.02 (0.005~0.140) | This study |
| Dagu River Estuary | 24.56 (4.90~50.10) | 28.14 (25.40~31.90) | 62.84 (24.20~95.10) | 61.06 (23.00~87.80) | 0.07 (0.04~0.10) | 6.12 (4.0~10.8) | 0.030 (0.005~0.055) | This study |
| Intertidal Jiaozhou Bay | 38.8 | 55.2 | 107.4 | 69.9 | 0.42 | 9.2 | na | [9] |
| Liaodong Bay | 19.4 | 31.8 | 71.7 | 46.4 | na | 8.3 | 0.04 | [43] |
| Luanhe River Esturary | 18.76 | 30.98 | 44.63 | 41.14 | 0.09 | 7.21 | 0.02 | [4] |
| Coastal Bohai Bay | 38.5 | 34.7 | 131.1 | 101.4 | 0.22 | na | na | [52] |
| Laizhou Bay | 22 | 21.9 | 60.4 | 60 | 0.12 | 12.7 | na | [55] |
| Changjiang Estuary | 30.7 | 27.3 | 94.3 | 78.9 | 0.26 | na | na | [53] |
| Pearl River Estuary | 46.2 | 59.3 | 150.1 | 89 | na | na | na | [54] |
| MSQ-1 | 35 | 60 | 150 | 80 | 0.5 | 20 | 0.2 | AQSIQ (2002) |
Metals concentrations of all the above locations refer to the average values. The values bracketed in the Dagu river and estuary refer to the content ranges of metals. MSQ-1 is Chinese Marine Sediment Quality standard criteria (GB 18668-2002). “na” presents no data.
4. Discussion
4.1. Metals Contamination
4.1.1. Sediment Quality
In aquatic sediments, it is important to master the bioavailability of metals to benthic organisms because it is directly related to human health through the food chain. However, there are many factors, such as metal form, physical properties of sediment, water environment, and deposition processes, which make it difficult to calculate the metals bioavailability [56]. Here, we used several of the more common sediment quality assessment methods to obtain the sediment quality in the Dagu River Estuary.
In comparison to the primary criteria (GB 18668-2002) (Table 1), one site (D5) in the upper reach of Dagu River, one site (D22) near the downstream entrance, and three sites (J6, J9 and J10) located in the subsea channel had Cu concentrations exceeding the primary criteria, which was 1.3, 1.4, 1.4, 1.3 and 1.1 times the upper limit value, respectively. All other metal concentrations were below the primary criteria. Therefore, the sediments in the study area met the requirements of the marine organism and humans for the quality of the marine environment.
Compared with the TEL-PEL SQGs (Table 2), the values of Cu, Pb, Zn, Cr, Cd, Hg and As were below TEL with 82.9%, 87.8%, 100%, 87.8%, 100%, 95.1% and 97.6% of samples in Dagu River, respectively. The values of Cu, Pb, Zn, Cr, Cd, Hg and As were in the range of TEL and PEL with 17.1%, 12.2%, 0%, 12.2%, 0%, 4.9% and 2.4% of samples, respectively, showing that Cu, Pb, Cr, Hg and As had occasional adverse effects. In the estuary, the concentrations of Cu, Pb, Zn, Cr, Cd, Hg and As were below TEL with 73.2%, 95.1%, 100%, 73.2%, 100%, 92.7% and 100% of samples, respectively. While the values of Cu, Pb, Zn, Cr, Cd, Hg and As were in the range of TEL and PEL with 26.8%, 4.9%, 0%, 26.8%, 0%, 7.3% and 0% of samples, respectively, showing that Cu, Pb, Cr and As had occasional adverse effects. None of the metals in the study area exceeded the PEL, suggesting that the sediments were not very toxic (Table 2).
4.1.2. Enrichment Factor (EF)
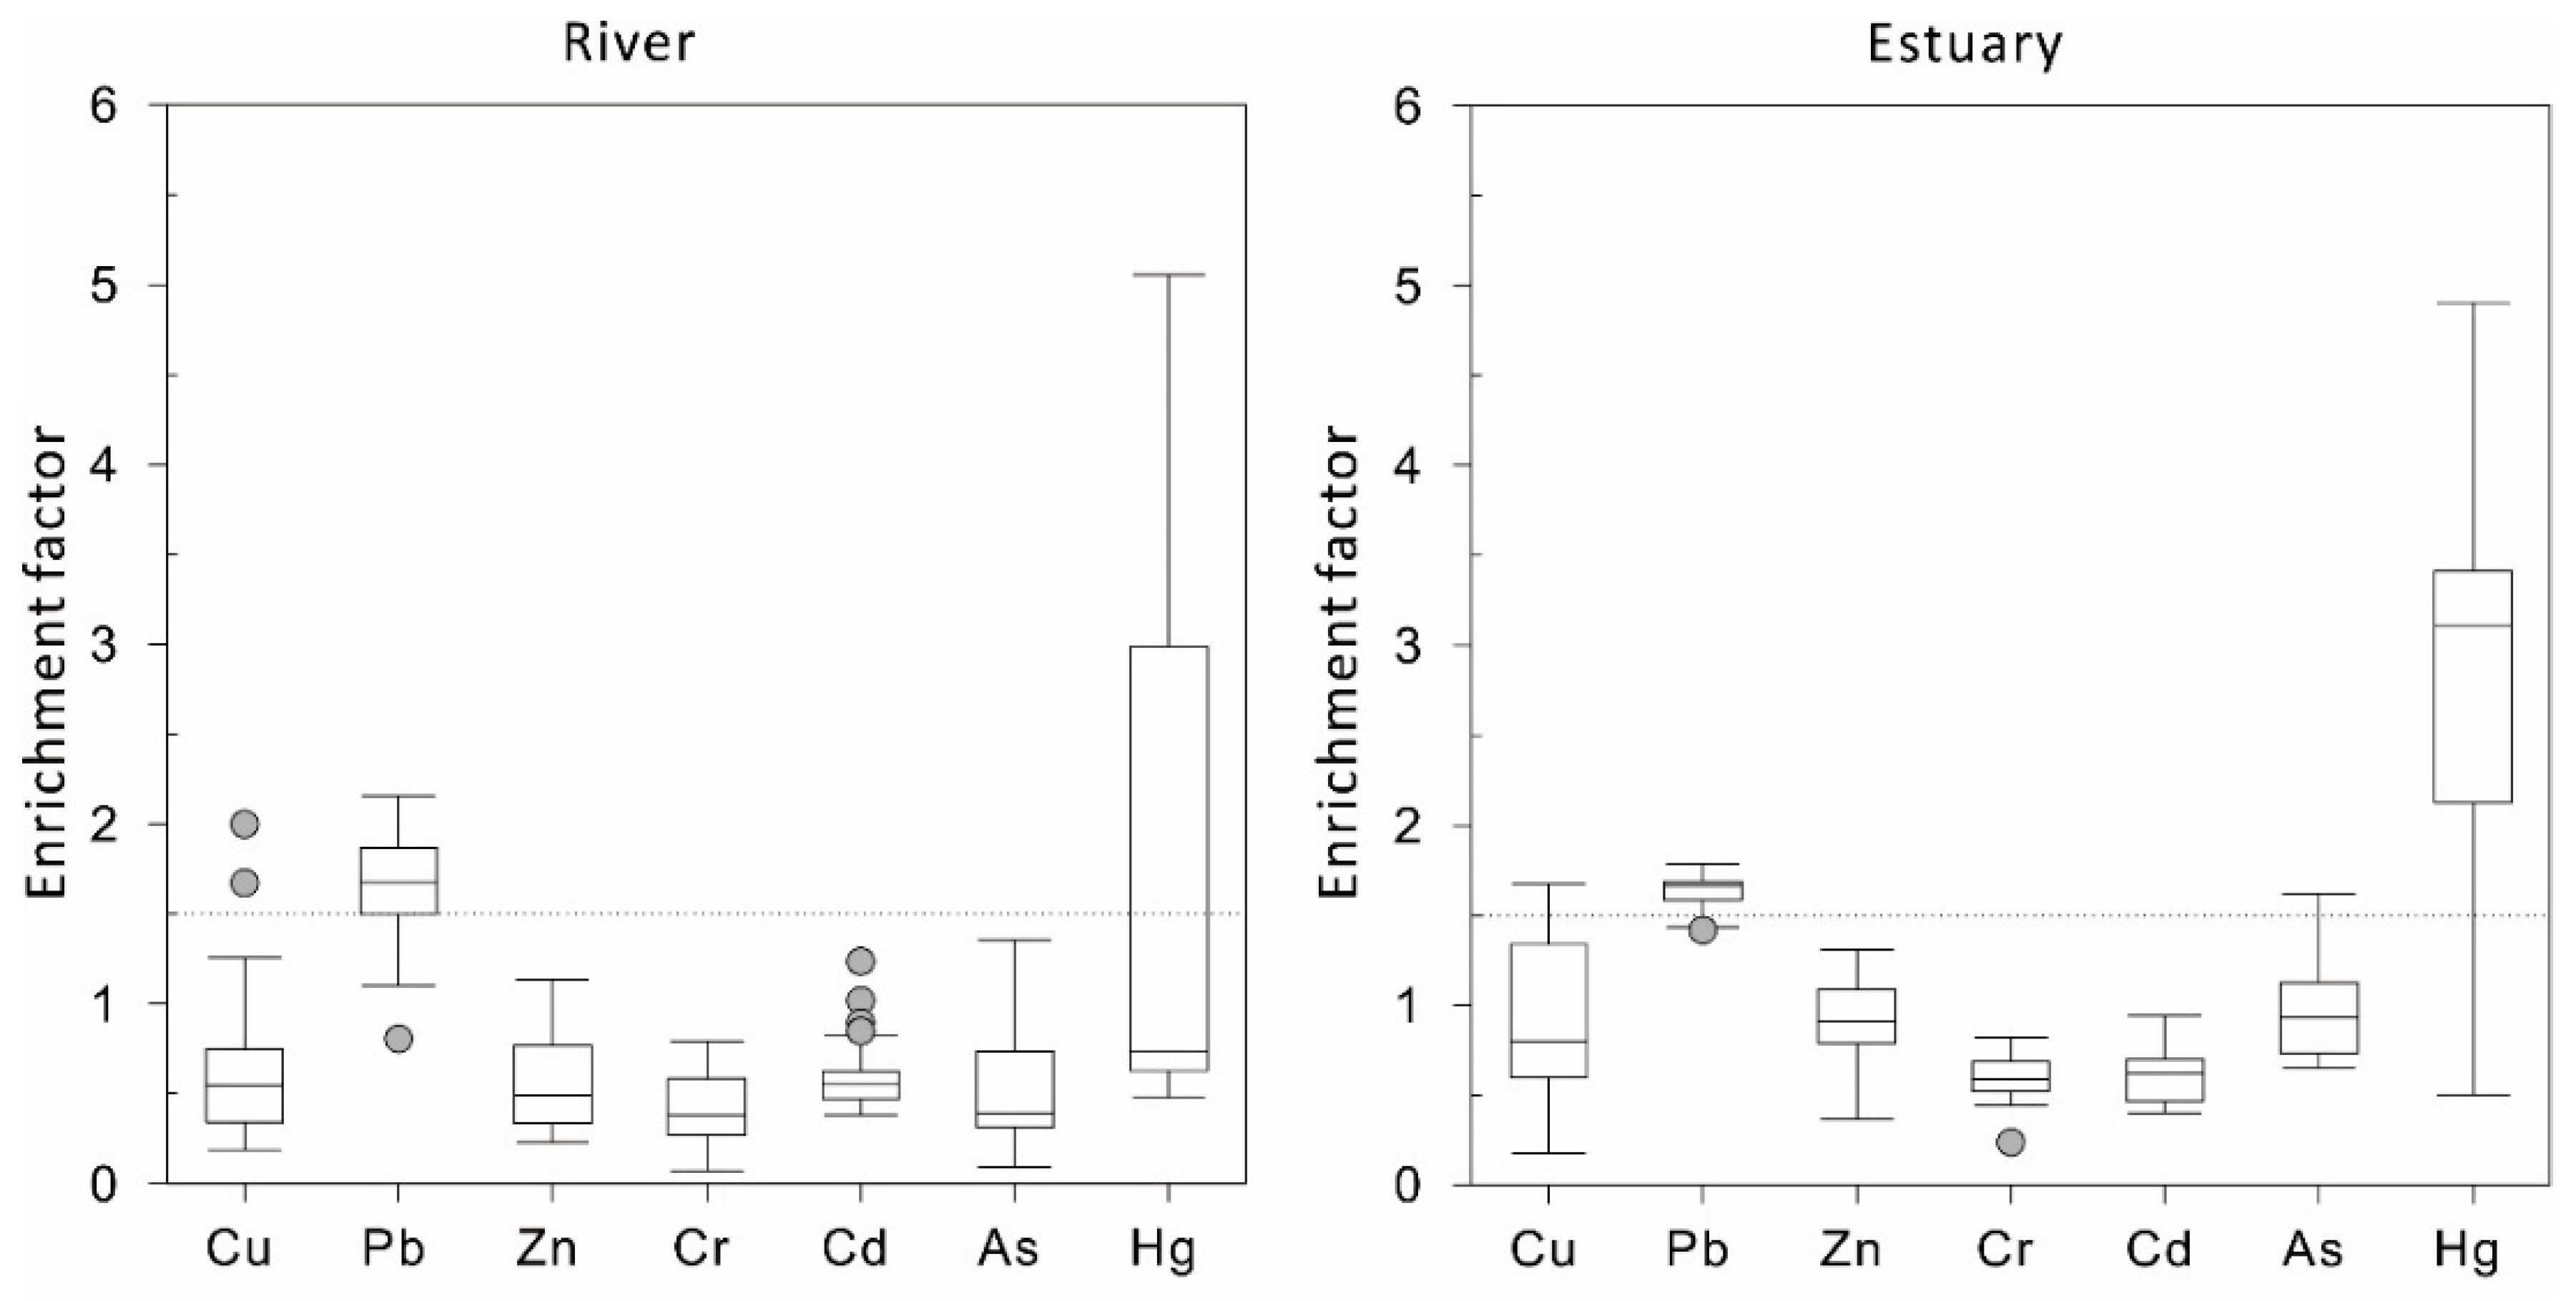
The EF values of these metals in the Dagu River sediments were as follows (Table 3 and Figure 4): Cu (0.2–2.0, average: 0.6), Pb (0.8–2.2, average: 1.6), Zn (0.2–1.1, average: 0.6), Cr (0.1–0.8, average: 0.4), Cd (0.4–1.2, average: 0.6), Hg (0.5–12.9, average: 2.0) and As (0.1–1.4, average: 0.5). The mean EF values of these metals in decreasing order in the Dagu River were as follows: Hg > Pb > Cu > Zn > As > Cd > Cr.
The enrichments of metals in the river and estuary were very similar. The EF values of these metals in the estuary sediments were as follows (Table 3 and Figure 4): Cu (0.2–1.6, average: 0.8), Pb (1.4–1.8, average: 1.6), Zn (0.4–1.3, average: 0.9), Cr (0.2–0.8, average: 0.6), Cd (0.4–0.9, average: 0.6), Hg (0.5–4.9, average: 2.7) and As (0.6 to 1.6, average: 0.9). The mean EF values of these metals in decreasing order in the estuary sediments were as follows: Hg > Pb > As > Zn > Cu > Cd > Cr.
The average EF values of Cu, Zn, Cr, Cd and As were less than 1.5 in the river and estuary, indicating that most of these metals came from natural weathering products [4,5]. The average values of EFPb and EFHg were over 1.5, with 69.2% and 30.8% of the river sampling sites, respectively, suggesting that they might be human contaminants. Minor enrichments of Pb were distributed throughout the river. However, a small number of stations were moderately enriched by Hg, and one station was even severely enriched. The average values of EFPb and EFHg were over 1.5, with 80.0% and 86.7% of the estuary sampling sites, respectively. Compared with the river sediments, the estuary sediments were highly enriched by Pb and Hg, especially for the enrichment of Hg. This was characterized by minor enrichment of Pb and moderate enrichment of Hg, showing that they might be human emissions accumulated in the estuary area.
4.2. Metals Control Factors and Sources
According to the results of Pearson correlation coefficients (Table 4 and Table 5), Mz in the river sediments were significantly positively correlated (r > 0.75) with Zn, Cr and As, and moderately positively correlated with Cu, Cd and Hg (0.5 < r < 0.6), and weakly positively correlated with Pb (r = 0.34). Similarly, Mz in the estuary sediments had moderate and significant positive correlations with the metals except for Pb (r = 0.22), indicating that in addition to Pb, other metals in the river sediments and estuary sediments were significantly associated with sediment particle sizes. TOC in the river sediments also had moderate positive correlations with Cu, Zn, Cr, Cd, Hg and As, and low positive correlations with Pb, showing that TOC was also an important factor in controlling the accumulation of heavy metals and metalloids. The enrichment of Pb was basically unaffected by the particle sizes, but more easily adsorbed by the Al-rich clay mineral particles, therefore, it had a good correlation with Al. Although the correlation with Mz was low, Mn tends to be symbiotic with Fe and exhibits highly siderophile affinity and high Fe contents tend to have relatively high Mn contents [4,5].
In the estuary sediments, the correlations among TOC and metals were more significant, showing high and extremely high correlations. These correlations suggested that organic matter played an important role in controlling the metals concentrations in the sediments. In river sediments, Al were highly correlated with Zn and moderately related to other metals. Fe had high correlations with Cu, Zn and Cr, and moderate correlations with Cd, As and Hg, and an extremely low correlation with Pb. Mn was moderately correlated with Cu, Zn, Cd, Cr and As, and extremely low related to Pb and Hg. Moreover, Al, Fe, and TOC were all moderately related to Mz. Al and Fe are usually enriched in fine-grained sediments, generally weathering products of rocks and soils under natural conditions, and not influenced significantly by the authigenic and biologic processes, representing terrestrial inputs with relatively stable chemical properties. The good correlations among Mz and Al, Fe and TOC indicated that the grain size was the main factor controlling the elements enrichment and TOC, while the fine-grained sediments were good carriers for metal elements [57,58,59]. In addition, Fe was also moderately related to Al and Mn. Fe/Mn oxides can adsorb metals, resulting in moderate correlations between Mn and most metals. In summary, the concentrations of Pb were not restricted by particle sizes in the river and estuary sediments, but were related to adsorption of fine-grained aluminosilicate minerals. Other metals were closely related to the grain size, and enriched by adsorption of aluminosilicate minerals, Fe/Mn oxides and organic matter.
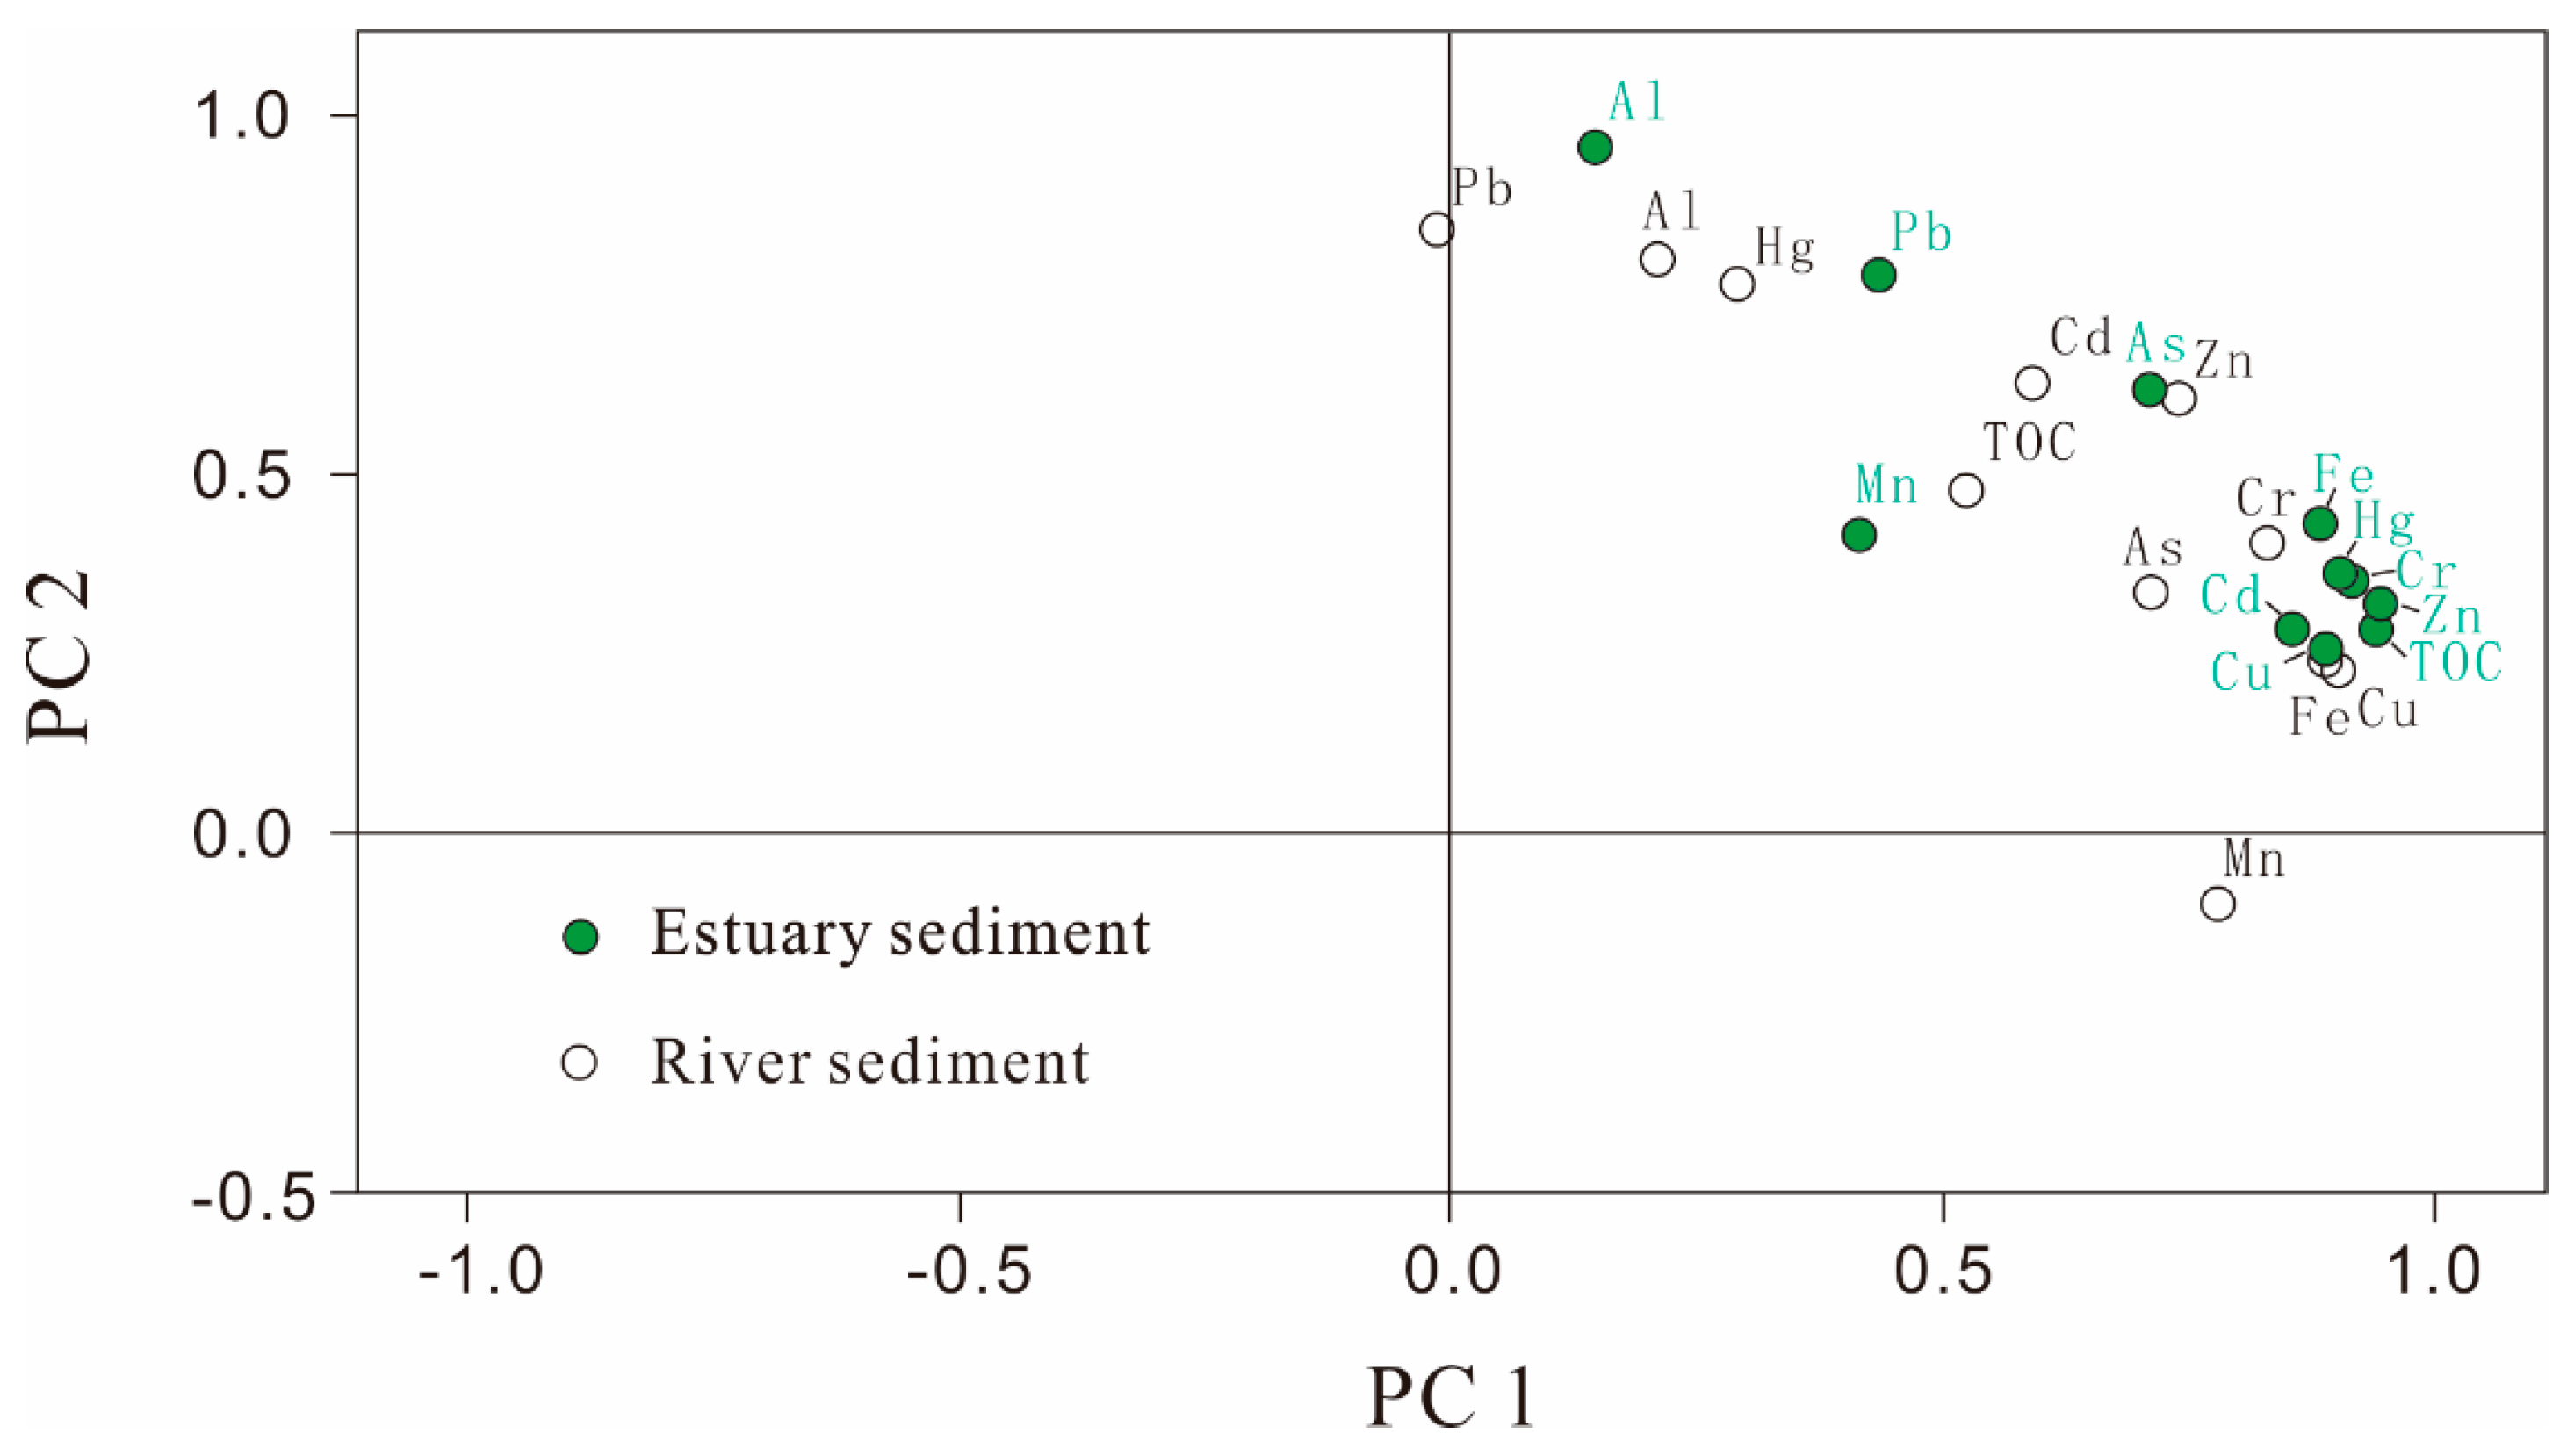
As shown in the results of the factor analysis in Table 6 and Figure 5, the first two principal components extracted with eigenvalues greater than three in the river accounted for 73.1% of the total variability. Factor 1 was strongly positively loaded with Mn, Fe, Cu, Zn, Cr and As, and moderately positively loaded with TOC and Cd. Fe/Mn oxides and TOC are very effective metal carriers in sediments. According to the results of the EF, these metals were mainly from terrestrial inputs discharged by the river. Factor 2 was strongly positively loaded with Al, Pb and Hg, and moderately positively loaded with Zn and Cd. These metals are mainly related to vehicle emissions, coal and oil combustion due to the precipitation of aerosols [42,60,61]. Fine-grained aluminosilicate minerals could adsorb the trace metals, resulting in the enrichments of Pb and Hg. However, the first two factors with eigenvalues greater than two in the estuary accounted for 85.9% of the total variability. Factor 1 was strongly positively loaded with Fe, TOC, Cu, Zn, Cr, Cd, Hg, and Factor 2 was strongly positively loaded with Al and Pb. As mentioned previously, Al and Fe are the major components of silica minerals that are the products of rock and soil weathering, generally concentrated in fine-grained sediments. Moreover, organic matter contents are generally higher in finer sediments. Therefore, most metals are more susceptible to adsorption and enrichment by fine-grained sediments and organic matter in the estuary area [4,5]. Hg pollutants are mainly discharged into the atmosphere through coal combustion, metal processing, waste incineration, chemical and cement production, and then enriched in soil and seafloor sediments by sedimentation. Among them, coal combustion is the primary source of Hg pollutants. Hg emissions in China account for one-third of the world’s total emissions, mainly because China’s traditional energy structure is dominated by coal. Especially in the northern regions, winter heating is mainly carried out through coal combustion [62,63]. In addition to fossil fuel burning, mining, and manufacturing, Pb emissions are derived mainly from vehicular exhausts and Pb ores [61,62,63].
4.3. Metals Transport
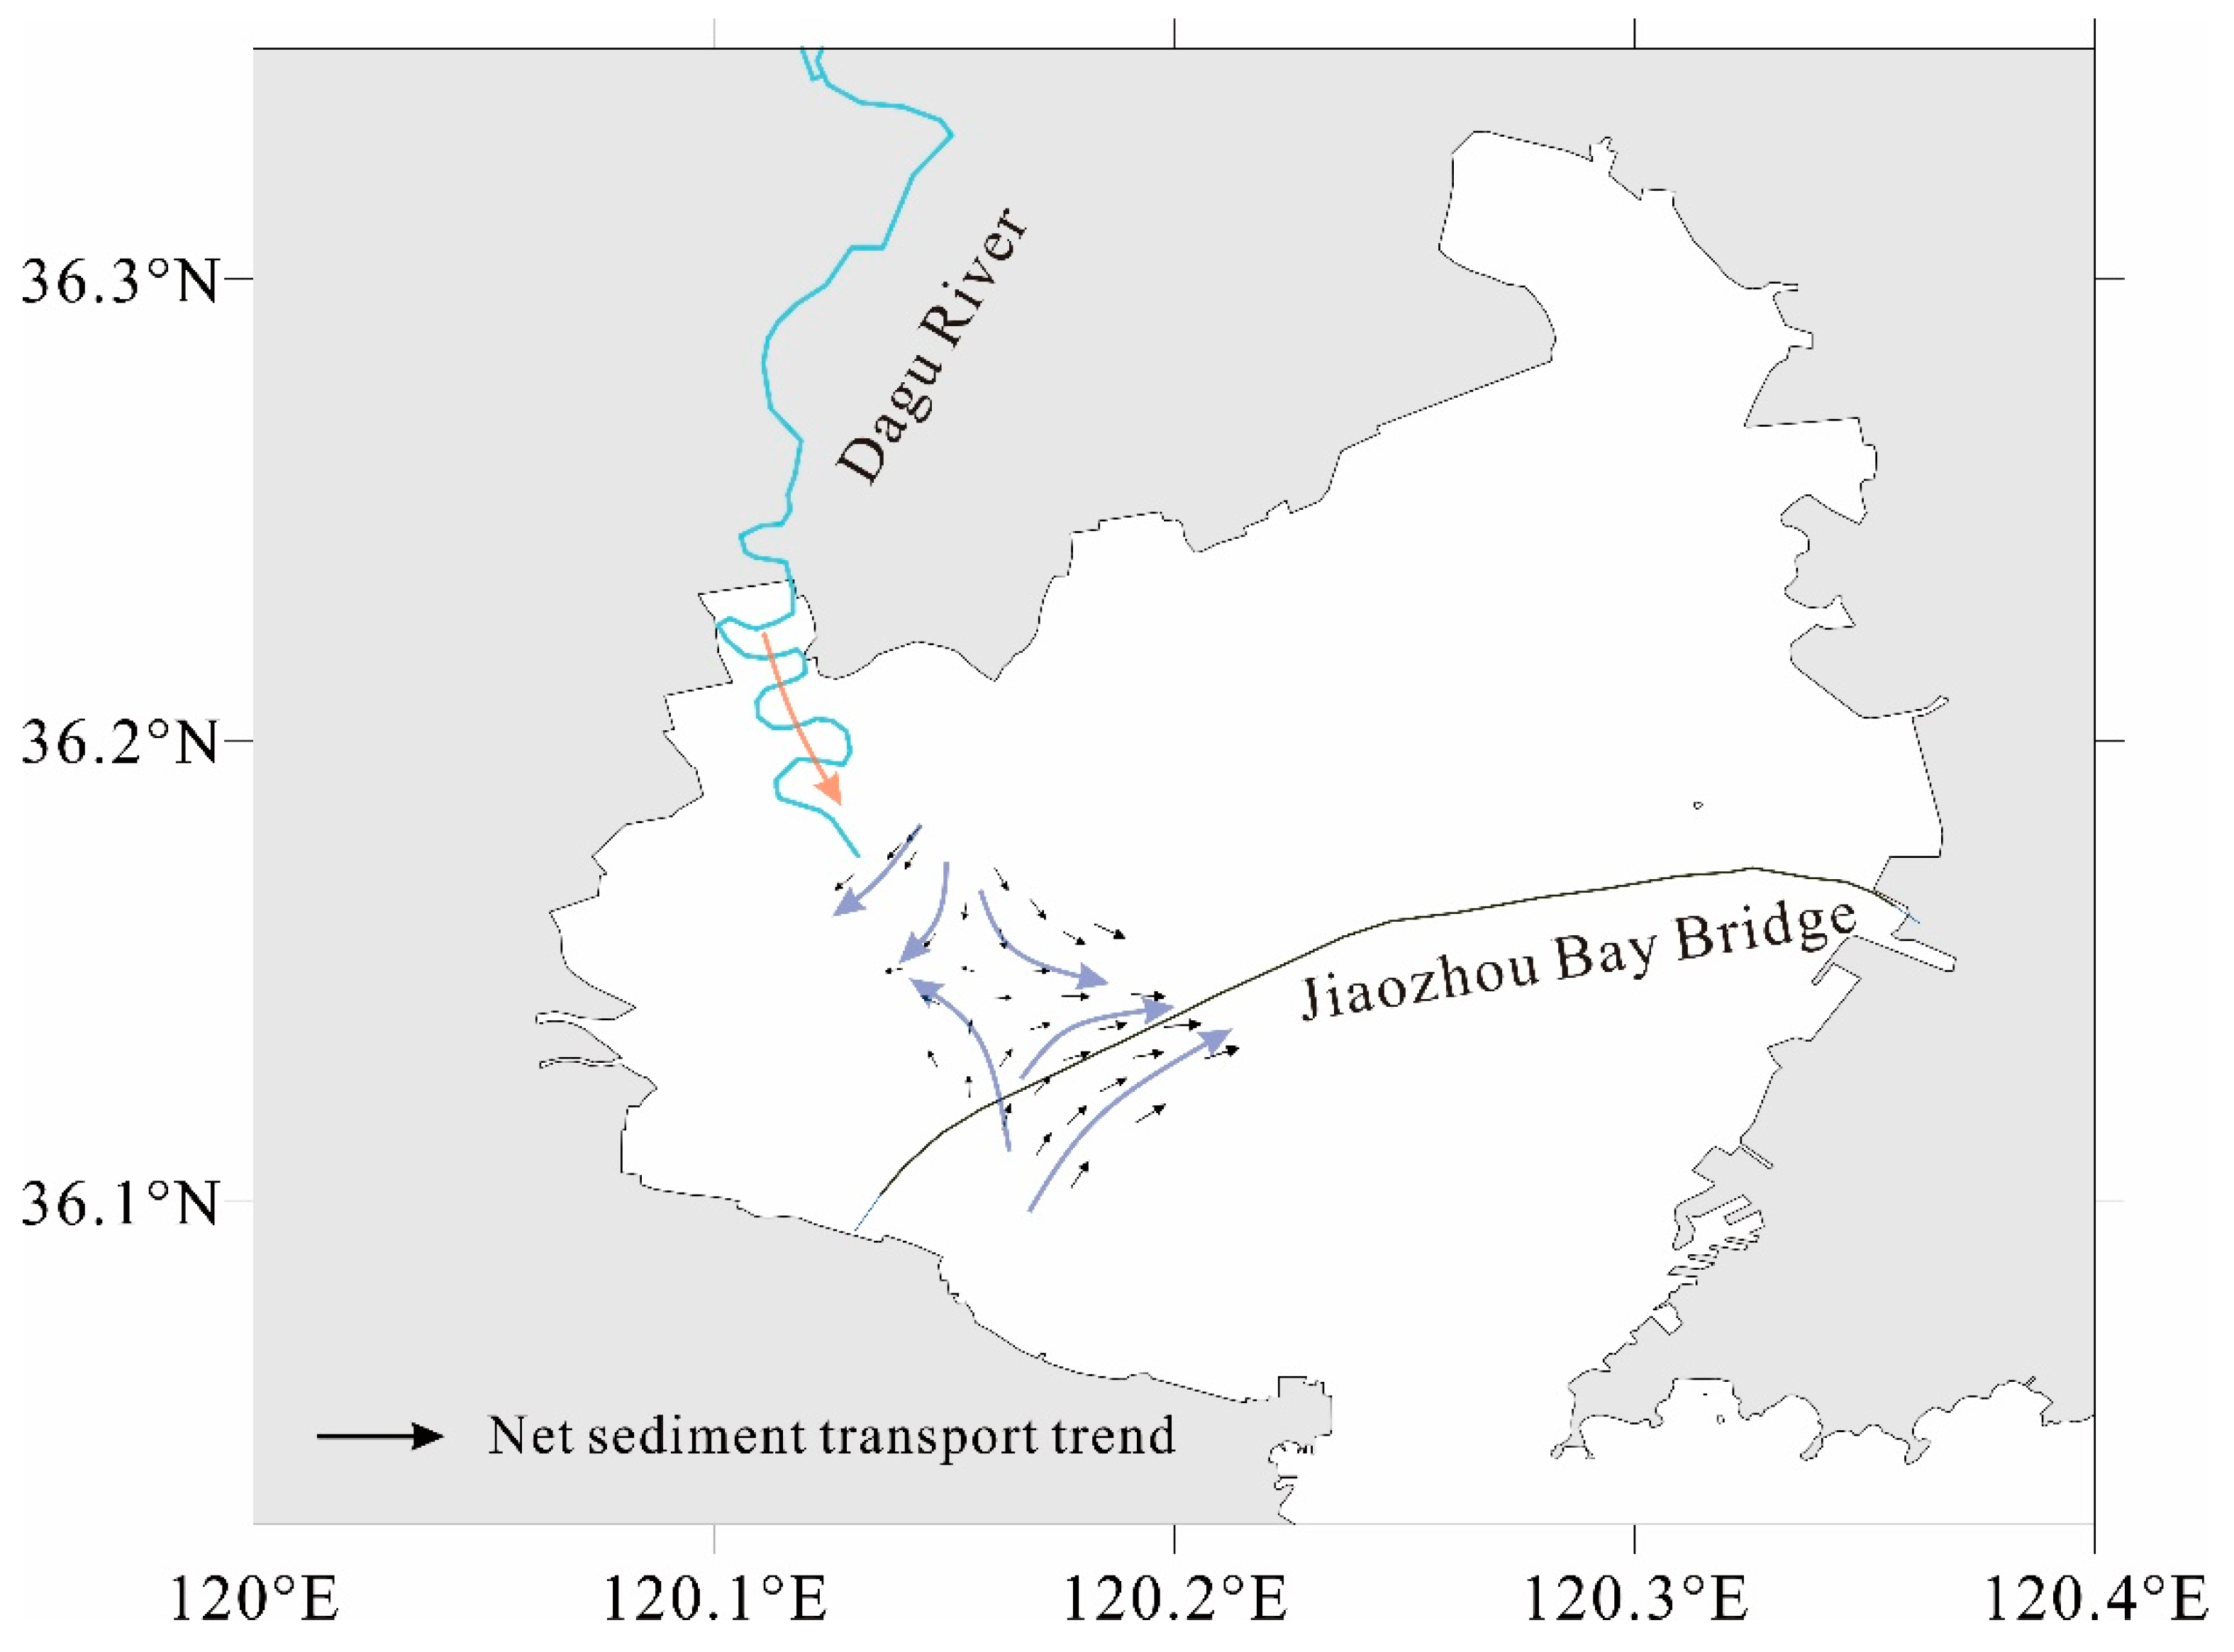
It is obvious that in the coastal zone, rivers are the principal form of transport of metallic elements into the ocean. However, after entering the ocean, how are they transported in the estuary? In order to understand the net transport trends and sedimentary dynamic environmental conditions of sediment in the study area, we used the approach of a grain-size trends analysis, which has been widely used in sediment transport studies in various marine environments [48,50]. Using the geostatistical method, we found that the characteristic distance of 0.039° was representative and could reflect the characteristics of the transport trend in the estuary. The surface sediment from the river estuary in the Northwest of the Jiaozhou Bay were transported to the south under the influence of the runoff recharge from the Dagu River (Figure 6). This has also been confirmed by studies of seabed topography, sediment particle size and heavy mineral [32,33]. There were also significant differences in the transport tendencies between the north and south sides of the Jiaozhou Bay bridge. On the north side, the sediment was transported to the Northeast and east, but the sediment in the south side was transported to the Northeast. It might be related to the barrier function of the bridge, where the river runoff met the weak tidal power of the sea, and the sediment transport direction was deflected clockwise to the east. As confirmed by many studies, there was net sediment transport towards the South-southeast in the shallow sea area of the Northwest of the Jiaozhou Bay due to the rectilinear current that dominated in the bay [35].
5. Conclusions
The river sediments were mainly composed of coarse particles, but the estuary delta sediments were finer in grain size. The metal contents in sediments from the estuary area were much higher than those of the river.
Correlation analysis showed that the concentrations of Pb were not restricted by particle sizes in river and estuary sediments but were related to the adsorption of fine-grained aluminosilicate minerals. Other metals were mainly controlled by the grain size, and enriched by adsorption of aluminosilicate minerals, Fe/Mn oxides and organic matter.
The values of Cu, Pb, Cr, As and Hg were between TEL and PEL, indicating these metals might have occasional adverse effects. Results of EF values revealed that the entire study area was enriched in Pb and Hg, but the estuary was more significant, especially for the enrichment of Hg. Coal combustion and automobile exhaust emissions were their main sources.
Pollutants were mainly deposited in the estuary after entering the ocean and were further transported to the south and east under the action of river runoff and reciprocating current.
Furthermore, the chemical model of SEM (simultaneously extracted metals)/AVS (acid volatile sulfides) based on the technique adopted by the US-EPA will be considered to better understand the metal bioavailability of estuarine and bay sediments.
Author Contributions
Formal analysis, J.L.; funding acquisition, P.Y. and X.C.; investigation, J.L., X.C. and K.C.; methodology, J.L.; project administration, P.Y. and X.C.; software, J.L.; supervision, K.C.; writing–original draft, J.L.; writing–review and editing, J.L., P.Y. and X.C.
Funding
This study was supported by the National Natural Science Foundation of China (Grant No. 41706074 and 41506107), “China-ASEAN Marine Geoscience Research and Disaster Reduction and Prevention initiatives”, the Marine Geology Survey Project (Grant No. DD20160145 and GZH201100203), and the Basic Fund of Ministry of Science and Technology (Grant No. 2013FY112200).
Acknowledgments
We appreciate the editors and anonymous reviewers for their constructive comments that improve the quality of the original manuscript.
Conflicts of Interest
The authors declare no conflict of interest.
References
- Liu, J.; Cao, K.; Yin, P.; Gao, F.; Chen, X.; Zhang, Y.; Yu, Y. The Sources and Transport Patterns of Modern Sediments in Hangzhou Bay: Evidence from Clay Minerals. J. Ocean Univ. China 2018, 17, 1352–1360. [Google Scholar] [CrossRef]
- Song, H.; Liu, J.; Yin, P.; Zhang, Y.; Chen, X. Characteristics of Heavy Minerals and Quantitative Provenance Identification of Sediments from the Muddy Area Outside the Oujiang Estuary Since 5.8 kyr. J. Ocean Univ. China 2018, 17, 1325–1335. [Google Scholar] [CrossRef]
- Li, M.; Yin, P.; Duan, X.; Liu, J.; Qiu, J.; Phung, V.P. Land-Use Changes and Human Driving in and Near the Yangtze River Delta from 1995–2015. J. Ocean Univ. China 2018, 17, 1361–1368. [Google Scholar] [CrossRef]
- Liu, J.; Yin, P.; Chen, B.; Gao, F.; Song, H.; Li, M. Distribution and contamination assessment of heavy metals in surface sediments of the Luanhe River Estuary, northwest of the Bohai Sea. Mar. Pollut. Bull. 2016, 109, 633–639. [Google Scholar] [CrossRef] [PubMed]
- Song, H.; Liu, J.; Yin, P.; Zhang, Y. Distribution, enrichment and source of heavy metals in Rizhao offshore area, southeast Shandong Province. Mar. Pollut. Bull. 2017, 119, 175–180. [Google Scholar] [CrossRef] [PubMed]
- Xu, F.J.; Hu, B.; Dou, Y.G.; Song, Z.J.; Liu, X.T.; Yuan, S.Q.; Sun, Z.L.; Li, A.C.; Yin, X.B. Prehistoric heavy metal pollution on the continental shelf off Hainan Island, South China Sea: From natural to anthropogenic impacts around 4.0 kyr BP. Holocene 2018, 28, 455–463. [Google Scholar] [CrossRef]
- Zhou, Z.; Li, X.; Chen, L.; Li, B.; Liu, T.; Ai, B.; Yang, L.; Liu, B.; Chen, Q. Macrobenthic assemblage characteristics under stressed waters and ecological health assessment using AMBI and M-AMBI: A case study at the Xin’an River Estuary, Yantai, China. Acta Oceanol. Sin. 2018, 37, 77–86. [Google Scholar] [CrossRef]
- Xu, F.; Liu, Z.; Cao, Y.; Qiu, L.; Feng, J.; Xu, F.; Tian, X. Assessment of heavy metal contamination in urban river sediments in the Jiaozhou Bay catchment, Qingdao, China. Catena 2017, 150, 9–16. [Google Scholar] [CrossRef]
- Xu, F.; Qiu, L.; Cao, Y.; Huang, J.; Liu, Z.; Tian, X.; Li, A.; Yin, X. Trace metals in the surface sediments of the intertidal Jiaozhou Bay, China: Sources and contamination assessment. Mar. Pollut. Bull. 2016, 104, 371–378. [Google Scholar] [CrossRef] [PubMed]
- Tchounwou, P.B.; Yedjou, C.G.; Patlolla, A.K.; Sutton, D.J. Heavy Metals Toxicity and the Environment. In Experientia Supplementum; Springer Science and Business Media LLC: Berlin, Germany, 2012; Volume 101, pp. 133–164. [Google Scholar]
- Burton G, A. Sediment quality criteria in use around the world. Limnology 2002, 3, 65–76. [Google Scholar] [CrossRef]
- Ra, K.; Kim, E.S.; Kim, K.T.; Kim, J.K.; Lee, J.M.; Choi, J.Y. Assessment of heavy metal contamination and its ecological risk in the surface sediments along the coast of Korea. J. Coast. Res. 2013, 118, 105–110. [Google Scholar] [CrossRef]
- Sun, J.; Rong, J.; Zheng, Y.; Ma, D.; Lan, X. Risk Assessment of Heavy Metal Contaminated Dagu River Sediments. Procedia Environ. Sci. 2011, 8, 764–772. [Google Scholar] [CrossRef] [Green Version]
- Liang, X.; Song, J.; Duan, L.; Yuan, H.; Li, X.; Li, N.; Qu, B.; Wang, Q.; Xing, J. Source identification and risk assessment based on fractionation of heavy metals in surface sediments of Jiaozhou Bay, China. Mar. Pollut. Bull. 2018, 128, 548–556. [Google Scholar] [CrossRef] [PubMed]
- Kang, X.; Song, J.; Yuan, H.; Li, X.; Li, N.; Duan, L. Historical trends of anthropogenic metals in sediments of Jiaozhou Bay over the last century. Mar. Pollut. Bull. 2018, 135, 176–182. [Google Scholar] [CrossRef] [PubMed]
- Wang, S.J.; Li, X.P.; Schertl, H.P.; Feng, Q.D. Petrogenesis of early cretaceous andesite dykes in the Sulu orogenic belt, eastern China. Mineral. Petrol. 2019, 113, 77–97. [Google Scholar] [CrossRef]
- Du, Q.; Han, Z.; Shen, X.; Han, C.; Song, Z.; Gao, L.; Han, M.; Zhong, W. Geochronology and geochemistry of Permo-Triassic sandstones in eastern Jilin Province (NE China): Implications for final closure of the Paleo-Asian Ocean. Geosci. Front. 2019, 10, 683–704. [Google Scholar] [CrossRef]
- Pang, Y.-M.; Guo, X.-W.; Han, Z.-Z.; Zhang, X.-H.; Zhu, X.-Q.; Hou, F.-H.; Han, C.; Song, Z.-G.; Xiao, G.-L. Mesozoic–Cenozoic denudation and thermal history in the Central Uplift of the South Yellow Sea basin and the implications for hydrocarbon systems: Constraints from the CSDP-2 borehole. Mar. Pet. Geol. 2019, 99, 355–369. [Google Scholar] [CrossRef]
- Song, Z.G.; Han, C.; Liu, H.; Han, Z.Z.; Yan, J.L.; Zhong, W.J.; Gao, L.H.; Du, Q.X.; Han, M.; Li, J.J. Early-Middle Ordovician intermediate-mafic and ultramafic rocks in central Jilin Province, NE China: Geochronology, origin, and tectonic implications. Mineral. Petrol. 2019, 113, 393–415. [Google Scholar] [CrossRef]
- Pang, Y.M.; Zhang, X.H.; Guo, X.W.; Xiao, G.L.; Zhu, X.Q. Mesozoic and Cenozoic tectono-thermal evolution modeling in the Northern South Yellow Sea Basin. Chin. J. Geophys. Chin. Ed. 2017, 60, 3177–3190. [Google Scholar]
- Han, C.; Han, M.; Jiang, Z.X.; Han, Z.Z.; Li, H.; Song, Z.G.; Zhong, W.J.; Liu, K.X.; Wang, C.H. Source analysis of quartz from the Upper Ordovician and Lower Silurian black shale and its effects on shale gas reservoir in the Southern Sichuan Basin and its periphery. China Geol. J. 2019, 54, 439–449. [Google Scholar] [CrossRef]
- Pang, Y.M.; Zhang, X.H.; Guo, X.W.; Xiao, G.L.; Han, Z.Z. Basin modeling in the initial stage of exploration: a case study from the North Subbasin of the South Yellow Sea Basin. Acta Oceanol. Sin. 2017, 36, 65–78. [Google Scholar] [CrossRef]
- Meng, Y.; Santosh, M.; Li, R.; Xu, Y.; Hou, F. Petrogenesis and tectonic implications of Early Cretaceous volcanic rocks from Lingshan Island in the Sulu Orogenic Belt. Lithos 2018, 312, 244–257. [Google Scholar] [CrossRef]
- Wei, P.F.; Yu, X.F.; Li, D.P.; Liu, Q.; Yu, L.D.; Li, Z.P.; Geng, K.; Zhang, Y.; Sun, Y.Q.; Chi, N.J. Geochemistry, Zircon U–Pb Geochronology, and Lu–Hf Isotopes of the Chishan Alkaline Complex, Western Shandong, China. Minerals 2019, 9(5), 293. [Google Scholar] [CrossRef]
- Cao, Y.; Liu, L.; Wang, C.; Kang, L.; Li, D.; Yang, W.; Zhu, X. Timing and nature of the partial melting processes during the exhumation of the garnet–bearing biotite gneiss in the southern Altyn Tagh HP/UHP belt, Western China. J. Asian Earth Sci. 2019, 170, 274–293. [Google Scholar] [CrossRef]
- Wang, S.; Schertl, H.-P.; Pang, Y. Geochemistry, geochronology and Sr–Nd–Hf isotopes of two types of early Cretaceous granite porphyry dykes in the Sulu orogenic belt, eastern China. Can. J. Earth Sci. 2019. [Google Scholar] [CrossRef]
- Li, X.P.; Guo, J.H.; Zhao, G.C.; Li, H.K.; Song, Z.J. Formation of the Paleoproterozoic calc-silicate and high-pressure mafic granulite in the Jiaobei terrane, eastern Shandong, China. Acta Petrol. Sin. 2011, 27, 961–968. [Google Scholar]
- Zhu, D.; Lü, D.; Shen, X.; Yang, Q.; Li, D.; Ren, T.; Yang, S. Discovery and Geological Significance of Neoproterozoic Metamorphic Granite in Jimo, Shandong Province, Eastern China. Acta Geol. Sin. 2016, 90, 2080–2096. [Google Scholar] [CrossRef]
- Chen, J.; Han, Z.; Zhang, X.; Fan, A.; Yang, R. Early diagenetic deformation structures of the Furongian ribbon rocks in Shandong Province of China—A new perspective of the genesis of limestone conglomerates. Sci. China Earth Sci. 2010, 53, 241–252. [Google Scholar] [CrossRef]
- Jin, A.; Li, J.; Hou, G. Timing and implications for the late Mesozoic geodynamic settings of eastern North China Craton: Evidences from K–Ar dating age and sedimentary–structural characteristics records of Lingshan Island, Shandong Province. J. Earth Syst. Sci. 2017, 126, 117. [Google Scholar]
- Qiu, J.; Liu, J.; Saito, Y.; Yin, P.; Zhang, Y.; Liu, J.; Zhou, L. Seismic morphology and infilling architecture of incised valleys in the northwest South Yellow Sea since the last glaciation. Cont. Shelf Res. 2019, 179, 52–65. [Google Scholar] [CrossRef]
- Wang, Y.P.; Gao, S.; Jia, J.J. Sediment distribution and transport patterns in Jiaozhou Bay and adjoining areas. Acta Geograp Hica Sin. 2000, 55, 449–458, (In Chinese with English abstract). [Google Scholar]
- Gao, S.; Wang, Y.P. Characteristics of sedimentary environment and tidal inlet evolution of Jiaozhou Bay. Adv. Mar. Sci. 2002, 20, 52–59, (In Chinese with English abstract). [Google Scholar]
- Li, N.S.; Yu, H.J.; Zhao, S.L. Natural Environment and Geological Evolution of Jiaozhou Bay; Ocean Press: Beijing, China, 2006; pp. 1–282. (In Chinese) [Google Scholar]
- Zhao, K.; Qiao, L.; Shi, J.; He, S.; Li, G.; Yin, P. Evolution of sedimentary dynamic environment in the western Jiaozhou Bay, Qingdao, China in the last 30 years. Estuar. Coast. Shelf Sci. 2015, 163, 244–253. [Google Scholar] [CrossRef]
- Folk, R.L.; Ward, W.C. Brazos River bar [Texas]; A study in the significance of grain size parameters. J. Sediment. Res. 1957, 27, 3–26. [Google Scholar] [CrossRef]
- Dou, Y.; Li, J.; Zhao, J.; Hu, B.; Yang, S. Distribution, enrichment and source of heavy metals in surface sediments of the eastern Beibu Bay, South China Sea. Mar. Pollut. Bull. 2013, 67, 137–145. [Google Scholar] [CrossRef]
- AQSIQ (Administration of Quality Supervision, Inspection and Quarantine of the People’s Republic of China). Marine Sediment Quality of China (GB 18668-2002); Standards Press of China: Beijing, China, 2002; pp. 1–2.
- Long, E.R.; Macdonald, D.D.; Smith, S.L.; Calder, F.D. Incidence of adverse biological effects within ranges of chemical concentrations in marine and estuarine sediments. Environ. Manag. 1995, 19, 81–97. [Google Scholar] [CrossRef]
- Long, E.R.; Field, L.J.; Macdonald, D.D. Predicting toxicity in marine sediments with numerical sediment quality guidelines. Environ. Toxicol. Chem. 1998, 17, 714–727. [Google Scholar] [CrossRef]
- Macdonald, D.D.; Carr, R.S.; Calder, F.D.; Long, E.R.; Ingersoll, C.G. Development and evaluation of sediment quality guidelines for Florida coastal waters. Ecotoxicology 1996, 5, 253–278. [Google Scholar] [CrossRef]
- Xia, P.; Meng, X.W.; Feng, A.P.; Yin, P.; Zhang, J.; Wang, X.Q. Geochemical characteristics of heavy metals in coastal sediments from the northern Beibu Gulf (SW China): The background levels and recent contamination. Environ. Earth Sci. 2012, 66, 1337–1344. [Google Scholar] [CrossRef]
- Hu, B.Q.; Li, J.; Zhao, J.T.; Yang, J.; Bai, F.L.; Dou, Y.G. Heavy metal in surface sediments of the Liaodong Bay, Bohai Sea: distribution, contamination, and sources. Environ. Monit. Assess. 2013, 185, 5071–5083. [Google Scholar] [CrossRef]
- Zhang, J.; Liu, C. Riverine Composition and Estuarine Geochemistry of Particulate Metals in China—Weathering Features, Anthropogenic Impact and Chemical Fluxes. Estuarine Coast. Shelf Sci. 2002, 54, 1051–1070. [Google Scholar] [CrossRef]
- Chen, C.-W.; Kao, C.-M.; Chen, C.-F.; Dong, C.-D. Distribution and accumulation of heavy metals in the sediments of Kaohsiung Harbor, Taiwan. Chemosphere 2007, 66, 1431–1440. [Google Scholar] [CrossRef]
- Gao, S.; Luo, T.-C.; Zhang, B.-R.; Zhang, H.-F.; Han, Y.-W.; Zhao, Z.-D.; Hu, Y.-K. Chemical composition of the continental crust as revealed by studies in East China. Geochim. Cosmochim. Acta 1998, 62, 1959–1975. [Google Scholar] [CrossRef]
- Taylor, R. Interpretation of the Correlation Coefficient: A Basic Review. J. Diagn. Med Sonogr. 1990, 6, 35–39. [Google Scholar] [CrossRef]
- Gao, S.; Collins, M. Net sediment transport patterns inferred from grain-size trends, based upon definition of “transport vectors. ” Sediment. Geol. 1992, 81, 47–60. [Google Scholar] [CrossRef]
- Mclaren, P.; Bowles, D. The Effects of Sediment Transport on Grain-Size Distributions. J. Sediment. Res. 1985, 55, 457–470. [Google Scholar]
- Gao, S. A FORTRAN program for grain-size trend analysis to define net sediment transport pathways. Comput. Geosci. 1996, 22, 449–452. [Google Scholar] [CrossRef]
- Folk, R.L.; Andrews, P.B.; Lewis, D.W. Detrital sedimentary rock classification and nomenclature for use in New Zealand. N. Z. J. Geol. Geophys. 1970, 13, 937–968. [Google Scholar] [CrossRef] [Green Version]
- Gao, X.; Chen, C.-T.A. Heavy metal pollution status in surface sediments of the coastal Bohai Bay. Water Res. 2012, 46, 1901–1911. [Google Scholar] [CrossRef]
- Zhang, W.; Feng, H.; Chang, J.; Qu, J.; Xie, H.; Yu, L. Heavy metal contamination in surface sediments of Yangtze River intertidal zone: An assessment from different indexes. Environ. Pollut. 2009, 157, 1533–1543. [Google Scholar] [CrossRef]
- Zhou, H.-Y.; Peng, X.-T.; Pan, J.-M. Distribution, source and enrichment of some chemical elements in sediments of the Pearl River Estuary, China. Cont. Shelf Res. 2004, 24, 1857–1875. [Google Scholar] [CrossRef]
- Xu, G.; Liu, J.; Pei, S.; Gao, M.; Hu, G.; Kong, X. Sediment properties and trace metal pollution assessment in surface sediments of the Laizhou Bay, China. Environ. Sci. Pollut. Res. 2015, 22, 11634–11647. [Google Scholar] [CrossRef] [PubMed]
- Zhang, C.; Yu, Z.-G.; Zeng, G.-M.; Jiang, M.; Yang, Z.-Z.; Cui, F.; Zhu, M.-Y.; Shen, L.-Q.; Hu, L. Effects of sediment geochemical properties on heavy metal bioavailability. Environ. Int. 2014, 73, 270–281. [Google Scholar] [CrossRef] [PubMed]
- Han, Z.; Gao, X.; Zhao, H.; Tucker, M.E.; Zhao, Y.; Bi, Z.; Pan, J.; Wu, G.; Yan, H. Extracellular and Intracellular Biomineralization Induced by Bacillus licheniformis DB1-9 at Different Mg/Ca Molar Ratios. Minerals 2018, 8, 585. [Google Scholar] [CrossRef]
- Han, Z.Z.; Yu, W.W.; Zhao, H.; Zhao, Y.H.; Tucker, E.M.; Yan, H.X. The Significant Roles of Mg/Ca Ratio, Cl− and SO42− in Carbonate Mineral Pre-cipitation by the Halophile Staphylococcus epidermis Y2. Minerals 2018, 8, 594. [Google Scholar] [CrossRef]
- Guo, K.; Zhai, S.-K.; Wang, X.-Y.; Yu, Z.-H.; Lai, Z.-Q.; Chen, S.; Song, Z.-J.; Ma, Y.; Chen, Z.-X.; Li, X.-H.; et al. The dynamics of the southern Okinawa Trough magmatic system: New insights from the microanalysis of the An contents, trace element concentrations and Sr isotopic compositions of plagioclase hosted in basalts and silicic rocks. Chem. Geol. 2018, 497, 146–161. [Google Scholar] [CrossRef]
- Wong, C.; Li, X.; Zhang, G.; Qi, S.; Peng, X. Atmospheric deposition of heavy metals in the Pearl River Delta, China. Atmos. Environ. 2003, 37, 767–776. [Google Scholar] [CrossRef] [Green Version]
- Järup, L. Hazards of heavy metal contamination. Br. Med. Bull. 2003, 68, 167–182. [Google Scholar] [CrossRef] [PubMed] [Green Version]
- Duan, X.; Liu, J.; Zhang, D.; Yin, P.; Li, Y.; Li, X. An assessment of human influences on sources of polycyclic aromatic hydrocarbons in the estuarine and coastal sediments of China. Mar. Pollut. Bull. 2015, 97, 309–318. [Google Scholar] [CrossRef] [PubMed]
- Duruibe, J.O.; Ogwuegbu, M.O.C.; Egwurugwu, J.N. Heavy metal pollution and human biotoxic effects. Int. J. Phys. Sci. 2007, 2, 112–118. [Google Scholar]
Figure 1.
Sampling sites in the Dagu River Estuary, Southeast of Shandong Province.
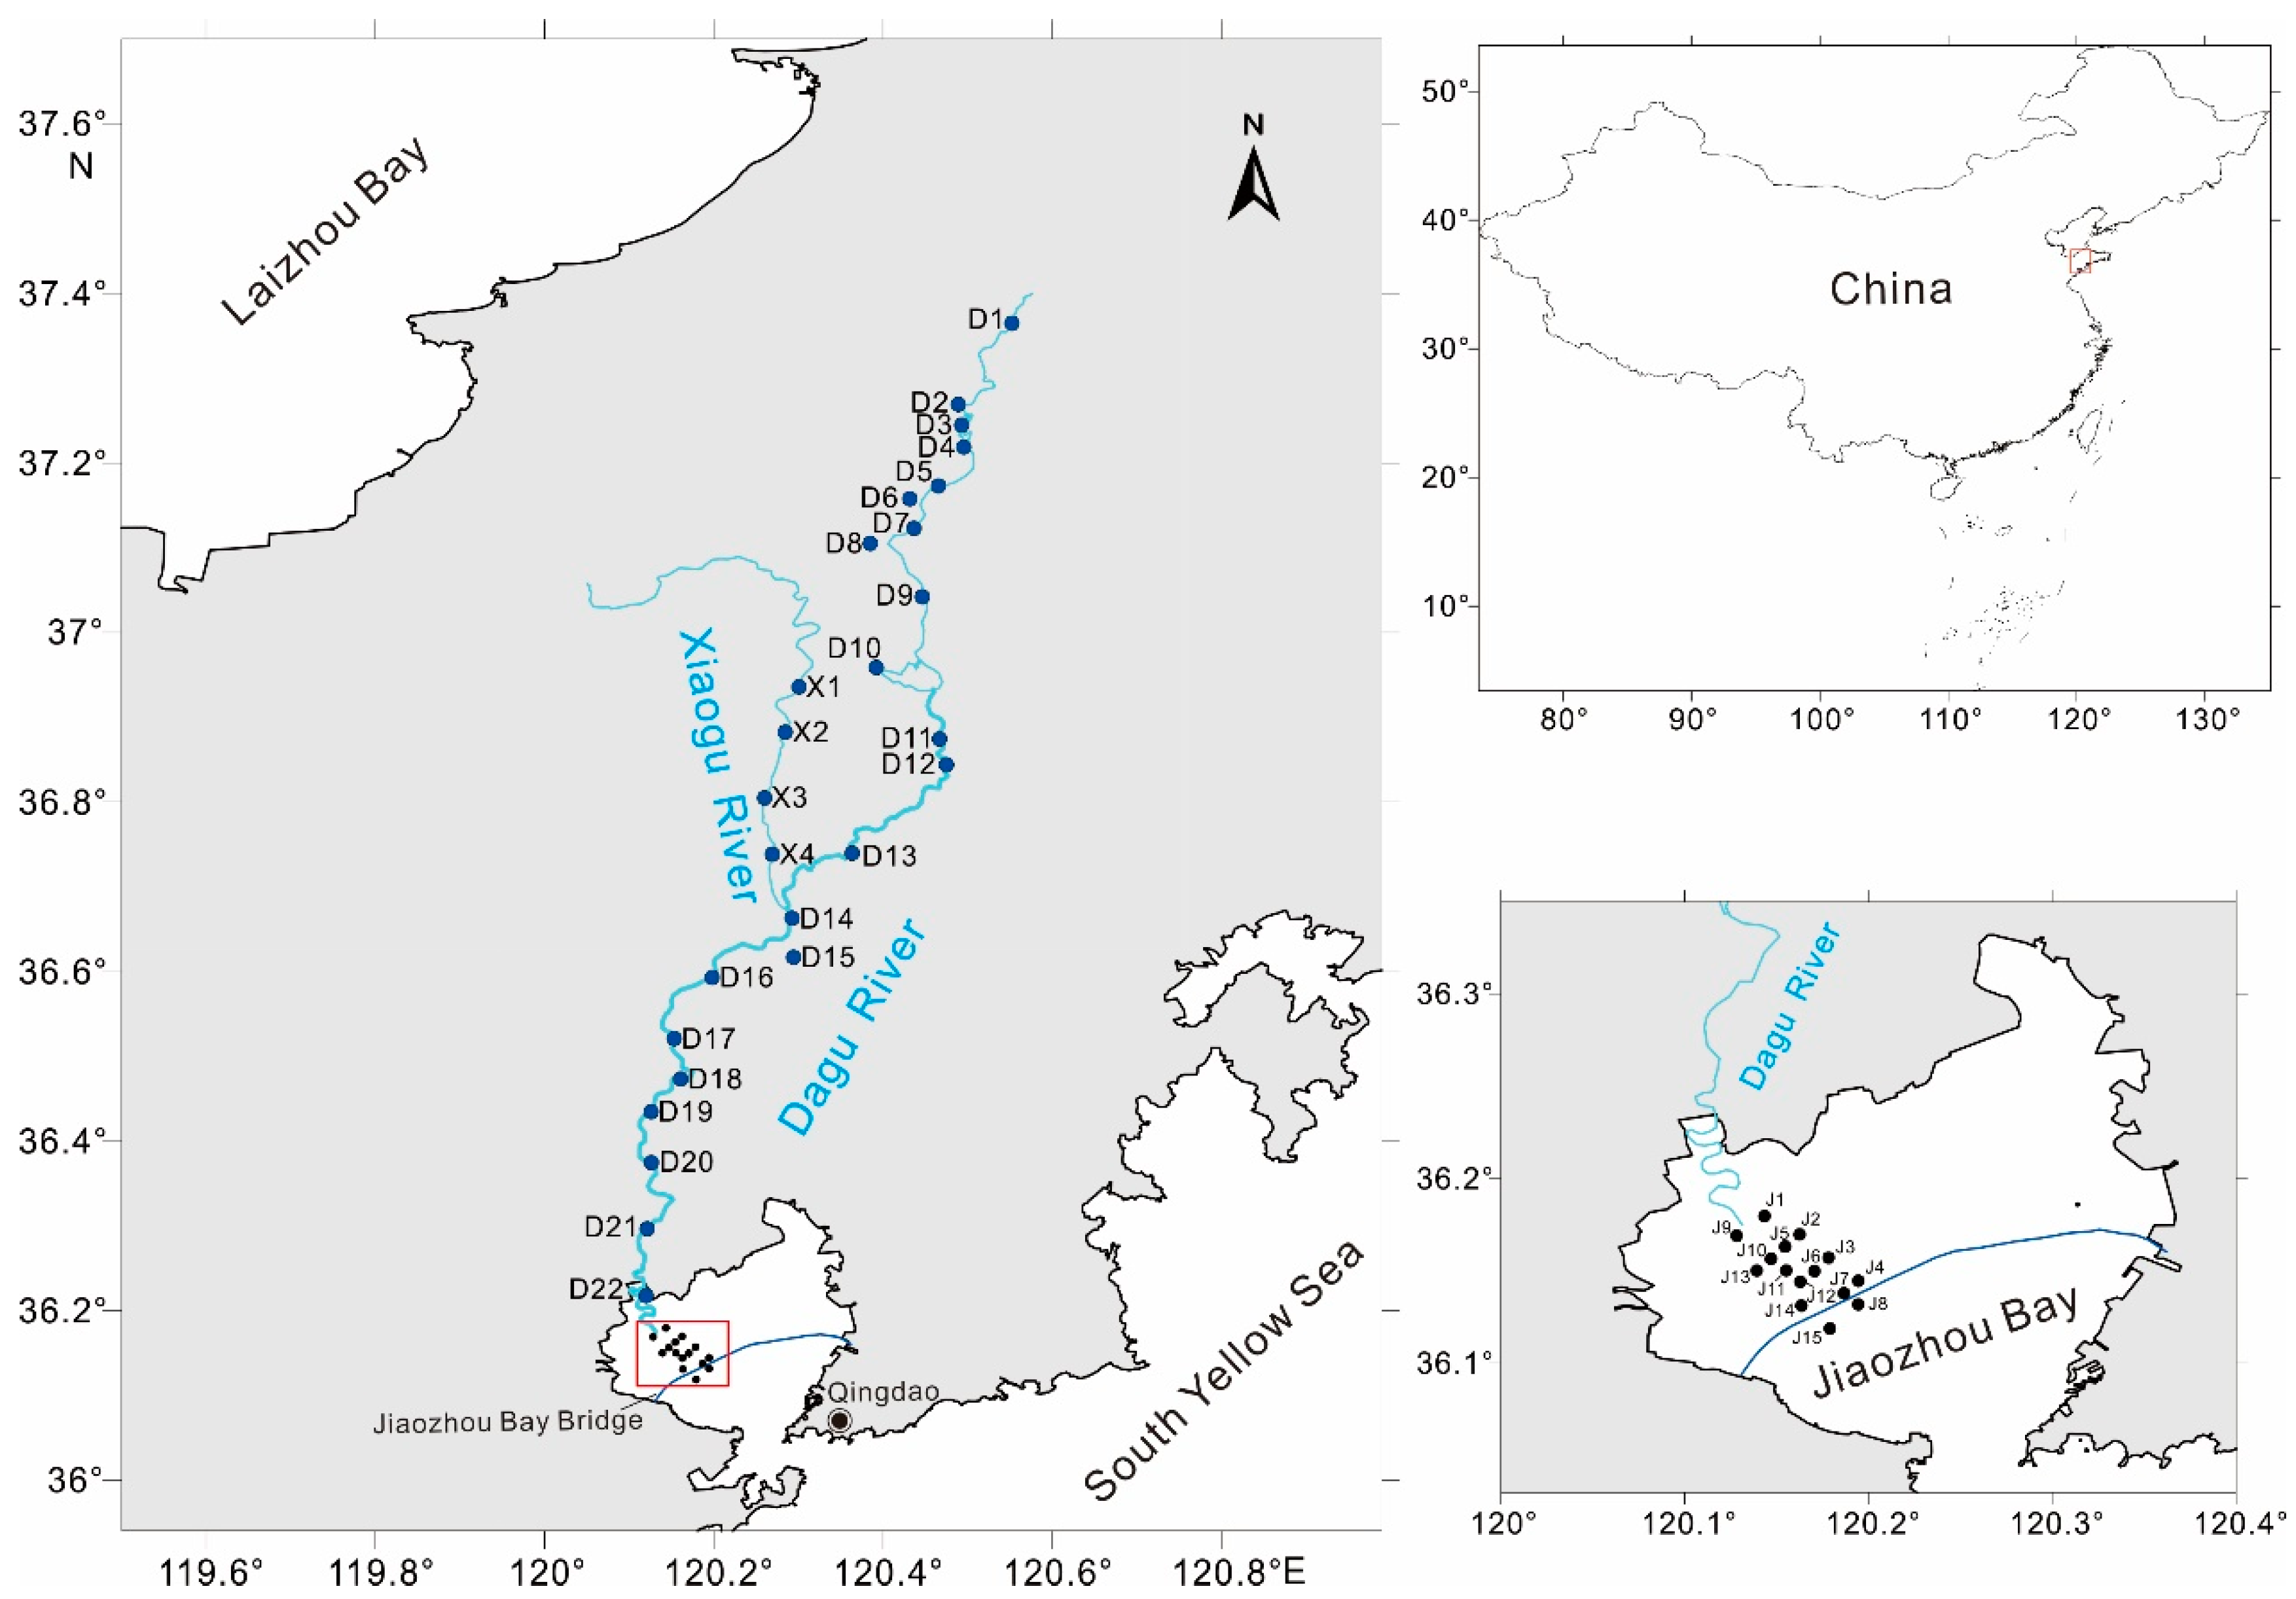
Figure 2.
Content changes of mean grain size (Mz: Φ) and mud component (Mud: %) in the river and estuary sediments. The left axis represents the mean grain size value (blue bar chart), and the right axis represents the mud content (red line chart).
Figure 2.
Content changes of mean grain size (Mz: Φ) and mud component (Mud: %) in the river and estuary sediments. The left axis represents the mean grain size value (blue bar chart), and the right axis represents the mud content (red line chart).
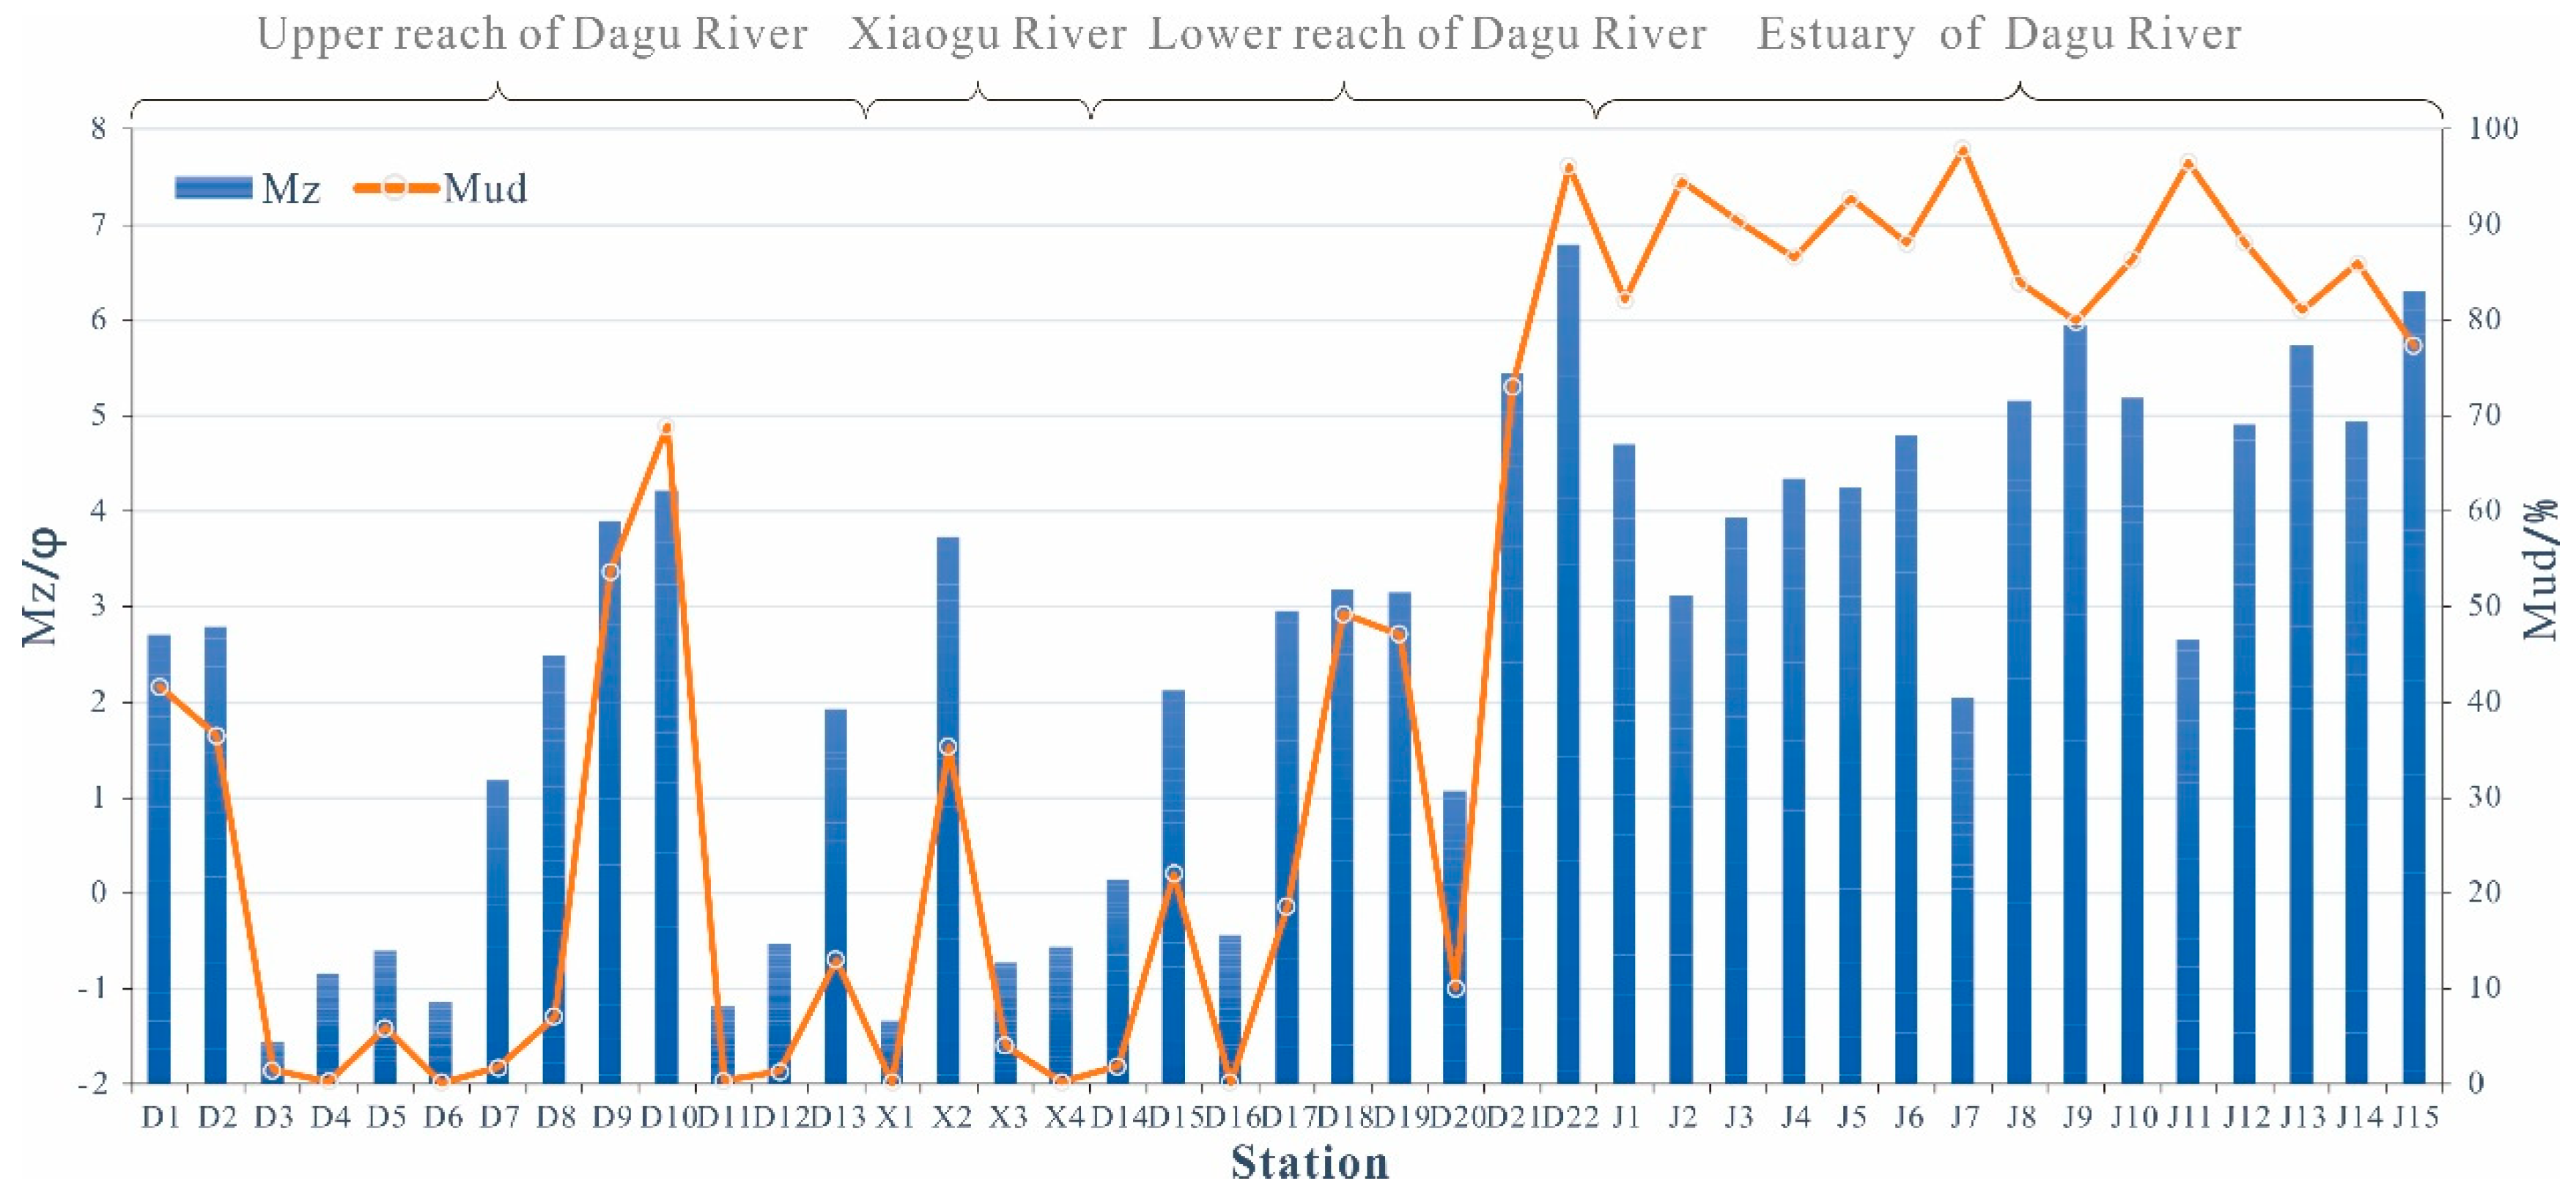
Figure 3.
Content changes of metals (Cu, Pb, Zn, Cr, Cd, As and Hg) in the river and estuary sediments.
Figure 3.
Content changes of metals (Cu, Pb, Zn, Cr, Cd, As and Hg) in the river and estuary sediments.

Figure 4.
The enrichment factors (EF) of trace metals in the river and estuary sediments.

Figure 5.
Principal component loading plot of the heavy metals and metalloids in the river and estuary sediments.
Figure 5.
Principal component loading plot of the heavy metals and metalloids in the river and estuary sediments.

Figure 6.
Sediment transport trend in the estuary. The red arrow represents the runoff direction of the Dagu River, and the blue arrow represents the possible current direction of the sea.
Figure 6.
Sediment transport trend in the estuary. The red arrow represents the runoff direction of the Dagu River, and the blue arrow represents the possible current direction of the sea.

Table 2.
Comparison between heavy metals and metalloids concentrations (mg/kg) in the Dagu River Estuary and sediment quality guidelines (SQGs) with percentage of samples in each guideline.
Table 2.
Comparison between heavy metals and metalloids concentrations (mg/kg) in the Dagu River Estuary and sediment quality guidelines (SQGs) with percentage of samples in each guideline.
| Sediment Quality Guidelines | Locations | Cu | Pb | Zn | Cr | Cd | As | Hg |
|---|---|---|---|---|---|---|---|---|
| Threshold effect level (TEL) | 18.7 | 30.2 | 124 | 52.3 | 0.68 | 7.24 | 0.13 | |
| Probable effect level (PEL) | 108 | 112 | 271 | 160 | 4.21 | 41.6 | 0.7 | |
| Compared with TEL and PEL (% of samples in each guideline) | ||||||||
| <TEL (%) | Dagu River | 82.9 | 87.8 | 100 | 87.8 | 100 | 95.1 | 97.6 |
| Dagu River Estuary | 73.2 | 95.1 | 100 | 73.2 | 100 | 92.7 | 100 | |
| ≥TEL < PEL (%) | Dagu River | 17.1 | 12.2 | 0 | 12.2 | 0 | 4.9 | 2.4 |
| Dagu River Estuary | 26.8 | 4.9 | 0 | 26.8 | 0 | 7.3 | 0 | |
Table 3.
Background values and enrichment factors (EF) of heavy metals and metalloids in the Dagu River Estuary.
Table 3.
Background values and enrichment factors (EF) of heavy metals and metalloids in the Dagu River Estuary.
| Parameters | Locations | Cu | Pb | Zn | Cr | Cd | As | Hg |
|---|---|---|---|---|---|---|---|---|
| Mbackground [46] (mg/kg) | North China | 25 | 15 | 61 | 90 | 0.091 | 5.6 | 0.0094 |
| EF | Dagu River | 0.6 | 1.6 | 0.6 | 0.4 | 0.6 | 0.5 | 2.0 |
| 0.2~2.0 | 0.8~2.2 | 0.2~1.1 | 0.1~0.8 | 0.4~1.2 | 0.1~1.4 | 0.5~12.9 | ||
| Dagu River Estuary | 0.8 | 1.6 | 0.4 | 0.6 | 0.6 | 0.9 | 2.7 | |
| 0.2~1.6 | 1.4~1.8 | 0.4~1.3 | 0.2~0.8 | 0.4~0.9 | 0.6~1.6 | 0.5~4.9 |
Mbackground presents the background metal values, which were the average metal concentrations of the upper continental crust in North China [46].
Table 4.
Pearson’s correlation matrix for the heavy metals and metalloids and selected elements (Al, Fe, Mn), total organic carbon (TOC) and mean grain size (Mz) (n = 26) in the river.
Table 4.
Pearson’s correlation matrix for the heavy metals and metalloids and selected elements (Al, Fe, Mn), total organic carbon (TOC) and mean grain size (Mz) (n = 26) in the river.
| Variables | Al | Mn | Fe | TOC | Cu | Pb | Zn | Cr | Cd | As | Hg | Mz |
|---|---|---|---|---|---|---|---|---|---|---|---|---|
| Al | 1.00 | |||||||||||
| Mn | 0.10 | 1.00 | ||||||||||
| Fe | 0.48 * | 0.57 ** | 1.00 | |||||||||
| TOC | 0.34 | 0.29 | 0.48 * | 1.00 | ||||||||
| Cu | 0.41 * | 0.66 ** | 0.92 ** | 0.49 * | 1.00 | |||||||
| Pb | 0.61 ** | 0.10 | 0.15 | 0.37 | 0.23 | 1.00 | ||||||
| Zn | 0.72 ** | 0.43 * | 0.86 ** | 0.61 ** | 0.87 ** | 0.47 * | 1.00 | |||||
| Cr | 0.49 * | 0.49 * | 0.86 ** | 0.59 ** | 0.79 ** | 0.25 | 0.85 ** | 1.00 | ||||
| Cd | 0.48 * | 0.43 * | 0.66 ** | 0.68 ** | 0.65 ** | 0.48 * | 0.76 ** | 0.71 ** | 1.00 | |||
| As | 0.37 | 0.50 ** | 0.57 ** | 0.63 ** | 0.61 ** | 0.29 | 0.68 ** | 0.78 ** | 0.51 ** | 1.00 | ||
| Hg | 0.56 ** | 0.17 | 0.41 * | 0.40 * | 0.41 * | 0.49 * | 0.60 ** | 0.62 ** | 0.74 ** | 0.47 * | 1.00 | |
| Mz | 0.60 ** | 0.22 | 0.54 ** | 0.60 ** | 0.54 ** | 0.34 | 0.76 ** | 0.77 ** | 0.50 ** | 0.79 ** | 0.56 ** | 1.00 |
** Correlation is significant at the 0.01 level (two-tailed). * Correlation is significant at the 0.05 level (two-tailed).
Table 5.
Pearson’s correlation matrix for the heavy metals and metalloids and selected elements (Al, Fe, Mn), total organic carbon (TOC) and mean grain size (Mz) (n = 15) in the estuary.
Table 5.
Pearson’s correlation matrix for the heavy metals and metalloids and selected elements (Al, Fe, Mn), total organic carbon (TOC) and mean grain size (Mz) (n = 15) in the estuary.
| Variables | Al | Mn | Fe | TOC | Cu | Pb | Zn | Cr | Cd | As | Hg | Mz |
|---|---|---|---|---|---|---|---|---|---|---|---|---|
| Al | 1.00 | |||||||||||
| Mn | 0.38 | 1.00 | ||||||||||
| Fe | 0.54 * | 0.57 * | 1.00 | |||||||||
| TOC | 0.39 | 0.46 | 0.96 ** | 1.00 | ||||||||
| Cu | 0.38 | 0.37 | 0.85 ** | 0.90 ** | 1.00 | |||||||
| Pb | 0.74 ** | 0.36 | 0.69 ** | 0.66 ** | 0.65 ** | 1.00 | ||||||
| Zn | 0.44 | 0.56 * | 0.98 ** | 0.97 ** | 0.92 ** | 0.65 ** | 1.00 | |||||
| Cr | 0.48 | 0.67 ** | 0.97 ** | 0.94 ** | 0.85 ** | 0.61 * | 0.97 ** | 1.00 | ||||
| Cd | 0.47 | 0.31 | 0.83 ** | 0.85 ** | 0.87 ** | 0.61 * | 0.88 ** | 0.84 ** | 1.00 | |||
| As | 0.70 ** | 0.43 | 0.92 ** | 0.86 ** | 0.79 ** | 0.74 ** | 0.86 ** | 0.85 ** | 0.73 ** | 1.00 | ||
| Hg | 0.47 | 0.48 | 0.97 ** | 0.96 ** | 0.87 ** | 0.68 ** | 0.98 ** | 0.94 ** | 0.90 ** | 0.86 ** | 1.00 | |
| Mz | 0.10 | 0.44 | 0.58 * | 0.55 * | 0.54 * | 0.22 | 0.65 ** | 0.66 ** | 0.60 * | 0.41 | 0.65 ** | 1.00 |
** Correlation is significant at the 0.01 level (two-tailed). * Correlation is significant at the 0.05 level (two-tailed).
Table 6.
Rotated component matrix for data of surface sediments and eigenvalues, percentage of variances, and eigenvectors for the two principal components (PC1–PC2).
Table 6.
Rotated component matrix for data of surface sediments and eigenvalues, percentage of variances, and eigenvectors for the two principal components (PC1–PC2).
| Parameter | Dagu River | Dagu River Estuary | ||
|---|---|---|---|---|
| PC1 | PC2 | PC1 | PC2 | |
| Al | 0.21 | 0.80 | 0.15 | 0.96 |
| Mn | 0.78 | −0.10 | 0.41 | 0.41 |
| Fe | 0.89 | 0.24 | 0.88 | 0.43 |
| TOC | 0.52 | 0.47 | 0.94 | 0.28 |
| Cu | 0.90 | 0.23 | 0.89 | 0.26 |
| Pb | −0.02 | 0.84 | 0.43 | 0.78 |
| Zn | 0.74 | 0.60 | 0.94 | 0.32 |
| Cr | 0.83 | 0.41 | 0.90 | 0.36 |
| Cd | 0.59 | 0.63 | 0.85 | 0.28 |
| As | 0.71 | 0.34 | 0.71 | 0.61 |
| Hg | 0.30 | 0.76 | 0.92 | 0.35 |
| Eigenvalues | 4.73 | 3.31 | 6.61 | 2.84 |
| Percentage of Variances | 42.96 | 30.09 | 60.12 | 25.83 |
| Cumulative % Eigenvectors | 42.96 | 73.05 | 60.12 | 85.95 |
Extraction method: principal component analysis. Rotation method: Varimax with Kaiser normalization. Rotation converged in three iterations.
© 2019 by the authors. Licensee MDPI, Basel, Switzerland. This article is an open access article distributed under the terms and conditions of the Creative Commons Attribution (CC BY) license (http://creativecommons.org/licenses/by/4.0/).
Share and Cite
MDPI and ACS Style
Liu, J.; Yin, P.; Chen, X.; Cao, K. Distribution, Enrichment and Transport of Trace Metals in Sediments from the Dagu River Estuary in the Jiaozhou Bay, Qingdao, China. Minerals 2019, 9, 545. https://doi.org/10.3390/min9090545
AMA Style
Liu J, Yin P, Chen X, Cao K. Distribution, Enrichment and Transport of Trace Metals in Sediments from the Dagu River Estuary in the Jiaozhou Bay, Qingdao, China. Minerals. 2019; 9(9):545. https://doi.org/10.3390/min9090545
Chicago/Turabian StyleLiu, Jinqing, Ping Yin, Xiaoying Chen, and Ke Cao. 2019. "Distribution, Enrichment and Transport of Trace Metals in Sediments from the Dagu River Estuary in the Jiaozhou Bay, Qingdao, China" Minerals 9, no. 9: 545. https://doi.org/10.3390/min9090545
Note that from the first issue of 2016, this journal uses article numbers instead of page numbers. See further details here.