Mono and Poly-Cationic Adsorption of Heavy Metals Using Natural Glauconite


Abstract
1. Introduction
2. Materials and Methods
2.1. Materials
2.2. Batch Adsorption Experiments
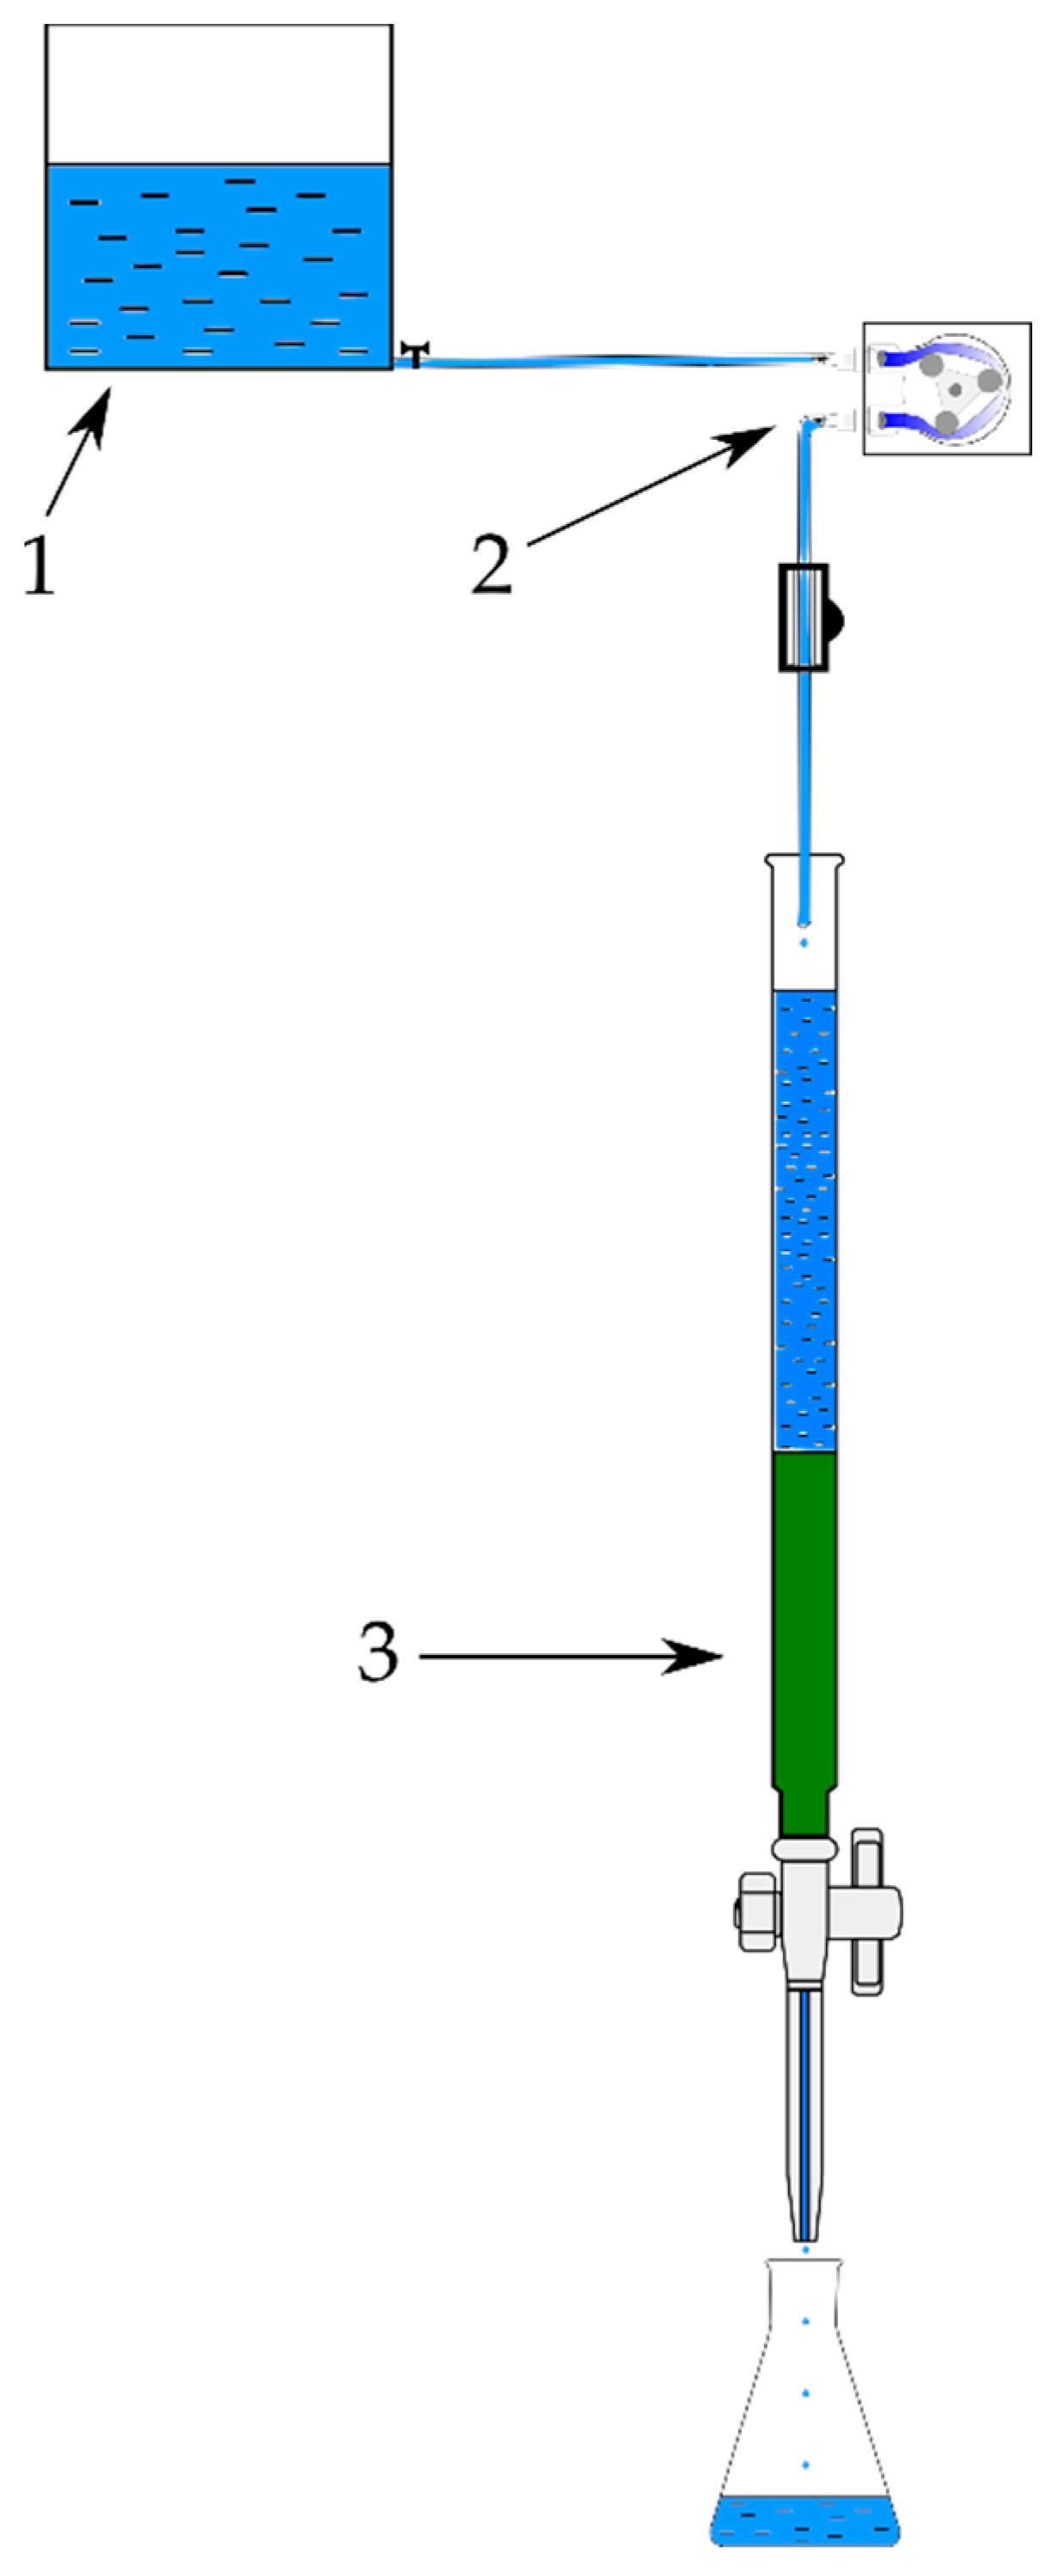
2.3. Fixed-Bed Column Experiments
3. Results and Discussion
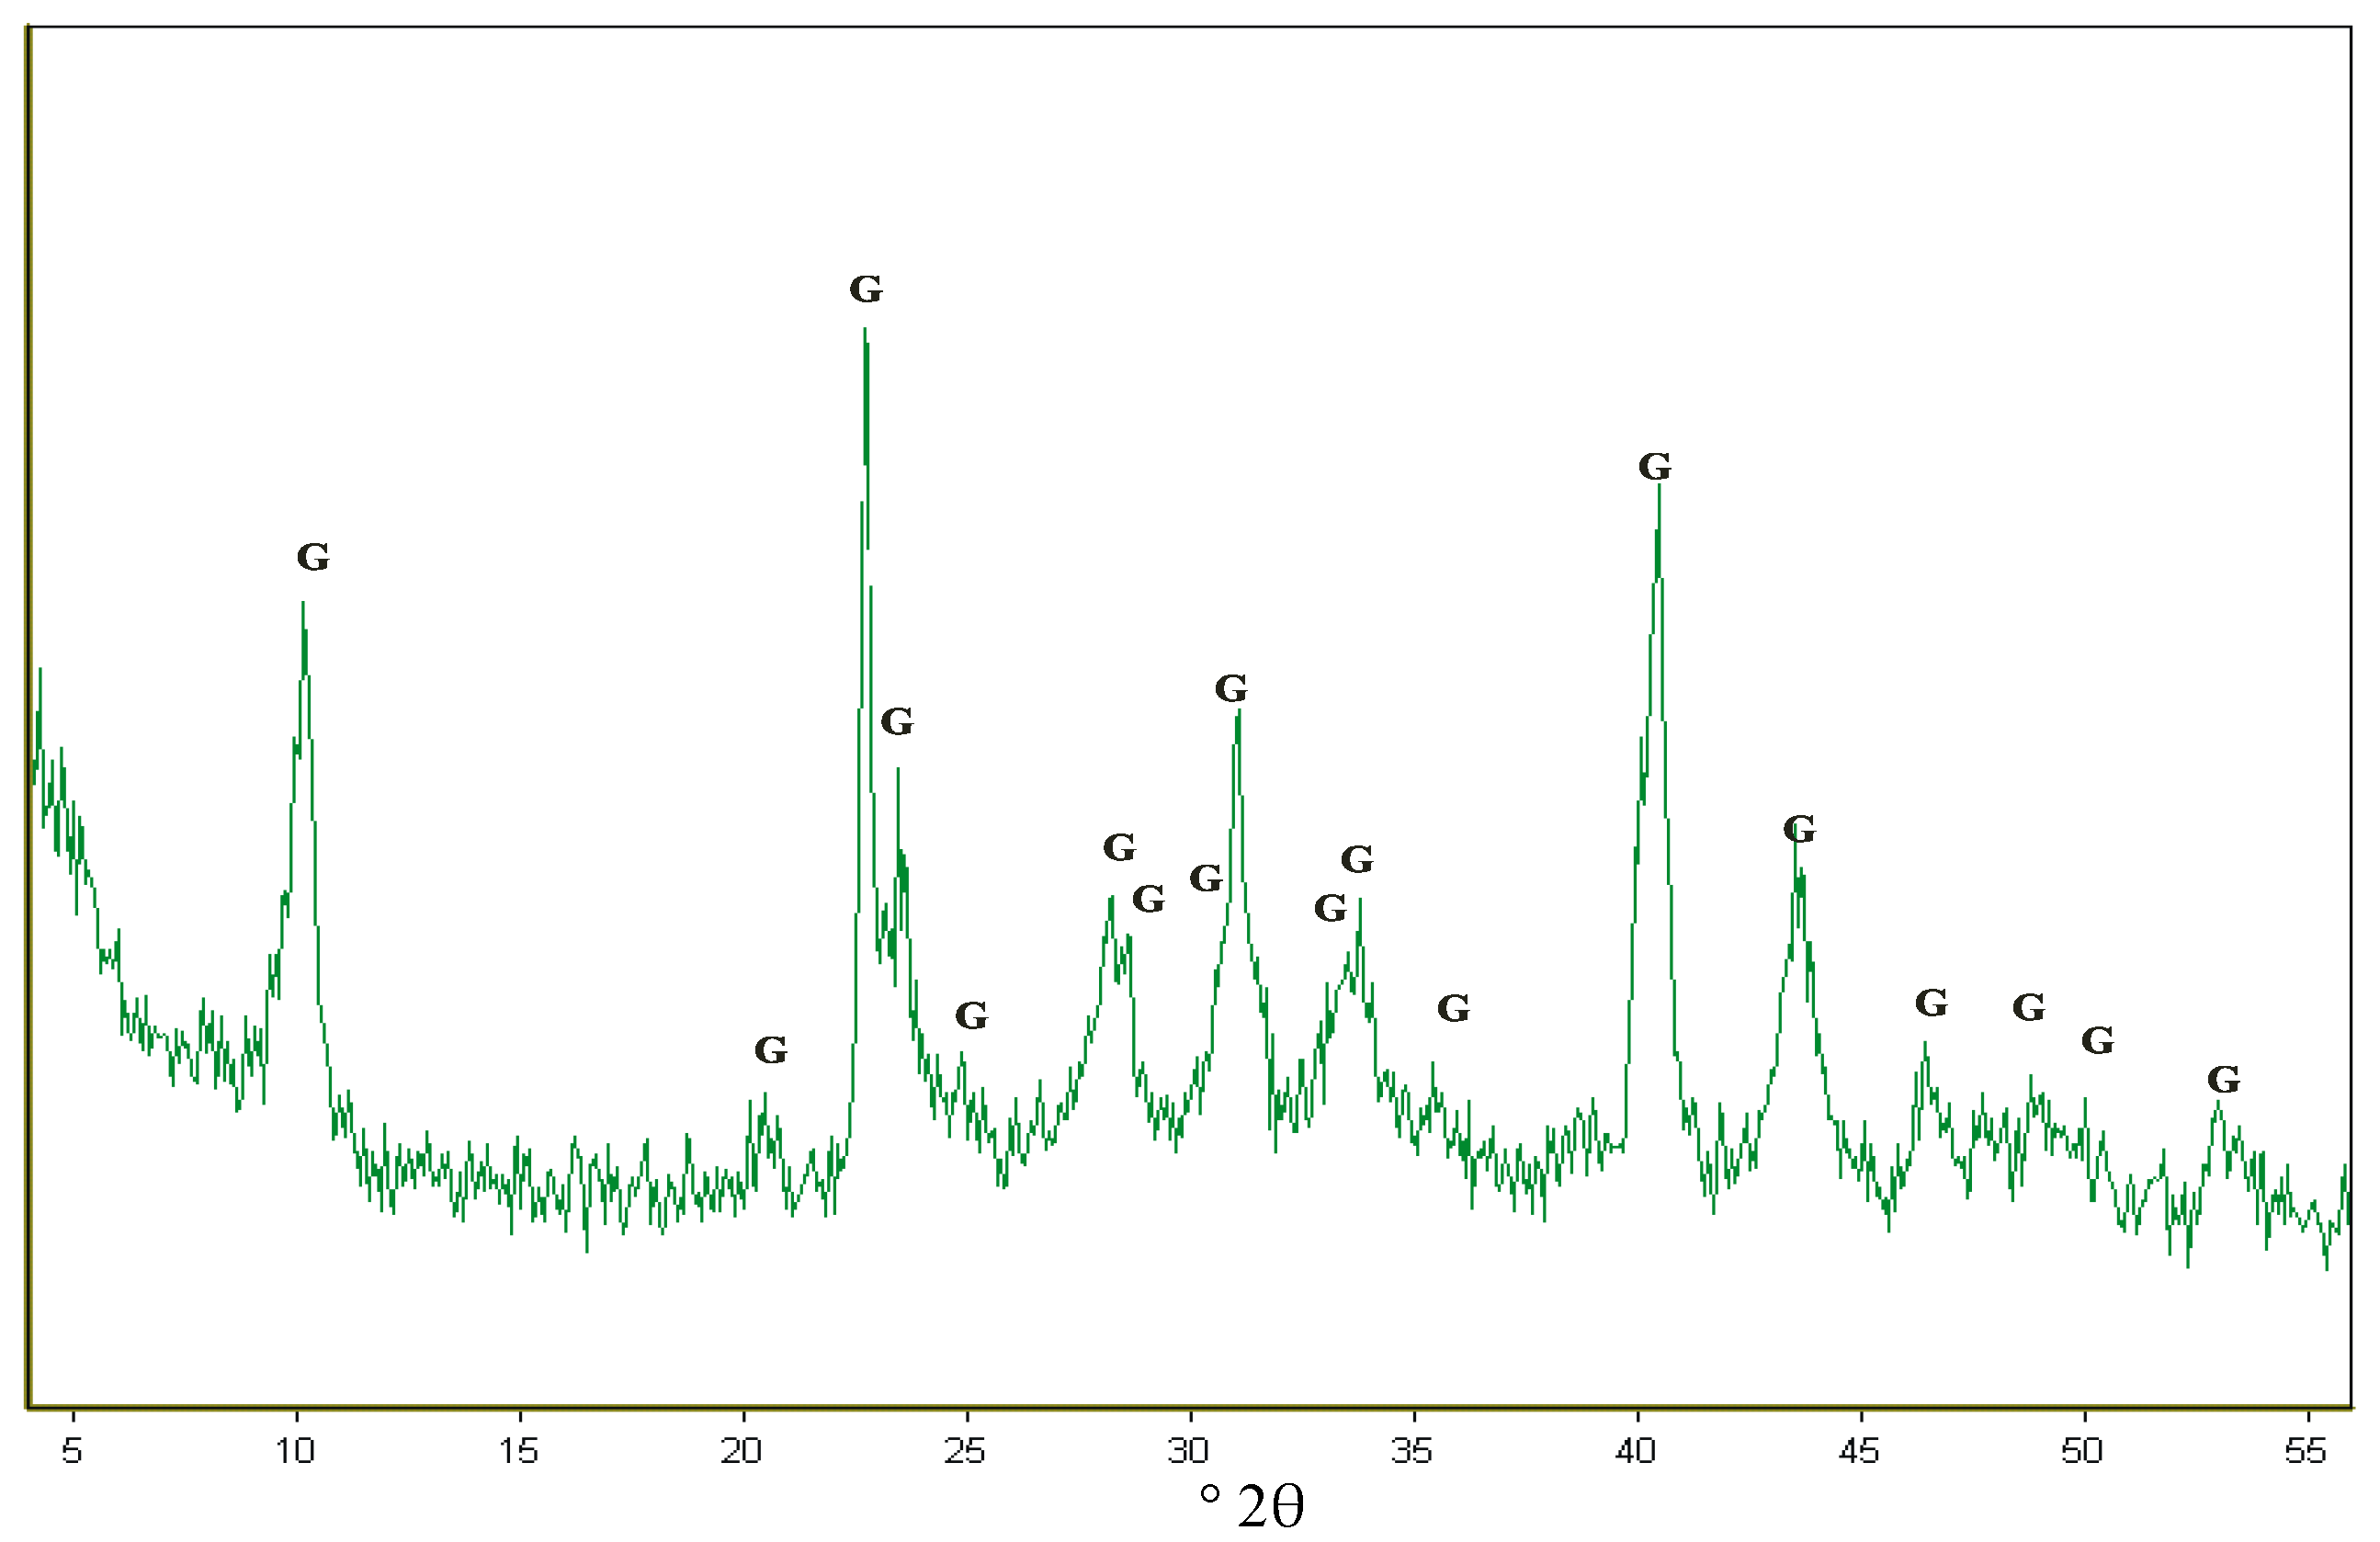
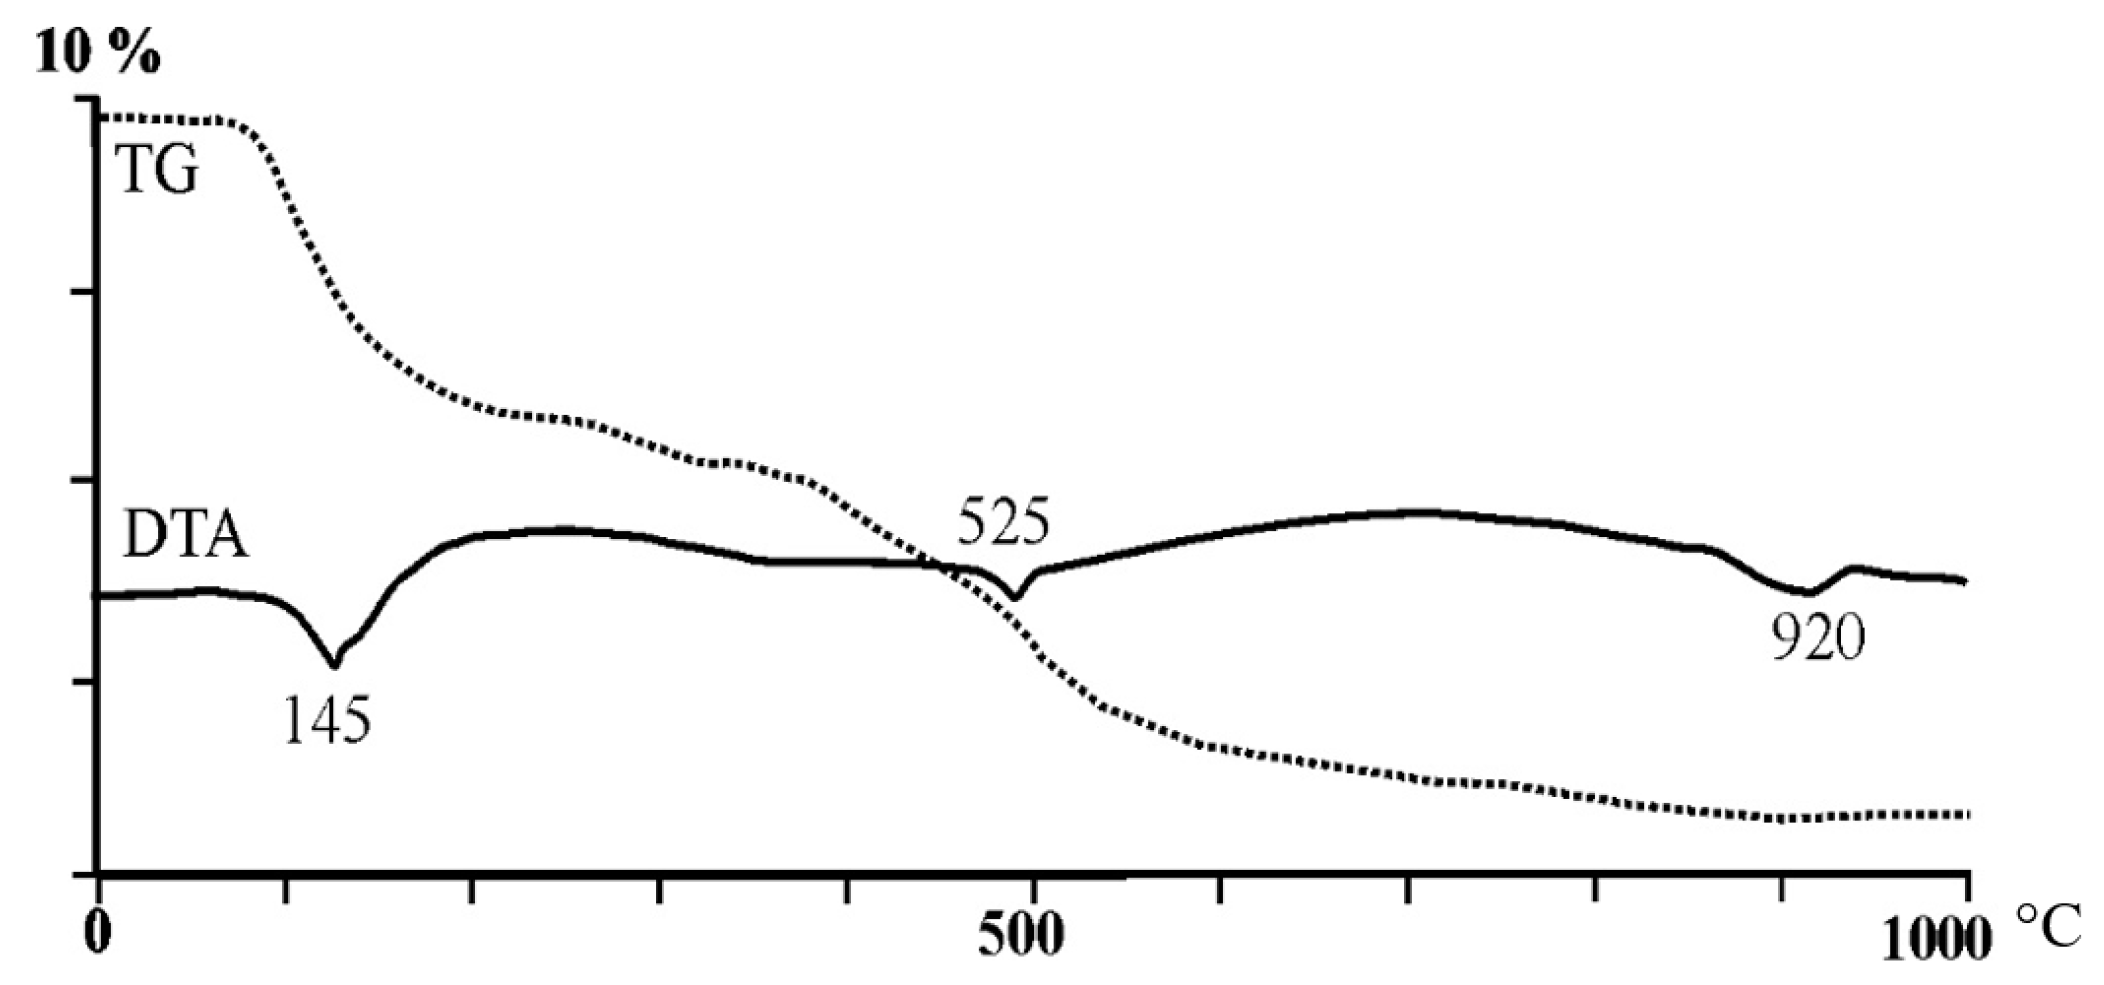
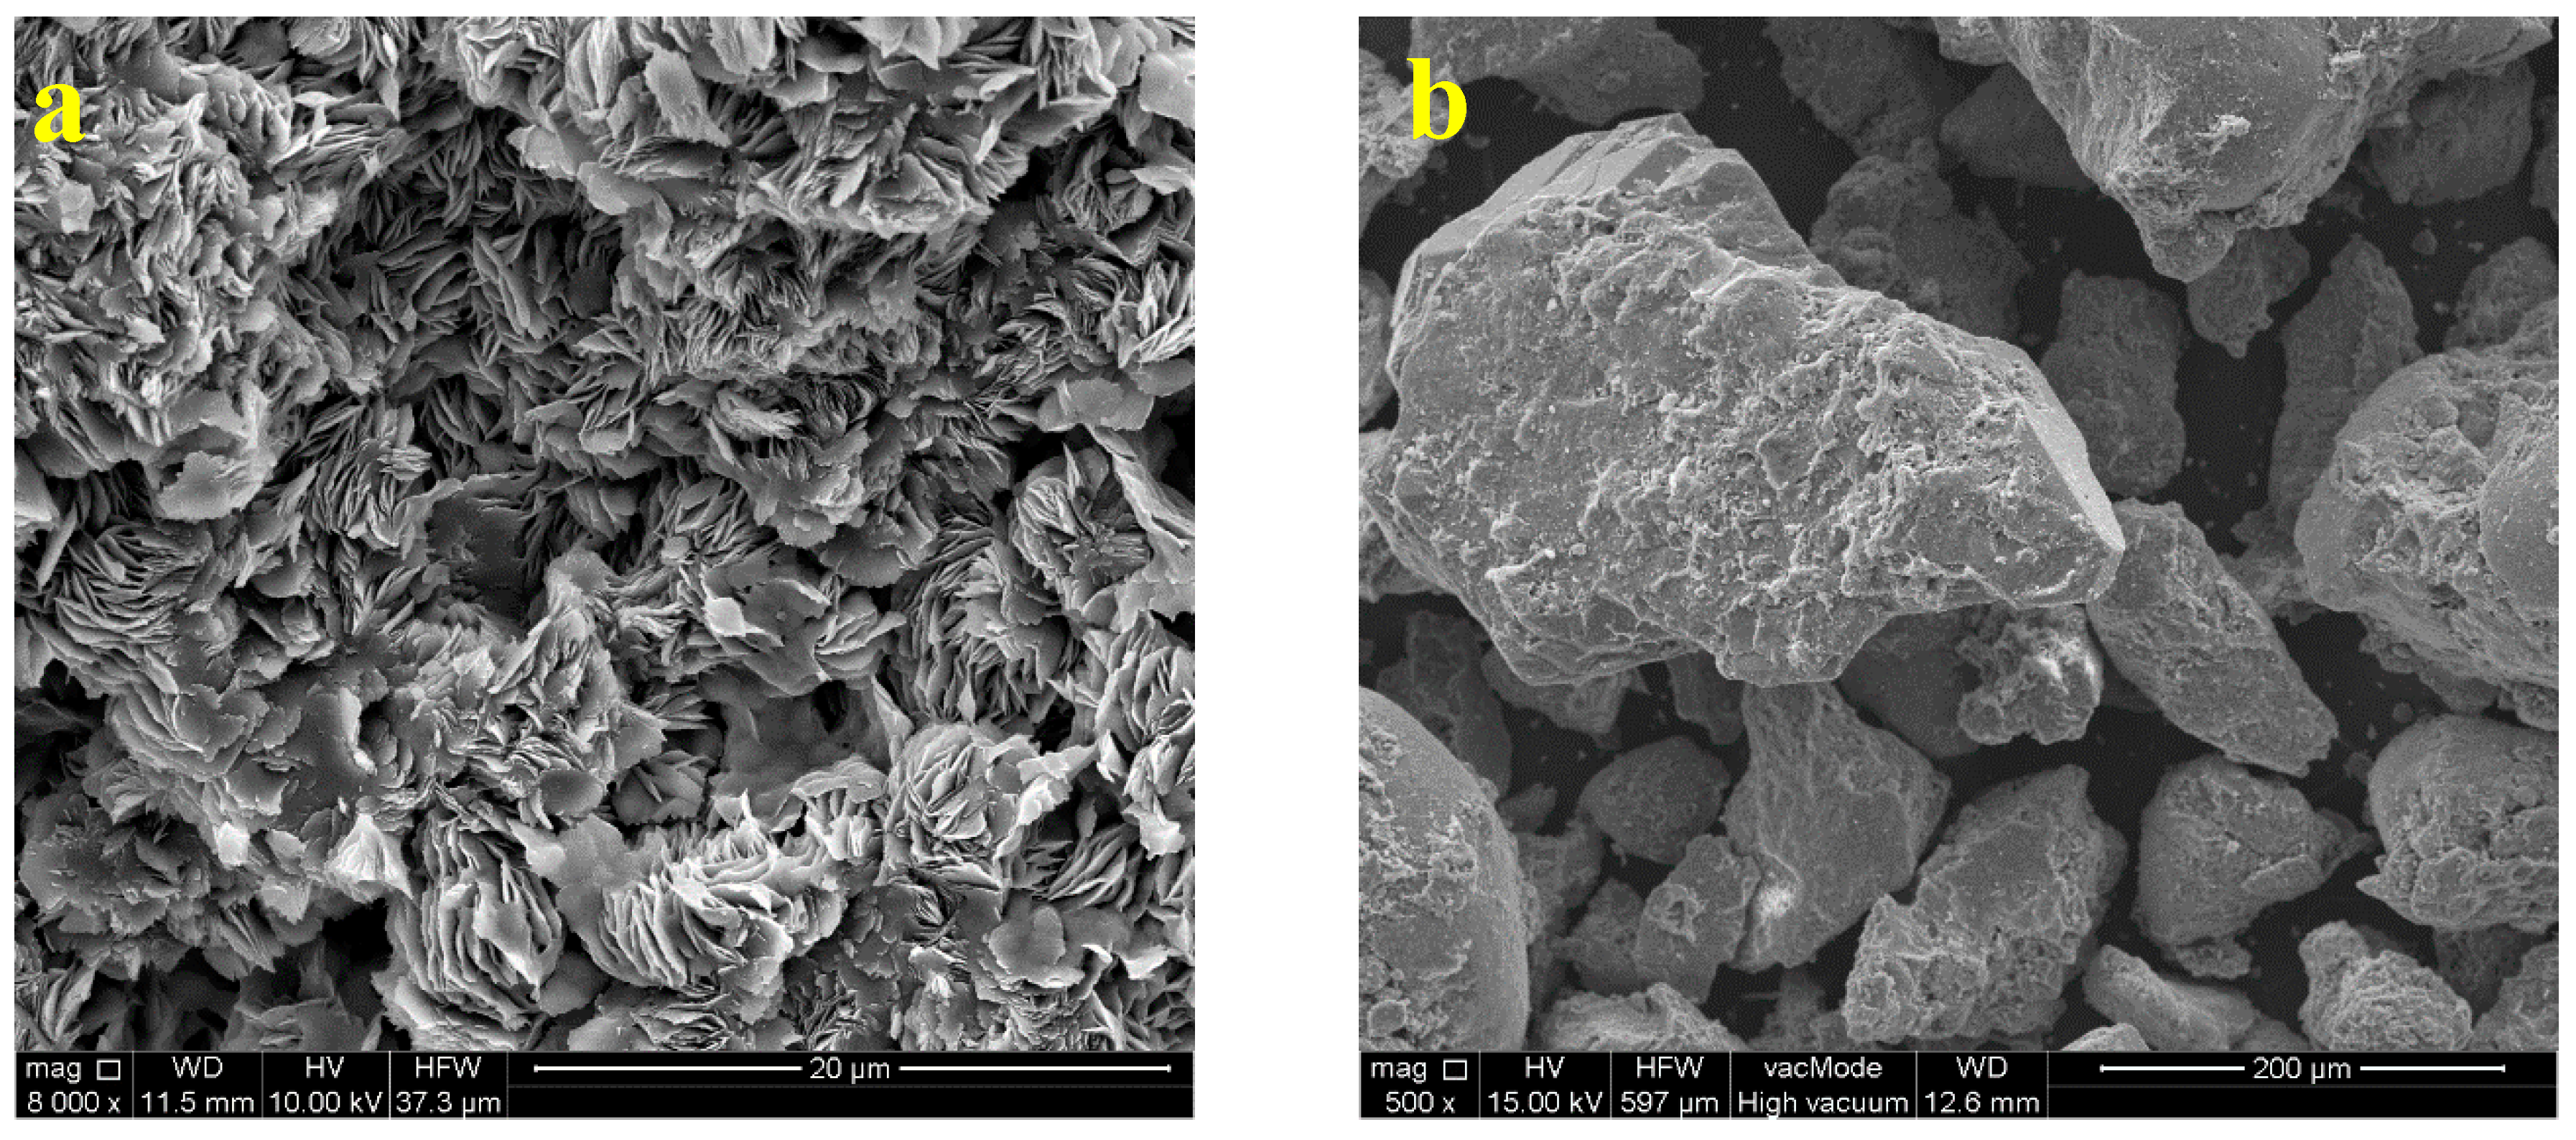
3.1. Glauconite Characteristics
3.2. Batch Experiments
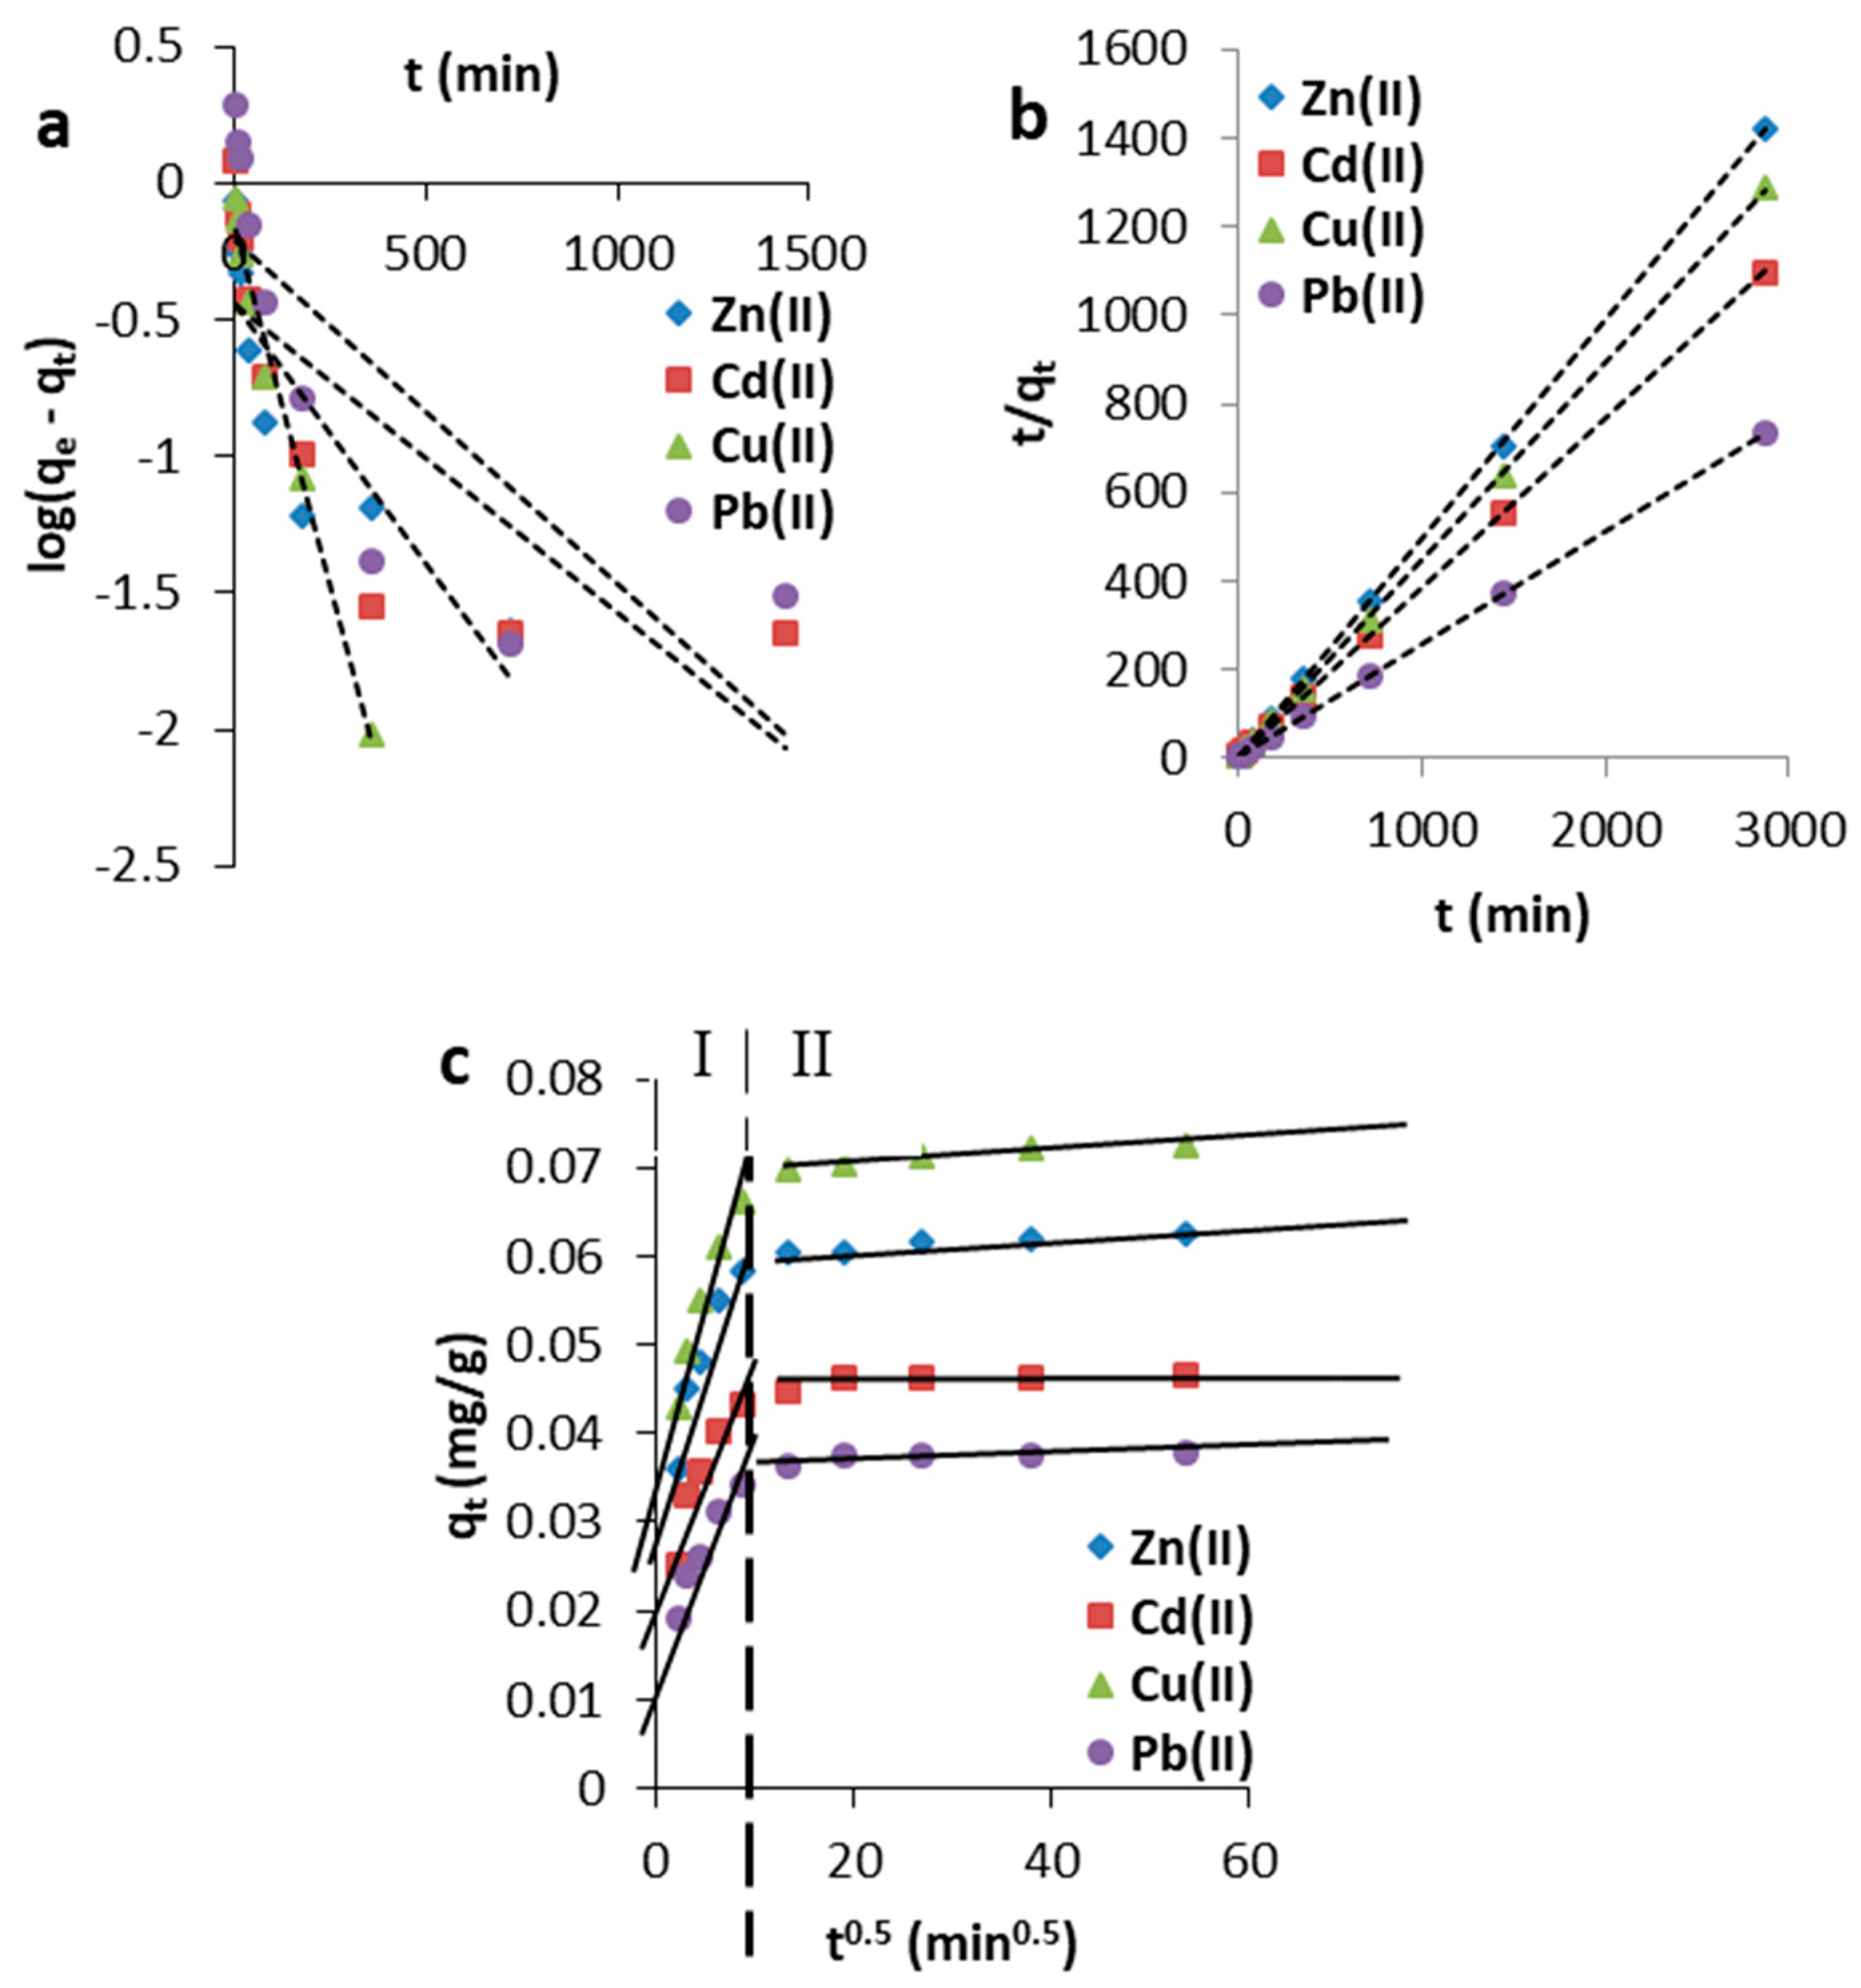
3.2.1. Effect of Contact Time
- pseudo-first-order model,
- pseudo-second-order model,
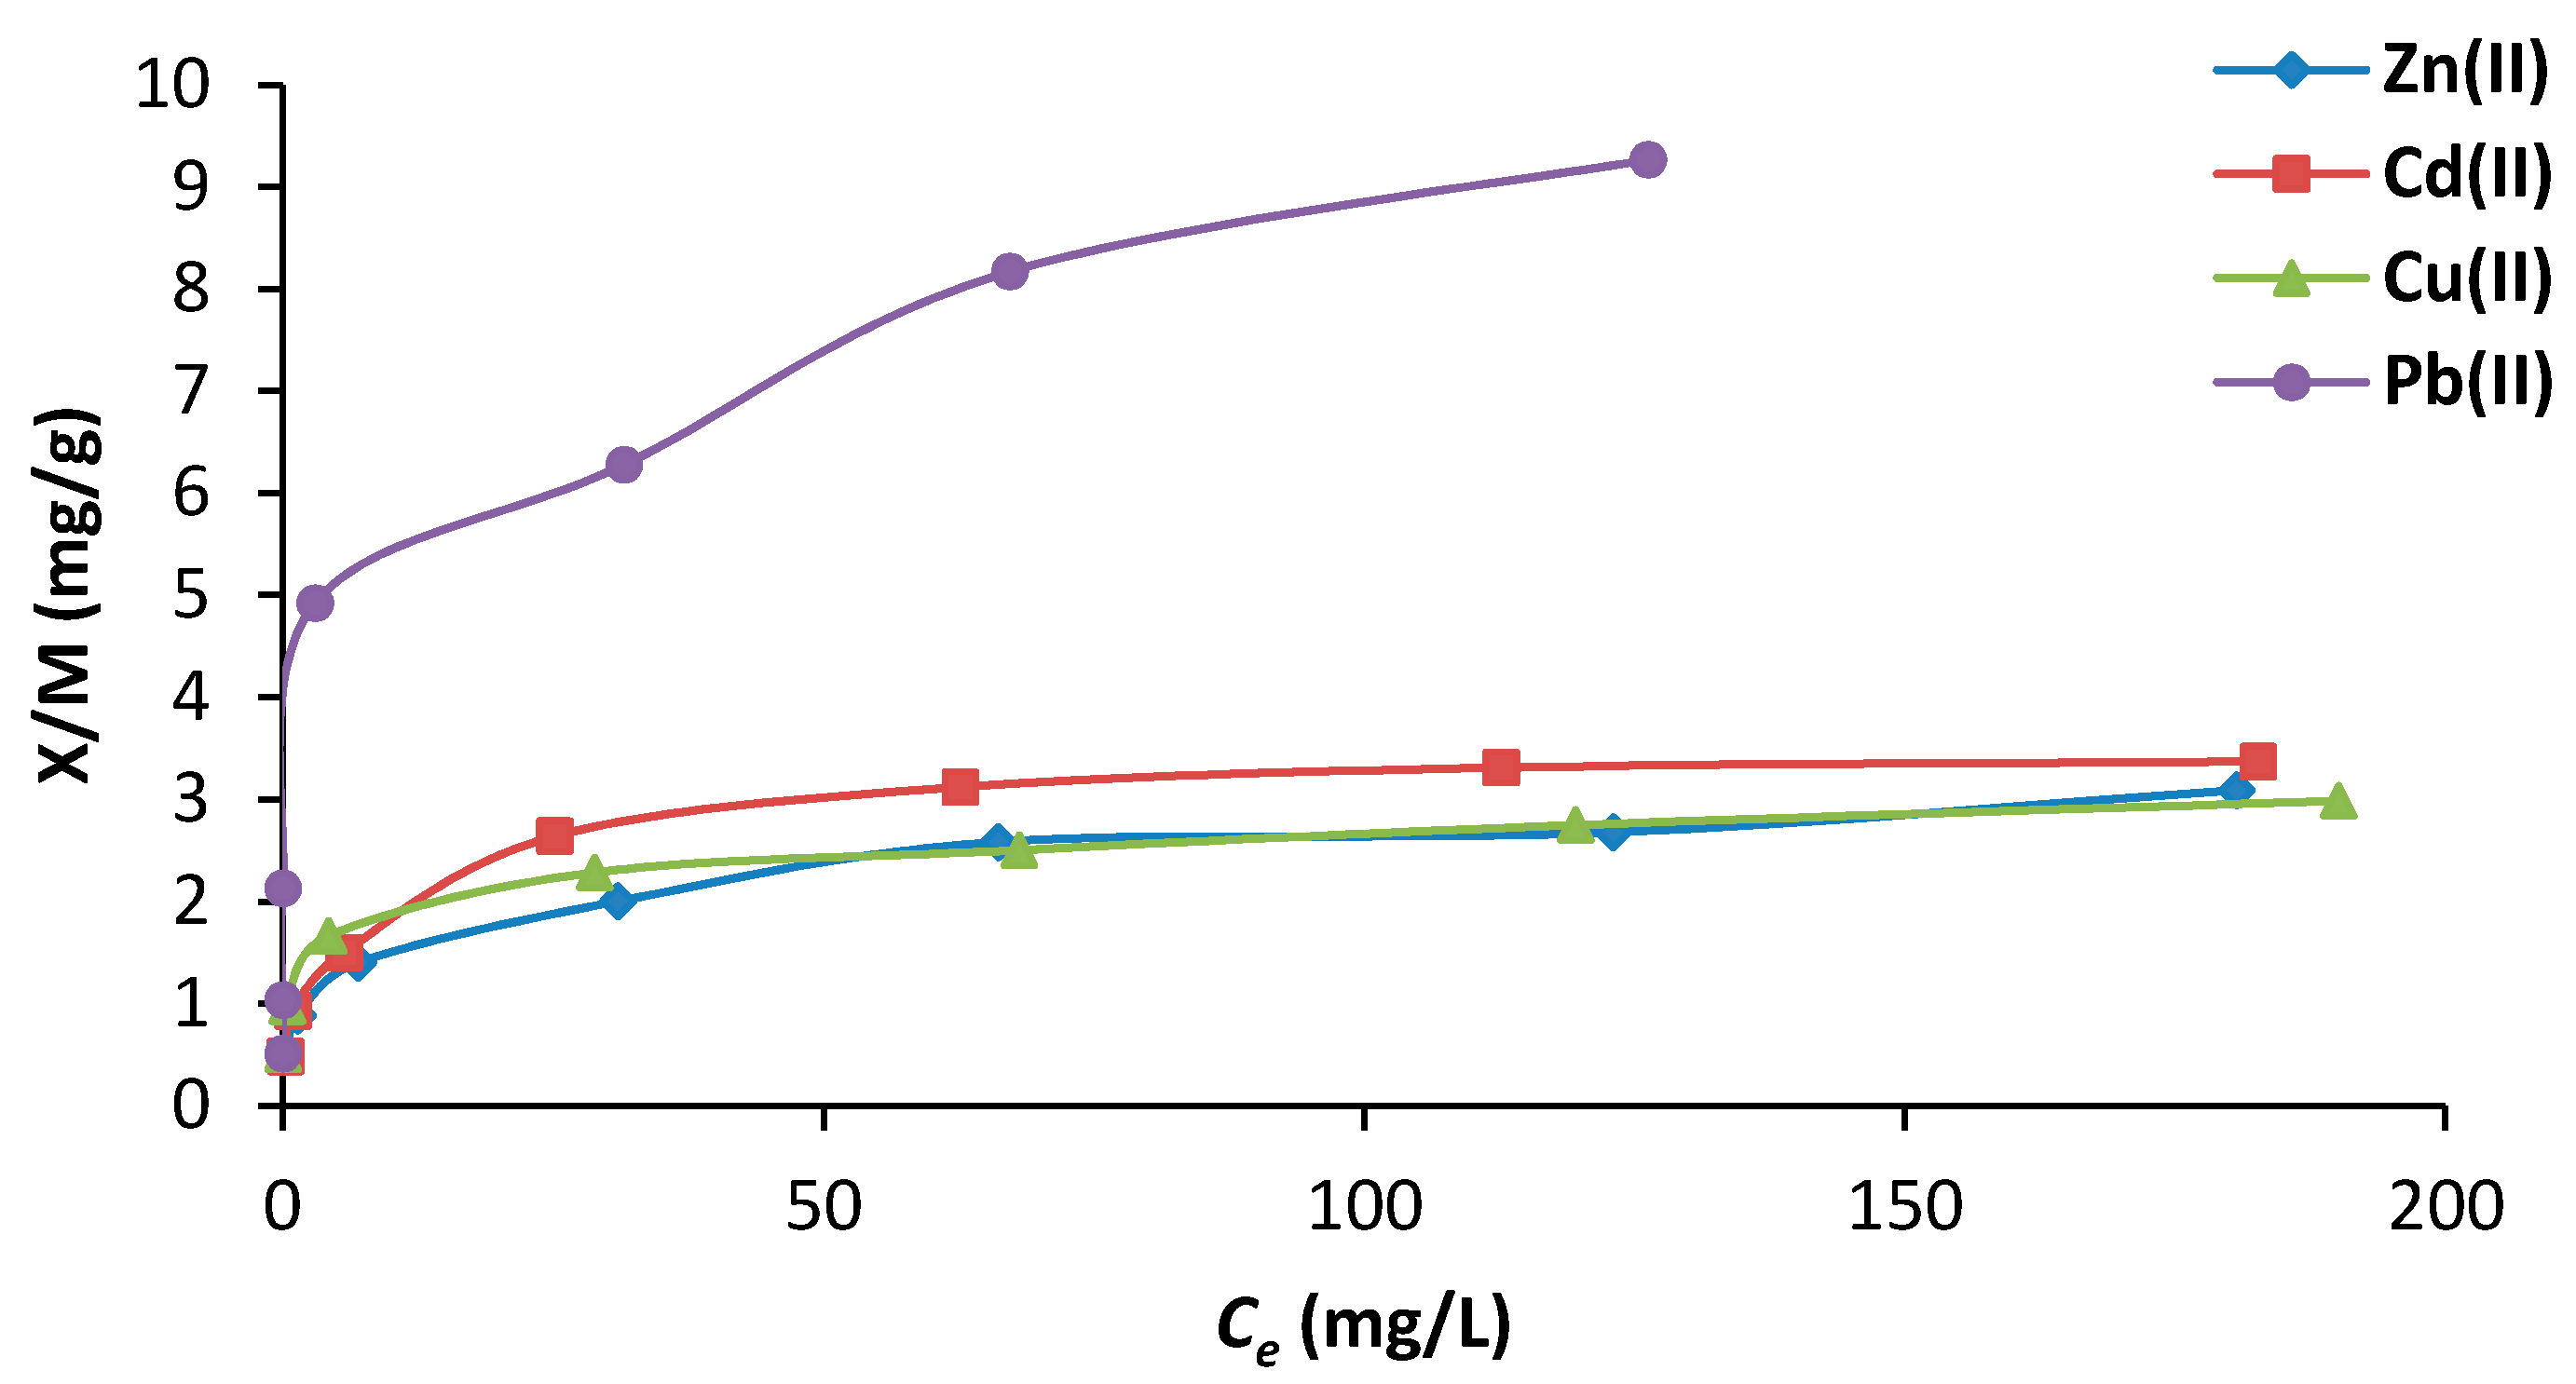
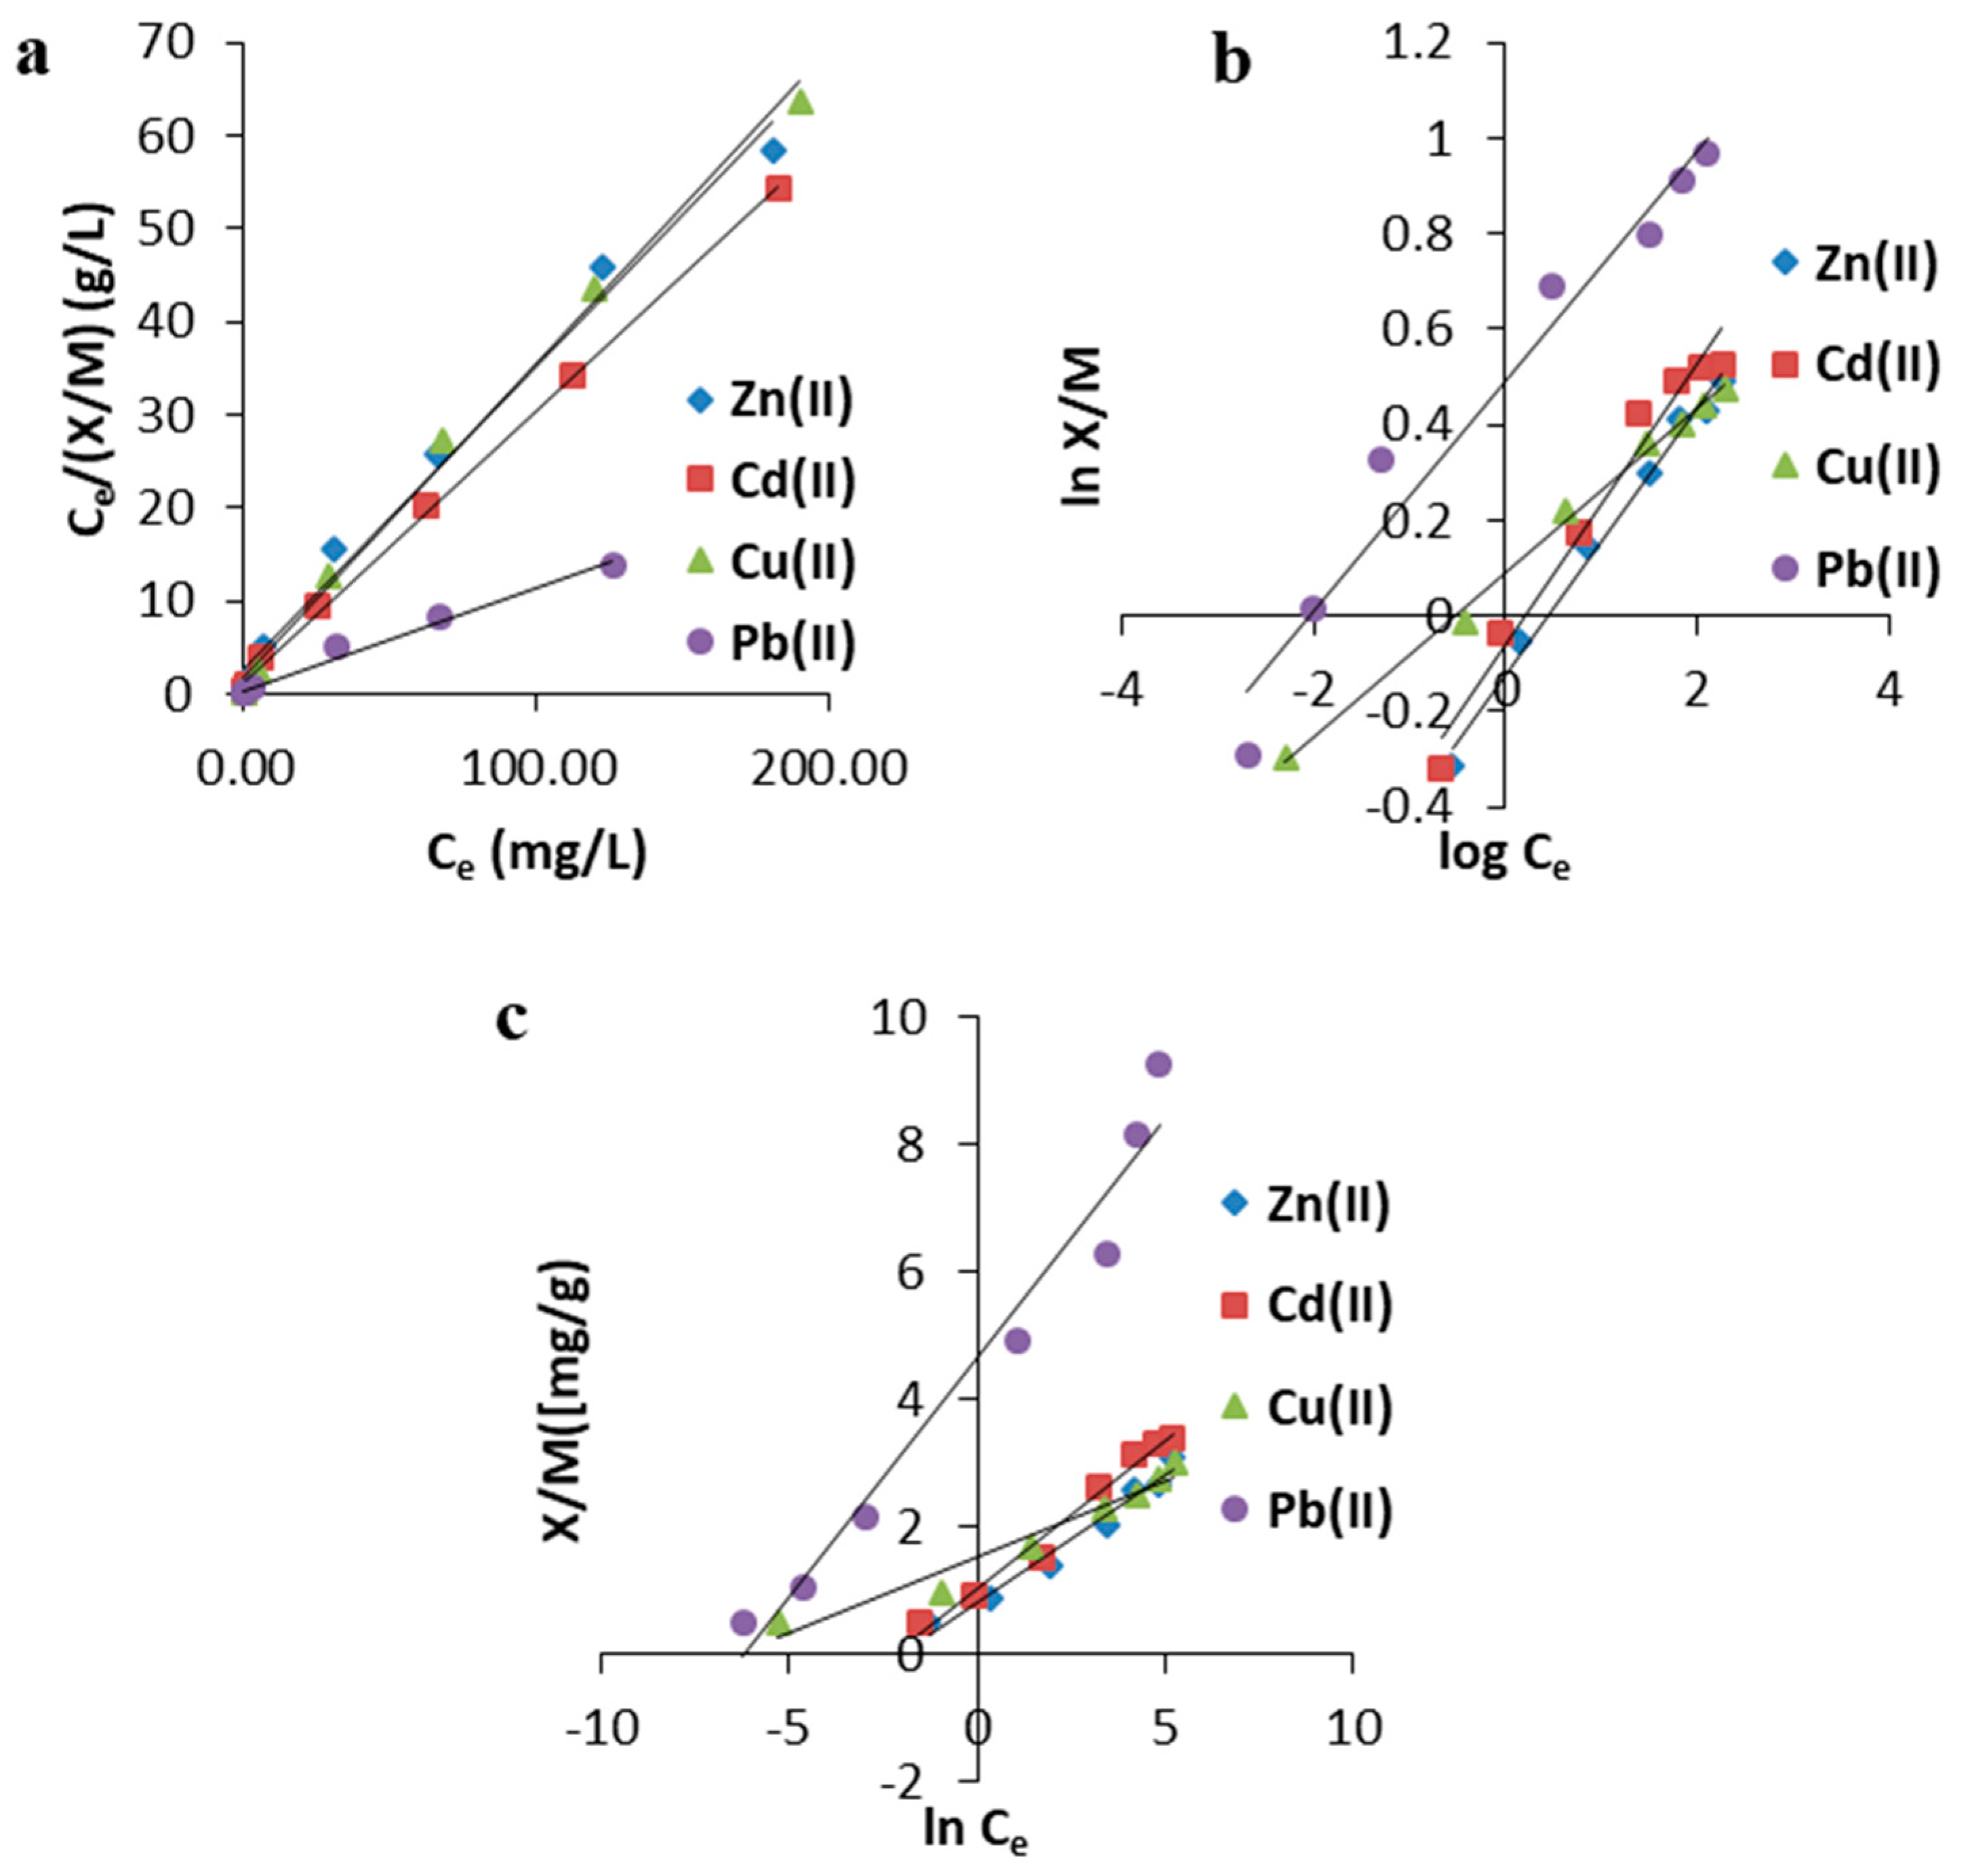
3.2.2. Effect of Initial Concentration
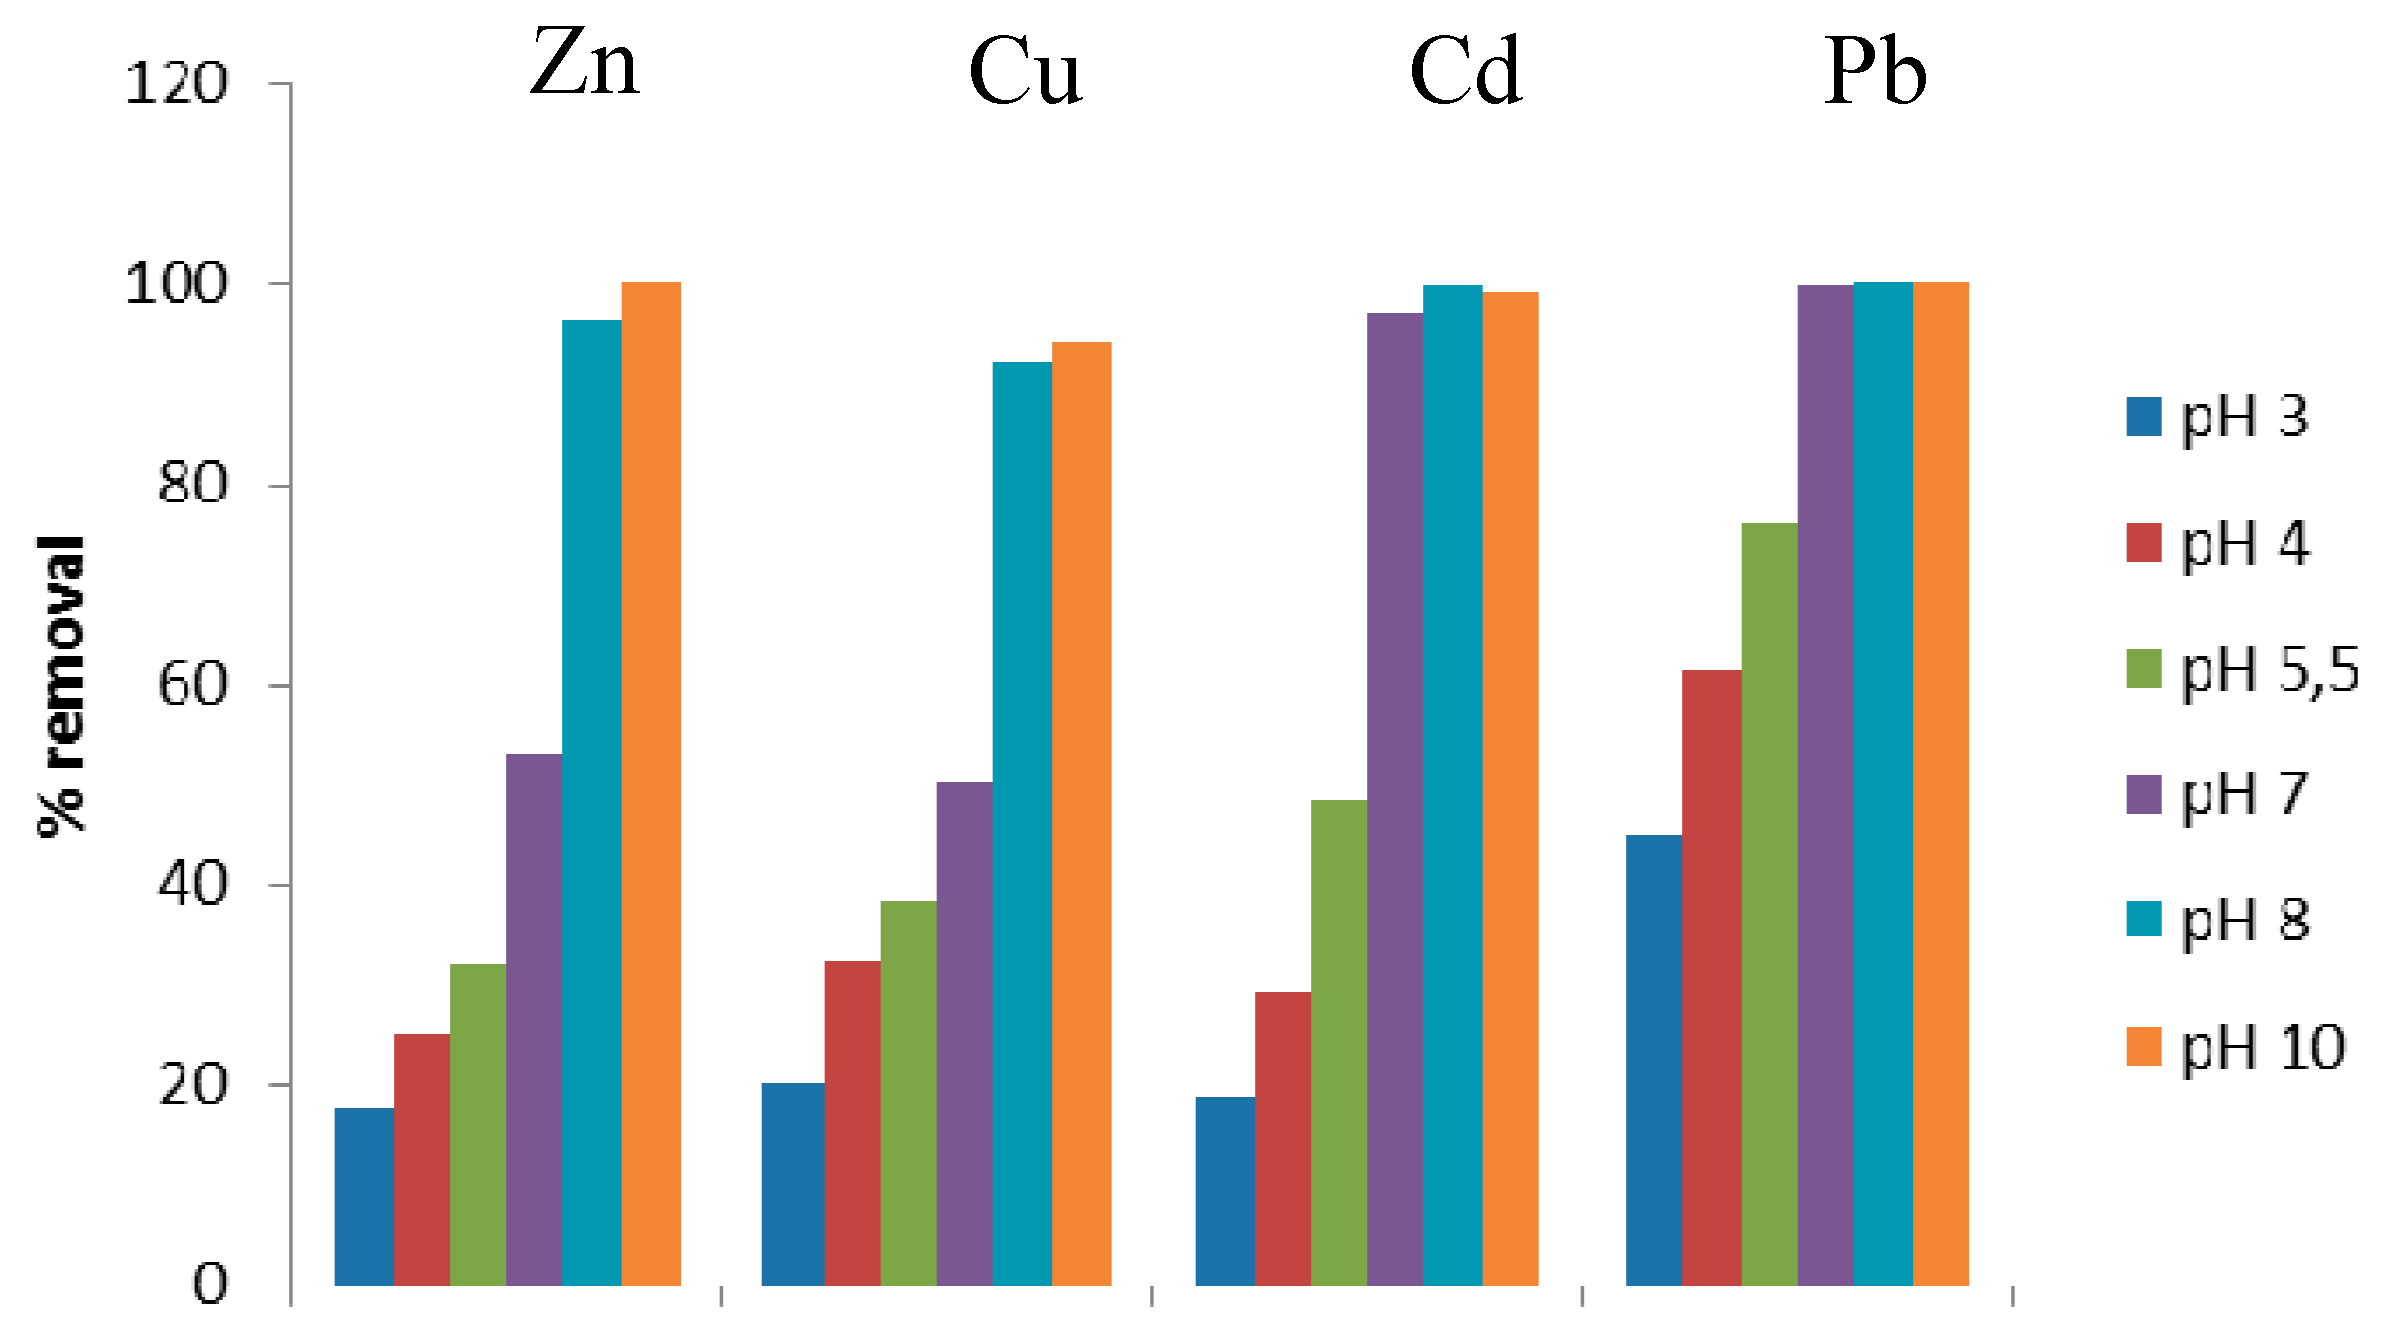
3.2.3. Effect of pH
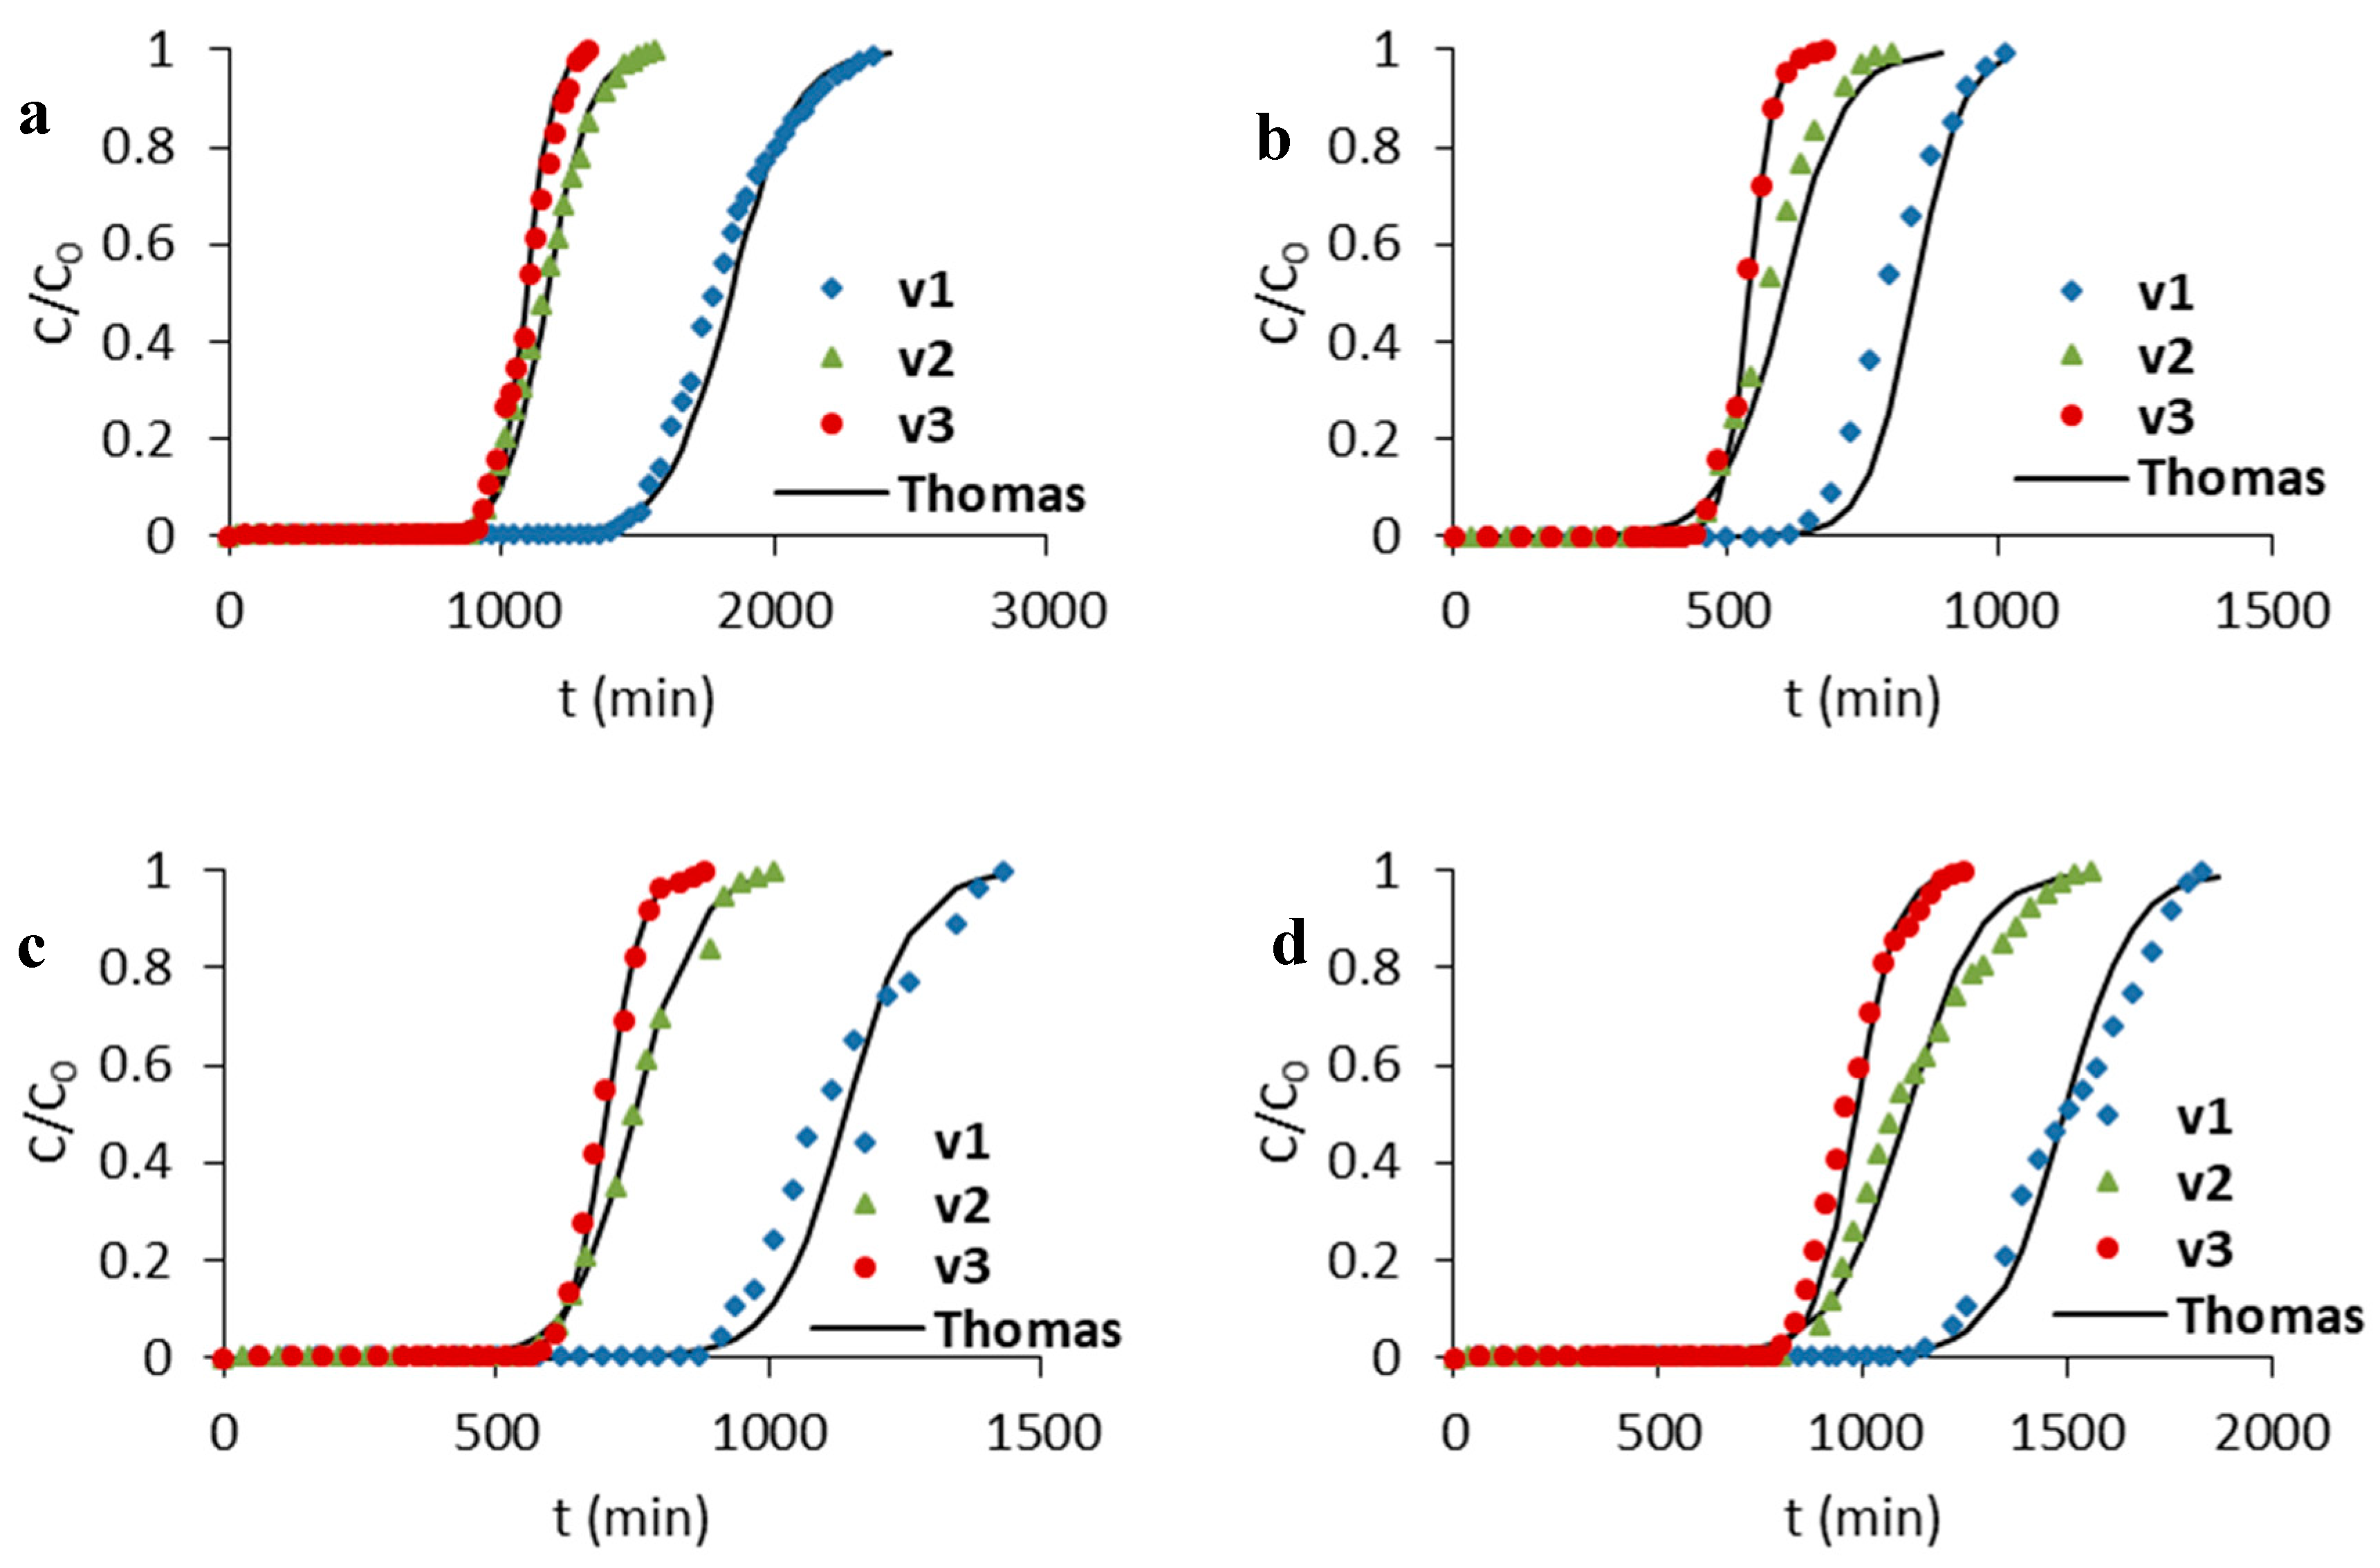
3.3. Column Studies
4. Conclusions
Author Contributions
Funding
Acknowledgments
Conflicts of Interest
References
- Bove, D.; Merello, S.; Frumento, D.; Al Arni, S.; Aliakbarian, B.; Converti, A. A critical review of biological processes and technologies for landfill leachate treatment. Chem. Eng. Technol. 2015, 38, 2115–2126. [Google Scholar] [CrossRef]
- Ayari, F.; Srasra, E.; Trabelsi-Ayadi, M. Retention of lead from an aqueous solution by use of bentonite as adsorbent for reducing leaching from industrial effluents. Desalination 2007, 206, 270–278. [Google Scholar] [CrossRef]
- Gupta, D.A. Implication of environmental flows in river basin management. Phys. Chem. Earth. 2008, 33, 298–303. [Google Scholar] [CrossRef]
- Kyzioł-Komosińska, J.; Rosik-Dulewska, C.; Franus, M.; Antoszczyszyn-Szpicka, P.; Czupioł, J.; Krzyżewska, I. Sorption Capacities of Natural and Synthetic Zeolites for Cu(II) Ions. Pol. J. Environ. Stud. 2015, 24, 1111–1123. [Google Scholar] [CrossRef]
- Demirbas, A. Heavy metal adsorption onto agro-based waste materials: A review. J. Hazard. Mater. 2008, 157, 220–229. [Google Scholar] [CrossRef] [PubMed]
- Oyaro, N.; Juddy, O.; Murago, E.N.M.; Gitonga, E. The contents of Pb, Cu, Zn and Cd in meat in Nairobi, Kenya. Int. J. Food Agric. Environ. 2007, 5, 119–121. [Google Scholar]
- Wang, S.; Terdkiatburana, T.; Tad’e, M.O. Adsorption of Cu(II), Pb(II) and humic acid on natural zeolite tuff in single and binary systems. Sep. Purif. Technol. 2008, 62, 64–70. [Google Scholar] [CrossRef]
- Paulino, A.T.; Minasse, F.A.S.; Guilherme, M.R.; Reis, A.V.; Muniz, E.C.; Nozaki, J. Novel adsorbent based on silkworm chrysalides for removal of heavy metals from wastewaters. J. Colloid Interface Sci. 2006, 301, 479–487. [Google Scholar] [CrossRef]
- Naseem, R.; Tahir, S.S. Removal of Pb(II) from aqueous solution by using bentonite as an adsorbent. Water Res. 2001, 35, 3982–3986. [Google Scholar] [CrossRef]
- Hamdaoui, O. Removal of copper(II) from aqueous phase by purolite C100-MB cation exchange resin in fixed bed columns: modeling. J. Hazard. Mater. 2009, 161, 737–746. [Google Scholar] [CrossRef]
- Akbal, F.; Camcı, S. Copper, chromium and nickel removal from metal plating wastewater by electrocoagulation. Desalination 2011, 269, 214–222. [Google Scholar] [CrossRef]
- Mirbagheri, S.A.; Hosseini, S.N. Pilot plant investigation on petrochemical wastewater treatment for the removal of copper and chromium with the objective of reuse. Desalination 2005, 171, 85–93. [Google Scholar] [CrossRef]
- Shammas, N.K. Coagulation and flocculation. In Physicochemical Treatment Processes, 3rd ed.; Wang, L.K., Hung, Y.-T., Shammas, N.K., Eds.; Humana Press: Clifton, NJ, USA, 2004; pp. 103–140. [Google Scholar]
- Wang, L.K.; Fahey, E.M.; Wu, Z.C. Dissolved air flotation. In Physicochemical Treatment Processes, 3rd ed.; Wang, L.K., Hung, Y.-T., Shammas, N.K., Eds.; Humana Press: Clifton, NJ, USA, 2004; pp. 431–500. [Google Scholar]
- Kurniawan, T.A.; Chan, G.Y.S.; Lo, W.; Babel, S. Physico-chemical treatment techniques for wastewater laden with heavy metals. Chem. Eng. J. 2006, 118, 83–98. [Google Scholar] [CrossRef]
- Rao, M.M.; Ramesh, A.; Rao, G.P.; Seshaiah, K. Removal of copper and cadmium from the aqueous solutions by activated carbon derived from Ceiba pentandra hulls. J. Hazard. Mater. 2006, 129, 123–129. [Google Scholar] [PubMed]
- Zheng, Y.A.; Huang, D.J.; Wang, A.Q. Chitosan-g-poly(acrylic acid) hydrogel with crosslinked polymeric networks for Ni2+ Recovery. Chim. Acta 2011, 687, 193–200. [Google Scholar] [CrossRef] [PubMed]
- Chen, Y.; Zhao, W.; Yang, X.; Li, Y. Efficient removal of heavy metal ions from aqueous solution by a novel poly (1-vinylimidazole) chelate resin. Polym. Bull. 2019, 76, 1081–1097. [Google Scholar] [CrossRef]
- Luo, H.; Law, W.W.; Wu, Y.; Zhu, W.; Yang, E.H. Hydrothermal synthesis of needle-like nanocrystalline zeolites from metakaolin and their applications for efficient removal of organic pollutants and heavy metals. Microporous Mesoporous Mater. 2019, 272, 8–15. [Google Scholar] [CrossRef]
- Li, Z.; Wu, L.; Sun, S.; Gao, J.; Zhang, H.; Zhang, Z.; Wang, Z. Disinfection and removal performance for Escherichia coli, toxic heavy metals and arsenic by wood vinegar-modified zeolite. Ecotoxicol. Environ. Saf. 2019, 174, 129–136. [Google Scholar] [CrossRef] [PubMed]
- Eeshwarasinghe, D.; Loganathan, P.; Vigneswaran, S. Simultaneous removal of polycyclic aromatic hydrocarbons and heavy metals from water using granular activated carbon. Chemosphere 2019, 223, 616–627. [Google Scholar] [CrossRef] [PubMed]
- Sis, H.; Uysal, T. Removal of heavy metal ions from aqueous medium using Kuluncak (Malatya) vermiculites and effect of precipitation on removal. Appl. Clay Sci. 2014, 95, 1–8. [Google Scholar] [CrossRef]
- Stefanova, I.G. Natural sorbents as barriers against migration of radionuclides from radioactive waste repositories. Nat. Mic. Mat. Environ. Tech. 1999, 362, 370–379. [Google Scholar]
- Hao, O.J.; Tsai, C.M. The removal of metals and ammonium by natural glauconite. Environ. Int. 1987, 13, 203–212. [Google Scholar] [CrossRef]
- Griffioen, J. Potassioum adsorption ratios as an indicator for the fate of agricultural potassium in groundwater. J. Hydrol. 2001, 254, 244–254. [Google Scholar] [CrossRef]
- Derkowski, A.; Środoń, J.; Franus, W.; Uhlik, P.; Banaś, M.; Zieliński, G.; Caplovicova, M.; Franus, M. Partial dissolution of glauconitic samples: implications for the methodology of K-Ar and Rb-Sr dating. Clays Clay Miner. 2009, 57, 531–554. [Google Scholar] [CrossRef]
- Franus, W.; Franus, M.; Latosińska, J.; Wójcik, R. The use of spent glauconite in lightweight aggregate production. Bol. Soc. Esp. Ceram V. 2011, 50, 193–200. [Google Scholar] [CrossRef]
- Gillman, G.P. A proposed method for measurement of exchange properties of highly weathered soils. Aust. J. Soil. Res. 1979, 17, 129–139. [Google Scholar] [CrossRef]
- Chu, K.H. Improved fixed bed models for metal biosorption. Chem. Eng. J. 2004, 97, 233–239. [Google Scholar] [CrossRef]
- Medvidović Vukojević, N.; Perić, J.; Trgo, M. Column performance in lead removal from aqueous solutions by fixed bed of natural zeolite—Clinoptilolite. Sep. Purif. Technol. 2006, 49, 237–244. [Google Scholar] [CrossRef]
- Tassist, A.; Lounici, H.; Abdi, N.; Mameri, N. Equilibrium, kinetic an thermodynamic studies on aluminum biosorption by a mycelial biomas (Streptomeces rimosus). J. Hazard. Mater. 2010, 183, 35–43. [Google Scholar] [CrossRef] [PubMed]
- Weber, W.J.; Morris, J.C. Equilibria and capacities for adsorption on carbon. J. Sanit. Eng. Div. 1964, 90, 79–108. [Google Scholar]
- Moura, C.P.; Vidal, C.B.; Barros, A.L.; Costa, L.S.; Vasconellos, L.C.G.; Dias, F.S.; Nascimento, R.F. Adsorption of BTX (benzene, toluene, o-xylene, and p-xylene) from aqueous solutions by modified periodic mesoporous organosilica. J. Colloid Interface Sci. 2011, 363, 626–634. [Google Scholar] [CrossRef] [PubMed]
- Chen, A.H.; Liu, S.C.; Chen, C.Y.; Chen, C.Y. Comparative adsorption of Cu(II), Zn(II), and Pb(II) ions in aqueous solution on the crosslinked chitosan with epichlorohydrin. J. Hazard. Mater. 2008, 154, 184–191. [Google Scholar] [CrossRef] [PubMed]
- Alshameri, A.; Yan, C.; Al-Ani, Y.; Dawood, A.S.; Ibrahim, A.; Zhou, C.; Wang, H. An investigation into the adsorption removal of ammonium by salt activated Chinese (Hulaodu) natural zeolite: Kinetics, isotherms, and thermodynamics. J. Taiwan Inst. Chem. Eng. 2014, 45, 554–564. [Google Scholar] [CrossRef]
- Mishra, P.C.; Patel, R.K. Removal of lead and zinc ions from water by low cost adsorbents. J. Hazard. Mater. 2009, 168, 319–325. [Google Scholar] [CrossRef] [PubMed]
- Langmuir, I. The constitution and fundamental properties of solids and liquids. J. Am. Chem. Soc. 1916, 38, 2221–2295. [Google Scholar] [CrossRef]
- Ho, Y.S.; Huang, C.T.; Huang, H.W. Equilibrium sorption isotherm for metal ions on tree fern. Process Biochem. 2002, 37, 1421–1430. [Google Scholar] [CrossRef]
- Deepthi, R.R.; Sasidhar, P. Sorption of Cesium on Clay Colloids: Kinetic and Thermodynamic Studies. Aquat. Chem. 2012, 18, 281–296. [Google Scholar] [CrossRef]
- Tempkin, M.; Pyzhev, V. Kinetics of ammonia synthesis on promoted iron catalysts. Acta Physico-Chimica Sin USSR 1940, 12, 327–356. [Google Scholar]
- Davis, J.A.; Hayes, K.F. Geochemical processes at mineral surfaces: An overview. In American Chemical Society Symposium Series 323; American Chemical Society: Washington, DC, USA, 1986; pp. 2–18. [Google Scholar]
- Smith, E.; Lu, W.; Vengris, T.; Binkiene, R. Sorption of heavy metals by Lithuanian glauconite. Water Res. 1996, 30, 2883–2892. [Google Scholar] [CrossRef]
- Volesky, B. Biosorption process simulation tools. Hydrometallurgy 2003, 71, 179–190. [Google Scholar] [CrossRef]
- Inglezakis, V.J.; Grigoropoulou, H. Effects of operating conditions on the removal of heavy metals by zeolite in fixed bed reactors. J. Hazard. Mater. 2004, B112, 37–43. [Google Scholar] [CrossRef] [PubMed]
- Husein, D.Z.; Al-Radadi, T.; Danish, E.Y. Adsorption of phosphate using alginate-/zirconium-grafted newspaper pellets: fixed-bed column study and application. J. Sci. Eng. 2017, 42, 1399–1412. [Google Scholar] [CrossRef]
- Aguayo-Villarreal, I.A.; Bonilla-Petriciolet, A.; Hernández-Montoya, V.; Montes–Morán, M.A.; Reynel-Avila, H.E. Batch and column studies of Zn2+ removal from aqueous solution using chicken feathers as sorbents. Chem. Eng. J. 2011, 167, 67–76. [Google Scholar] [CrossRef]
- Ramirez, A.; Giraldo, S.; Garcia-Nunez, J.; Florez, E.; Acelas, N. Phosphate removal from water using a hybrid material in a fixed-bed column. J. Water Process Eng. 2018, 26, 131–137. [Google Scholar] [CrossRef]


| Parameter | Value |
|---|---|
| SBET (m2/g) | 78.44 |
| Vmic (cm3/g) | 0.005 |
| Smes (m2/g) | 67.21 |
| Vmes (cm3/g) | 0.086 |
| CEC (meq/100 g) | 17 |
| Bulk density (g/cm3) | 1.38 |
| Point of zero charge, pHpzc | 6.48 |
| Time (min) | Zn | Cd | Cu | Pb | ||||
|---|---|---|---|---|---|---|---|---|
| qt (mg/g) | E (%) | qt (mg/g) | E (%) | qt (mg/g) | E (%) | qt (mg/g) | E (%) | |
| 5 | 1.174 | 22.91 | 1.422 | 27.87 | 1.363 | 27.04 | 1.968 | 40.78 |
| 10 | 1.478 | 28.82 | 1.855 | 36.24 | 1.567 | 31.03 | 2.497 | 51.33 |
| 20 | 1.573 | 30.66 | 2.001 | 39.20 | 1.748 | 34.65 | 2.694 | 55.39 |
| 40 | 1.795 | 34.96 | 2.254 | 44.14 | 1.935 | 38.38 | 3.222 | 66.13 |
| 80 | 1.906 | 37.17 | 2.428 | 47.48 | 2.104 | 41.69 | 3.553 | 73.07 |
| 180 | 1.980 | 38.60 | 2.523 | 49.40 | 2.218 | 43.98 | 3.753 | 77.07 |
| 360 | 1.975 | 38.53 | 2.596 | 50.76 | 2.291 | 45.40 | 3.875 | 79.64 |
| 720 | 2.018 | 39.34 | 2.602 | 50.94 | 2.301 | 45.20 | 3.895 | 79.96 |
| 1440 | 2.040 | 39.77 | 2.602 | 50.92 | 2.266 | 44.91 | 3.885 | 79.85 |
| 2880 | 2.027 | 39.50 | 2.625 | 51.37 | 2.237 | 44.32 | 3.916 | 80.41 |
| Parameter | Zn | Cd | Cu | Pb | |
|---|---|---|---|---|---|
| C0 | 51.3 | 51.1 | 50.4 | 48.7 | |
| qe | 2.04 | 2.62 | 2.30 | 3.92 | |
| PFO | qc (mg/g) | 0.37 | 0.36 | 0.71 | 0.62 |
| k1 (min−1) | 0.004 | 0.003 | 0.012 | 0.003 | |
| R2 | 0.753 | 0.619 | 0.985 | 0.626 | |
| PSO | qc (mg/g) | 2.03 | 2.63 | 2.25 | 3.92 |
| k2 (g/mg·min) | 0.100 | 0.061 | 2.251 | 0.035 | |
| R2 | 1.000 | 1.000 | 0.999 | 1.000 | |
| IPD | Kida | 0.0031 | 0.0024 | 0.0034 | 0.0022 |
| Da (mg/g) | 0.033 | 0.023 | 0.038 | 0.016 | |
| R2 | 0.887 | 0.878 | 0.949 | 0.943 | |
| Kidb | 5.18 × 10⁻⁵ | 3.30 × 10⁻⁵ | 6.25 × 10⁻⁵ | 2.93 × 10⁻⁵ | |
| Db (mg/g) | 0.060 | 0.045 | 0.069 | 0.036 | |
| R2 | 0.875 | 0.594 | 0.905 | 0.578 | |
| Isotherm Model | Parameter | Zn | Cd | Cu | Pb |
|---|---|---|---|---|---|
| Langmuir | aL (mg/g) | 3.072 | 3.438 | 2.960 | 9.099 |
| KL (L/mg) | 0.117 | 0.206 | 0.210 | 0.310 | |
| R2 | 0.988 | 0.999 | 0.994 | 0.986 | |
| Freundlich | KF (mg/g(L/mg)1/n) | 0.758 | 0.870 | 1.231 | 3.103 |
| 1/n | 3.596 | 3.420 | 5.831 | 4.137 | |
| R2 | 0.989 | 0.973 | 0.996 | 0.963 | |
| Temkin | b (kJ/mol) | 6.237 | 5.309 | 10.353 | 3.277 |
| KT (L/g) | 7.835 | 9.146 | 560.442 | 463.249 | |
| R2 | 0.973 | 0.978 | 0.952 | 0.963 |
| Parameter | Zn | Cd | Cu | Pb |
|---|---|---|---|---|
| C0 (mg/L) | 52 | 46 | 51 | 49 |
| tD(min) | 1045 | 1083 | 788 | 3403 |
| tC (min) | 1565 | 2330 | 1465 | 3790 |
| VD (mL) | 1130 | 1520 | 890 | 2770 |
| VC (mL) | 1650 | 2190 | 1520 | 3510 |
| AD (mg/g) | 4.680 | 5.252 | 3.357 | 11.310 |
| AC (mg/g) | 5.359 | 6.999 | 4.741 | 12.527 |
| kTh (L/mg·min) | 0.000210 | 0.000373 | 0.000386 | 0.000309 |
| Q0 (mg/g) | 5.211 | 7.854 | 5.099 | 13.755 |
| R2 | 0.909 | 0.960 | 0.981 | 0.954 |
| Parameter | Zn | Cd | Cu | Pb | ||||||||
|---|---|---|---|---|---|---|---|---|---|---|---|---|
| C0 (mg/L) | 6.98 | 11.05 | 6.63 | 20.18 | ||||||||
| v1 | v2 | v3 | v1 | v2 | v3 | v1 | v2 | v3 | v1 | v2 | v3 | |
| tD (min) | 1690 | 1070 | 1035 | 673 | 447 | 450 | 895 | 570 | 590 | 1120 | 820 | 790 |
| tC (min) | 2426 | 1560 | 1315 | 1067 | 890 | 680 | 1428 | 1010 | 882 | 1870 | 1558 | 1248 |
| VD (BV) (cm3) | 1900 | 1650 | 2080 | 725 | 760 | 880 | 1040 | 1005 | 1200 | 1390 | 1450 | 1660 |
| VC (BV) (cm3) | 2850 | 2470 | 2710 | 1310 | 1570 | 1410 | 895 | 570 | 590 | 1120 | 820 | 790 |
| Ad, (mg/g) | 0.8 | 08 | 088 | 1.46 | 1.4 | 1.57 | 1.12 | 1.06 | 1.28 | 4.406 | 4.608 | 5.314 |
| AC (mg/g) | 1.21 | 1.20 | 1.30 | 1.49 | 1.44 | 1.58 | 1.63 | 1.73 | 1.74 | 6.27 | 6.52 | 6.94 |
| kTh (L/mg min·10−3) | 1.212 | 1.821 | 2.960 | 2.120 | 1.60 | 4.130 | 2.419 | 2.648 | 4.782 | 0.596 | 0.548 | 0.995 |
| Q0 (mg/g) | 1.446 | 1.210 | 1.415 | 1.049 | 0.992 | 1.110 | 0.849 | 0.740 | 0.864 | 3.384 | 3.309 | 3.682 |
| R2 | 0.955 | 0.964 | 0.950 | 0.966 | 0.627 | 0.969 | 0.772 | 0.983 | 0.980 | 0.907 | 0.899 | 0.928 |
© 2019 by the authors. Licensee MDPI, Basel, Switzerland. This article is an open access article distributed under the terms and conditions of the Creative Commons Attribution (CC BY) license (http://creativecommons.org/licenses/by/4.0/).
Share and Cite
Franus, M.; Bandura, L.; Madej, J. Mono and Poly-Cationic Adsorption of Heavy Metals Using Natural Glauconite. Minerals 2019, 9, 470. https://doi.org/10.3390/min9080470
Franus M, Bandura L, Madej J. Mono and Poly-Cationic Adsorption of Heavy Metals Using Natural Glauconite. Minerals. 2019; 9(8):470. https://doi.org/10.3390/min9080470
Chicago/Turabian StyleFranus, Małgorzata, Lidia Bandura, and Jarosław Madej. 2019. "Mono and Poly-Cationic Adsorption of Heavy Metals Using Natural Glauconite" Minerals 9, no. 8: 470. https://doi.org/10.3390/min9080470
APA StyleFranus, M., Bandura, L., & Madej, J. (2019). Mono and Poly-Cationic Adsorption of Heavy Metals Using Natural Glauconite. Minerals, 9(8), 470. https://doi.org/10.3390/min9080470