Article

The Chemical Composition and Surface Texture of Transparent Heavy Minerals from Core LQ24 in the Changjiang Delta

1
School of Geography, Geomatics and Planning, Jiangsu Normal University, Xuzhou 221116, China
2
State Key Laboratory of Marine Geology, Tongji University, Shanghai 200092, China
3
Shandong Key Laboratory of Eco-environmental Science for Yellow River Delta, Binzhou University, Binzhou 256603, China
4
School of Resources and Environmental Engineering, Ludong University, Yantai 264025, China
*
Author to whom correspondence should be addressed.
Minerals 2019, 9(7), 454; https://doi.org/10.3390/min9070454
Submission received: 12 May 2019 / Revised: 18 July 2019 / Accepted: 19 July 2019 / Published: 22 July 2019
(This article belongs to the Special Issue Heavy Minerals: Methods & Case Histories)

Abstract

:
The assessment of textural and compositional modifications of detrital sediments is required to reconstruct past source to sink dynamics. The Changjiang Delta is an ideal location to study the sedimentary environment from the Pliocene to Quaternary transition. In the present study, we aim to decipher the response of heavy minerals to mechanical wear and chemical weathering since the Pliocene. With the application of a scanning electron microscope and an electron probe, the geochemistry and surface texture of different heavy minerals (amphibole, epidote, and tourmaline groups) with grain-size fractions of 32–63 µm and 63–125 µm were studied. The result shows that the surface texture of unstable minerals (amphibole, epidote) changed under strong chemical weathering in the Pliocene sediments. By contrast, unstable minerals of the Pleistocene sediments are relatively fresh and similar to those of the modern Changjiang sediment. The stable mineral tourmaline does not exhibit morphology changes in different chemical weathering conditions. No effect of grain size on geochemical composition is noticed. The single minerals of very fine sand and coarse silt show similar geochemical and morphological features. The integration of mineralogy, geochemical data, and grain size parameters yield a more precise understanding of the physical and chemical response of heavy minerals to different weathering conditions. The outcome of the study is also helpful in deciphering sediment provenance changes and environmental changes in the Changjiang basin.

1. Introduction

The study of source to sink dynamics of large river systems such as Changjiang are vital to understand the hydrological, geomorphological, ecological, and anthropogenic modifications in the ever-changing climatic conditions [1,2,3]. The pre-dam (Three Gorges Dam) sediment yield of the Changjiang River was >300 × 106 tons per year, whereas, at present, it is ~120 × 106 tons [4]. The reconstruction of the source and distribution patterns of the delta sediments can help to unravel the history of erosion processes, source area characteristics, and the factors controlling and determining the production (source), transport, dispersal and accumulation (sink), and reworking (number of burial-erosion cycles during sediment transport) at different temporal and spatial scales [5,6,7].
The identification and quantification of heavy minerals is one of the most sensitive approaches to classify the various provenance terrains and depositional environment conditions [8,9]. However, heavy mineral assemblages are affected by hydraulic sorting during transportation, chemical weathering during deposition, and dissolution during diagenesis [10,11,12,13]. Moreover, physical and chemical etching and corrosion processes intensify with burial depth due to intrastratal dissolution, resulting in the depletion of unstable minerals (like amphibole and epidote) and the enrichment of stable minerals (ZTR) in core sediments [8,14]. To overcome this bias, several provenance-sensitive heavy mineral ratios (e.g., the garnet-zircon (GZi), ZTR, and stability indexes) are widely used [11,15]. Moreover, in situ geochemical analysis of heavy minerals is also widely applied in geoscience and adds a considerable complexity of interpretation [16,17,18]. Chemical analysis on single-grain minerals (e.g., zircon, tourmaline, apatite, rutile, monazite, amphibole, and garnet) has promoted the study of sediment source to sink [19,20,21]. However, there are only a few studies that deal with the relationship between the physical and chemical parameters of single heavy minerals and address these significant research lacunae: (i) How do different minerals respond to different sedimentary environments in the deltaic area? (ii) Do the physical and chemical properties of stable and unstable heavy minerals change depending on depth?
Thicknesses of 150–400 m sediments have been deposited in the Changjiang Delta since the Pliocene [22]. This area is a natural laboratory that can be used to carry out studies on sediment provenance, tectonic evolution, sedimentary environment, and river evolution [23,24,25]. With the application of clay minerals, geochemistry, and heavy mineral analyses, researchers have documented different sedimentary environments during the Pliocene to Pleistocene transition [26,27]. Heavy mineral analysis evinces the presence of high contents of zircon and extremely low contents of amphibole (5%) in Pliocene sediments of the Changjiang Delta, which is related to strong chemical weathering or diagenesis during this time (Figure 1). In contrast, high proportions of unstable mineral (amphibole 40%) in the Pleistocene strata indicate relatively weak chemical weathering or minor diagenetic effects [3,27]. The high heavy mineral concentration (HMC) values in some of the Pleistocene samples define a placer trend, probably due to hydraulic sorting [13,20]. The different chemical weathering and sedimentary conditions at the Pliocene to Quaternary transition make the Changjiang Delta an ideal location to document the physical and geochemical response of single minerals to different sedimentary environments [23,27].
In this study, unstable (amphibole, epidote) and stable (tourmaline) heavy mineral in grain size fractions of 32–63 µm and 63–125 µm were analyzed by using a scanning electron microscope (SEM) and an electron probe (EP). Through the assessment of the surface texture and chemical composition of different transparent heavy minerals, we aim to study the physical and chemical response of different single minerals and discuss their influence on provenance discrimination.

2. Materials and Methods

One continuous Late Cenozoic borehole (LQ24, 400 m in length) was extracted from Chongming Island in the Changjiang Delta. The bottom (400–337.2 m) of LQ24 is constrained to the Pliocene according to the paleomagnetic analysis results, which disclosed that the boundary of Gauss/Matuyama (G/M) is located at a core depth of 337.2 m (Figure 2). The Pliocene strata above the bedrocks consisted of stiff clay. There were many calcareous and iron-manganese nodules (Figure 2). Moreover, a block of grey calcareous sand was found in the bottom strata (Figure 2). No microfossils were found in the Pliocene sediments. In addition, poorly sorted gravels can be found, which indicate the origin of sedimentary facies as an alluvial fan or a meandering river [22]. The Quaternary strata comprised several sedimentary sequences, which were composed of sand at the bottom and clayey silt at the top, suggesting a fluvial environment (Figure 2). In some mid–late Quaternary sediments, foraminifera and shell debris were easily found, implying marine transgression since then [3,23,27]. In-depth detailed stratigraphic information, including magnetostratigraphy, grain size, sedimentary facies, magnetic susceptibility, and foraminifera have been documented by [3]. In the present study, two Pliocene sediment samples (core depth of 378 m and 355 m), and three Pleistocene samples (core depth of 320, 259, and 178 m) were selected (Figure 2).
In order to make a comparison with the Changjiang Delta sediment, one modern sediment sample was collected from its estuary levee (Figure 3).
For each sample (1 kg each), the very fine sand (63–125 µm) and coarse silt (32–63 µm) fractions were separated and selected for single mineral analyses. These size fractions were wet-sieved through 125, 63, and 32 µm nylon meshes, respectively. After drying in the oven with a temperature of <40 °C, the very fine sand and coarse silt fractions were then put into a sodium polytungstate solution (2.90 kg/dm3 at 20 °C; e.g., [5,21,28]) and heavy minerals were separated from the light fraction by the gravity separation method (e.g., [14,29]). The content of the heavy minerals (HMC) is calculated as the total mass of the heavy mineral fraction contained in the analyzed fraction [30].
After heavy liquid separation, >100 mineral grains (amphibole, epidote, and tourmaline) were handpicked randomly under a stereoscopic microscope. Further, all the handpicked minerals were observed and checked under a polarizing microscope. All of the amphibole grains of the Pliocene samples were selected due to their low concentrations. At least 30 single mineral grains were measured randomly by SEM analysis. After SEM analysis, single mineral grains were then embedded in epoxy, polished, and coated with carbon to carry out electron probe analysis. A uniform flat surface of each grain was selected as a test spot. Single mineral grains were photographed by a scanning electron microscope (XL-30 ESEM, Philips Company, Eindhoven, The Netherlands), and the mineral chemical composition was measured by an electron probe microanalysis (JXA-8230 electron probe system, JEOL, Kyoto, Japan) at the State Key Laboratory of Marine Geology, Tongji University. The measurement conditions were a 15 kV accelerating voltage, a 10 nA probe current, and a 5 μm beam diameter. The analysis time of each element was 30 s for Si, Mg, Al, Fe, Ca, and Mn; 10 s for Na; 12 s for K; and 60 s for Ti. Natural and synthetic mineral standards (SPI) were used to calibrate all quantitative analyses, and a ZAF correction was used for data reduction.

3. Results

3.1. Geochemical Characteristics of Different Single Minerals in Core LQ24

3.1.1. Geochemical Characteristics of Unstable Minerals in Core LQ24

No change in the composition content (TFeO, CaO, MgO, Al2O3, K2O, TiO2, MnO, Cr2O3, and V2O3) of the amphibole derived from very fine sand and the coarse silt fractions was noticed (Figure 4). The detailed EPMA results of this study are presented in Table 1.
Further classification of the amphiboles was made in Figure 5. Results show that members of the amphibole group in all of the Changjiang sediment samples belong to the calcic–amphibole group [31], in which ten different kinds of hornblendes were included. These hornblendes were dominated by magnesio-hornblende, followed by actinolite, tschermakite, and edenite (Figure 5). Other amphibole species, including ferrotschermakite, ferroedenite, magnesio hastingsite, and ferropargasite, were low in content. Moreover, amphibole compositions in very fine sand and coarse silt fractions were very similar (Figure 5).
Similar to the characteristics of the amphibole in Core LQ24, the epidote geochemistry of the Pliocene is almost the same with the Pleistocene and modern Changjiang samples (Figure 6). No difference in the composition (main element content) of the epidote between 63–125 µm and 32–63 µm size fractions was found.

3.1.2. Geochemical Characteristics of Stable Mineral in Core LQ24

The element composition (Al2O3, TFeO, MgO, Na2O, CaO, K2O, TiO2, MnO, Cr2O3, and V2O3) of stable tourmaline is shown in Figure 7. Similar to the geochemical characteristics of amphibole and epidote in Core LQ24, the element characteristics of tourmaline are also the same at different core depths and the same as the modern Changjiang river samples (Figure 7).

3.2. Surface Texture of Different Transparent Heavy Minerals in Core Sediment of the Changjiang Delta

The surface texture characteristic of unstable heavy minerals are different for the Pliocene and Pleistocene sediment samples (Figure 8). The corroded unstable mineral grains were abundant in the Pliocene sediment compared to the Pleistocene samples. The corroded amphibole accounted for about 30% in the Pliocene sediment and 15% in the Pleistocene samples. On the other hand, corroded epidote grains accounted for about 50% in Pliocene sediments, which was approximately twice that of the Pleistocene samples. In contrast to the unstable minerals, the surface texture of the stable minerals did not exhibit an obvious change in the depth of the core. The corroded tourmaline grains were about 10% on average, which was less than that of unstable minerals. For the same single mineral, the surface texture characteristic of the very fine sand was similar to that of the coarse silt (Figure 8).

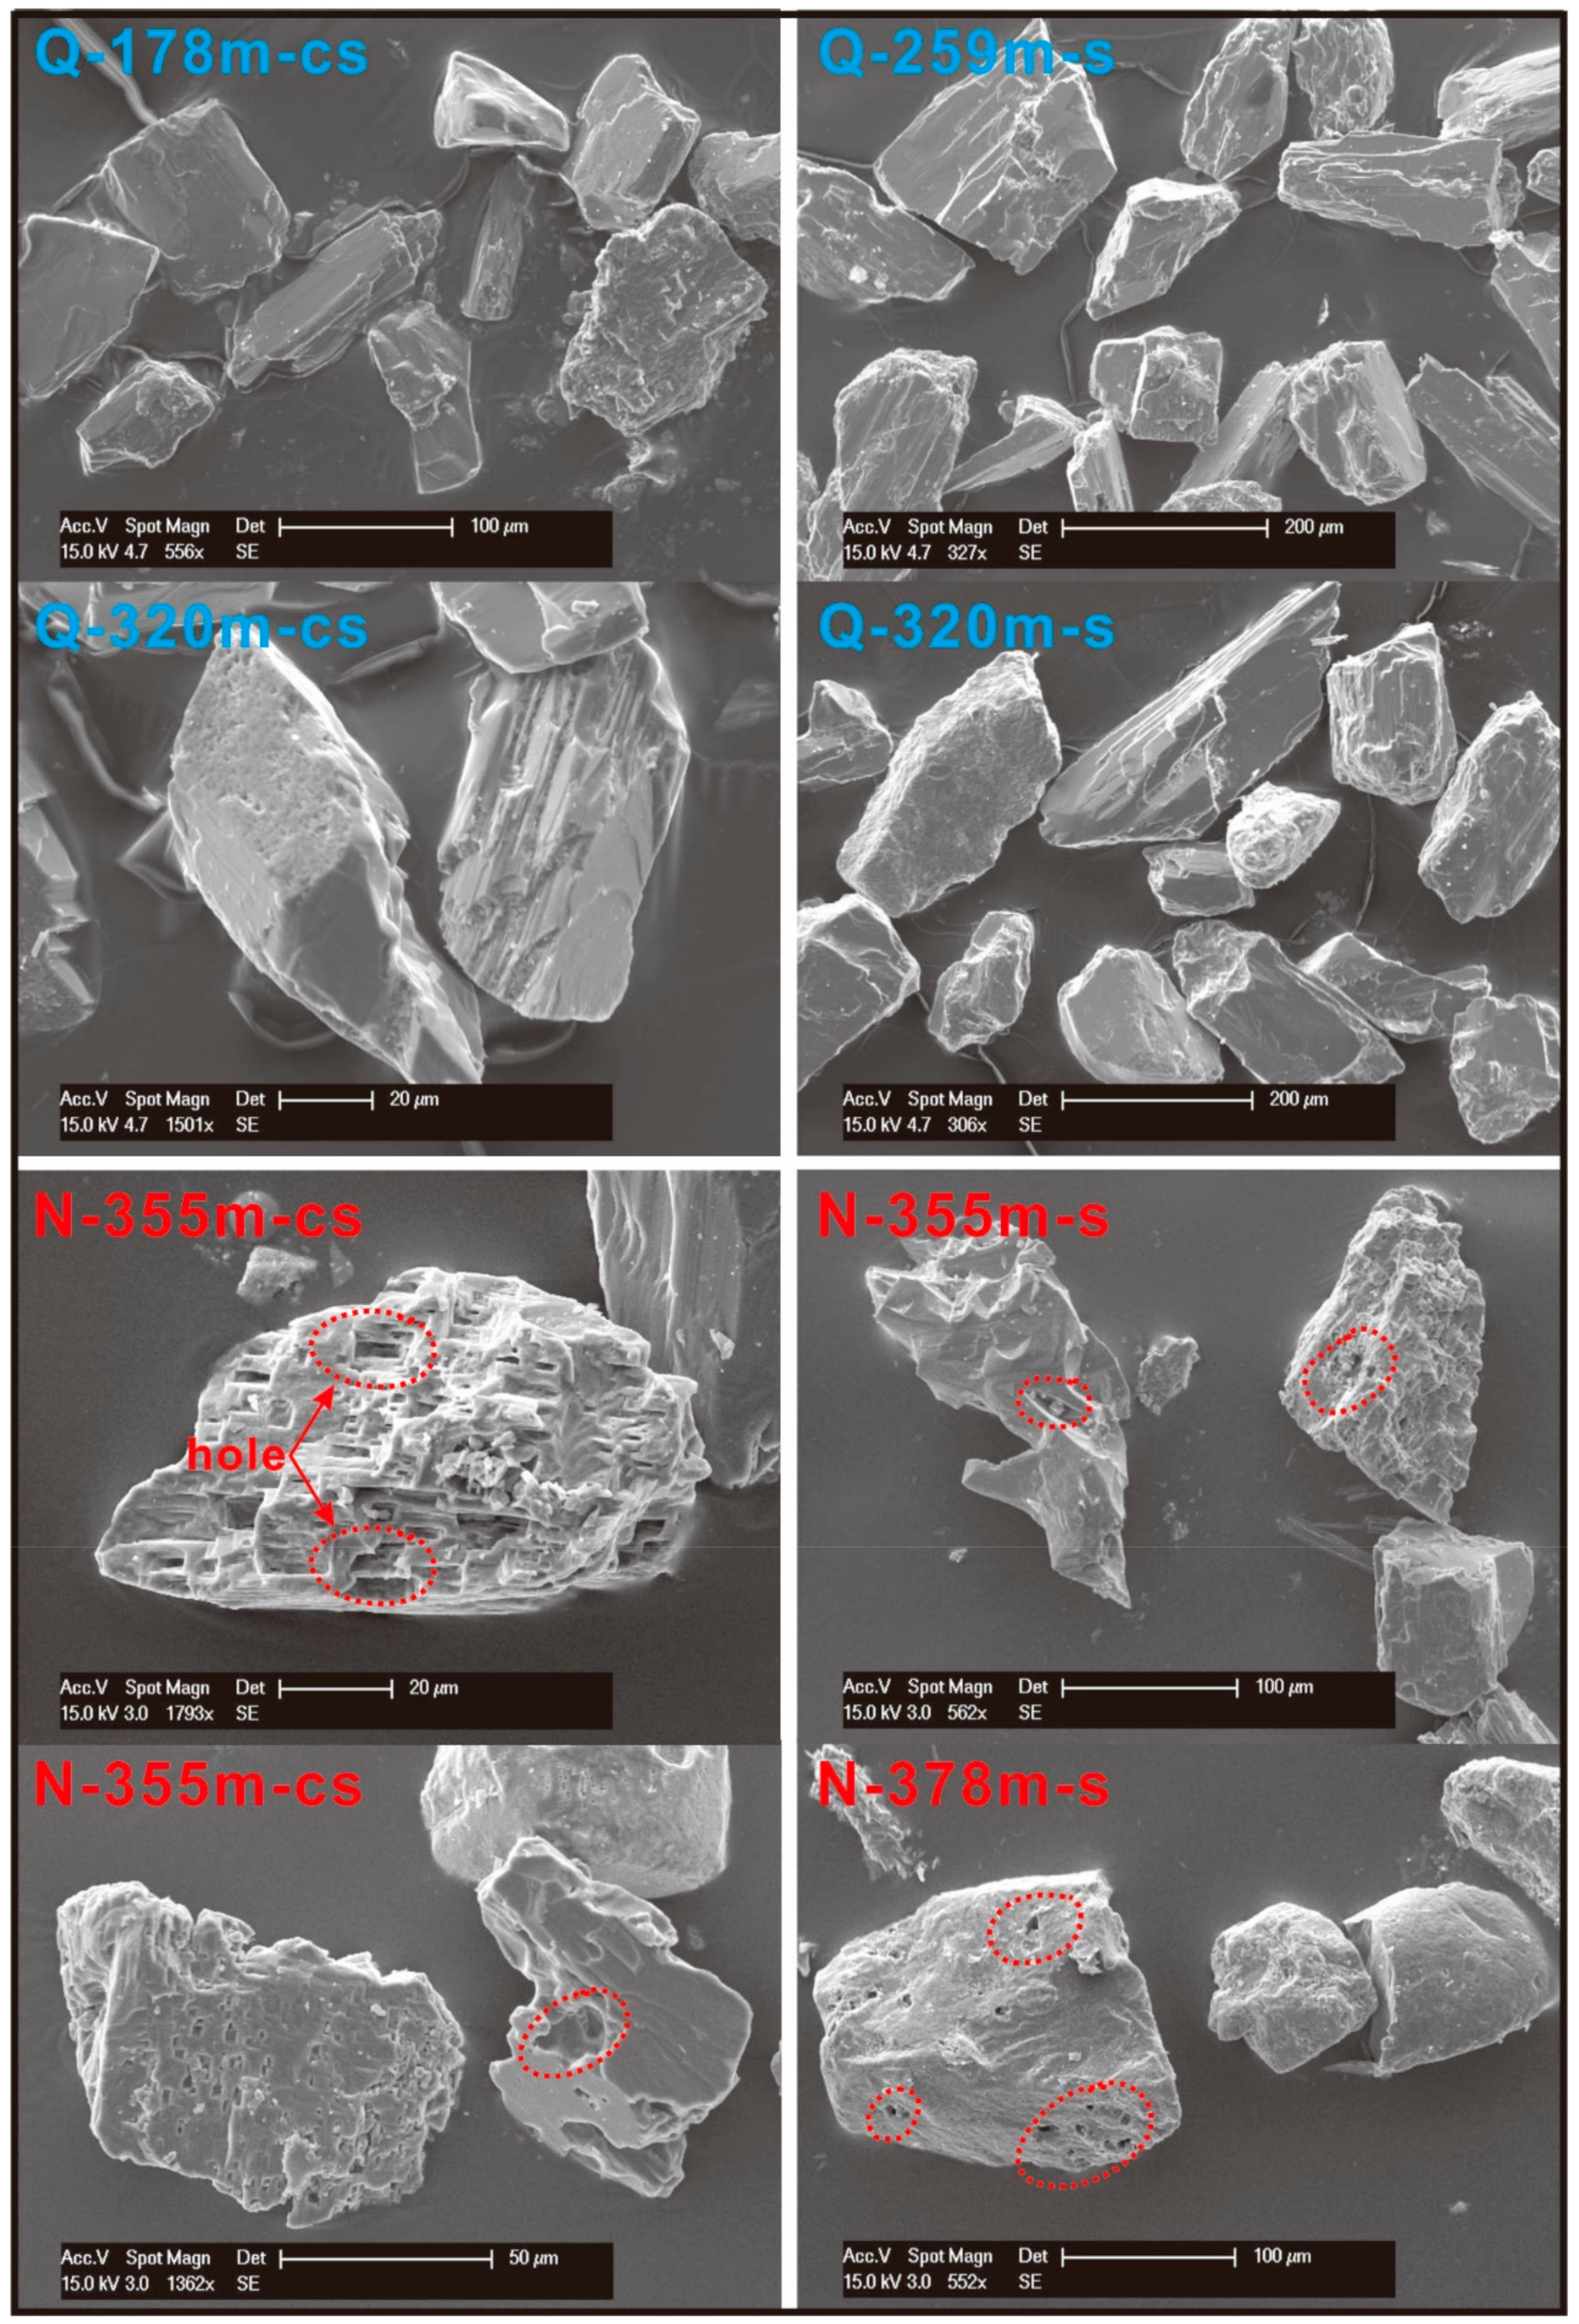
3.2.1. Crystal Morphology of Unstable Heavy Minerals in Core LQ24

SEM results showed that the surface texture of the unstable heavy minerals was different in the Pliocene and Pleistocene samples. For the Pliocene sediment of Core LQ24, both the amphibole and epidote displayed evidence of chemical etching (Figure 9 and Figure 10). Etch pits on the crystal surfaces of these single mineral grains were visible. The crystal corrosion along the cleavage plane and fuzzy edges were readily visible. Microscope observation found that the transparency of some mineral grains was significantly reduced. Due to strong dissolution, some amphibole grains were found to be deeply etched (Figure 9).
Unlike the sample of the Pliocene strata, the surface texture of the unstable heavy minerals in the Pleistocene sample displayed different characteristics. Amphibole and epidote grains generally had an irregular-angular shape, and their crystal surfaces were relatively fresh (Figure 9 and Figure 10). Two systems of cleavage were obvious at a specific angle. Only a few particles had a fuzzy crystal surface and plane due to dissolution and abrasion (Figure 9 and Figure 10). The crystal morphology of the different grain size displayed little surface texture difference between the very fine sand and coarse silt.

3.2.2. Surface Texture of Stable Heavy Mineral

The SEM images of the stable heavy mineral of tourmaline showed that crystal particles in the Pliocene and Pleistocene sediments had short prismatic or granular morphologies, and were mostly sub-angular or sub-rounded in shape (Figure 11). The edges of the tourmaline crystal were clear with generally flat crystal surfaces. Etch pits were noticed in a few particles (Figure 11). Similar crystal morphologies were observed in the Pleistocene and Pliocene samples of tourmaline. The tourmaline grain size in the very fine sand and coarse silt has a similar surface texture. In general, the unstable heavy minerals of the Pliocene samples show signs of weathering, while these minerals in the Quaternary strata are relatively fresh. A slight alteration or dissolution was found in the crystal morphology of the stable mineral from the Changjiang Delta, and no variations were seen in the Pliocene and Pleistocene samples.

4. Discussion

4.1. The Factors Which may Cause Variations in Surface Texture of Different Single Minerals

The corrosion signature of heavy minerals indicates different transportation, sedimentation, and burial conditions [32,33,34]. The SEM images of Core LQ24 revealed that the amphibole and epidote in the Pliocene strata were more corroded than the tourmaline mineral present in both the Pliocene and Pleistocene sediments (Figure 9, Figure 10 and Figure 11). In our interpretation, weathering is the main factor influencing the dissolution of unstable minerals in the analyzed sediment samples. In the warm-humid climate, chemical weathering proceeds at a faster rate and can result in the progressive corrosion and depletion of unstable minerals [35,36]. Previous studies have documented a drastic environment change in the Changjiang Delta during the Pliocene to Pleistocene transition [23,27]. Then, warm and wet climate conditions were prevalent in East China, along with a low deposition rate in the Changjiang Delta [24,37,38]. Before deposition, weathering may have been responsible for the surface texture variation in amphibole, epidote, and tourmaline. In such strong weathering conditions, unstable minerals are progressively corroded and finally depleted.
The abundance of apatite is a reliable indicator of surface weathering. This mineral is susceptible to dissolution during weathering but remains stable in deep burial [8,13,15]. In order to reflect the weathering intensity, we used the ATi (Apatite-Tourmaline index), whose value is calculated as (100 × Apatite%)/(Apatite% + tourmaline%) [39]. In this parameter, two minerals (Apatite and tourmaline) possess identical densities but show contrasting behaviours in weathering, thereby reducing the effect of hydrodynamics. Furthermore, apatite fertility and erosion rates may have an impact on the content of apatite [20,21]. In the present study, low ATi and apatite content in the Pliocene imply stronger weathering scenarios (Figure 12). Moreover, a strong enrichment of ZTR and a significant loss of unstable minerals (amphibole <5%) also suggest that weathering was much stronger during the Pliocene than during the Quaternary time (Figure 12).
Strong weathering conditions resulted in a decline in the concentration of unstable heavy minerals [8,27], and amphibole and epidote developed etched surfaces, as shown in Figure 9 and Figure 10. As an unstable heavy mineral, amphibole is dissolved in strong weathering conditions [10,27]. In such environments, unstable minerals were easily etched during the Pliocene. SEM images show that amphibole and epidote were corroded along the direction of the crystal cleavage and left tiny holes on the crystal face after dissolution (Figure 9 and Figure 10). At the same time, the crystal’s transparency reduced.
Amphibole and epidote etching were found to be comparable to previously published studies [9,10,32]. In modern sediments of subequatorial regions, surface textures of detrital minerals ranged from incipient corrosion to deep etching, reflecting a progressive increase in the degree of alteration [9]. In addition, some studies show that etching developed from mamillations, through facetted grains, to skeletal grains [32]. Therefore, we infer that the etching of amphibole and epidote grains would have occurred during the sediment transport process before deposition in the sink area of the Changjiang Delta. In this process, the least stable mineral, amphibole, dissolved faster and decreased in the bottom of Core LQ24. On the other hand, the more stable minerals of ZTR dissolved at slower rates and thus were relatively enriched.
The intrastratal dissolution during the diagenetic process may also be listed as a major factor that promotes unstable mineral dissolution in a core sediment. For ancient sediments, temperatures and pressures that increase with burial depth cause the intrastratal dissolution of unstable heavy minerals [14]. Being a depocenter since the Pliocene, the Changjiang Delta has a deposition of a ~300 m thick siliciclastic sedimentary sequence. Affected by compaction and diagenesis, a block of calcite-cemented sand formed at the core bottom of the Changjiang Delta [3,27]. However, the burial depths involved in this study area are modest (the deepest thickness = ca. 400 m), and the sediments of the Changjiang Delta are very young (Neogene) [22,38]. Calcite-cemented sands in the bottom strata are not fully diagenized. Environmental magnetic parameters have shown that diagenesis has not erased the detrital magnetic signal in the Changjiang Delta. This observation suggests weak post-depositional diagenesis [38]. Compared to similar studies in other parts of the world, the process of dissolution during burial diagenesis needs a deeper burial and higher temperatures. Studies in older (Paleocene) sandstones of the North Sea show that amphibole and epidote dissolutions are not complete until they reach a 600 m and 1100 m burial depth, respectively [40]. Walderhaug and Porten suggest that amphibole and epidote dissolution requires pore water temperatures of 40 and 95 °C, respectively [41]. These studies suggest that the process of burial diagenesis did not play a significant role in the single mineral dissolution in the Changjiang Delta.

4.2. Chemical Responses of Different Single Minerals to Different Weathering Environments

Irrespective of the corroded surface texture of susceptible heavy minerals in the Pliocene strata (as a result of strong weathering conditions), no change in the major element composition of single minerals was observed (Figure 4, Figure 5, Figure 6 and Figure 7). The EPMA results show the prevalence of a similar geochemical character in single minerals extracted from the Pliocene, Pleistocene, and modern Changjiang sediments. The result of amphibole classification showed that all amphibole grains in the boreholes and river samples were mainly composed of magnesio-hornblende, actinolite, tschermakite, and edenite (Table 2, Figure 5). For different samples, the percentage of the same amphibole species varied slightly (Table 2). This bias might have been introduced by natural processes, such as hydraulic sorting, mechanical abrasion, and weathering, or by inaccurate procedures during sampling, laboratory treatment, and analysis [20,28]. Furthermore, for the same type of heavy mineral, the geochemical characteristics are similar in the size fractions of 63–125 µm and 32–63 µm.
Under a strong weathering environment, unstable minerals are easily corroded due to their crystal lattice feature. As chemical weathering proceeds, unstable minerals gradually disappear, thereby resulting in an extremely low (about 5%) content of amphibole in the Pliocene strata. Unstable mineral dissolution further affected the HMC. Studies show that the HMC of most Pliocene samples is only 0.5% (Figure 2), which is much lower than that of the modern river sediment samples [27,42].

5. Conclusions

(1)
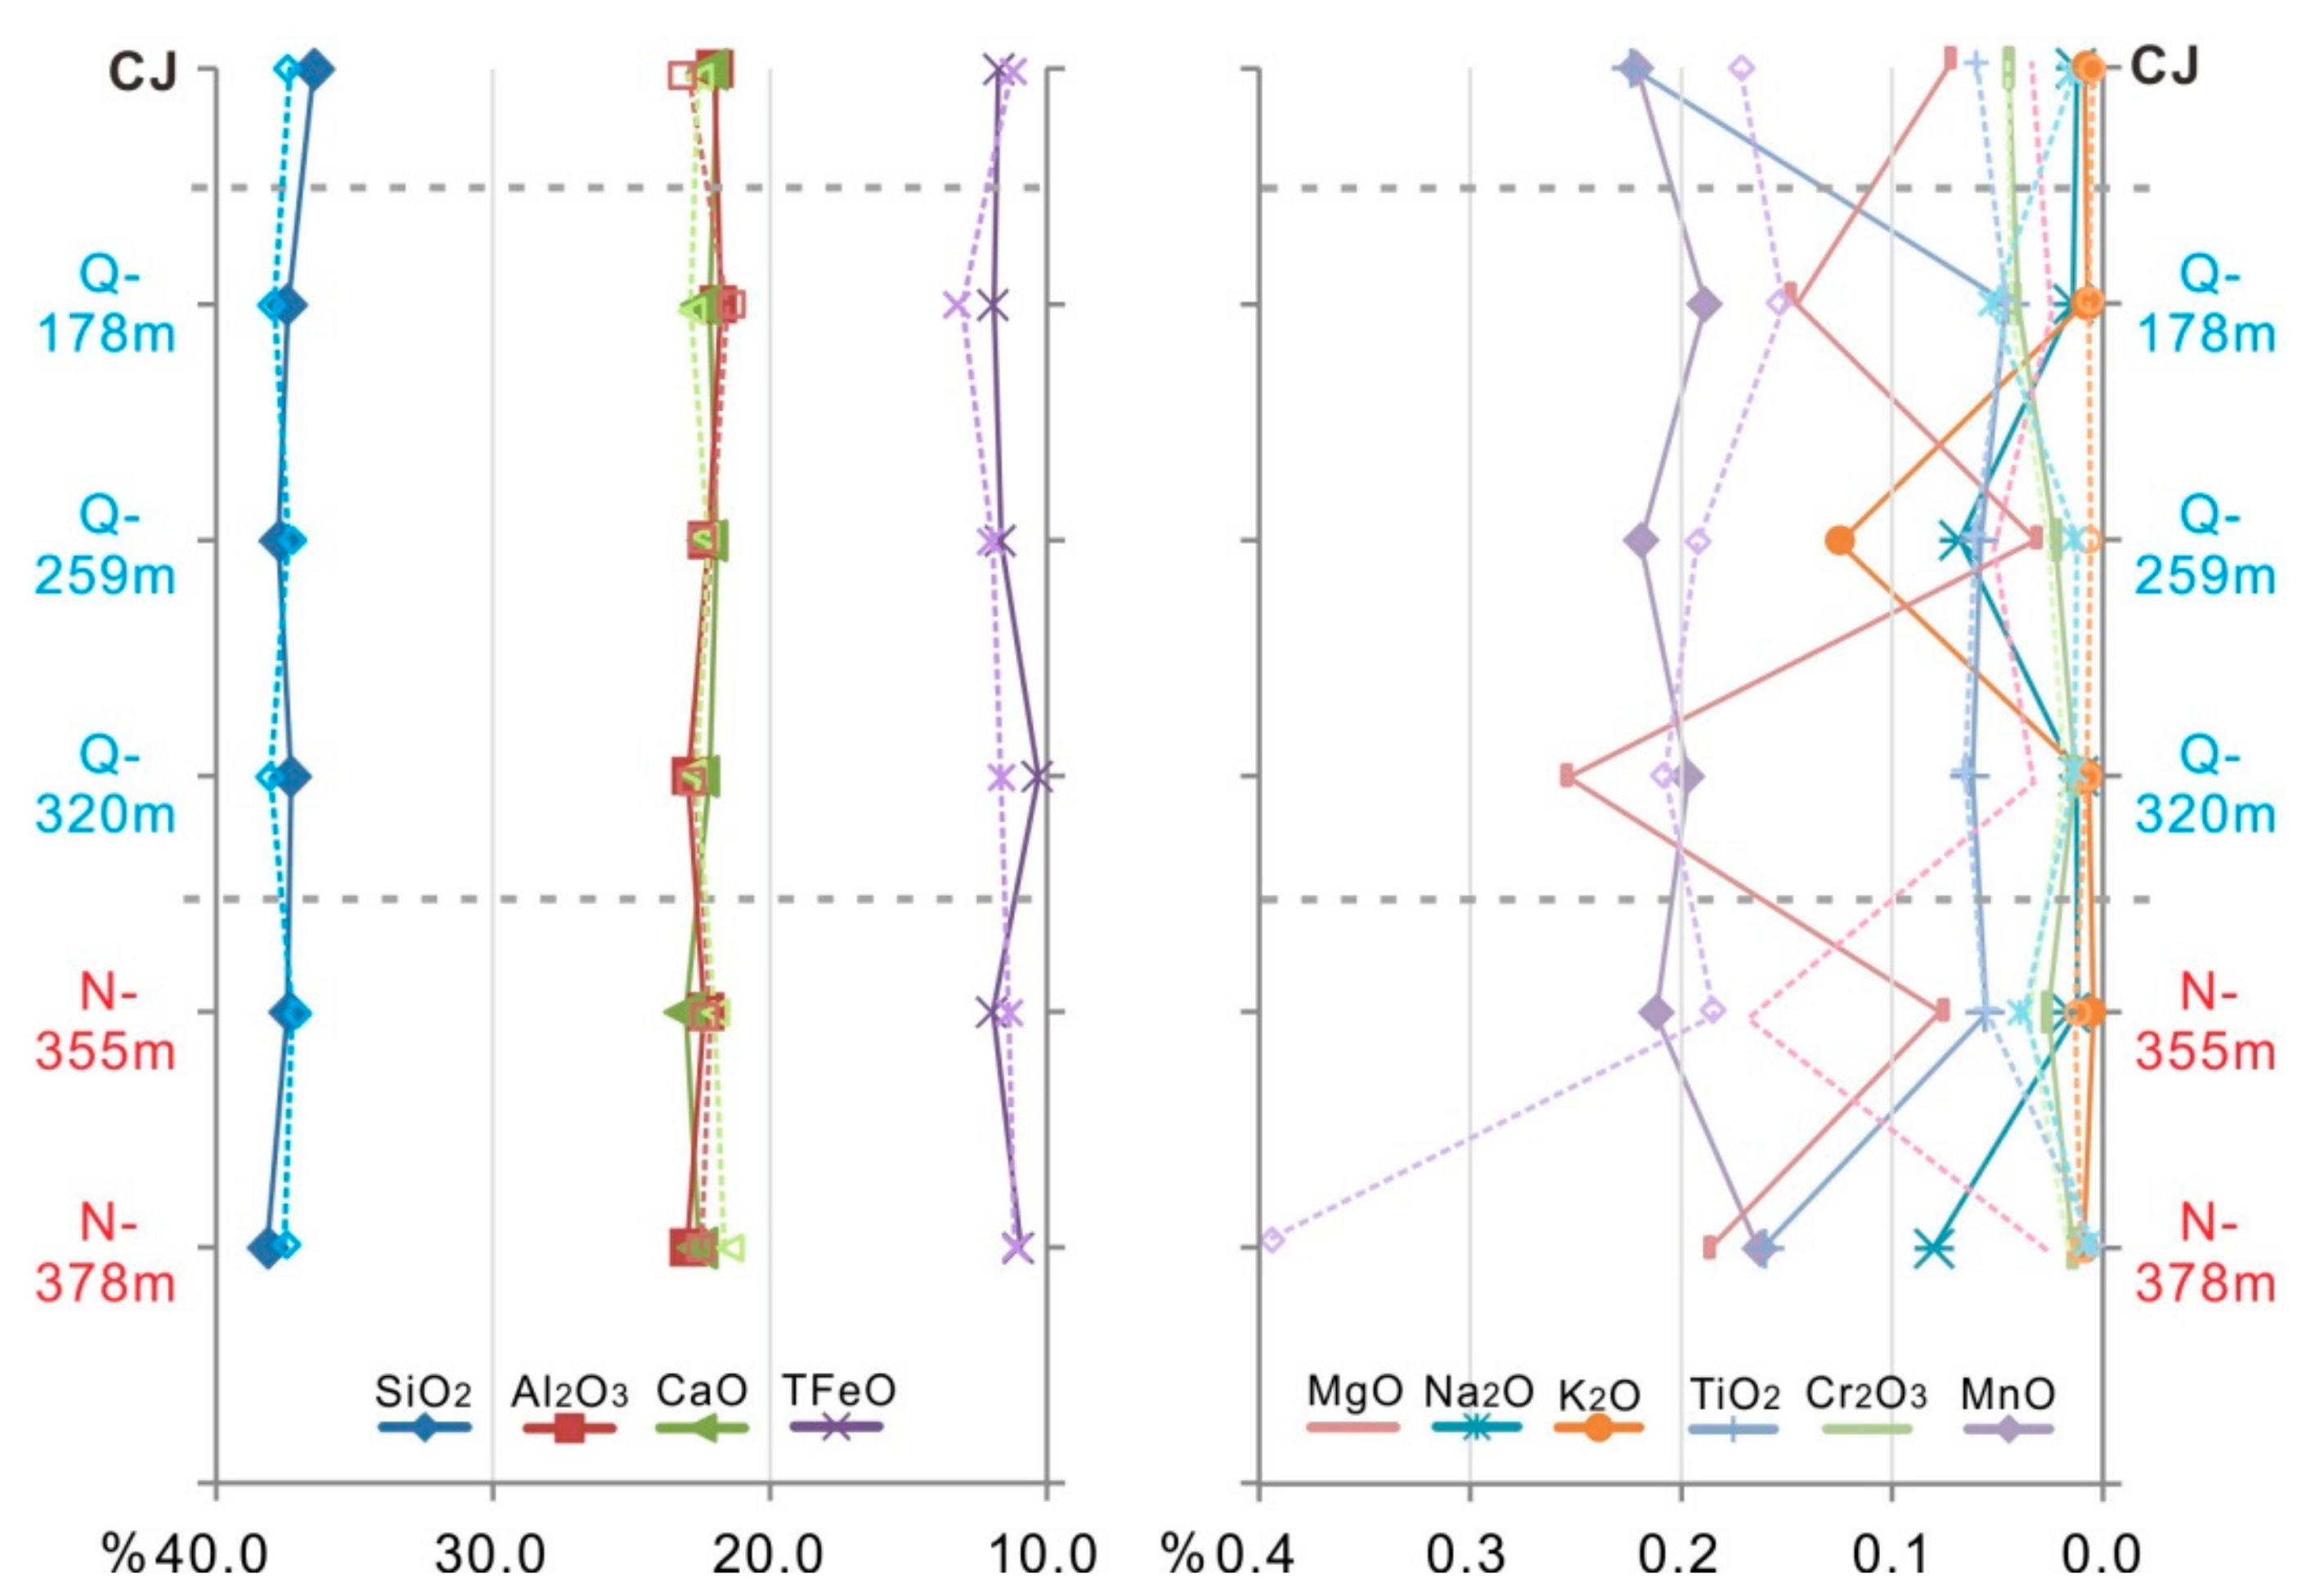
The major element (Si, Fe, Mn, Al, Mg, Ti, and Na) contents of single minerals at different core depths of LQ24 are similar to those of the modern Changjiang sample. There is no distinct depth control of elemental richness or loss of single minerals in the Plio-Pleistocene sediment.
(2)
The surface texture of unstable minerals (amphibole, epidote) in the Pliocene strata of Changjiang Delta shows corrosion. By contrast, unstable minerals from the Pleistocene sediment are relatively fresh, like those of the modern Changjiang samples. The stable mineral tourmaline does not show a morphological difference in different strata.
(3)
Different minerals within grains of 63–125 µm and 32–63 µm size fractions do not show physical and chemical variations at different core depths in the Changjiang Delta.

Author Contributions

Conceptualization, W.Y.; Methodology, L.Z. and B.J.; Writing—original draft preparation, W.Y; Writing—review and editing, W.Y., S.P. and X.Y.

Funding

This research was funded by a Project Funded by the Priority Academic Program Development of Jiangsu Higher Education Institutions, the National Science Foundation of China (Grant No. 41706048; 41730531; 41576057), and the Natural Science Foundation of Shandong Province, China (No: ZR2019MD009).

Acknowledgments

Special thanks to Sergio Andò and three anonymous reviewers for their constructive comments that helped improve the manuscript.

Conflicts of Interest

The authors declare no conflict of interest.

References

  1. Milliman, J.D.; Shen, H.T.; Yang, Z.S.; Mead, R.H. Transport and deposition of river sediment in the Changjiang estuary and adjacent continental shelf. Cont. Shelf Res. 1985, 4, 37–45. [Google Scholar] [CrossRef]
  2. Yang, S.L.; Xu, K.H.; Milliman, J.D.; Yang, H.F.; Wu, C.S. Decline of Yangtze River water and sediment discharge: Impact from natural and anthropogenic changes. Sci. Rep. 2015, 5, 12581. [Google Scholar] [CrossRef] [PubMed]
  3. Yue, W.; Jin, B.F.; Zhao, B.C. Transparent heavy minerals and magnetite geochemical composition of the Yangtze River sediments: Implication for provenance evolution of the Yangtze Delta. Sediment. Geol. 2018, 364, 42–52. [Google Scholar] [CrossRef]
  4. Changjiang Water Resources Commission. Bulletin of the Changjiang Sediment in 1951–2016; Changjiang Press: Wuhan, China, 2016. (In Chinese) [Google Scholar]
  5. Vezzoli, G.; Garzanti, E.; Limonta, M.; Andò, S.; Yang, S.Y. Erosion patterns in the Changjiang (Yangtze River) catchment revealed by bulk-sample versus single-mineral provenance budgets. Geomorphology 2016, 261, 177–192. [Google Scholar] [CrossRef]
  6. Hori, K.; Saito, Y.; Zhao, Q.; Cheng, X.; Wang, P.; Sato, Y.; Li, C. Sedimentary facies and Holocene progradation rates of the Changjiang (Yangtze) delta, China. Geomorphology 2001, 41, 233–248. [Google Scholar] [CrossRef]
  7. Wang, Z.H.; Saito, Y.; Zhan, Q.; Nian, X.M.; Pan, D.D.; Wang, L.; Chen, T.; Xie, J.L.; Li, X.; Jiang, X.Z. Three-dimensional evolution of the Yangtze River mouth, China during the Holocene: Impacts of sea level, climate and human activity. Earth Sci. Rev. 2018, 185, 938–955. [Google Scholar] [CrossRef]
  8. Morton, A.C.; Hallsworth, C.R. Processes controlling the composition of heavy mineral assemblages in sandstones. Sediment. Geol. 1999, 124, 3–29. [Google Scholar] [CrossRef]
  9. Andò, S.; Garzanti, E.; Padoan, M.; Limonta, M. Corrosion of heavy minerals during weathering and diagenesis: a catalog for optical analysis. Sediment. Geol. 2012, 280, 165–178. [Google Scholar] [CrossRef]
  10. Velbel, M.A. Surface textures and dissolution processes of heavy minerals in the sedimentary cycle: Examples from pyroxenes and amphiboles. Dev. Sedimentol. 2007, 58, 113–150. [Google Scholar]
  11. Hubert, J.F.A. Zircon-tourmaline-rutile maturity index and the interdependence of the composition of heavy mineral assemblages with the gross composition and texture of sandstones. J. Sediment. Res. 1962, 32, 440–450. [Google Scholar]
  12. Garzanti, E.; Andò, S.; Vezzoli, G. Grain-size dependence of sediment composition and environmental bias in provenance studies. Earth Planet. Sci. Lett. 2009, 277, 422–432. [Google Scholar] [CrossRef]
  13. Malusà, M.G.; Garzanti, E. The Sedimentology of Detrital Thermochronology. In Fission-Track Thermochronology and Its Application to Geology; Springer: Cham, Switzerland, 2019; pp. 123–143. [Google Scholar]
  14. Morton, A.C. Depth control of intrastratal solution of heavy minerals from the Palaeocene of the North Sea. J. Sedim. Petrol. 1979, 49, 281–286. [Google Scholar]
  15. Garzanti, E.; Andò, S. Heavy mineral concentration in modern sands: Implications for provenance interpretation. Dev. Sedimentol. 2007, 58, 517–545. [Google Scholar]
  16. Von Eynatten, H.; Gaupp, R. Provenance of Cretaceous synorogenic sandstones in the Eastern Alps: Constraints from framework petrography, heavy mineral analysis and mineral chemistry. Sediment. Geol. 1999, 124, 81–111. [Google Scholar] [CrossRef]
  17. Garzanti, E.; Vermeesch, P.; Rittner, M.; Simmons, M. The zircon story of the Nile: Time-structure maps of source rocks and discontinuous propagation of detrital signals. Basin Res. 2018, 30, 1098–1117. [Google Scholar] [CrossRef]
  18. Morton, A.C. A new approach to provenance studies: Electron microprobe analysis of detrital garnets from Middle Jurassic sandstones of the northern North Sea. Sedimentology 1985, 32, 553–566. [Google Scholar] [CrossRef]
  19. Von Eynatten, H.; Dunkl, I. Assessing the sediment factory: The role of single grain analysis. Earth Sci. Rev. 2012, 115, 97–120. [Google Scholar] [CrossRef]
  20. Malusà, M.G.; Resentini, A.; Garzanti, E. Hydraulic sorting and mineral fertility bias in detrital geochronology. Gondwana Res. 2016, 31, 1–19. [Google Scholar] [CrossRef]
  21. Malusà, M.G.; Wang, J.; Garzanti, E.; Liu, Z.C.; Villa, I.M.; Wittmann, H. Trace-element and Nd-isotope systematics in detrital apatite of the Po river catchment: Implications for provenance discrimination and the lag-time approach to detrital thermochronology. Lithos 2017, 290–291, 48–59. [Google Scholar] [CrossRef]
  22. Yue, W.; Yue, X.Y.; Zhang, L.M.; Liu, X.B.; Song, J. Morphology of Detrital Zircon as a Fingerprint to Trace Sediment Provenance: Case Study of the Yangtze Delta. Minerals 2019, 9, 438. [Google Scholar] [CrossRef]
  23. Yang, S.Y.; Li, C.X.; Cai, J.G. Geochemical compositions of core sediments in eastern China: Implication for Late Cenozoic palaeoenvironmental changes. Palaeogeogr. Palaeoclimatol. Palaeoecol. 2006, 229, 287–302. [Google Scholar] [CrossRef]
  24. Zhang, P.; Miao, Y.F.; Zhang, Z.Y.; Lu, S.M.; Zhang, Y.J.; Chen, H.G.; Li, X.Q.; Miao, Q.Y.; Feng, W.L.; Ou, J.; et al. Late Cenozoic sporopollen records in the Yangtze River Delta, East China and implications for East Asian summer monsoon evolution. Palaeogeogr. Palaeoclimatol. Palaeoecol. 2013, 388, 153–165. [Google Scholar] [CrossRef]
  25. Yue, W.; Liu, J.T.; Zhang, D.; Wang, Z.H.; Zhao, B.C.; Chen, Z.Y.; Chen, J. Magnetite with anomalously high Cr2O3 as a fingerprint to trace upper Yangtze sediments to the sea. Geomorphology 2016, 268, 14–20. [Google Scholar] [CrossRef]
  26. Yang, S.Y.; Li, C.X.; Yokoyama, K. Elemental compositions and monazite age patterns of core sediments in the Changjiang Delta: Implications for sediment provenance and development history of the Changjiang River. Earth Planet. Sci. Lett. 2006, 245, 762–776. [Google Scholar] [CrossRef]
  27. Yue, W.; Yang, S.Y.; Zhao, B.C.; Chen, Z.Y.; Yu, J.J.; Liu, X.B.; Huang, X.T.; Jin, B.F.; Chen, J. Changes in environment and provenance within the Changjiang (Yangtze River) Delta during Pliocene to Pleistocene transition. Mar. Geol. 2019, 416. [Google Scholar] [CrossRef]
  28. Malusà, M.G.; Carter, A.; Limoncelli, M.; Villa, I.M.; Garzanti, E. Bias in detrital zircon geochronology and thermochronometry. Chem. Geol. 2013, 359, 90–107. [Google Scholar] [CrossRef]
  29. Mange, M.A.; Maurer, H.F.W. Heavy Minerals in Colour; Chapman and Hall: London, UK, 1992; pp. 135–151. [Google Scholar]
  30. Jin, B.; Wang, M.; Yue, W.; Zhang, L.; Wang, Y. Heavy Mineral Variability in the Yellow River Sediments as Determined by the Multiple-Window Strategy. Minerals 2019, 9, 85. [Google Scholar] [CrossRef]
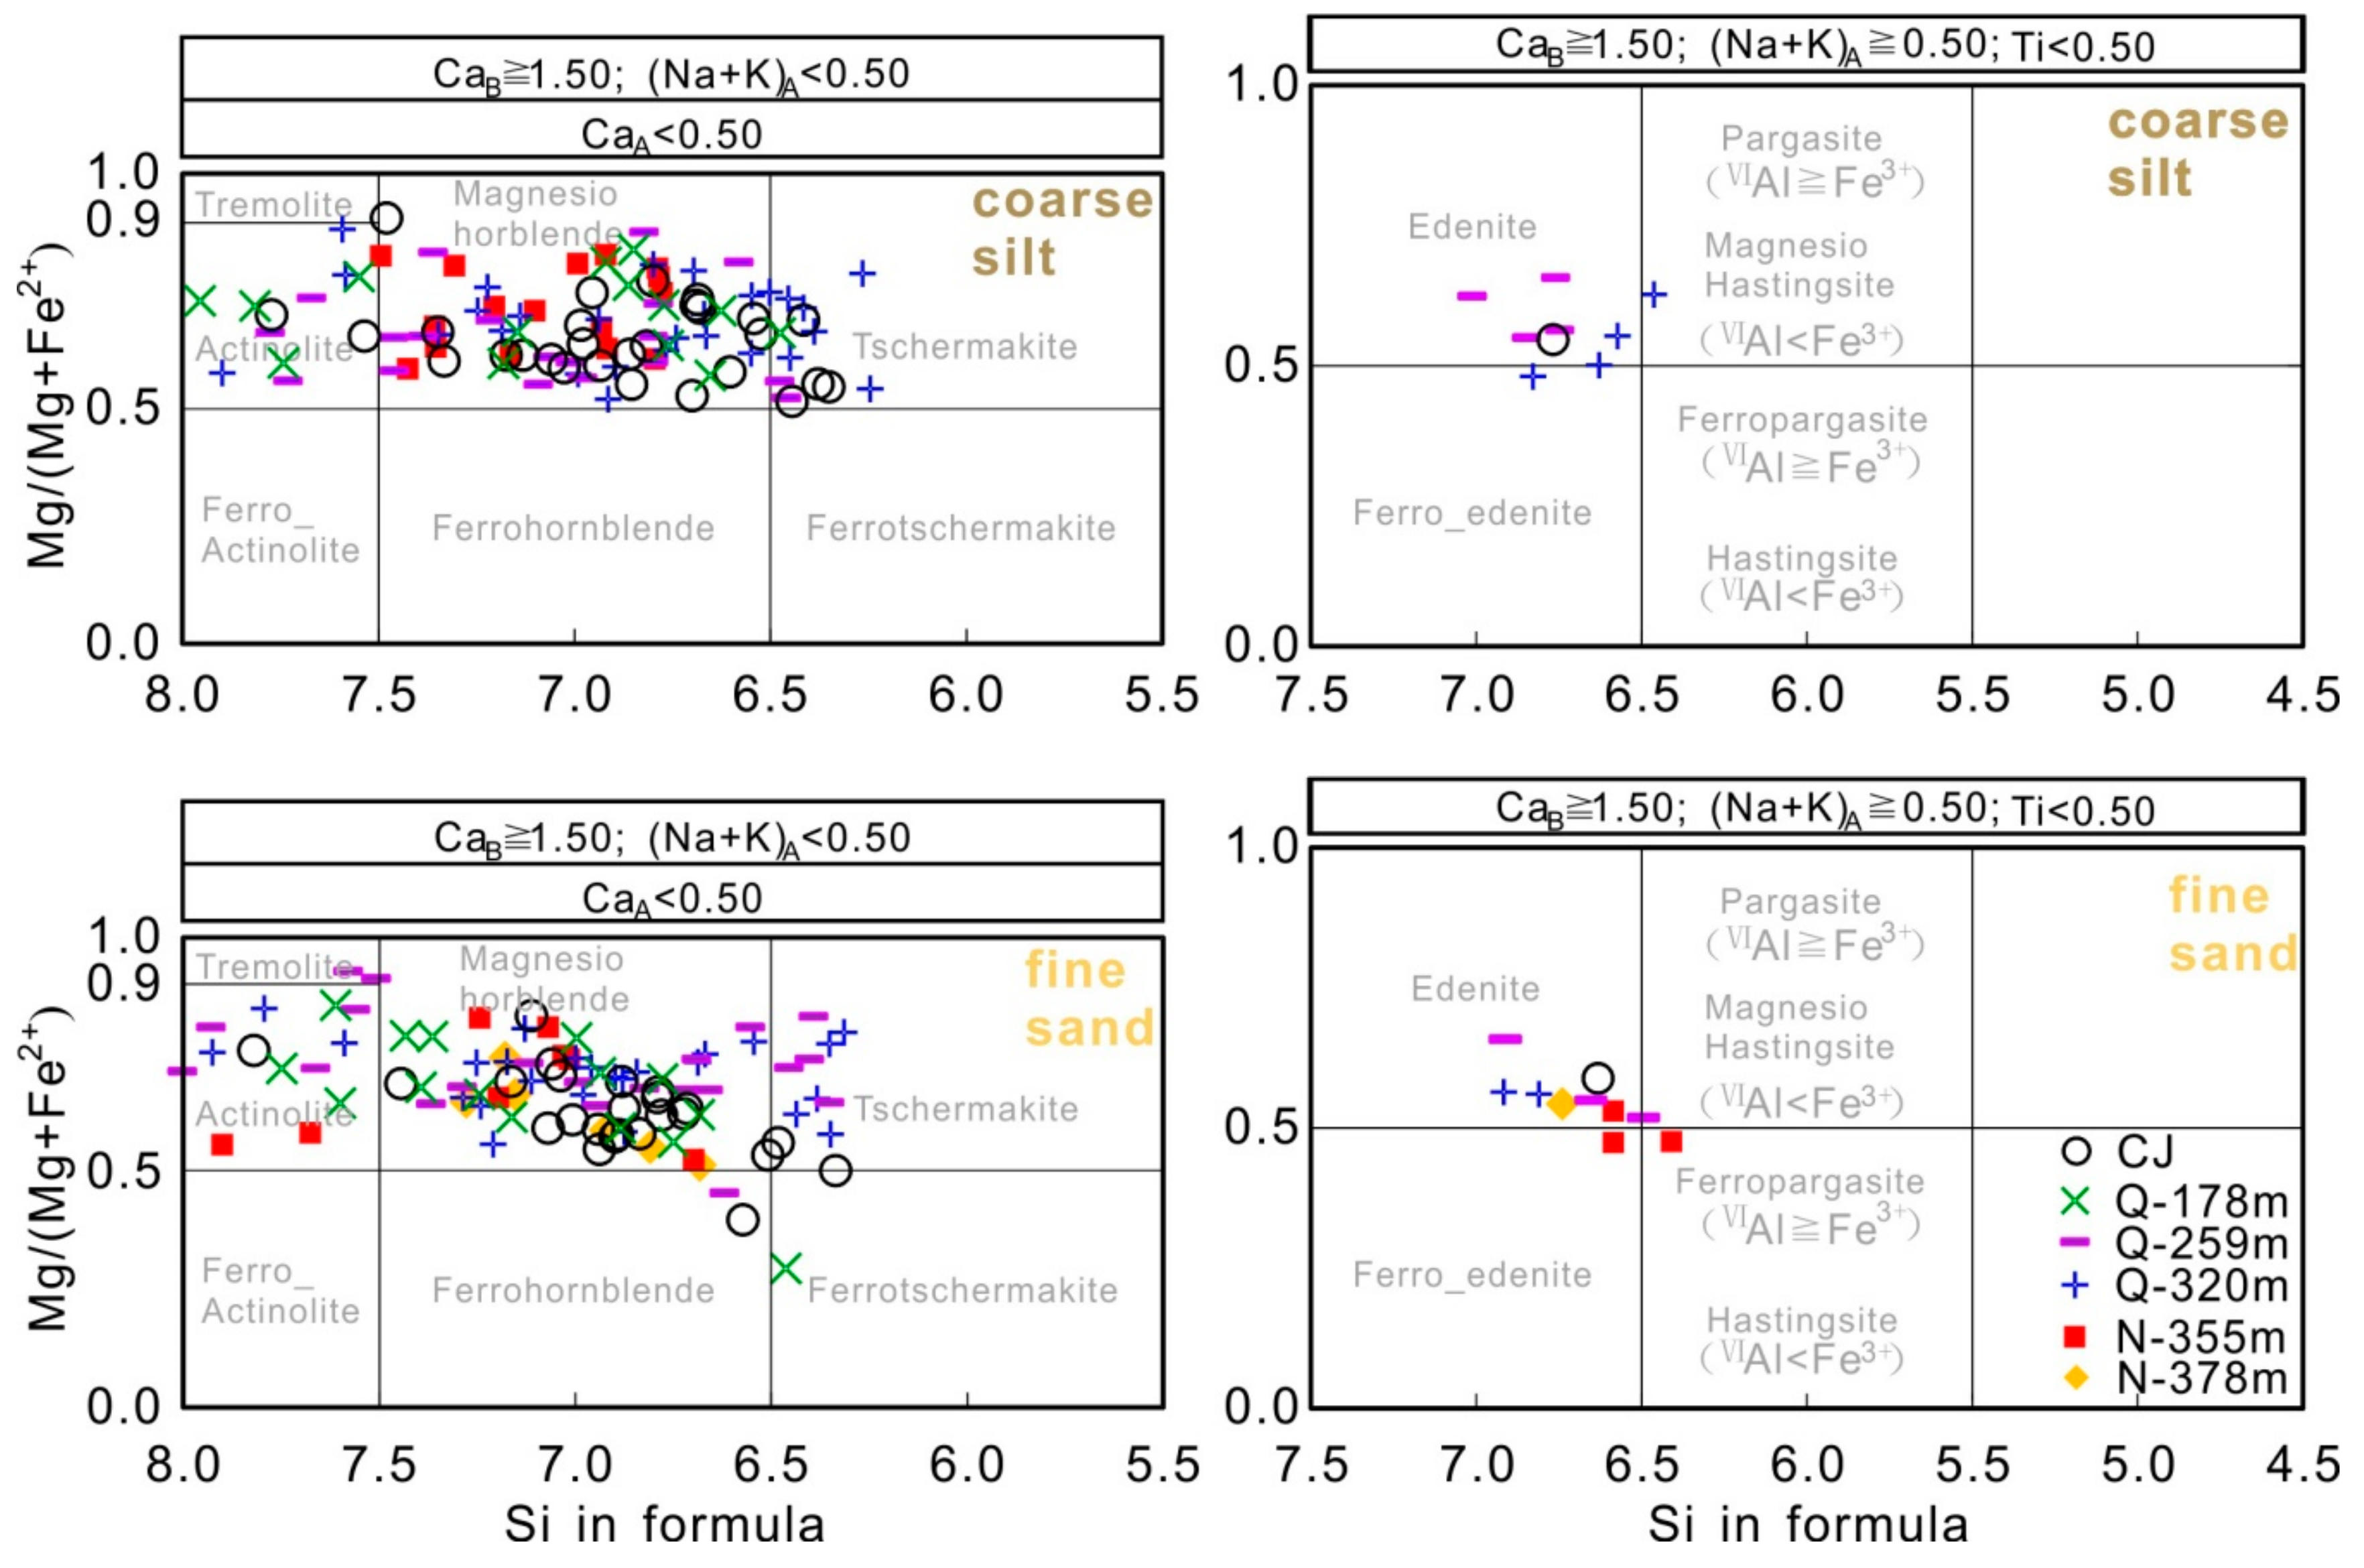
  31. Leake, B.E.; Woolley, A.R.; Birch, W.D.; Burke, E.A.J.; Ferraris, G.; Grice, J.D.; Hawthorne, F.C.; Kisch, H.J.; Krivovichev, V.G.; Schumacher, J.C.; et al. Nomenclature of amphiboles: Additions and revisions to the International Mineralogical Association’s amphibole nomenclature. Am. Mineral. 2004, 89, 883–887. [Google Scholar]
  32. Morton, A.C. Surface features of heavy mineral grains from Palaeocene sands of the central North Sea. Scot. J. Geol. 1979, 15, 293–300. [Google Scholar] [CrossRef]
  33. Berner, R.A.; Sjöberg, E.L.; Velbel, M.A.; Krom, M.D. Dissolution of pyroxenes and amphiboles during weathering. Science 1980, 207, 1205–1206. [Google Scholar] [CrossRef]
  34. Lång, L.O. Heavy mineral weathering under acidic soil conditions. Appl. Geochem. 2000, 15, 415–423. [Google Scholar] [CrossRef]
  35. White, A.F.; Blum, A.E. Effects of climate on chemical weathering in watersheds. Geochim. Cosmochim. Acta. 1995, 59, 1729–1747. [Google Scholar] [CrossRef]
  36. Brantley, S.L. Reaction Kinetics of Primary Rock-Forming Minerals Under Ambient Conditions. In Treatise on Geochemistry; Drever, J.I., Holland, H.D., Turekian, K.K., Eds.; Elsevier: Amsterdam, The Netherland, 2003; pp. 73–117. [Google Scholar]
  37. Han, J.; Fyfe, W.S.; Longstaffe, F.J.; Palmer, H.C.; Yan, F.H.; Mai, X.S. Pliocene-Pleistocene climatic change recorded in fluviolacustrine sediments in central China. Palaeogeogr. Palaeoclimatol. Palaeoecol. 1997, 135, 27–39. [Google Scholar] [CrossRef]
  38. Liu, X.; Chen, J.; Maher, B.A.; Zhao, B.; Yue, W.; Sun, Q.; Chen, Z. Connection of the proto-Yangtze River to the East China Sea traced by sediment magnetic properties. Geomorphology 2018, 303, 162–171. [Google Scholar] [CrossRef] [Green Version]
  39. Morton, A.C.; Hallsworth, C.R. Identifying provenance-specific features of detrital heavy mineral assemblages in sandstones. Sediment. Geol. 1994, 90, 241–256. [Google Scholar] [CrossRef]
  40. Morton, A.C. Stability of detrital heavy minerals in Tertiary sandstones of the North Sea Basin. Clay Miner. 1984, 19, 287–308. [Google Scholar] [CrossRef]
  41. Walderhaug, O.; Porten, K.W. Stability of detrital heavy minerals on the Norwegian continental shelf as a function of depth and temperature. J. Sediment. Res. 2007, 77, 992–1002. [Google Scholar] [CrossRef]
  42. Yang, S.Y.; Wang, Z.; Guo, Y.; Li, C.X.; Cai, J.G. Heavy mineral compositions of the Changjiang (Yangtze River) sediments and their provenance–tracing implication. J. Asian Earth Sci. 2009, 35, 56–65. [Google Scholar] [CrossRef]
Figure 1. Stable minerals (ZTR) vs. heavy mineral concentration of Pliocene and Pleistocene sediments from the Core LQ24 of the Changjiang Delta. HMC = Heavy mineral concentration; the ZTR index [11] is the percentage of relatively durable zircon, tourmaline, and rutile among the transparent heavy minerals. The high HMC values in some of the Pleistocene samples define a placer trend [13], and diagenetic dissolution in the Pliocene sand produces a decrease in HMC and an increase in ZTR.
Minerals 09 00454 g001
Figure 2. The Plio-Pleistocene magneto-stratigraphy of Core LQ24 from the Changjiang Delta. Paleo-magnetic dating, lithology, and grain size parameters were from [3]. N = Pliocene, Q = Pleistocene.
Minerals 09 00454 g002
Figure 3. Sampling locations of the core and modern Changjiang River sediment.
Minerals 09 00454 g003
Figure 4. The mean element compositions of the amphibole of Core LQ24 and modern Changjiang River. A very fine sand fraction (63–125 µm) is indicated by full lines and coarse silt (32–63 µm) is indicated by dashed lines. Core depth is set in the vertical axis. CJ = Changjiang River. Core samples that were sampled from different depths of burial are marked in a red and light blue color. The red one is representative of the Pliocene; the light blue is representative of Pleistocene; N = Pliocene, Q = Pleistocene. Please see Table 1 for the numbers of grains analysed per sample.
Minerals 09 00454 g004
Figure 5. Amphibole classification diagrams for Core LQ24 and the modern Changjing River. CJ = Changjiang, N = Pliocene, Q = Pleistocene. Ca-amphibole classification was performed according to [31].
Minerals 09 00454 g005
Figure 6. Mean element compositions of the epidote of Core LQ24 and the modern Changjiang River. A very fine sand fraction (63–125 µm) is indicated by full lines and coarse silt (32–63 µm) is indicated by dashed lines. Core depth is set in the vertical axis. CJ = Changjiang River. Core samples that were sampled from different depths of burial are marked in a red and light blue color. The red one is representative of the Pliocene; the light blue is representative of the Pleistocene; N = Pliocene, Q = Pleistocene. Please see Table 1 for the numbers of grains analysed per sample.
Minerals 09 00454 g006
Figure 7. The mean element compositions of the tourmaline of Core LQ24 and the modern Changjiang River. A very fine sand fraction (63–125 µm) is indicated by full lines and coarse silt (32–63 µm) is indicated by dashed lines. The core depth is set in the vertical axis. CJ = Changjiang River. Core samples that were sampled from different depths of burial are marked in a red and light blue color. The red one is representative of the Pliocene; the light blue is representative of the Pleistocene; N = Pliocene, Q = Pleistocene. Please see Table 1 for the numbers of grains analysed per sample.
Minerals 09 00454 g007
Figure 8. Percentage of corroded single mineral grains in the Core LQ24 of Changjiang Delta. A very fine sand fraction (63–125 µm) is indicated by full lines and coarse silt (32–63 µm) is indicated by dashed lines. N = Pliocene, Q = Pleistocene.
Minerals 09 00454 g008
Figure 9. Surface texture of the amphibole in the Core LQ24 of the Changjiang Delta. s = Very fine sand fraction (63–125 µm), cs = coarse silt fraction (32–63 µm). N = Pliocene, Q = Pleistocene.
Minerals 09 00454 g009
Figure 10. Surface texture of the epidote in the Core LQ24 of the Changjiang Delta. s = Very fine sand fraction (63–125 µm), cs = coarse silt fraction (32–63 µm). N = Pliocene, Q = Pleistocene.
Minerals 09 00454 g010
Figure 11. Surface texture of the tourmaline in the Core LQ24 of the Changjiang Delta. s = Very fine sand fraction (63–125 µm), cs = coarse silt fraction (32–63 µm). N = Pliocene, Q = Pleistocene.
Minerals 09 00454 g011
Figure 12. Heavy mineral distribution for Core LQ24 of the Changjiang Delta. Heavy mineral data are from [3]. The analyzed size fraction is very fine sand (63–125 µm). N = Pliocene, Q = Pleistocene. Systematic mineral abbreviation list: ATi (Apatite-Tourmaline index) = (100 × Apatite%)/(Apatite% + tourmaline%). Amp = Amphibole, Ep = Epidote, Ilm = Ilmenite, Mgt = Magnetite, Px = Pyroxene, Ap = Apatite, Zrn = Zircon; Tur = Tourmaline, Grt = Garnet, Others = Other heavy minerals and mineral aggregate, including limonite, fluorite, titanite, rutile, anatase, kyanite, andalusite, un-identified grains, rock fragments, etc.
Minerals 09 00454 g012
Table 1. Average element compositions (%) of amphibole, epidote, tourmaline of Core LQ24 and modern Changjiang River. s = Very fine sand fraction (63–125 µm), cs = Coarse silt fraction (32–63 µm). CJ = Changjiang River.
Samples (Number)SiO2Al2O3Na2OMgOK2OTiO2CaOFeOMnOCr2O3V2O3
LQ24-355m-cs-Amp(17)46.836.550.8612.750.460.3111.3913.150.380.020.05
LQ24-320m-cs-Amp(31)45.438.741.1811.310.760.5011.3315.340.450.040.06
LQ24-259m-cs-Amp(25)46.797.620.9111.330.550.3411.2915.650.520.070.05
LQ24-178m-cs-Amp(15)46.328.050.9211.410.370.2312.3213.560.350.030.05
CJ-Amp-cs(29)46.197.951.0011.270.690.7411.8615.740.380.080.06
LQ24-378m-cs-Ep(12)37.1422.120.000.020.010.0121.6411.310.620.010.03
LQ24-355m-cs-Ep(44)36.8021.90.030.170.010.0522.0611.340.180.030.05
LQ24-320m-cs-Ep(27)37.6622.610.010.030.000.0622.4911.710.210.020.08
LQ24-259m-cs-Ep(26)37.0321.980.010.050.000.0622.2511.940.190.020.06
LQ24-178m-cs-Ep(25)37.5521.400.050.020.000.0422.7413.250.150.040.1
CJ-Ep-cs(27)36.9222.670.010.030.000.0622.511.50.170.040.07
LQ24-378m-cs-Tur(29)35.9230.431.936.030.030.340.838.400.050.050.04
LQ24-355m-cs-Tur(23)35.7831.171.915.030.030.350.448.500.050.040.06
LQ24-178m-cs-Tur(26)36.4231.881.845.520.030.30.567.720.050.070.04
CJ-Tur-cs(20)34.6531.251.926.180.030.810.958.390.040.050.07
LQ24-378m-s-Amp(7)46.628.241.0511.130.760.4511.6915.810.340.030.07
LQ24-355m-s-Amp(12)46.589.400.9211.481.260.3510.3615.190.330.030.07
LQ24-320m-s-Amp(27)46.557.881.1712.260.630.4011.4214.380.460.050.04
LQ24-259m-s-Amp(24)46.597.411.0812.380.540.3812.2213.480.420.070.06
LQ24-178m-s-Amp(15)47.327.300.7612.410.340.3712.4912.660.250.100.06
CJ-Amp-s(25)46.188.801.0711.280.530.6511.4415.450.390.040.06
LQ24-378m-s-Ep(24)38.0822.930.080.190.010.1622.5811.000.160.010.08
LQ24-355m-s-Ep(52)37.3122.30.020.080.010.0623.0511.970.210.030.05
LQ24-320m-s-Ep(33)37.2522.860.010.250.010.0622.5310.320.200.010.07
LQ24-259m-s-Ep(28)37.6622.290.070.030.120.0622.2311.650.220.020.04
LQ24-178m-s-Ep(25)37.3921.870.010.150.010.0422.4511.920.190.040.08
CJ-Ep-s(22)36.4121.980.010.070.010.2222.2211.70.220.040.09
LQ24-378m-s-Tur(47)35.9532.551.864.410.040.310.579.400.070.030.03
LQ24-355m-s-Tur(21)35.8833.021.925.620.040.320.557.280.060.050.04
LQ24-259m-s-Tur(6)37.5131.451.928.380.050.281.255.380.050.070.06
LQ24-178m-s-Tur(25)35.3632.291.715.350.030.360.857.750.040.040.03
CJ-Tur-s(16)34.9831.742.116.400.030.750.707.490.040.050.06
Table 2. Amphibole species (%) for Core LQ24 and the modern Changjing River. s = Very fine sand fraction (63–125 µm), cs = coarse silt fraction (32–63 µm). CJ = Changjiang River. Others = other amphibole species, including Ferrotschermakite, Ferroedenite, Magnesio Hastingsite, and Ferropargasite.
SamplesTremoliteActinoliteMagnesio-HornblendeFerro-HornblendeTschermakiteEdeniteOthers
LQ24-N-s0.0011.1166.670.000.0011.1111.10
LQ24-Q-s3.0315.1557.581.5213.647.581.50
CJ-s0.004.0080.004.008.004.000.00
LQ24-N-cs0.005.8894.120.000.000.000.00
LQ24-Q-cs1.4513.0459.420.0013.047.255.80
CJ-cs0.006.9072.410.0013.793.453.50

