Geometallurgical Characterization of Non-Ferrous Historical Slag in Western Tasmania: Identifying Reprocessing Options


Abstract

1. Introduction
2. Site Description
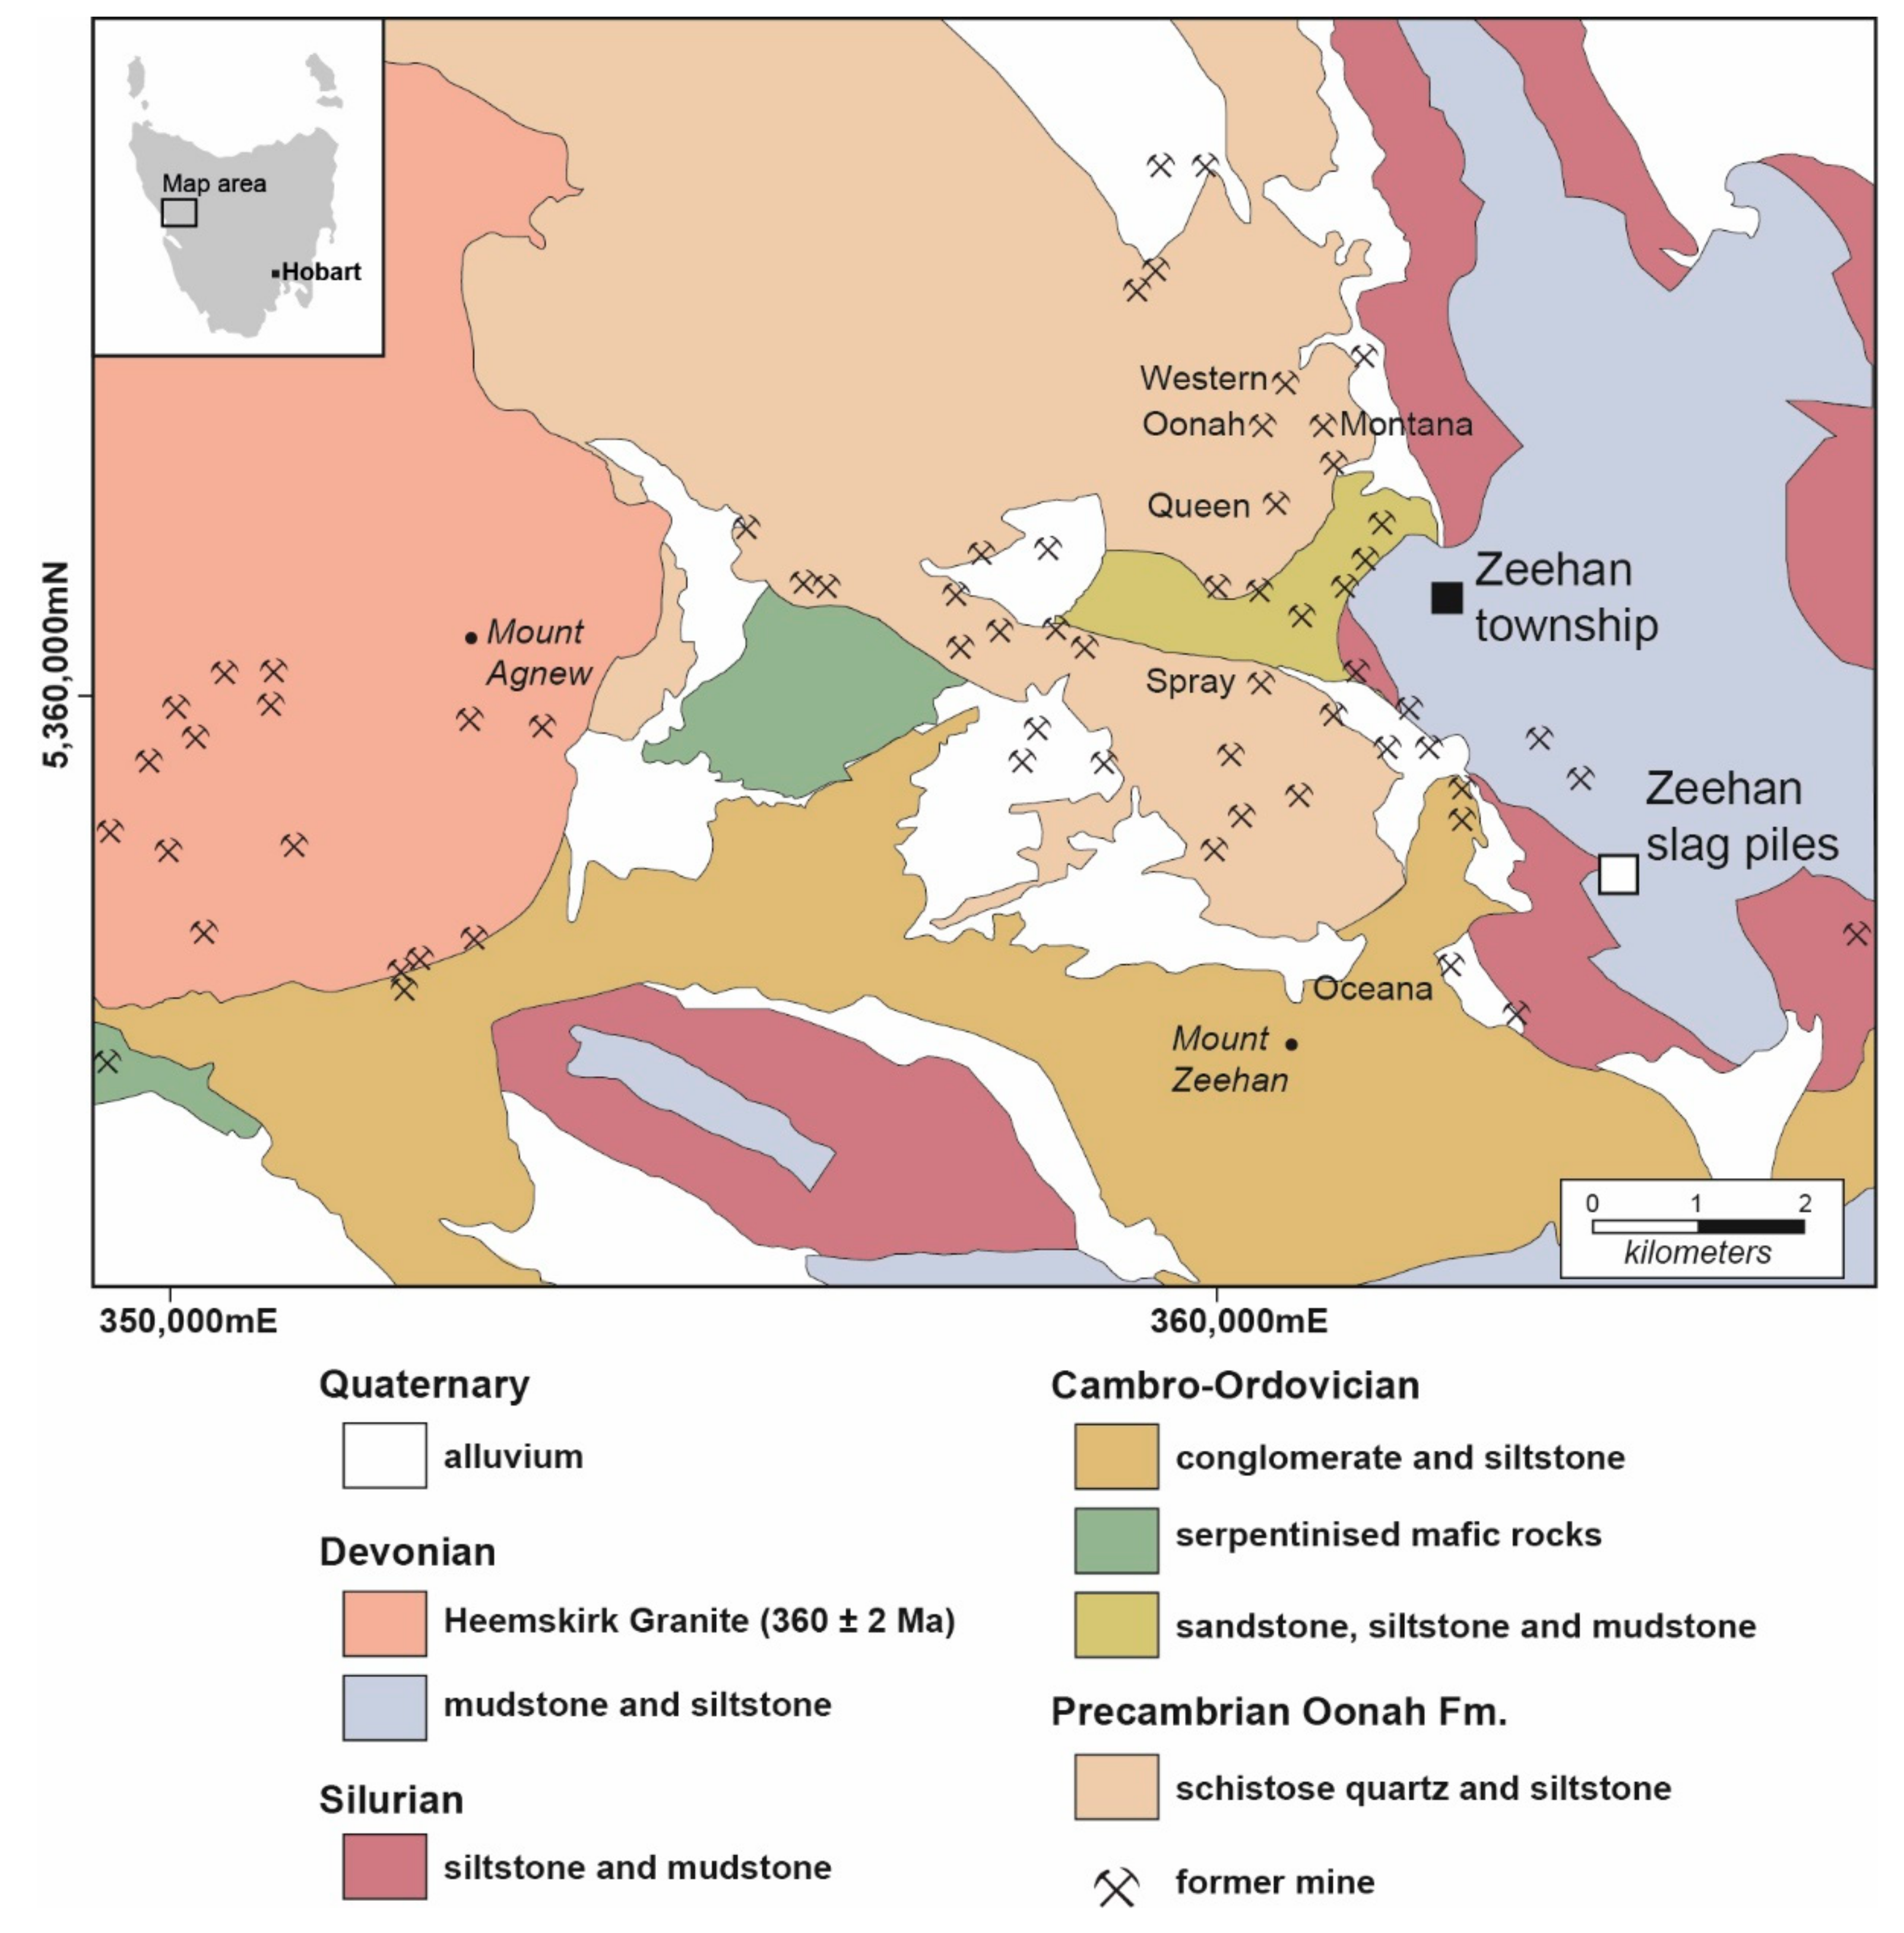
2.1. Local Geology
2.2. Mineral Processing
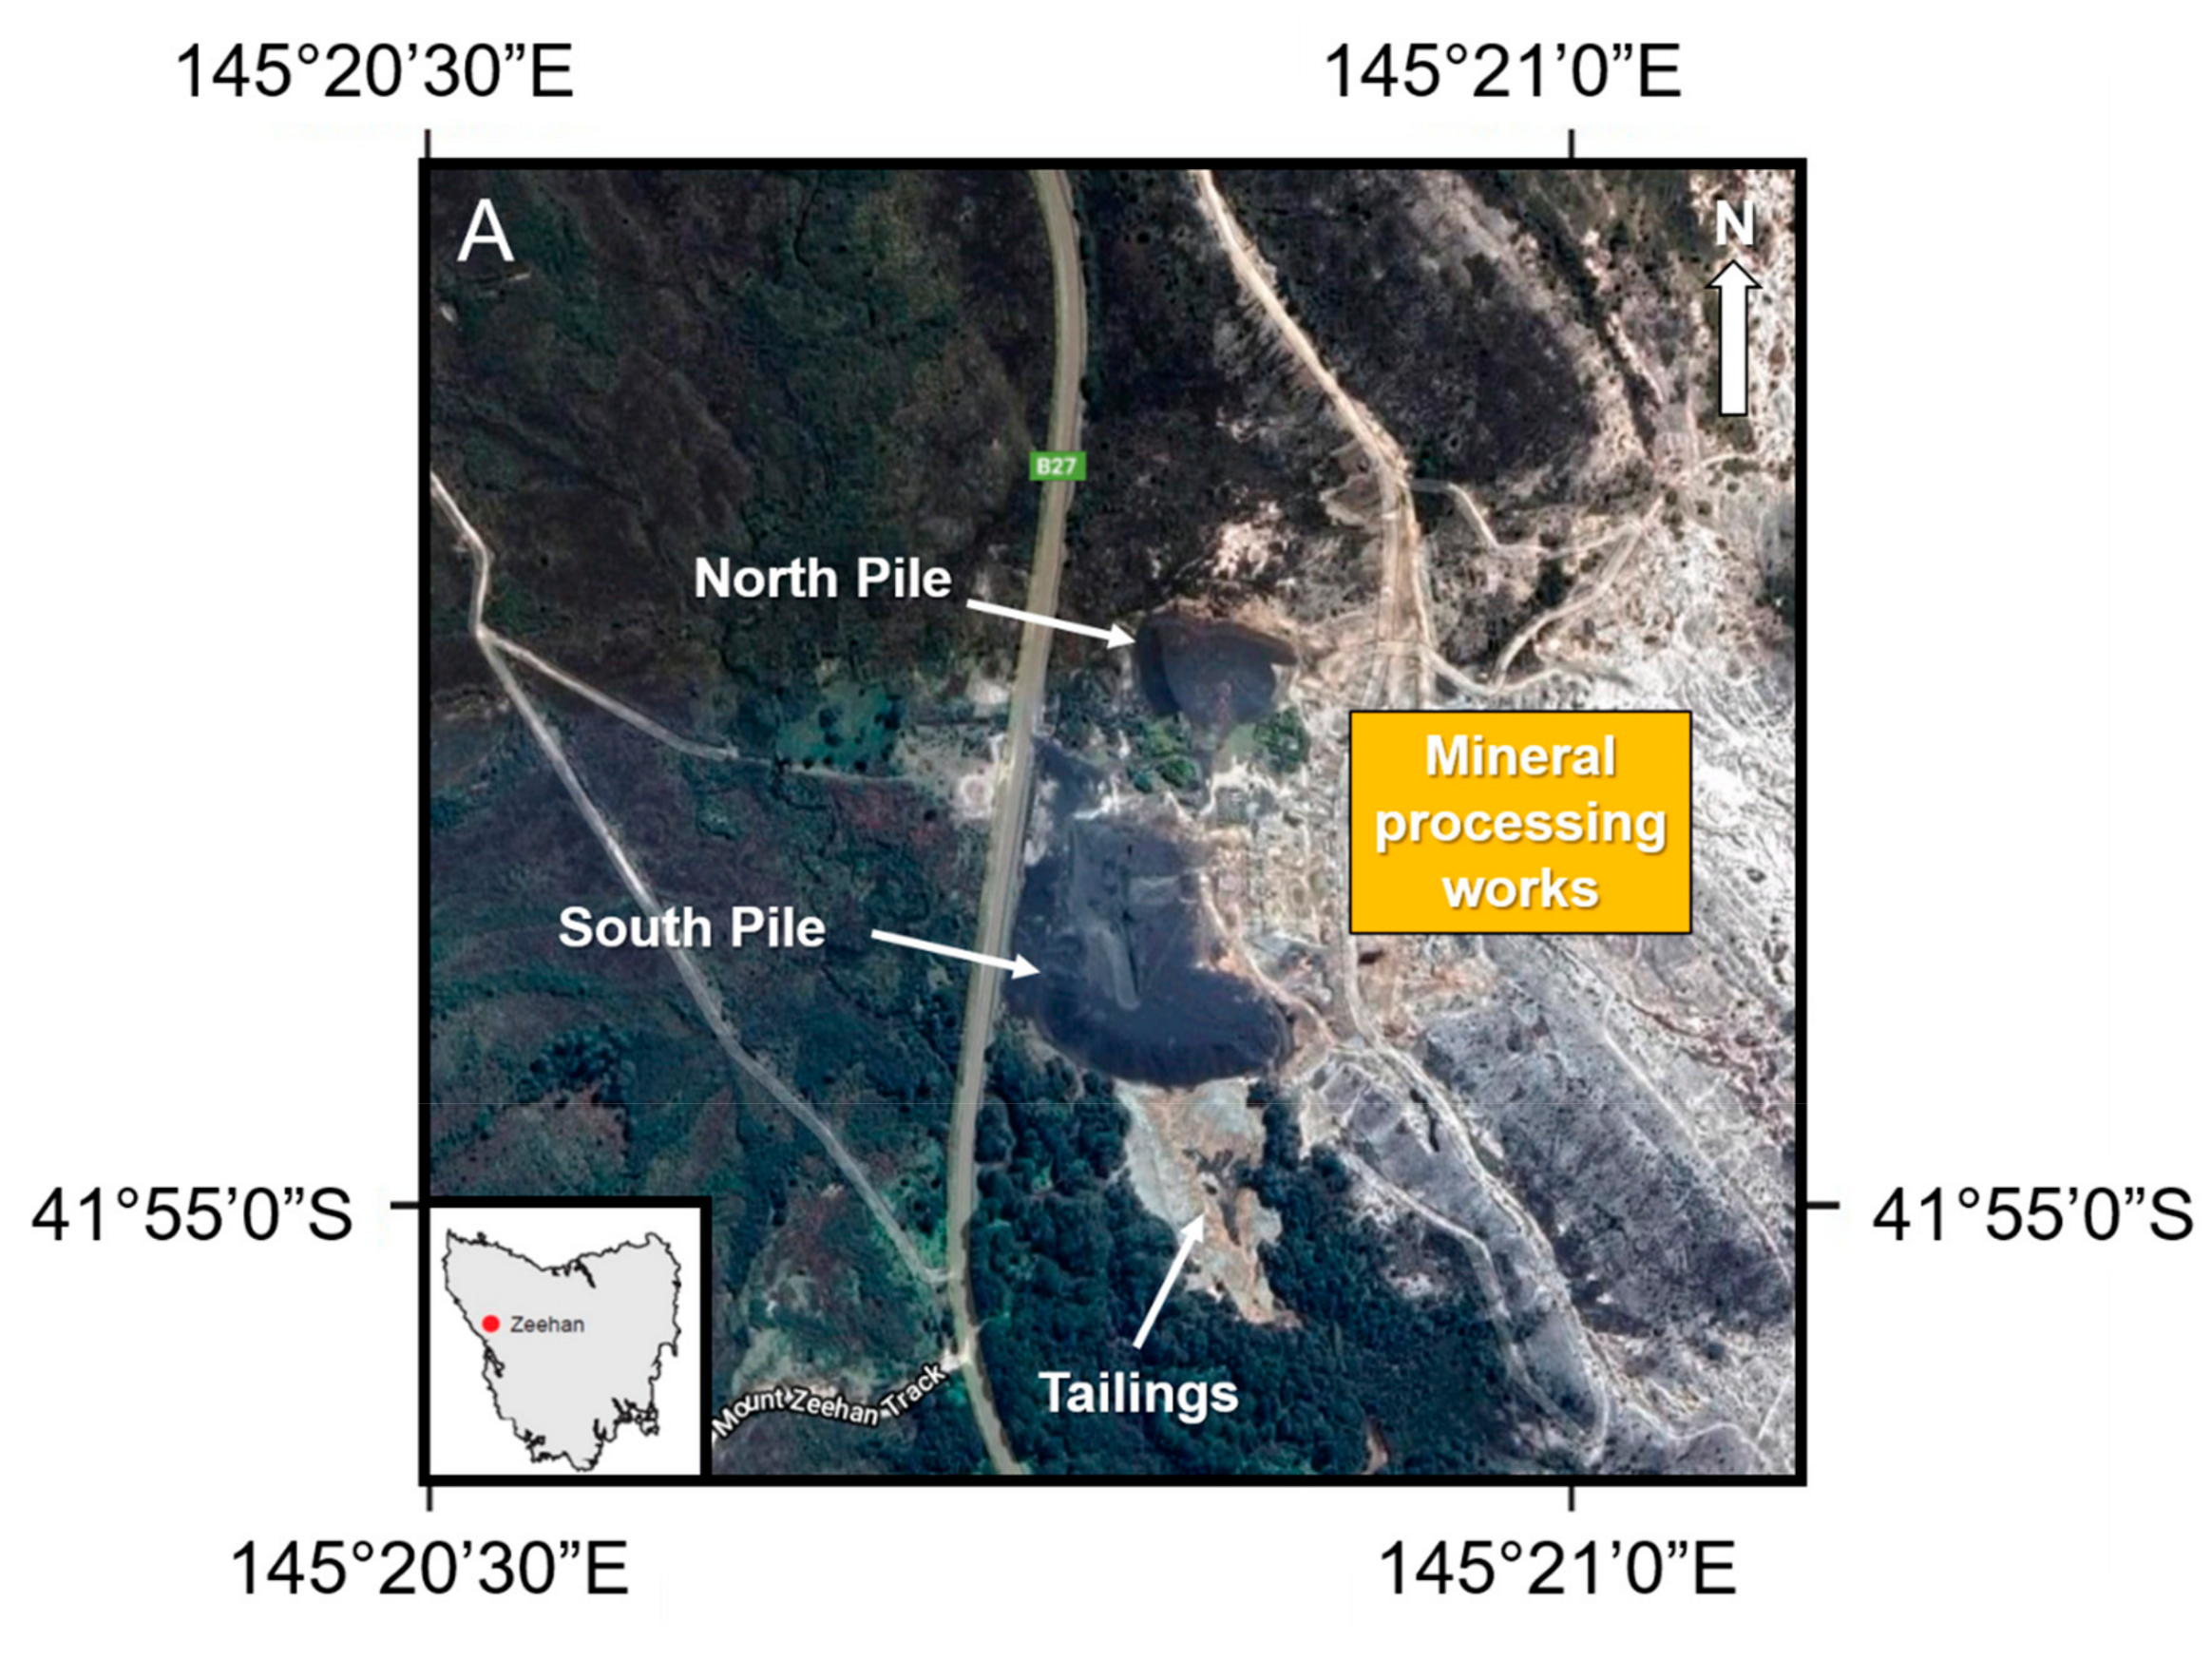
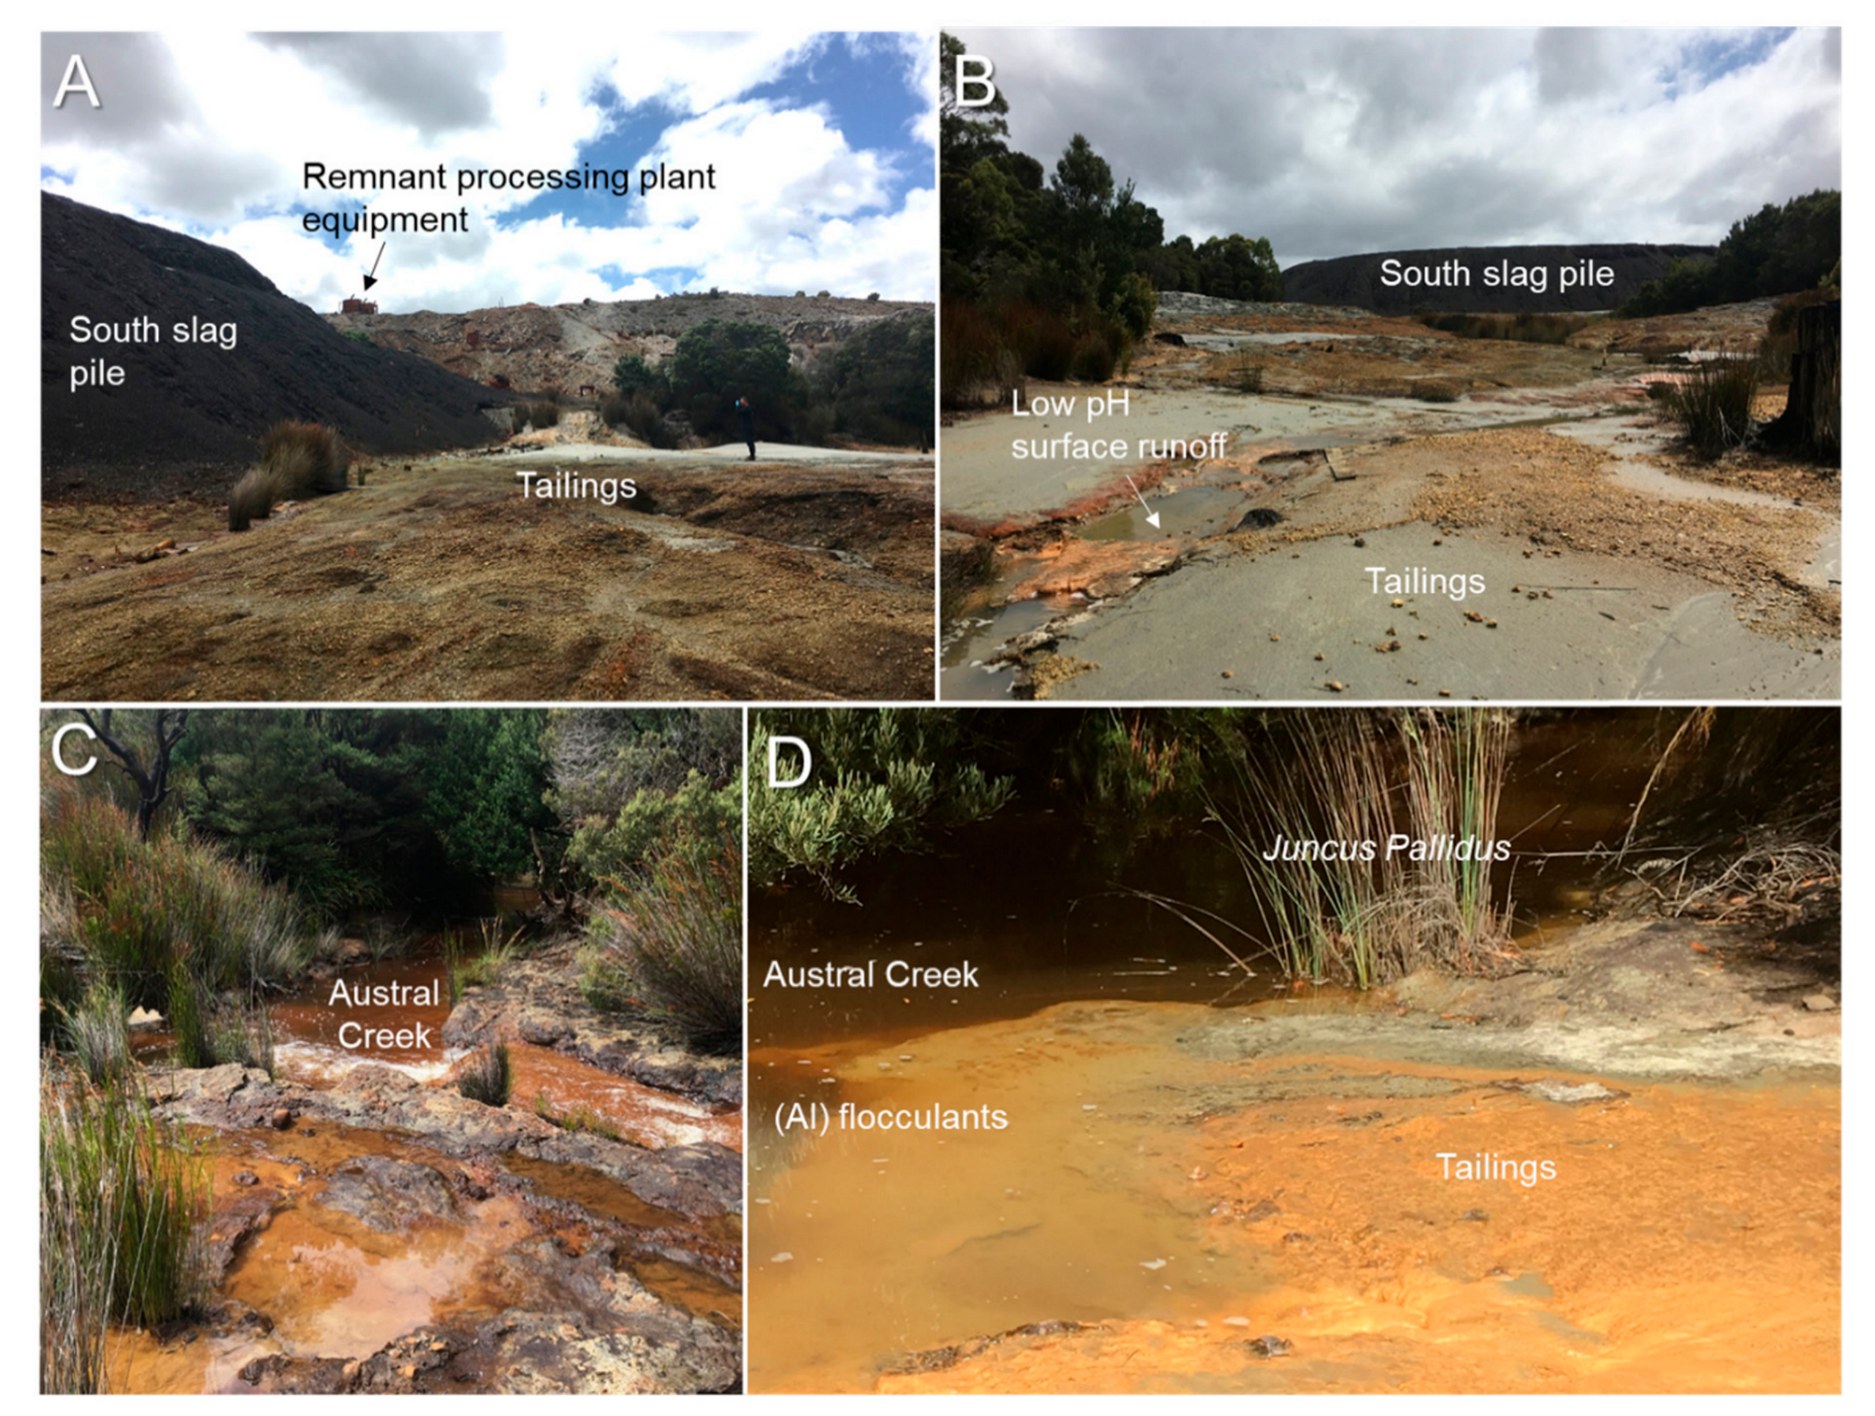
2.3. Site Description
3. Materials and Methods
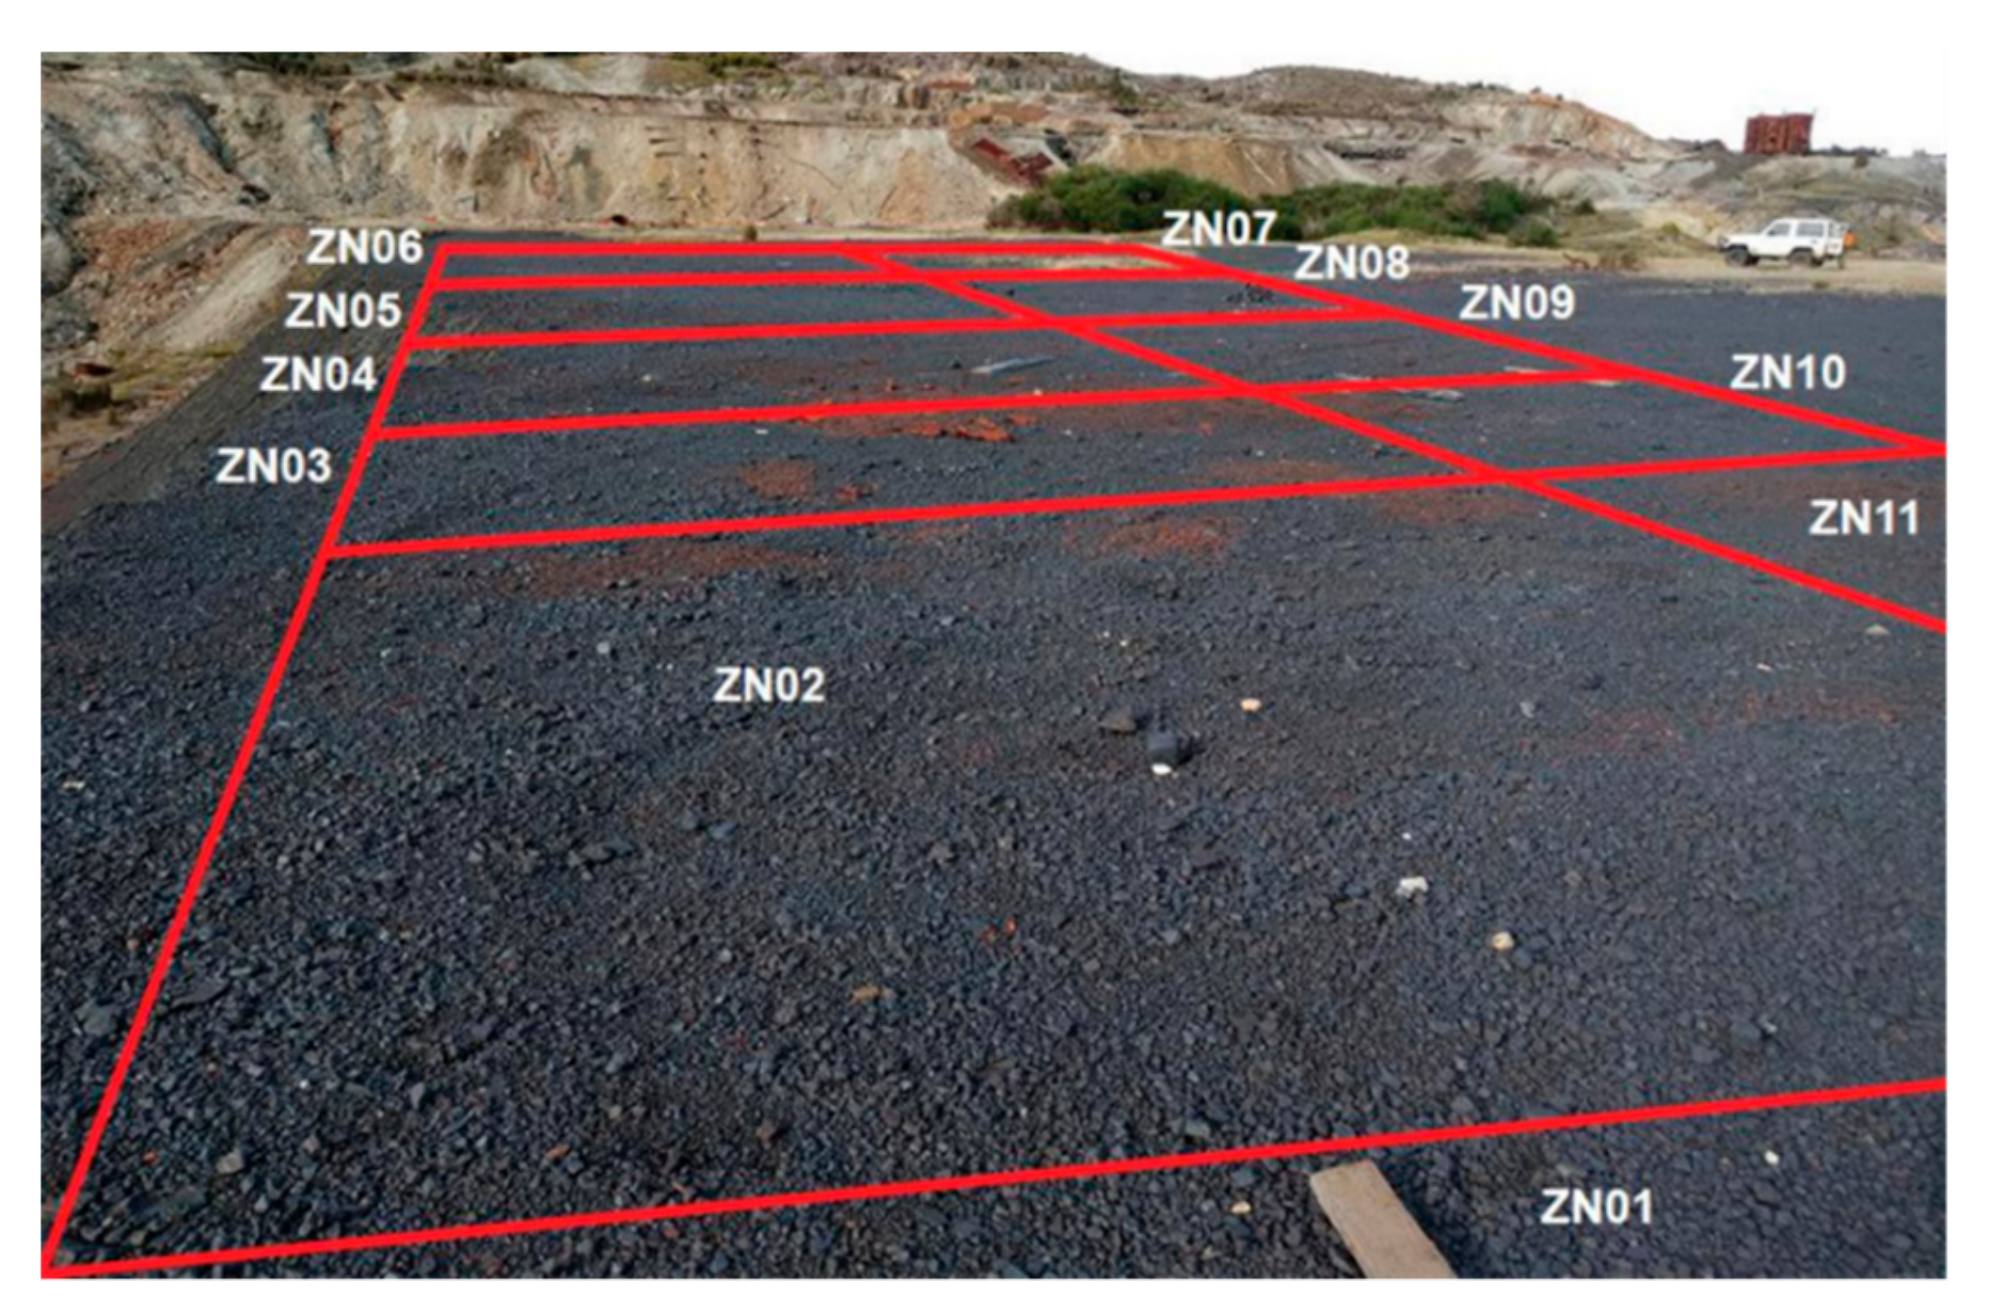
3.1. Sampling and Sample Preparation
3.2. X-Ray Diffractometry
3.3. Bulk Chemistry
3.4. Static and Leach Testing
3.4.1. Soluble Metals
3.4.2. Sulfide Oxidizable Fraction
3.4.3. Solution ICP-MS
3.5. Microscopy
3.6. Laser Ablation ICPMS
4. Results
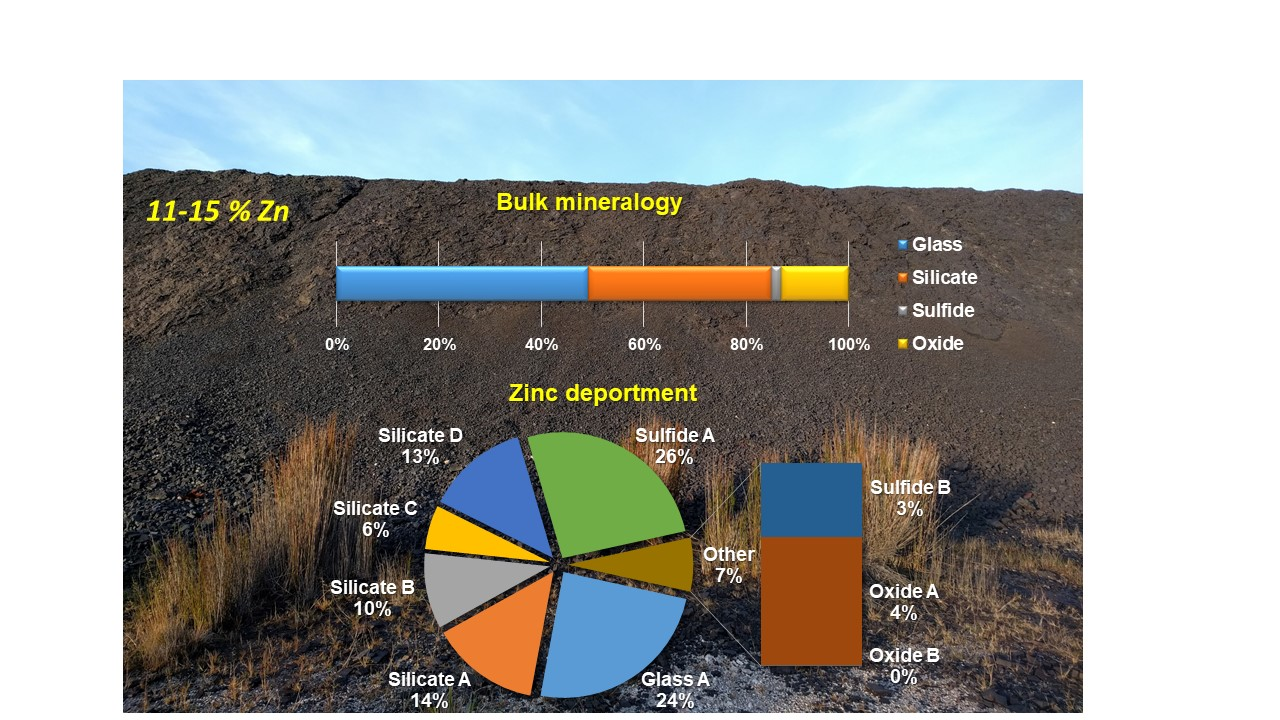
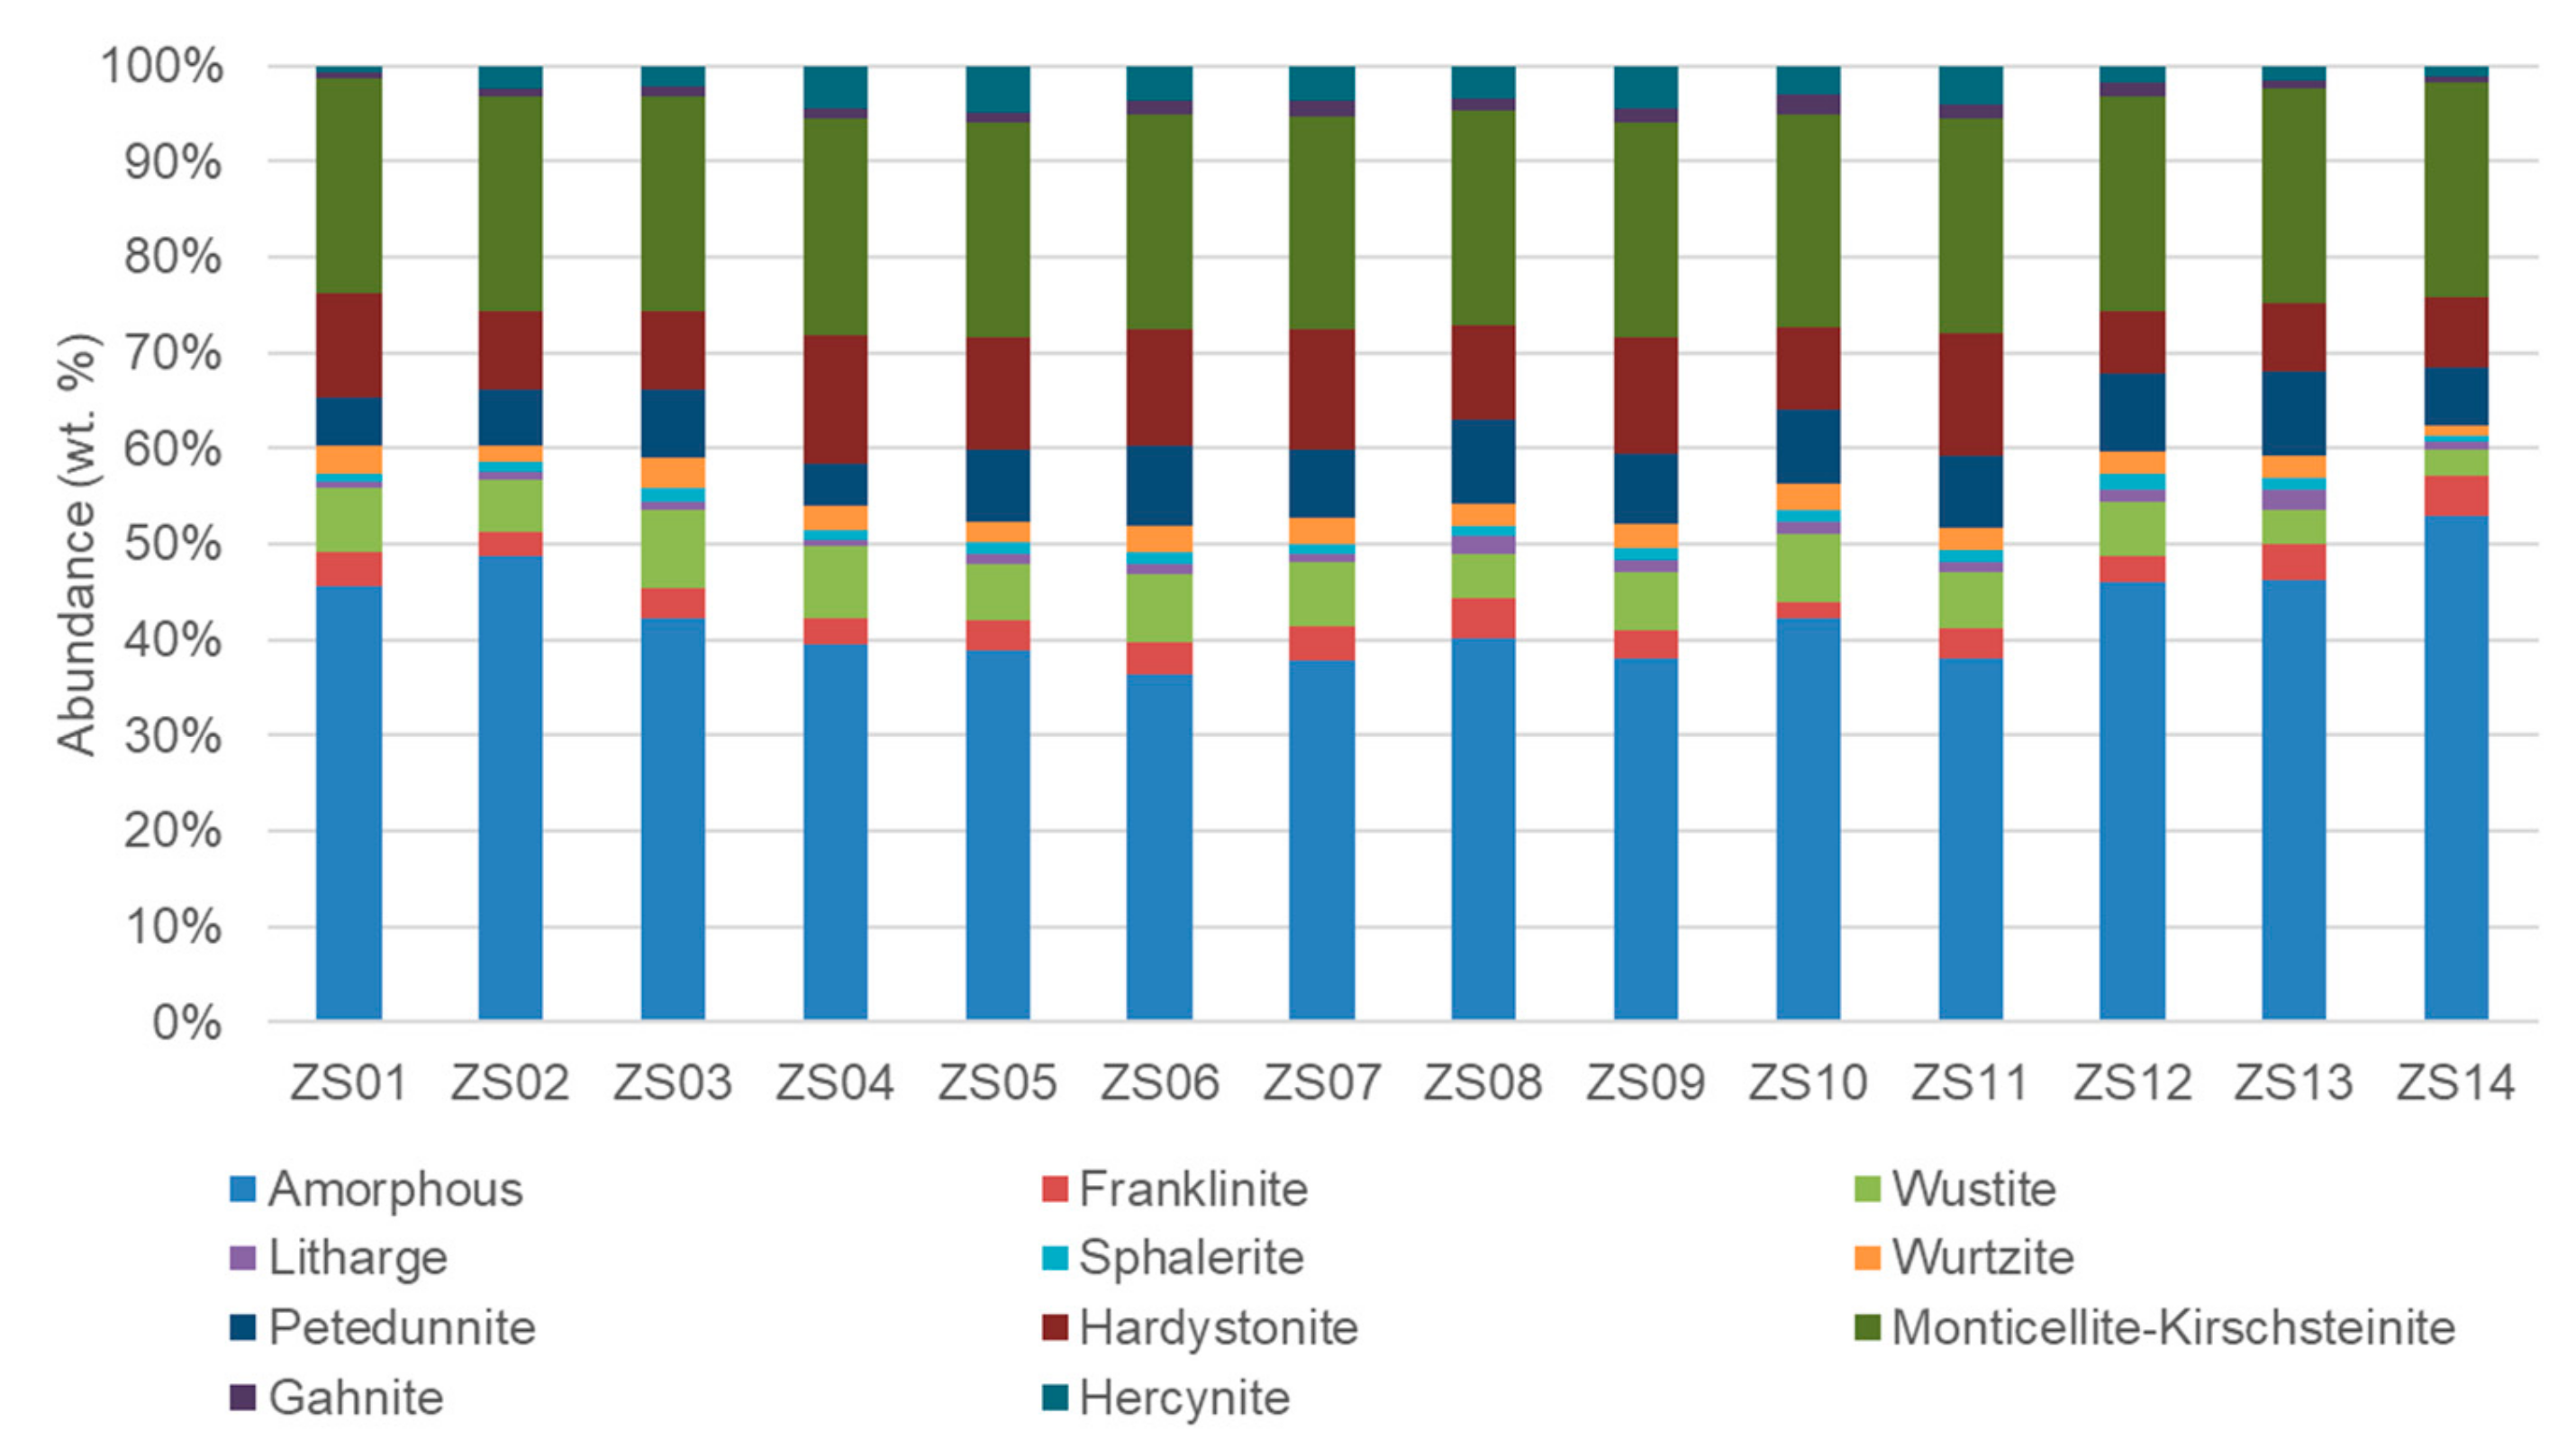
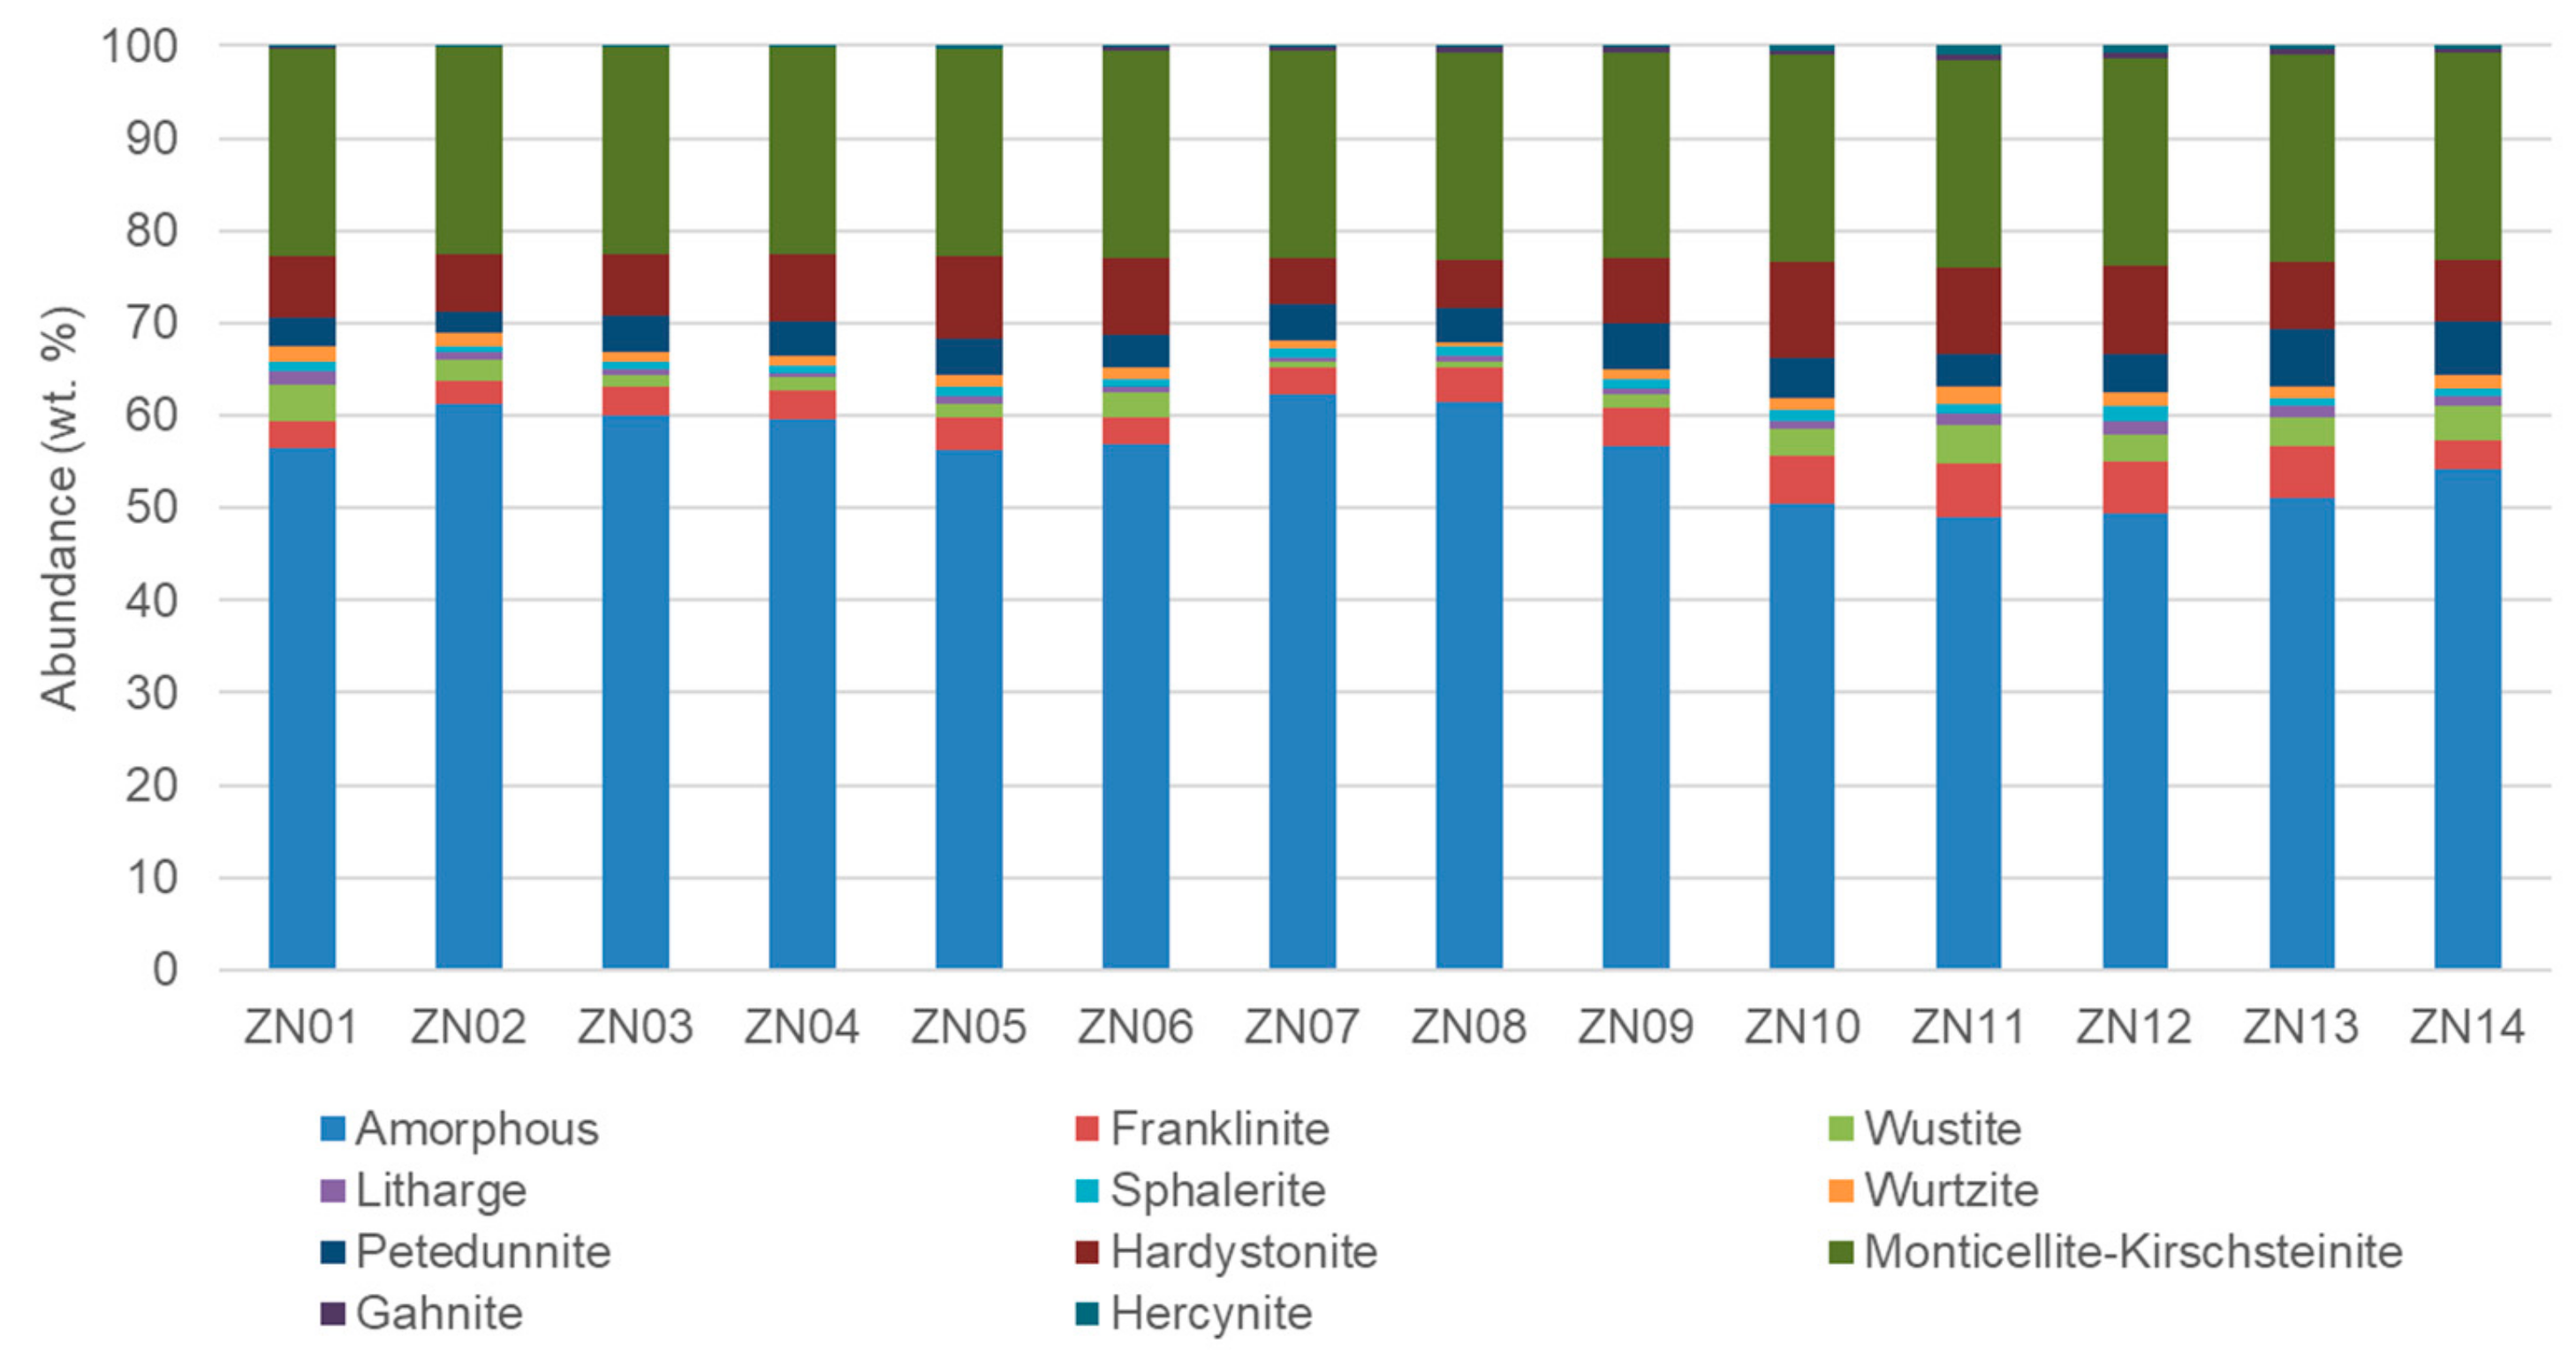
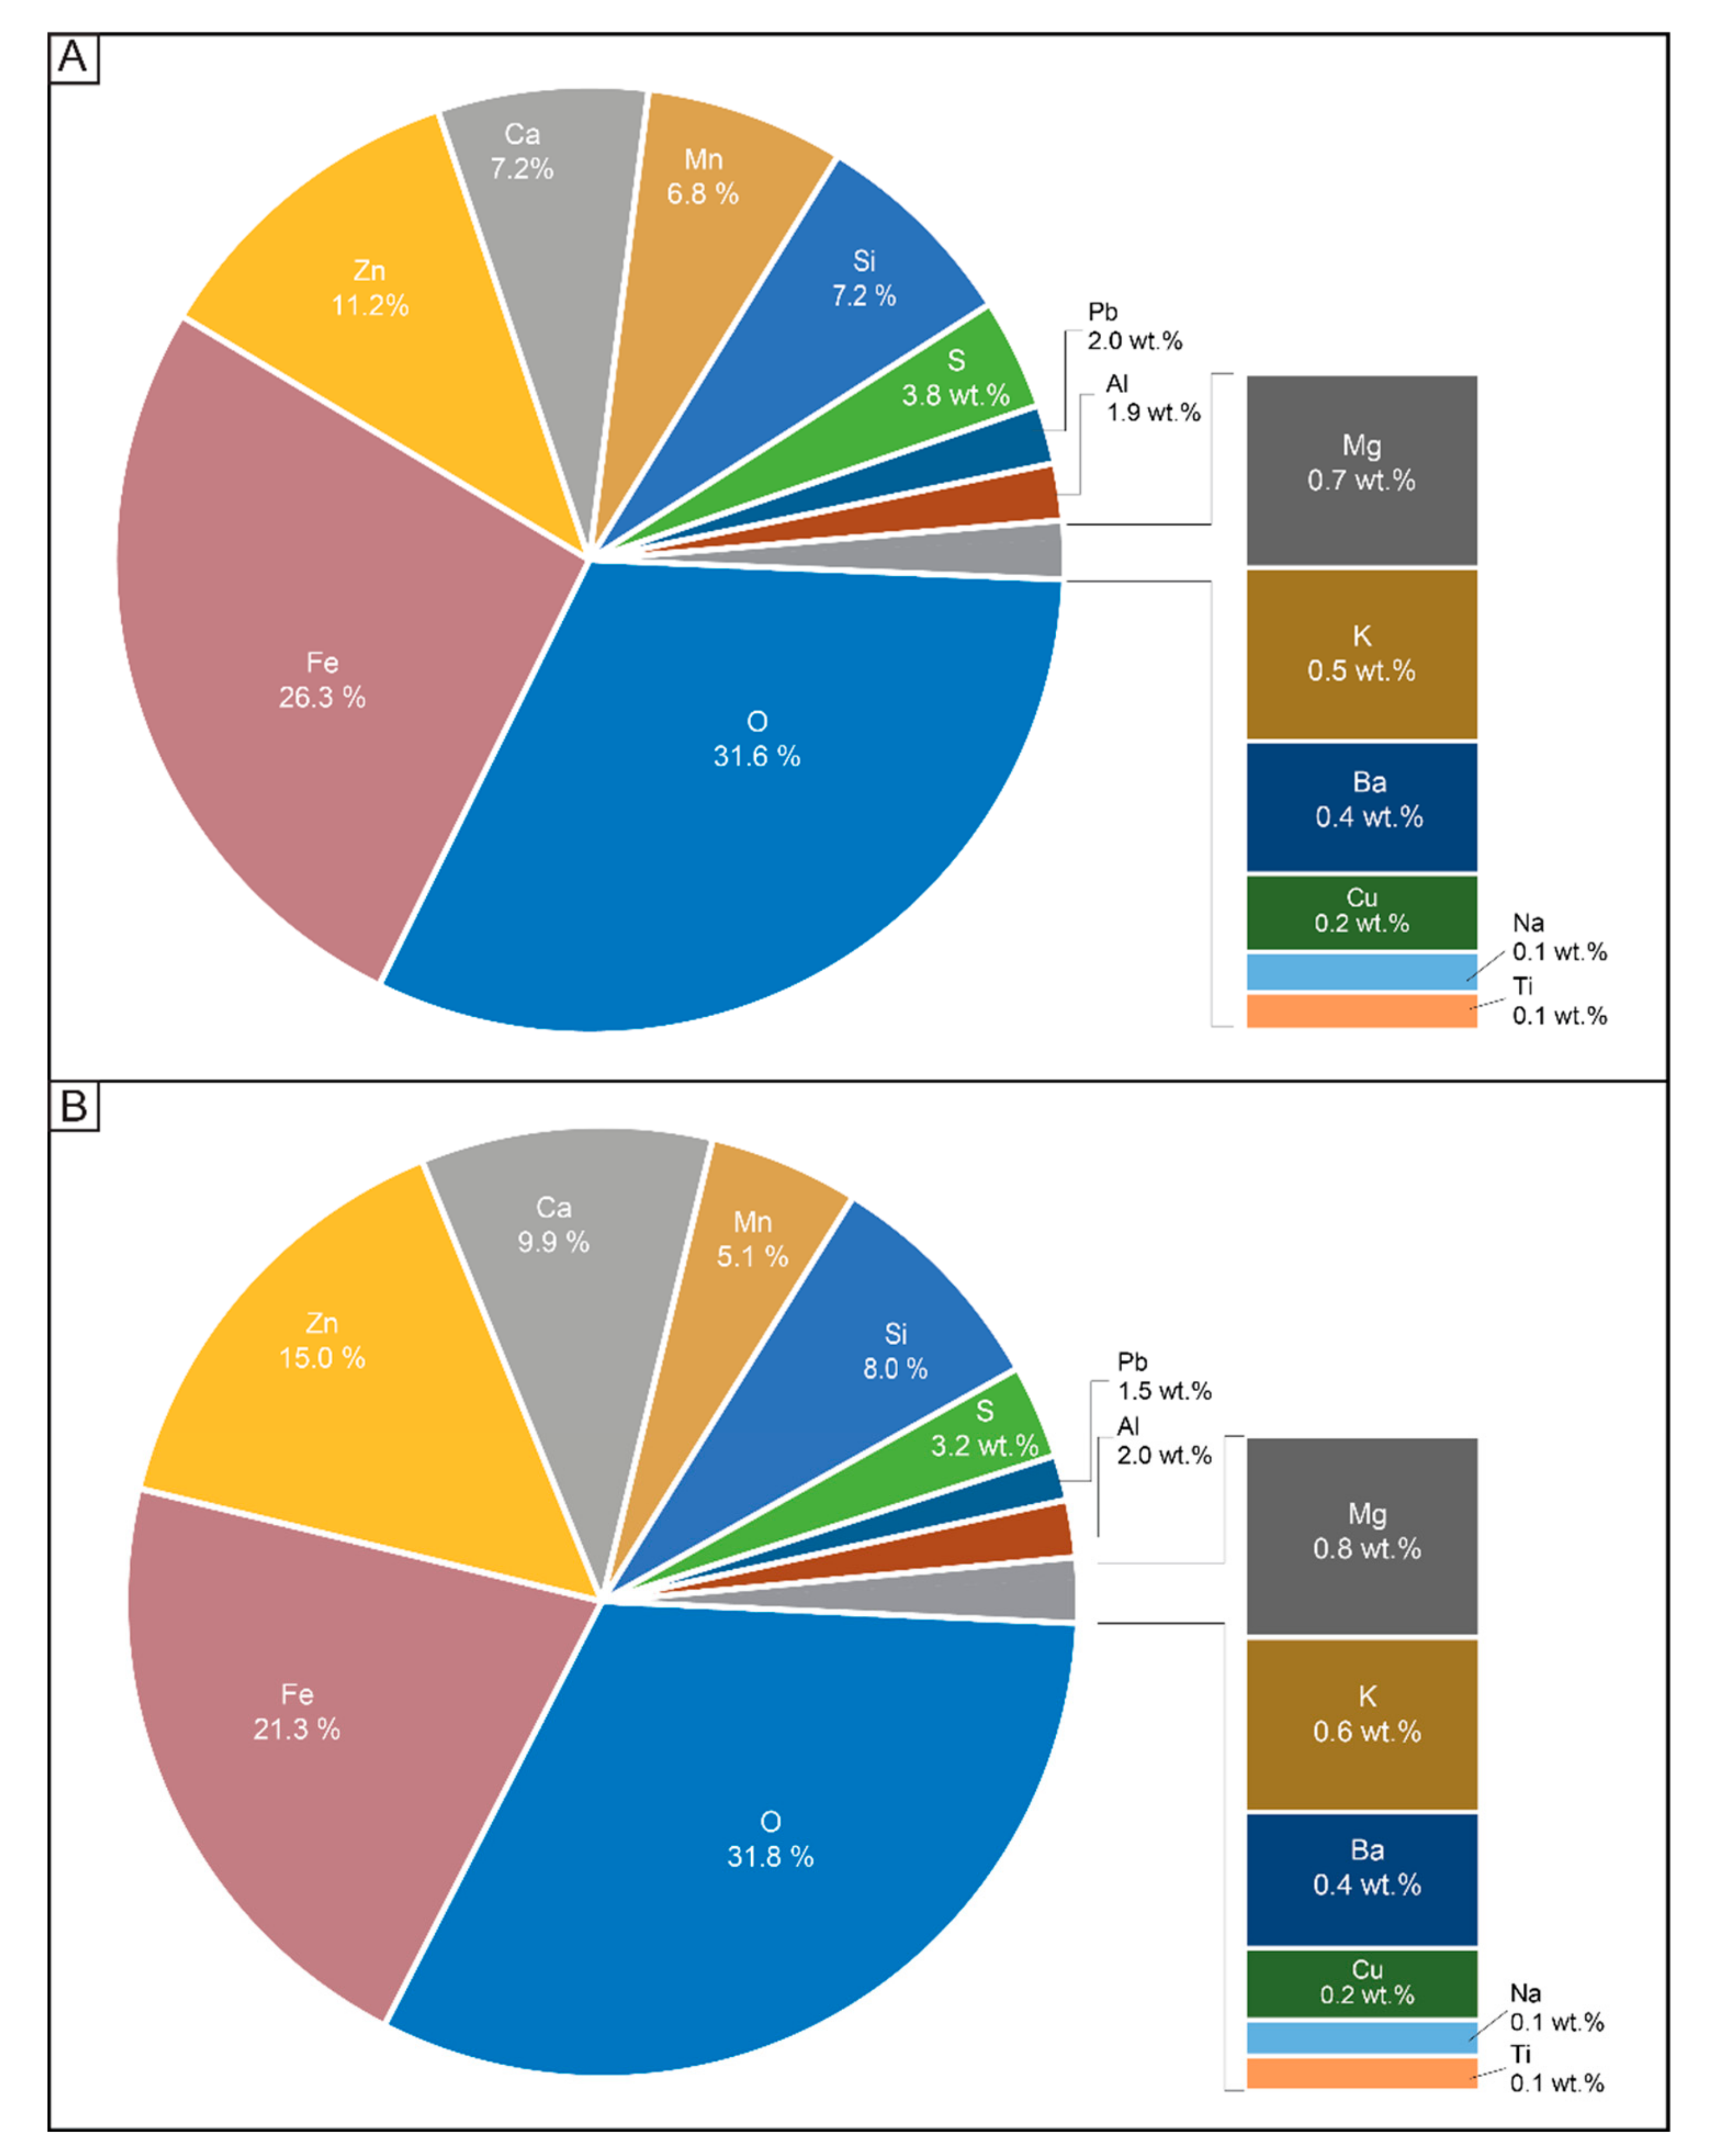
4.1. Bulk Properties
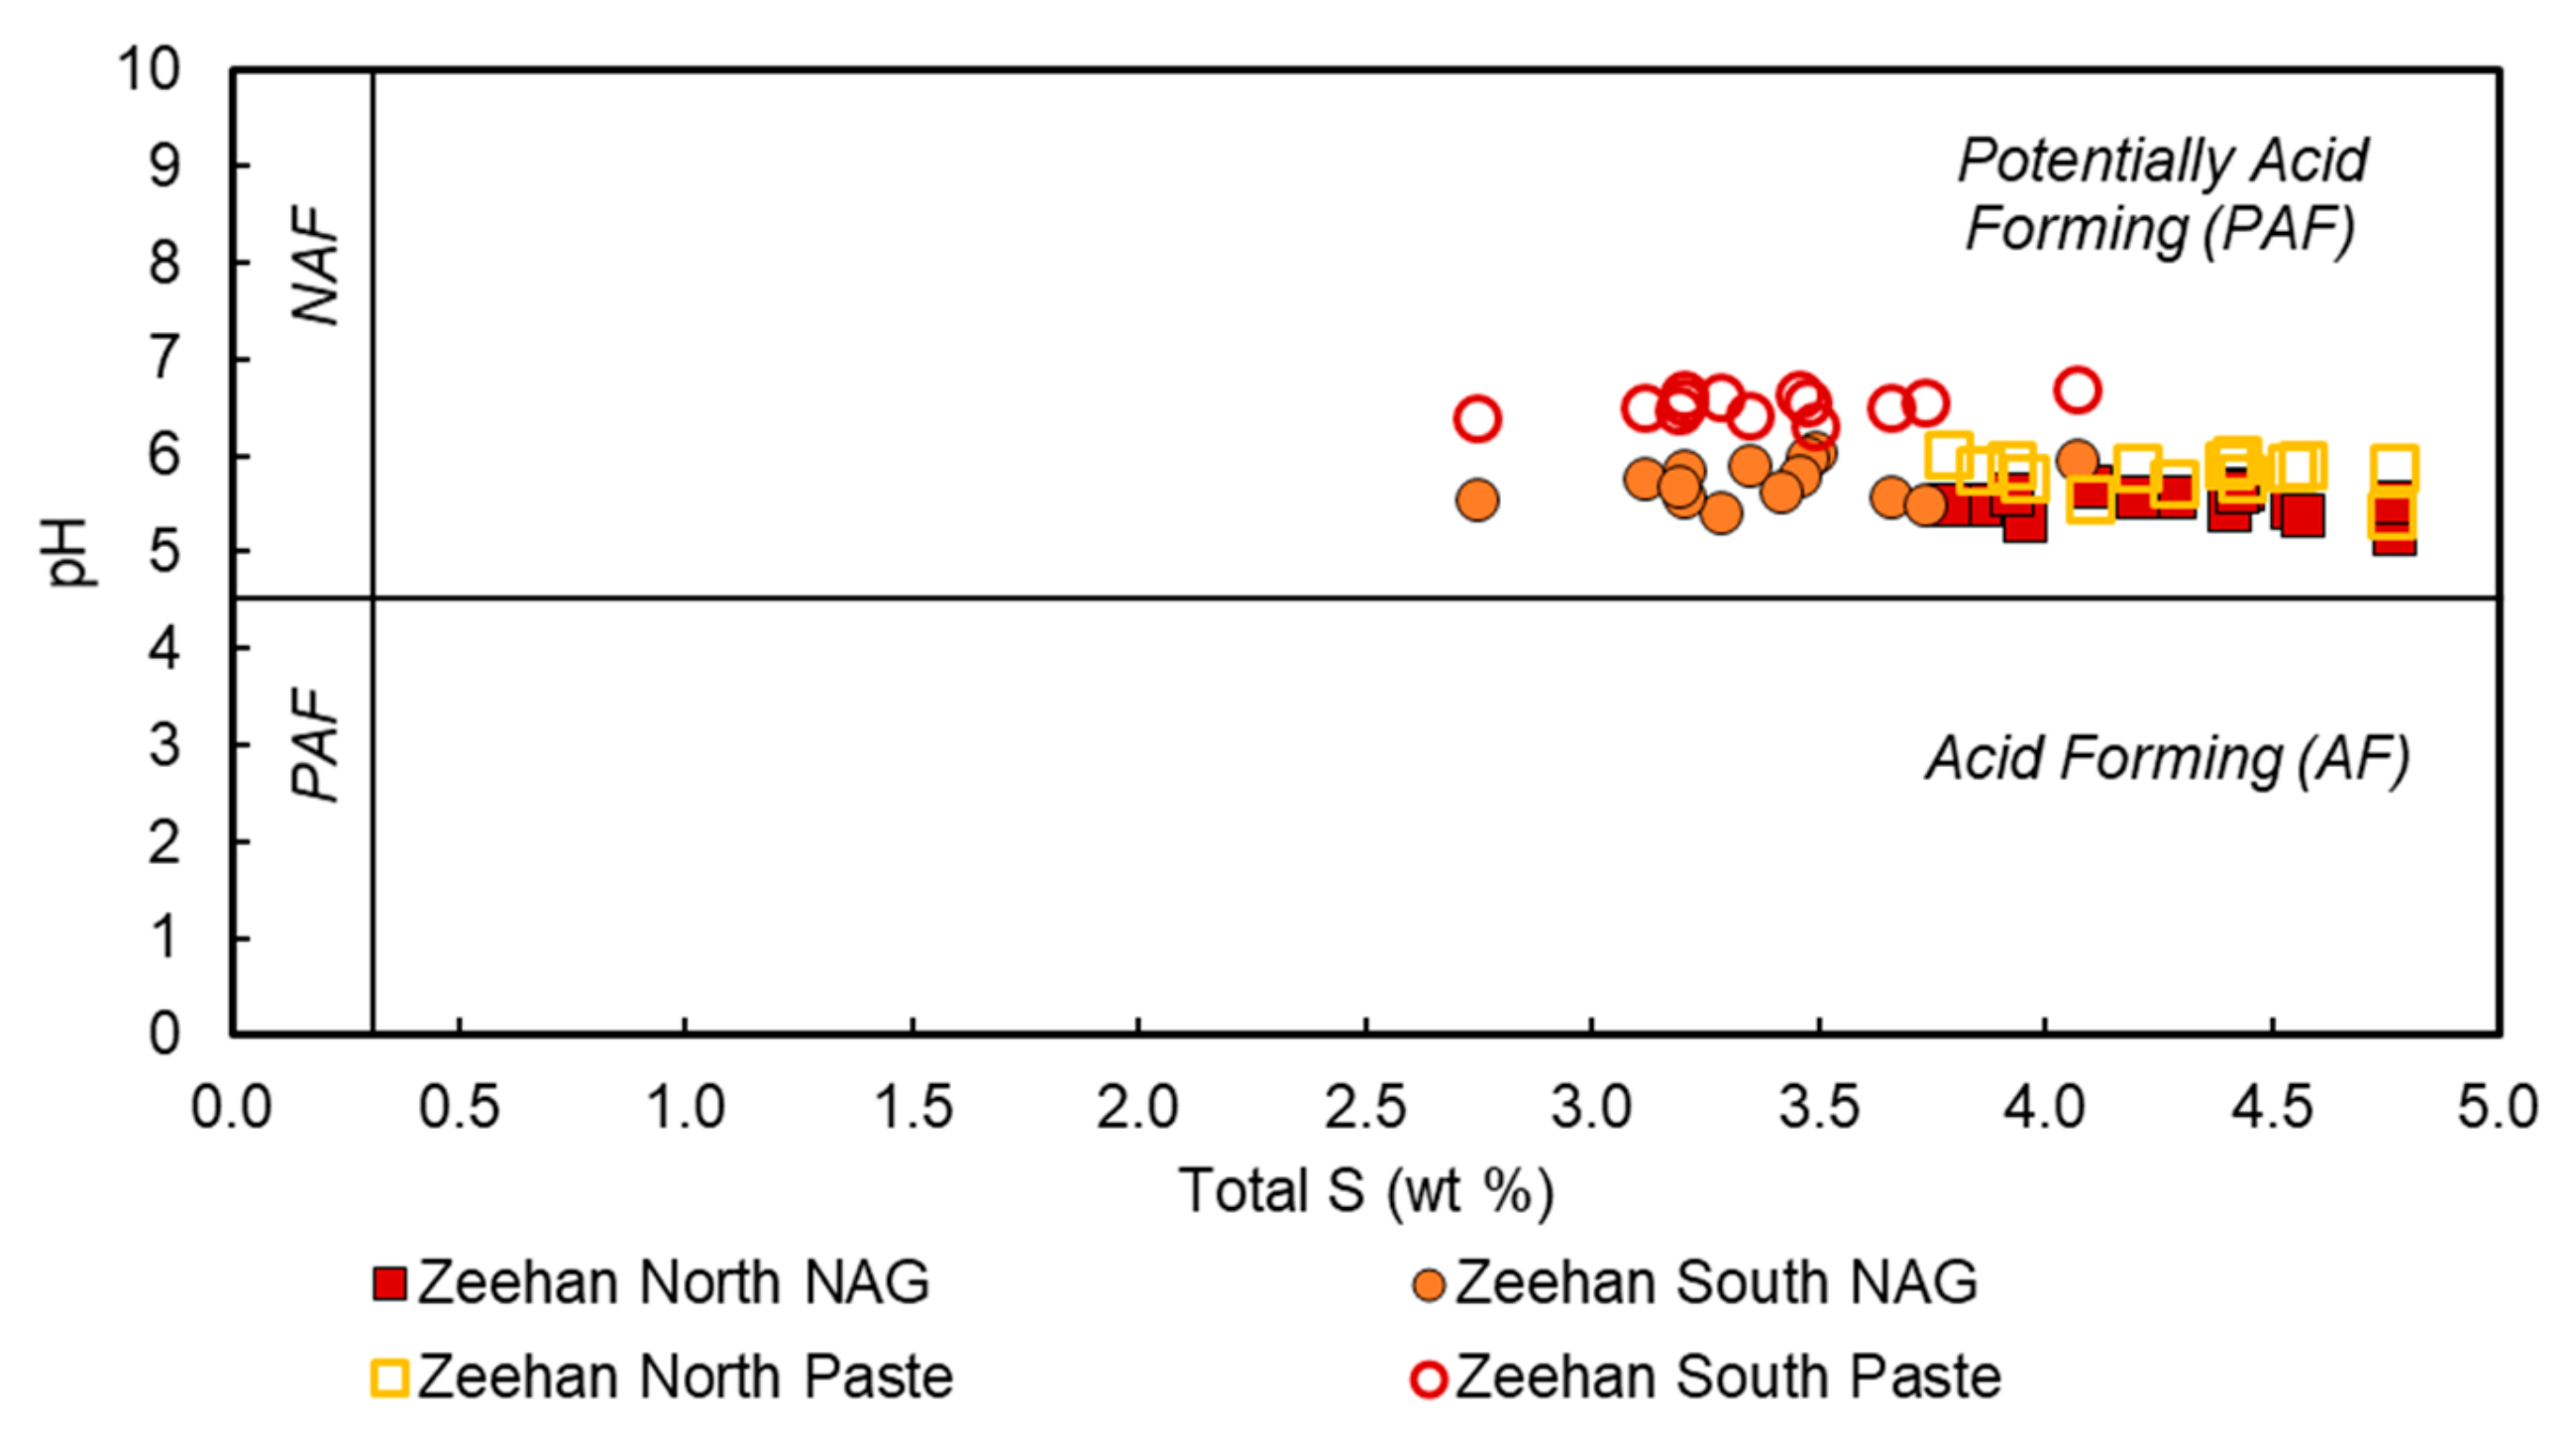
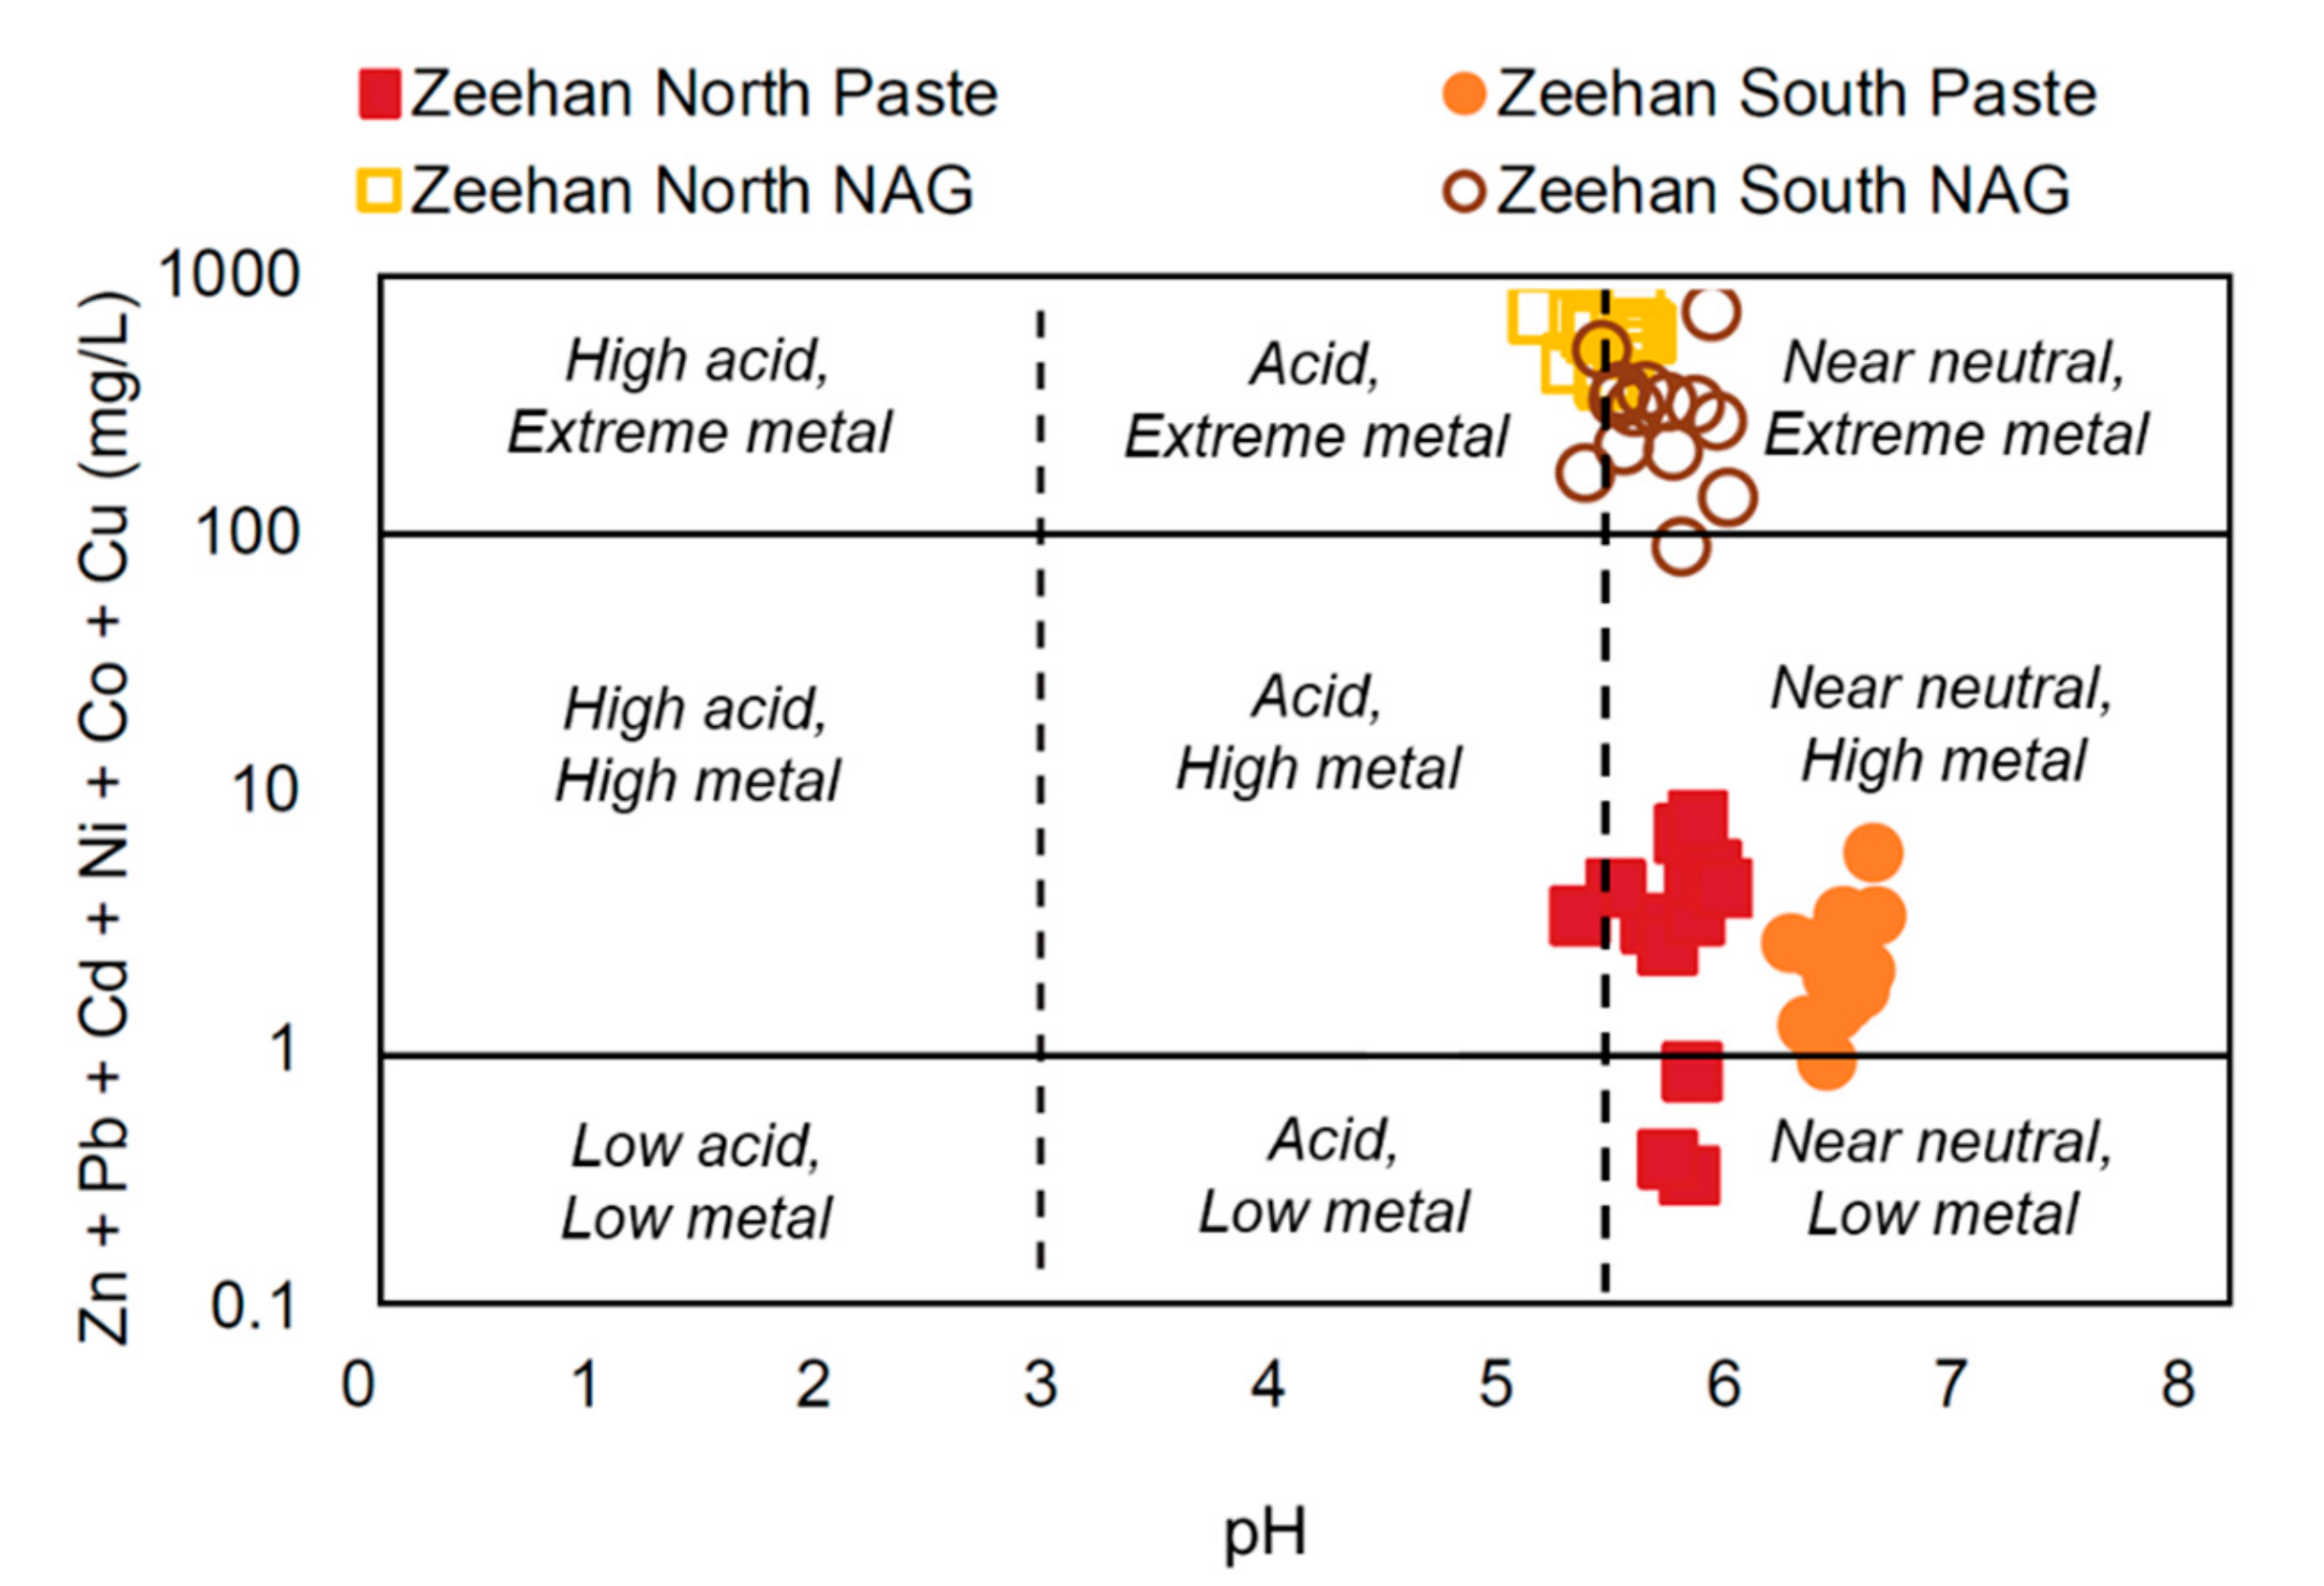
4.2. Geo-Environmental Classification
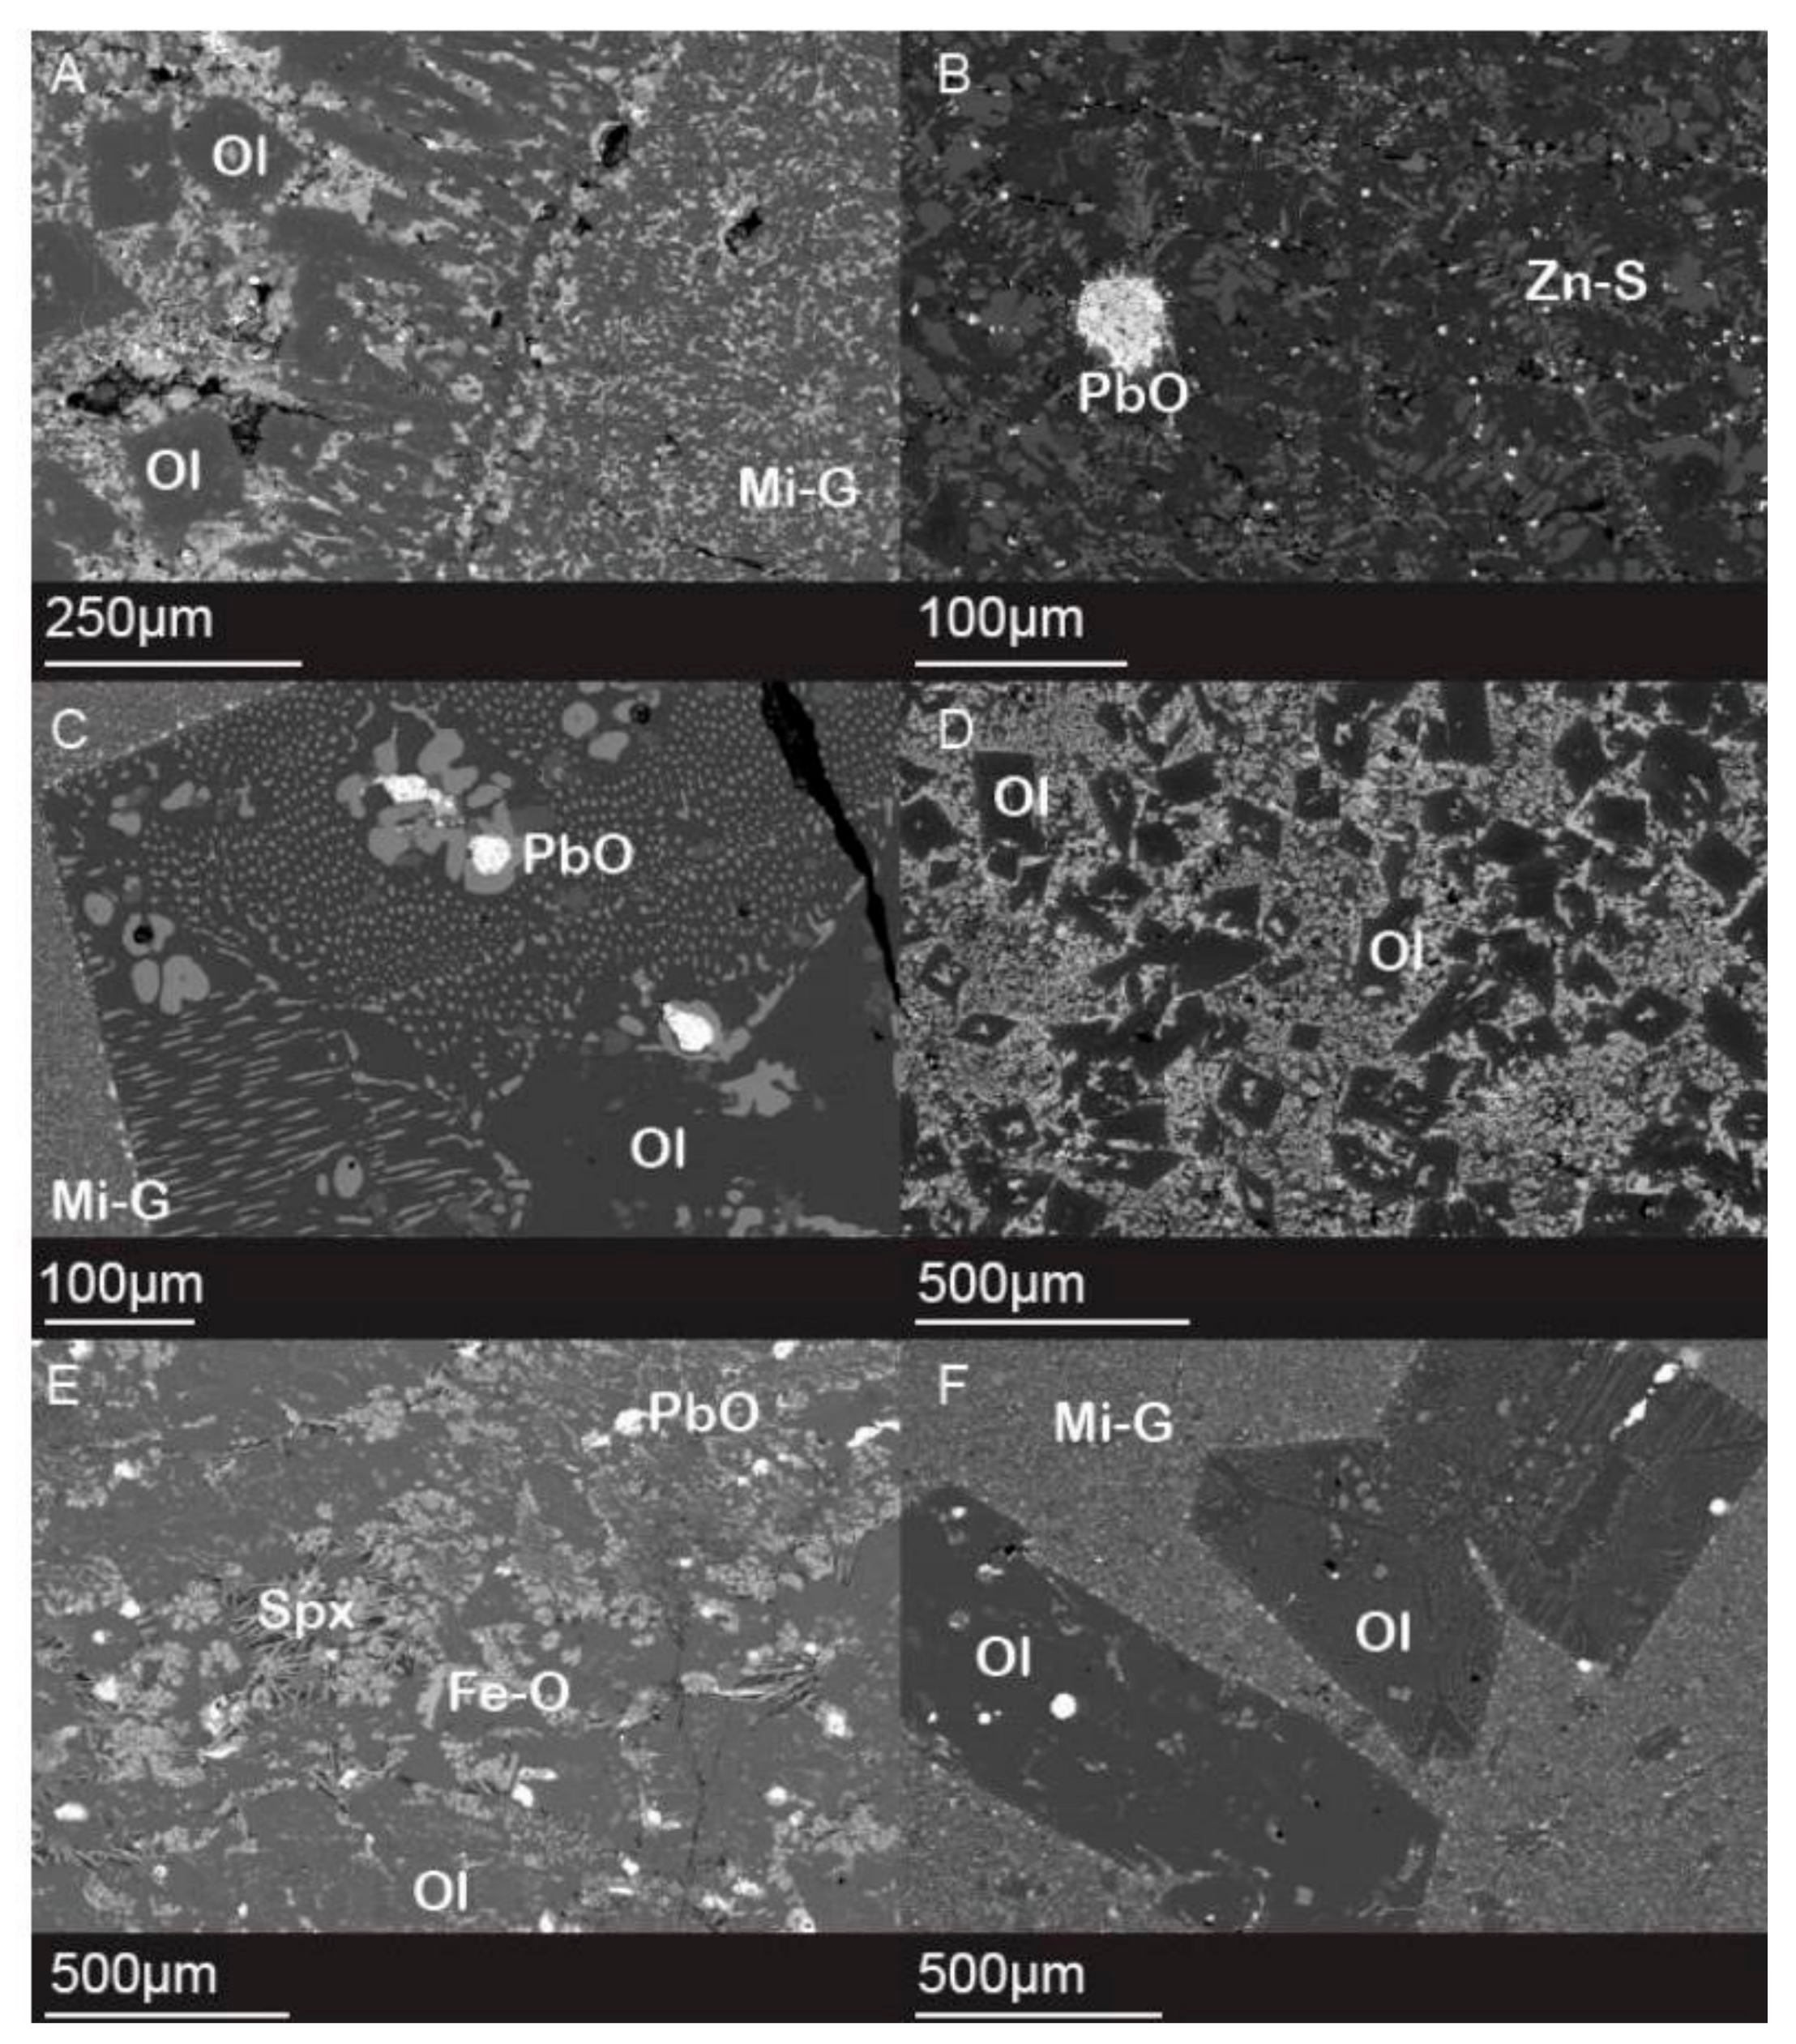
4.3. Microtextures
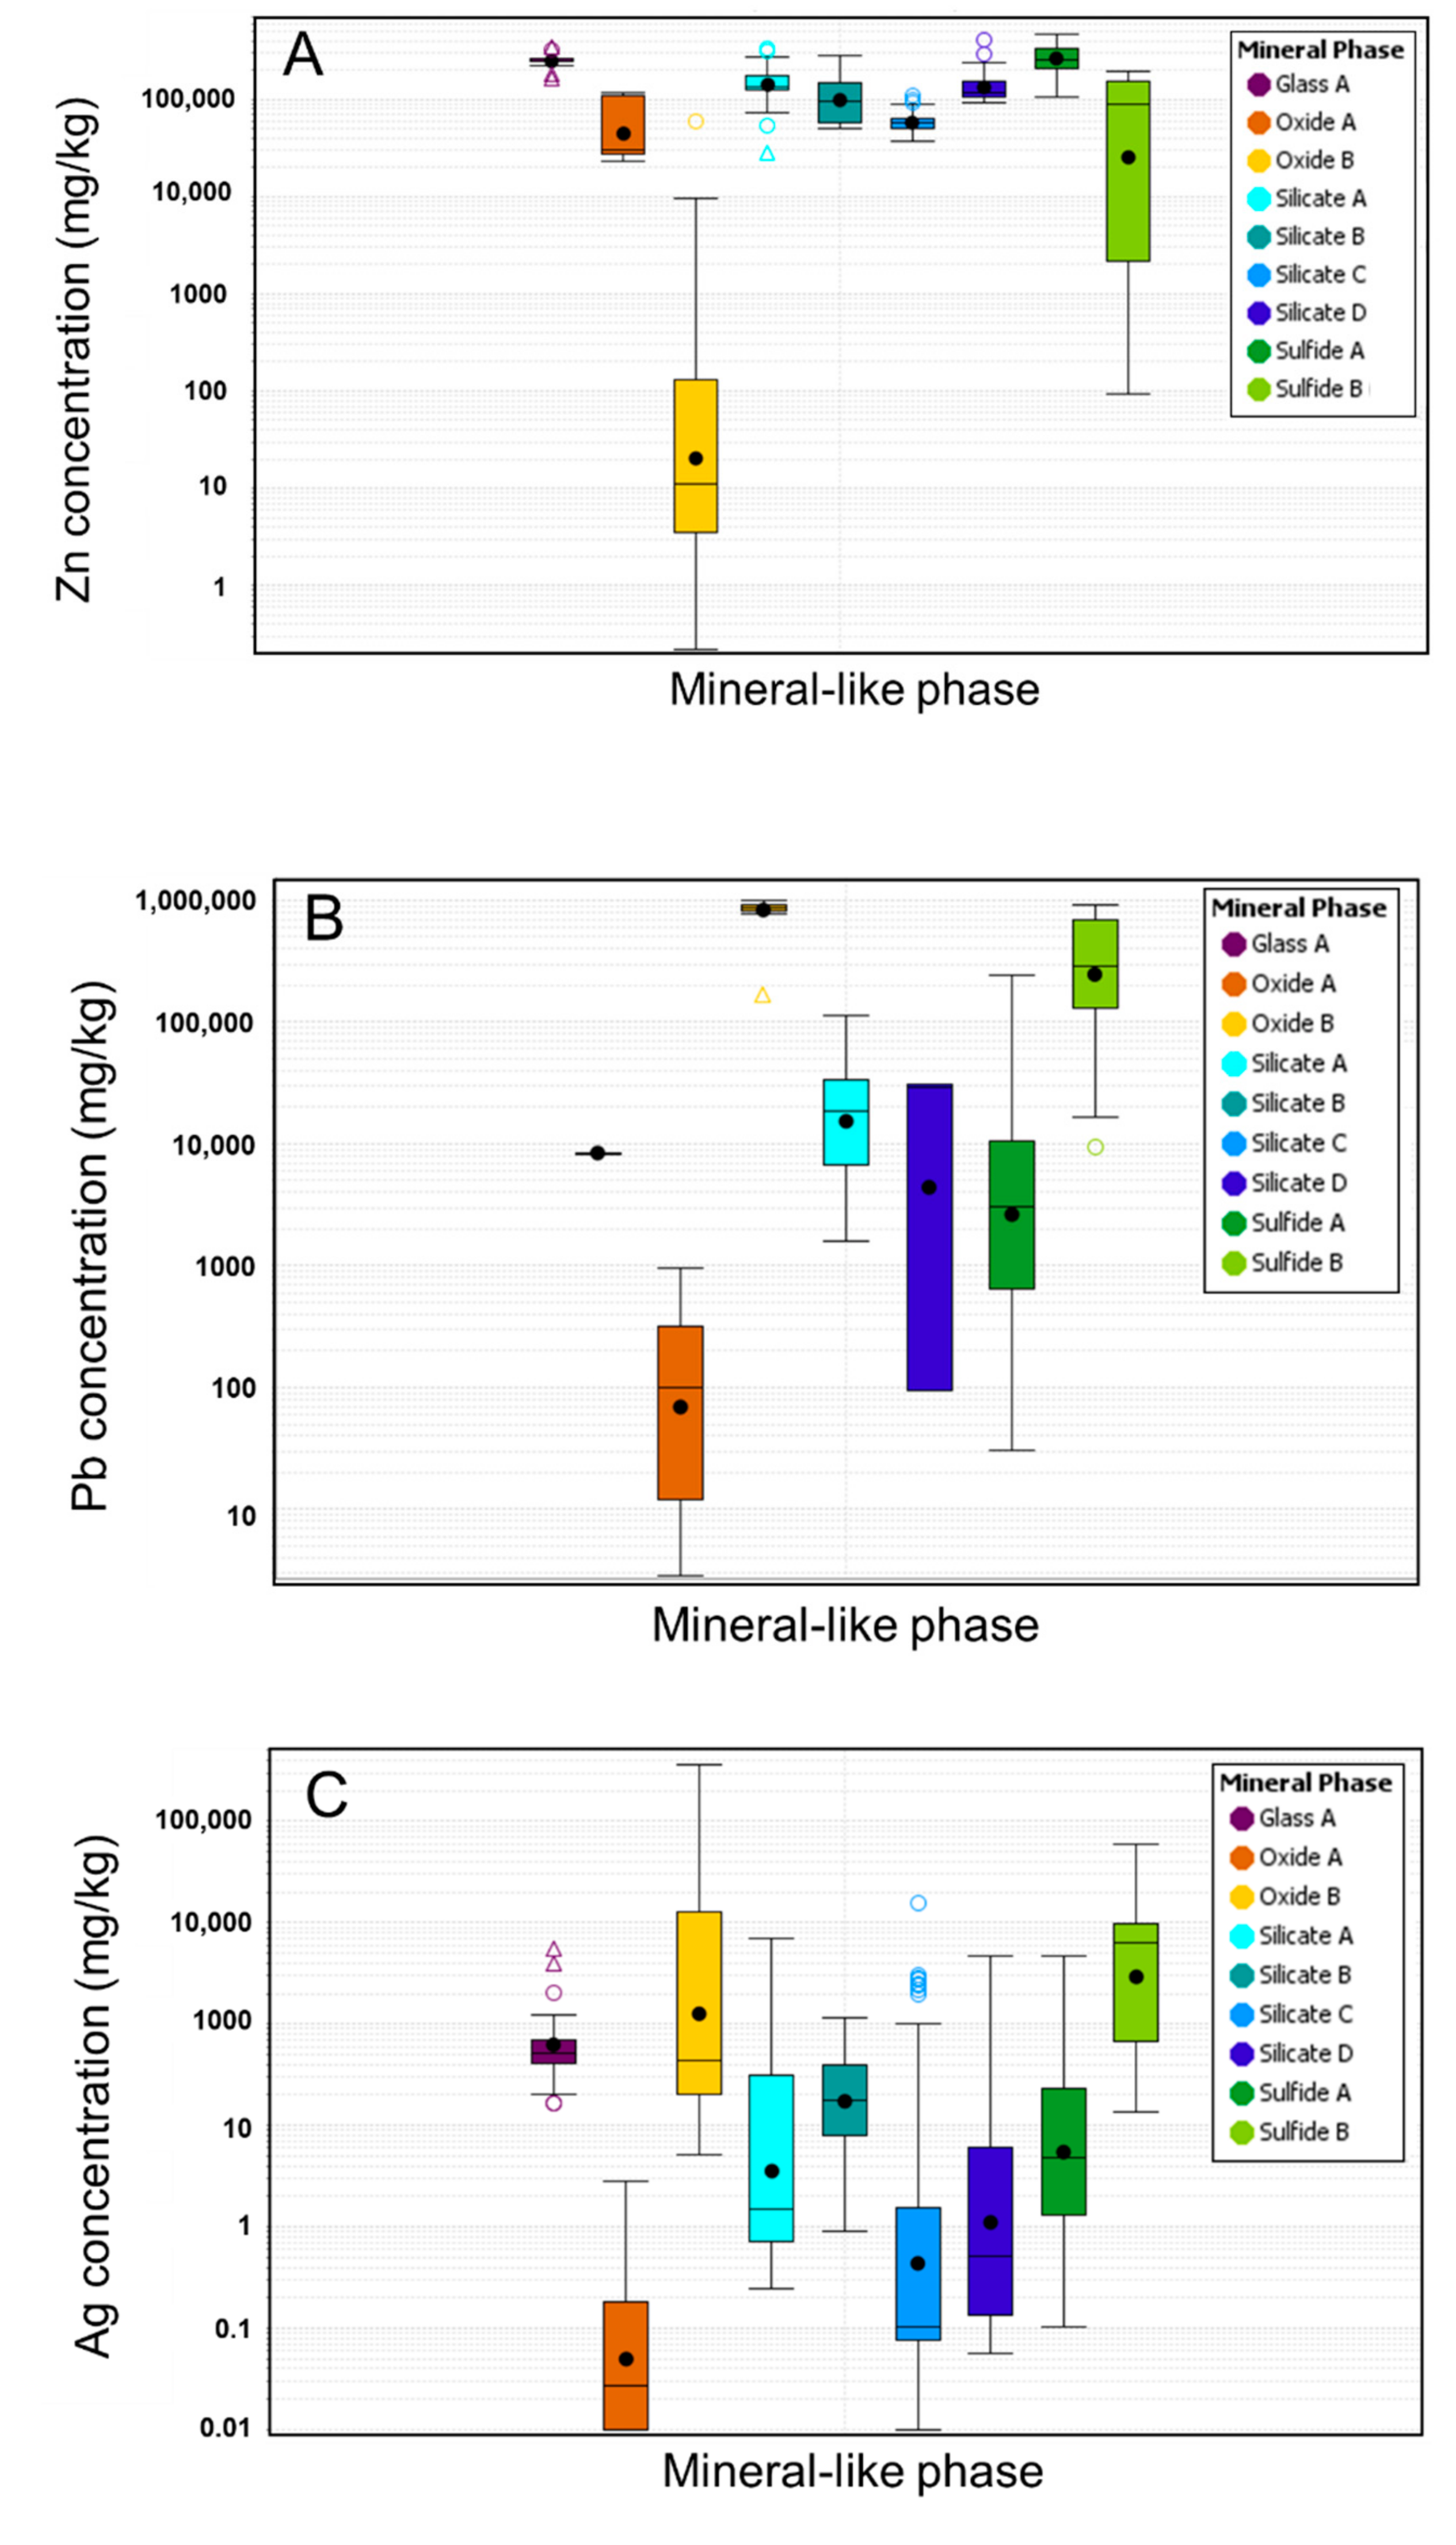
4.4. Mineral Chemistry
4.4.1. Glass and Silicates
4.4.2. Sulfides
4.4.3. Oxides
4.4.4. Element Deportment
5. Discussion
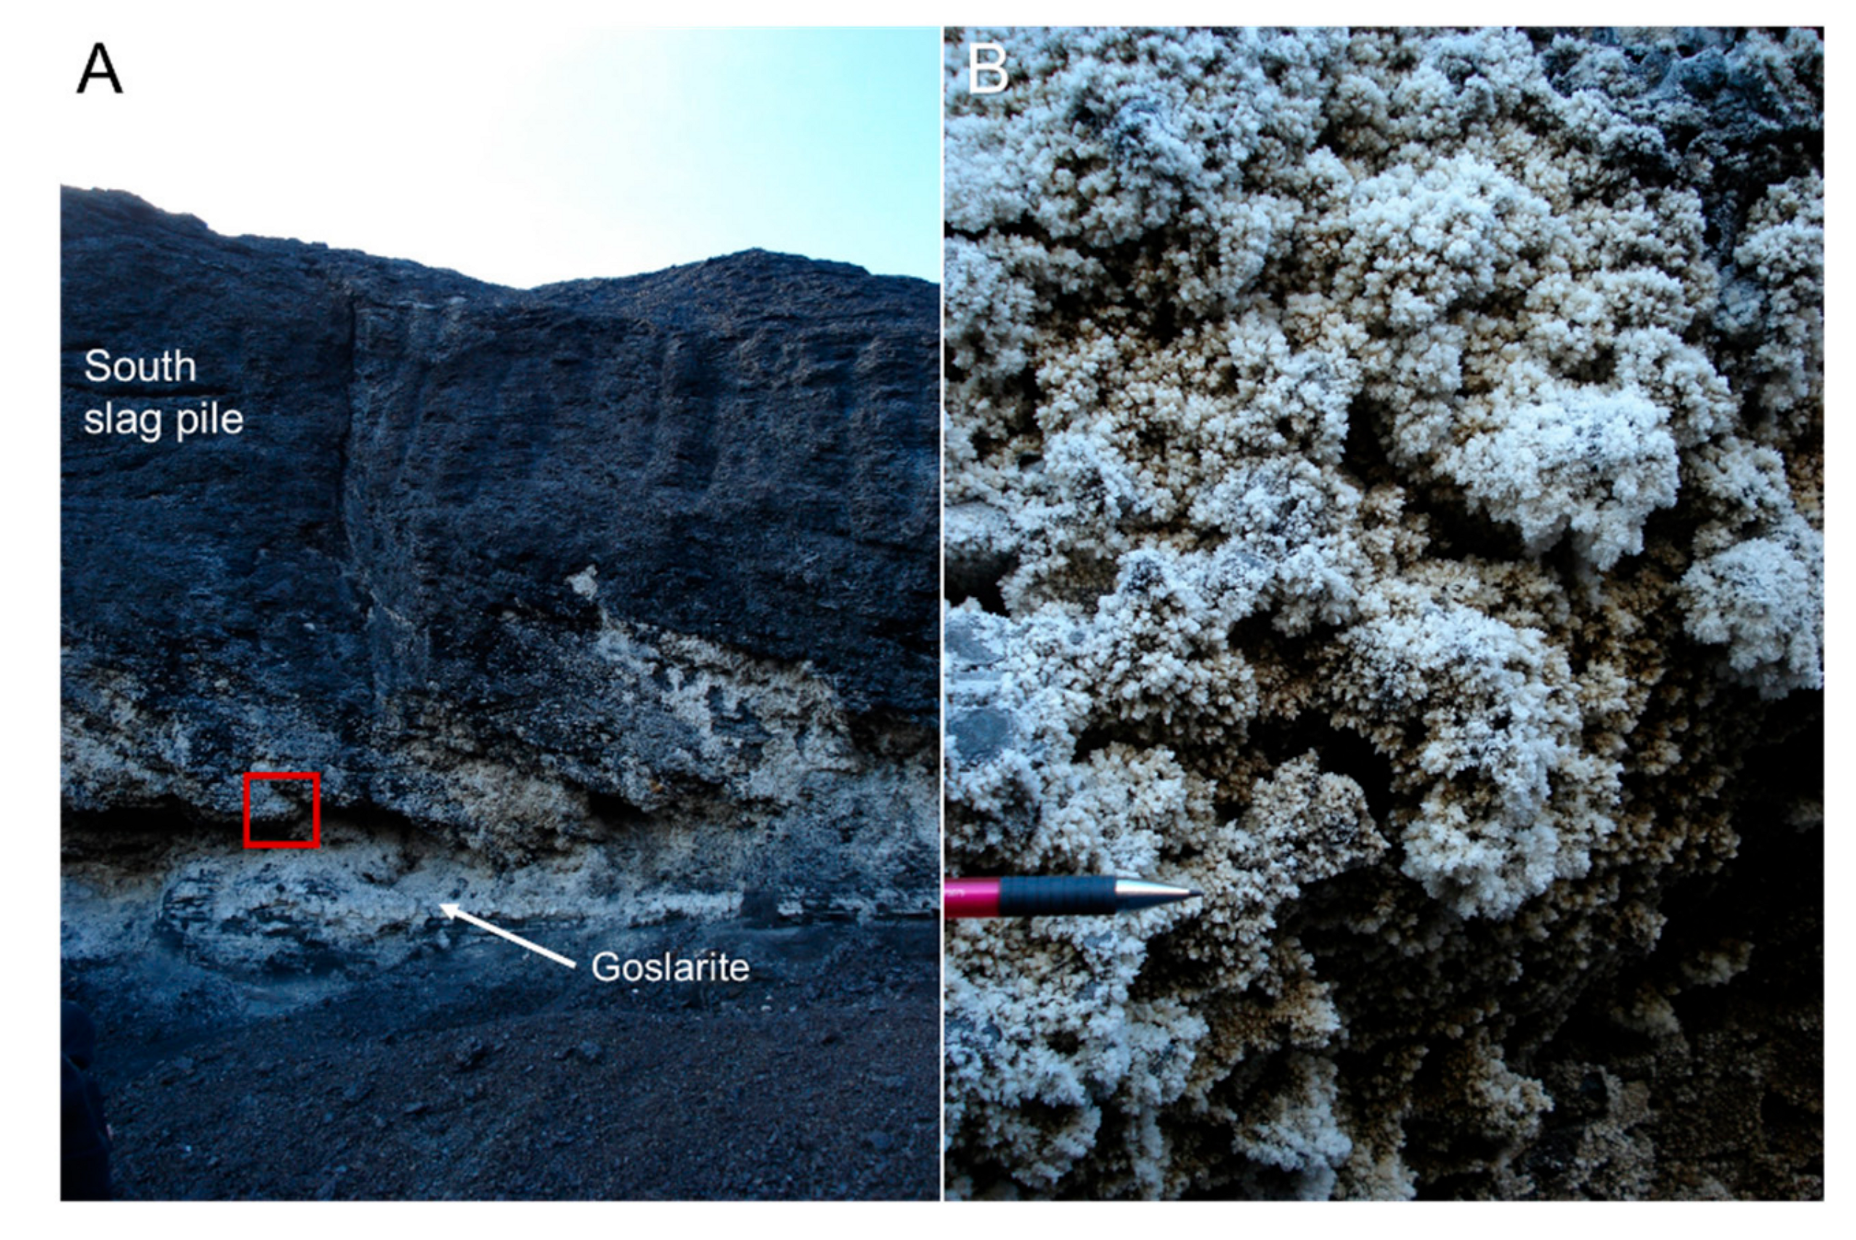
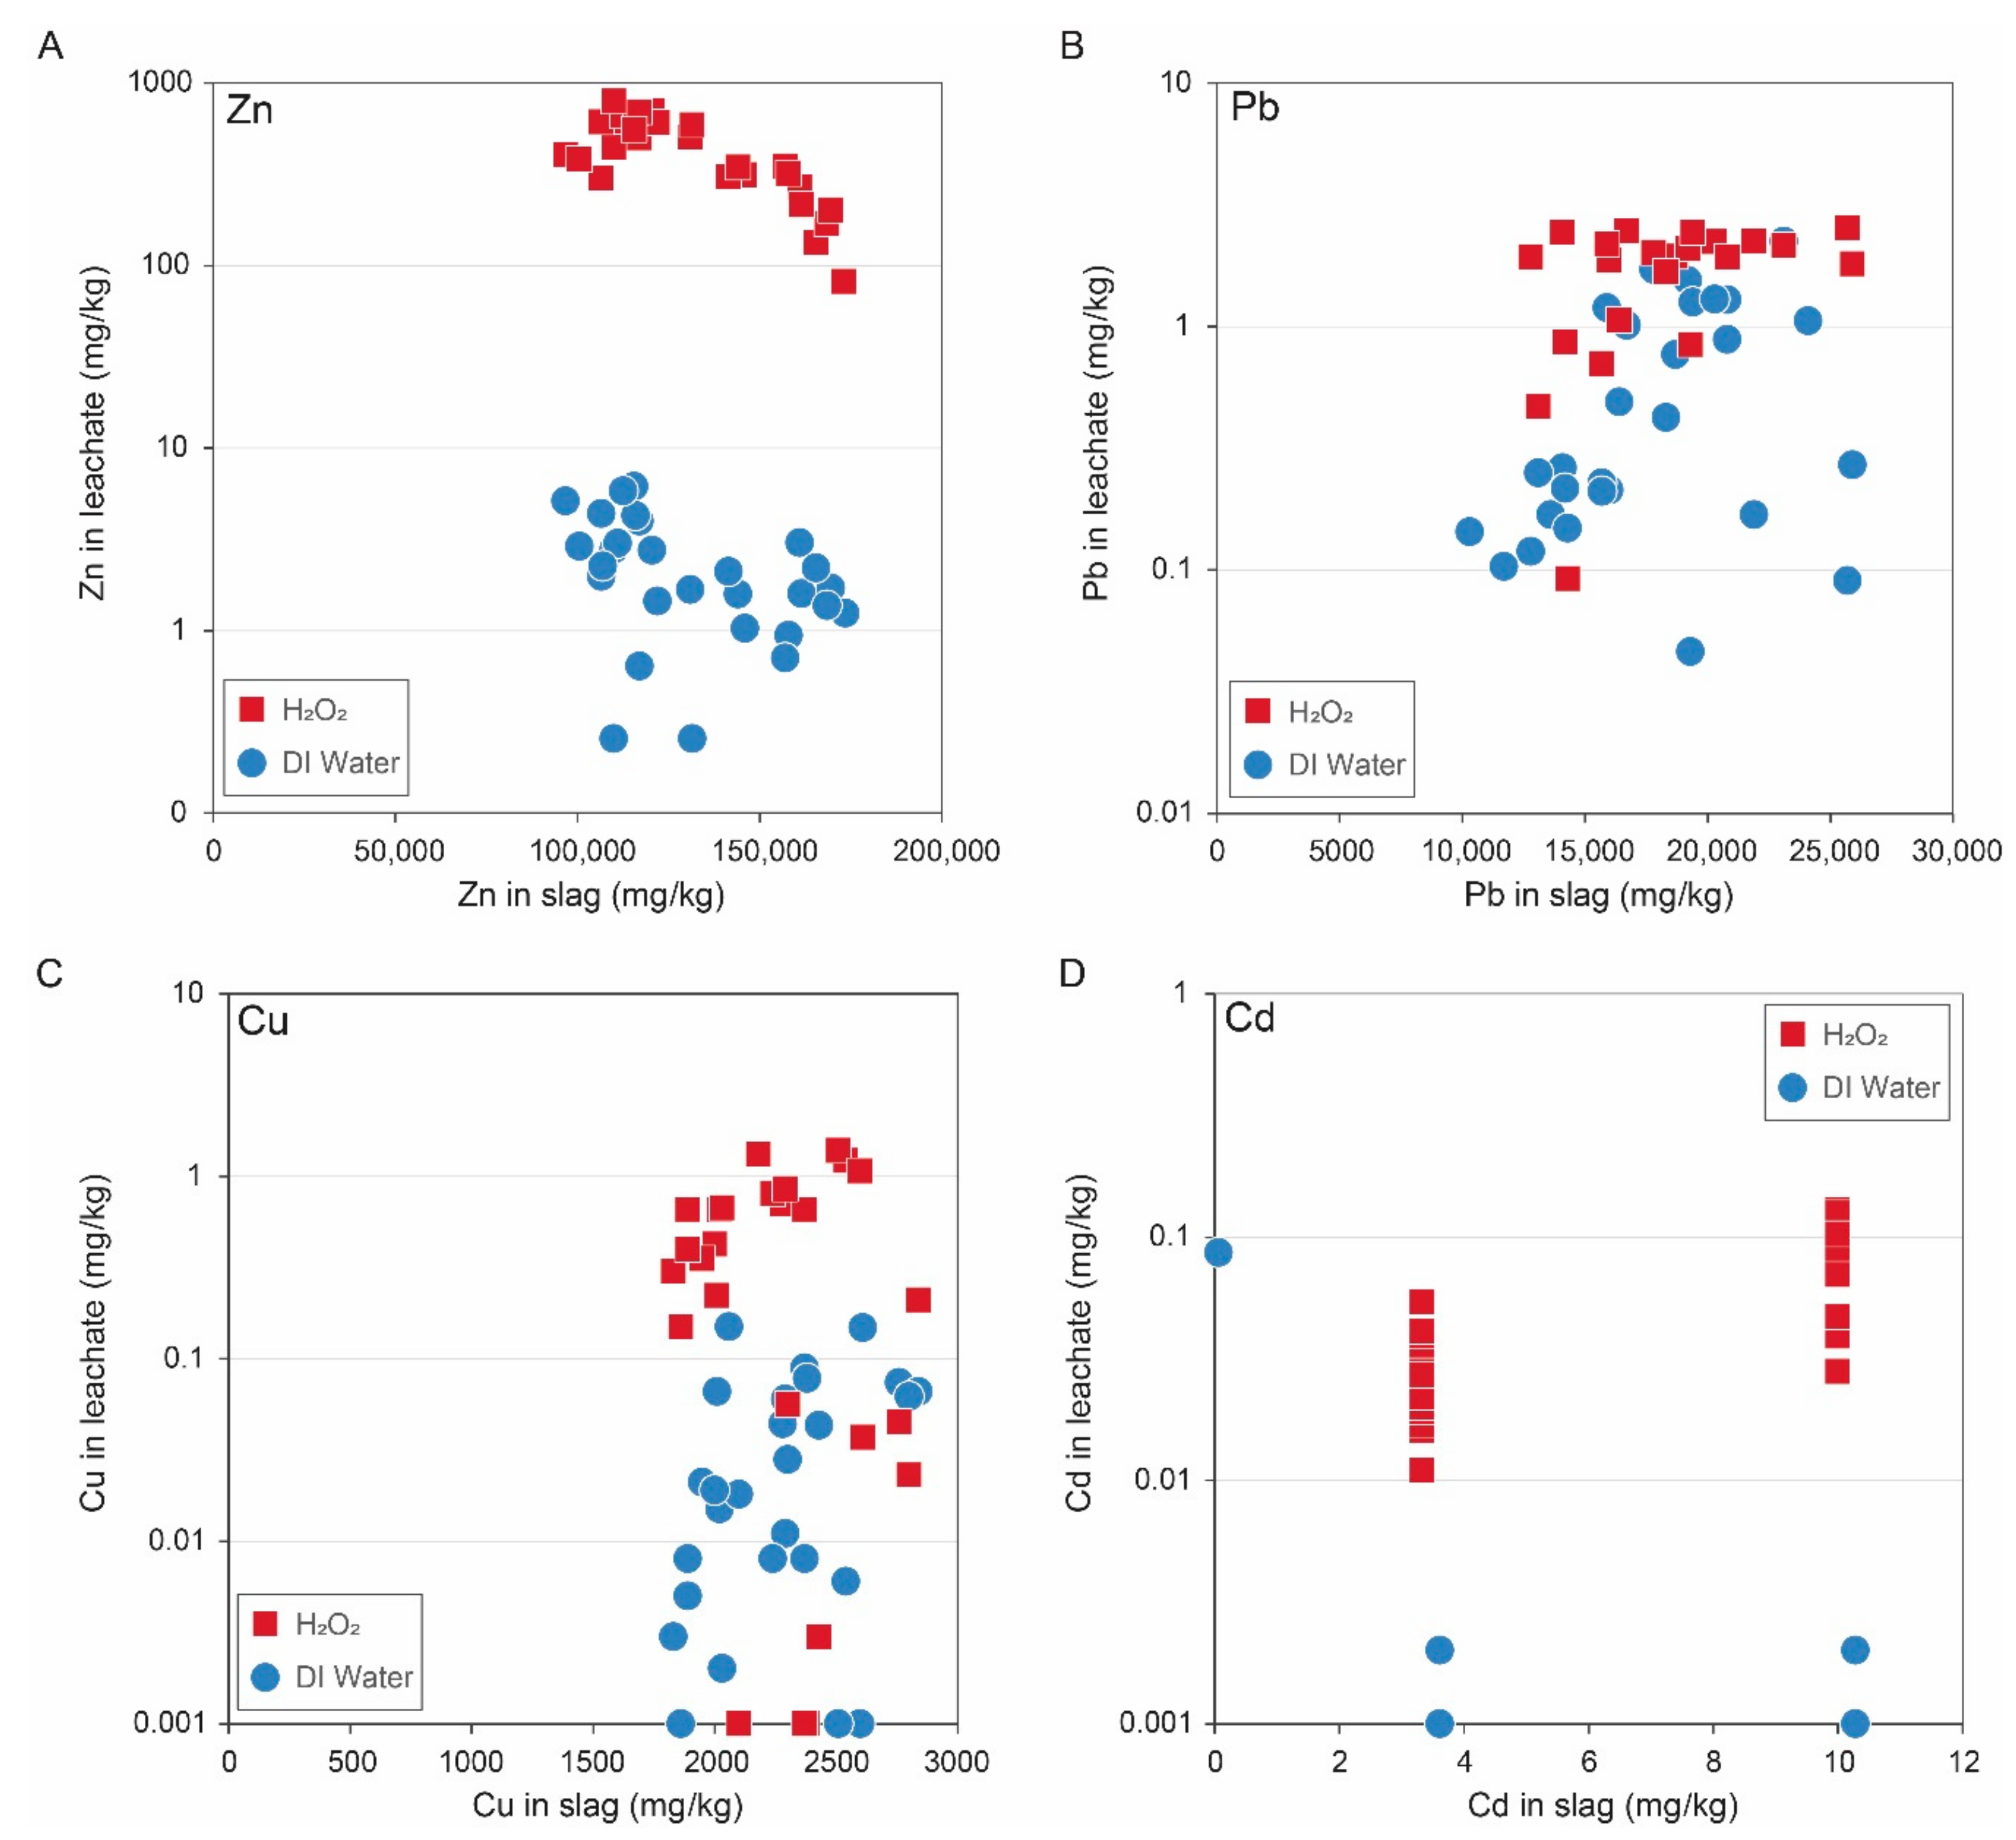
5.1. Geo-Environmental Risks
5.2. Rehandling and Reprocessing Options
5.2.1. Chemical Reprocessing
- Slag was initially subjected to leaching at 1.85 mol/L H2SO4 at 1/10 solid ratio at a temperature of 55 °C. The residue was then collected for a secondary leaching process.
- A concentrated solution of 4.07 mol/L H2SO4 was then added to the leachate at 1/10 solid ratio at a temperature of 95 °C to dissolve the ferrite phases. Ammonium jarosite was precipitated to recover any dissolved Fe.
5.2.2. Biological Extraction
5.2.3. Site Remediation
6. Conclusions
Supplementary Materials
Author Contributions
Funding
Acknowledgments
Conflicts of Interest
References
- Velenturf, A.P.M.; Jopson, J.S. Making the business case for resource recovery. Sci. Total Environ. 2019, 648, 1031–1041. [Google Scholar] [CrossRef] [PubMed]
- Bleicher, A.; David, M.; Rutjes, H. When environmental legacy becomes a resource: On the making of secondary resources. Geoforum 2019, 101, 18–27. [Google Scholar] [CrossRef]
- Afum, B.D.; Caverson, D.; Ben-Awuah, E. A conceptual framework for characterizing mineralized waste rocks as future resource. Int. J. Min. Sci. Technol. 2019, 29, 429–435. [Google Scholar] [CrossRef]
- Young, J.E. Mining the Earth; WorldWatch: Washington, DC, USA, 1992. [Google Scholar]
- Jenkins, H.; Yakovleva, N. Corporate social responsibility in the mining industry: Exploring trends in social and environmental disclosure. J. Clean. Prod. 2006, 14, 271–284. [Google Scholar] [CrossRef]
- Parbhakar-Fox, A.K.; Edraki, M.; Hardie, K.; Kadletz, O.; Hall, T. Identification of acid rock drainage sources through mesotextural classification at abandoned mines of Croydon, Australia: Implications for the rehabilitation of waste rock repositories. J. Geochem. Explor. 2014, 137, 11–28. [Google Scholar] [CrossRef]
- Griggs, D.; Stafford-Smith, M.; Gaffney, O.; Rockström, J.; Öhman, M.C.; Shyamsundar, P.; Steffen, W.; Glaser, G.; Kanie, N.; Noble, I. Policy: Sustainable development goals for people and planet. Nature 2013, 495, 305–307. [Google Scholar] [CrossRef] [PubMed]
- Piatak, N.M.; Parsons, M.B.; Seal, R.R., II. Characteristics and environmental aspects of slag: A review. Appl. Geochem. 2015, 57, 236–266. [Google Scholar] [CrossRef]
- Lottermoser, B.G. Evaporative mineral precipitates from a historical smelting slag dump, Rio Tinto, Spain. Neues Jahrbuch für Mineralogie-Abhandlungen 2005, 181, 183–190. [Google Scholar] [CrossRef]
- Piatak, N.M. Environmental characteristics and utilization potential of metallurgical slag. In Environmental Geochemistry, 2nd ed.; Elsevier: Amsterdam, The Netherlands, 2018; pp. 487–519. [Google Scholar]
- Csavina, J.; Field, J.; Taylor, M.P.; Gao, S.; Landázuri, A.; Betterton, E.A.; Sáez, A.E. A review on the importance of metals and metalloids in atmospheric dust and aerosol from mining operations. Sci. Total Environ. 2012, 433, 58–73. [Google Scholar] [CrossRef]
- Pugin, K.G.; Vaysman, Y.I. Methodological approaches to development of ecologically safe usage technologies of ferrous industry solid waste resource potential. World Appl. Sci. J. 2013, 22, 28–33. [Google Scholar] [CrossRef]
- Available online: http://www.euroslag.com (accessed on 11 April 2019).
- Australasian Slag Association. Available online: http://www.asa-inc.org.au (accessed on 1 April 2019).
- Roberts, G. Metal Mining in Tasmania, 1804 to 1914: How Government Helped Shape the Mining Industry; Bookprint Pty. Limited: Launceston, Australia; Fullers Bookshop: Launceston, Australia, 2007. [Google Scholar]
- Williams, K.; Both, R. Geological Survey Record No. 11 Mineralogy of the Mines and Prospects of the Zeehan Field; Mineral Resources Tasmania; Government Printer: Hobart, Tasmania, 1971. [Google Scholar]
- Solomon, M. An introduction to the geology and metallic ore deposits of Tasmania. Econ. Geol. 1981, 76, 194–208. [Google Scholar] [CrossRef]
- Seymour, D.B.; Green, G.R.; Calver, C.R. The Geology and Mineral Deposits of Tasmania: A Summary; Mineral Resources Tasmania: Rosny Park, Australia, 2006. [Google Scholar]
- Fox, N.; Parbhakar-Fox, A.; Lottermoser, B. Prediction of Metal Mobility from Sulfidic Waste Rocks Using Micro-Analytical Tools, Spray, Tasmania. In Environmental Indicators in Metal Mining; Springer: Cham, Switzerland, 2017; pp. 263–277. [Google Scholar]
- Bacon, C.A. A Tasmanian mining history timeline. In Tasmanian Geological Survey Record 2013/10; Mineral Resources Tasmania: Sydney, Australia, 2013. [Google Scholar]
- Blissett, A.H. Geological Survey Explanatory Report: One Mile Geological Map Series, Kʹ55-5-50, Zeehan; Tasmania Department of Mines: Hobart, Australia, 1962. [Google Scholar]
- Brown, A.; Findlay, R.; Goscombe, B.; McClenaghan, M.; Seymore, D. Geological Atlas 1: 50 000 Series. Sheet 50 (7914S), Zeehan; Mineral Resources Tasmania: Sydney, Australia, 2004. [Google Scholar]
- Taylor, K. Acid Drainage Abatement from an Abandoned Smelter Site, Zeehan; University of Tasmania: Hobart, Australia, 1998. [Google Scholar]
- Dold, B. Speciation of the most soluble phases in a sequential extraction procedure adapted for geochemical studies of copper sulfide mine waste. J. Geochem. Explor. 2003, 80, 55–68. [Google Scholar] [CrossRef]
- Noble, T.L.; Lottermoser, B.G.; Parbhakar-Fox, A. Evaluation of pH testing methods for sulfidic mine waste. Mine Water Environ. 2015, 35, 318–331. [Google Scholar] [CrossRef]
- Smart, R.; Skinner, W.; Levay, G.; Gerson, A.; Thomas, J.; Sobieraj, H.; Schumann, R.; Weisener, C.; Weber, P.; Miller, S. ARD Test Handbook: Project P387, A Prediction and Kinetic Control of Acid Mine Drainage; Ian Wark Research Institute: Melbourne, Australia, 2002. [Google Scholar]
- Parbhakar-Fox, A.; Lottermoser, B. Predictive Environmental Indicators in Mining: Review of the Literature and Current Best Practices; CRC ORE Technical Report 2; CRC for Optimising Resource Extraction: Brisbane, Australia, 2011. [Google Scholar]
- Parbhakar-Fox, A.; Fox, N.; Ferguson, T.; Hill, R.; Maynard, B. Dissection of the NAG pH test: Tracking efficacy through examining reaction products. In Proceedings of the 11th International Conference on Acid Rock Drainage 2018, Pretoria, South Africa, 10–14 September 2018; pp. 949–955. [Google Scholar]
- Norris, A.; Danyushevsky, L. Towards Estimating the Complete Uncertainty Budget of Quantified Results Measured by LA-ICPMS; Goldschmidt: Boston, MA, USA, 2018. [Google Scholar]
- Schindler, M. A mineralogical and geochemical study of slag from the historical O’Donnell Roast Yards, Sudbury, Ontario, Canada. Can. Miner. 2014, 52, 433–452. [Google Scholar] [CrossRef]
- Ettler, V.; Legendre, O.; Bodénan, F.; Touray, J.C. Primary phases and natural weathering of old lead–zinc pyrometallurgical slag from Příbram, Czech Republic. Can. Miner. 2001, 39, 873–888. [Google Scholar] [CrossRef]
- Bell, R.C.; Turner, G.H.; Peters, E. Fuming of zinc from lead blast slag furnace. JOM 1955, 7, 472–477. [Google Scholar] [CrossRef]
- Piatak, N.M.; Seal, R.R., II. Mineralogy and the release of trace elements from slag from the Hegeler Zinc smelter, Illinois (USA). Appl. Geochem. 2010, 25, 302–320. [Google Scholar] [CrossRef]
- Puziewicz, J.; Zainoun, K.; Bril, H. Primary phases in pyrometallurgical slags from a zinc-smelting waste dump, S’wietochłowice, Upper Silesia, Poland. Can. Miner. 2007, 45, 1189–1200. [Google Scholar] [CrossRef]
- Tyszka, R.; Kierczak, J.; Pietranik, A.; Ettler, V.; Mihaljevič, M. Extensive weathering of zinc smelting slag in a heap in Upper Silesia (Poland): Potential environmental risks posed by mechanical disturbance of slag deposits. Appl. Geochem. 2014, 40, 70–81. [Google Scholar] [CrossRef]
- Weber, P.; Hughes, J.B.; Conner, L.B.; Lindsay, P.; Smart, R.S.C. Short Term Acid Drainage Characteristics Determined by Paste pH and Kinetic NAG Testing: Cypress Prospect; American Society of Mining and Reclamation (ASMR): St. Louis, MO, USA, 2006. [Google Scholar]
- Lahiri, P.; Sengupta, S.K. Spinel ferrites as catalysts: A study on catalytic effect of co-precipitated ferrites on hydrogen peroxide decomposition. Can. J. Chem. 1991, 69, 33–36. [Google Scholar] [CrossRef]
- Seal, R.; Foley, N.K.; Wanty, R.B. Introduction to geoenvironmental models of mineral deposits U.S. Geological Survey Open-File Report 02-195; Chapter A; pp. 1–7. Available online: https://pubs.usgs.gov/of/2002/of02-195/OF-02-195-508-V5.pdf (accessed on 5 July 2019).
- Australia and New Zealand Guidelines for Fresh and Marine Water Quality. 2000. Available online: https://www.waterquality.gov.au/sites/default/files/documents/anzecc-armcanz-2000-guidelines-vol1.pdf (accessed on 15 June 2019).
- Ficklin, W.H.; Plumlee, G.S.; Smith, K.S.; McHugh, J.B. Geochemical classification of mine drainages and natural drainages in mineralised areas. In Proceedings of the 7th International Water-Rock Interaction Conference, Park City, UT, USA, 13–18 July 1992. [Google Scholar]
- Gbor, P.K.; Mokri, V.; Jia, C.Q. Characterization of smelter slags. J. Environ. Sci. Health A 2000, 35, 147–167. [Google Scholar] [CrossRef]
- Ettler, V.; Červinka, R.; Johan, Z. Mineralogy of medieval slags from lead and silver smelting (Bohutín, Příbram district, Czech Republic): Towards estimation of historical smelting conditions. Archaeometry 2009, 51, 987–1007. [Google Scholar] [CrossRef]
- Piatak, N.M.; Seal, R.R., II. Mineralogy and environmental geochemistry of historical iron slag, Hopewell Furnace, national historic site, Pennsylvania, USA. Appl. Geochem. 2012, 27, 623–643. [Google Scholar] [CrossRef]
- Shannon, R.D.; Prewitt, C.T. Revised values of effective ionic radii. Acta Crystallogr. B 1970, 26, 1046–1048. [Google Scholar] [CrossRef]
- Ettler, V.; Johan, Z.; Touray, J.C.; Jelínek, E. Zinc partitioning between glass and silicate phases in historical and modern lead–zinc metallurgical slags from the Příbram district, Czech Republic. C. R. Acad. Sci. 2000, 331, 245–250. [Google Scholar] [CrossRef]
- Lockington, J.A.; Cook, N.J.; Ciobanu, C.L. Trace and minor elements in sphalerite from metamorphosed sulfide deposits. Miner. Petrol. 2014, 108, 873–890. [Google Scholar] [CrossRef]
- Tyszka, R.; Pietranik, A.; Kierczak, J.; Zieliński, G.; Darling, J. Cadmium distribution in Pb-Zn slags from Upper Silesia, Poland: Implications for cadmium mobility from slag phases to the environment. J. Geochem. Explor. 2018, 186, 215–224. [Google Scholar] [CrossRef]
- Jambor, J.L. Mine-waste mineralogy and mineralogical perspectives of acid–base accounting. In Environmental Aspects of Mine Wastes; Jambor, J.L., Blowes, D.W., Ritchie, A.I.M., Eds.; Mineralogical Association of Canada: Nepean, ON, Canada, 2003. [Google Scholar]
- Parsons, M.B.; Bird, D.K.; Einaudi, M.T.; Alpers, C.N. Geochemical and mineralogical controls on trace element release from the Penn Mine base-metal slag dump, California. Appl. Geochem. 2001, 16, 1567–1593. [Google Scholar] [CrossRef]
- Piatak, N.M.; Seal, R.K.; Hammarstrom, J.M. Mineralogical and geochemical controls on the release of trace elements from slag produced by base-and precious-metal smelting at abandoned mine sites. Appl. Geochem. 2004, 19, 1039–1064. [Google Scholar] [CrossRef]
- Pan, J.; Plant, J.A.; Voulvoulis, N.; Oates, C.J.; Ihlenfeld, C. Cadmium levels in Europe: Implications for human health. Environ. Geochem. Health 2010, 32, 1–12. [Google Scholar] [CrossRef]
- Cundy, A.B.; Bardos, R.P.; Church, A.; Puschenreiter, M.; Friesl-Hanl, W.; Müller, I.; Neu, S.; Mench, M.; Witters, N.; Vangronsveld, J. Developing principles of sustainability and stakeholder engagement for “gentle” remediation approaches: The European context. J. Environ. Econ. Manag. 2013, 129, 283–291. [Google Scholar] [CrossRef] [PubMed]
- Schneider, L.; Mariani, M.; Saunders, K.M.; Maher, W.A.; Harrison, J.J.; Fletcher, M.S.; Zawadzki, A.; Heijnis, H.; Haberle, S.G. How significant is atmospheric metal contamination from mining activity adjacent to the Tasmanian Wilderness World Heritage Area? A spatial analysis of metal concentrations using air trajectories models. Sci. Total Environ. 2019, 656, 250–260. [Google Scholar] [CrossRef] [PubMed]
- Kurama, H.; Goektepe, F. Recovery of zinc from waste material using hydro metallurgical processes. Environ. Prog. 2003, 22, 161–166. [Google Scholar] [CrossRef]
- Ma, A.; Zheng, X.; Li, S.; Wang, Y.; Zhu, S. Zinc recovery from metallurgical slag and dust by coordination leaching in NH3–CH3COONH4–H2O system. R. Soc. Open Sci. 2018, 5, 180660. [Google Scholar] [CrossRef] [PubMed]
- Perederiy, I.; Papangelakis, V.G. Why amorphous FeO-SiO2 slags do not acid leach at high temperatures. J. Hazard. Mater. 2017, 321, 737–744. [Google Scholar] [CrossRef] [PubMed]
- Verscheure, K.; Camp, M.V.; Blanpain, B.; Wollants, P.; Hayes, P.C.; Jak, E. Investigation of zinc fuming processes for the treatment of zinc-containing residues. In Proceedings of the International Symposium on Sustainable Developments in Metals Processing, Melbourne, Australia, 3–6 July 2005. [Google Scholar]
- Potysz, A.; Hullebusch, E.D.; Kierczak, J. Perspectives regarding the use of metallurgical slags as secondary metal resources—A review of bioleaching approaches. J. Environ. Manag. 2018, 219, 138–152. [Google Scholar] [CrossRef] [PubMed]
- Cheng, Y.; Guo, Z.; Liu, X.; Yin, H.; Qiu, G.; Pan, F.; Liu, H. The bioleaching feasibility for Pb/Zn smelting slag and community characteristics of indigenous moderate-thermophilic bacteria. Bioresour. Technol. 2009, 100, 2737–2740. [Google Scholar] [CrossRef] [PubMed]
- Guo, Z.; Zhang, L.; Cheng, Y.; Pan, F.; Jiang, K. Effects of pH, pulp density and particle size on solubilization of metals from a Pb/Zn smelting slag using indigenous moderate thermophilic bacteria. Hydrometallurgy 2010, 104, 25–31. [Google Scholar] [CrossRef]
- Kaksonen, A.H.; Lavonen, L.; Kuusenaho, M.; Kolli, A.; Närhi, H.; Vestola, E.; Puhakka, J.A.; Tuovinen, O.H. Bioleaching and recovery of metals from final slag waste of the copper smelting industry. Min. Eng. 2011, 24, 1113–1121. [Google Scholar] [CrossRef]
- Kaksonen, A.H.; Sarkijarvi, S.; Puhakka, J.A.; Peuraniemi, E.; Junnikkala, S.; Tuovinen, O.H. Chemical and bacterial leaching of metals from a smelter slag in acid solutions. Hydrometallurgy 2016, 159, 46–53. [Google Scholar] [CrossRef]
- National Environment Protection (Assessment of Site Contamination) Guidelines on Investigation for Soil and Groundwater. 2011. Available online: http://www.nepc.gov.au/system/files/resources/93ae0e77-e697-e494-656f-afaaf9fb4277/files/schedule-b1-guideline-investigation-levels-soil-and-groundwater-sep10.pdf (accessed on 12 June 2019).
- Chen, X.; Wright, J.V.; Conca, J.L.; Peurrung, L.M. Evaluation of heavy metal remediation using mineral apatite. Water Air Soil Pollut. 1997, 8, 57–78. [Google Scholar] [CrossRef]
- Ma, Q.Y.; Traina, S.J.; Logan, T.J.; Ryan, J.A. In situ lead immobilization by apatite. Environ. Sci. Technol. 1993, 27, 1803–1810. [Google Scholar] [CrossRef]
- Friesl, W.; Friedl, J.; Platzer, K.; Horak, O.; Gerzabek, M.H. Remediation of contaminated agricultural soils near a former Pb/Zn smelter in Austria: Batch, pot and field experiments. Environ. Pollut. 2006, 144, 40–50. [Google Scholar] [CrossRef] [PubMed]


| Phase | Texture | Mineral Resemblance | Chemical Formula * |
|---|---|---|---|
| Glass A | Microlitic | Fayalite–Tephroite series | Fe2SiO4 to Mn2SiO4 |
| Silicate A | Skeletal laths to euhedral crystals | Petedunnite | Ca(Zn,Mn,Mg,Fe)Si2O6 |
| Silicate B | Skeletal laths to euhedral crystals | Fayalite–Tephroite Series/Kirschsteinite | Fe2SiO4 to Mn2SiO4/CaFeSiO4 |
| Silicate C | Skeletal laths to euhedral crystals | Kirschsteinite | CaFeSiO4 |
| Silicate D | Skeletal laths to euhedral crystals | Fayalite | Fe2SiO4 |
| Sulfide A | Dendritic | Sphalerite and Wurtzite | (Zn,Fe)S |
| Sulfide B | Bleb contained in skeletal laths to euhedral crystals | Galena | PbS |
| Oxide A | Dendritic | Franklinite and Magnetite | ZnFe2O4 and Fe3O4 |
| Oxide B | Bleb | Litharge, Massicot | PbO |
© 2019 by the authors. Licensee MDPI, Basel, Switzerland. This article is an open access article distributed under the terms and conditions of the Creative Commons Attribution (CC BY) license (http://creativecommons.org/licenses/by/4.0/).
Share and Cite
Parbhakar-Fox, A.; Gilmour, S.; Fox, N.; Olin, P. Geometallurgical Characterization of Non-Ferrous Historical Slag in Western Tasmania: Identifying Reprocessing Options. Minerals 2019, 9, 415. https://doi.org/10.3390/min9070415
Parbhakar-Fox A, Gilmour S, Fox N, Olin P. Geometallurgical Characterization of Non-Ferrous Historical Slag in Western Tasmania: Identifying Reprocessing Options. Minerals. 2019; 9(7):415. https://doi.org/10.3390/min9070415
Chicago/Turabian StyleParbhakar-Fox, Anita, Sarah Gilmour, Nathan Fox, and Paul Olin. 2019. "Geometallurgical Characterization of Non-Ferrous Historical Slag in Western Tasmania: Identifying Reprocessing Options" Minerals 9, no. 7: 415. https://doi.org/10.3390/min9070415
APA StyleParbhakar-Fox, A., Gilmour, S., Fox, N., & Olin, P. (2019). Geometallurgical Characterization of Non-Ferrous Historical Slag in Western Tasmania: Identifying Reprocessing Options. Minerals, 9(7), 415. https://doi.org/10.3390/min9070415