Fluid Evolution and Ore Genesis of the Qibaoshan Polymetallic Ore Field, Shandong Province, China: Constraints from Fluid Inclusions and H–O–S Isotopic Compositions

Abstract
:1. Introduction
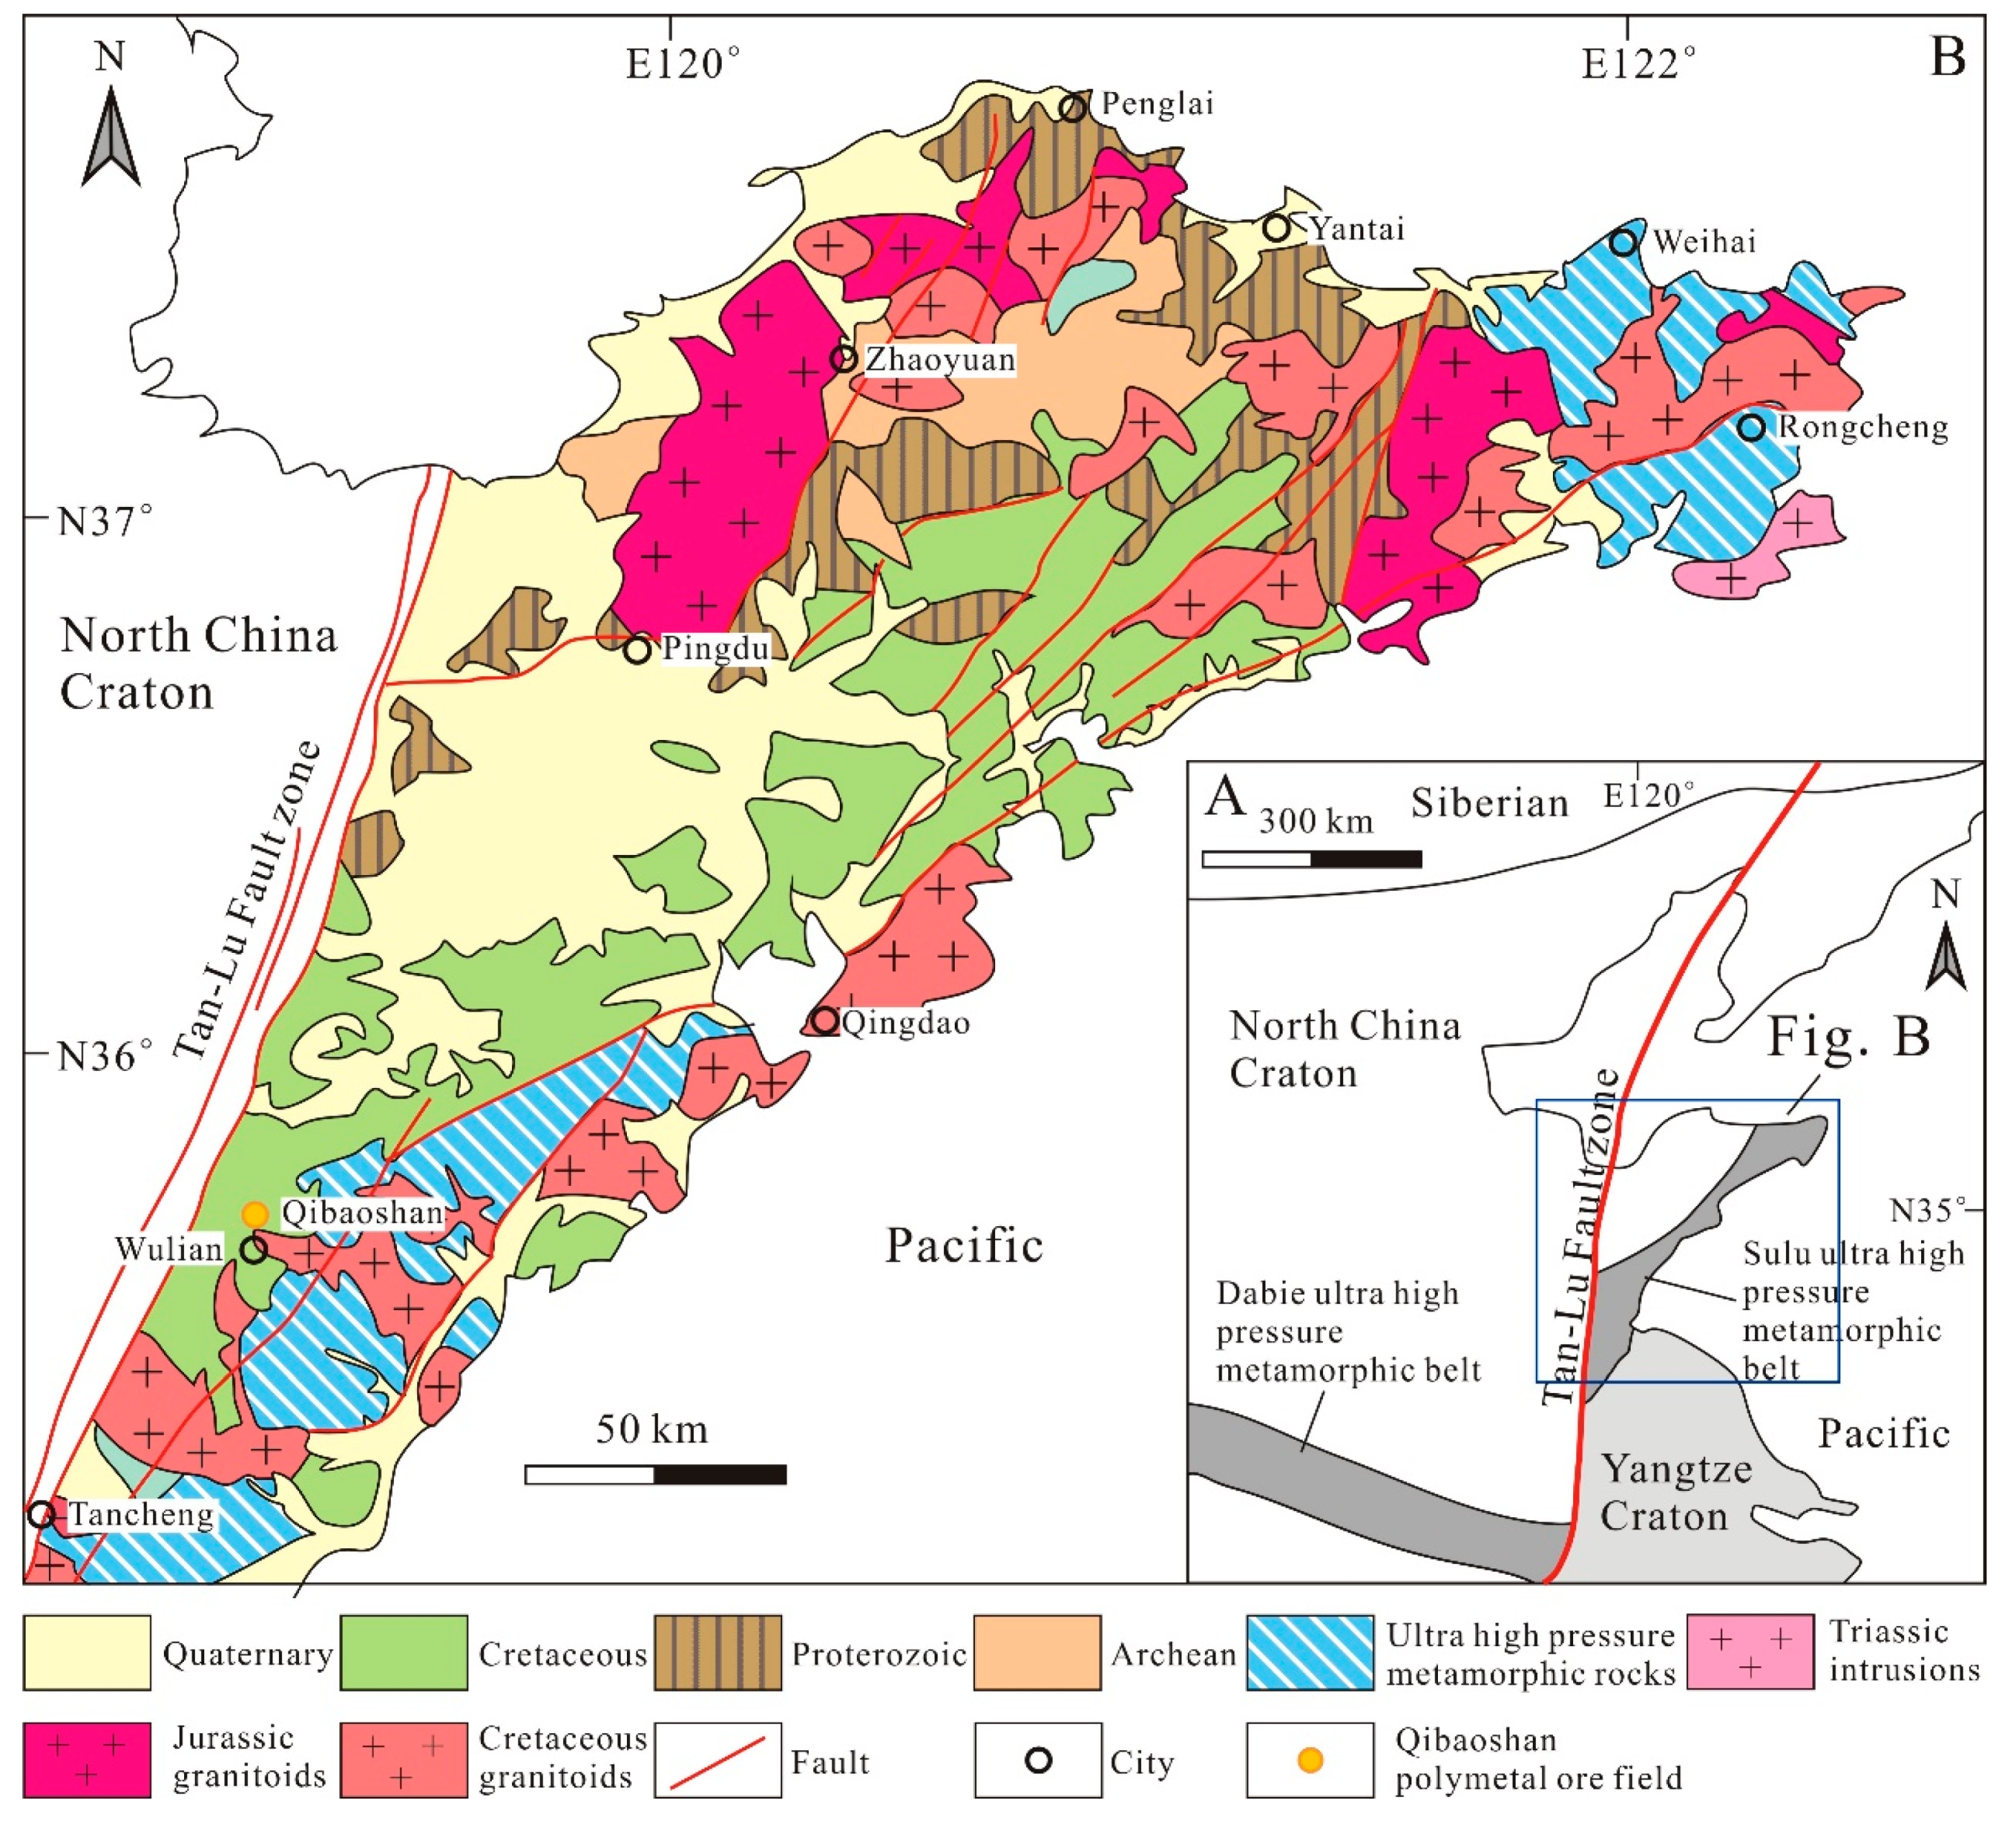
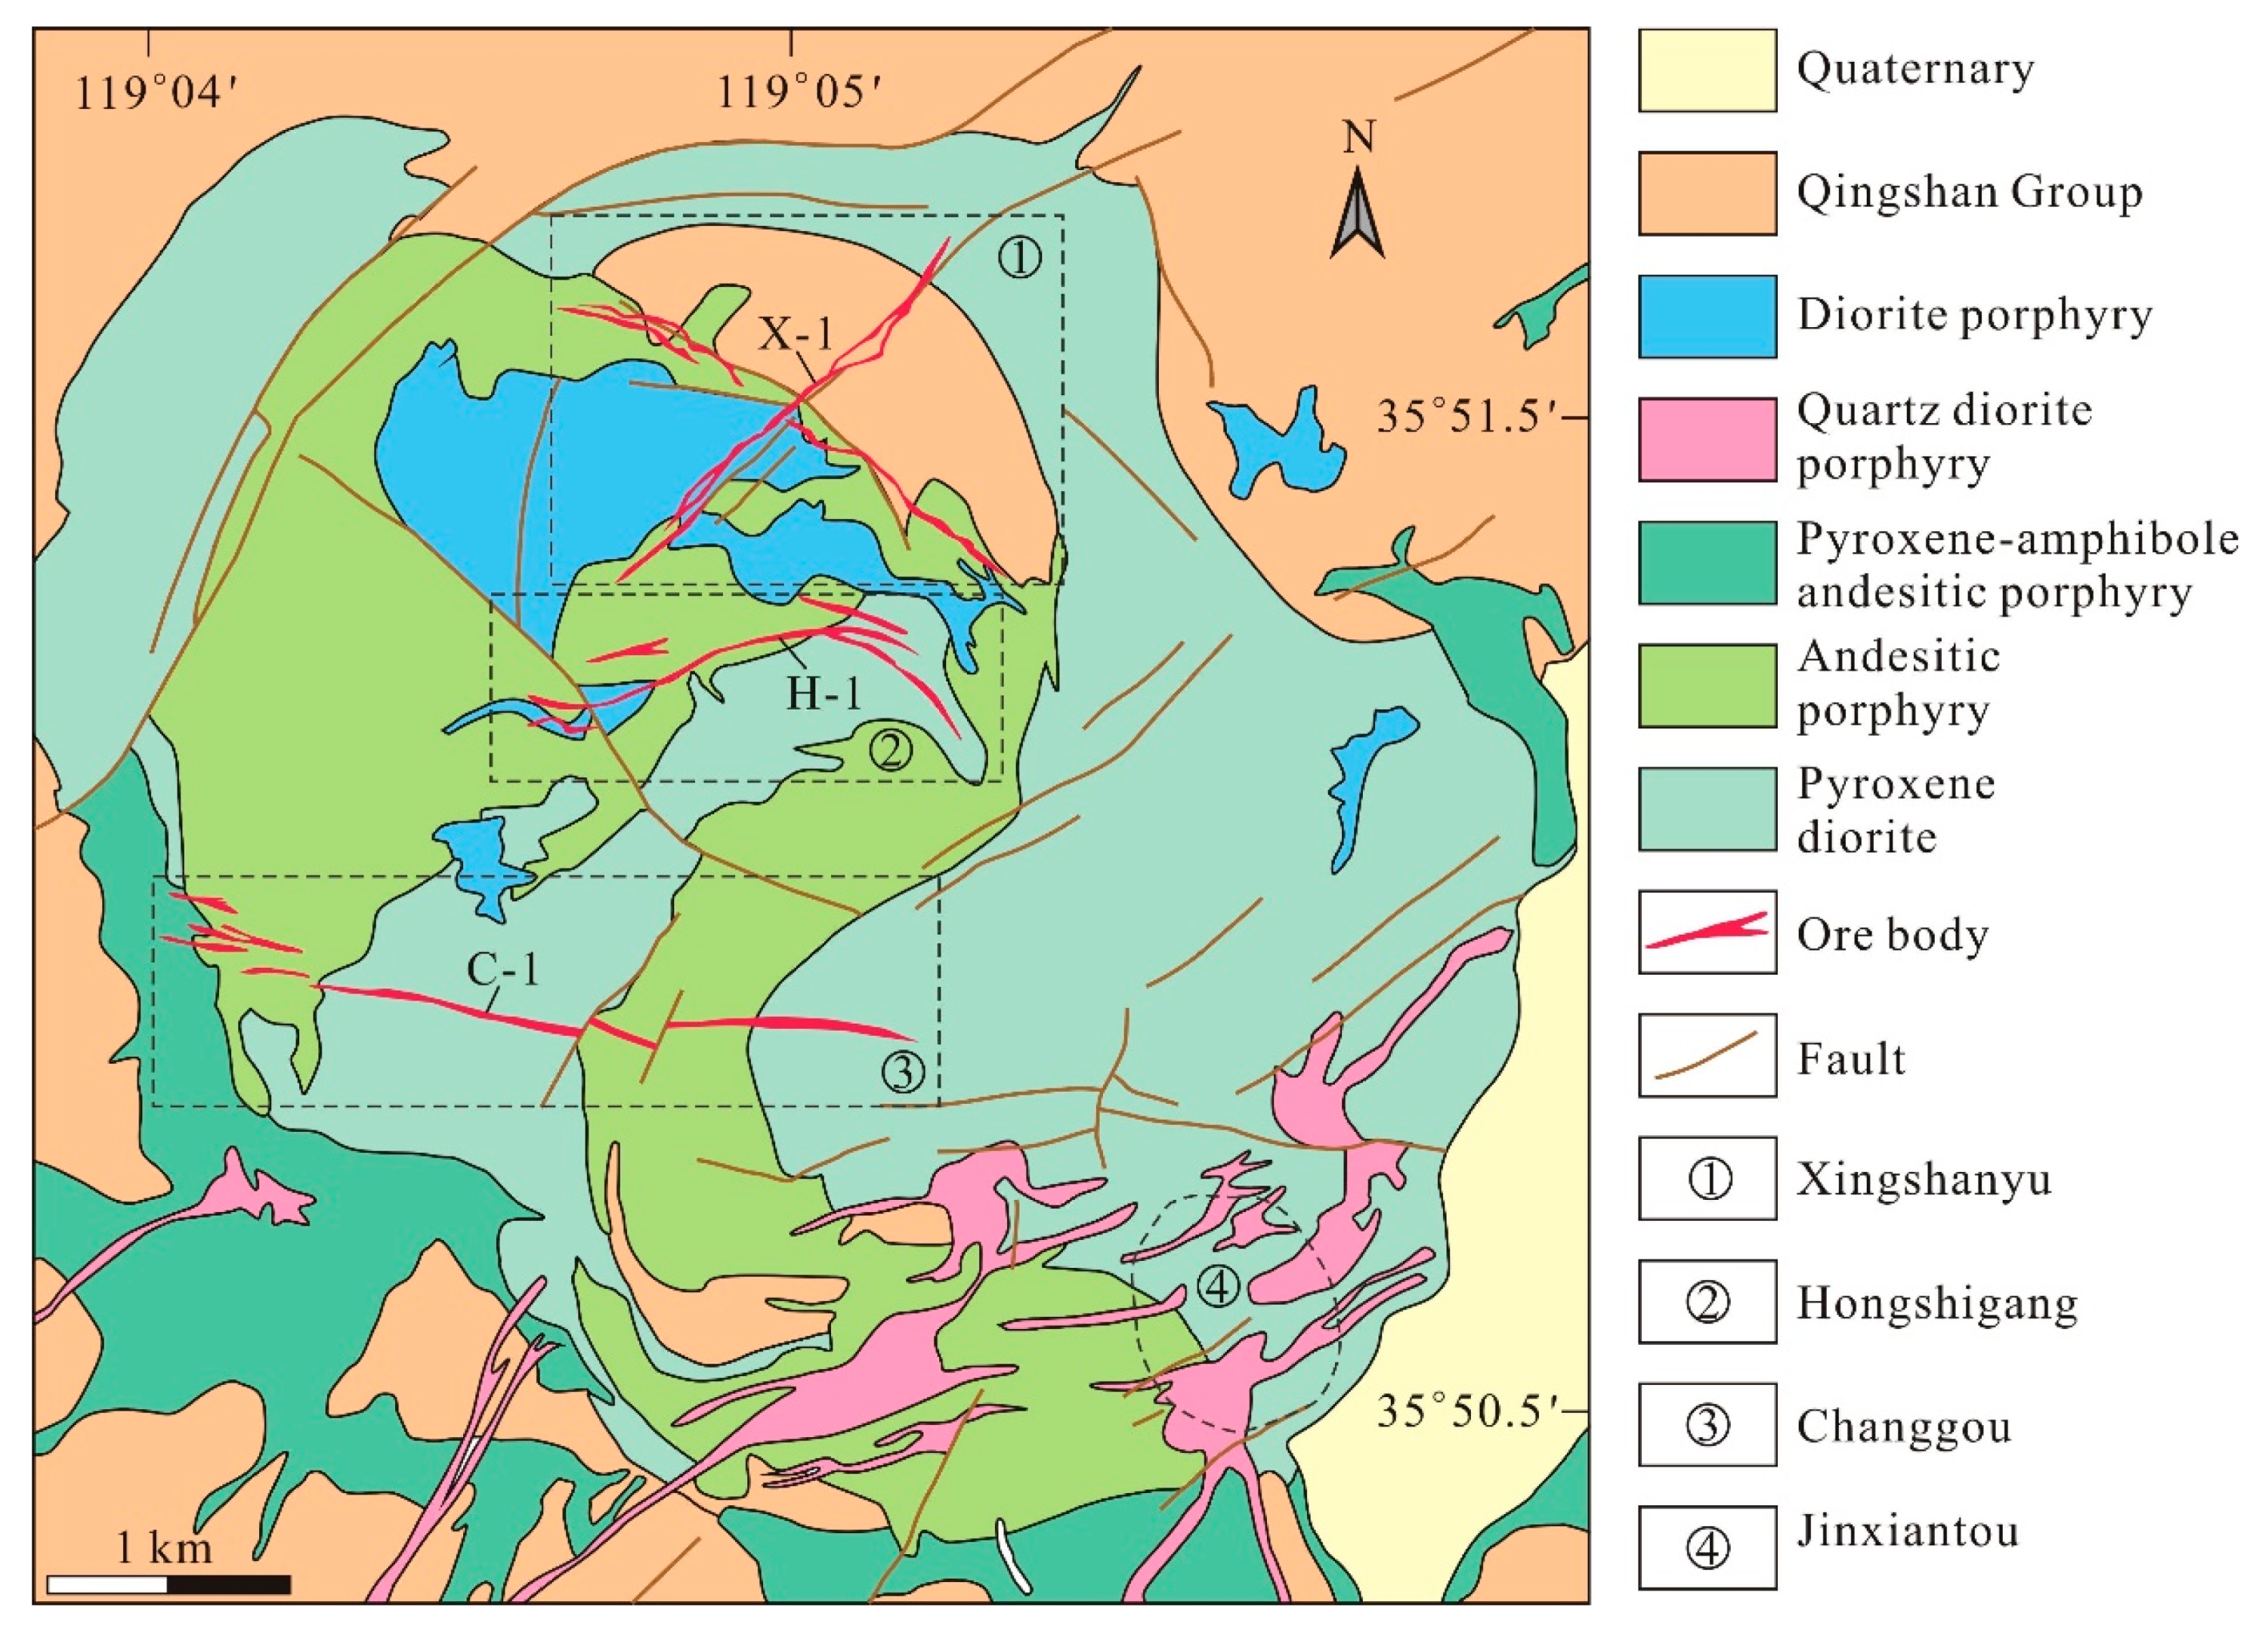
2. Regional Geology
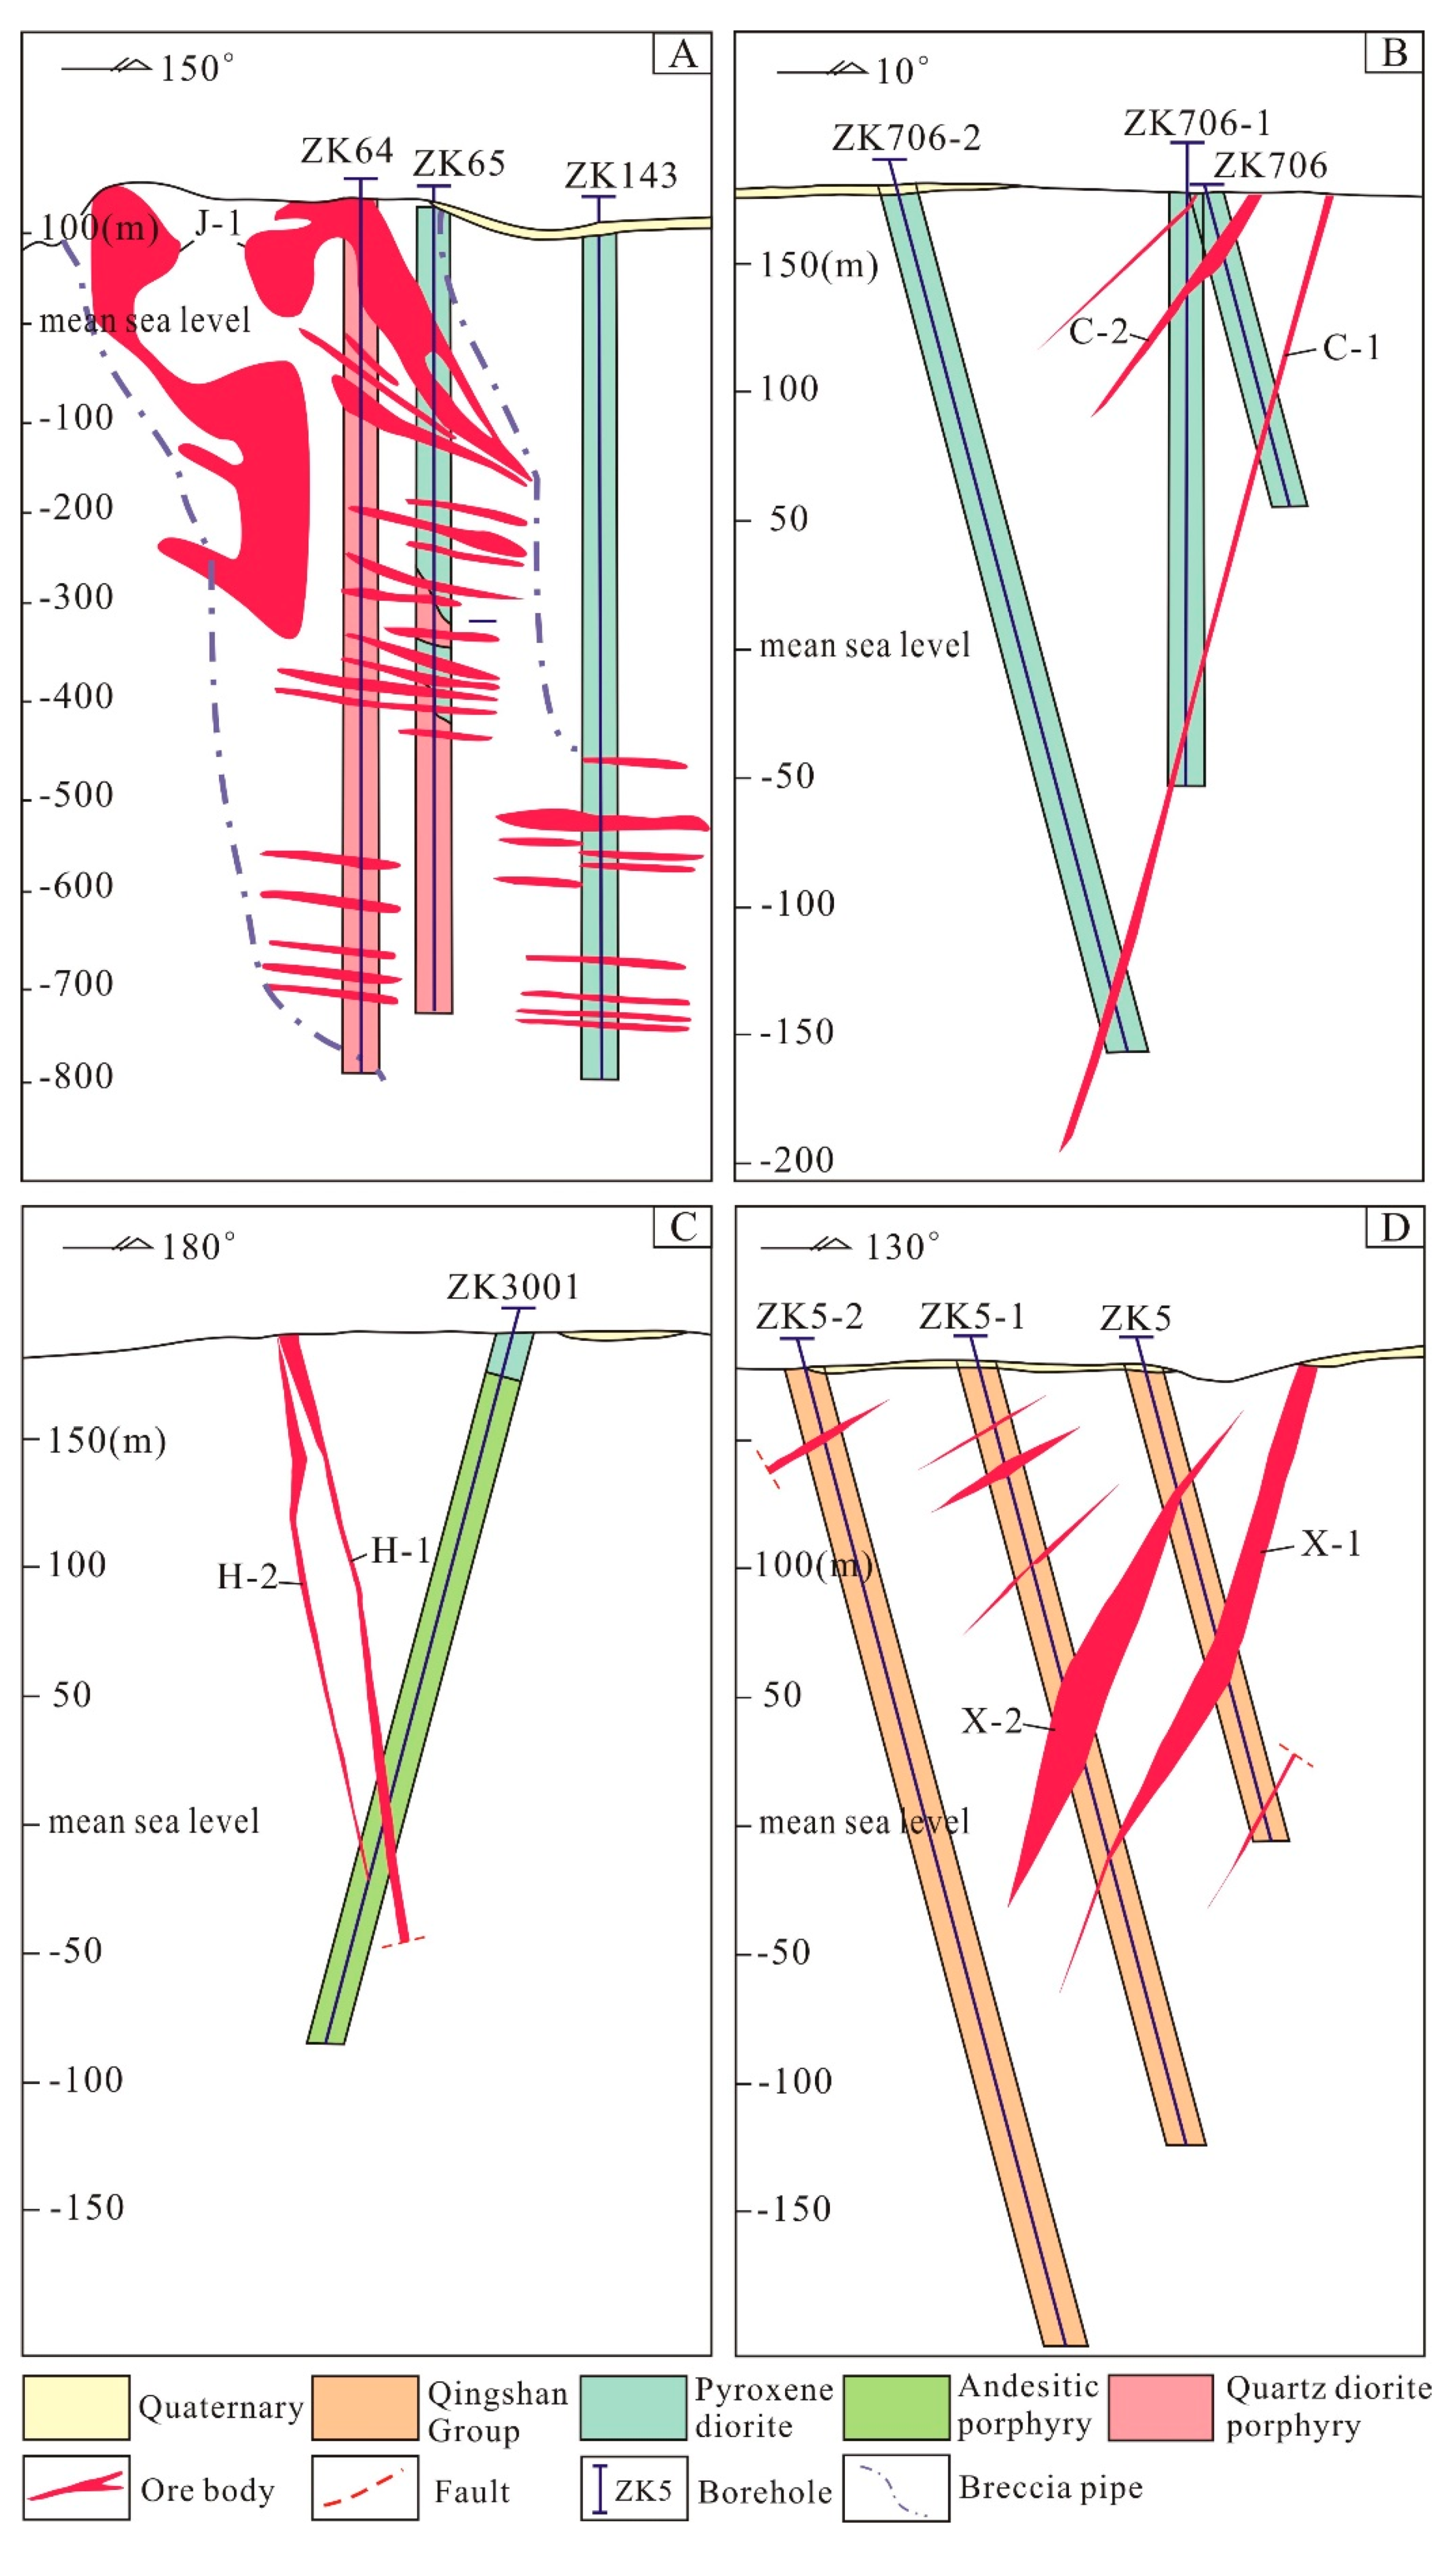
3. Deposit Geology
4. Mineralization Characteristics
4.1. Jinxiantou Deposit
4.2. Changgou Deposit
4.3. Hongshigang Deposit
4.4. Xingshanyu Deposit
5. Samples and Analytical Methods
5.1. Fluid Inclusions
5.2. H–O–S Isotopes
6. Results
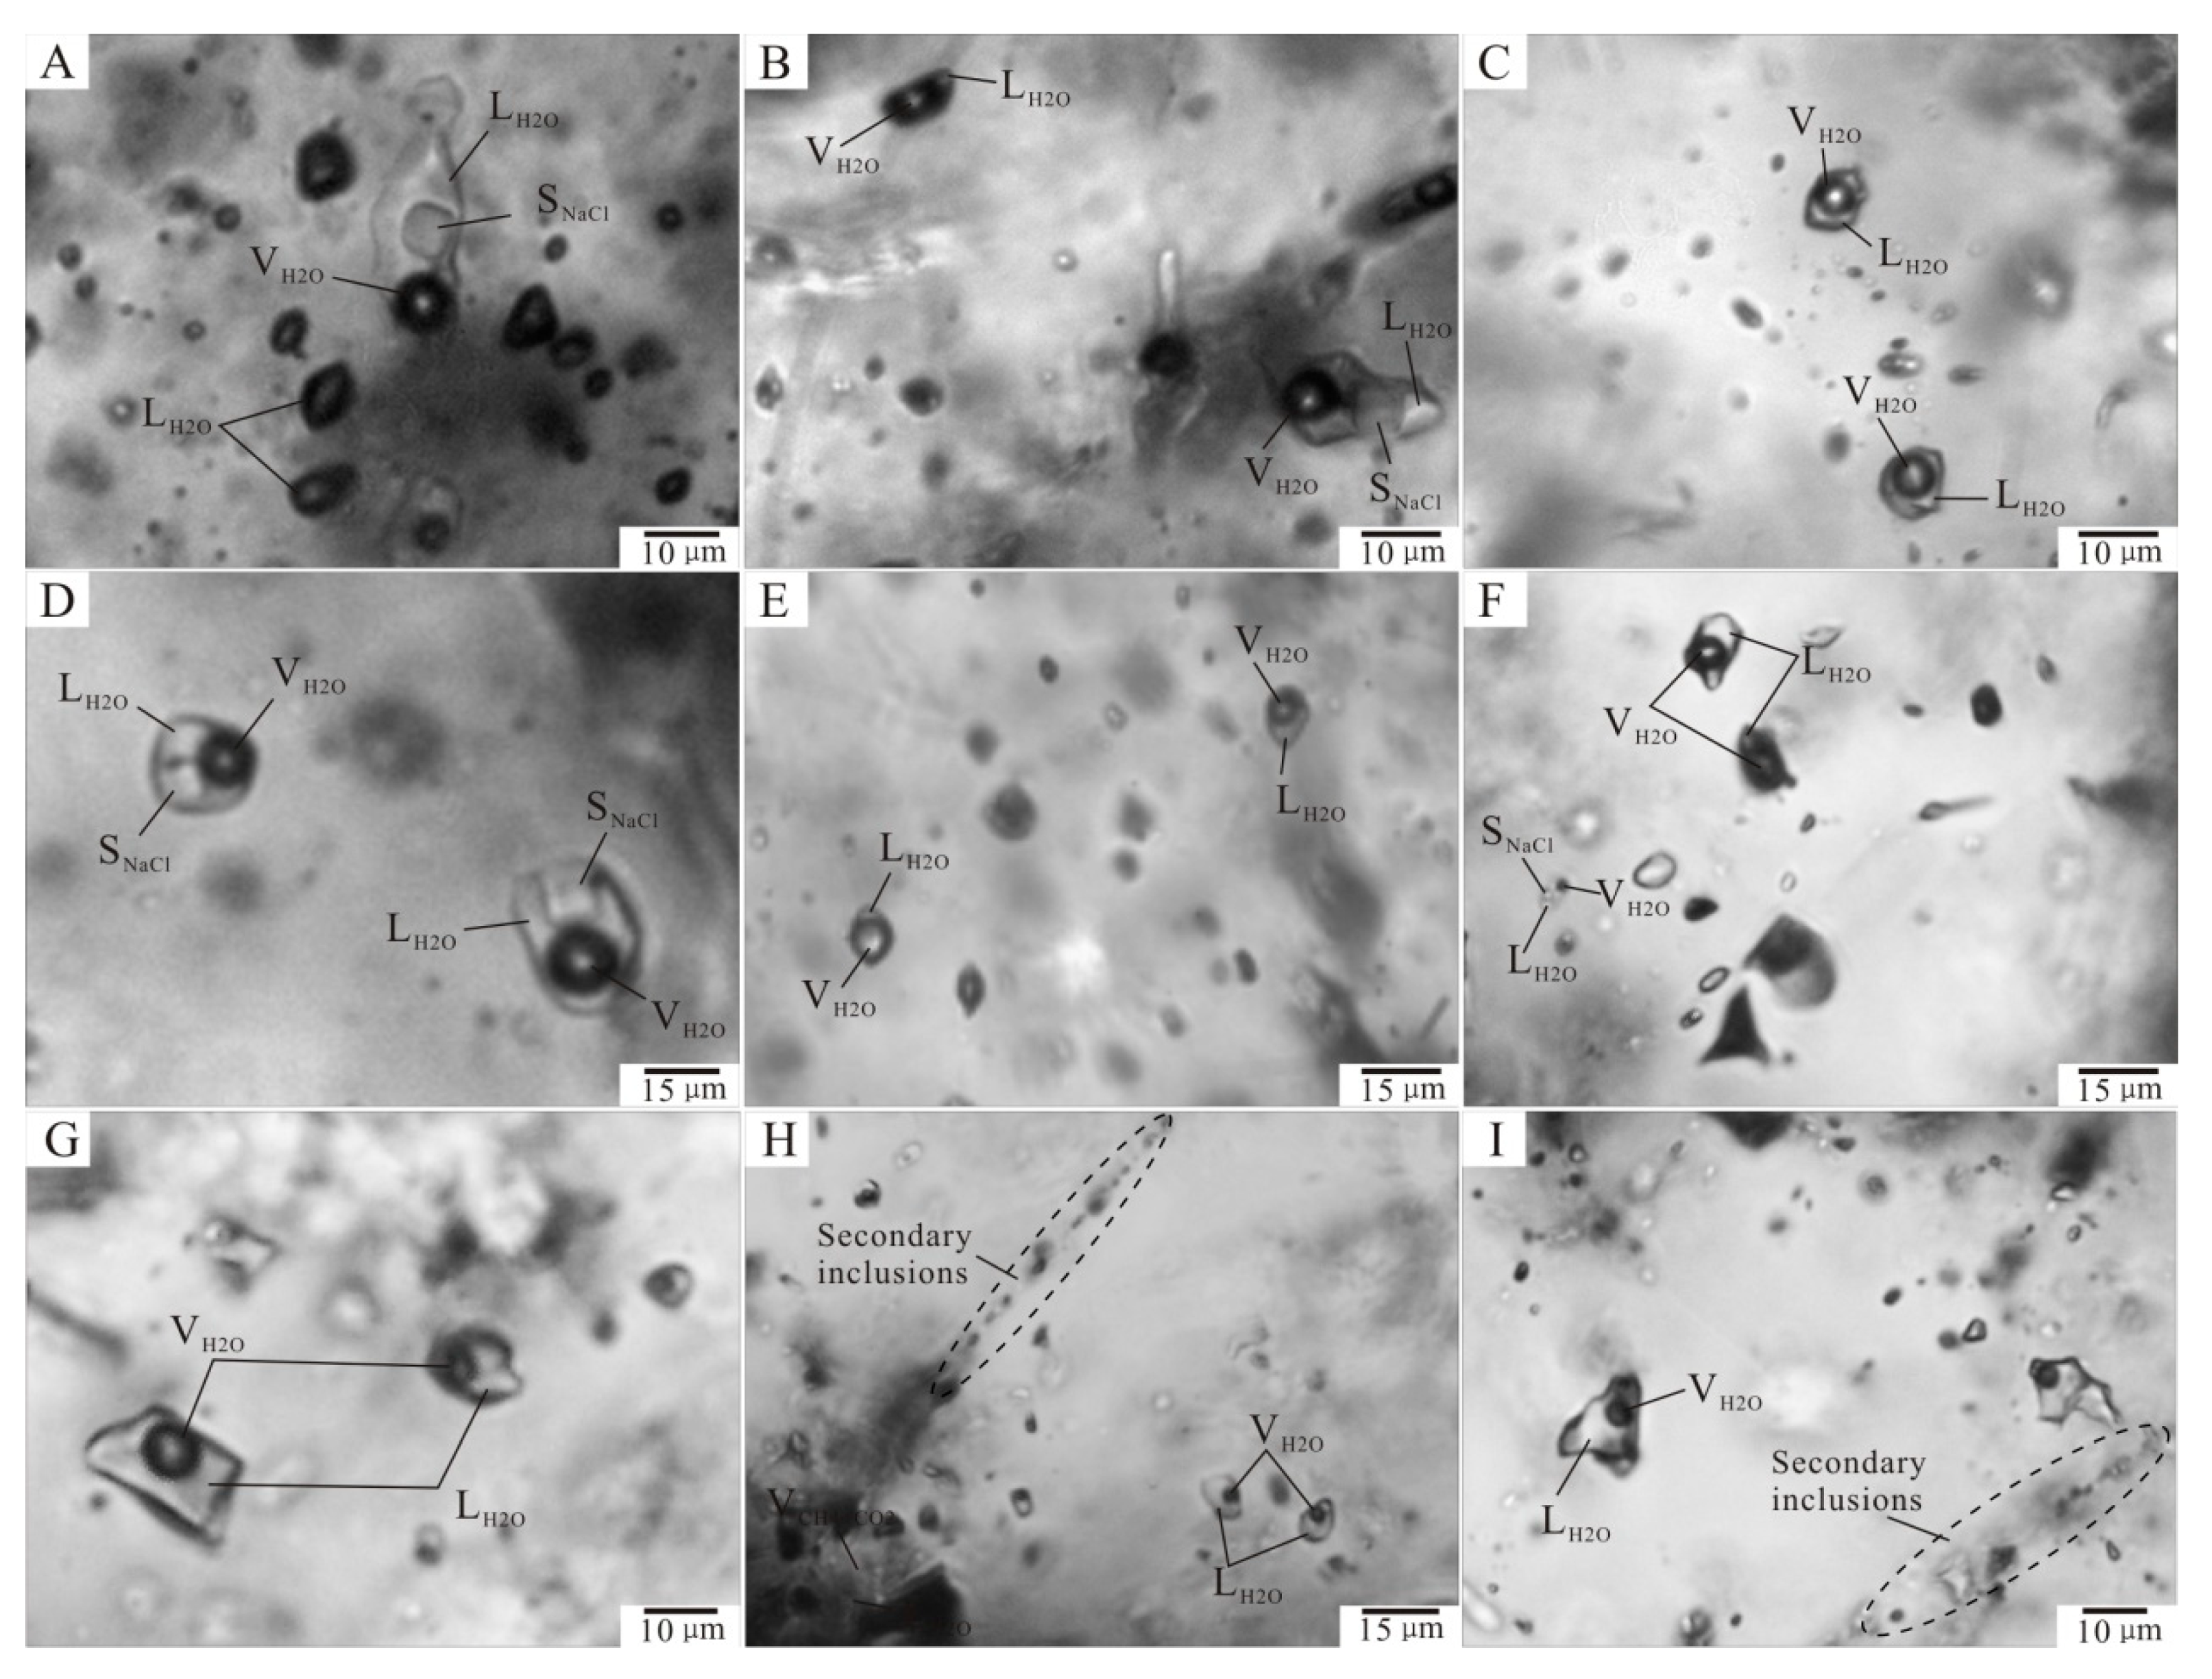
6.1. Fluid Inclusion Petrography
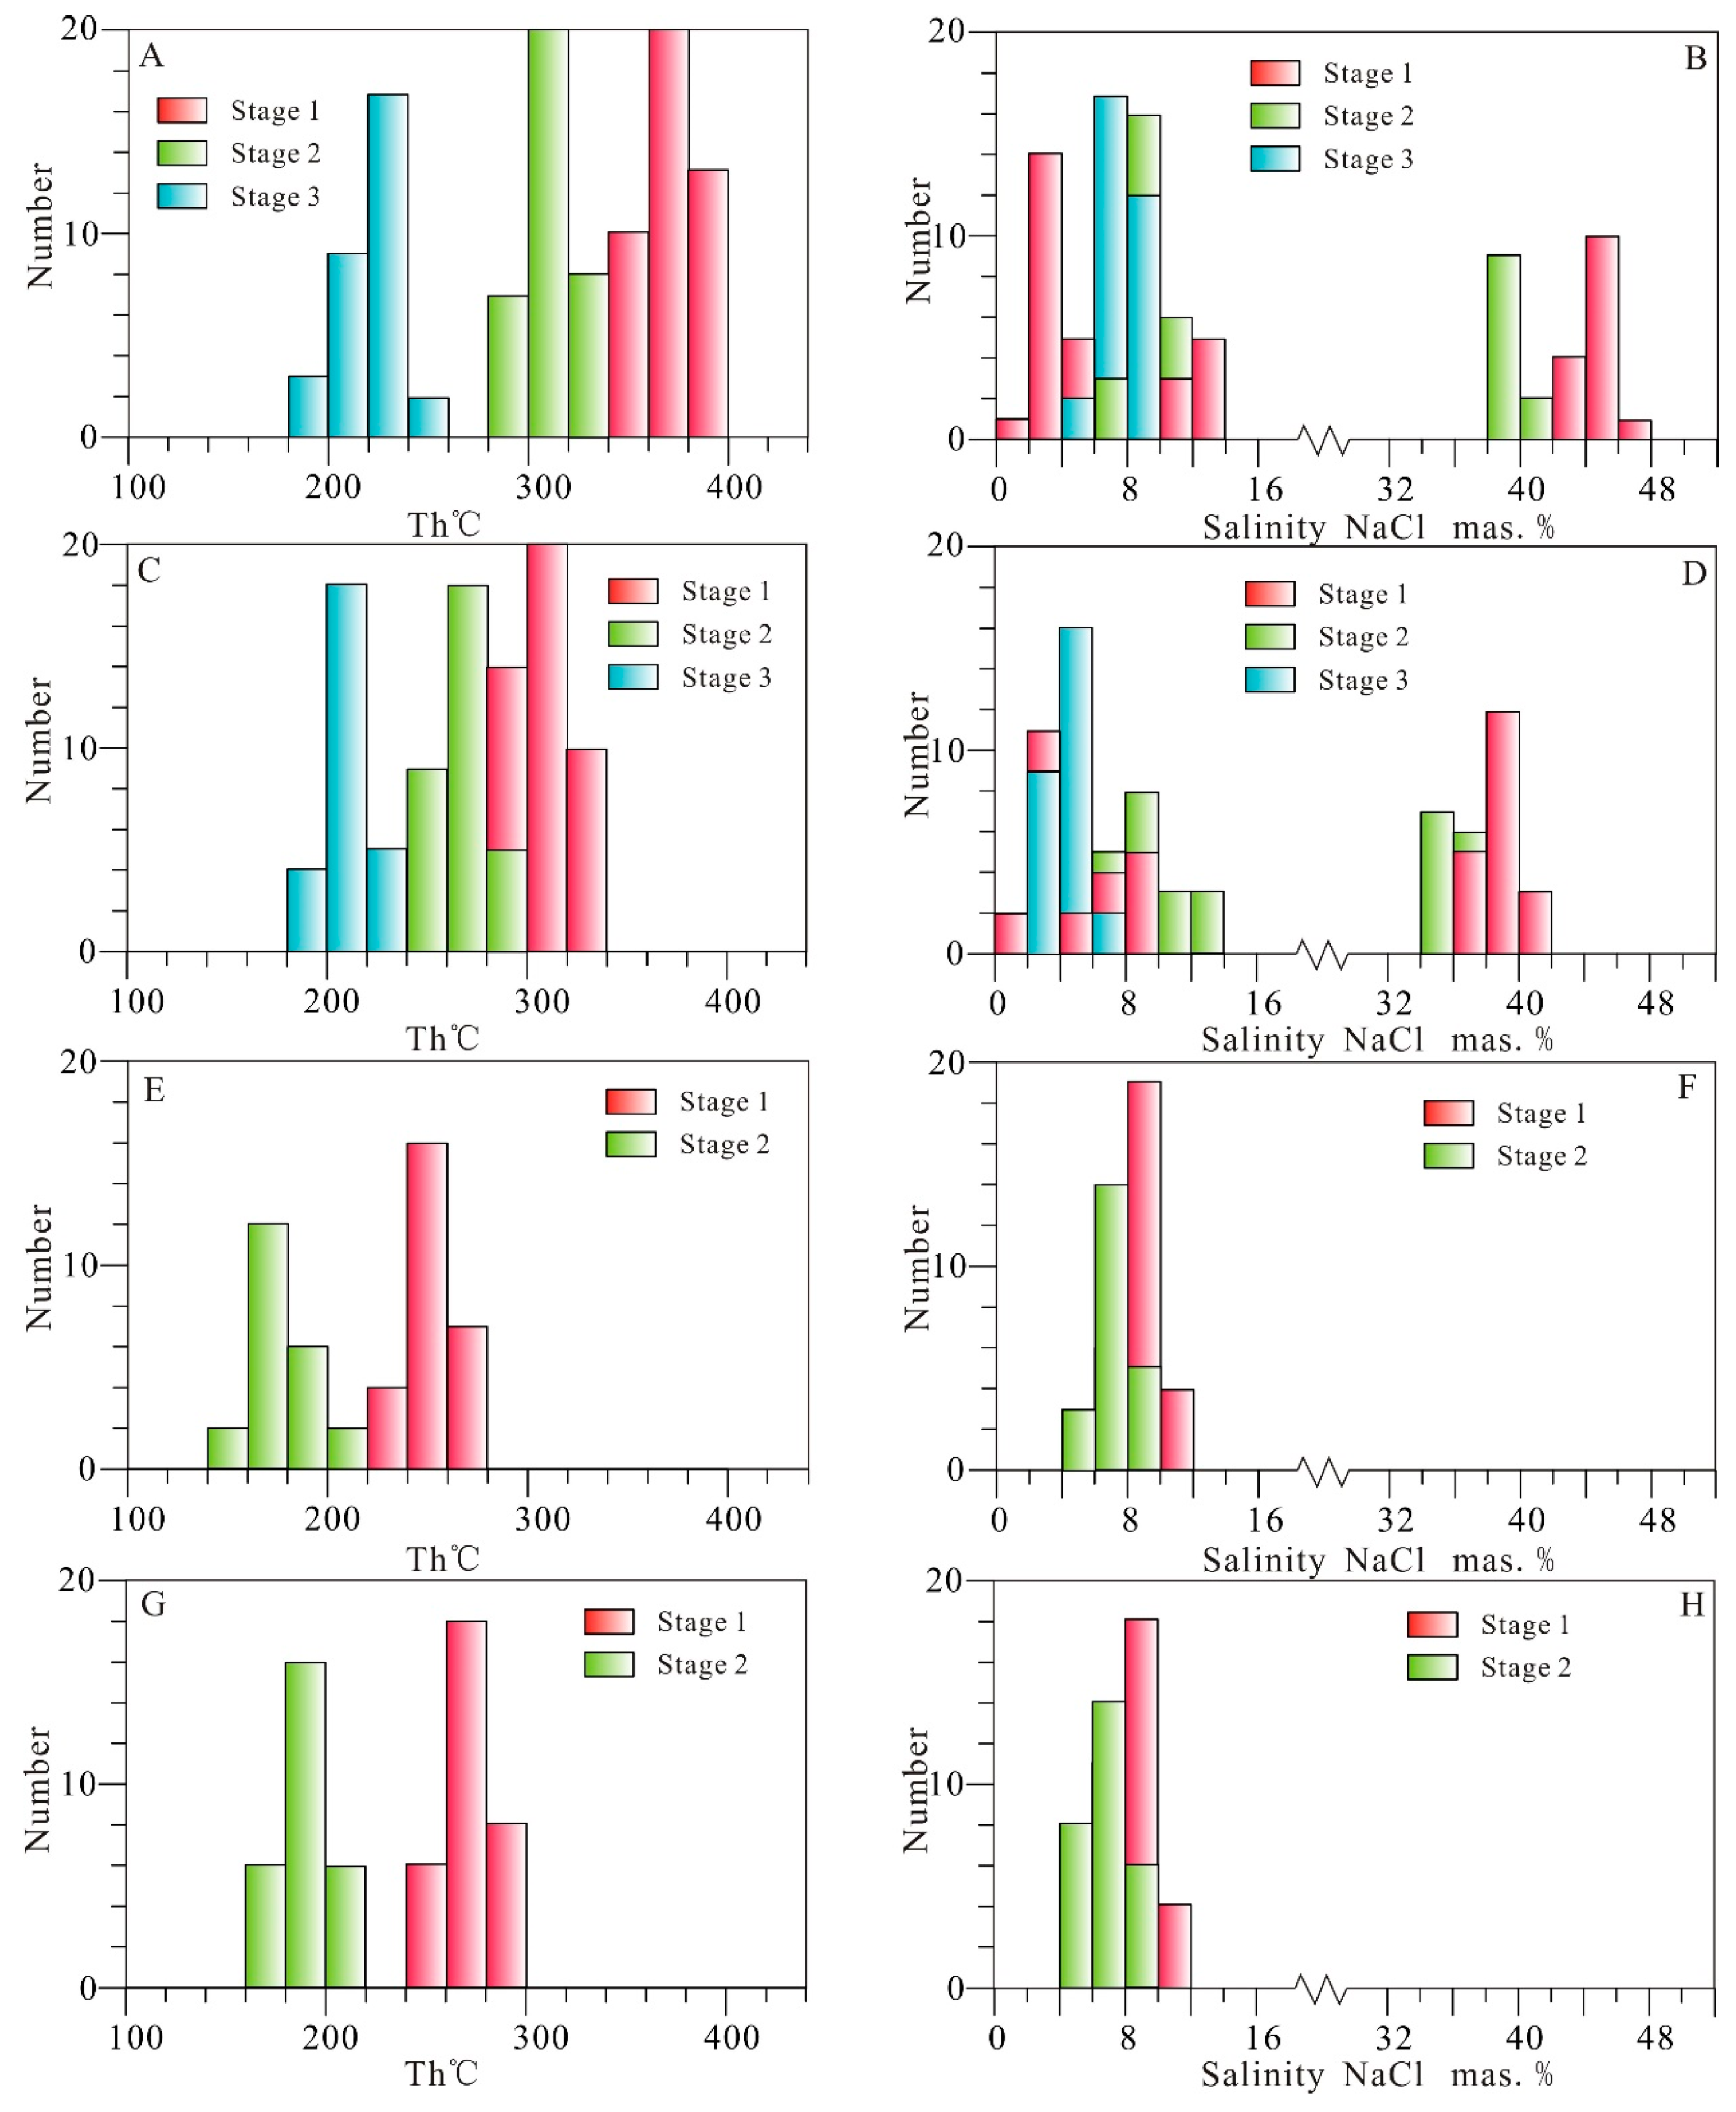
6.2. Fluid Inclusion Microthermometry
6.2.1. Jinxiantou Deposit
6.2.2. Changgou Deposit
6.2.3. Hongshigang Deposit
6.2.4. Xingshanyu Deposit
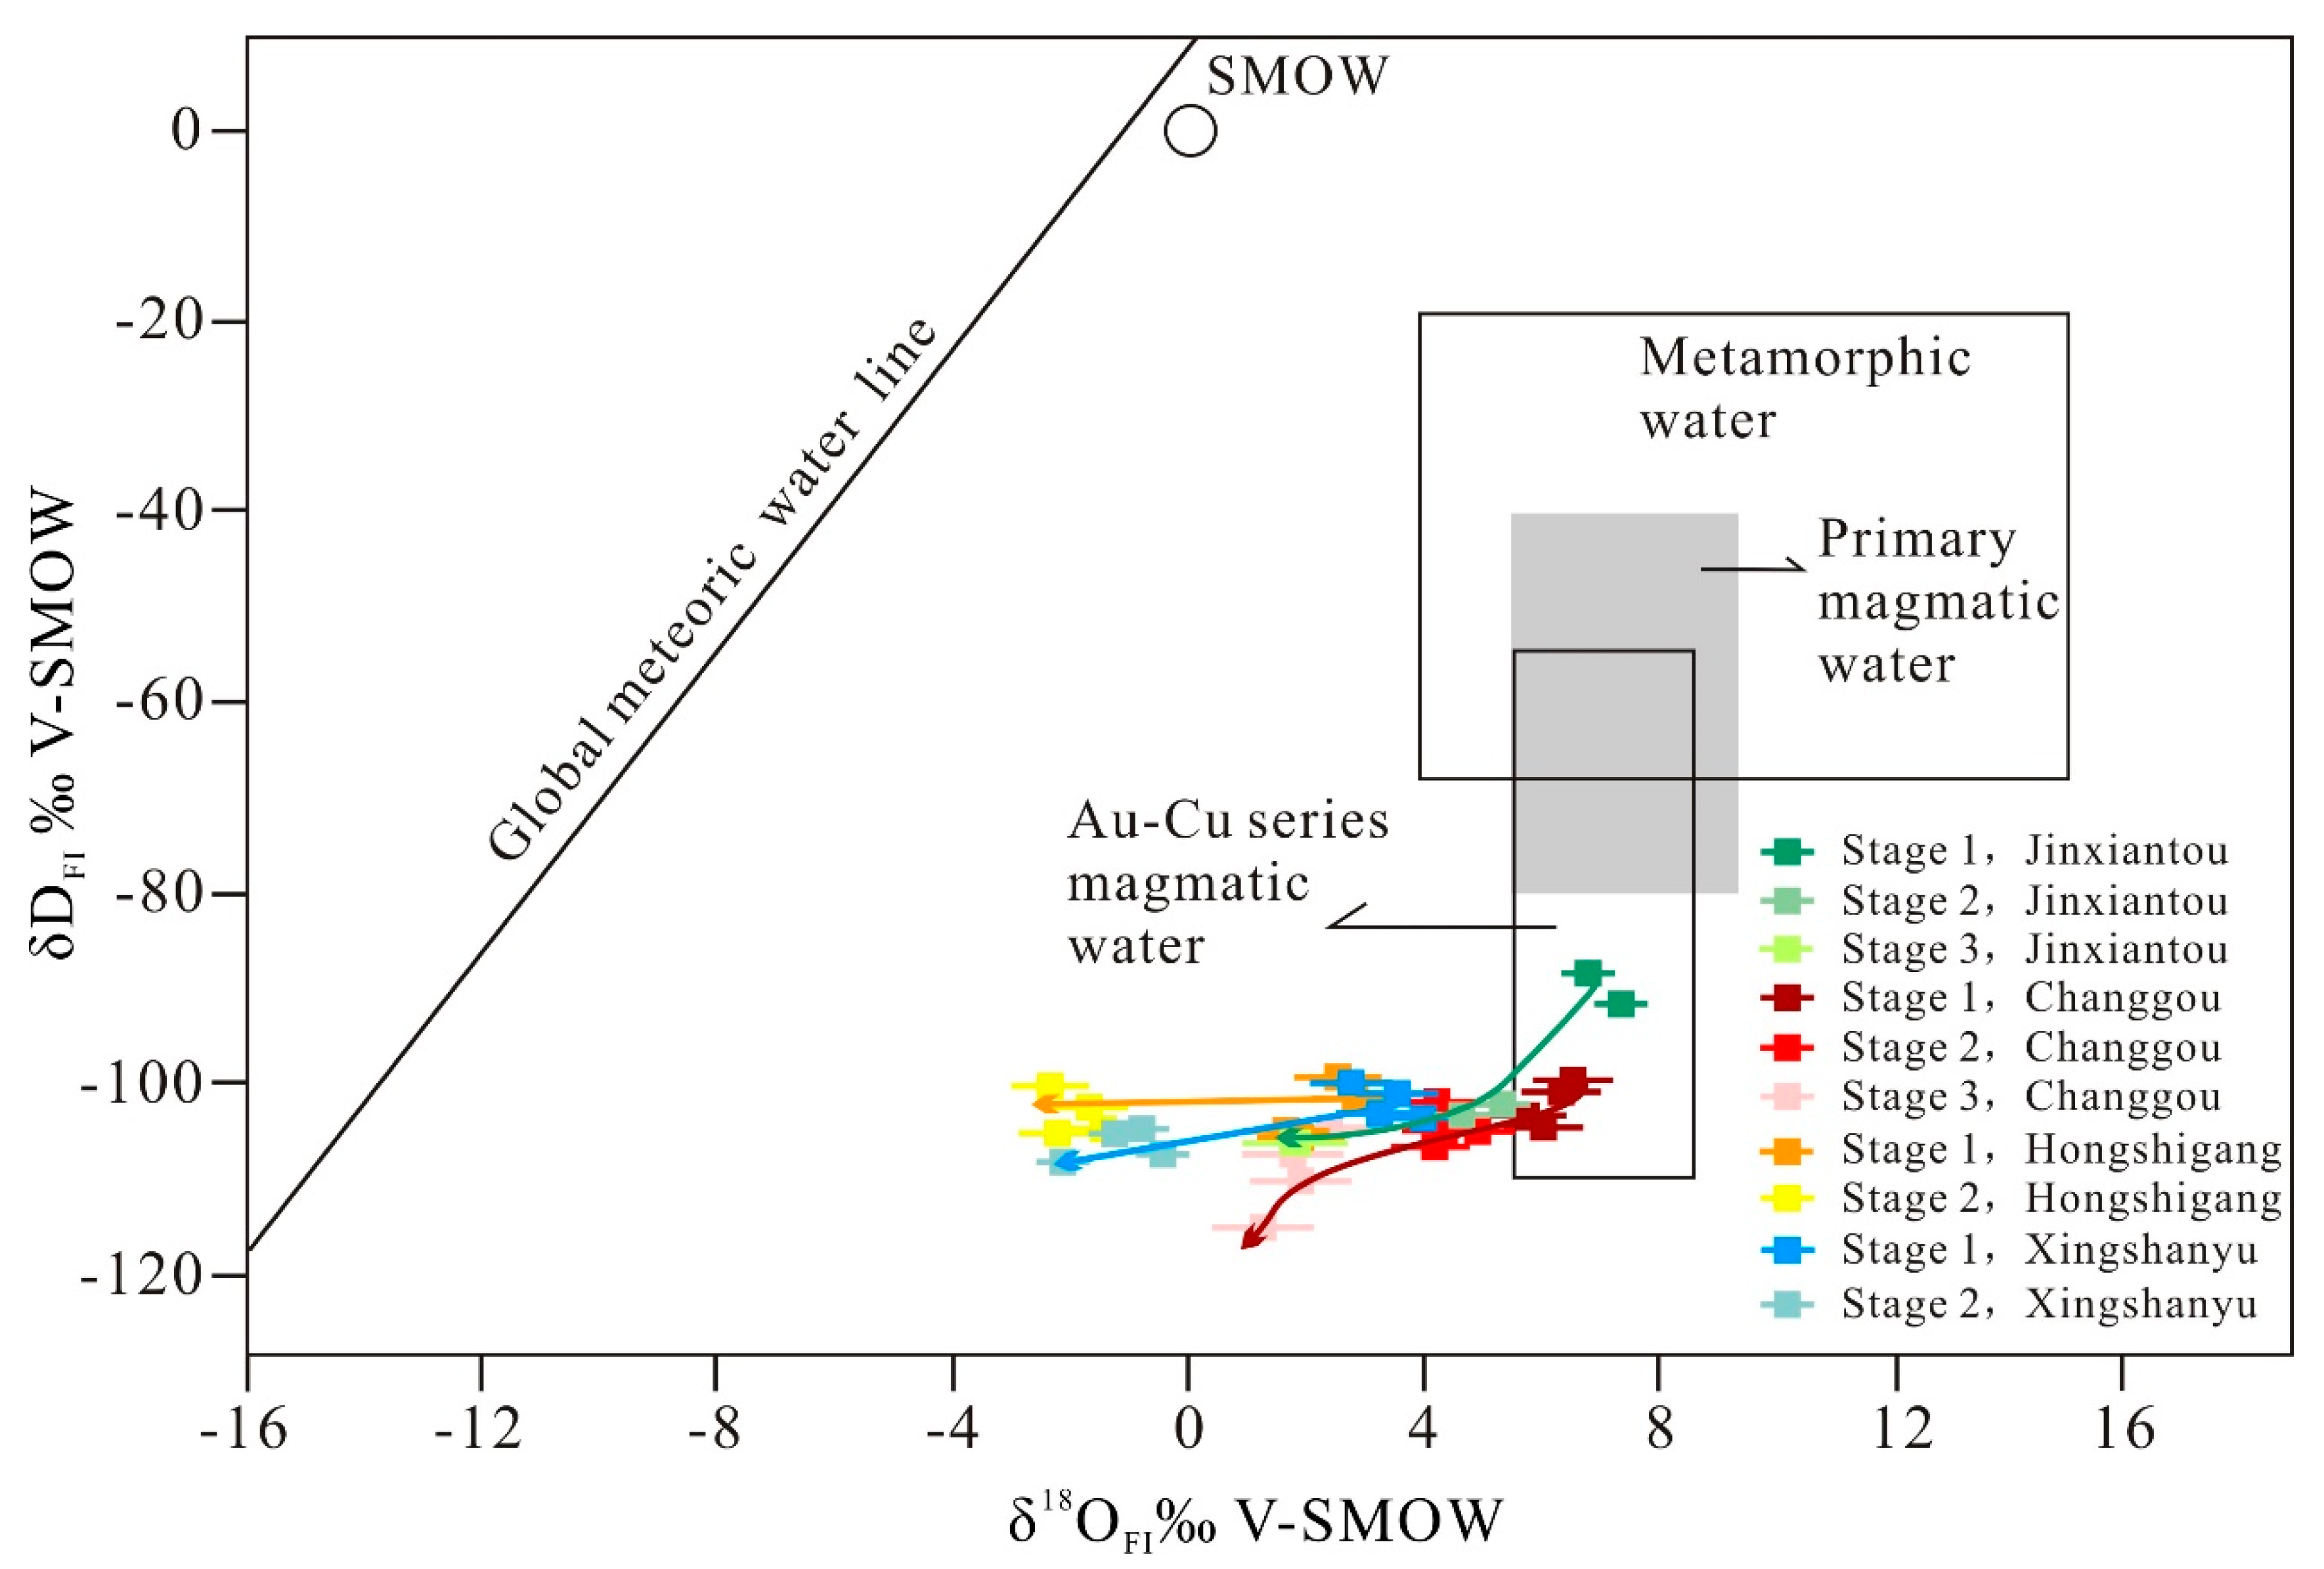
6.3. Oxygen and Hydrogen Isotopes
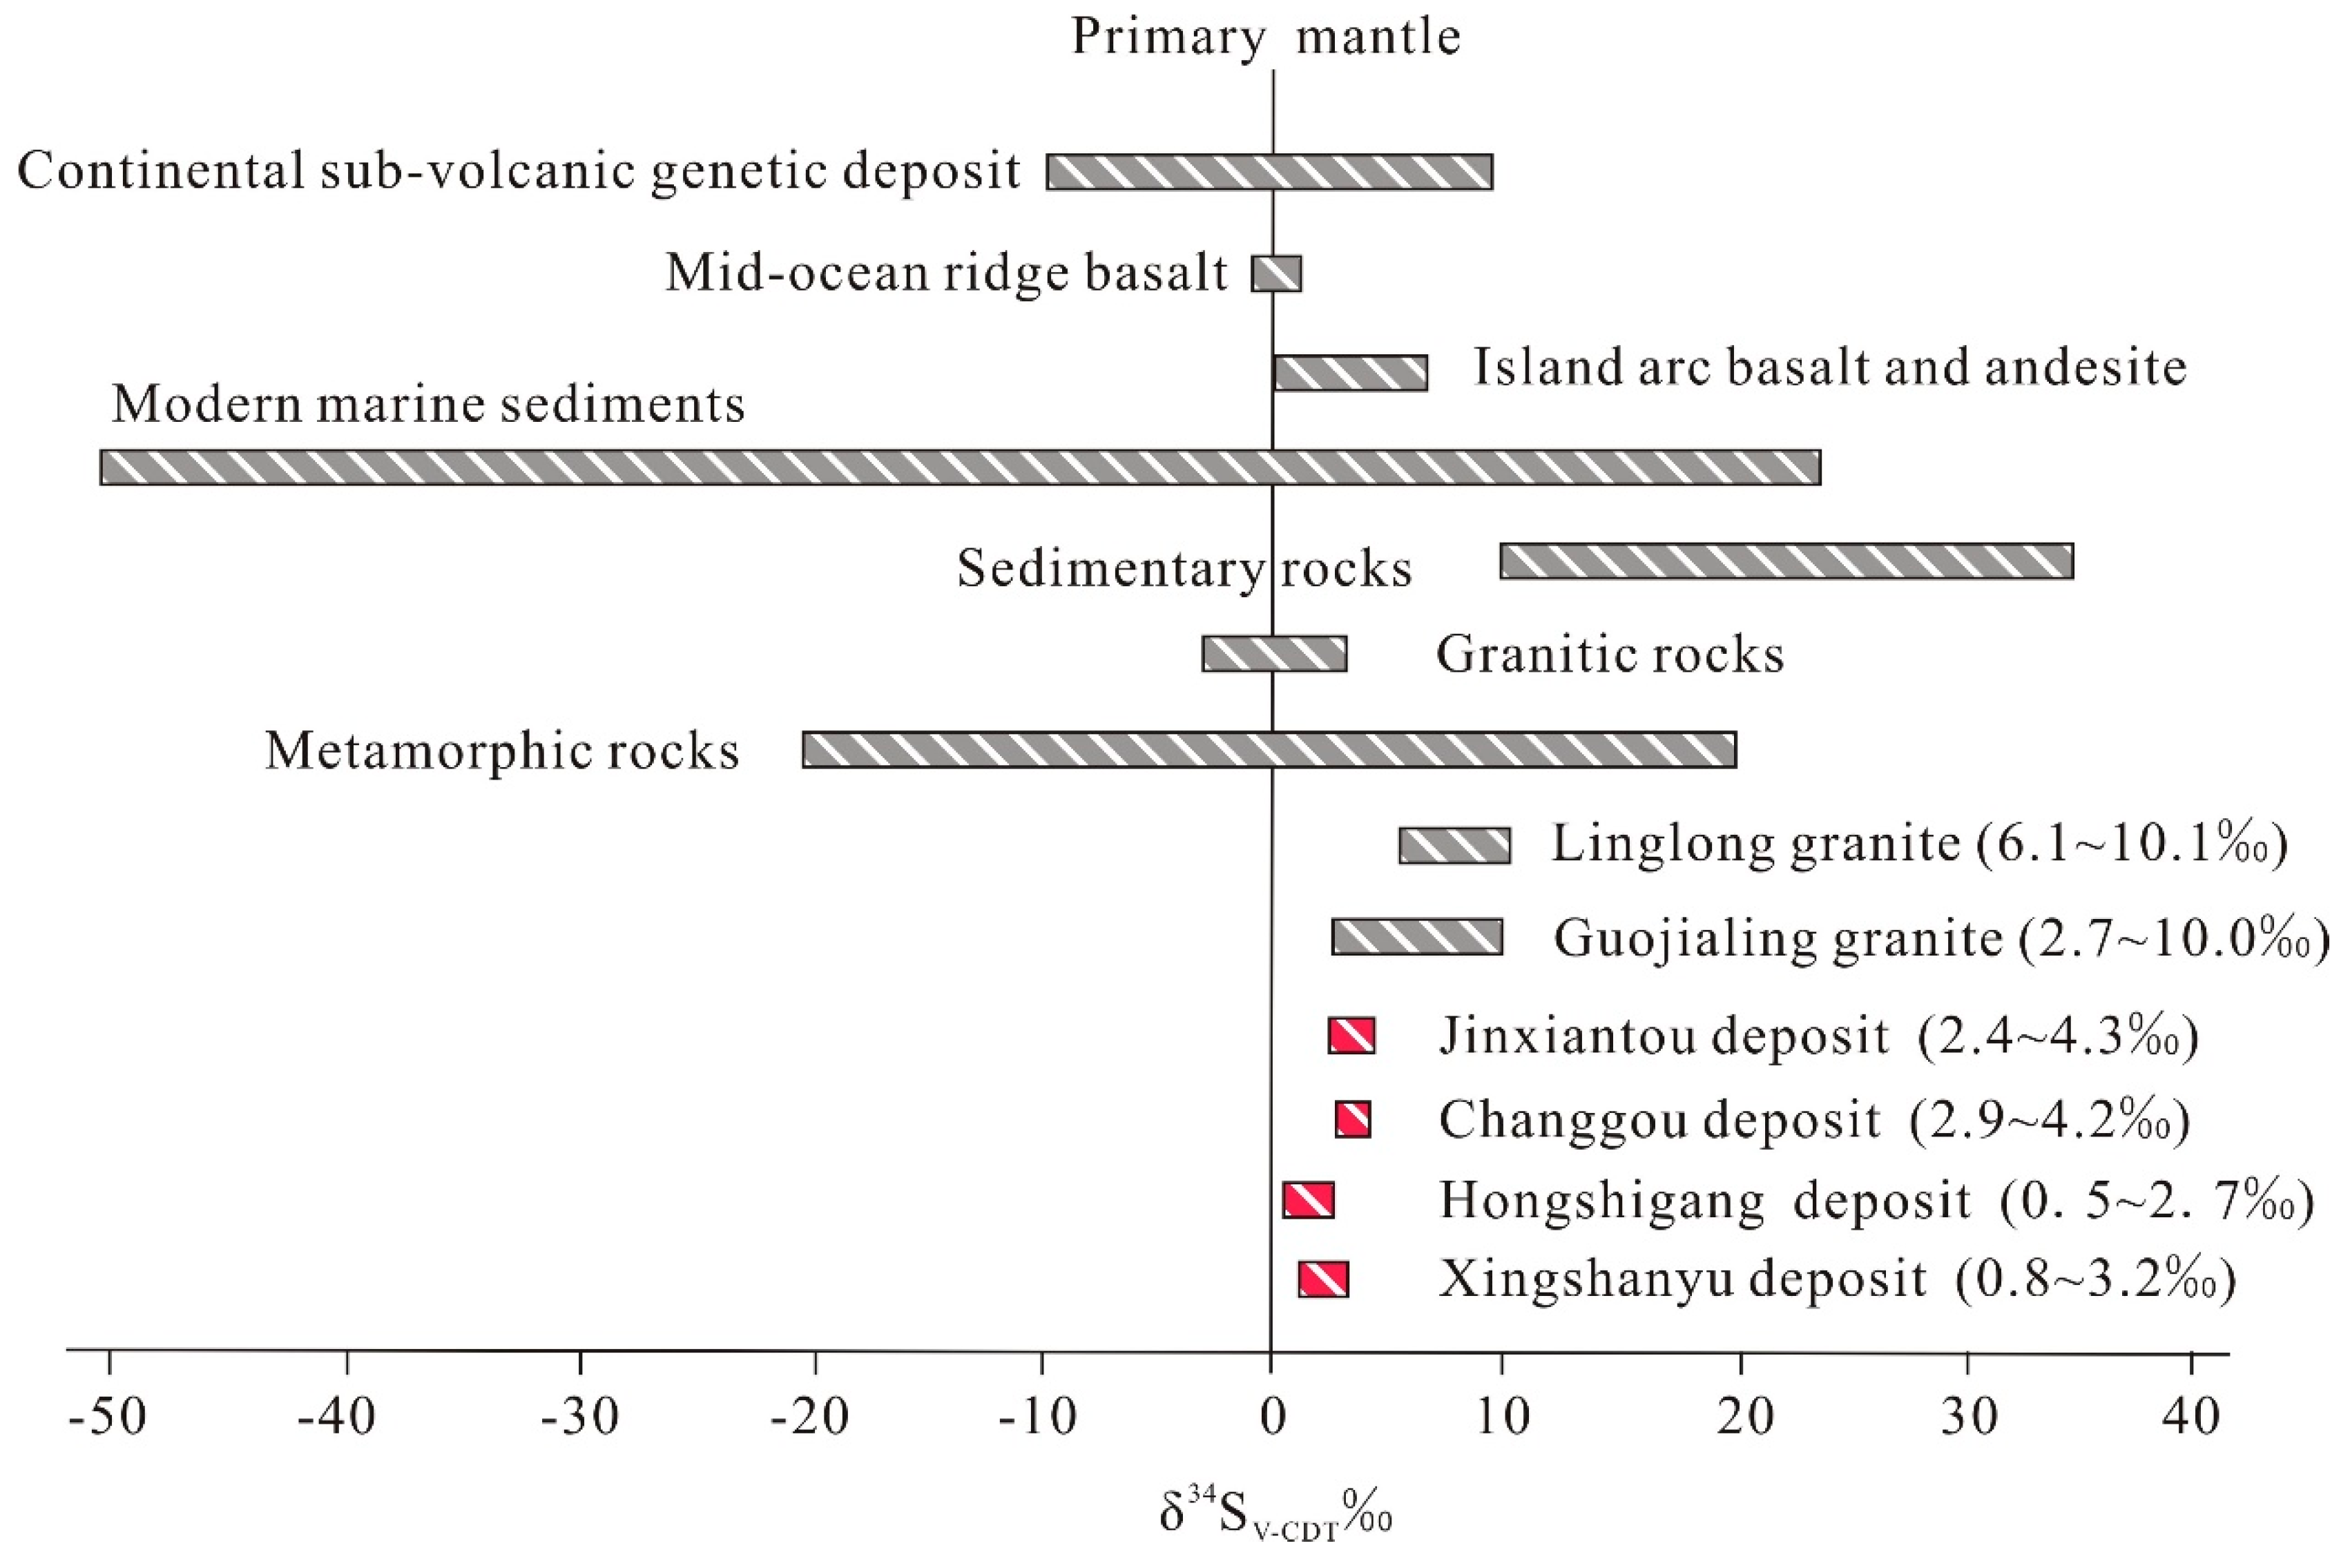
6.4. Sulfur Isotopes
7. Discussion
7.1. Sources of Ore Constituents
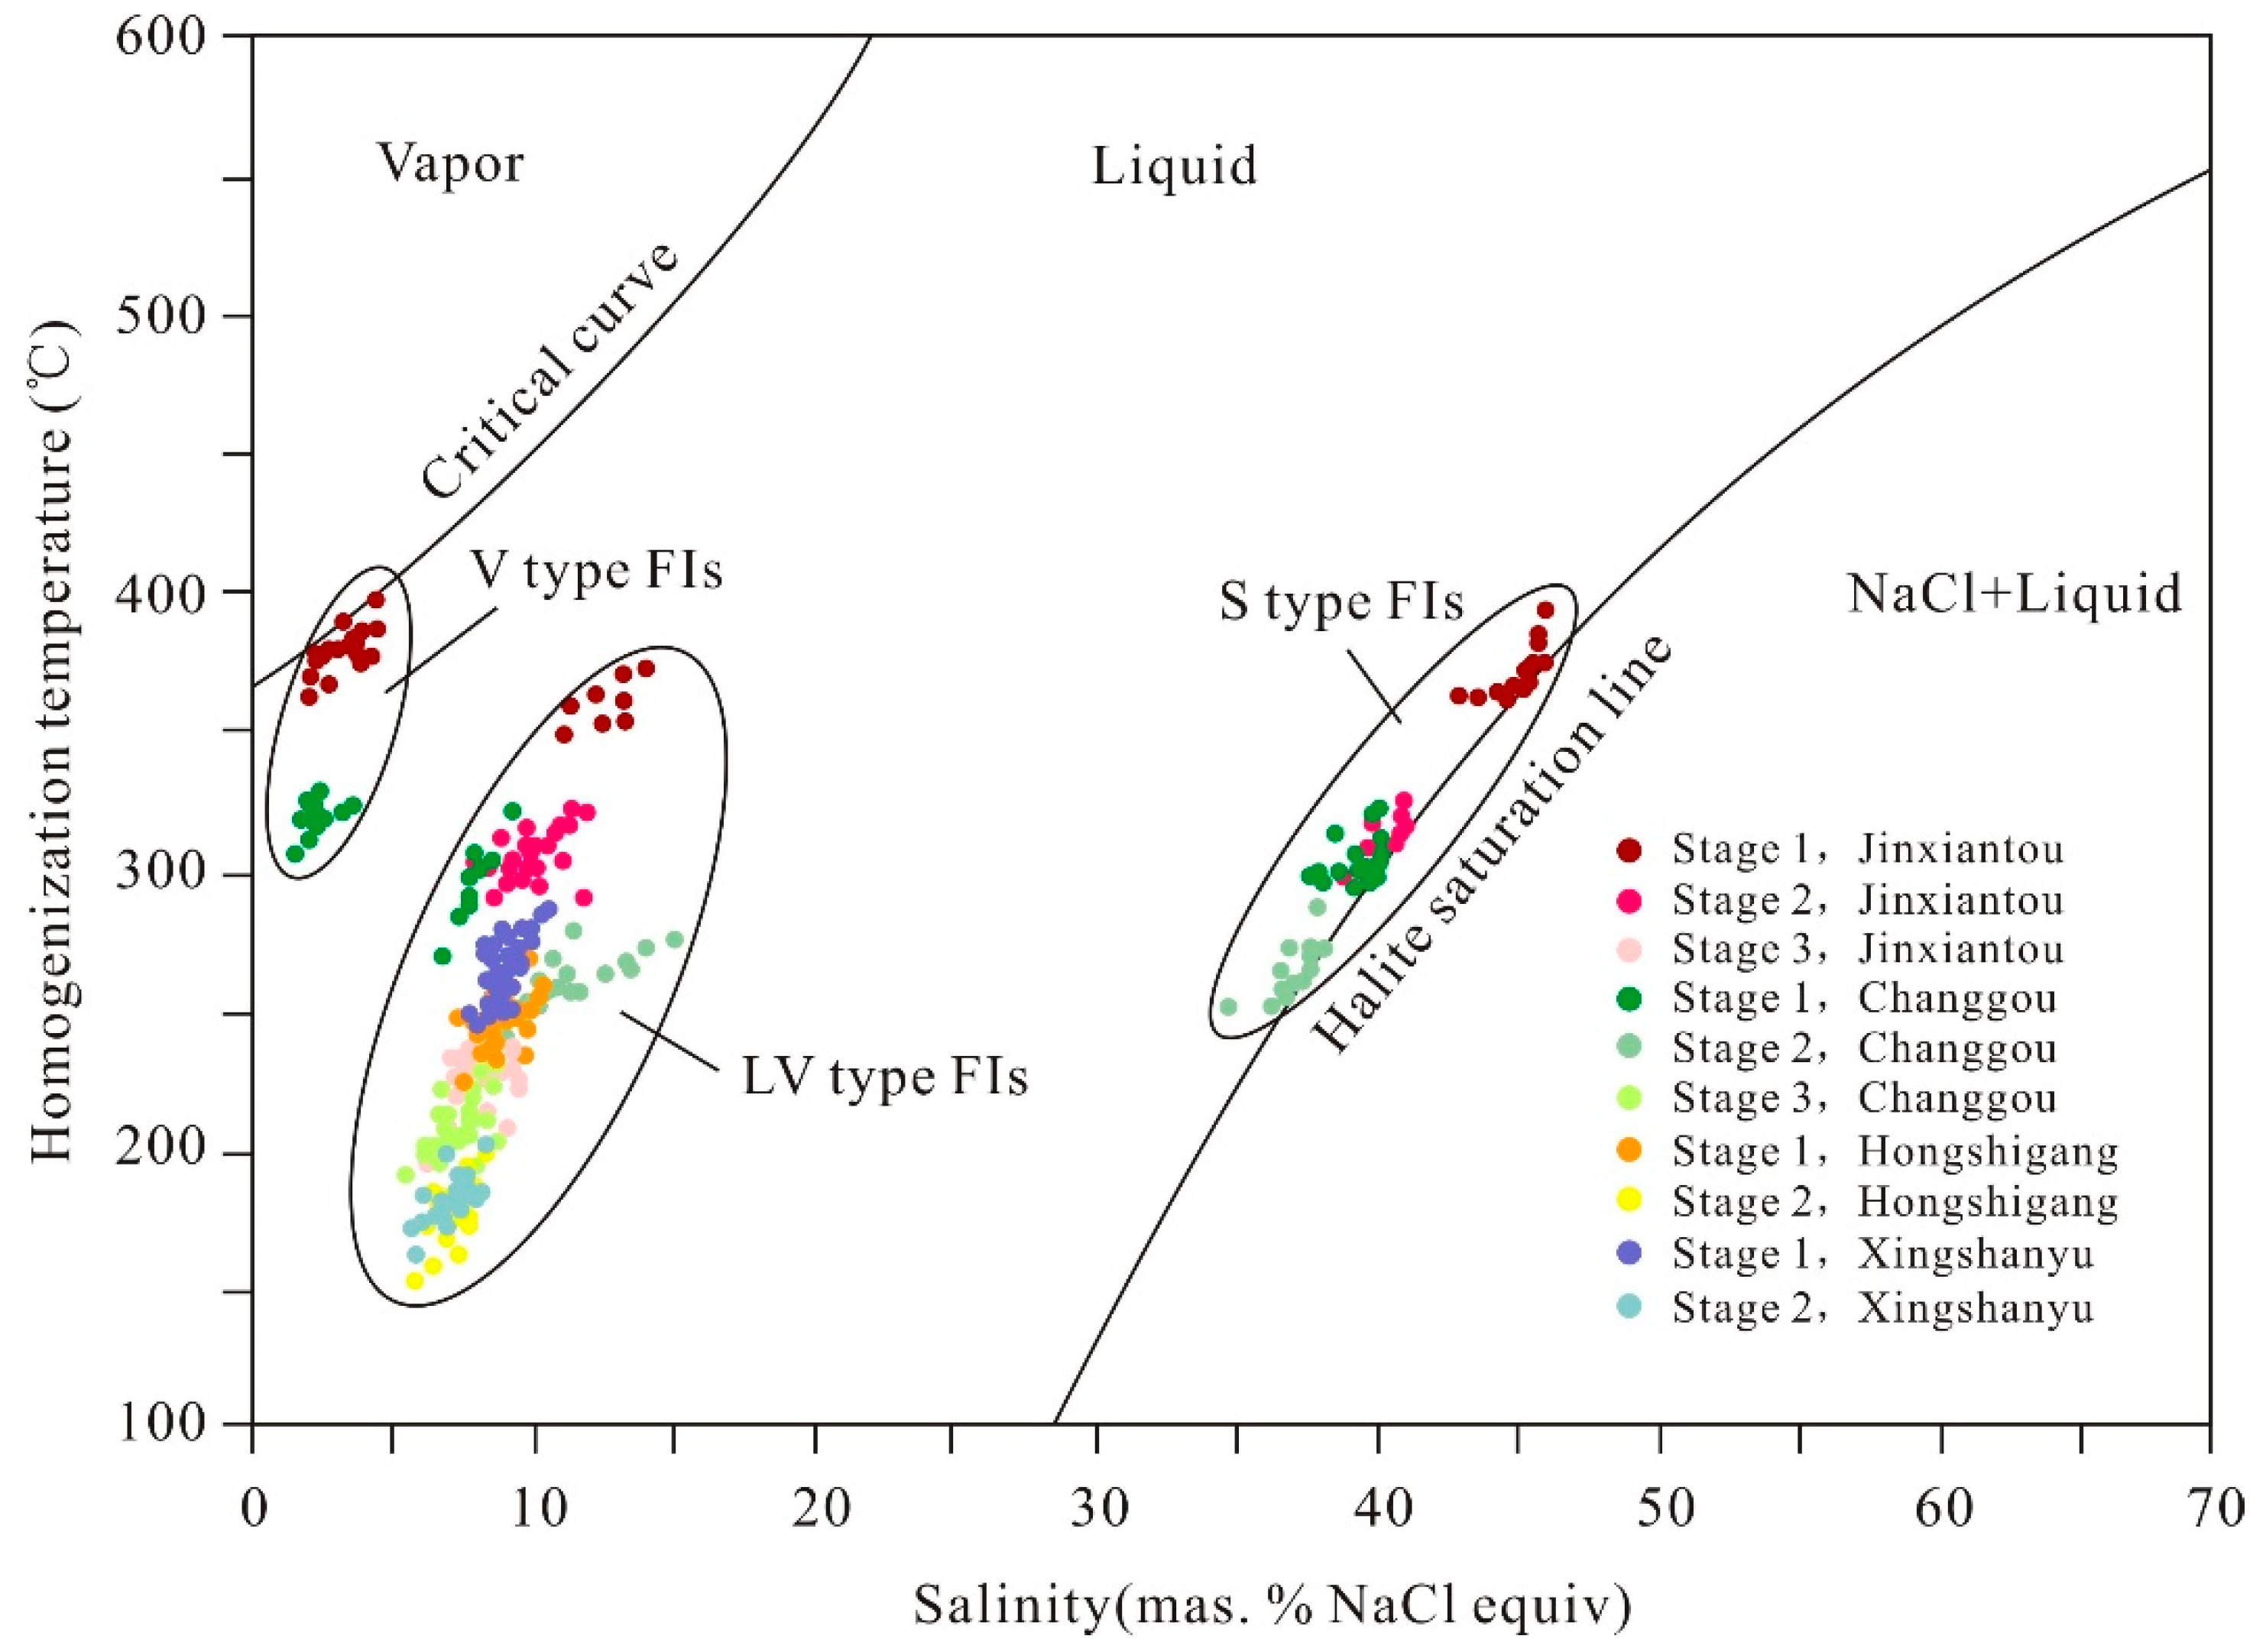
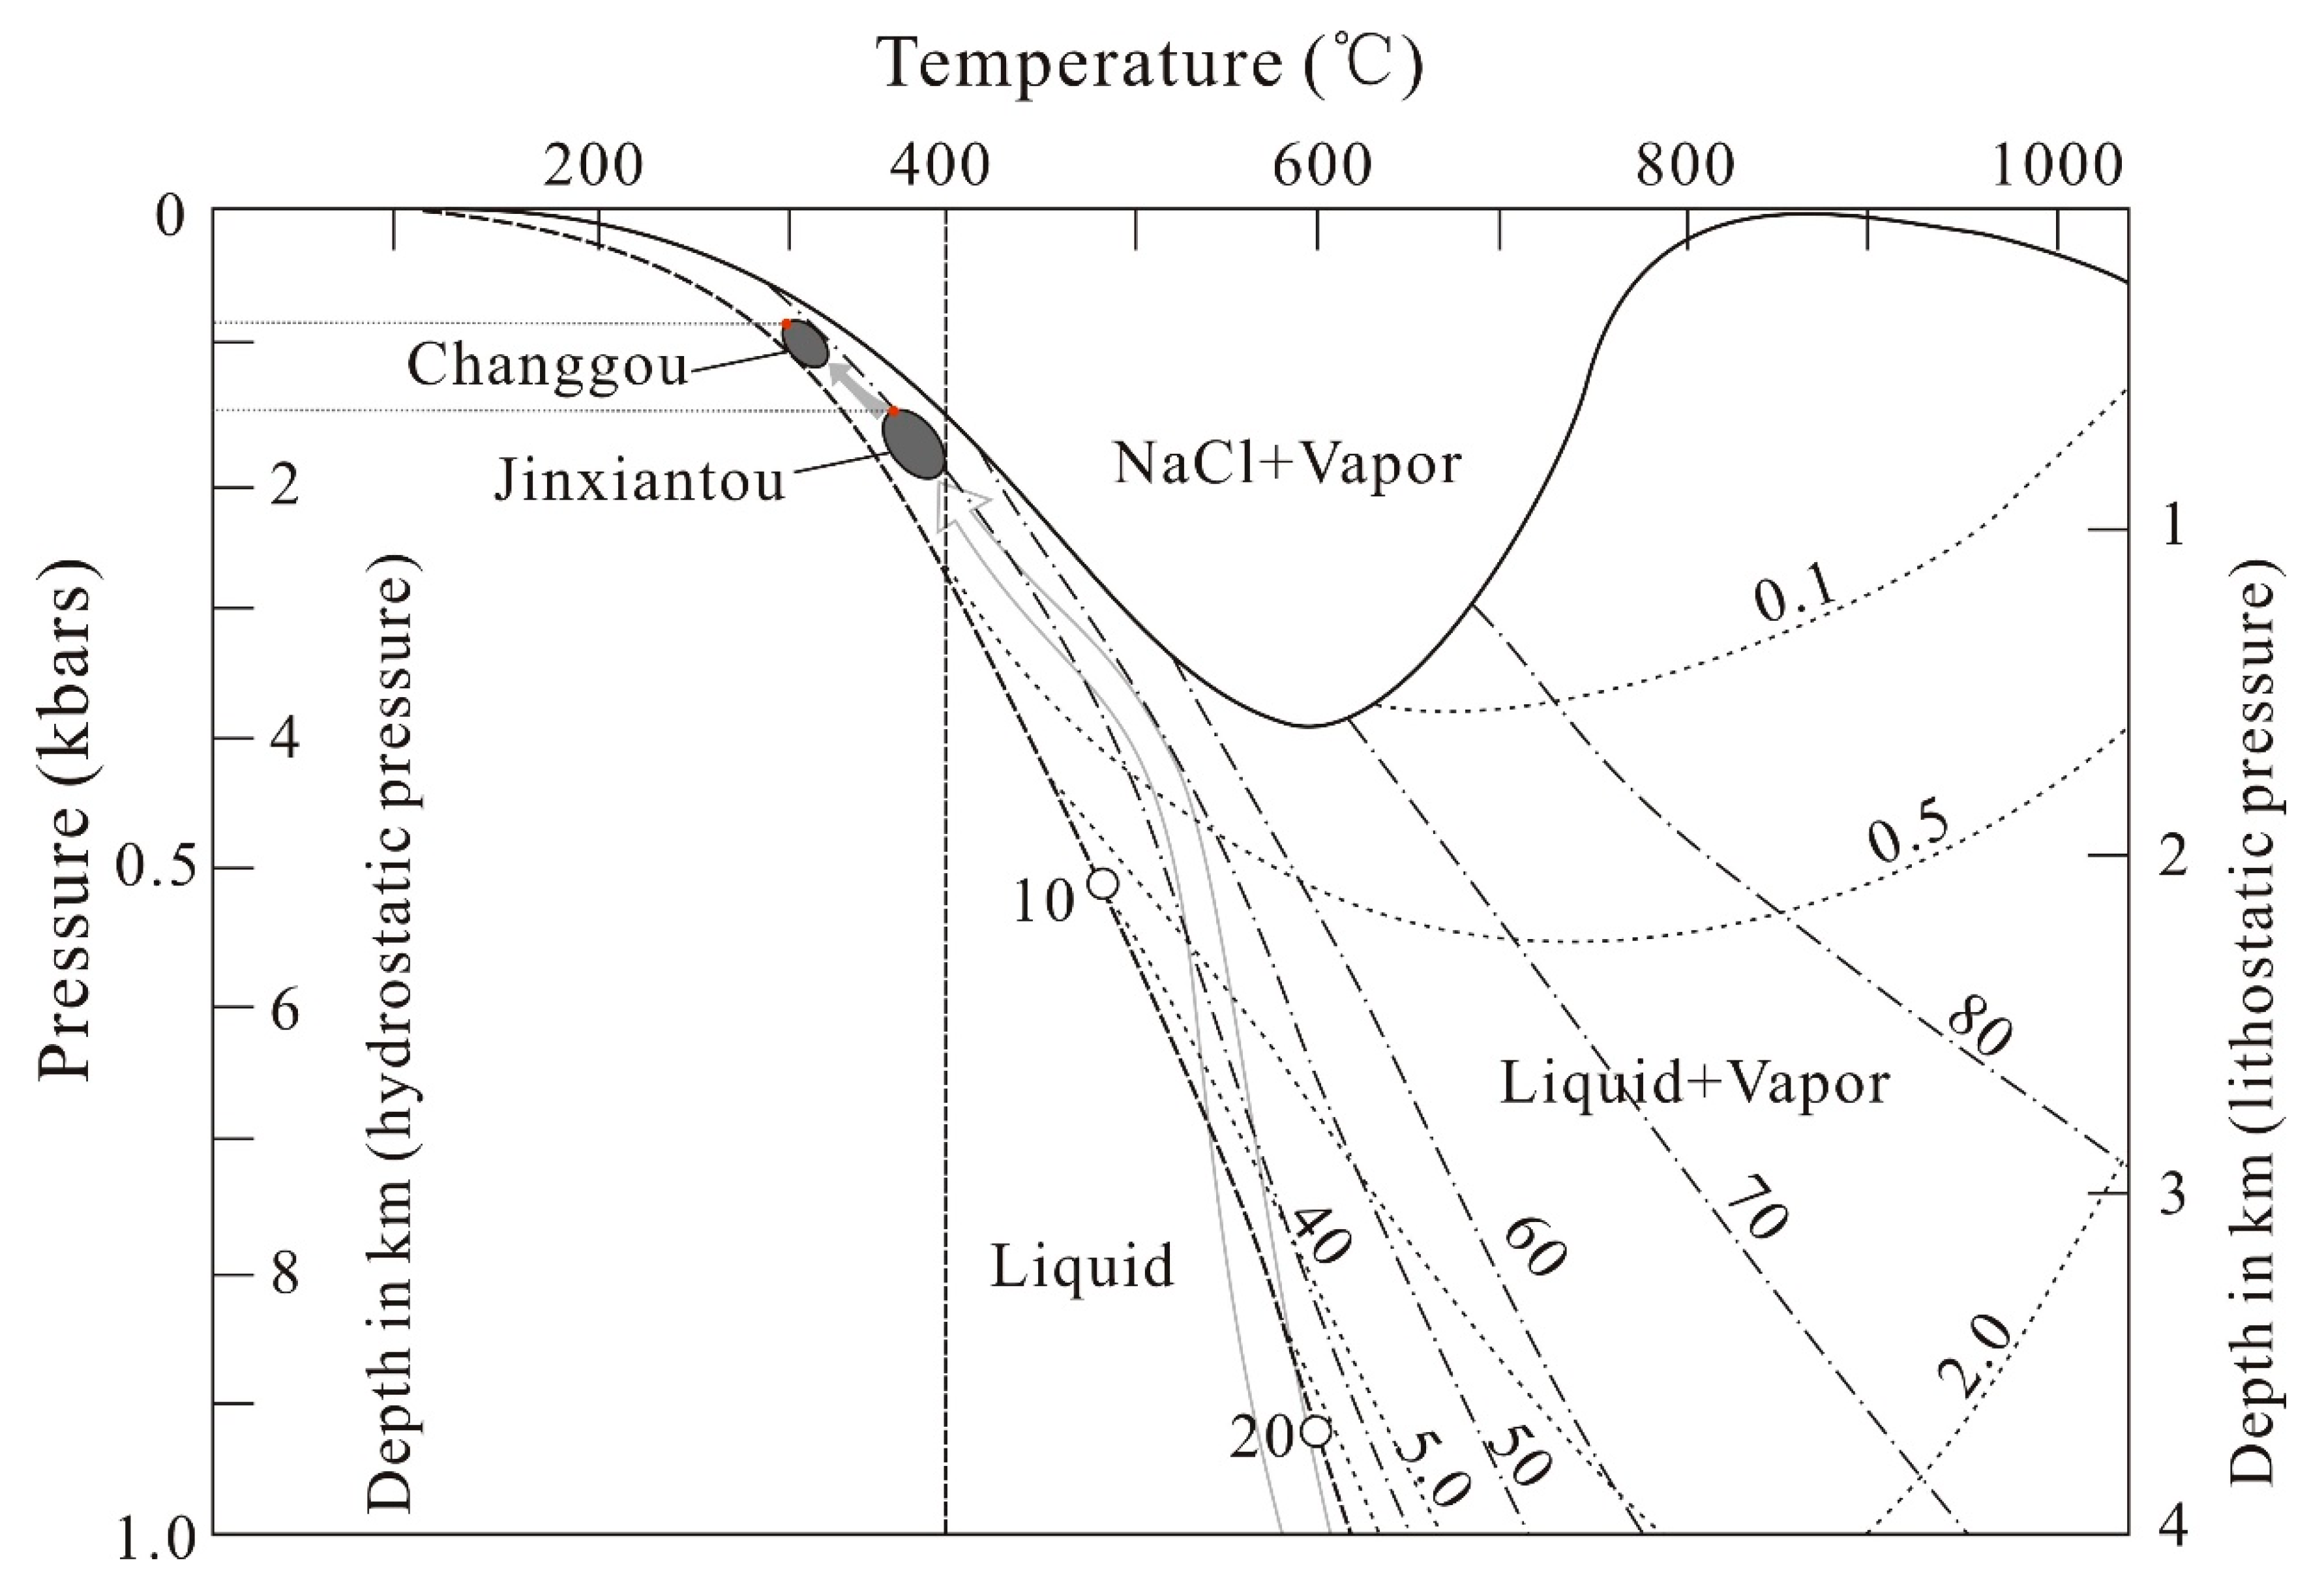
7.2. Fluid Compositions and Pressure–Temperature (P–T) Conditions of Fluid Trapping
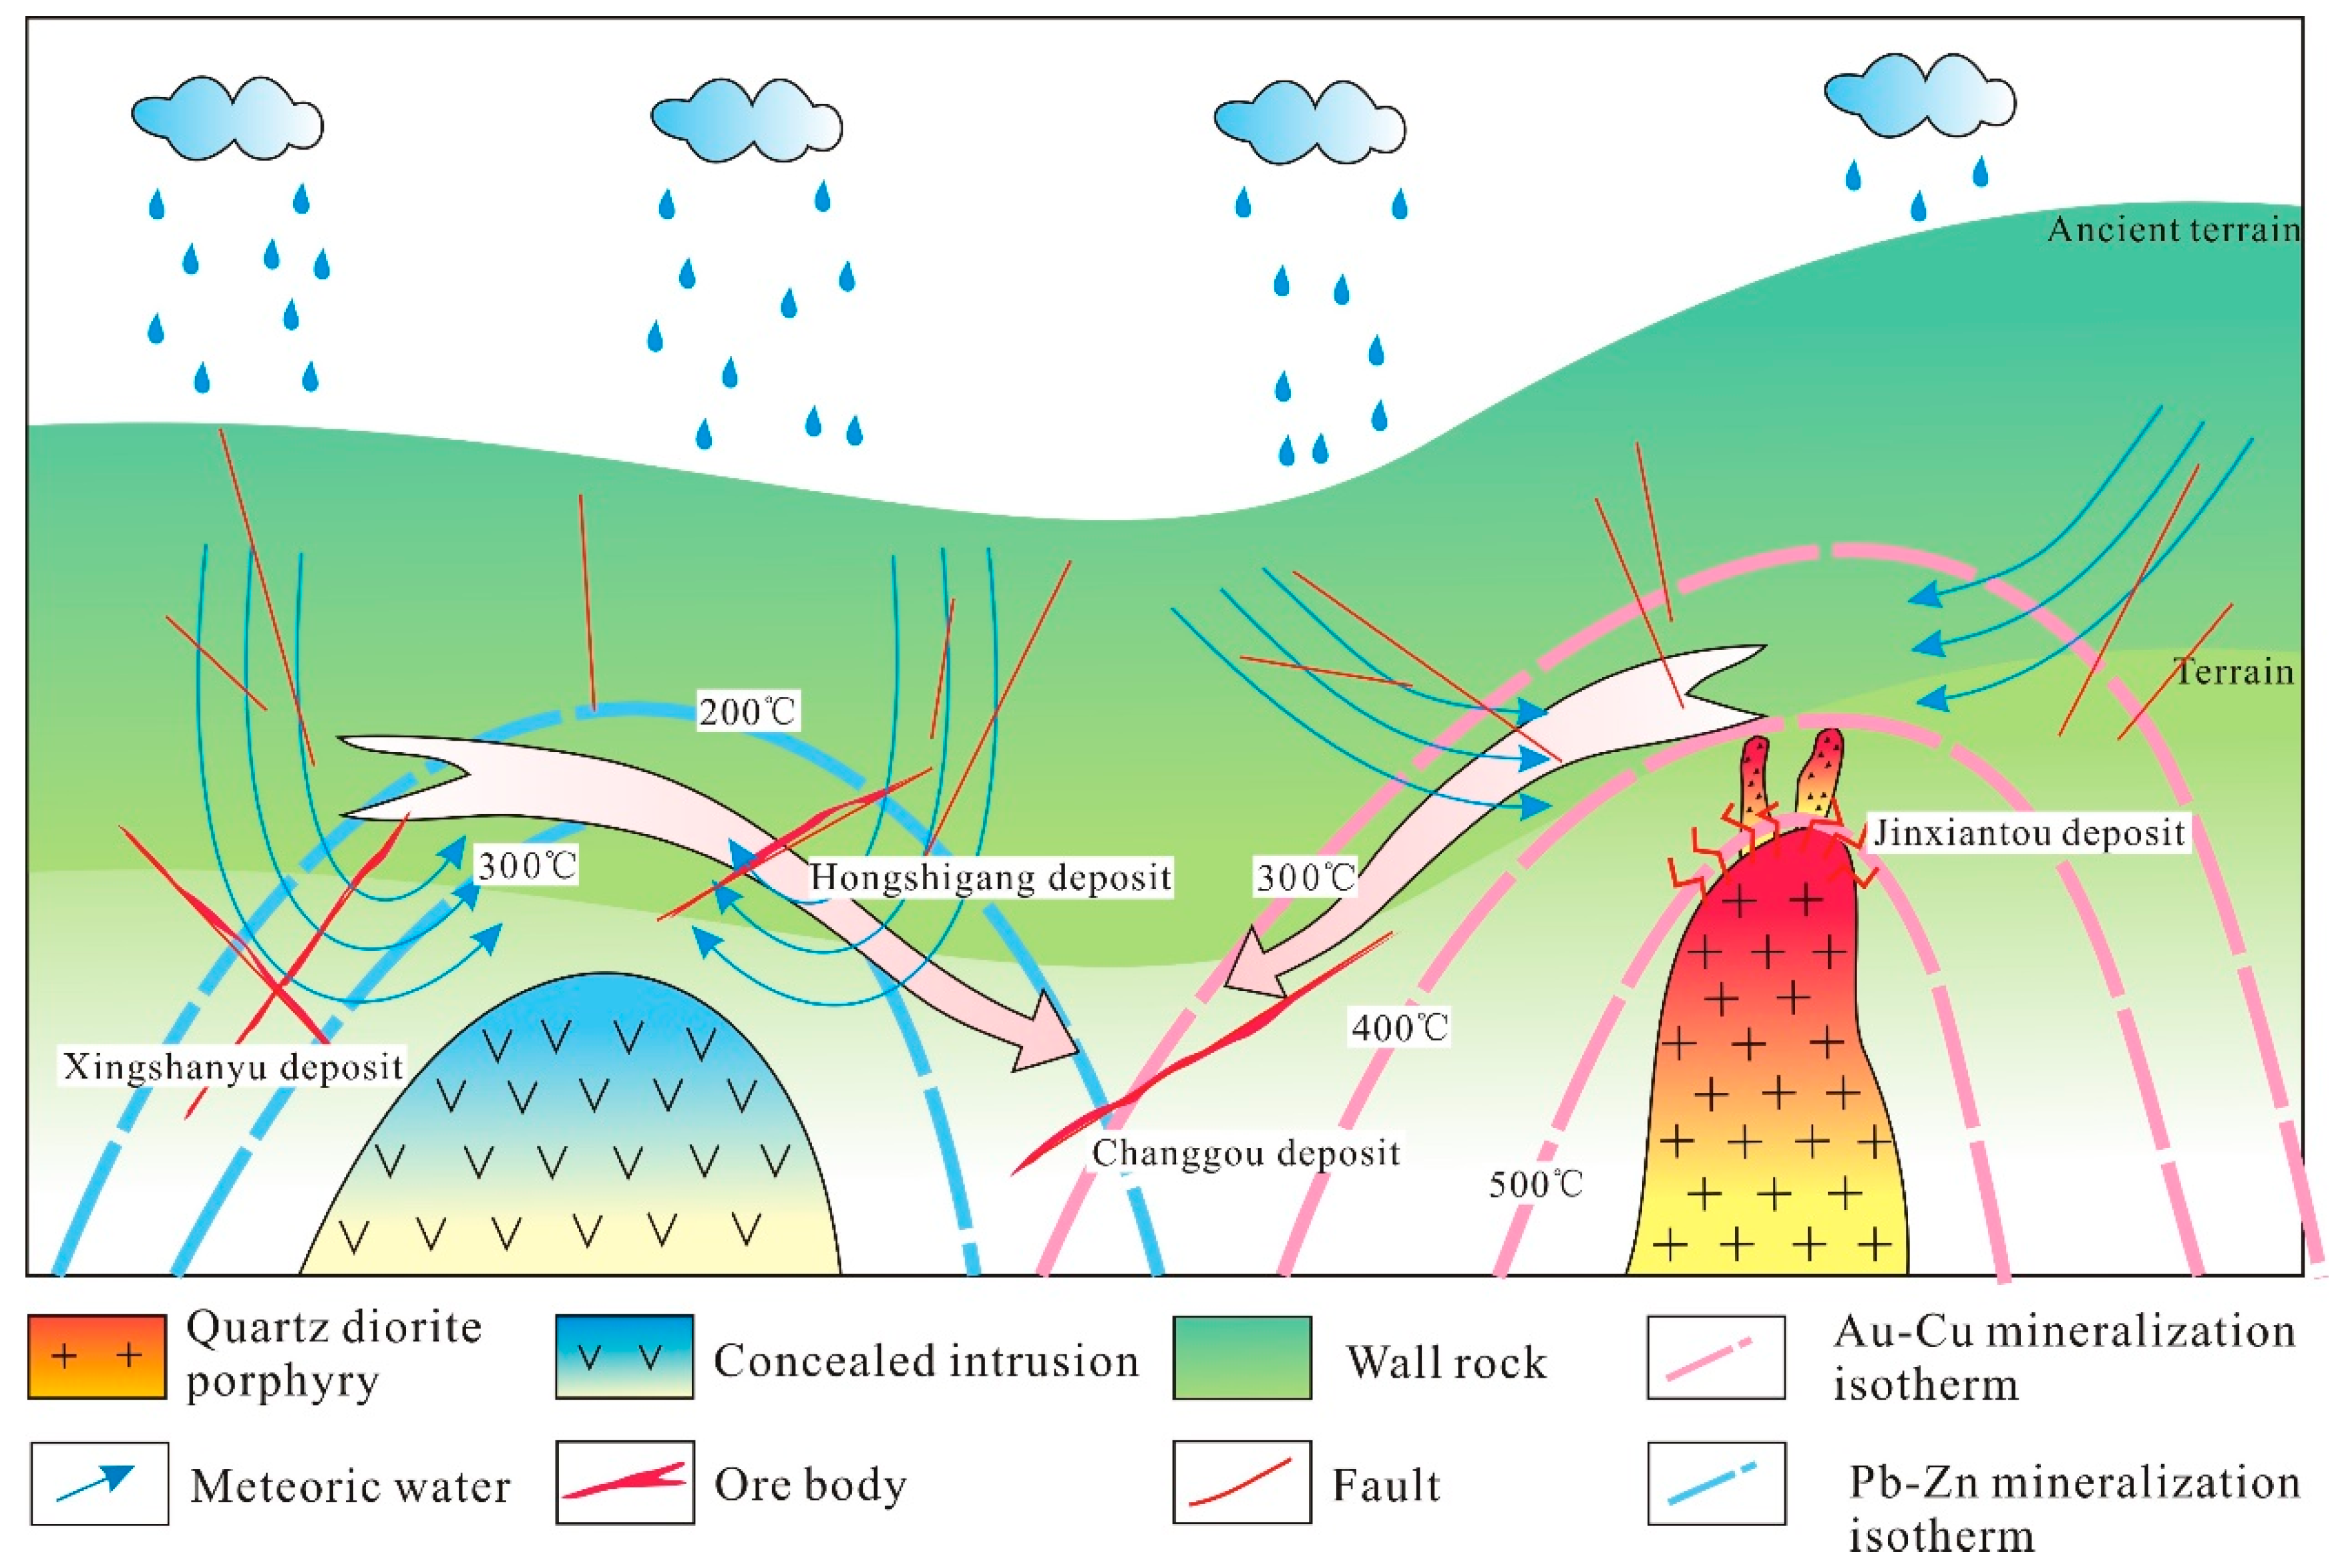
7.3. Sources and Evolution of the Hydrothermal System
7.4. Two Phases of Mineralization in the Qibaoshan Polymetallic Ore Field
8. Conclusions
Author Contributions
Funding
Acknowledgments
Conflicts of Interest
References
- Wang, Y. Geological characteristics and origin of Qibaoshan gold deposit in Shandong province. Geol. Rev. 1991, 37, 329–337, (In Chinese with English Abstract). [Google Scholar]
- Zhang, L.Y.; Cheng, M.Q. Geochemical characteristics of Qibaoshan Au-Cu deposit Shandong province and it’s genesis. Contrib. Geol. Miner. Resour. Res. 1996, 1, 18–24, (In Chinese with English Abstract). [Google Scholar]
- Xu, X.W.; Cai, X.P.; Liang, G.H.; Wang, J.; Qin, D.J.; Zhang, B.L.; Gao, H.Z.; Sun, M.H.; Liu, C.S.; Zhou, L.K.; et al. Detailed prediction on position, shape and size of concealed ore-bearing breccia pipes in the subvolcanic complex in Qibaoshan area Shandong province. Gold Sci. Technol. 1999, 7, 9–18, (In Chinese with English Abstract). [Google Scholar]
- Xu, X.W.; Cai, X.P.; Qin, D.J.; Wang, J.; Liang, G.H.; Zhang, X.Y.; Liu, L.J. Fluids double fracturing genetic mechanism and mineralization of gold-copper of the breccia pipe at Qibaoshan in Shandong province. Sci. China (Ser. D) 2000, 43, 113–121. [Google Scholar] [CrossRef]
- Xu, W.G.; Fan, H.R.; Hu, F.F.; Wang, Y.; Yang, K.F. Fluid inclusions of the Qibaoshan Cu-Au deposit, Shandong Province, China. Acta Petrol. Sin. 2015, 31, 1015–1030. [Google Scholar]
- Wang, Y.; Fan, H.R.; Hu, F.F.; Lan, T.G. Ore-forming fluids and metallogenesis of the Qibaoshan Cu-Au deposit in the Wulian county, Shandong province, China. Acta Petrol. Sin. 2008, 24, 2029–2036. [Google Scholar]
- Sun, S.; Li, Y.; Zhang, X.; Liu, H. Boiling fluid inclusions of high temperature and high salinity in the quartz grains in altered porphyry from the Au-Cu-bearing cryptoexplosion breccia pipe at Qibaoshan Shandong province and their significance. Acta Petrol. Sin. 2010, 26, 3319–3326. [Google Scholar]
- Tian, N.F.; Fan, Z.; Gao, Z.J.; Yuan, J. Geological characteristics and prospecting direction of Qibaoshan copper and polymetallic mineralization in Wulian county of Shandong Province. Shandong Land Resour. 2011, 27, 8–11, (In Chinese with English Abstract). [Google Scholar]
- Liu, X.H.; Xie, B.L.; Tian, M. Characteristic and prospecting direction of Xingshanyu mineralized zone. Miner. Eng. Res. 2013, 28, 72–76, (In Chinese with English Abstract). [Google Scholar]
- Lan, T.G.; Fan, H.R.; Santosh, M.; Hu, F.F.; Yang, K.F.; Yang, Y.H.; Liu, Y.S. Geochemistry and Sr-Nd-Pb-Hf isotopes of the Mesozoic Dadian alkaline intrusive complex in the Sulu orogenic belt, eastern China. Implications for crust-mantle interaction. Chem. Geol. 2011, 285, 97–114. [Google Scholar] [CrossRef]
- Chen, J.F.; Xie, Z.; Li, H.M. U–Pb zircon ages for a collision-related K-rich complex at Shidao in the Sulu ultrahigh pressure terrane, China. Geochem. J. 2003, 37, 35–46. [Google Scholar] [CrossRef]
- Guo, J.H.; Chen, F.K.; Zhang, X.M.; Siebel, W.; Zhai, M.G. Evolution of syn-to post-collisional magmatism from north Sulu UHP belt, eastern China: Zircon U–Pb geochronology. Acta Petrol. Sin. 2005, 21, 1281–1301, (In Chinese with English Abstract). [Google Scholar]
- Yang, J.H.; Chung, S.L.; Wilde, S.A.; Wu, F.Y.; Chu, M.F.; Lo, C.H.; Fan, H.R. Petrogenesis of post-orogenic syenites and crustal growth in the Sulu orogenic belt, East China: Geochronological, geochemical and Nd-Sr isotopic evidence. Geochem. J. 2005, 214, 99–125. [Google Scholar]
- Gao, T.S.; Chen, J.F.; Xie, Z.; Yan, J.; Qian, B. Geochemistry of Triassic igneous complex at Shidao in the Sulu UHP metamorphic belt. J. Asian Earth Sci. 2004, 20, 1025–1038. [Google Scholar]
- Xu, W.L.; Gao, S.; Wang, Q.H.; Wang, D.Y.; Liu, Y.S. Mesozoic crustal thickening of the eastern North China Craton: Evidence from eclogite xenoliths and petrologic implications. Geology 2006, 34, 721. [Google Scholar] [CrossRef]
- Yang, K.F.; Fan, H.R.; Santosh, M.; Hu, F.F.; Wilde, S.A.; Lan, T.G.; Lu, L.N.; Liu, Y.S. Reactivation of the Archean lower crust: Implications for zircon geochronology, elemental and Sr-Nd-Hf isotopic geochemistry of late Mesozoic granitoids from northwestern Jiaodong Terrane, the North China Craton. Lithos 2013, 146–147, 112–127. [Google Scholar] [CrossRef]
- Yang, Q.Y.; Santosh, M.; Shen, J.F.; Li, S.R. Juvenile vs. recycled crust in NE China: Zircon U–Pb geochronology, Hf isotope and an integrated model for Mesozoic gold mineralization in the Jiaodong Peninsula. Gondwana Res. 2014, 25, 1445–1468. [Google Scholar] [CrossRef]
- Ma, L.; Jiang, S.Y.; Dai, B.Z.; Jiang, Y.H.; Hou, M.L.; Pu, W.; Xu, B. Multiple sources for the origin of Late Jurassic Linglong adakitic granite in the Shandong Peninsula, eastern China: Zircon U–Pb geochronological, geochemical and Sr–Nd–Hf isotopic evidence. Lithos 2013, 162, 251–263. [Google Scholar] [CrossRef]
- Goss, S.C.; Wilde, S.A.; Wu, F.Y.; Yang, J.H. The age, isotopic signature and significance of the youngest Mesozoic granitoids in the Jiaodong Terrane, Shandong Province, North China Craton. Lithos 2010, 120, 309–326. [Google Scholar] [CrossRef]
- Zhang, H.F.; Zhai, M.G.; Tong, Y.; Peng, P.; Xu, B.L.; Guo, J.H. Petrogenesis of the Sanfoshan high-Ba–Sr granite, Jiaodong peninsula, eastern China. Geol. Rev. 2006, 52, 43–53, (In Chinese with English Abstract). [Google Scholar]
- Guo, P.; Santosh, M.; Li, S.R. Geodynamics of gold metallogeny in the Shandong Province, NE China: An integrated geological, geophysical and geochemical perspective. Gondwana Res. 2013, 24, 1172–1202. [Google Scholar] [CrossRef]
- Zhang, M. Geological Characterisitics and Genesis of Qibaoshan Iron Oxide-Copper-Gold (IOCG) Deposit, Wulian County, Shandong Province. Master’s Thesis, Jilin University, Changchun, China, 2016. (In Chinese). [Google Scholar]
- Yu, G.Y.; Wang, Z.G.; Wang, K.Y.; Li, J.F.; Wang, C.Y. The magma evolution and geodynamic setting in the Qibaoshan ore area, Wulian County, Shandong Province, China. Geol. J. 2018, accepted but unpublished. [Google Scholar] [CrossRef]
- Zhang, Y.Q.; Ling, W.L.; Zhang, J.B.; Duan, R.C.; Ren, B.F.; Yang, H.M. Zircon U–Pb geochronology of the Mesozoic volcanic rocks from Qingshan Group in the eastern Shandong. Earth Sci. 2019, 44, 344–354, (In Chinese with English Abstract). [Google Scholar]
- Bodnar. R., J. Reviced equation and table for determining the freezing point depression of H2O-NaCl solutions. Geochim. Cosmochim. Acta 1993, 57, 683–684. [Google Scholar] [CrossRef]
- Clayton, R.N.; Mayeda, T.K. The use of bromine pentafluoride in the extraction of oxygen from oxides and silicates for isotopic analysis. Geochim. Cosmochim. Acta 1963, 27, 43–52. [Google Scholar] [CrossRef]
- Clayton, R.N.; O’Neil, J.R.; Mayeda, T.K. Oxygen isotope exchange between quartz and water. J. Geophys. Res. 1972, 77, 3057–3067. [Google Scholar] [CrossRef]
- Roedder, E. Fluid inclusions. Rev. Mineral. 1984, 12, 644. [Google Scholar]
- Hollister, L.S.; Burruss, R.C. Phase equilibria in fluid inclusions from the Khtada Lake metamorphic complex. Geochim. Cosmochim. Acta 1976, 40, 163–175. [Google Scholar] [CrossRef]
- Shepherd, T.J.; Rankin, A.H.; Alderton, D. A Practical Guide to Fluid Inclusion Studies; Blackie and Son: Glasgow, UK, 1985; p. 239. [Google Scholar]
- Doe, B.; Stacey, J. The application of lead isotopes to the problems of ore genesis and ore prospect evaluation: A review. Econ. Geol. 1974, 69, 757–776. [Google Scholar] [CrossRef]
- Taylor, H.P., Jr. The application of oxygen and hydrogen isotope studies to problems of hydrothermal alteration and ore deposition. Econ. Geol. 1974, 69, 843–883. [Google Scholar] [CrossRef]
- Hoefs, J. Stable Isotope Geochemistry, 6th ed.; Springer: Berlin, Germany, 2009. [Google Scholar]
- Ohmoto, H.; Rye, R.O. Isotopes of Sulfur and Carbon; John Wiley and Sons: New York, NY, USA, 1979. [Google Scholar]
- Yang, M.Z. The Geochemistry of Wall Rock Alteration Zone of Gold Deposits—As Exemplified by Jiaodong Gold Deposits; Geological Publishing House: Beijing, China, 1998; pp. 109–112, (In Chinese with English Abstract). [Google Scholar]
- Li, H.Q.; Liu, J.Q.; Wei, L. Chronological Study of Fluid Inclusion for Hydrothermal Deposit and Its Geological Applications; Geological Publishing House: Beijing, China, 1993; pp. 1–126, (In Chinese with English Abstract). [Google Scholar]
- Ohmoto, H.; Goldhaber, M. Sulphur and carbon isotopes. In Geochemistry of Hydrothermal Ore Deposits; Barnes, H.L., Ed.; Wiley: New York, NY, USA, 1997; pp. 517–611. [Google Scholar]
- Zheng, Y.F. Stable Isotope Geochemistry; Science Press: Beijing, China, 2000; (In Chinese with English Abstract). [Google Scholar]
- Li, S.D.; Zhang, X.B.; Gao, L.L. Ore Genesis at the Jinchang Gold-Copper Deposit in Heilongjiang Province, Northeastern China: Evidence from Geology, Fluid Inclusions, and H-O-S Isotopes. Minerals 2019, 9, 99. [Google Scholar] [CrossRef]
- Hedenquist, J.W.; Arribas, A.; Reynolds, T.J. Evolution of an intrusion centered hydrothermal system: Far Southeast–Lepanto porphyry and epithermal Cu–Au deposits, Philippines. Econ. Geol. 1998, 93, 373–404. [Google Scholar] [CrossRef]
- Redmond, P.B.; Einaudi, M.T.; Inan, E.E.; Landtwing, M.R.; Heinrich, C.A. Copper deposition by fluid cooling in intrusion-centered systems: New insights from the Bingham porphyry ore deposit, Utah. Geology 2004, 32, 217–220. [Google Scholar] [CrossRef]
- Audétat, A.; Günther, D. Mobility and H2O loss from fluid inclusions in natural quartz crystals. Contrib. Mineral. Petrol. 1999, 137, 1–14. [Google Scholar] [CrossRef]
- Becker, S.P.; Fall, A.; Bodnar, R.J. Synthetic fluid inclusions. XVII PVTX properties of high salinity H2O-NaCl soluitons (>30 wt % NaCl): Application to fluid inclusion that homogenize by disappearance from porphyry copper and other hydrothermal ore deposits. Econ. Geol. 2008, 103, 539–544. [Google Scholar] [CrossRef]
- Hedenquist, J.W.; Richards, J.P. The influence of geochemical techniques on the development of genetic models for porphyry copper deposits. Tech. Hydrothermal Ore Depos. Geol. 1998, 10, 235–256. [Google Scholar]
- Siahcheshm, K.; Calagari, A.A.; Abedini, A. Hydrothermal evolution in the Maher–Abad porphyry Cu–Au deposit, SW Birjand, Eastern Iran: Evidence from fluid inclusions. Ore Geol. Rev. 2014, 58, 1–13. [Google Scholar] [CrossRef]
- Fournier, R.O. Hydrothermal processes related to movement of fluid from plastic into brittle rock in the magmatic-epithermal environment. Econ. Geol. 1999, 94, 1193–1211. [Google Scholar] [CrossRef]
- Barnes, H.L. Solubilities of ore minerals. In Geochemistry of Hydrothermal ore Deposits; Wiley: Hoboken, NJ, USA, 1979; pp. 404–460. [Google Scholar]
- Koděra, P.; Lexa, J.; Rankin, A.H.; Fallick, A.E. Epithermal gold veins in a caldera setting: Banská Hodruša, Slovakia. Mineral. Depos. 2005, 39, 921–943. [Google Scholar] [CrossRef]
- Shmulovich, K.I.; Landwehr, D.; Simon, K.; Heinrich, W. Stable isotope fractionation between liquid and vapour in water-salt systems up to 600 °C. Chem. Geol. 1999, 157, 343–354. [Google Scholar] [CrossRef]
- Chen, J.; Wang, H.N. Geochemistry; Science Press: Beijing, China, 2004. [Google Scholar]


| Deposit | Stage | Sample (Quartz) | FIA | FI Type | Number of Inclusion Measured | Te (°C) | Tm (ice) (°C) | Tm (NaCl) (°C) | Salinity (mas. % NaCl) | Th (°C) |
|---|---|---|---|---|---|---|---|---|---|---|
| Jinxiantou | I | JXT-1 | V and S | V | 6 | −2.8 to −1.2 | 2.1–4.6 | 366–395 | ||
| S | 5 | 361–389 | 43.4-46.3 | 365–389 | ||||||
| JXT-3 | V | V | 9 | −2.7 to −1.1 | 1.9–4.5 | 372–397 | ||||
| JXT-4 | LV | LV | 8 | −26.5 to −28.1 | −10.1 to −7.6 | 11.2–14.0 | 351–375 | |||
| JXT-6 | V and S | V | 5 | −2.3 to −1.3 | 2.2–3.9 | 375–386 | ||||
| JXT-7 | S | 10 | 355–385 | 42.9–45.8 | 362–385 | |||||
| II | JXT-11 | LV | LV | 13 | −24.7 to −27.8 | −7.8 to −4.8 | 7.6–11.5 | 285–319 | ||
| JXT-12 | LV | LV | 11 | −25.3 to −26.4 | −8.2 to −5.7 | 8.8–12.0 | 298–326 | |||
| JXT-15 | S | S | 5 | 300–313 | 38.2–39.2 | 302–315 | ||||
| JXT-16 | S | S | 6 | 319–330 | 39.7–40.6 | 319–332 | ||||
| III | JXT-18 | LV | LV | 10 | −23.7 to −24.5 | −6.0 to −3.9 | 6.3–9.2 | 191–226 | ||
| JXT-19 | LV | LV | 12 | −23.9 to −25.8 | −6.1 to −4.1 | 6.6–9.3 | 202–242 | |||
| JXT-20 | LV | LV | 9 | −24.2 to −26.1 | −5.6 to −3.6 | 5.9–8.7 | 196–227 | |||
| Changgou | I | CG-1 | LV | LV | 9 | −25.7 to −27.8 | −5.9 to −4.1 | 6.6–9.1 | 286–326 | |
| CG-2 | V and S | V | 6 | −1.4 to −1.0 | 1.7–2.4 | 309–315 | ||||
| S | 3 | 280–310 | 36.7–38.9 | 302–312 | ||||||
| CG-4 | S | S | 8 | 292–325 | 37.6–40.2 | 295–328 | ||||
| CG-6 | V and S | V | 9 | −2.5 to −1.2 | 2.1–4.2 | 315–325 | ||||
| S | 11 | 295–323 | 37.8–40.0 | 299–322 | ||||||
| II | CG-10 | LV and S | LV | 6 | −24.7 to −26.8 | −11.2 to −8.5 | 12.3–15.2 | 261–285 | ||
| S | 4 | 249–270 | 34.6–36.0 | 259–272 | ||||||
| CG-13 | S | S | 9 | 261–293 | 35.4–37.6 | 265–293 | ||||
| CG-15 | LV | LV | 13 | −25.0 to −27.3 | −7.6 to −5.8 | 8.9–11.2 | 245–281 | |||
| III | CG-16 | LV | LV | 11 | −23.7 to −25.6 | −4.9 to −3.4 | 5.6–7.7 | 189–226 | ||
| CG-19 | LV | LV | 16 | −23.2 to −26.1 | −5.3 to −4.4 | 6.6–8.3 | 192–235 | |||
| Hongshigang | I | HSG-1 | LV | LV | 10 | −29.1 to −31.6 | −6.2 to −4.6 | 7.3–9.5 | 236–252 | |
| HSG-2 | LV | LV | 8 | −28.9 to −32.5 | −6.9 to −5.5 | 8.5–10.4 | 240–265 | |||
| HSG-6 | LV | LV | 11 | −31.5 to −34.5 | −6.5 to −4.5 | 7.2–9.9 | 247–273 | |||
| II | HSG-7 | LV | LV | 10 | −30.9 to −32.6 | −4.9 to −3.6 | 5.9–7.7 | 155–183 | ||
| HSG-8 | LV | LV | 12 | −28.7 to −31.8 | −5.4 to −3.8 | 6.2–8.4 | 169–202 | |||
| Xingshanyu | I | XSY-1 | LV | LV | 10 | −30.3 to −34.8 | −6.3 to −4.8 | 7.6–9.6 | 246–269 | |
| XSY-2 | LV | LV | 15 | −29.2 to −32.3 | −7.0 to −5.3 | 8.3–10.5 | 258–289 | |||
| XSY-5 | LV | LV | 8 | −28.9 to −31.9 | −6.8 to −4.8 | 7.6–10.2 | 252–281 | |||
| II | XSY-6 | LV | LV | 7 | −29.2 to −31.6 | −4.9 to −3.6 | 5.9–7.7 | 165–186 | ||
| XSY-8 | LV | LV | 13 | −28.6 to −30.7 | −5.5 to −3.9 | 6.3–8.5 | 175–209 | |||
| XSY-11 | LV | LV | 8 | −30.2 to −33.4 | −5.2 to −3.4 | 5.6–8.1 | 172–198 |
| Deposit | Sample | Stage | δ18Oqz (‰ V-SMOW) | δDFI (‰ V-SMOW) | Th (°C) | δ18OFI (‰ V-SMOW) |
|---|---|---|---|---|---|---|
| Jinxiantou | JT-13 | 1 | 11.5 | −88.6 | 371 ± 15 | 6.8 ± 0.4 |
| JT-15 | 1 | 11.9 | −91.8 | 371 ± 15 | 7.2 ± 0.4 | |
| JT-16 | 2 | 11.8 | −102.5 | 312 ± 15 | 5.3 ± 0.5 | |
| JT-17 | 2 | 11.1 | −103.9 | 312 ± 15 | 4.6 ± 0.5 | |
| JT-19 | 3 | 12.2 | −104.6 | 223 ± 16 | 1.8 ± 0.8 | |
| JT-22 | 3 | 12.3 | −106.3 | 223 ± 16 | 1.9 ± 0.8 | |
| Changgou | CG-12 | 1 | 12.9 | −101.9 | 307 ± 17 | 6.3 ± 0.6 |
| CG-13 | 1 | 13.1 | −101.2 | 307 ± 17 | 6.5 ± 0.6 | |
| CG-15 | 1 | 12.6 | −104.5 | 307 ± 17 | 6.0 ± 0.6 | |
| CG-17 | 1 | 12.4 | −104.1 | 307 ± 17 | 5.8 ± 0.6 | |
| CG-18 | 2 | 12.9 | −105.2 | 268 ± 14 | 4.8 ± 0.6 | |
| CG-19 | 2 | 12.5 | −105.3 | 268 ± 14 | 4.4 ± 0.6 | |
| CG-20 | 2 | 12.2 | −106.2 | 268 ± 14 | 4.1 ± 0.6 | |
| CG-22 | 2 | 12.3 | −103.8 | 268 ± 14 | 4.2 ± 0.6 | |
| CG-23 | 3 | 12.7 | −107.1 | 212 ± 15 | 1.7 ± 0.8 | |
| CG-25 | 3 | 13.4 | −104 | 212 ± 15 | 2.4 ± 0.8 | |
| CG-26 | 3 | 12.2 | −115.6 | 212 ± 15 | 1.2 ± 0.8 | |
| CG-27 | 3 | 12.8 | −110.2 | 212 ± 15 | 1.8 ± 0.8 | |
| Hongshigang | HS-11 | 1 | 10.5 | −109.8 | 250 ± 15 | 1.6 ± 0.7 |
| HS-13 | 1 | 10.8 | −106.6 | 250 ± 15 | 1.9 ± 0.7 | |
| HS-14 | 1 | 11.7 | −102.4 | 250 ± 15 | 2.8 ± 0.7 | |
| HS-15 | 1 | 11.4 | −100.2 | 250 ± 15 | 2.5 ± 0.7 | |
| HS-18 | 2 | 10.9 | −101.9 | 177 ± 16 | −2.4 ± 0.6 | |
| HS-19 | 2 | 11.8 | −105.2 | 177 ± 16 | −1.5 ± 0.6 | |
| HS-21 | 2 | 11.7 | −103.6 | 177 ± 16 | −1.6 ± 0.6 | |
| HS-23 | 2 | 11.1 | −107.1 | 177 ± 16 | −2.2 ± 0.6 | |
| Xingshanyu | XS-11 | 1 | 11.3 | −100.6 | 270 ± 15 | 3.2 ± 0.6 |
| XS-12 | 1 | 10.9 | −102.1 | 270 ± 15 | 2.8 ± 0.6 | |
| XS-14 | 1 | 11.6 | −101.4 | 270 ± 15 | 3.5 ± 0.6 | |
| XS-18 | 1 | 12.1 | −103.2 | 270 ± 15 | 4.0 ± 0.6 | |
| XS-20 | 2 | 11.4 | −104.9 | 191 ± 15 | −0.9 ± 0.4 | |
| XS-21 | 2 | 11.9 | −107.5 | 191 ± 15 | −0.4 ± 0.4 | |
| XS-22 | 2 | 10.2 | −108.3 | 191 ± 15 | −2.1 ± 0.4 | |
| XS-25 | 2 | 11.1 | −105.2 | 191 ± 15 | −1.2 ± 0.4 |
| Deposit | Sample | Stage | Mineral | δ34Ssulfide (‰) | δ34SH2S(mean) (‰) | Th(mean) (°C) | Sample Location |
|---|---|---|---|---|---|---|---|
| Jinxiantou | JT-1-2 | 2 | Chalcopyrite | 4.3 | 4.4 ± 0.01 | 312 ± 15 | ZK64, −42 m |
| JT-4-2 | 2 | Chalcopyrite | 3.4 | 3.5 ± 0.01 | 312 ± 15 | ZK141, −150 m | |
| JT-7-2 | 2 | Chalcopyrite | 2.4 | 2.5 ± 0.01 | 312 ± 15 | ZK143, −545 m | |
| JT-8 | 2 | Chalcopyrite | 2.9 | 3.0 ± 0.01 | 312 ± 15 | ZK143, −451 m | |
| Changgou | CG-1-1 | 2 | Chalcopyrite | 4.2 | 4.4 ± 0.01 | 268 ± 14 | ZK706-1, 116 m |
| CG-1-2 | 2 | Chalcopyrite | 4.2 | 4.4 ± 0.01 | 268 ± 14 | ZK706-1, 122 m | |
| CG-10-1 | 2 | Chalcopyrite | 3.3 | 3.5 ± 0.01 | 268 ± 14 | ZK706-2, −148 m | |
| CG-10-2 | 2 | Chalcopyrite | 3.0 | 3.2 ± 0.01 | 268 ± 14 | ZK706-2, −153 m | |
| CG-9-1 | 2 | Chalcopyrite | 3.8 | 4.0 ± 0.01 | 268 ± 14 | ZK706, 135 m | |
| CG-9-2 | 2 | Chalcopyrite | 2.9 | 3.1 ± 0.01 | 268 ± 14 | ZK706, 146 m | |
| Hongshigang | HS-1-1 | 1 | Galena | 0.6 | 2.9 ± 0.07 | 250 ± 15 | ZK3001, 5 m |
| HS-1-2 | 1 | Galena | 0.5 | 2.8 ± 0.07 | 250 ± 15 | ZK3001, 15 m | |
| HS-2-1 | 1 | Galena | 3.0 | 5.3 ± 0.07 | 250 ± 15 | ZK0001, −38 m | |
| HS-2-2 | 1 | Galena | 2.7 | 5.0 ± 0.07 | 250 ± 15 | ZK0001, −40 m | |
| HS-3-1 | 1 | Galena | 1.8 | 4.1 ± 0.07 | 250 ± 15 | ZK0002, −225 m | |
| HS-3-2 | 1 | Galena | 2.5 | 4.8 ± 0.07 | 250 ± 15 | ZK0002, −236 m | |
| Xingshanyu | XS-1 | 1 | Galena | 0.8 | 2.9 ± 0.12 | 270 ± 15 | ZK5-1, 52 m |
| XS-2 | 1 | Galena | 1.2 | 3.3 ± 0.12 | 270 ± 15 | ZK5-1, 48 m | |
| XS-3 | 1 | Galena | 1.5 | 3.6 ± 0.12 | 270 ± 15 | ZK5-2, 145 m | |
| XS-4 | 1 | Galena | 2.8 | 4.9 ± 0.12 | 270 ± 15 | ZK5-2, 153 m | |
| XS-5 | 1 | Galena | 3.2 | 5.3 ± 0.12 | 270 ± 15 | ZK5, 107 m | |
| XS-6 | 1 | Galena | 2.4 | 4.5 ± 0.12 | 270 ± 15 | ZK5, 113 m |
© 2019 by the authors. Licensee MDPI, Basel, Switzerland. This article is an open access article distributed under the terms and conditions of the Creative Commons Attribution (CC BY) license (http://creativecommons.org/licenses/by/4.0/).
Share and Cite
Yu, G.-Y.; Li, S.-D.; Wang, Y.-C.; Wang, K.-Y. Fluid Evolution and Ore Genesis of the Qibaoshan Polymetallic Ore Field, Shandong Province, China: Constraints from Fluid Inclusions and H–O–S Isotopic Compositions. Minerals 2019, 9, 394. https://doi.org/10.3390/min9070394
Yu G-Y, Li S-D, Wang Y-C, Wang K-Y. Fluid Evolution and Ore Genesis of the Qibaoshan Polymetallic Ore Field, Shandong Province, China: Constraints from Fluid Inclusions and H–O–S Isotopic Compositions. Minerals. 2019; 9(7):394. https://doi.org/10.3390/min9070394
Chicago/Turabian StyleYu, Guang-Yuan, Shun-Da Li, Yi-Cun Wang, and Ke-Yong Wang. 2019. "Fluid Evolution and Ore Genesis of the Qibaoshan Polymetallic Ore Field, Shandong Province, China: Constraints from Fluid Inclusions and H–O–S Isotopic Compositions" Minerals 9, no. 7: 394. https://doi.org/10.3390/min9070394
APA StyleYu, G.-Y., Li, S.-D., Wang, Y.-C., & Wang, K.-Y. (2019). Fluid Evolution and Ore Genesis of the Qibaoshan Polymetallic Ore Field, Shandong Province, China: Constraints from Fluid Inclusions and H–O–S Isotopic Compositions. Minerals, 9(7), 394. https://doi.org/10.3390/min9070394