Preferred Orientation of Quartz in Metamorphic Rocks from the Bergell Alps


Abstract
:1. Introduction
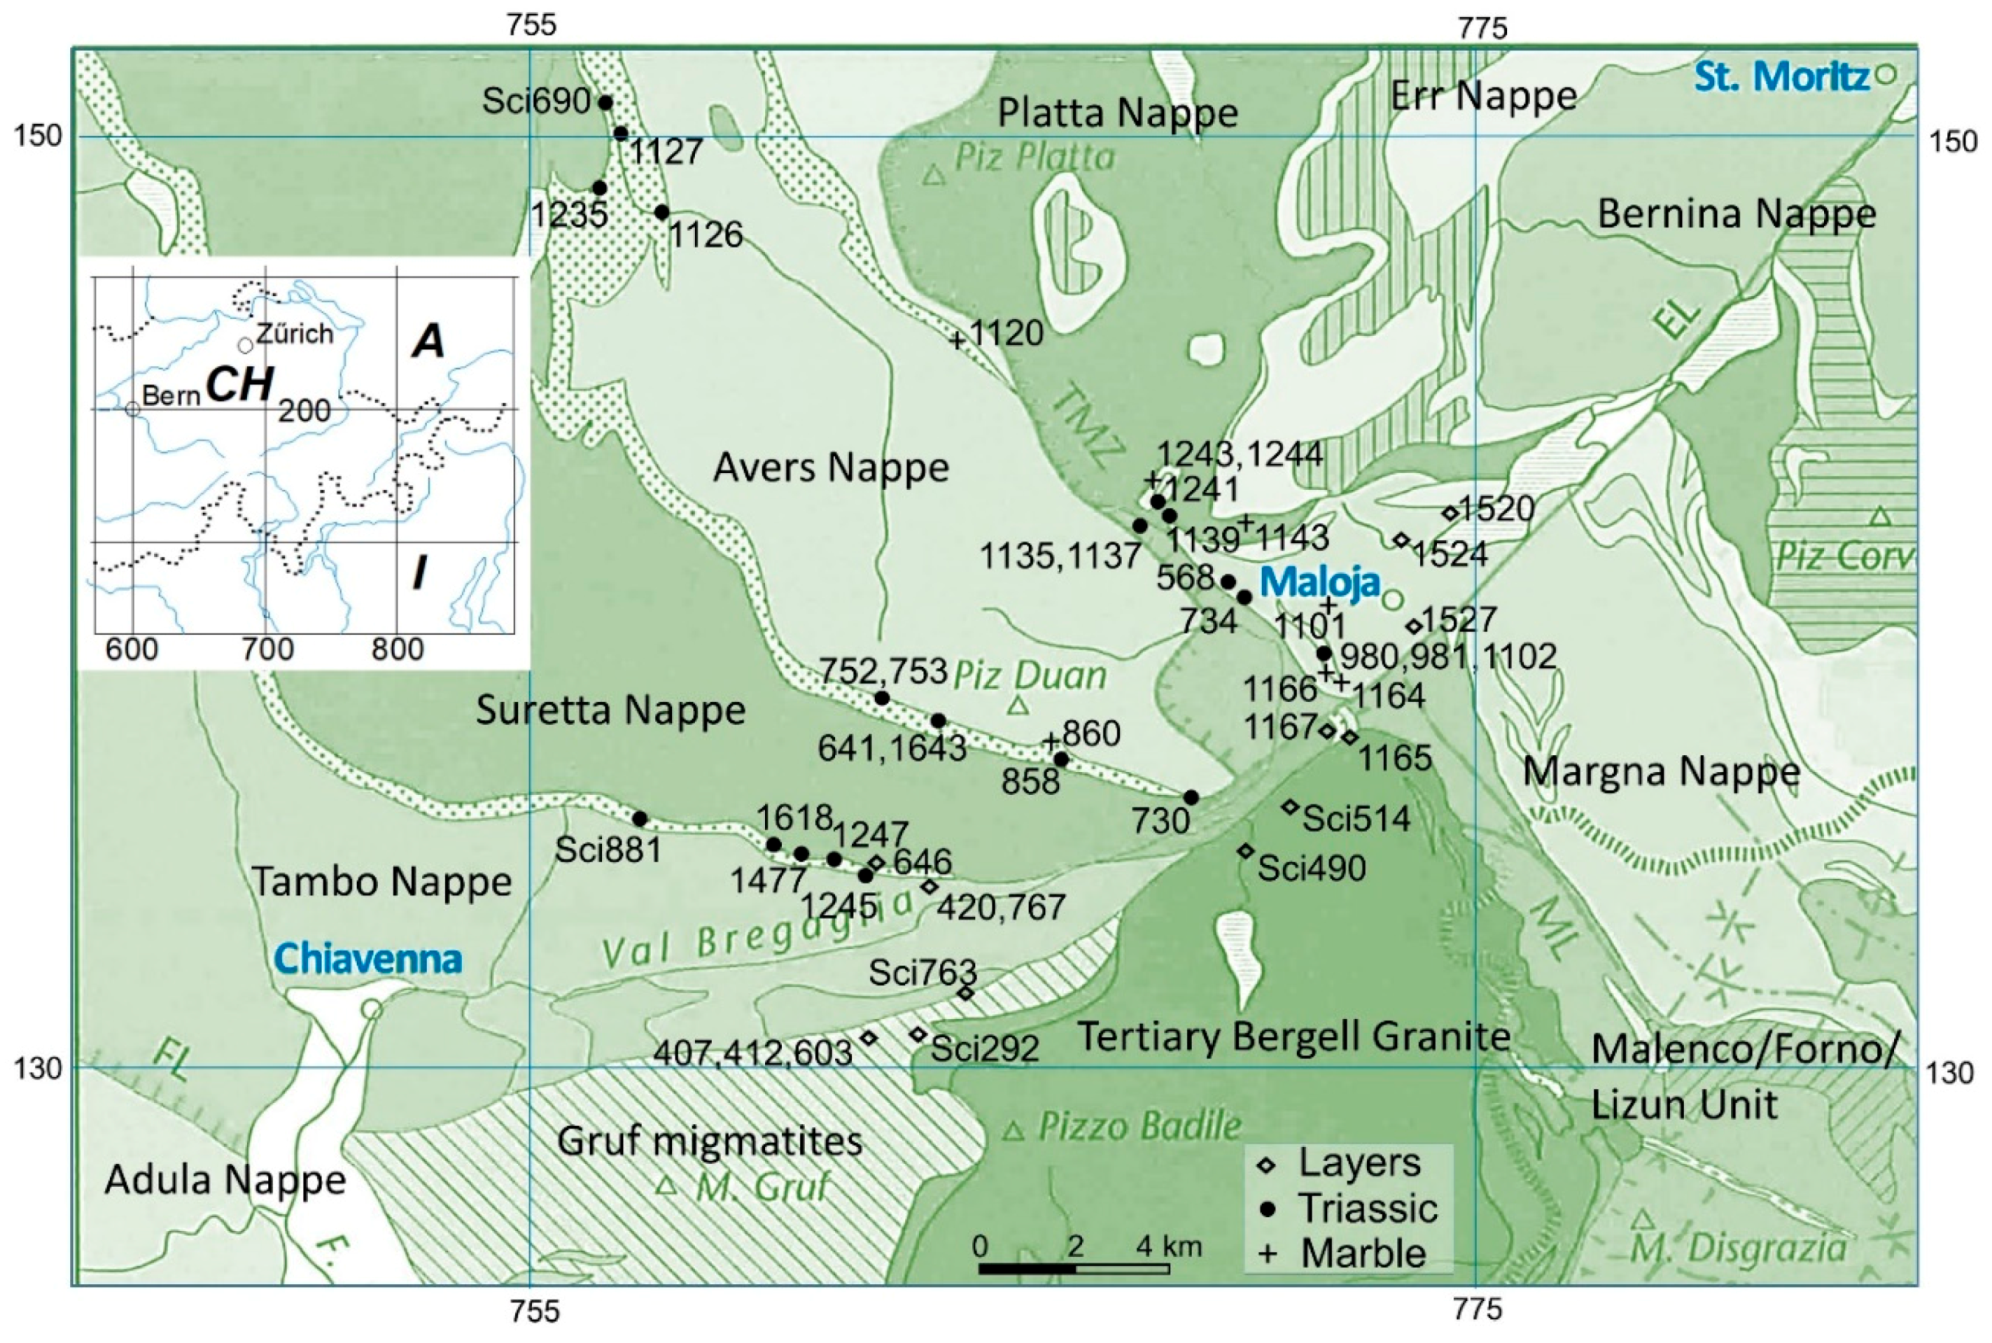
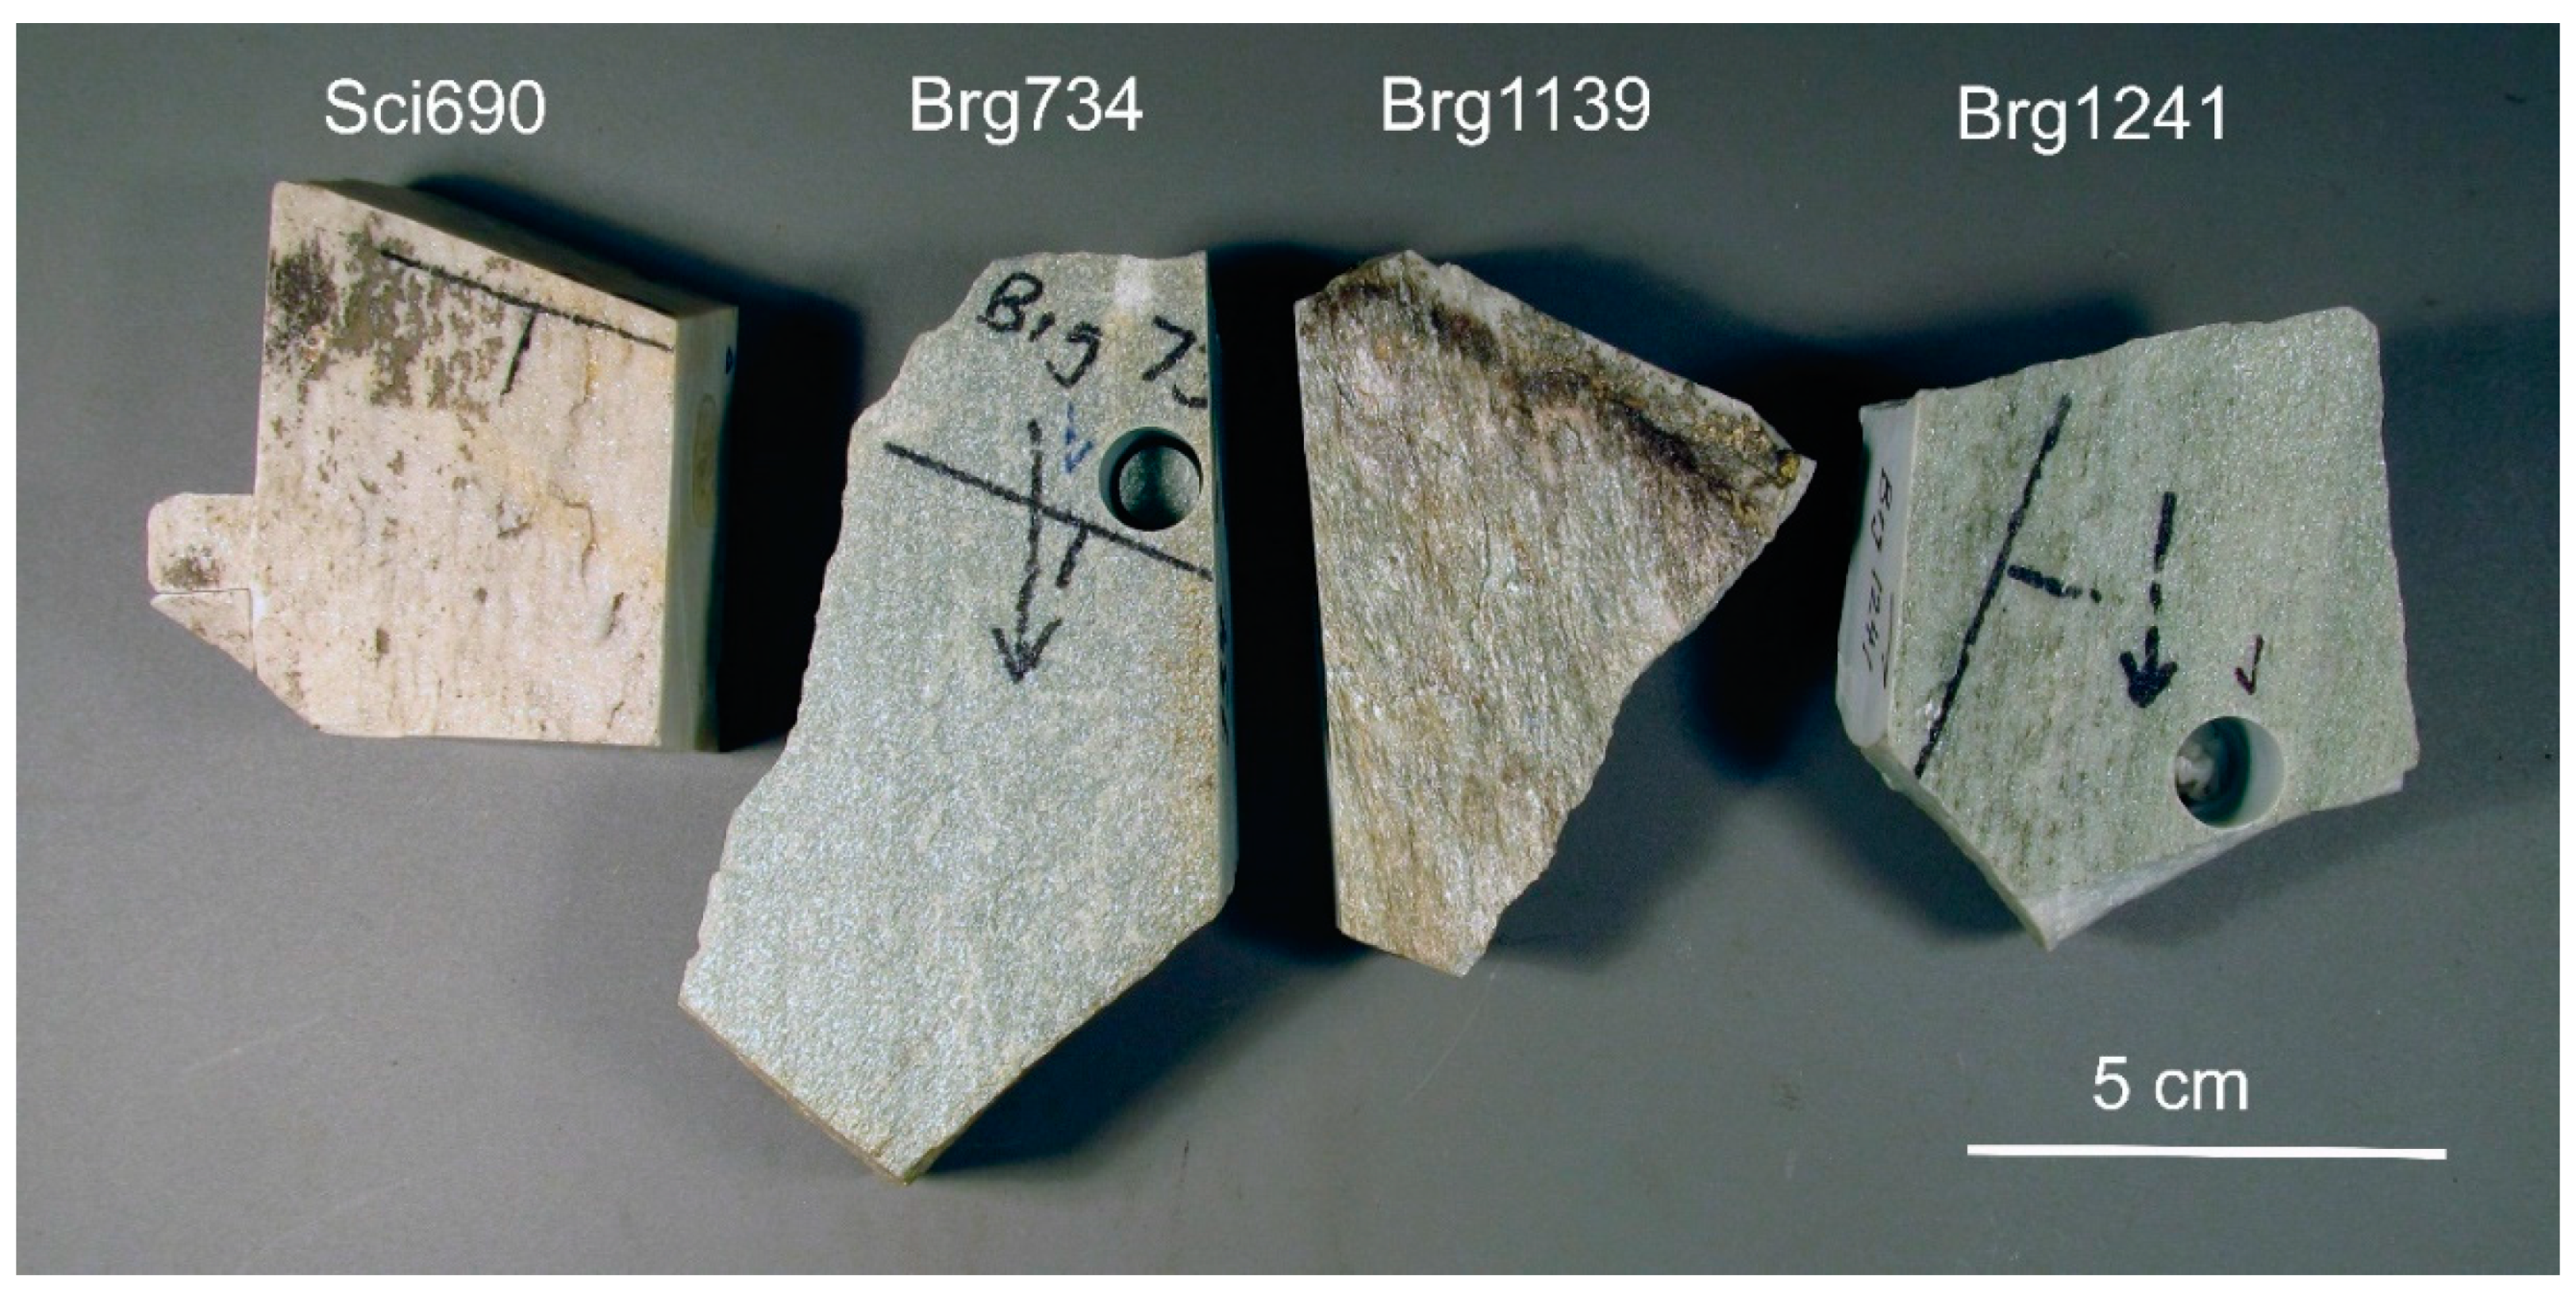
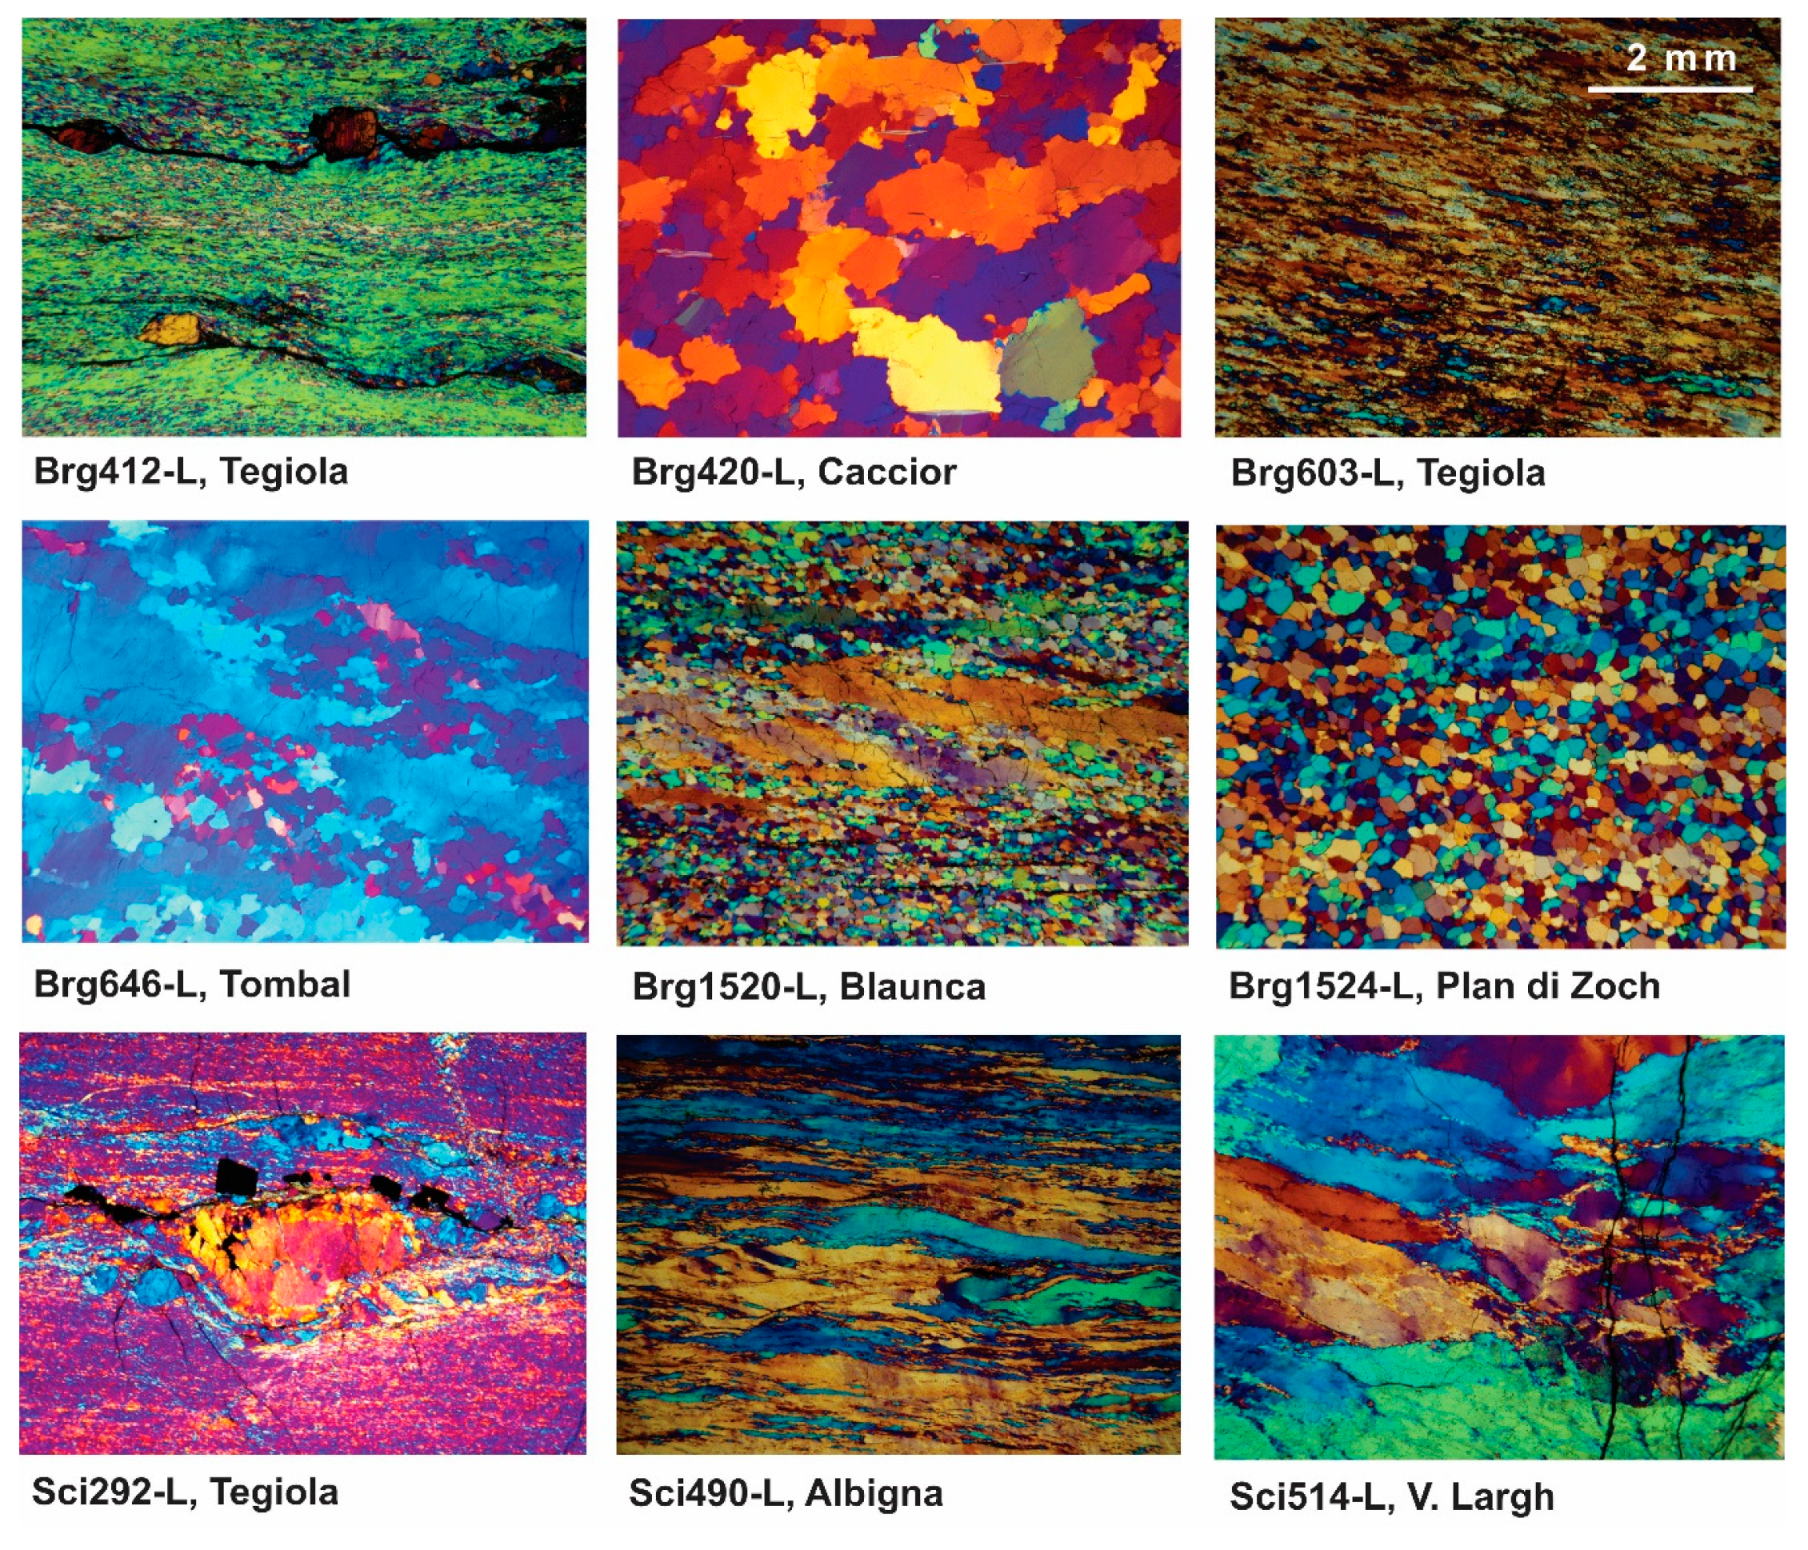
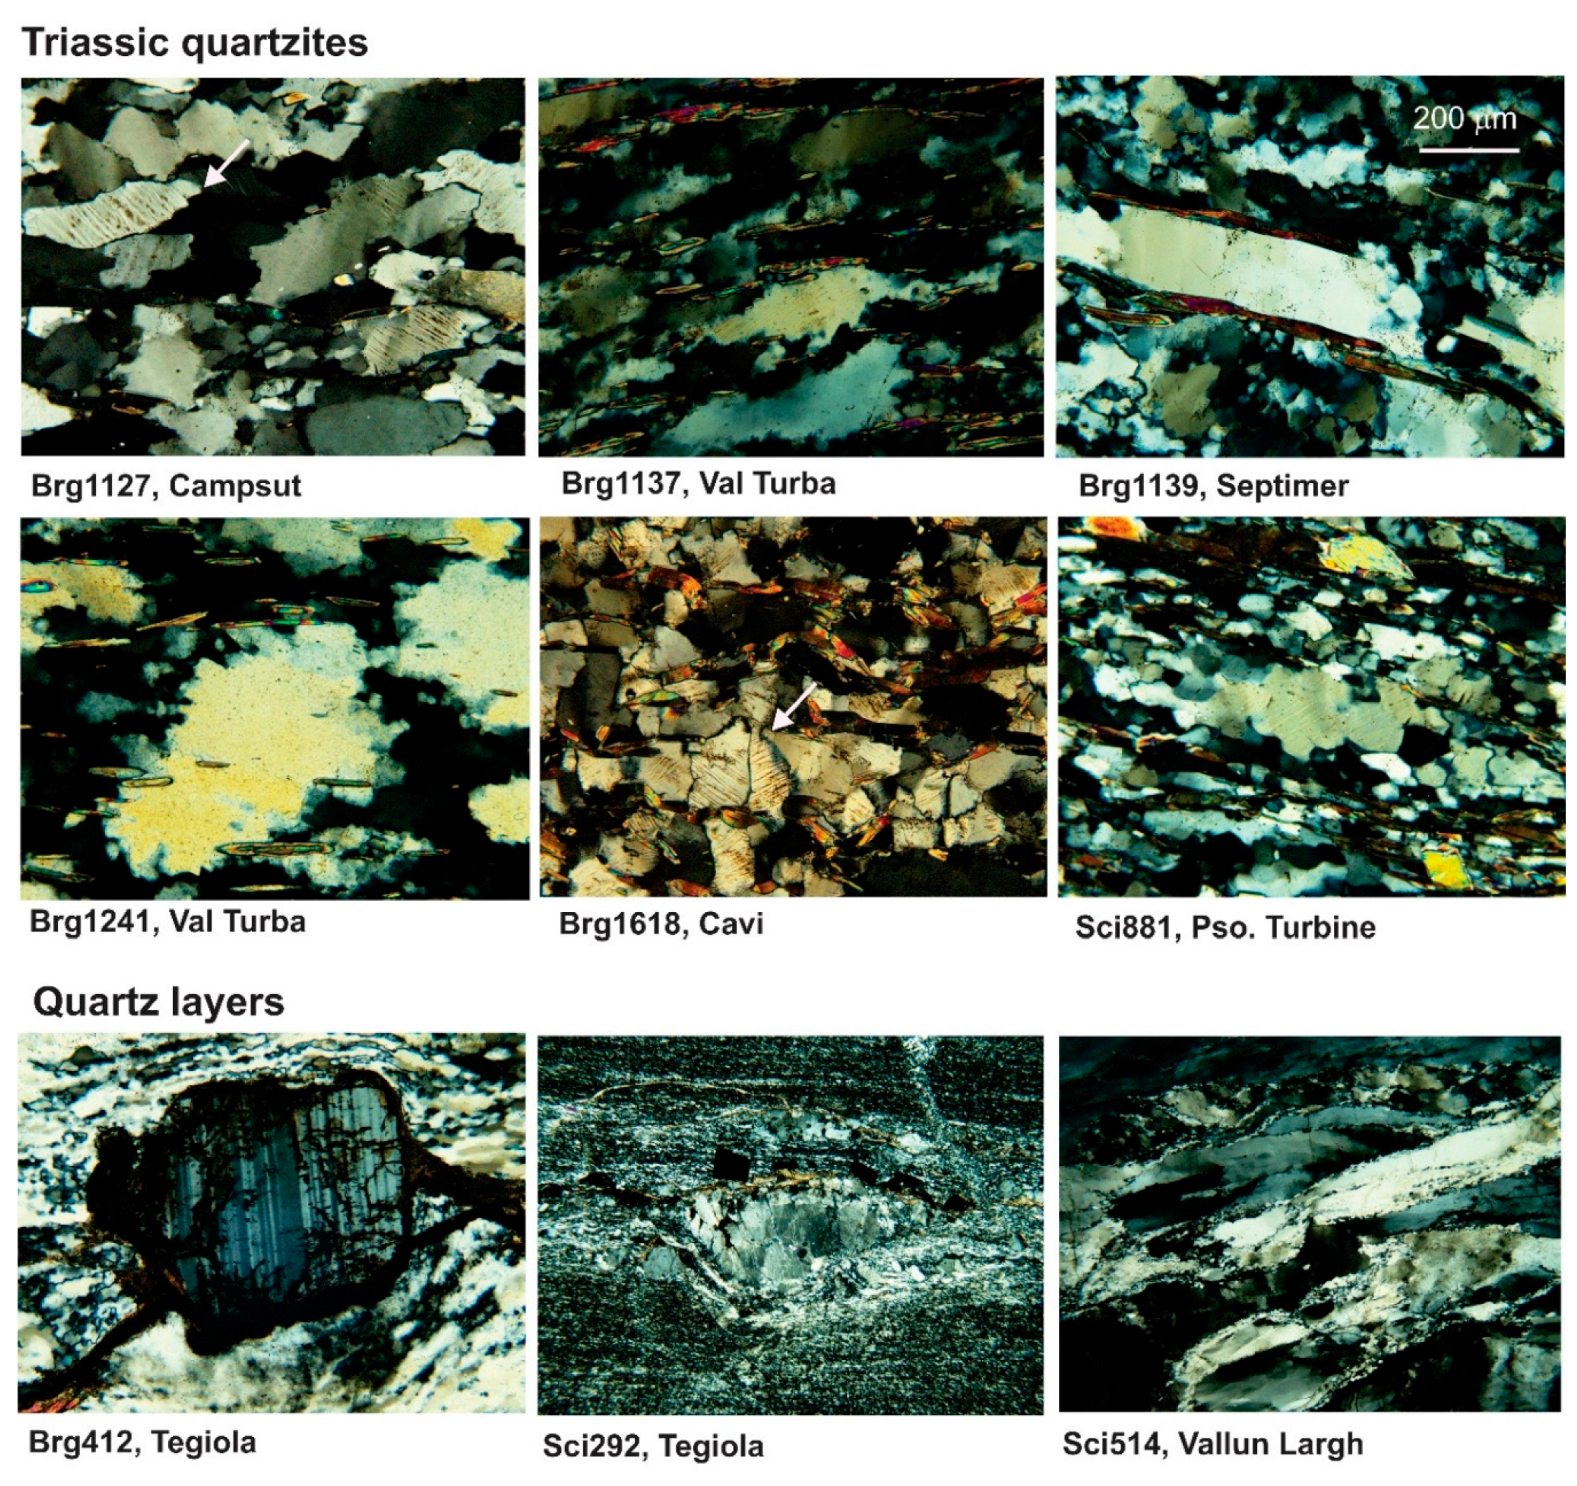
2. Samples
3. Experimental Methods
3.1. Some Remarks on Coordinate Systems and Quartz Crystallography
3.2. Neutron Diffraction
3.3. SEM-EBSD
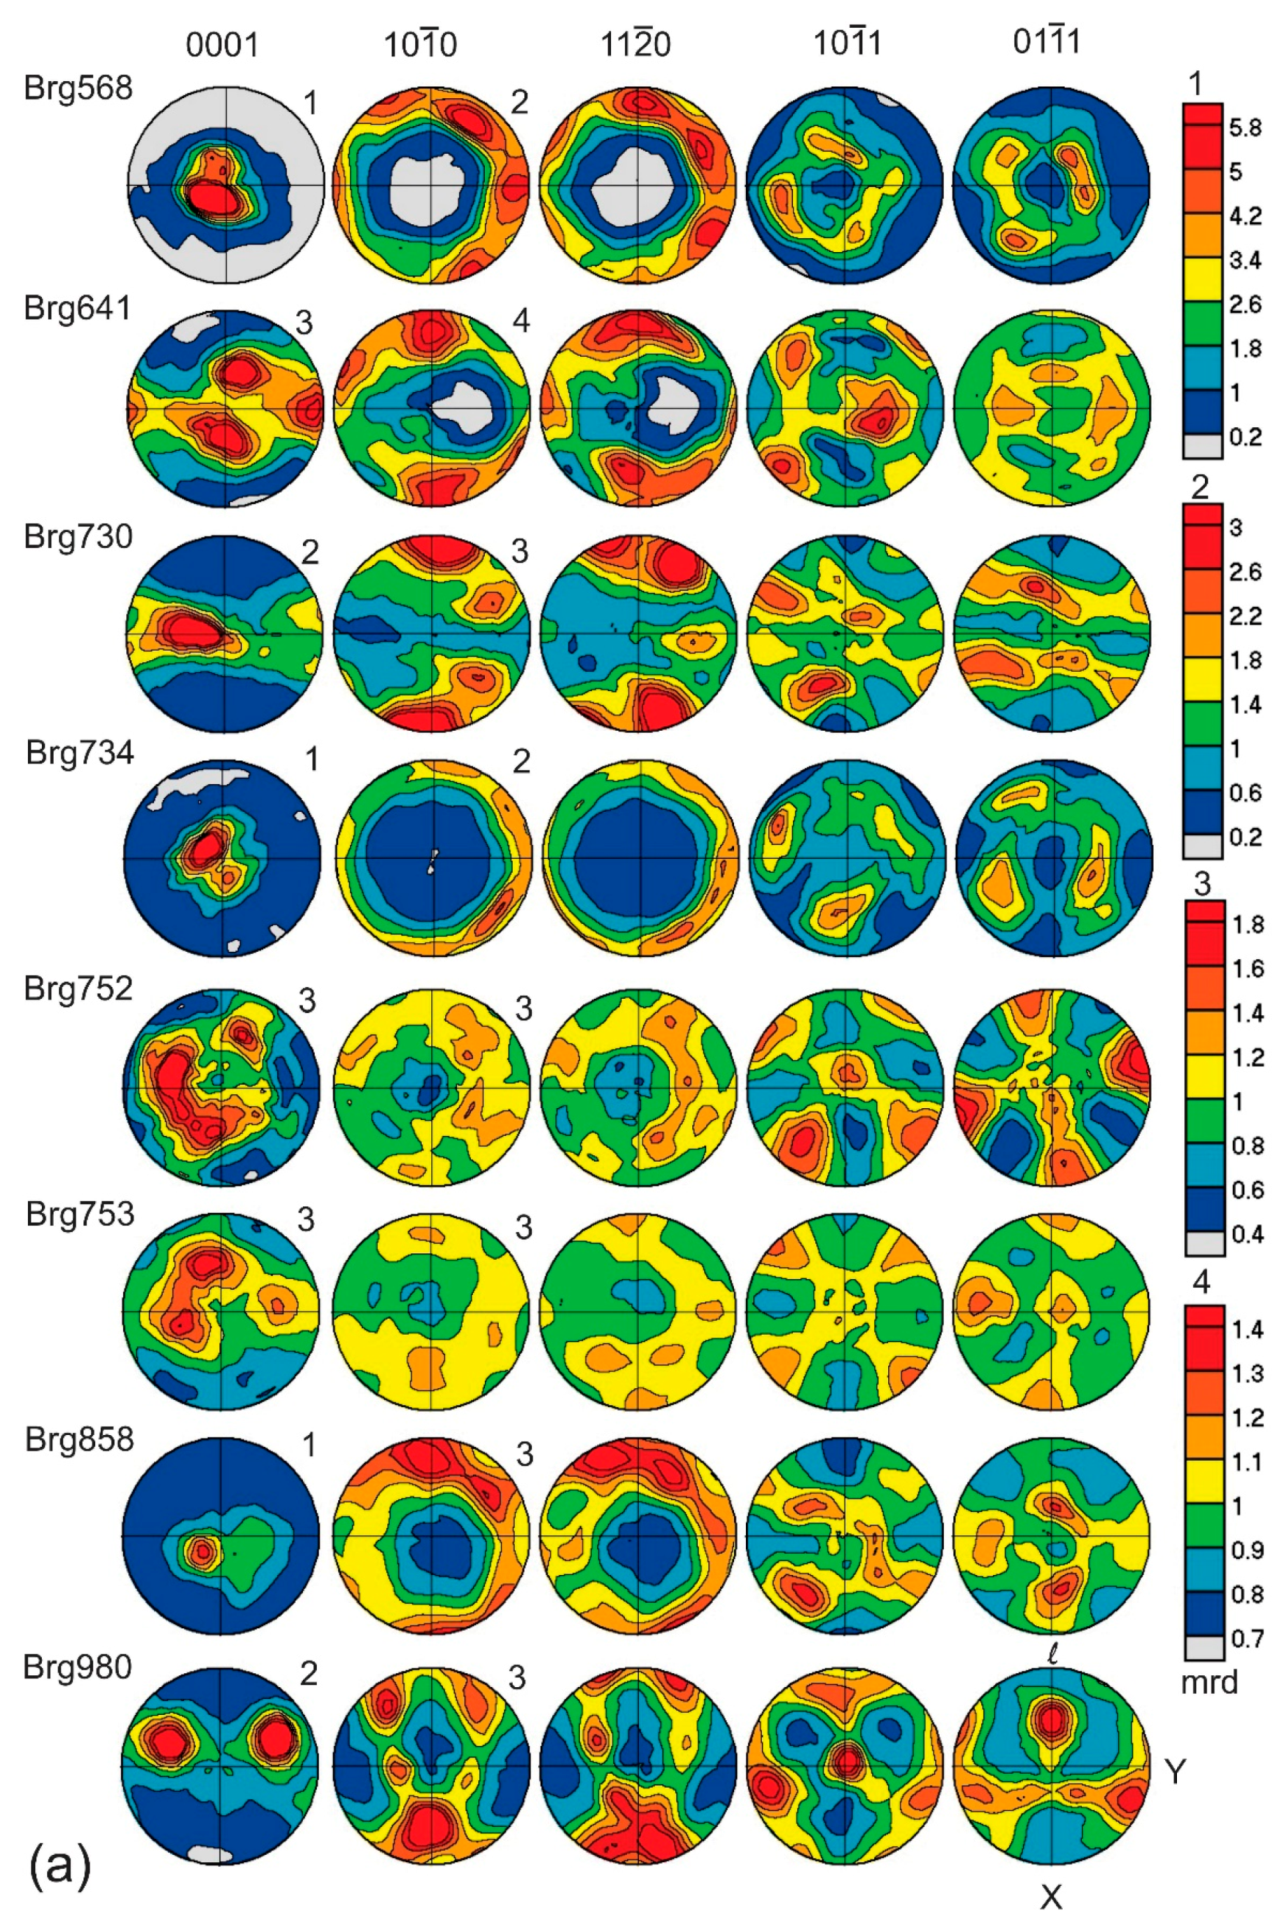
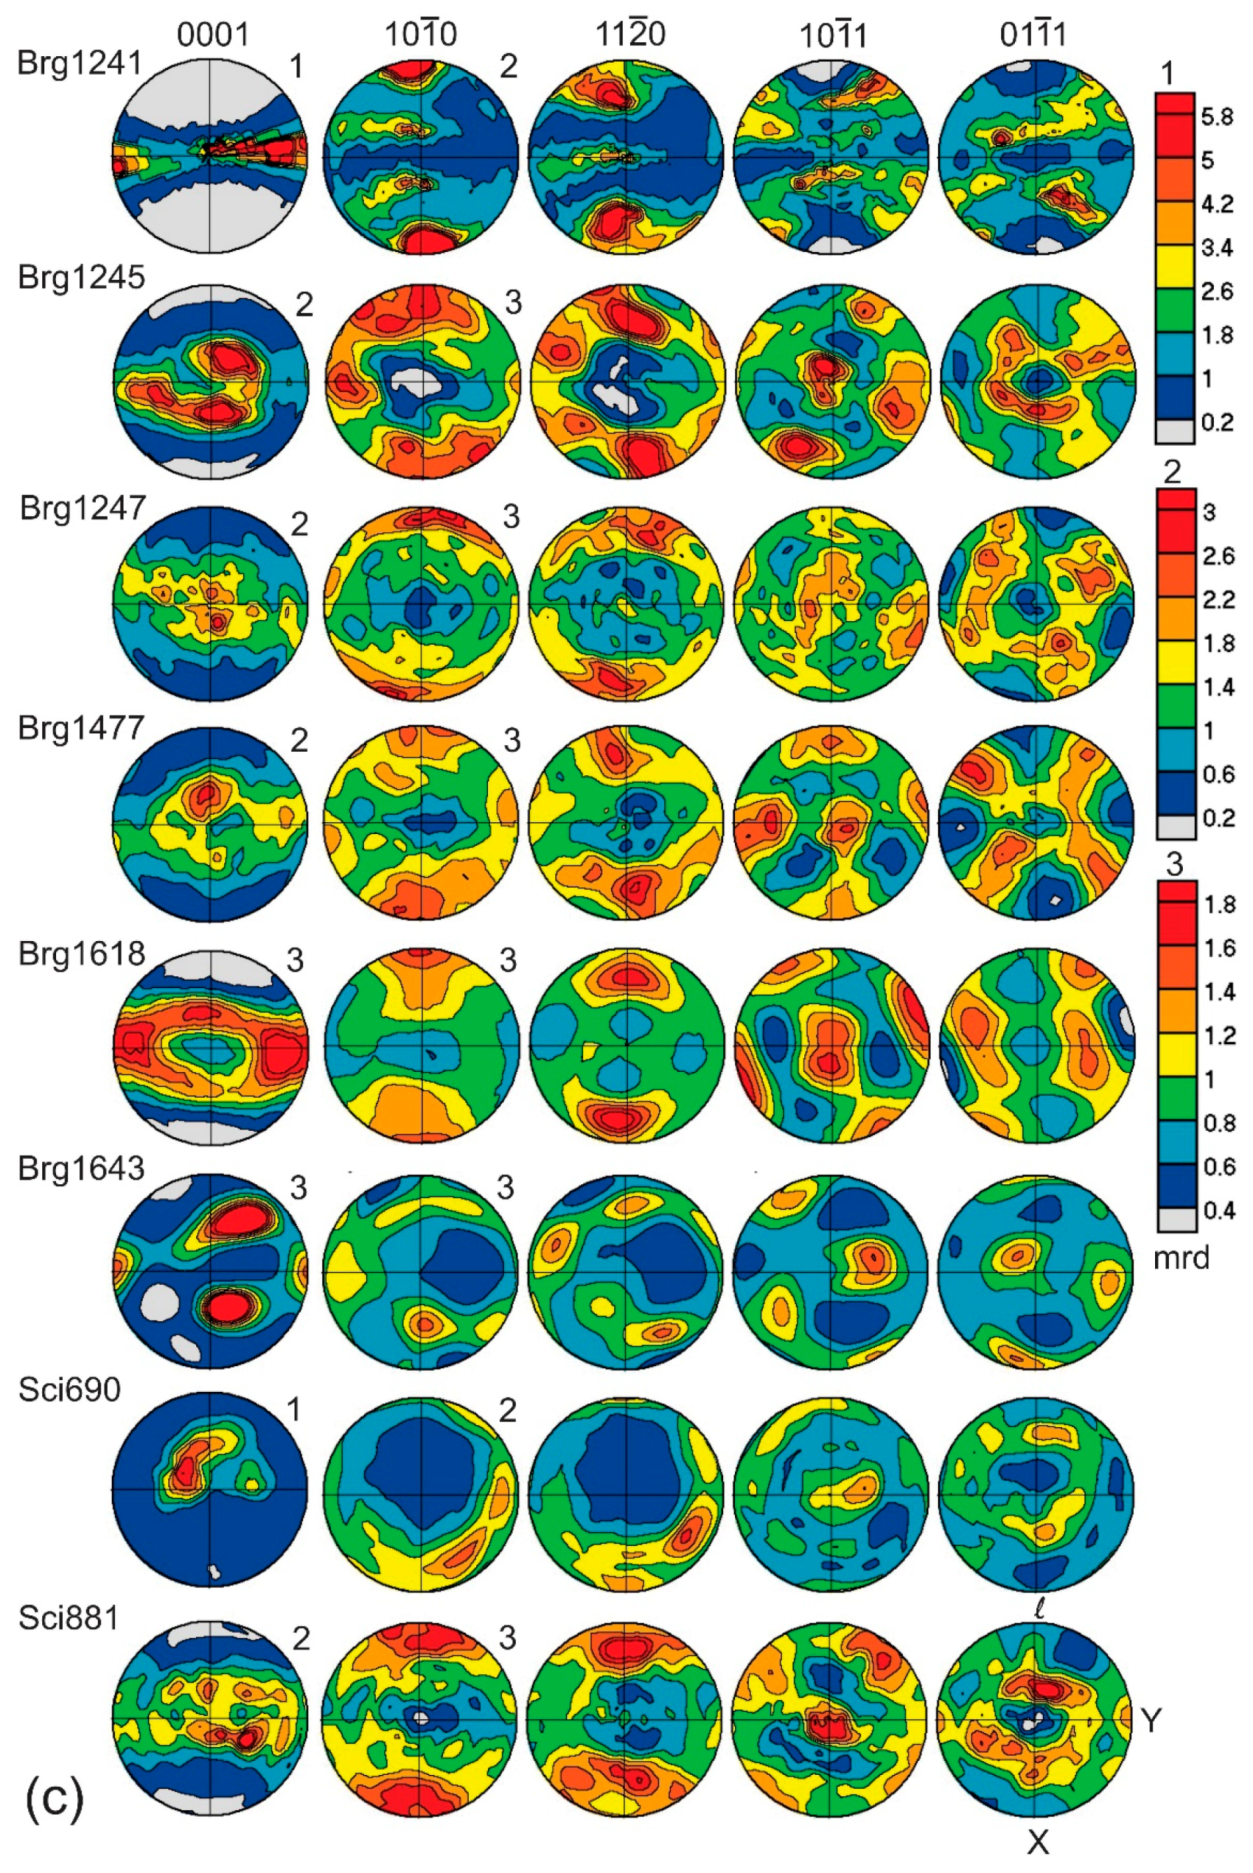
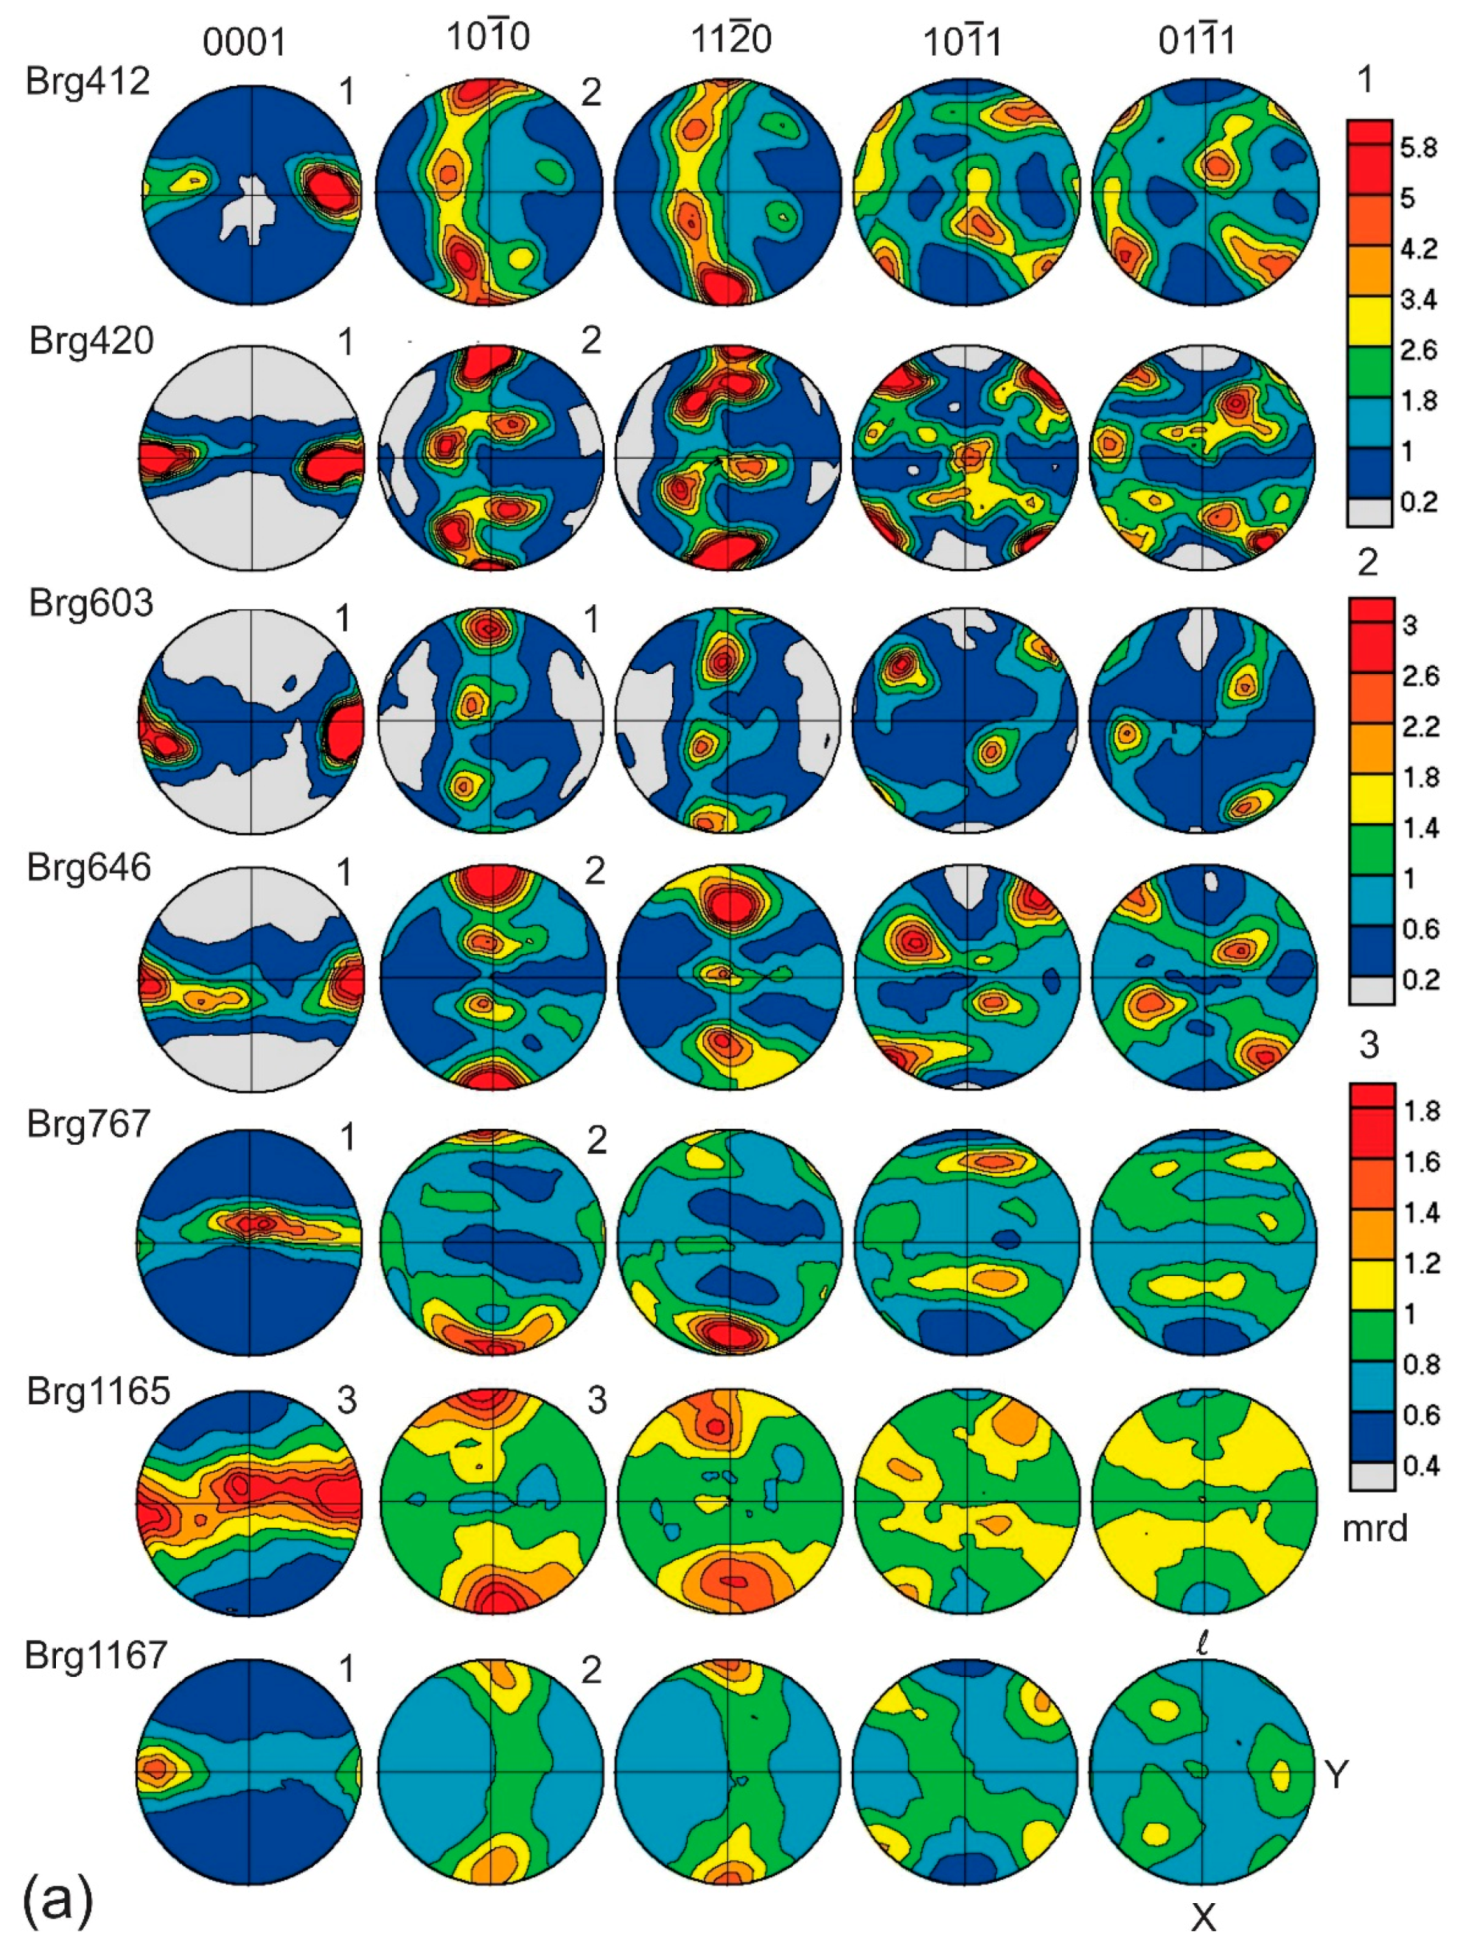
4. Results
5. Discussion
5.1. Quartz Texture Types
5.2. Bergell Quartz Textures
5.3. Polycrystal Plasticity Modeling
5.4. Multiphase Issues
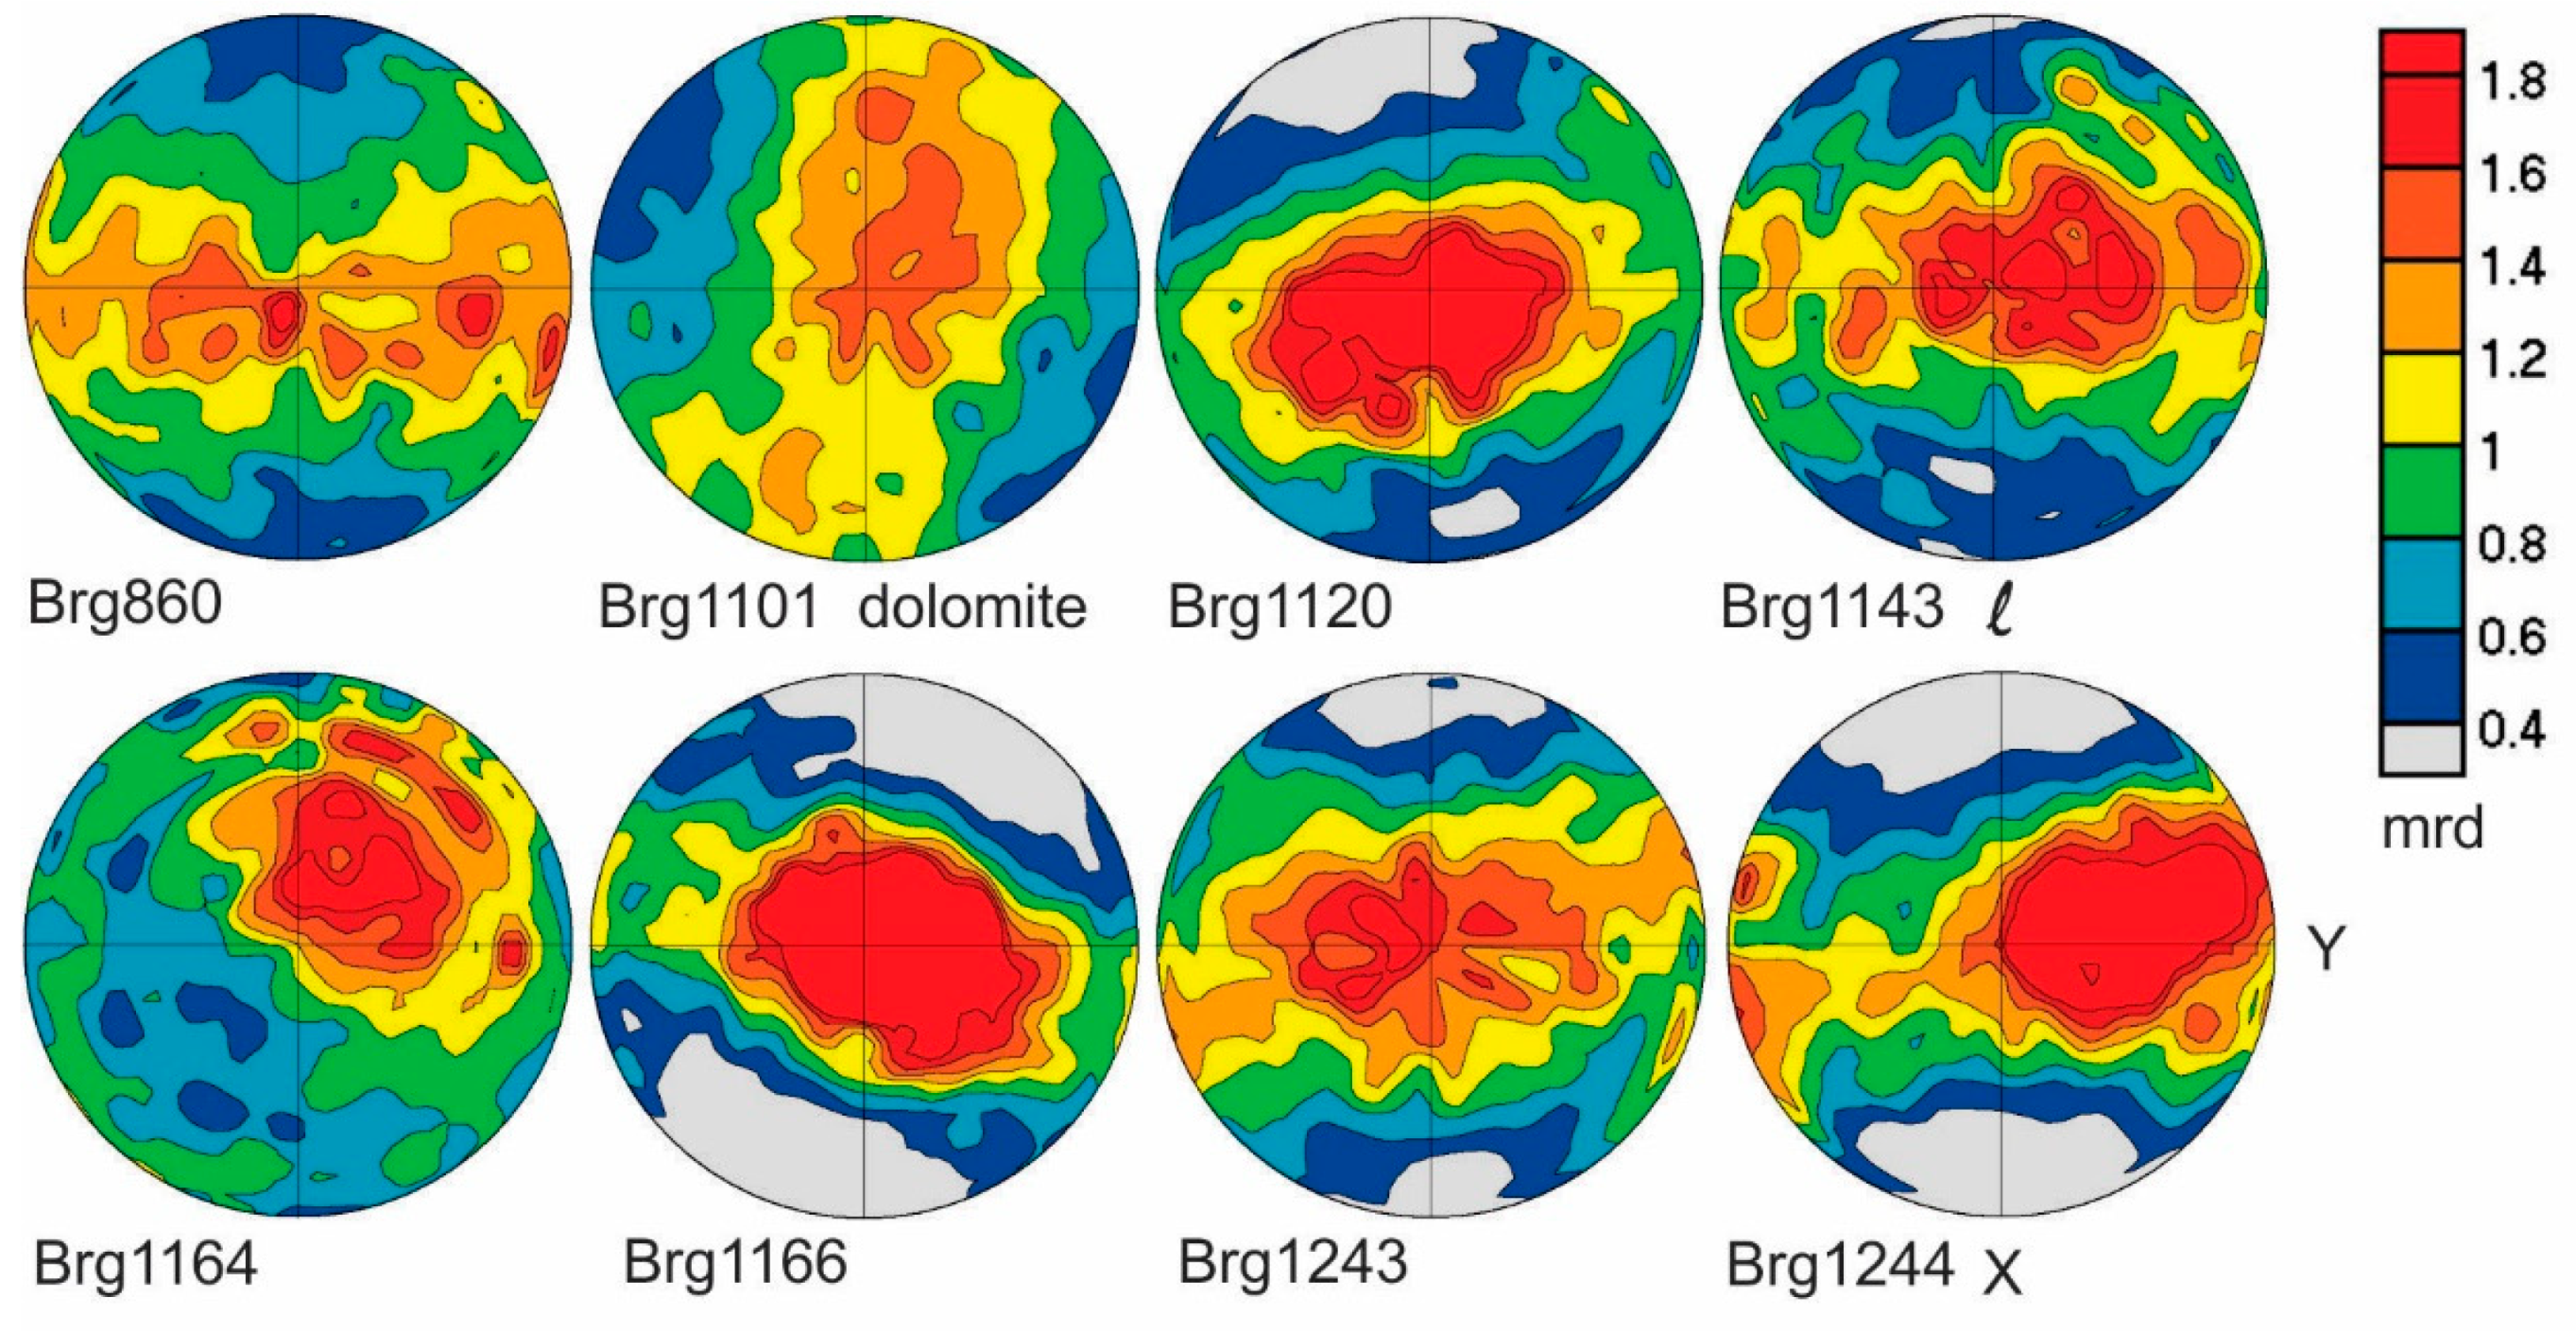
5.5. Textures of Associated Marble
5.6. Dynamic Recrystallization
5.7. Mechanical Dauphiné Twinning
5.8. Comparison of Methods of Texture Measurements
6. Conclusions
Supplementary Materials
Author Contributions
Funding
Acknowledgments
Conflicts of Interest
References
- Schmidt, W. Gefügestatistik. Tschermaks Mineral. Petrog. Mitt. 1925, 38, 392–423. [Google Scholar]
- Sander, B. Einführung in die Gefügekunde der geologischen Körper. Teil II: Die Korngefüge; Springer: Wien, Austria, 1950; p. 412. [Google Scholar] [CrossRef]
- Behr, H.-J. Beiträge zur petrographischen und tektonischen Analyse des sächsischen Grundgebirges. Freiberger Forsch. 1961, C119, 1–118. [Google Scholar]
- Behr, H.-J. Die Korngefügefazies der Zweigürteltektonite im kristallinen Grundgebirge Sachsens. Abh. Deutsch. Akad. Wiss. Berlin, Kl. Bergbau 1964, 1, 1–46. [Google Scholar]
- Behr, H.-J. Zur Methodik tektonischer Forschung im kristallinen Grundgebirge. Ber. Geol. Ges. DDR. 1965, 10/2, 163–179. [Google Scholar]
- Lister, G.S.; Dornsiepen, U.F. Fabric transition in the Saxony granulite terrain. J. Struct. Geol. 1982, 4, 81–92. [Google Scholar] [CrossRef]
- Christie, J.M. The Moine thrust zone in the Assynt region, northwest Scotland. Calif. Univ. Publ. Geol. Sci. 1963, 40, 345–440. [Google Scholar]
- Law, R.D. Heterogeneous deformation and quartz crystallographic fabric transitions: natural examples from the Moine Thrust zone at the stack of Glencoul, northern Assynt. J. Struct. Geol. 1987, 9, 819–833. [Google Scholar] [CrossRef]
- Law, R.D.; Schmid, S.M.; Wheeler, J. Simple shear deformation and quartz crystallographic fabrics: A possible natural example from the Torrion area of NW Scotland. J. Struct. Geol. 1990, 12, 29–45. [Google Scholar] [CrossRef]
- Bell, T.H.; Etheridge, M.A. The deformation and recrystallization of quartz in a mylonite zone, Central Australia. Tectonophysics 1976, 32, 235–267. [Google Scholar] [CrossRef]
- Wenk, H.-R. Gefügestudie an Quarzknauern und linsen der Tessiner Kulmination. Schweiz. Mineral. Petrog. Mitt. 1965, 45, 468–516. [Google Scholar]
- Simpson, C. Oblique girdle orientation patterns of quartz c-axes from a shear zone in the basement core of the Maggia Nappe Ticino, Switzerland. J. Struct. Geol. 1980, 2, 243–247. [Google Scholar] [CrossRef]
- Mancktelow, N.S. Quartz textures form the Simplon Fault Zone, southwest Switzerland and north Italy. Tectonophysics 1987, 135, 133–153. [Google Scholar] [CrossRef]
- Mancktelow, N.S. Atypical textures in quartz from the Simplon fault zone. J. Struct. Geol. 1987, 9/8, 995–1005. [Google Scholar] [CrossRef]
- Parsons, A.J.; Law, R.D.; Lloyd, R.D.; Phillips, R.J.; Searle, M.P. Thermo-kinematic evolution of the Annapurna-Dhaulagiri Himalaya, central Nepal: The composite orogenic system. Geochem. Geophys. Geosystems 2016, 17, 1511–1539. [Google Scholar] [CrossRef]
- Long, S.P.; Gordon, S.M.; Young, J.P.; Soignard, E. Temperature and strain gradients through Lesser Himalayan rocks and across the Main Central thrust, south central Bhutan: Implications for transport-parallel stretching and inverted metamorphism. Tectonics 2016, 35, 1863–1891. [Google Scholar] [CrossRef]
- Hunter, N.J.R.; Weinberg, R.F.; Wilson, C.J.L.; Luzin, V.; Misra, S. Microscopic anatomy of a “hot-on-cold” shear zone: Insights from quartzites from the Main Central Thrust in the Alaknanda Valley (Garhwal Himalaya). Geol. Soc. America Bull. 2018, 130, 1519–1539. [Google Scholar] [CrossRef]
- Larson, K.P. Refining the structural framework of the Khimti Khola region, east-central Nepal Himalaya, using quartz textures and c-axis fabrics. J. Struct. Geol. 2018, 107, 142–152. [Google Scholar] [CrossRef]
- Wenk, H.-R.; Baker, D.W.; Griggs, E.T. X-ray fabric analysis of hot-worked and annealed flint. Science 1967, 157, 1447–1449. [Google Scholar] [CrossRef]
- Tullis, J. Quartz: Preferred orientation in rocks produced by Dauphiné twinning. Science 1970, 168, 1342–1344. [Google Scholar] [CrossRef]
- Baker, D.W.; Wenk, H.-R.; Christie, J.M. X-ray analysis of preferred orientation in fine-grained quartz aggregates. J. Geol. 1969, 77, 144–172. [Google Scholar] [CrossRef]
- Baker, D.W.; Wenk, H.-R. Preferred orientation in a low symmetry quartz mylonite. J. Geol. 1972, 80, 81–105. [Google Scholar] [CrossRef]
- Dingley, D.J. A comparison of diffraction techniques for the SEM. Scanning Electr. Microsc. 1981, 4, 273–286. [Google Scholar]
- Kunze, K.; Adams, B.L.; Heidelbach, F.; Wenk, H.-R. Local microstructural investigations in recrystallized quartzite using orientation imaging microscopy. Mater. Sci. Forum. 1994, 157–162, 1243–1250. [Google Scholar] [CrossRef]
- Wenk, H.-R.; Lutterotti, L.; Vogel, S.C. Rietveld texture analysis from TOF neutron diffraction data. Powder Diffr. 2010, 25, 283–296. [Google Scholar] [CrossRef]
- Bunge, H.-J. Zur Darstellung allgemeiner Texturen. Z. Metallk. 1965, 56, 872–874. [Google Scholar]
- Roe, R.-J. Description of crystallite orientation in polycrystalline materials III, general solution to pole figure inversion. J. Appl. Phys. 1965, 36, 2024–2031. [Google Scholar] [CrossRef]
- Matthies, S. On the reproducibility of the orientation distribution function of texture samples from pole figures (ghost phenomena). Phys. Status Solidi B. 1979, 92, K135–K138. [Google Scholar] [CrossRef]
- Matthies, S.; Vinel, G.W. On the reproduction of the orientation distribution function of textured samples from reduced pole figures using the concept of conditional ghost correction. Phys. Status Solidi B 1982, 112, K111–K114. [Google Scholar] [CrossRef]
- Pawlik, K. Determination of the orientation distribution function from pole figures in arbitrarily defined cells. Phys. Status Solidi B 1986, 134, 477–483. [Google Scholar] [CrossRef]
- Schaeben, H. Entropy optimization in texture goniometry. Phys. Status Solidi B 1988, 148, 63–72. [Google Scholar] [CrossRef]
- Hielscher, R.; Schaeben, H. A novel pole figure inversion method: specification of the MTEX algorithm. J. Appl. Cryst. 2008, 41, 1024–1037. [Google Scholar] [CrossRef]
- Christie, J.M.; Griggs, D.T.; Carter, N.L. Experimental evidence of basal slip in quartz. J. Geol. 1964, 72, 734–756. [Google Scholar] [CrossRef]
- Hobbs, B.E.; McLaren, A.C.; Paterson, M.S. Plasticity of single crystals of synthetic quartz. Flow Fract. Rocks 1972, 16, 29–53. [Google Scholar] [CrossRef]
- Baeta, R.D.; Ashbee, K.G.H. Mechanical deformation of quartz: I Constant strain-rate compression experiments. Phil. Mag. 1970, 22, 601–623. [Google Scholar] [CrossRef]
- D’Omalius d’Halloy, J.J. Introduction a la Géologie; Levrault: Paris, France, 1833. [Google Scholar]
- Kurz, W.; Neubauer, F.; Genser, J.; Dachs, E. Alpine geodynamic evolution of passive and active continental margin sequences in the Tauern Window (eastern Alps, Austria, Italy): A review. Geol. Rundschau. 1998, 87, 225–242. [Google Scholar] [CrossRef]
- Schmid, S.M.; Scharf, A.; Handy, M.R.; Rosenberg, C.L. The Tauern Window (Eastern Alps, Austria): A new tectonic map, with cross-sections and a tectonometamorphic synthesis. Swiss J. Geosci. 2013, 106, 1–32. [Google Scholar] [CrossRef]
- Trommsdorff, V.; Montrasio, A.; Hermann, J.; Müntener, O.; Spillmann, P.; Gieré, R. The geological map of Valmalenco. Schweiz. Mineral. Petrog. Mitt. 2005, 85, 1–13. [Google Scholar]
- Wenk, H.-R. The structure of the Bergell Alps. Eclogae Geol. Helv. 1973, 66, 255–291. [Google Scholar]
- Wenk, H.-R.; Wenk, E.; Wallace, J. Metamorphic mineral assemblages in pelitic rocks of the Bergell Alps. Schweiz. Mineral. Petrog. Mitt. 1974, 54, 507–554. [Google Scholar]
- Law, R.D. Crystallographic fabrics: A selective review of their applications to research in structural geology. Geol. Soc. London, Spec. Publ. 1990, 54, 335–352. [Google Scholar] [CrossRef]
- Bishop, J.R. Piezoelectric effects in quartz-rich rocks. Tectonophysics 1981, 77, 97–321. [Google Scholar] [CrossRef]
- Ivankina, T.I.; Nikitin, A.N.; Voitus, W.; Walther, K. Texture analysis and investigation of piezoelectric properties of natural quartz. Textures Microstruct. 1991, 14–18, 421–429. [Google Scholar] [CrossRef]
- Frondel, C. Characters of quartz fibers. Am. Mineral. 1978, 63, 17–27. [Google Scholar]
- Tanaka, Y.; Kojima, T.; Takata, Y.; Chainani, A.; Lovesey, S.W.; Knight, K.S.; Takeuchi, T.; Oura, M.; Senba, Y.; Ohashi, H.; et al. Determination of structural chirality of berlinite and quartz using resonant X-ray diffraction with circularly polarized X-rays. Physic. Rev. B 2010, 81, 144104. [Google Scholar] [CrossRef]
- Matthies, S.; Wenk, H.-R.; Vinel, G.W. Some basic concepts of texture analysis and comparison of three methods to calculate orientation distributions from pole figures. J. Appl. Crystallogr. 1988, 21, 285–304. [Google Scholar] [CrossRef]
- Pehl, J.; Wenk, H.-R. Evidence for regional Dauphiné twinning in quartz from the Santa Rosa mylonite zone in Southern California. A neutron diffraction study. J. Struct. Geol. 2005, 27, 1741–1749. [Google Scholar] [CrossRef]
- Wenk, H.-R.; Lutterotti, L.; Vogel, S.C. Texture analysis with the new HIPPO TOF diffractometer. Nucl. Instr. Methods A. 2003, 515, 575–588. [Google Scholar] [CrossRef]
- Ullemeyer, K.; Spalthoff, P.; Heinitz, J.; Isakov, N.N.; Nikitin, A.N.; Weber, K. The SKAT texture diffractometer at the pulsed reactor IBR-2 at Dubna: Experimental layout and first measurements. Nucl. Instr. Methods A. 1998, 412, 80–88. [Google Scholar] [CrossRef]
- Keppler, R.; Ullemeyer, K.; Behrmann, J.H.; Stipp, M. Potential of full pattern fit methods for the texture analysis of geological materials: Implications from texture measurements at the recently upgraded neutron time-of-flight diffractometer SKAT. J. Appl. Crystallogr. 2014, 47, 1520–1534. [Google Scholar] [CrossRef]
- Lutterotti, L.; Matthies, S.; Wenk, H.-R.; Schultz, A.J.; Richardson, J.W. Combined texture and structure analysis of deformed limestone from time-of-flight neutron diffraction spectra. J. Appl. Phys. 1997, 81, 594–600. [Google Scholar] [CrossRef]
- Kihara, K. An X-ray study of the temperature dependence of the quartz structure. Eur. J. Mineral. 1990, 2/1, 63–77. [Google Scholar] [CrossRef]
- Wenk, H.-R.; Matthies, S.; Donovan, J.; Chateigner, D. BEARTEX: A Windows-based program system for quantitative texture analysis. J. Appl. Crystallogr. 1998, 31, 262–269. [Google Scholar] [CrossRef]
- Matthies, S.; Wenk, H.-R. Transformations for monoclinic crystal symmetry in texture analysis. J. Appl. Cryst. 2009, 42, 564–571. [Google Scholar] [CrossRef]
- Tullis, J.; Christie, J.M.; Griggs, D.T. Microstructures and preferred orientations of experimentally deformed quartzites. Geol. Soc. Am. Bull. 1973, 84, 297–314. [Google Scholar] [CrossRef]
- Stipp, M.; Kunze, K. Dynamic recrystallization near the brittle-plastic transition in naturally and experimentally deformed quartz aggregates. Tectonophysics 2008, 448, 77–97. [Google Scholar] [CrossRef]
- Tullis, J. Preferred orientation of quartz produced by slip during plane strain. Tectonophysics 1977, 39, 87–102. [Google Scholar] [CrossRef]
- Dell’Angelo, L.N.; Tullis, J. Fabric development in experimentally sheared quartzites. Tectonophysics 1989, 169, 1–21. [Google Scholar] [CrossRef]
- Mainprice, D.H.; Bouches, J.L.; Blumenfeld, P.; Tubiá, J.M. Dominant c slip in naturally deformed quartz: Implications for dramatic plastic softening at high temperature. Geology 1986, 14, 819–822. [Google Scholar] [CrossRef]
- Toy, V.G.; Prior, D.J.; Norris, R.J. Quartz fabrics in the Alpine Fault mylonites: Influence of pre-existing preferred orientations on fabric development during progressive uplift. J. Struct. Geol. 2008, 30, 602–621. [Google Scholar] [CrossRef]
- Trommsdorff, V.; Wenk, E. Diskussion eines Zwillingsgefüges durch Achsenverteilungsanalyse an Quarz eines Tessiner Gneisses. Schweiz. Mineral. Petrog. Mitt. 1963, 43, 687–698. [Google Scholar]
- Fazio, E.; Punturo, R.; Cirrincione, R.; Kern, H.; Pezzino, A.; Wenk, H.-R.; Goswami, S.; Mamtani, M.A. Quartz preferred orientation in naturally deformed mylonitic rocks (Montalto Shear Zone—Italy): A comparison of results by different techniques, their advantages and limitations. Int. J. Earth Sci. 2017, 106, 2259–2278. [Google Scholar] [CrossRef]
- Wilson, C.J.L. Preferred orientation in quartz ribbon mylonites. Geol. Soc. Am. Bull. 1975, 86, 968–974. [Google Scholar] [CrossRef]
- Schmid, S.M.; Casey, M.; Starkey, J. An illustration of the advantages of a complete texture analysis described by the orientation distribution function (ODF) using quartz pole figure data. Tectonophysics 1981, 78, 101–117. [Google Scholar] [CrossRef]
- Carreras, J.; Estrada, A.; White, S. The effects of folding on the c-axis fabrics of a quartz mylonite. Tectonophysics 1977, 39, 3–24. [Google Scholar] [CrossRef]
- Okudaira, T.; Takeshita, T.; Hara, I.; Ando, J. A new estimate of the conditions for transition from basal <a> to prism [c] slip in naturally deformed quartz. Tectonophysics 1995, 250, 31–46. [Google Scholar] [CrossRef]
- Barth, N.C.; Hacker, B.R.; Seward, G.G.E.; Walsh, E.O.; Young, D.; Johnston, S. Strain within the ultrahigh-pressure Western Gneiss region of Norway recorded by quartz CPOs. Geol. Soc. London Spec. Publ. 2010, 335, 663–685. [Google Scholar] [CrossRef]
- Knipe, R.J.; Law, R.D. The influence of crystallographic orientation and grain boundary migration on microstructural and textural evolution in an S-C mylonite. Tectonophysics 1987, 135, 155–169. [Google Scholar] [CrossRef]
- Law, R.D.; Mainprice, D.; Casey, M.; Lloyd, G.E.; Knipe, R.J.; Cook, B.; Thigpen, J.R. Moine thrust zone mylonites at the Stack of Glencoul: I—Microstructures, strain and influence of recrystallization on quartz crystal fabric development. Geol. Soc. London Spec. Publ. 2010, 335, 543–577. [Google Scholar] [CrossRef]
- Pennacchioni, G.; Menegon, L.; Leiss, B.; Nestola, F.; Bromiley, G. Development of crystallographic preferred orientation and microstructure during plastic deformation of natural coarse-grained quartz veins. J. Geophys. Res. 2010, 115, B12405. [Google Scholar] [CrossRef]
- Stipp, M.; Stünitz, H.; Heilbronner, R.; Schmid, S.M. The Eastern Tonale fault zone: A “natural laboratory” for crystal plastic deformation of quartz over a temperature range from 250 °C to 700 °C. J. Struct. Geol. 2002, 24, 1861–1884. [Google Scholar] [CrossRef]
- Hara, I.; Takeda, K.; Kimura, T. Preferred lattice orientation of quartz in shear deformation. J. Sci. Hiroshima Univ. Ser. C 1973, 7, 1–11. [Google Scholar]
- Bouchez, J.L.; Pecher, A. Plasticité du quartz et sens de cisaillement dans les quartzites du grand Chevauchement Central Himalayen. Bull. Soc. Geol. Fr. 1976, 6, 1377–1384. [Google Scholar] [CrossRef]
- Lister, G.S. Discussion. Cross-girdle c-axis fabrics in quartzites plastically deformed by plane strain and progressive simple shear. Tectonophysics 1977, 39, 51–54. [Google Scholar] [CrossRef]
- Brunel, M. Quartz fabrics in shear-zone mylonites: Evidence for a major imprint due to late strain increments. Tectonophysics 1980, 64, T33–T44. [Google Scholar] [CrossRef]
- Lloyd, G.E.; Freeman, B. Dynamic recrystallization of quartz under greenschist conditions. J. Struct. Geol. 1994, 16, 867–881. [Google Scholar] [CrossRef]
- Takeshita, T.; Wenk, H.-R.; Lebensohn, R. Development of preferred orientation and microstructure in sheared quartzite: Comparison of natural and simulated data. Tectonophysics 1999, 312, 133–155. [Google Scholar] [CrossRef]
- Heidelbach, F.; Kunze, K.; Wenk, H.-R. Texture nalysis of a recrystallized quartzite using electron diffraction in the scanning electron microscope. J. Struct. Geol. 2000, 22, 91–104. [Google Scholar] [CrossRef]
- Keller, L.M.; Stipp, M. The single slip hypothesis revisited: Crystal-preferred orientations of sheared quartz aggregates with increasing strain in nature and numerical simulation. J. Struct. Geol. 2011, 33, 1491–1500. [Google Scholar] [CrossRef]
- Kilian, R.; Heilbronner, R.; Stünitz, H. Quartz microstructures and crystallographic preferred orientation: Which shear sense do they indicate? J. Struct. Geol. 2011, 33, 1446–1466. [Google Scholar] [CrossRef]
- Morales, L.F.G.; Mainprice, D.; Lloyd, G.E.; Law, R.D. Crystal fabric development and slip systems in a quartz mylonite: An approach via transmission electron microscopy and viscoplastic self-consistent modelling. Geol. Soc. London Special Publ. 2011, 360, 151–174. [Google Scholar] [CrossRef]
- Lister, G.S.; Williams, P.F. Fabric development in shear zones: theoretical controls and observed phenomena. J. Struct. Geol. 1979, 1, 283–297. [Google Scholar] [CrossRef]
- Heilbronner, R.; Tullis, J. Evolution of c-axis pole figures and grain size during dynamic recrystallization: Results from experimentally sheared quartzite. J. Geophys. Res. 2006, 111, B10202. [Google Scholar] [CrossRef]
- Kilian, R.; Heilbronner, R. Analysis of crystallographic preferred orientation of experimentally deformed Black Hills quartzite. Solid Earth 2017, 8, 1095–1117. [Google Scholar] [CrossRef]
- Lister, G.S.; Paterson, M.S. The simulation of fabric development during plastic deformation and its application to quartzite: Fabric transitions. J. Struct. Geol. 1979, 1, 99–115. [Google Scholar] [CrossRef]
- Lister, G.S.; Hobbs, B.E. The simulation of fabric development during plastic deformation and its application to quartzite: The influence of deformation history. J. Struct. Geol. 1980, 2, 355–370. [Google Scholar] [CrossRef]
- Morales, L.F.G.; Lloyd, G.E.; Mainprice, D. Fabric transitions in quartz via viscoplastic self-consistent modeling part I: Axial compression and simple shear under constant strain. Tectonophysics 2014, 636, 52–69. [Google Scholar] [CrossRef]
- Heyliger, P.; Ledbetter, H.; Kim, S. Elastic constants of natural quartz. J. Acoust. Soc. Am. 2003, 114, 644–650. [Google Scholar] [CrossRef]
- Carter, N.L. Basal quartz deformation lamellae; a criterion for recognition of impactites. Am. J. Sci. 1965, 263, 786–806. [Google Scholar] [CrossRef]
- Christie, J.M.; Raleigh, C.B. The origin of deformation lamellae in quartz. Am. J. Sci. 1959, 257, 385–407. [Google Scholar] [CrossRef]
- McLaren, A.C.; Turner, R.G.; Boland, J.N.; Hobbs, B.E. Dislocation structure of the deformation lamellae in synthetic quartz; a study by electron and optical microscopy. Contrib. Mineral. Petrol. 1970, 29, 104–115. [Google Scholar] [CrossRef]
- White, S. Geological significance of recovery and recrystallization processes in quartz. Tectonophysics 1977, 39, 143–170. [Google Scholar] [CrossRef]
- Christie, J.M.; Ardell, A.J. Substructures of deformation lamellae in quartz. Geology 1974, 2, 405–408. [Google Scholar] [CrossRef]
- Vernooij, M.G.C.; Langenhorst, F. Experimental reproduction of tectonic deformation lamellae in quartz and comparison to shock-induced planar deformation features. Meteor. Planet. Sci. 2005, 40, 1353–1361. [Google Scholar] [CrossRef]
- Trepman, C.A.; Spray, J.G. Planar microstructures and Dauphiné twins in shocked quartz from the Charlevoix impact structure, Canada. Geol. Soc. Amer. Special Paper 2005, 384, 315–328. [Google Scholar] [CrossRef]
- Gratz, A.J.; Tyburczy, J.; Christie, J.; Ahrens, T.; Pongratz, P. Shock metamorphism of deformed quartz. Phys. Chem. Miner. 1988, 16, 221–233. [Google Scholar] [CrossRef]
- Gratz, A.J.; Nellis, W.J.; Christie, J.M.; Brocious, W.; Swegle, J.; Cordier, P. Shock metamorphism of quartz with initial temperatures −170 to +1000 °C. Phys. Chem. Miner. 1992, 19, 267–288. [Google Scholar] [CrossRef]
- Stöffler, D.; Langenhorst, F. Shock metamorphism of quartz in nature and experiment: I. Basic observation and theory. Meteoritics 1994, 29, 155–181. [Google Scholar] [CrossRef]
- French, B.M.; Koeberl, C. The convincing identification of terrestrial meteorite impact structures: What works, what doesn’t, and why. Earth-Sci. Rev. 2010, 98, 123–170. [Google Scholar] [CrossRef]
- Hamers, M.F.; Pennock, G.M.; Herwegh, M.; Drury, M.R. Distinction between amorphous and healed planar deformation features in shocked quartz using composite color scanning electron microscope cathodoluminescence (SEM-CL) imaging. Meteorit. Planet. Sci. 2016, 51, 1914–1931. [Google Scholar] [CrossRef]
- Schubnikow, A. Über Schlagfiguren des Quarzes. Z. Kristallogr. 1930, 74, 103–104. [Google Scholar]
- Molinari, A.; Canova, G.; Ahzi, S. A self consistent approach of the large deformation polycrystal viscoplasticity. Acta Metall. 1987, 35, 2983–2994. [Google Scholar] [CrossRef]
- Lebensohn, R.; Tomé, C.A. self-consistent visco-plastic model: Prediction of rolling textures of anisotropic materials. Mater. Sci. Eng. A 1994, 175, 71–82. [Google Scholar] [CrossRef]
- Wenk, H.-R.; Canova, G.; Molinari, A.; Kocks, U.F. Viscoplastic modeling of texture development in quartzite. J. Geophys. Res. 1989, 94, 17895–17906. [Google Scholar] [CrossRef]
- Wenk, H.R. Deformation of mylonites in Palm Canyon, California, based on xenolith geometry. J. Struct. Geol. 1998, 20, 559–571. [Google Scholar] [CrossRef]
- Song, W.J.; Ree, J.H. Effect of mica on the grain size of dynamically recrystallized quartz in a quartz-muscovite mylonite. J. Struct. Geol. 2007, 29, 1872–1881. [Google Scholar] [CrossRef]
- Ebert, A.; Herwegh, M.; Evans, B.; Pfiffner, A.; Austin, N.; Vennemann, T. Microfabrics in carbonate mylonites along a large-scale shear zone (Helvetic Alps). Tectonophysics 2007, 444, 1–26. [Google Scholar] [CrossRef]
- Herwegh, M.; Linckens, J.; Ebert, A.; Berger, A.; Brodhag, S.H. The role of second phases for controlling microstructural evolution in polymineralic rocks: A review. J. Struct. Geol. 2011, 33, 1728–1750. [Google Scholar] [CrossRef]
- Tullis, J.; Wenk, H.-R. Effect of muscovite on the strength and lattice preferred orientations of experimentally deformed quartz aggregates. Mater. Sci. Eng. A 1994, 175, 209–220. [Google Scholar] [CrossRef]
- Canova, G.R.; Wenk, H.-R.; Molinari, A. Deformation modeling of multiphase polycrystals: Case of a quartz-mica aggregate. Acta Metall. Mater. 1992, 40, 1519–1530. [Google Scholar] [CrossRef]
- Vasin, R.; Kern, H.; Lokajicek, T.; Svitek, T.; Lehmann, E.; Mannes, D.C.; Chaouche, M.; Wenk, H.-R. Elastic anisotropy of Tambo gneiss from Promontogno, Switzerland: A comparison of crystal orientation and microstructure-based modeling and experimental measurements. Geophys. J. Int. 2017, 209, 1–20. [Google Scholar] [CrossRef]
- Rutter, E.H. Influence of temperature, strain rate and interstitial water in experimental deformation of calcite rocks. Tectonophysics 1974, 22, 311–334. [Google Scholar] [CrossRef]
- De Bresser, J.H.P.; Spiers, C.J. Strength characteristics of the r, f, and c slip systems in calcite. Tectonophysics 1997, 272, 1–23. [Google Scholar] [CrossRef]
- Turner, F.J.; Griggs, D.T.; Clark, R.H.; Dixon, R.H. Deformation of Yule marble, part VII: Development of oriented fabrics at 300 °C–400 °C. Geol. Soc. Am. Bull. 1956, 67, 1259–1294. [Google Scholar] [CrossRef]
- Schmid, S.M.; Paterson, M.S.; Boland, J.N. High temperature flow and dynamic recrystallization in Carrara marble. Tectonophysics 1980, 65, 245–280. [Google Scholar] [CrossRef]
- De Raadt, W.S.; Burlini, L.; Kunze, K.; Spiers, C.J. Effect of pre-existing crystallographic preferred orientation on the rheology of Carrara marble. J. Struct. Geol. 2014, 68, 44–57. [Google Scholar] [CrossRef]
- Pieri, M.; Burlini, L.; Kunze, K.; Stretton, I.; Olgaard, D.L. Rheological and microstructural evolution of Carrara marble with high shear strain: Results from high temperature torsion experiments. J. Struct. Geol. 2001, 23, 1393–1413. [Google Scholar] [CrossRef]
- Pieri, M.; Kunze, K.; Burlini, L.; Stretton, I.; Olgaard, D.L.; Burg, J.-P.; Wenk, H.-R. Texture development of calcite by deformation and dynamic recrystallization at 1000 K during torsion experiments of marble to large strains. Tectonophysics 2001, 330, 119–140. [Google Scholar] [CrossRef]
- Trommsdorff, V. Gefügestudien an Calcitmarmor aus Val Prato (Tessin). Schweiz. Mineral. Petrog. Mitt. 1964, 44, 595–611. [Google Scholar]
- Romeo, I.; Capote, R.; Lunar, R. Crystallographic preferred orientation and microstructure of a Variscan marble mylonite in the Ossa-Morena Zone (SW Iberia). J. Struct. Geol. 2007, 29, 1353–1368. [Google Scholar] [CrossRef]
- Rutter, E.H.; Rusbridge, M. The effect of non-coaxial strain paths on crystallographic preferred orientation development in the experimental deformation of a marble. Tectonophysics 1977, 39, 73–86. [Google Scholar] [CrossRef]
- Schmid, S.M.; Panozzo, R.; Bauer, S. Simple shear experiments on calcite rocks: Rheology and microfabric. J. Struct. Geol. 1987, 9, 747–778. [Google Scholar] [CrossRef]
- Wenk, H.-R.; Takeshita, T.; Bechler, E.; Erskine, B.; Matthies, S. Pure shear and simple shear calcite textures. Comparison of experimental, theoretical and natural data. J. Struct. Geol. 1987, 9, 731–745. [Google Scholar] [CrossRef]
- Trommsdorff, V.; Wenk, H.-R. Die Regelung des Dolomites von Crevola (Simplon), Diskussion und Probleme. Schweiz. Mineral. Petrog. Mitt. 1965, 45, 551–569. [Google Scholar]
- Holyoke III, C.W.; Kronenberg, A.K.; Newman, J. Dislocation creep of polycrystalline dolomite. Tectonophysics 2013, 590, 72–82. [Google Scholar] [CrossRef]
- Mainprice, D.H.; Paterson, M.S. Experimental studies of the role of water in the plasticity of quartzites. J. Geophys. Res. 1984, 89, 4257–4296. [Google Scholar] [CrossRef]
- Stipp, M.; Tullis, J.; Scherwath, M.; Behrmann, J.H. A new perspective on paleopiezometry: Dynamically recrystallized grain size distributions indicate mechanism changes. Geology 2010, 38, 759–762. [Google Scholar] [CrossRef]
- Cross, A.J.; Prior, D.J.; Stipp, M.; Kidder, S. The recrystallized grain size piezometer for quartz: An EBSD-based calibration. Geophys. Res. Lett. 2017, 44, 6667–6674. [Google Scholar] [CrossRef]
- Gleason, G.C.; Tullis, J.; Heidelbach, F. The role of dynamic recrystallization in the development of lattice preferred orientations in experimentally deformed quartz aggregates. J. Struct. Geol. 1993, 15, 1145–1168. [Google Scholar] [CrossRef]
- Halfpenny, A.; Prior, D.J.; Wheeler, J. Electron backscatter diffraction analysis to determine the mechanisms that operated during dynamic recrystallization of quartz-rich rocks. J. Struct. Geol. 2012, 36, 2–15. [Google Scholar] [CrossRef]
- Hirth, G.; Tullis, J. Dislocation creep regimes in quartz aggregates. J. Struct. Geol. 1992, 14, 145–159. [Google Scholar] [CrossRef]
- Humphreys, F.J.; Hatherly, M. Recrystallization and Related Annealing Phenomena; Oxford University Press: Oxford, UK, 1995. [Google Scholar]
- Kamb, W.B. Theory of preferred orientation developed by recrystallization under stress. J. Geol. 1959, 67, 153–170. [Google Scholar] [CrossRef]
- Shimizu, I. Nonhydrostatic and nonequilibrium thermodynamics of deformable materials. J. Geophys. Res. 1992, 97, 4587–4597. [Google Scholar] [CrossRef]
- Shimizu, I. Theories and applicability of grain size piezometers: The role of dynamic recrystallization mechanisms. J. Struct. Geol. 2008, 30, 899–917. [Google Scholar] [CrossRef]
- Jessell, M.W. Simulation of fabric development in recrystallizing aggregates, I. Description of the model. J. Struct. Geol. 1988, 10, 771–778. [Google Scholar] [CrossRef]
- Jessell, M.W. Simulation of fabric development in recrystallizing aggregates, II. Example model runs. J. Struct. Geol. 1988, 10, 779–793. [Google Scholar] [CrossRef]
- Wenk, H.-R.; Canova, G.; Bréchet, Y.; Flandin, L. A deformation-based model for recrystallization of anisotropic materials. Acta Mater. 1997, 45, 3283–3296. [Google Scholar] [CrossRef]
- Wenk, H.-R.; Tomé, C.N. Modeling dynamic recrystallization of olivine dynamic in simple shear. J. Geophys. Res. 1999, 104, 25513–25527. [Google Scholar] [CrossRef]
- Thomas, L.A.; Wooster, W.A. Piezocrescence—The growth of Dauphiné twinning in quartz under stress. Proc. R. Soc. Lond. Math. Phys. Sci. 1951, A 208, 43–62. [Google Scholar] [CrossRef]
- Tullis, J.; Tullis, T.E. Preferred orientation produced by mechanical Dauphiné twinning. Thermodynamics and axial experiments. Am. Geophys. U. Monogr. 1972, 16, 67–82. [Google Scholar] [CrossRef]
- Minor, A.; Rybacki, E.; Sintubin, M.; Vogel, S.; Wenk, H.-R. Tracking mechanical Dauphiné twin evolution with applied stress in axial compression experiments on a low-grade metamorphic rock. J. Struct. Geol. 2018, 112, 81–94. [Google Scholar] [CrossRef]
- Wenk, H.-R.; Barton, N.; Bortolotti, M.; Vogel, S.; Voltolini, M.; Lloyd, G.E.; Gonzalez, G.B. Dauphiné twinning and texture memory in polycrystalline quartz. Part 3: Texture memory during phase transformation. Phys. Chem. Miner. 2009, 37, 567–583. [Google Scholar] [CrossRef]
- Menegon, L.; Pennacchioni, G.; Heilbronner, R.; Pittarello, L. Evolution of quartz microstructure and c-axis crystallographic preferred orientation within ductilely deformed granitoids (Arolla Unit, Western Alps). J. Struct. Geol. 2008, 30, 1332–1347. [Google Scholar] [CrossRef]
- Menegon, L.; Piazolo, S.; Pennacchioni, G. The effect of Dauphiné twinning on plastic strain in quartz. Contrib. Mineral Petrol. 2011, 161, 635–652. [Google Scholar] [CrossRef]
- Rahl, J.M.; McGrew, A.J.; Fox, J.A.; Latham, J.R.; Gabrielson, T. Rhomb-dominated crystallographic preferred orientations in incipiently deformed quartz sandstones: A potential paleostress indicator for quartz-rich rocks. Geology 2018, 46, 195–198. [Google Scholar] [CrossRef]
- Heilbronner, R.; Pauli, C. Integrated spatial and orientation analysis of quartz c-axes by computer-aided microscopy. J. Struct. Geol. 1993, 15, 369–382. [Google Scholar] [CrossRef]
- Hunter, N.J.R.; Wilson, C.J.L.; Luzin, V. Comparison of quartz crystallographic preferred orientations identified with optical fabric analysis, electron backscatter and neutron diffraction techniques. J. Microsc. 2017, 265, 169–184. [Google Scholar] [CrossRef]
- Lutterotti, L.; Vasin, R.; Wenk, H.-R. Rietveld texture analysis from synchrotron diffraction images: I. Basic analysis. Powder Diffr. 2014, 29, 76–84. [Google Scholar] [CrossRef]
- Wenk, H.-R.; Lutterotti, L.; Kaercher, P.; Kanitpanyacharoen, W.; Miyagi, L.; Vasin, R. Rietveld texture analysis from synchrotron diffraction images: II. Complex multiphase materials and diamond anvil cell experiments. Powder Diffr. 2014, 29, 220–232. [Google Scholar] [CrossRef]
- Wenk, H.-R. Standard project for pole figure determination by neutron diffraction. J. Appl. Cryst. 1991, 24, 920–927. [Google Scholar] [CrossRef]
- Ullemeyer, K.; Braun, G.; Dahms, M.; Kruhl, J.H.; Olesen, N.Ø.; Siegesmund, S. Texture analysis of a muscovite-bearing quartzite: A comparison of some currently used techniques. J. Struct. Geol. 2000, 22, 1541–1557. [Google Scholar] [CrossRef]
- Wenk, H.-R. Texture analysis by advanced diffraction methods. In Modern Diffraction Methods; Mittemeijer, E.J., Welzel, U., Eds.; Wiley-VCH: Weinheim, Germany, 2012; pp. 173–220. [Google Scholar]


| Sample # | Place | Coord. | Neutron | EBSD | ||
|---|---|---|---|---|---|---|
| 0001 | J | 0001 | J | |||
| A: 24 Triassic quartzites | ||||||
| Brg 568 x | Alpascela | 770.1/141.5 | 12.4 | 5.5 | 15.5 + * | 10.3 |
| Brg 641 x | Val Duana | 763.3/139.6 | 2.4 | 1.2 | 6.6 + | 4.0 |
| Brg 730 | Roticcio | 769.0/136.85 | 4.2 | 1.8 | ||
| Brg 734 | Alpascela | 770.1/141.1 | 8.5 | 3.6 | ||
| Brg 752 | Bergalga | 762.95/139.25 | 2.7 | 1.4 | ||
| Brg 753 | Bergalga | 762.95/139.25 | 2.0 | 1.2 | ||
| Brg 858 x | Cam | 766.35/137.55 | 5.4 | 1.8 | ||
| Brg 980 x | Casaccia | 771.8/139.7 | 5.4 | 2.0 | 9.0 * | 8.2 |
| Brg 981 x | Casaccia | 771.8/139.6 | 7.1 | 3.2 | 9.3 + | 5.3 |
| Brg 1102 | Casaccia | 771.8/139.65 | 6.9 | 3.2 | ||
| Brg 1126 | Avers Croet | 757.3/149.4 | 3.6 | 2.1 | 7.5 + * | 5.2 |
| Brg 1127 x | Campsut | 756.1/151.5 | 3.4 | 1.9 | 5.0 + | 4.1 |
| Brg 1135 | Septimer | 767.6/142.7 | 2.3 | 1.2 | 5.2 * | 3.5 |
| Brg 1137 | Val Turba | 768.1/142.6 | 3.9 | 1.9 | 7.1 + | 4.2 |
| Brg 1139 x | Septimer | 768.5/142.7 | 3.7 | 1.9 | ||
| Brg 1235 x | Lago di Lei | 755.9/155.5 | 5.1 | 1.8 | ||
| Brg 1241 | Val Turba | 768.1/143.1 | 8.8 | 4.4 | ||
| Brg 1245 x | Plan Vaest | 762.1/135.15 | 4.0 | 2.2 | ||
| Brg 1247 | Plan Vaest | 762.1/135.1 | 2.9 | 1.5 | ||
| Brg 1477 | Bugna | 760.9/135.45 | 2.9 | 1.0 | 3.6 + | 1.9 |
| Brg 1618D x | Cavi | 760.1/135.7 | 2.3 | 1.5 | 6.6 + | 3.2 |
| Brg 1643D | Duana | 764.35/139.2 | 6.4 | 2.7 | 11.3 + | 5.5 |
| Sci 690 x | Innerferrera | 756.0/152.1 | 5.8 | 2.7 | 8.4 + | 5.1 |
| Sci 881 x | Pso. Turbine | 757.0/136.0 | 3.9 | 1.8 | 3.9 + * | 6.4 |
| B: 15 Quartz layers | ||||||
| Brg 407 | Tegiola | 762.5/130.1 | 21.1 + | 14.5 | ||
| Brg 412 x | Tegiola | 762.6/130.05 | 12.9 | 4.5 | ||
| Brg 420 x | Caccior | 763.4/134.9 | 15.0 | 9.8 | ||
| Brg 603 x | Tegiola | 762.2/130.25 | 16.9 | 11.9 | 19.6 + * | 22.1 |
| Brg 646 x | Tombal | 762.3/135.3 | 7.5 | 4.6 | ||
| Brg 767 | Caccior | 763.4/135.1 | 6.1 | 2.5 | ||
| Brg 1165 | Lavinair Crusc | 772.55/138.25 | 2.2 | 1.2 | ||
| Brg 1167 | Lavinair Crusc | 771.85/138.25 | 4.9 | 1.7 | 9.3 * | 6.6 |
| Brg 1520 x | Blaunca | 774.5/142.8 | 12.4 | 5.3 | 21.3 + | 22.1 |
| Brg 1524 x | Plan di Zoch | 773.75/142.7 | 8.8 | 4.4 | 11.8 + | 8.5 |
| Brg 1527 | Orden | 773.6/140.5 | 9.4 | 6.0 | ||
| Sci 292 x | Tegiola | 763.4/130.3 | 29.2 | 18.4 | 36.4 * | 26.9 |
| Sci 490 x | Albigna | 770.5/136.3 | 4.7 | 2.2 | ||
| Sci 514 x | V. Largh | 771.2/136.7 | 4.3 | 1.7 | ||
| Sci 763 | Lera d’Sura | 762.6/132.0 | 26.3 | 11.5 | 51.7 + | 74.1 |
| C: 8 Marbles (do is dolomite) | ||||||
| Brg860 | Pass dal Cam | 766.3/137.55 | 2.1 | 1.1 | ||
| Brg1101 | Casaccia (do) | 771.7/140.0 | 1.6 | 1.1 | ||
| Brg1120 | Juf | 764.37/146.3 | 3.4 | 1.3 | ||
| Brg1143 | Alpascela | 769.7/141.4 | 2.2 | 1.2 | ||
| Brg1164 | Lavinair Crusc | 772.55/138.2 | 2.2 | 1.2 | ||
| Brg1166 | Lavinair Crusc | 771.85/138.2 | 3.7 | 1.7 | ||
| Brg1243 | Val Turba | 768.3/142.8 | 2.1 | 1.2 | ||
| Brg1244 | Val Turba | 768.3/142.8 | 3.1 | 1.4 | ||
| Sample | Area (mm2) | Selected Data (K) | Twin Boundaries (K) | Inverse Ratio 10−2 |
|---|---|---|---|---|
| A: Triassic Quartzites | ||||
| Brg568 | 2 | 586 | 16 | 2.6 |
| Brg641 | 3 | 844 | 7 | 0.8 |
| Brg980 | 4 | 629 | 10 | 1.6 |
| Brg981 | 3 | 730 | 14 | 2.0 |
| Brg1126 | 2 | 1540 | 24 | 1.6 |
| Brg1127 | 2 | 1116 | 11 | 1.0 |
| Brg1135 | 3 | 597 | 17 | 2.8 |
| Brg1137 | 2 | 407 | 22 | 5.4 |
| Brg1477 | 3 | 614 | 9 | 1.5 |
| Brg1618 | 5 | 1257 | 31 | 2.4 |
| Brg1643 | 4 | 2628 | 20 | 0.8 |
| Sci638 | 5 | 756 | 30 | 3.9 |
| Sci690 | 3 | 583 | 8 | 1.4 |
| Sci881 | 4 | 1113 | 37 | 3.3 |
| B: Quartz Layers | ||||
| Brg407 | 1 | 670 | 7 | 1.0 |
| Brg603 | 2 | 560 | 10 | 1.9 |
| Brg1167 | 4 | 1383 | 16 | 1.1 |
| Brg1520 | 3 | 729 | 3 | 0.4 |
| Brg1524 | 2 | 818 | 10 | 1.2 |
| Sci292 | 13 | 550 | 2 | 0.3 |
| Sci763 | 3 | 827 | 7 | 0.8 |
| C: Comparison (see paragraph 5.7 below) | ||||
| Br-undef-B | 4 | 331 | 5 | 1.4 |
| Br-300-A | 4 | 730 | 17 | 2.4 |
| Br3-A-500MPa | 1 | 114 | 2 | 1.7 |
© 2019 by the authors. Licensee MDPI, Basel, Switzerland. This article is an open access article distributed under the terms and conditions of the Creative Commons Attribution (CC BY) license (http://creativecommons.org/licenses/by/4.0/).
Share and Cite
Wenk, H.-R.; Yu, R.; Vogel, S.; Vasin, R. Preferred Orientation of Quartz in Metamorphic Rocks from the Bergell Alps. Minerals 2019, 9, 277. https://doi.org/10.3390/min9050277
Wenk H-R, Yu R, Vogel S, Vasin R. Preferred Orientation of Quartz in Metamorphic Rocks from the Bergell Alps. Minerals. 2019; 9(5):277. https://doi.org/10.3390/min9050277
Chicago/Turabian StyleWenk, Hans-Rudolf, Rong Yu, Sven Vogel, and Roman Vasin. 2019. "Preferred Orientation of Quartz in Metamorphic Rocks from the Bergell Alps" Minerals 9, no. 5: 277. https://doi.org/10.3390/min9050277
APA StyleWenk, H.-R., Yu, R., Vogel, S., & Vasin, R. (2019). Preferred Orientation of Quartz in Metamorphic Rocks from the Bergell Alps. Minerals, 9(5), 277. https://doi.org/10.3390/min9050277