Article

Influence of Impurity Dissolution on Surface Properties and NH3-SCR Catalytic Activity of Rare Earth Concentrate

1
School of Energy and Environment, Inner Mongolia University of Science and Technology, Baotou 014010, China
2
State Key Laboratory of Multi-metal Resources Comprehensive Utilization, Baiyun Obo Mine, Inner Mongolia Autonomous Region, Baotou 014010, China
*
Authors to whom correspondence should be addressed.
Minerals 2019, 9(4), 246; https://doi.org/10.3390/min9040246
Submission received: 4 April 2019 / Revised: 17 April 2019 / Accepted: 18 April 2019 / Published: 22 April 2019
(This article belongs to the Section Mineral Processing and Extractive Metallurgy)

Abstract

:
Impurity removal and modification of rare earth concentrate powder were conducted by roasting weak acid-weak alkali leaching to obtain the active components of denitrification catalysts. NH3 selective catalytic reduction catalyst samples were prepared by mixing and kneading with pseudo-γ-Al2O3 boehmite as carrier. The results showed that the Ce7O12 content in the active component samples increased and dispersed more evenly. The grain size of the samples was refined, the specific surface area increased, and the active sites exposed more. Ce coexists in the form of Ce3+ and Ce4+. Fe coexists in the form of Fe3+ and Fe2+, but Fe3+ is abundant. Some Ce, La, Nd, Pr, Fe, Mn, and other components formed solid melts during preparation, which increased the synergistic catalytic effect. The denitrification efficiency of the catalyst sample was 92.8% under the conditions of reaction temperature 400 °C, NO content was 600 ppm, NH3/NO ratio was 1.5, and O2 concentration was 4%.

1. Introduction

Rare earth metal oxides are common active catalyst components [1,2,3]. The low-temperature activity and anti-toxicity of transition metal oxides such as iron and manganese are hotspots in the research field of novel selective catalytic reduction (SCR) catalysts [4,5,6,7,8,9]. It has been found that composite oxides such as Cr/Zr/Ce, W/Ce, Mn/Zr/Ce, and V/Ti/Ce have good SCR catalytic effects because of their rich acidic sites and different valence states [10,11,12,13]. The addition of Ce could increase the oxygen storage capacity and surface acidity of the catalyst and promote the adsorption and activation of NH3 on the catalyst surface [14].
Research on the preparation of catalysts from natural minerals by modification is receiving widespread attention [15,16].
The Baiyun Obo rare earth concentrate is rich in light rare earth elements such as La, Ce, Pr, and Nd (La2O3 26%, Ce2O3 50%, Nd2O3 16%, and Pr2O3 5%) and has a small amount of transition metal elements [17,18], which are necessary for many Ce-based NH3-SCR composite oxide catalysts. However, its low-temperature catalytic activity is relatively weak, with the actual NH3-SCR denitration rate is only 55–70% at 150–250 °C [19,20,21]. From the analysis of the composition-structure-property relationship of materials, natural rare earth concentrates have the material composition necessary for the preparation of rare earth metal oxide catalysts. However, because of the coexistence of various elements and the complex embedded structure [22,23], it does not have the necessary pore structure and surface properties of catalysts. Thus, rare earth concentrates exhibit weaker catalytic properties. Surface properties and pore structure are the main factors affecting the activity of NH3-SCR in rare earth concentrates. In this study, impurities such as SiO2 and CaO in rare earth concentrates are regarded as the template agent in the hard template method synthesis of porous media. The liquid phase system is designed to dissolve it to form a complex pore structure. On this basis, the rare earth and transition metal oxides are exposed to the surface of the pores. Through loading of the modified rare earth concentrate onto appropriate carriers, the dispersibility, active sites, redox, and selective adsorption characteristics of the surface-active components would be enhanced. The denitration reaction activation energy and denitration reaction temperature would be lowered, thus improving the efficiency of low-temperature NH3-SCR denitration reactions [24,25]. This effect has important theoretical significance and practical value in the research and development of new low-temperature SCR catalysts and will also provide new ideas and support for the high value-added use of Baiyun Obo rare earth concentrate.

2. Experiment

2.1. Materials

The rare earth concentrate obtained through multistage magnetic flotation separations of Bayan Obo ore was used as the raw material in the current study. The composition of the rare earth concentrate is shown in Table 1. An EDX1800E X-ray fluorescence spectrometer (Skyray Instrument Inc., Stoughton, MA, USA) was used. The test environment was a vacuum, the working voltage was 60 kV, and the working current was 60 mA. The mineral phases included mainly bastnaesite, monazite, and fluorite, and the rare earth elements were distributed among the various minerals. The chemical reagents used herein are all chemically pure.

2.2. Sample Preparation

A certain amount of rare earth concentrate was crushed, ground, sieved, dried, and then used with particle sizes of 100–200 mesh, 200–300 mesh, and 300–400 mesh. In this article, the rare earth concentrate treated with alkali (NaHCO3) was calcined, acid (oxalic acid) was calcined, and then the surface properties of the modified rare earth concentrate were studied.
The modification treatment of rare earth concentrate included alkali treatment, acid treatment, and alkali–acid co-treatment. The preparation and test plan of the obtained samples are shown in Table 2. The compositions of the modified rare earth concentrates are listed in Table 1.
For preparation of Samples 3 and 4, a certain mass of sodium bicarbonate or oxalic acid was added to the beaker, and then 50 mL deionized water was added. After stirring with a magnetic agitator, a uniform solution formed at room temperature. The content of the beaker was then dried at 110 °C. It was then calcined at 500 °C for 4 h and washed with water to remove the product. The mineral material on the filter paper was dried to produce a solid sample. For sample 5, the solid sample treated with sodium hydrogen carbonate in the acid treatment process was further treated with oxalic acid to obtain a co-treated sample. Reaction equations for rare earth concentrate alkali treatment (sodium bicarbonate roasting method) are as follows:
2NaHCO3 = Na2CO3 + H2O + CO2
3REFCO3 + H2O = RE2O3 + REOF + 2HF + 3CO2
REFCO3 = REOF +CO2
2REOF + Na2CO3 = RE2O3 + 2NaF + CO2
2CeFCO3 + 1/2O2 = Ce2O3F2 + 2CO2
Ce2O3F2 + Na2CO3 = 2CeO2 + CO2 + 2NaF
Reaction equations for the rare earth concentrate oxalic acid roasting method are as follows:
2Ca5F(PO4)3 + 10C2H2O4 = 10CaC2O4 + 6H3PO4 + 2HF
2Ca5F(PO4)3 + 7C2H2O4 = 7CaC2O4 + 3Ca(H2PO4)2 + 2HF
The minerals of the fluorocarbon bismuth concentrate are basically independent, in the form of monomer particles. A small amount of fluorocarbon strontium ore forms an inclusion with lanthanum rutile or quartz, and a small amount of fluorocarbon strontium ore forms a continuous connection with quartz. Rare earth concentrates increase the specific surface area after different treatments. The increase in specific surface area of alkali roasting is caused mainly by the decomposition of minerals and the formation of cracks. The acid treatment increases the specific surface area because the surface is eroded, and voids and depressions form on the surface. The acid–base treated sample is calcined by alkali addition on the basis of acid–base corrosion; that is, erosion is formed on the surface, and the mineral is decomposed to form a crack, so that more active components are exposed on the mineral surface.

2.3. Analyses

2.3.1. Sample Analysis

The test equipment included an X-ray diffractometer (PANalytical B.V., Almelo, The Netherlands), Sigma-500 field emission scanning electron microscope (Zeiss, Jena, Germany), STA449C thermal analyzer (Netzsch, Oberkochen, Germany), 3H-2000PS1 automated specific surface and aperture analyzer (BeiShiDe Instrument Technology, Beijing, China), PCA-1200 temperature programmed chemical adsorption instrument (Builder, Beijing, China), VERTEX70 Fourier in-situ infrared spectrometer (Bruker, Billerica, MA, USA), and Thermo ESCALAB 250Xi X-ray photoelectron spectrometer (Thermo Fisher Scientific, Waltham, MA, USA).

2.3.2. Catalysis Activity Testing

For each test, a 1-g sample was placed on the reaction bed. The composition of the flue gas was monitored by the DX4000 type Fourier infrared spectrum flue gas analyzer (Gasmet, Helsinki, Finland).
The testing instrument consisted of a vertical reaction tube furnace, Fourier infrared spectrum flue gas analyzer, and computer data acquisition system, with available online measurement of flue gas composition. A reaction bed was used to support the catalyst. The experimental principle of its activity is:
4NO + 4NH3 + O2 = 4N2 + 6H2O
2NO2 + 4NH3 + O2 = 3N2 + 6H2O
6NO + 4NH3 = 5N2 + 6H2O
6NO2 + 8NH3 = 7N2 + 12H2O
For each test, a 1-g sample was placed on the heated reaction bed in the quartz tube. After testing, the furnace was heated at 10 °C/min to the reaction temperature, and the reaction gases bubbled for 30 min until the test temperature and the gas concentration became stable. The denitration efficiency of the catalyst was calculated according to Formula (13):
η   = ( N O ) in ( N O ) out ( N O ) out × 100 %
where (NO)in is the initial NO concentration and (NO)out is the NO concentration during the catalysis reaction at different reaction temperatures.

3. Results and Discussion

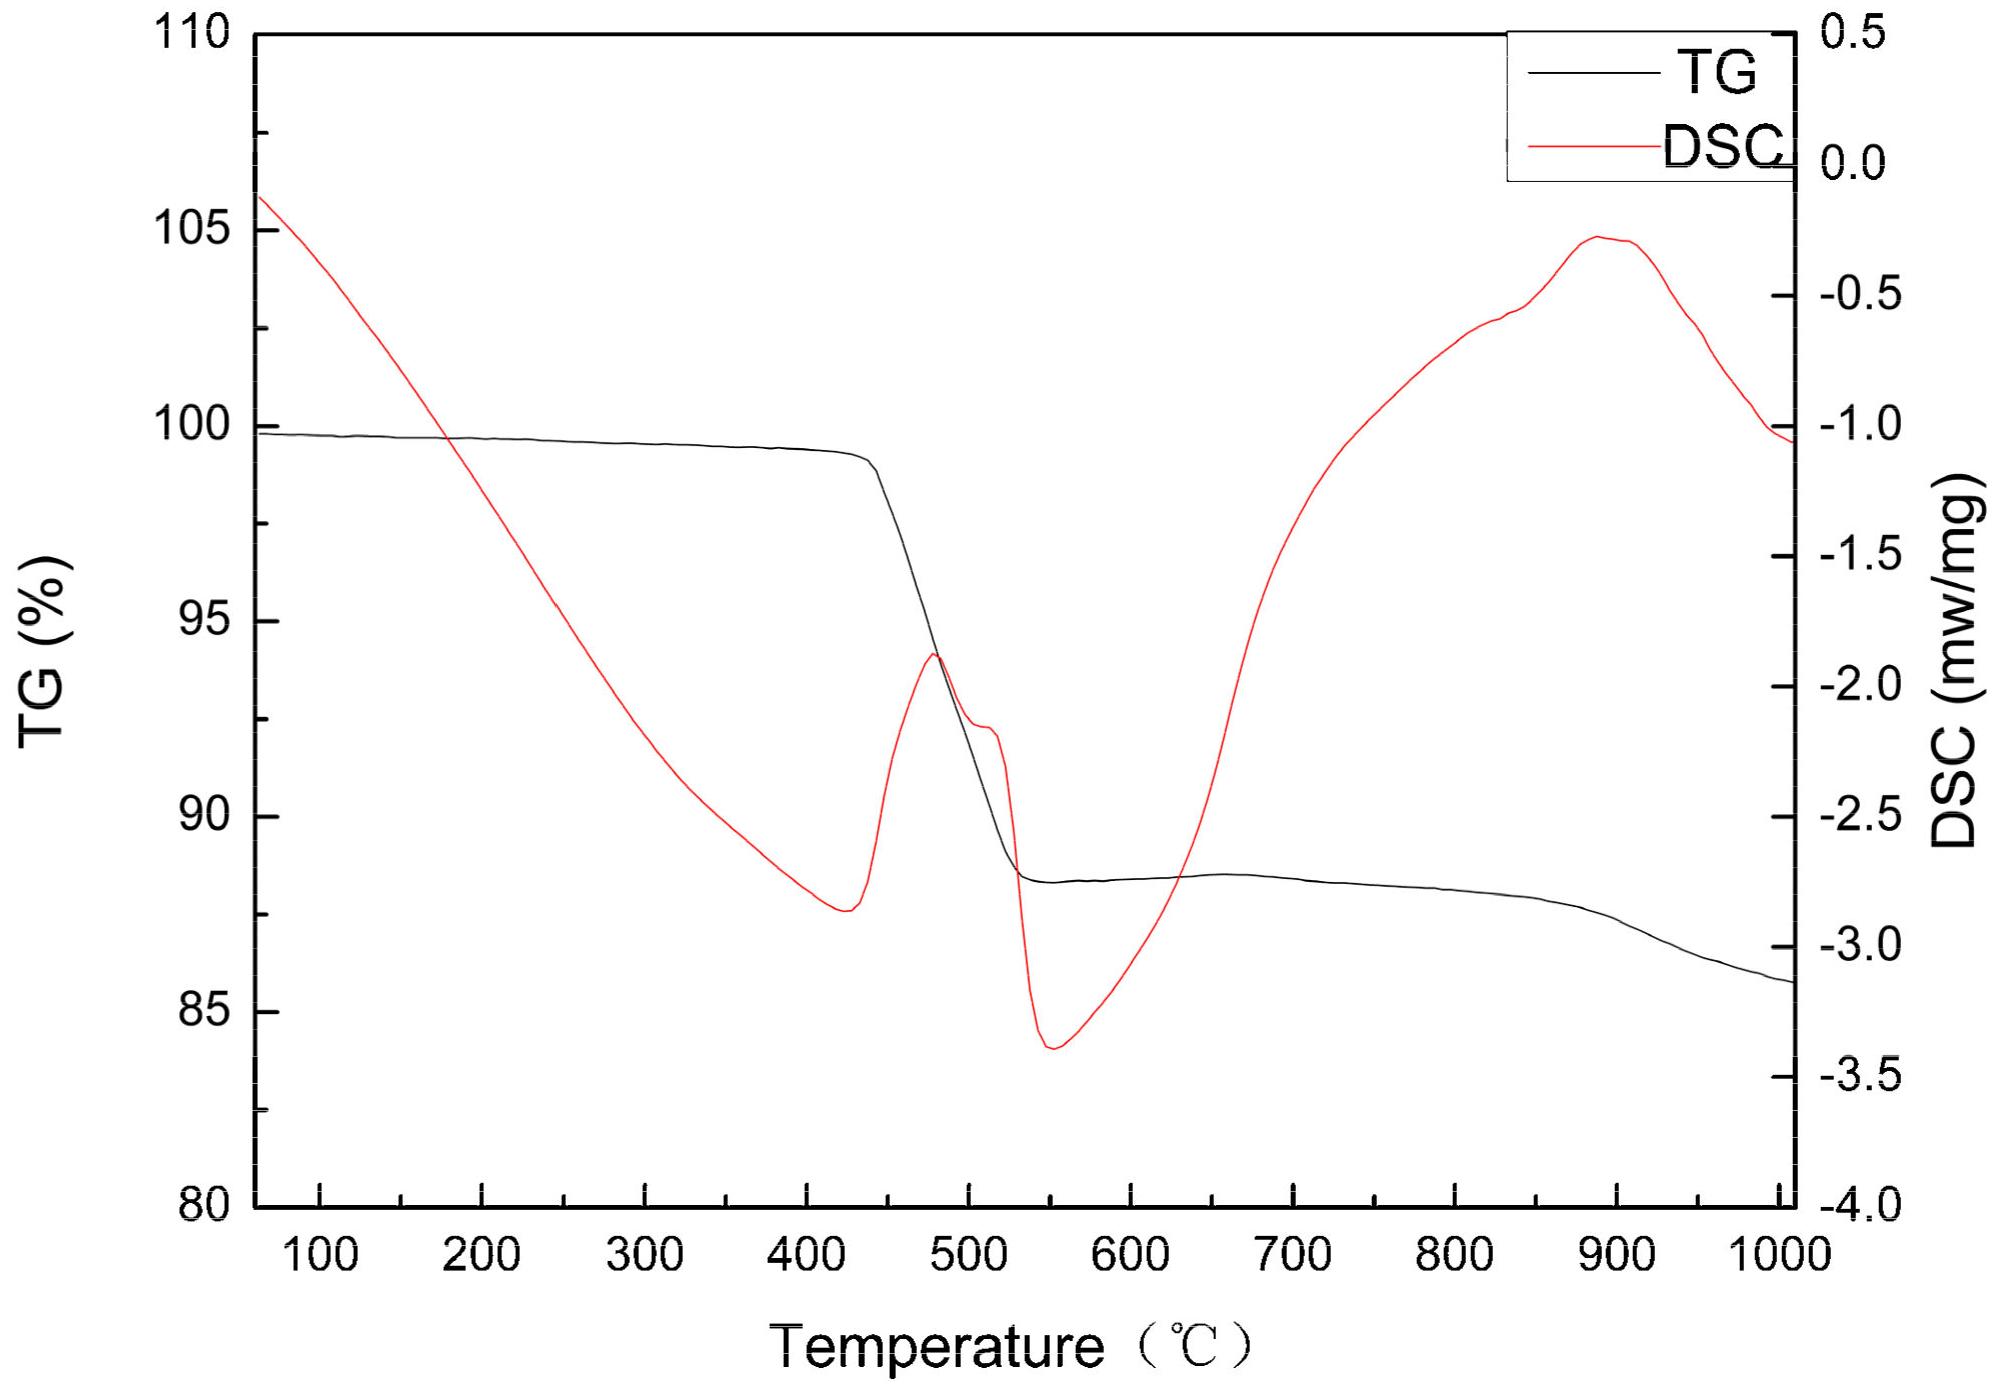
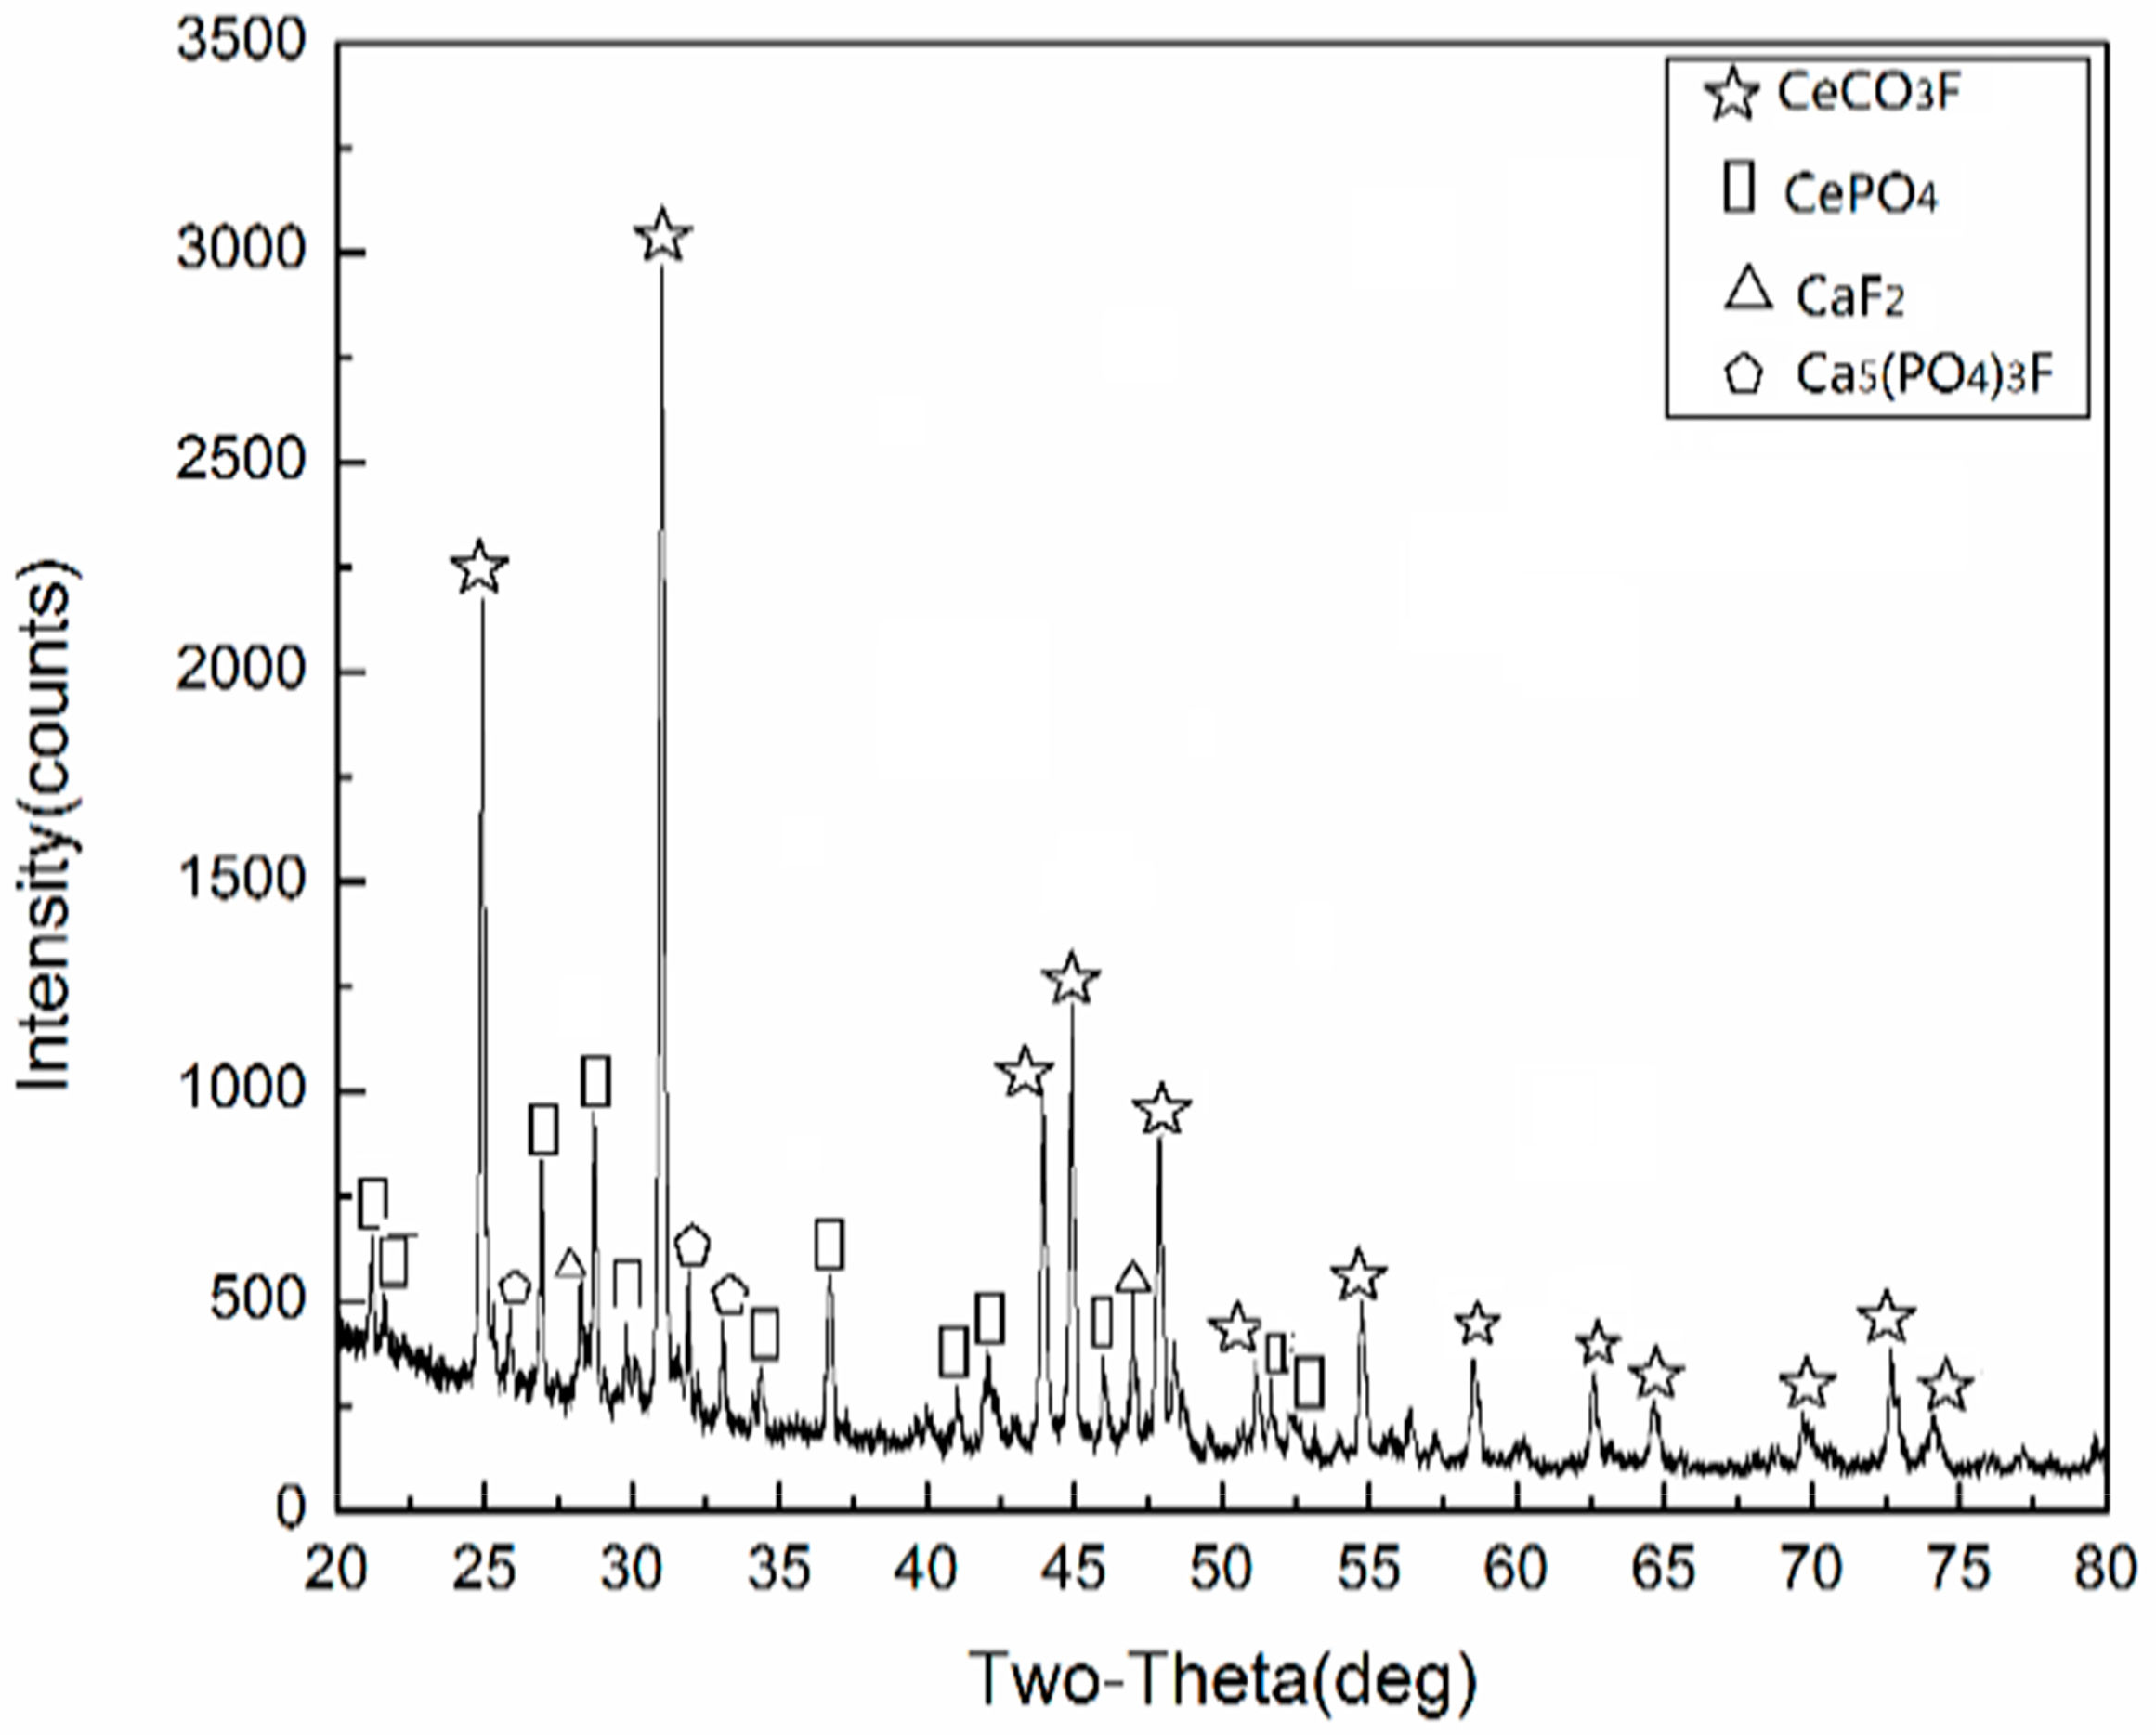
3.1. Characterization and Thermogravimetric Analysis of Rare Earth Concentrate

It can be seen in Table 1 that although the Baotou rare earth concentrate has a high content of rare earth elements, there are many non-rare earth impurities and complex components. Our research group has performed thermogravimetric (TG) analysis (Figure 1) and X-ray powder diffraction (XRD) analysis (Figure 2 and Figure 3) of the raw rare earth concentrate and XRD analysis of rare earth ore concentrate after modification and calcination. From the XRD characterizations, the presence states of the main elements and the ore phase structures can be observed.
Figure 1 shows the TG differential scanning calorimetry (DSC) curve of the rare earth concentrate. Because of the nearly complete desorption of adsorbed gas, the TG curve remained stable up to 400 °C. Within the range of 400–550 °C, a broad endothermic peak appears, with obvious weight loss. It is attributed to thermal decomposition of the rare earth concentrate. Within the range of 550–850 °C, the TG curve remained stable, indicating that the ore material itself was in an endothermic state. Within the range of 850–1000 °C, the TG curve shows continuous weight loss, with a broad endothermic peak in the DSC curve. This may be attributed to the decomposition of carbonate materials during roasting and local melting caused by sintering.
As shown in Figure 2 and Figure 3, the main components of the rare earth concentrate are bastnaesite and monazite. For the alkali-treated rare earth concentrate, a new material (NaF) formed. Compared with direct roasted rare earth concentrate, the increase in peak intensity of the Ce7O12 phase indicates that the addition of alkali could promote the conversion of more bastnaesite to Ce7O12. Further washing could remove NaF and residual Na2CO3 produced during defluorination and improve the purity of Ce7O12. After further treatment with oxalic acid, the peak height of the Ce7O12 crystal phase decreases and the peak width becomes larger. Meanwhile, the peak of the calcium fluorophosphate crystal phase disappears. The combined modification of sodium bicarbonate and oxalic acid is expected to improve the defluorination efficiency and reduce impurities and to increase the content and dispersion of Ce7O12. The active component is exposed while increasing the acidity level, effectively increasing the activity of the catalyst. CePO4 was stable during modification of the mineral materials, and no significant changes appeared in each treatment.

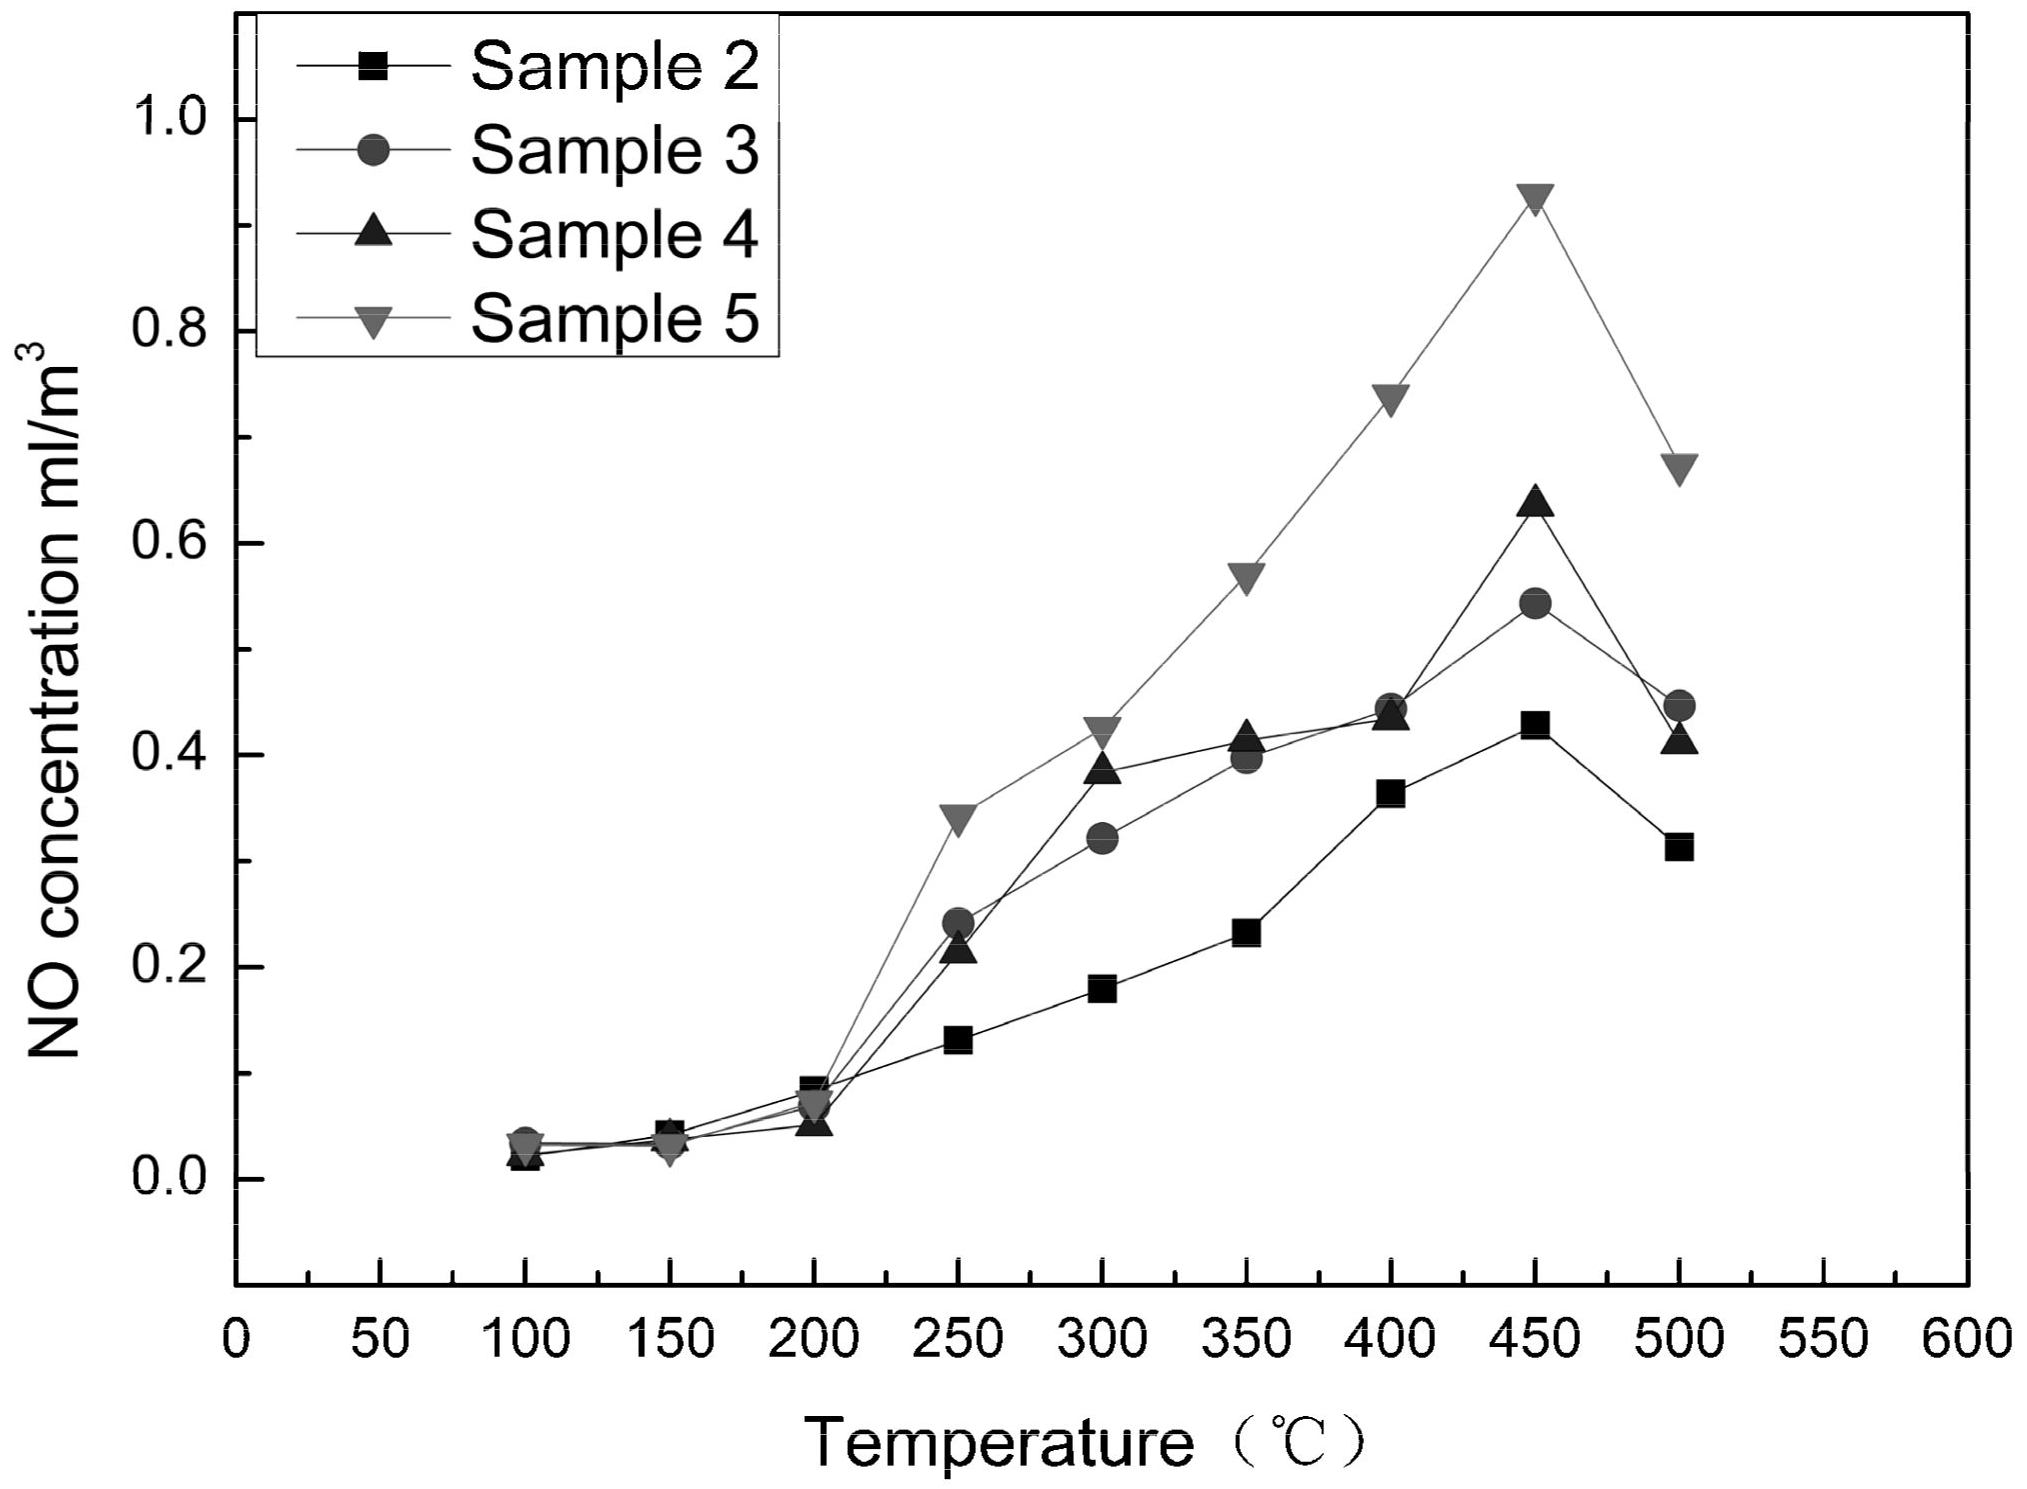
3.2. Catalytic Activity of Rare Earth Concentrate

While the reaction temperature was stable at 400 °C, no change in the NO content occurred for 12 min, and then the NO content began to decrease, approaching a steady state at 42 min. The NH3-SCR performance of the Baiyun Obo rare earth concentrate was tested by the denitrification performance test, which indicated that the unprocessed Baiyun Obo rare earth concentrate had obvious catalytic performance in the SCR denitrification reaction. The denitrification rate increased with the decrease in particle size of the original ore (Figure 4), because the smaller the particle size, the higher its relative dispersion, and the larger the contact area between the active components and NH3 and NO. Therefore, under the catalysis of rare earth ore, the activation energy of NH3 and NO reaction decreases, the frequency factor increases, the reduction capacity of NH3 to NO increases, and the reaction is further promoted. Therefore, a rare earth concentrate with a particle size less than 300 mesh was used in the experiment.

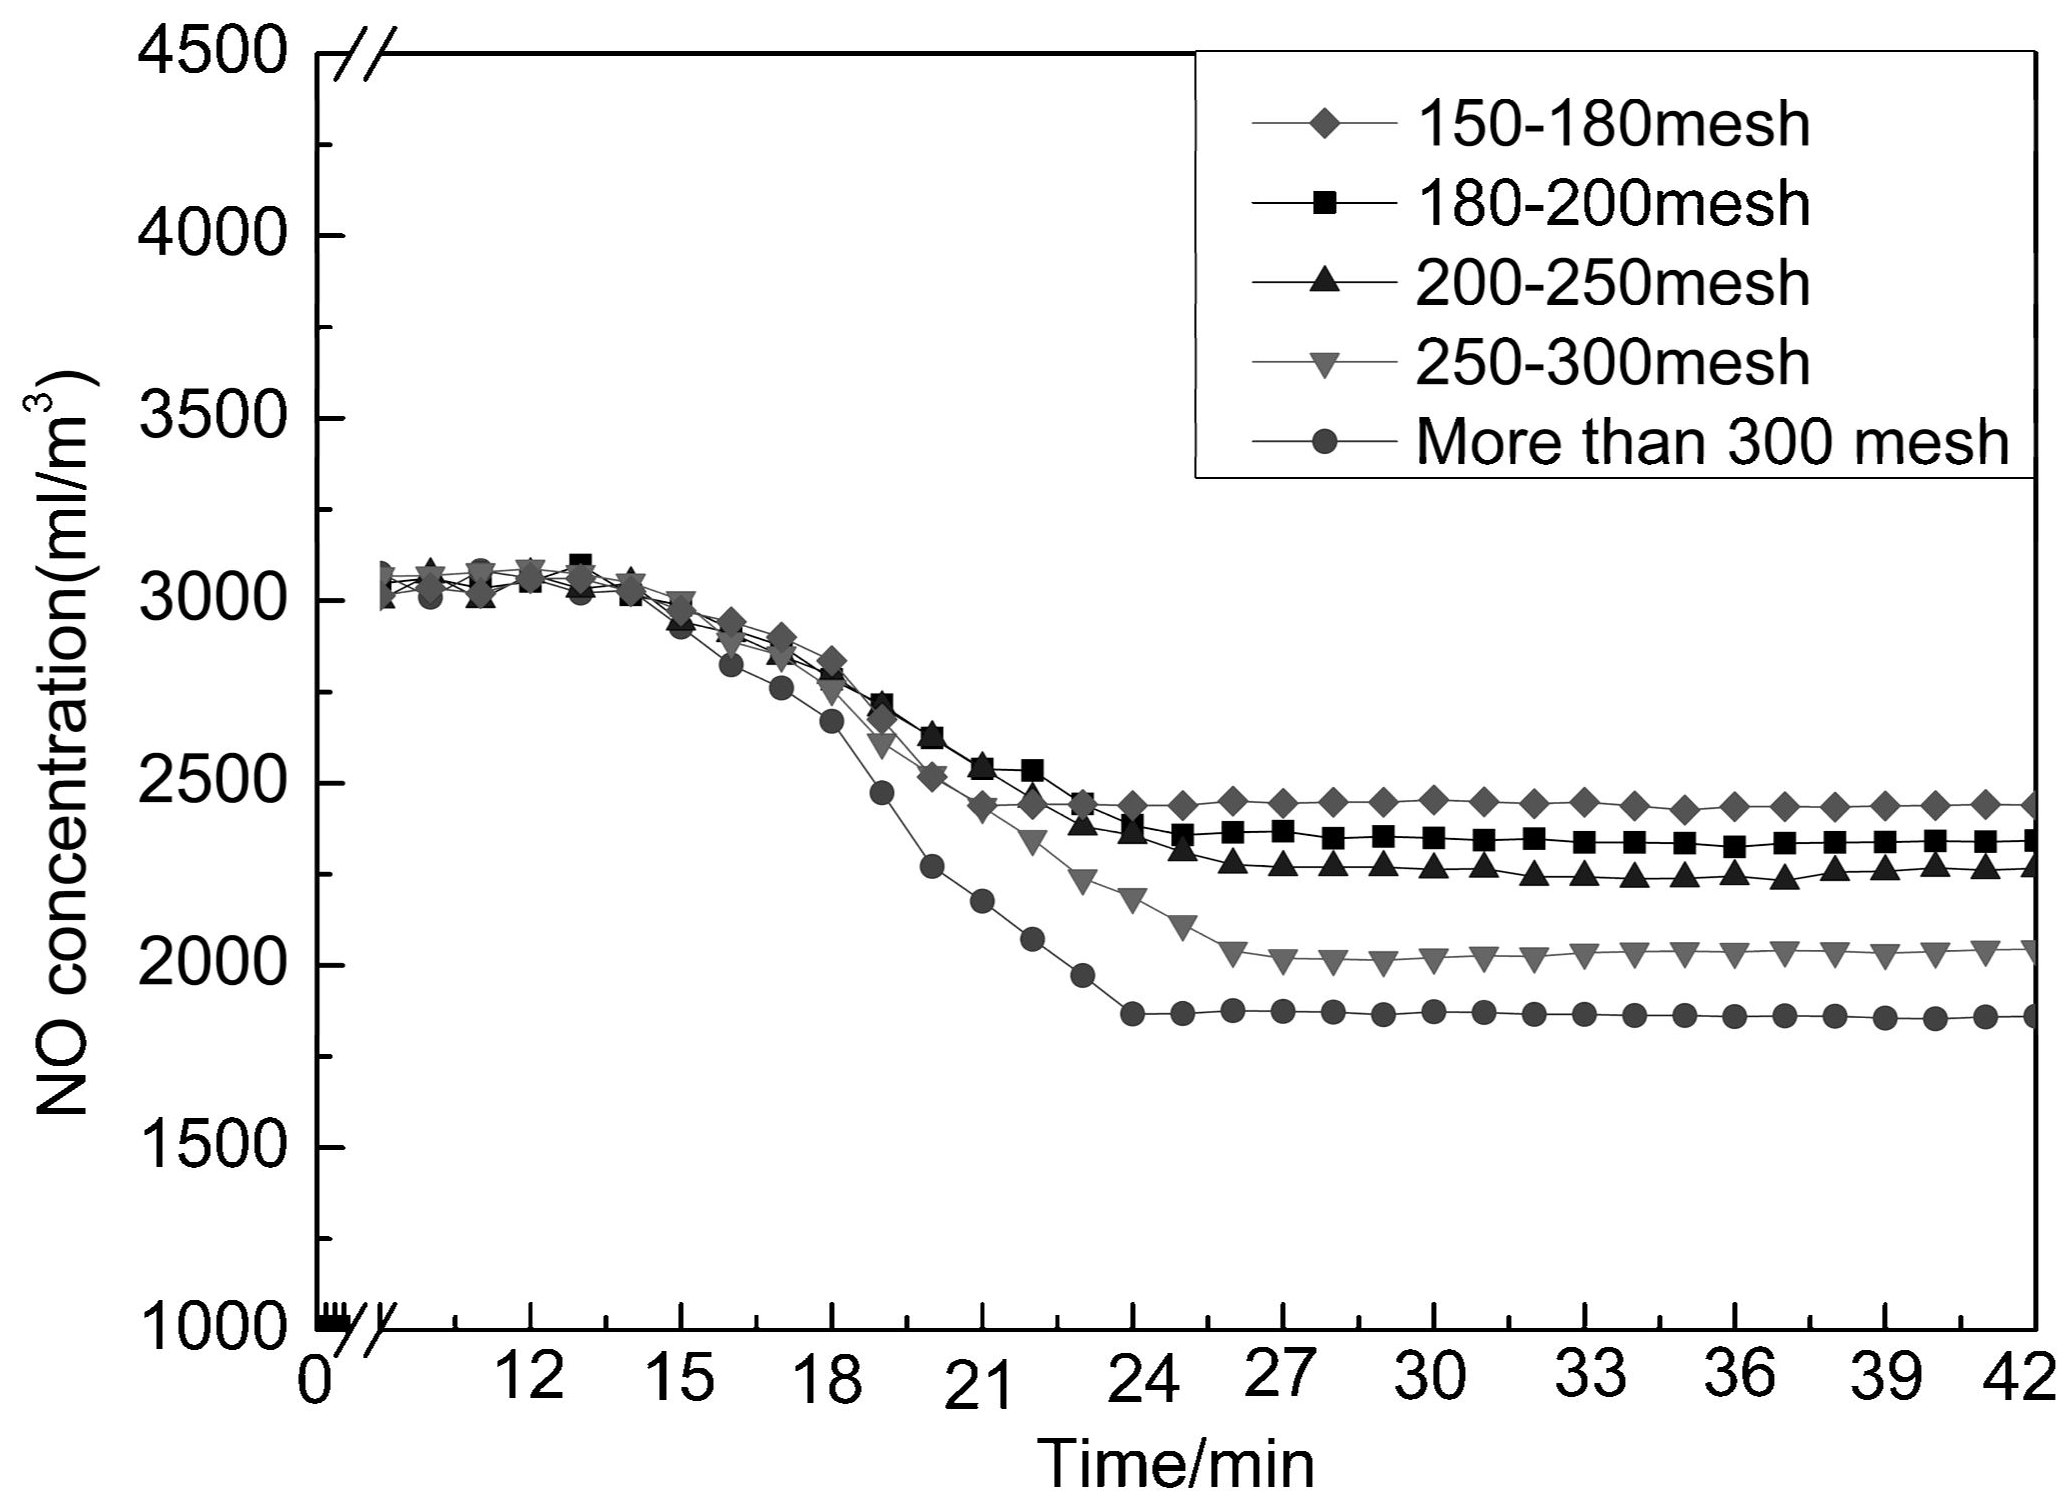
3.3. Activity Test for Different Treatments of Concentrate

As shown in Figure 5, the activity of the overall catalyst increased from 300 °C to 500 °C and decreased slightly after 500 °C. The catalytic activity of the sample after the acid and alkali co-treatment was greatly increased with respect to the sample after direct calcination. The treated sample temperature window and catalytic activity greatly increased at the same time. The specific surface area of element contact during catalytic activity increased by Ce, Fe, and other elements, and calcination was performed so that the effective element is exposed on the surface of the mineral material to form a solid solution, thereby increasing catalytic activity.

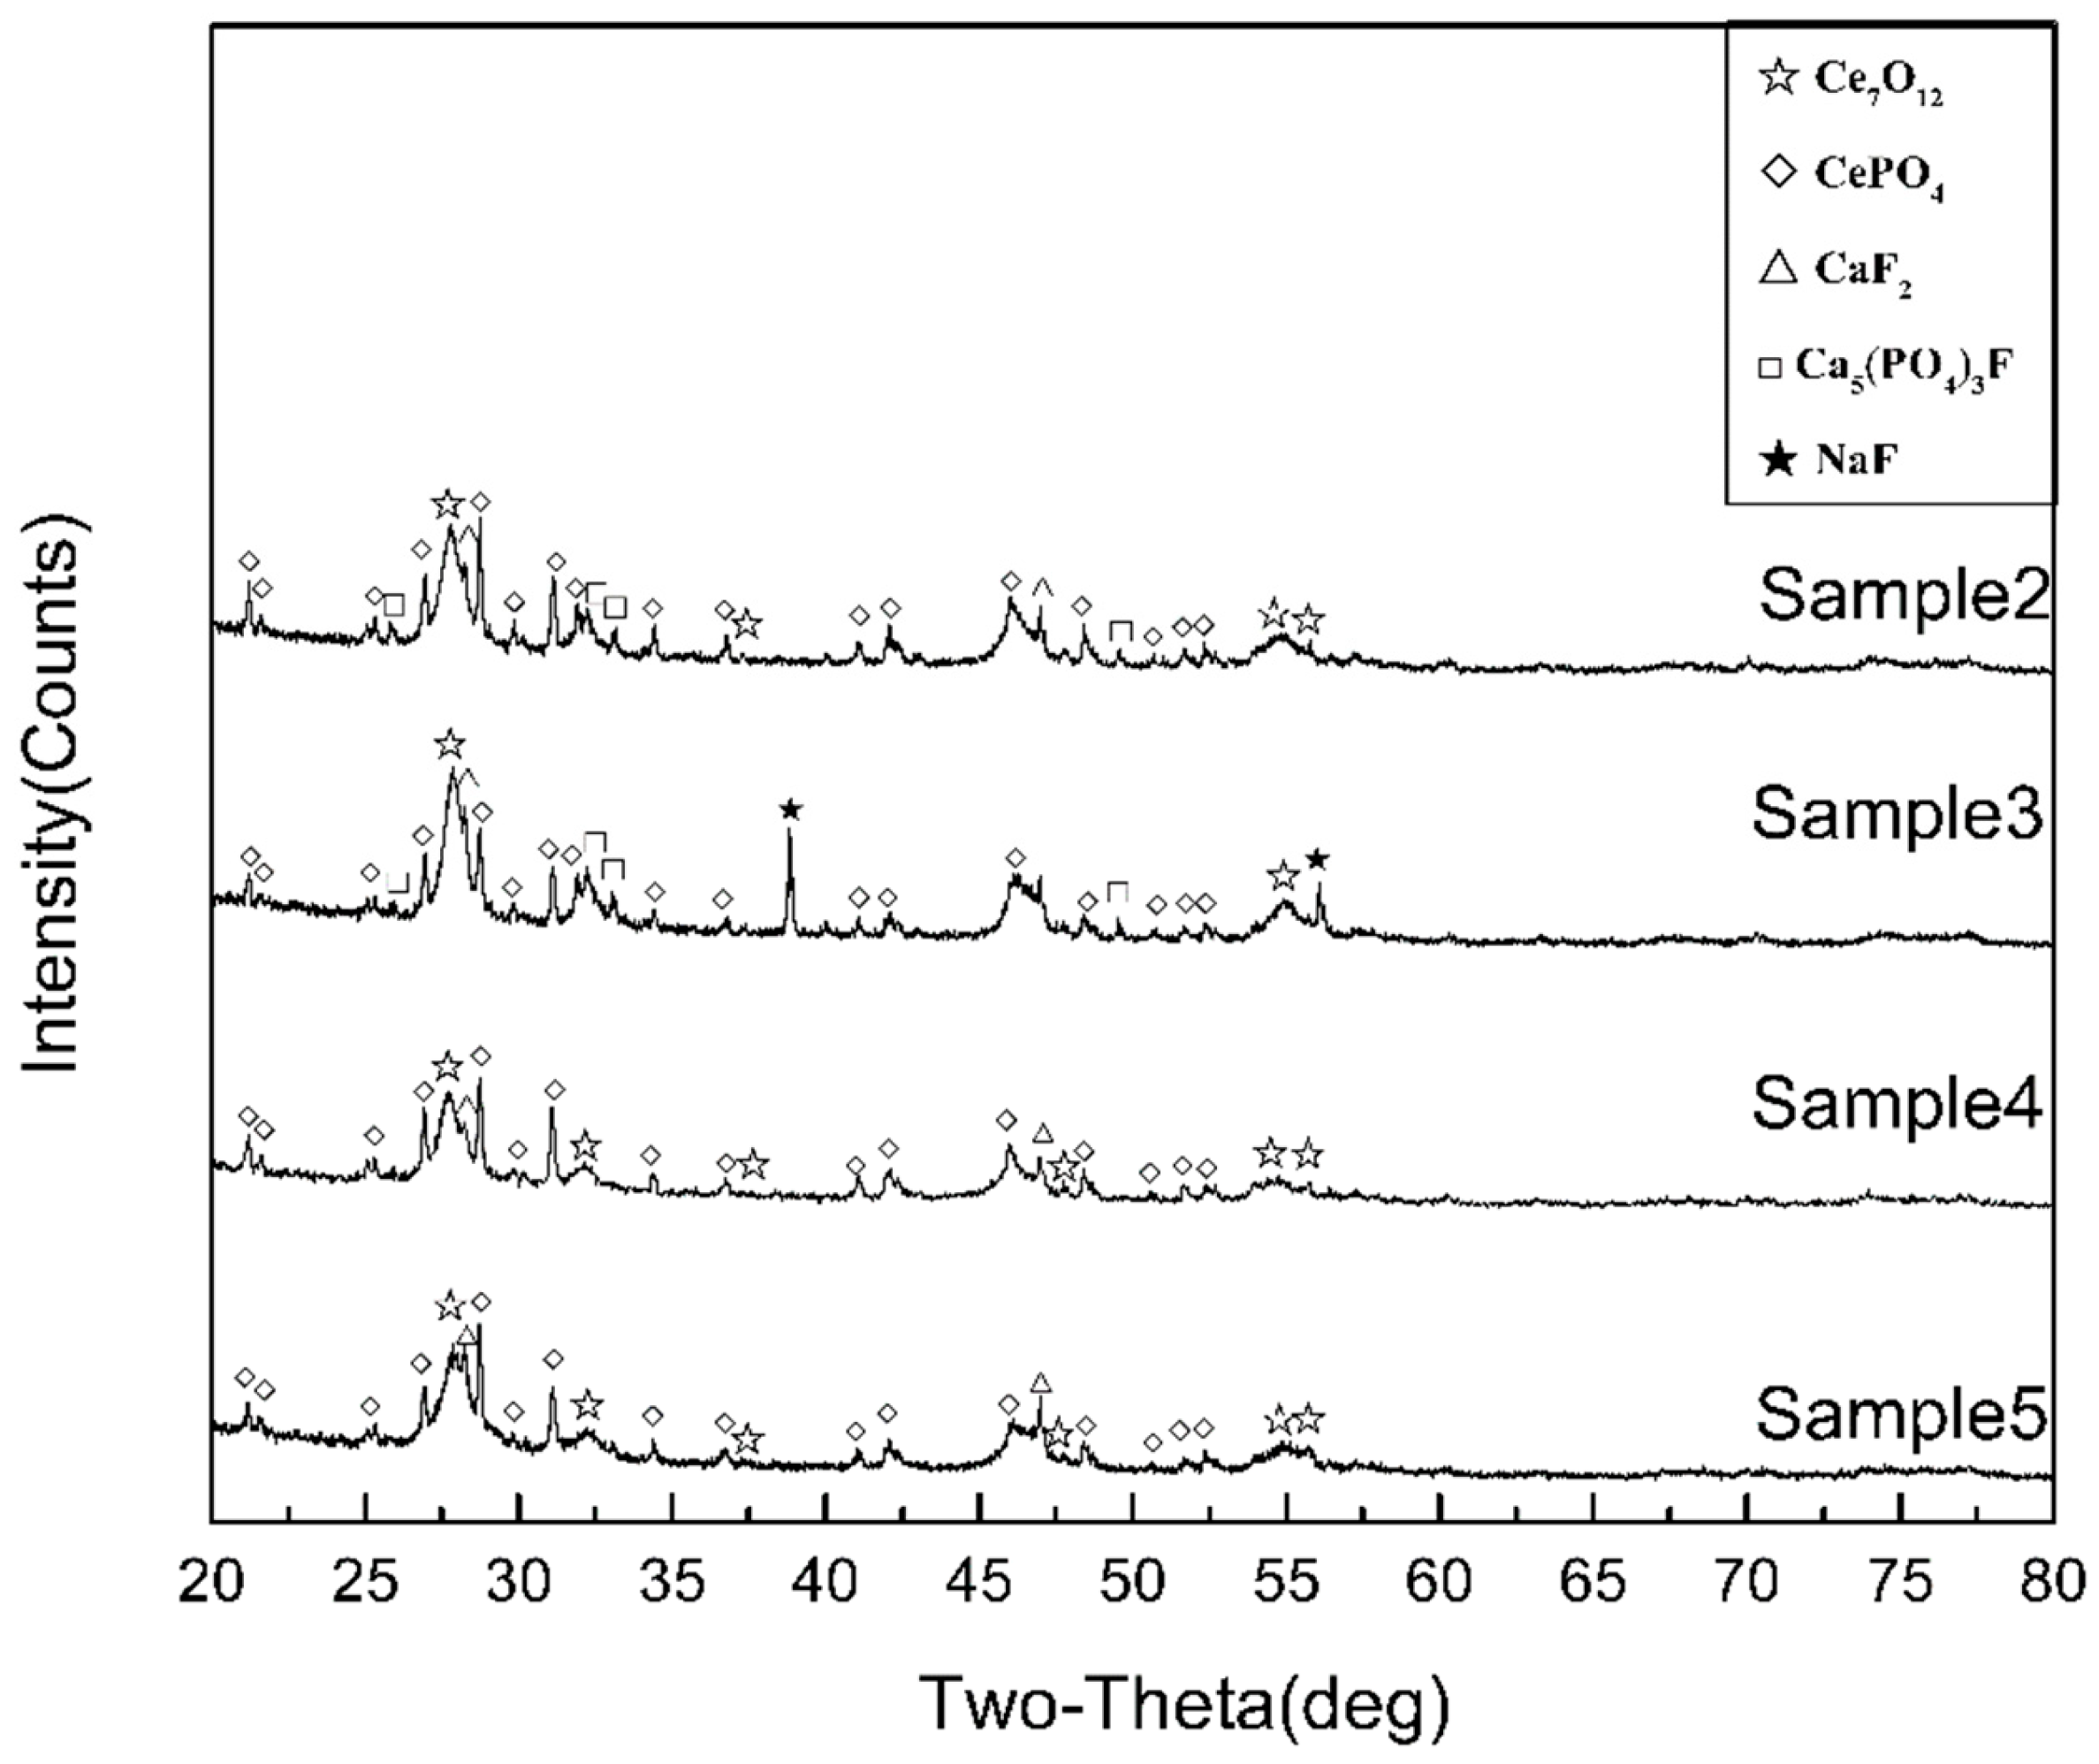
3.4. Properties and Micromorphology of Modified Rare Earth Concentrates

Because Ce in the rare earth concentrate occurs mainly in the form of CeFCO3, which is relatively inert to chemical catalysis, the catalytic activity of Ce is largely inhibited, and the catalytic activity of the rare earth concentrate at low temperature is weak. Therefore, removing and modifying the rare earth concentrates, thus increasing the content of active substances, could provide a material basis to optimize catalytic performance.

3.4.1. Properties of Modified Rare Earth Concentrates

Surface Properties

After the rare earth concentrate was calcined under different conditions, its physical properties were tested. The Brunauer-Emmett-Teller results are shown in Table 3.
It can be seen in Table 3 that the maximum surface area of the rare earth concentrate could be increased to 212.353 m2/g after treatment, which promotes a more uniform distribution of the active components. This could facilitate full contact of the reaction gas with the surface-active adsorption sites of the catalyst, thus increasing the adsorption amount and promoting the SCR reaction. The pore volume was increased to 0.57 mL/g, the average pore size was reduced, and the micropores were reduced to 10.10 nm, forming a larger pore volume and a richer medium pore structure. This will provide more active adsorption sites for reaction gas and facilitate the timely desorption and discharge of reaction products in the pores, thereby promoting an efficient SCR reaction.

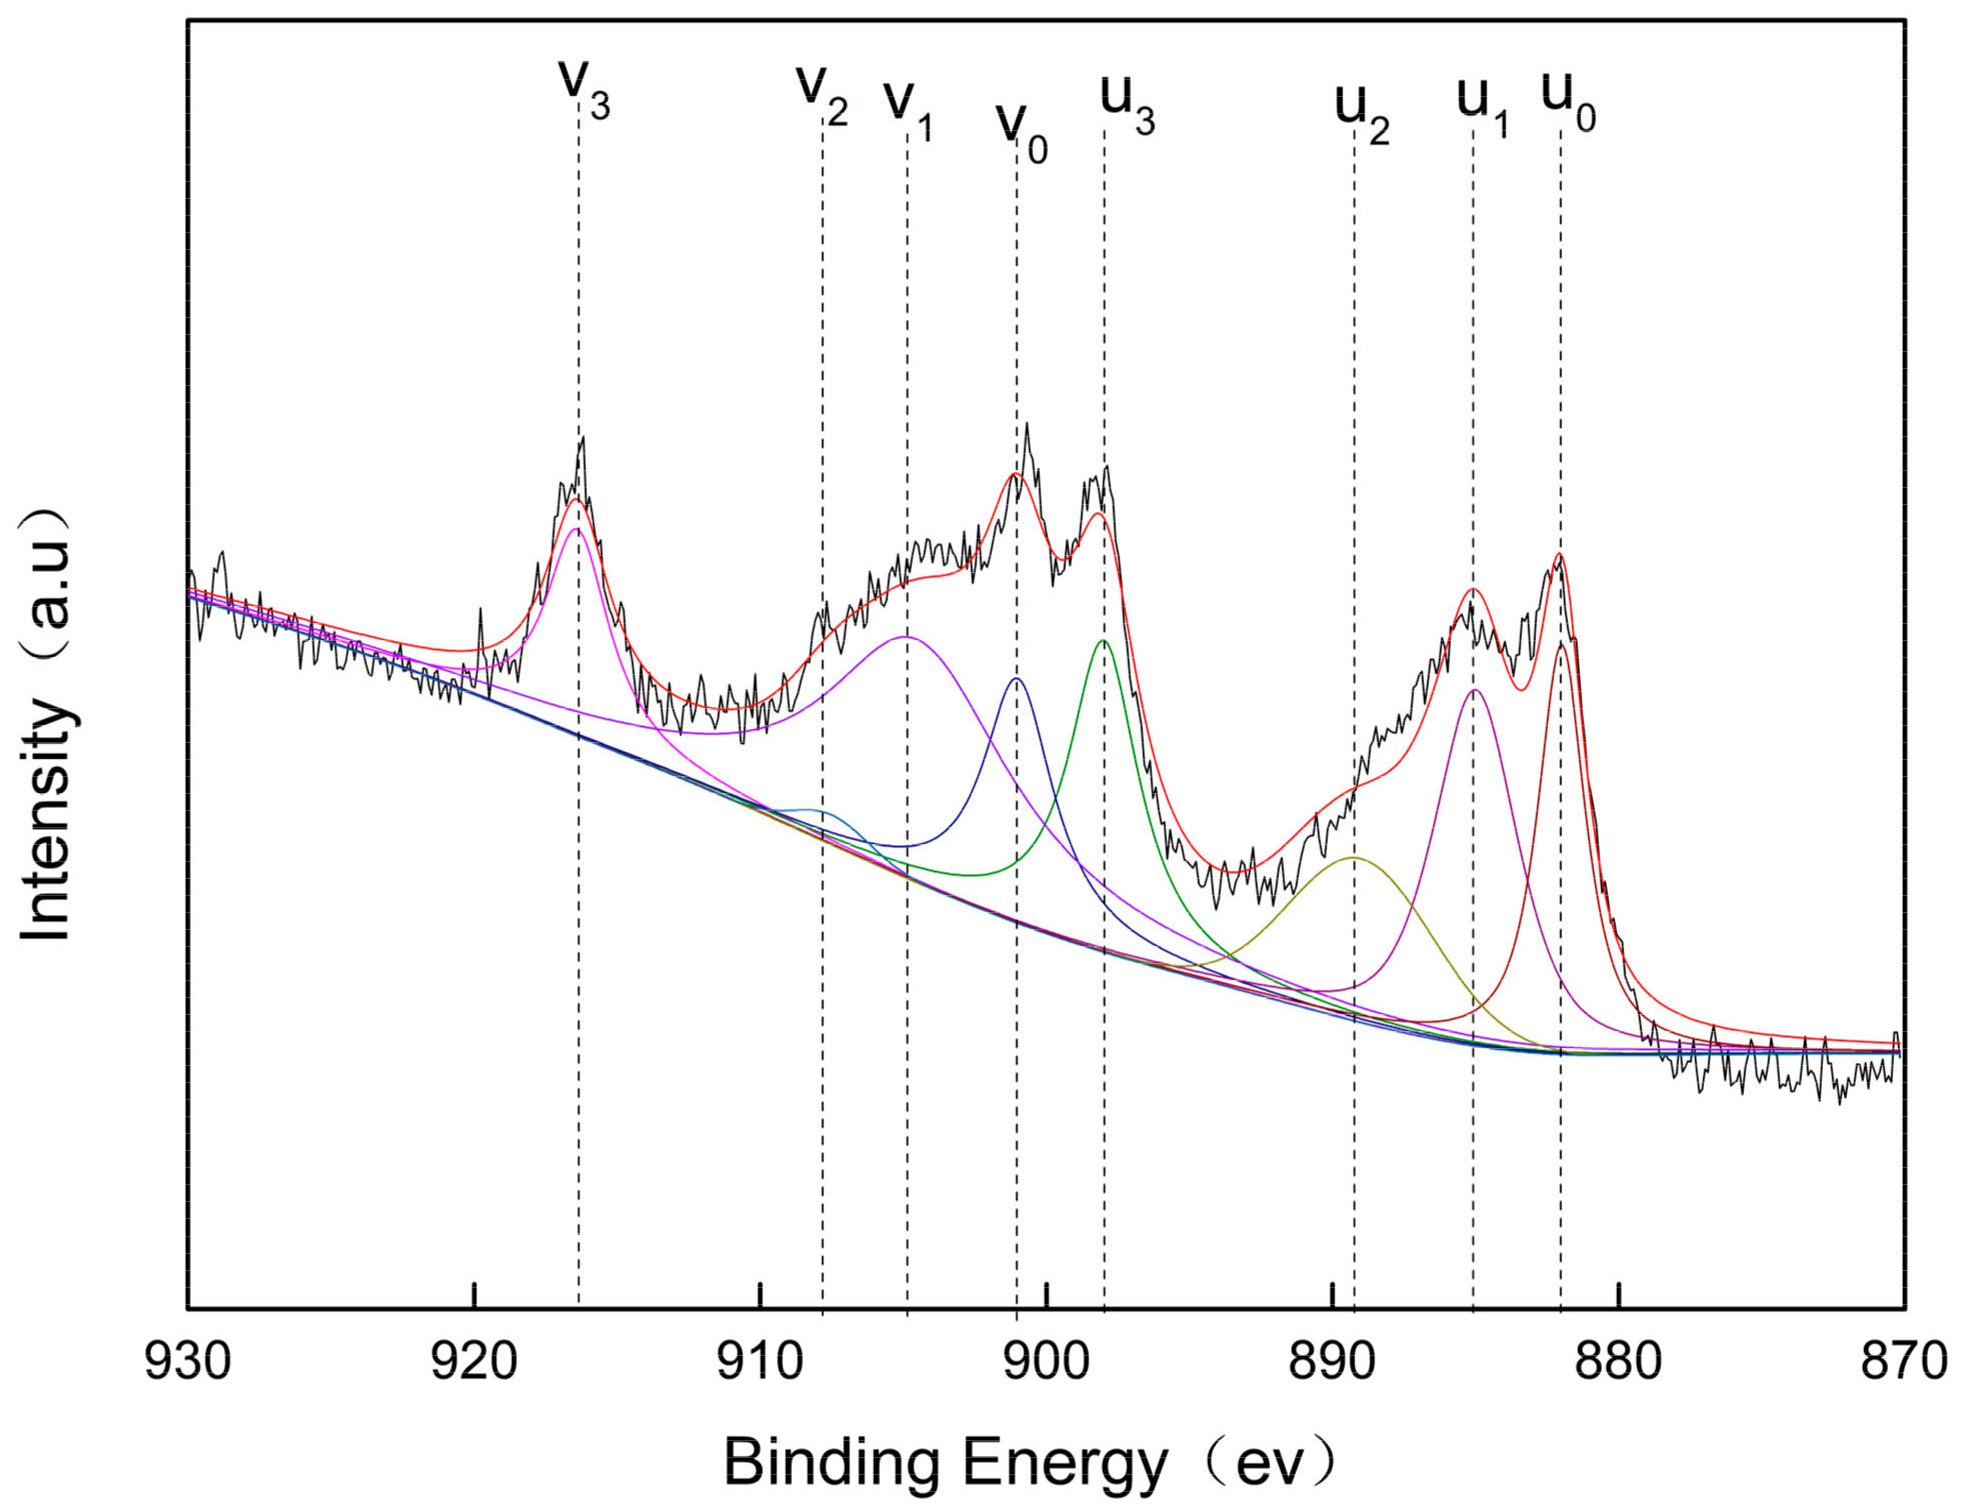
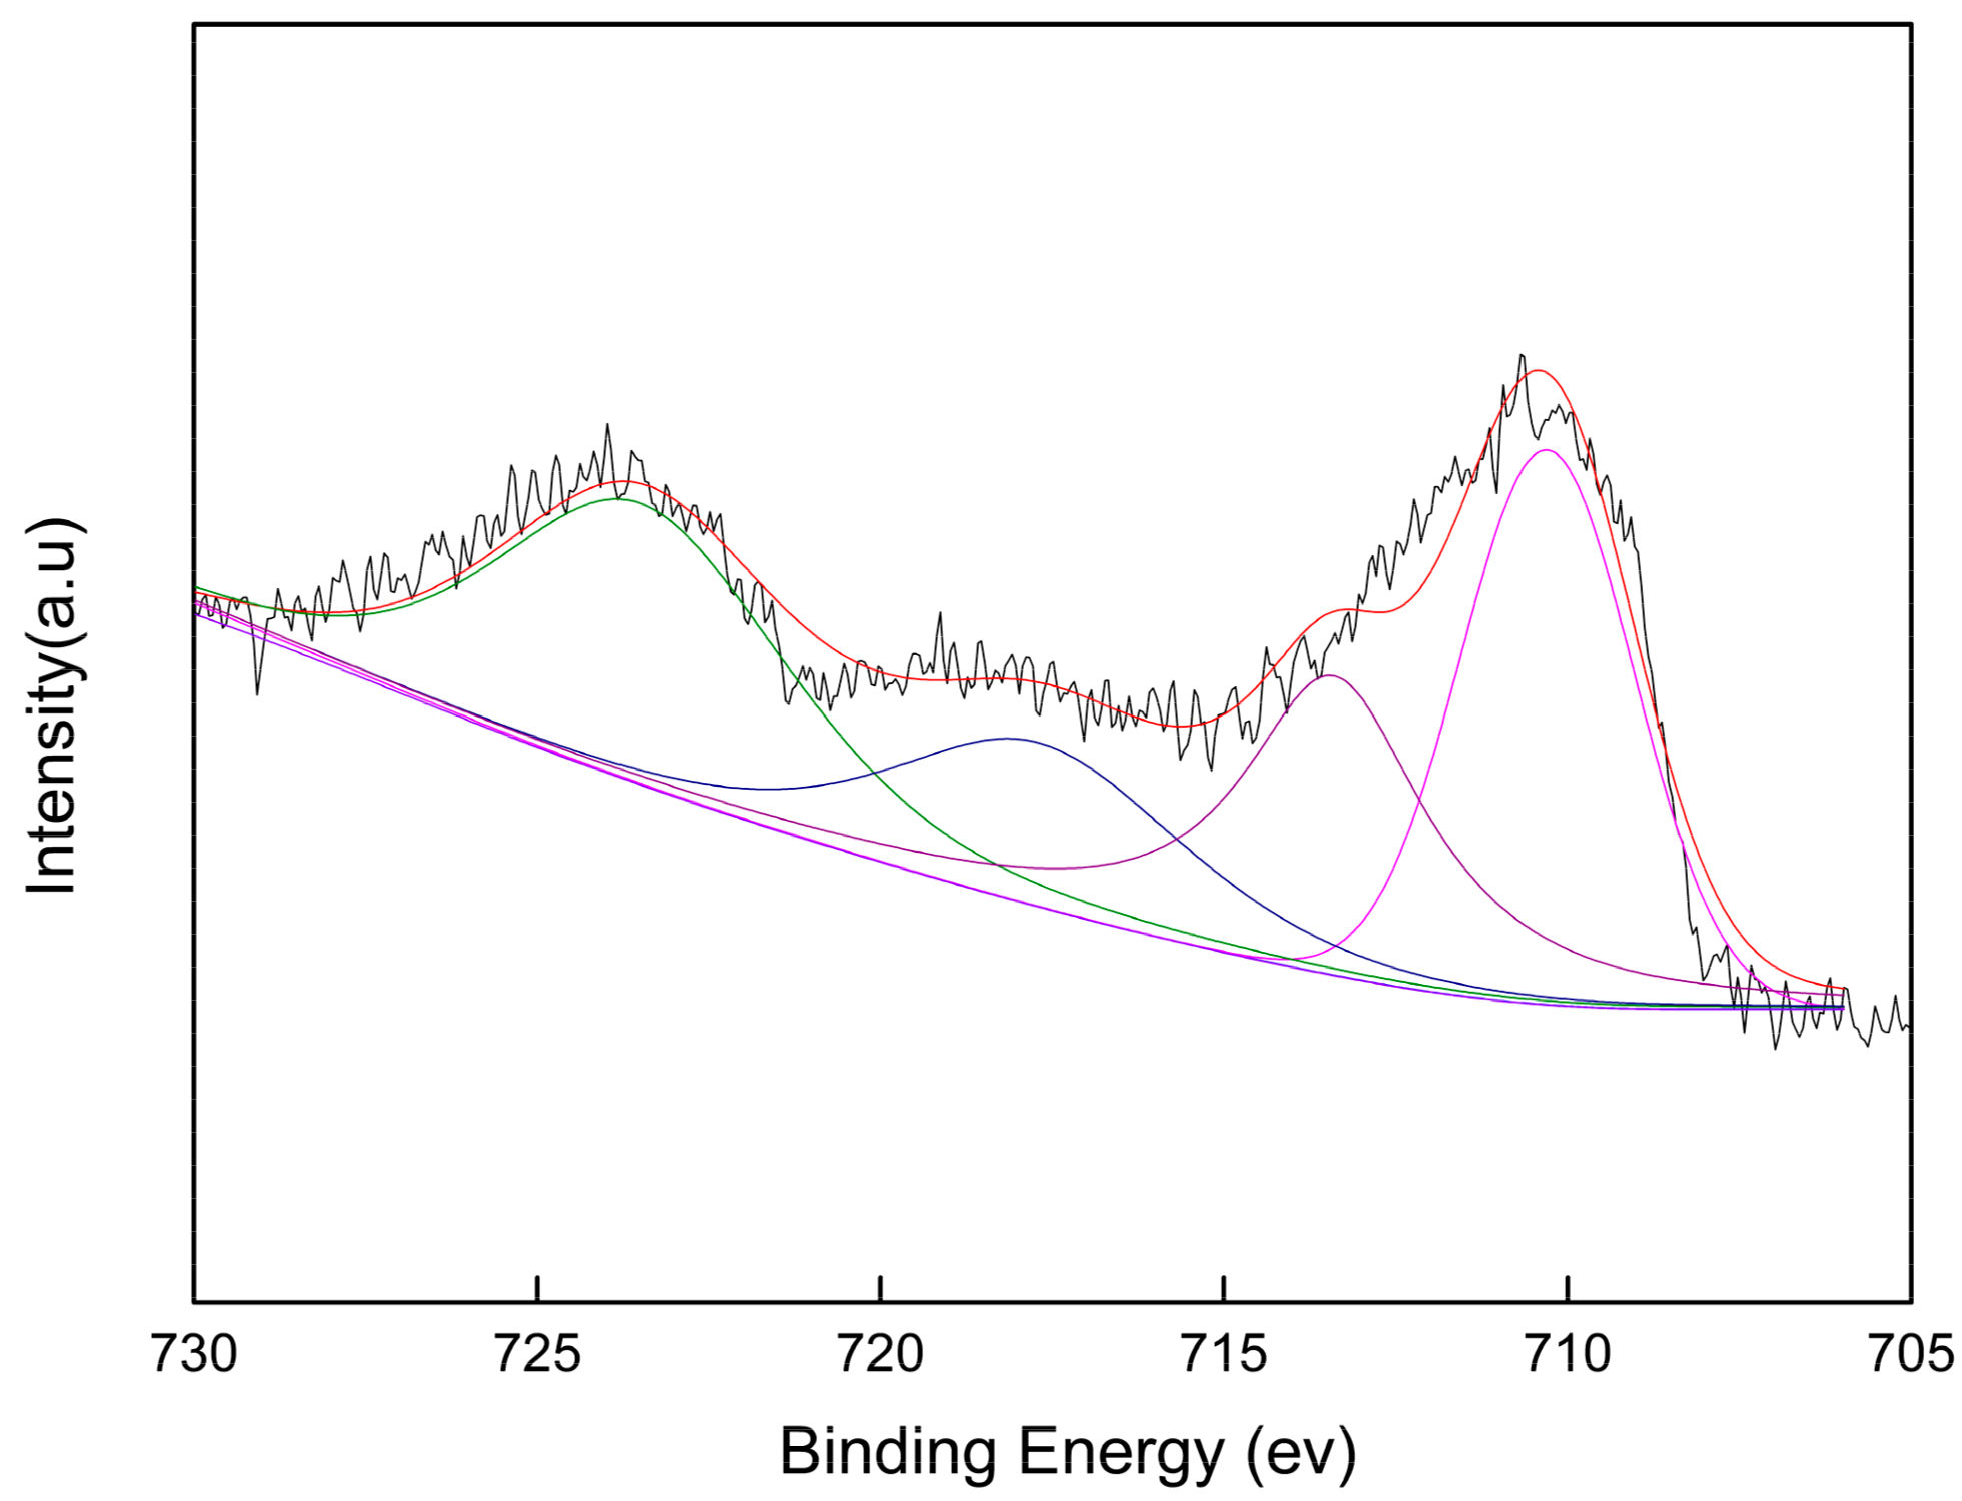
Valences of Ce and Fe Elements

Surface X-ray photoelectron spectroscopy (XPS) analysis of Ce and Fe was performed for sample 5. As shown in Figure 6, the XPS spectrum of the Ce 3d orbital of modified rare earth concentrate sample 5 is complex, showing three peak groups. The two types of Ce 3d 3/2 and Ce 3d 5/2 peaks are labeled with v and u, respectively, where v0, v1, v2, and v3 represent the electron binding energy peaks of Ce 3d 3/2 and u0, u1, u2, and u3 represent the electron binding energy peaks of Ce 3d 5/2. The peaks of v0, v2, v3, u0, u2, and u3 correspond to the characteristic peaks of Ce4+, and the two peaks of v1 and u1 correspond to the characteristic peaks of Ce3+ [26]. It is revealed that the catalyst has a certain number of Ce4+/Ce3+ redox electron pairs, which promote the storage and release of surface oxygen, increase surface oxidation, and increase transformation of NO to NO2 at the active site.
The XPS spectrum of the Fe 2p orbital on the surface of modified rare earth concentrate Sample 5 (Figure 7) showed two strong peaks and one weak auxiliary peak. The two strong peaks correspond to Fe 2p 3/2 (the binding energy is 711 eV) and Fe 2p 1/2 (the binding energy is ~725 eV). According to the standard spectrum of Fe 2p, the two peaks correspond to the characteristic peaks of Fe3+. The auxiliary peak in the range of 718–721 eV represents the characteristics of Fe2+. The XPS results indicate that Fe coexists in the form of Fe2+ and Fe3+, and Fe3+ dominates [27].

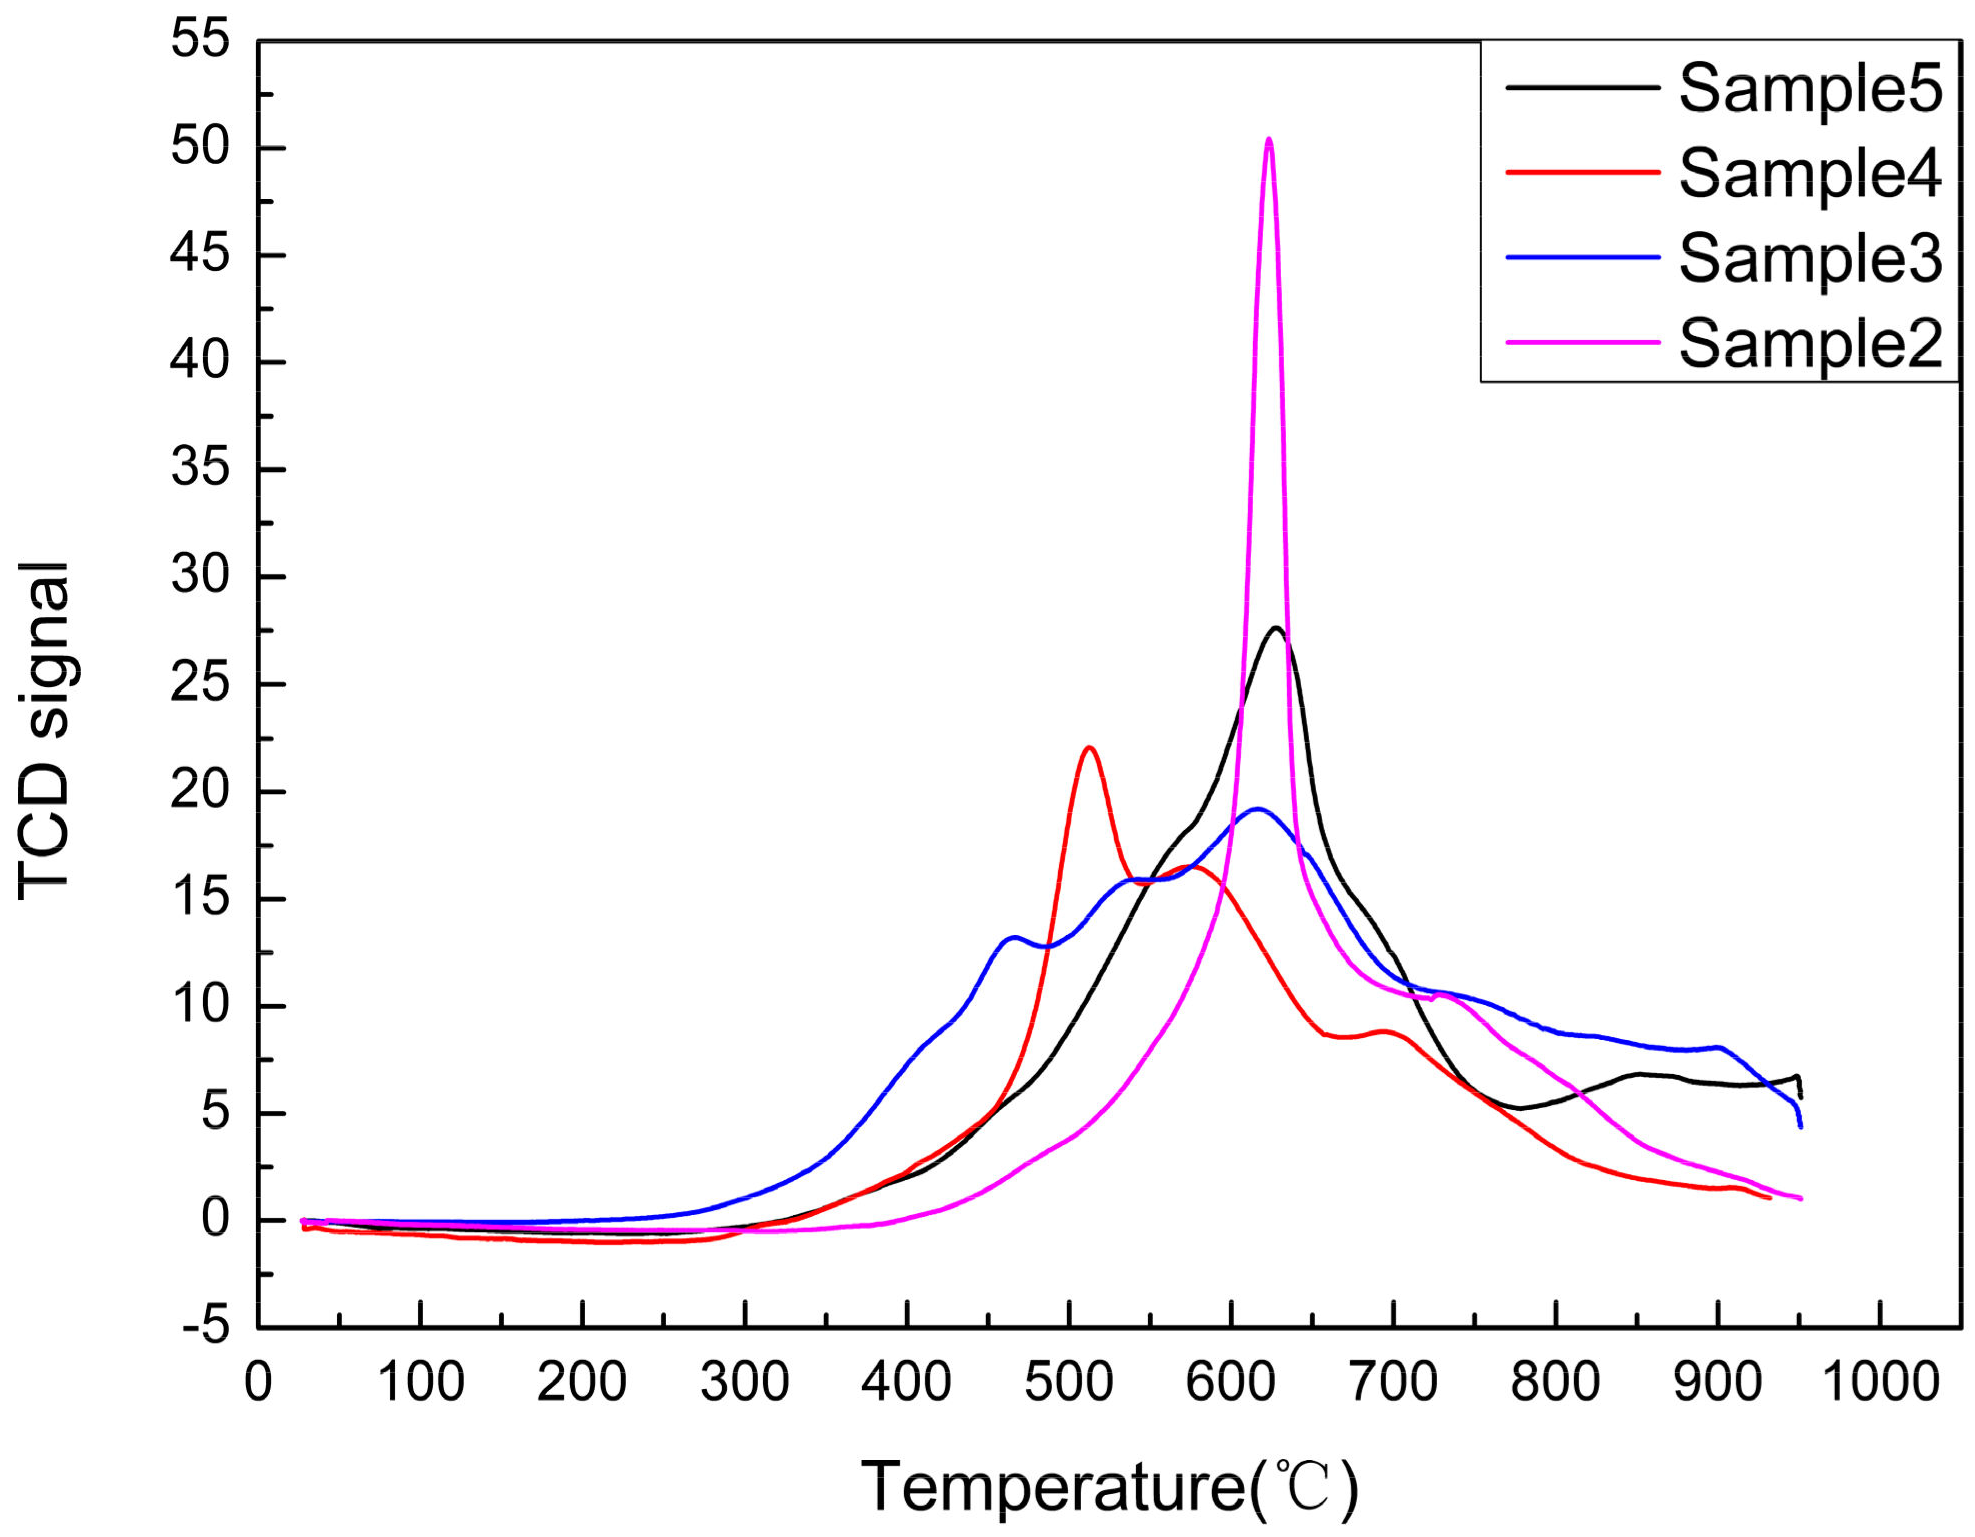
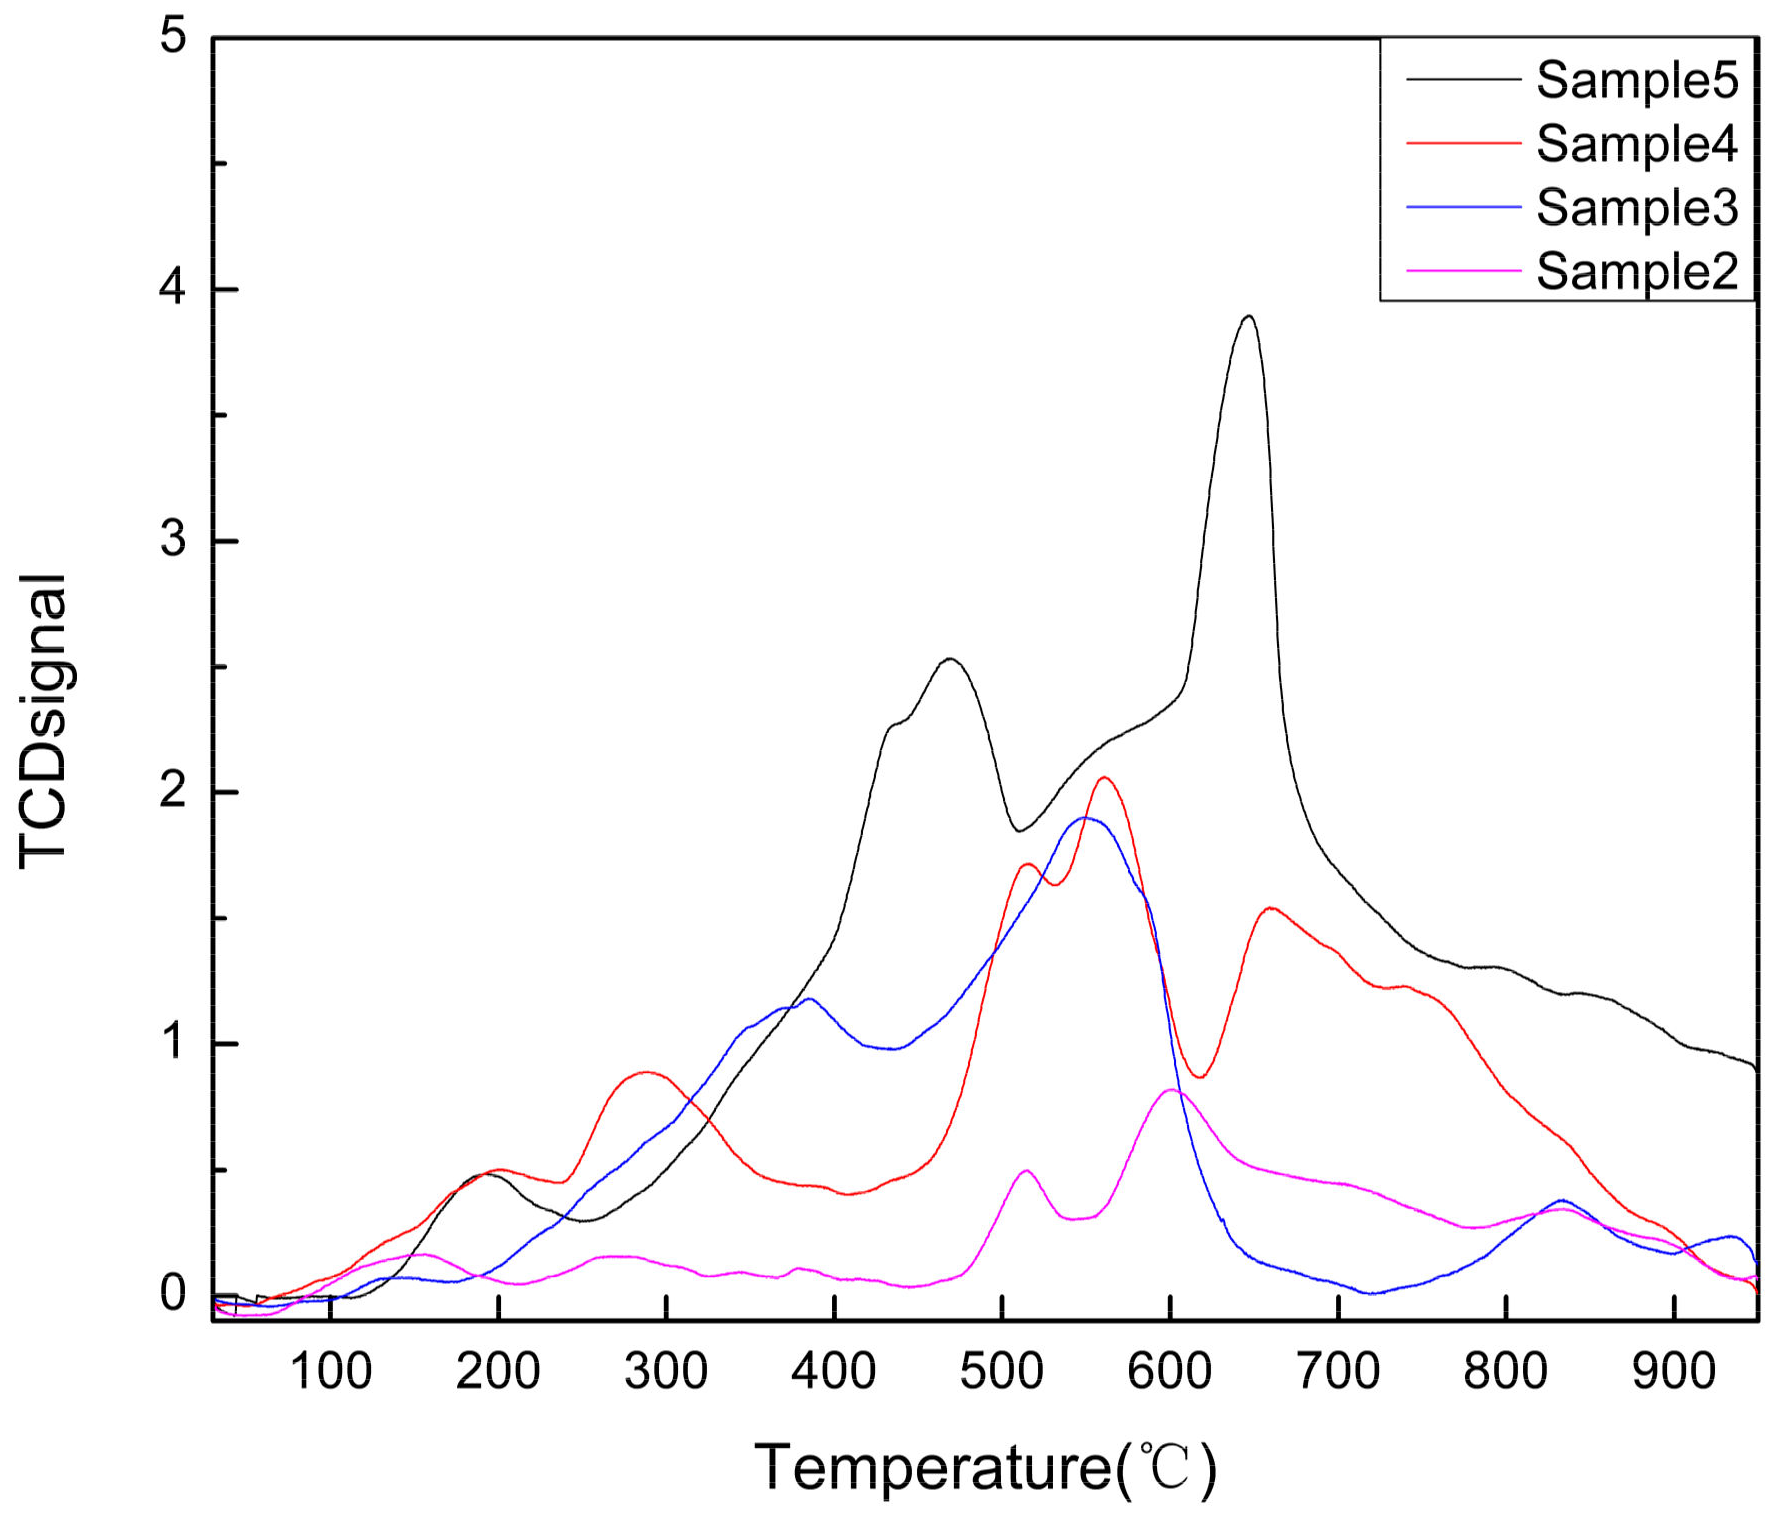
Surface Reduction Ability Characterization

To investigate the ability of metal ions to reduce to low-valent metal ions and to absorb and release oxygen, H2 temperature-programmed reduction (TPR) experiments were carried out. The results are shown in Figure 8.
It can be seen in Figure 8 that after direct roasting of the rare earth concentrate, there is a peak at 620 °C and a shoulder peak at 740 °C. After alkali modification treatment, there were multiple reduction peaks in the wide temperature range of 300–900 °C. After alkali–acid co-modification treatment, there were multiple reduction peaks in the wide temperature range of 400–800 °C. The main peak was at 620 °C, the two shoulder peaks are at 550 °C and 650 °C, and a weak broad peak was above 800 °C. Compared with the direct calcined sample, the temperature domain of the reduction peak was broadened, and the peak was moved toward the low-temperature region. The peak area of Sample 3 was 3087.3, the peak area of sample 4 was 4665.5, and the peak area of Sample 5 was 4032.2. The peak area of modified rare earth concentrates was larger than that of the unmodified one, indicating that the modification treatment could increase the oxygen storage capacity and redox ability of the catalyst.

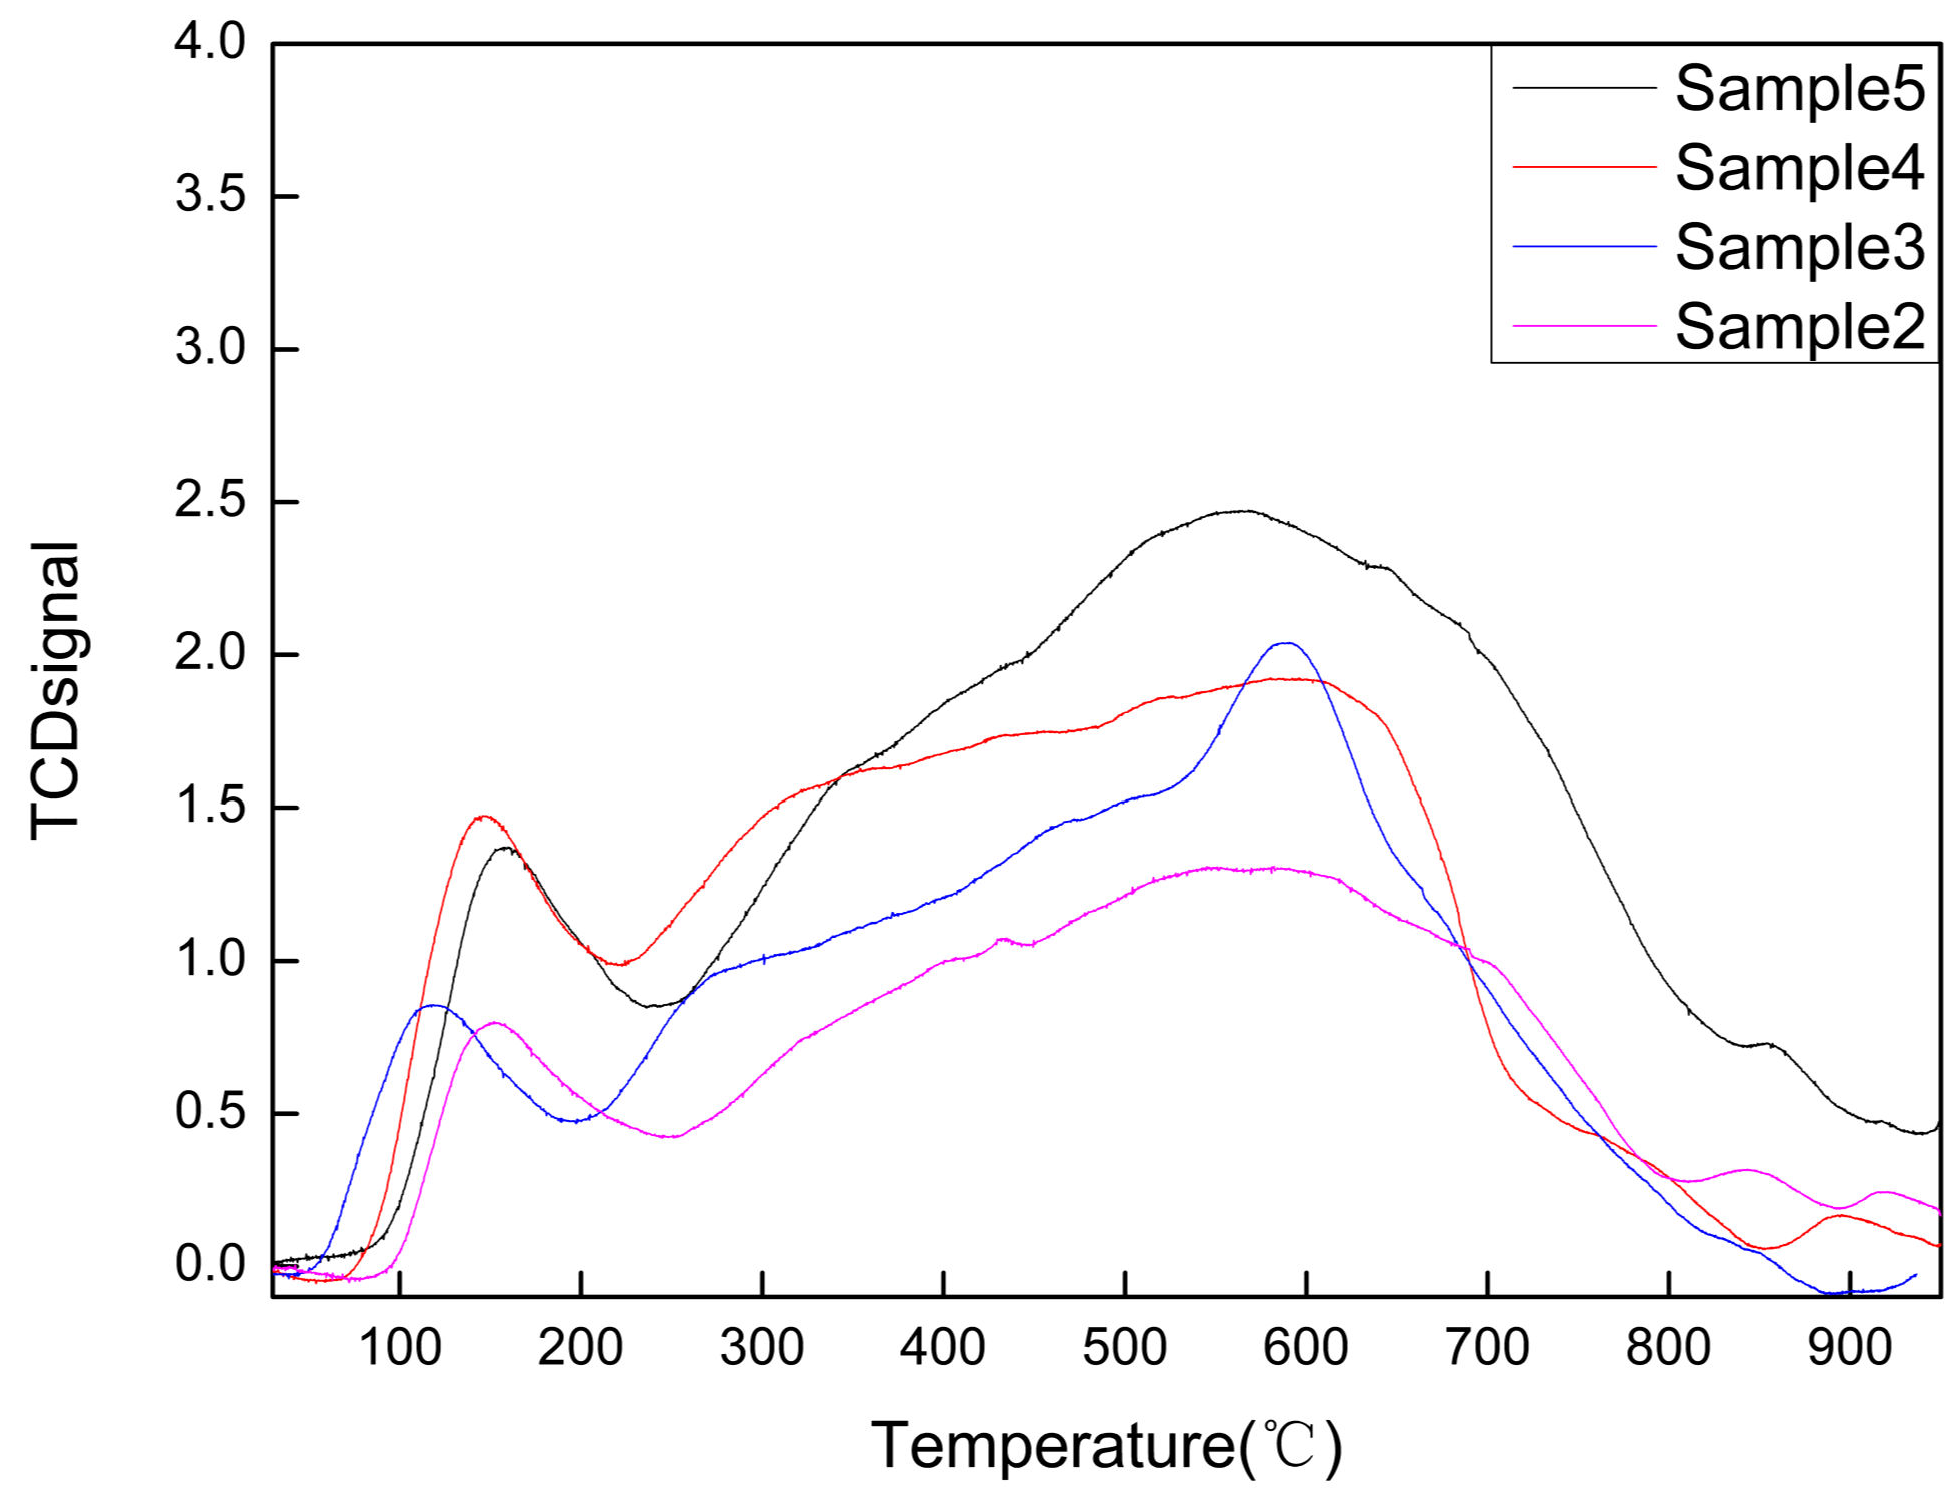
Surface Acidity Characterization

To investigate whether the modification treatment would affect the surface acidity of rare earth concentrates, NH3 temperature-programmed desorption (TPD) experiments were carried out on three kinds of rare earth concentrates with different modification treatments. The test results are shown in Figure 9.
It can be seen in Figure 9 that the order of surface acid amounts is acid–alkali co-treatment (NH3 desorption amount 1272.62 μmol/g) > acid treatment (984.79 μmol/g) > alkali treatment (778.20 μmol/g) > direct calcination treatment (642.06 μmol/g). Four samples showed a weak desorption peak in the low temperature range (100–250 °C). This finding shows that many substances work together to make a large amount of NH3 adsorb on the surface of the catalyst, increase the amount of surface acid, and increase the number of surface active sites, which indicates that the surfaces of particles can be modified after acid–base roasting treatment.

Characterization of Adsorption Capacity of NO

The adsorption capacity of modified rare earth concentrates for NO was investigated in a NO temperature-programmed adsorption–desorption experiment. The results are shown in Figure 10.
In the curves shown in Figure 10, compared with direct baking, the NO adsorption effect of rare earth concentrates after alkali treatment, acid treatment, and alkali–acid co-treatment was significantly increased. Compared with the direct roasted sample, the desorption peak of the alkali-treated sample was increased and shifted toward the low temperature range. The desorption peak of the acid-treated sample was obviously improved. After alkali–acid co-treatment, the adsorption capability was significantly increased throughout the temperature range. The acid–base co-processed sample has a greater specific surface area relative to the acid- or base-treated samples, providing more adsorption sites for NO. This is an important factor in the reaction efficiency of NO conversion.

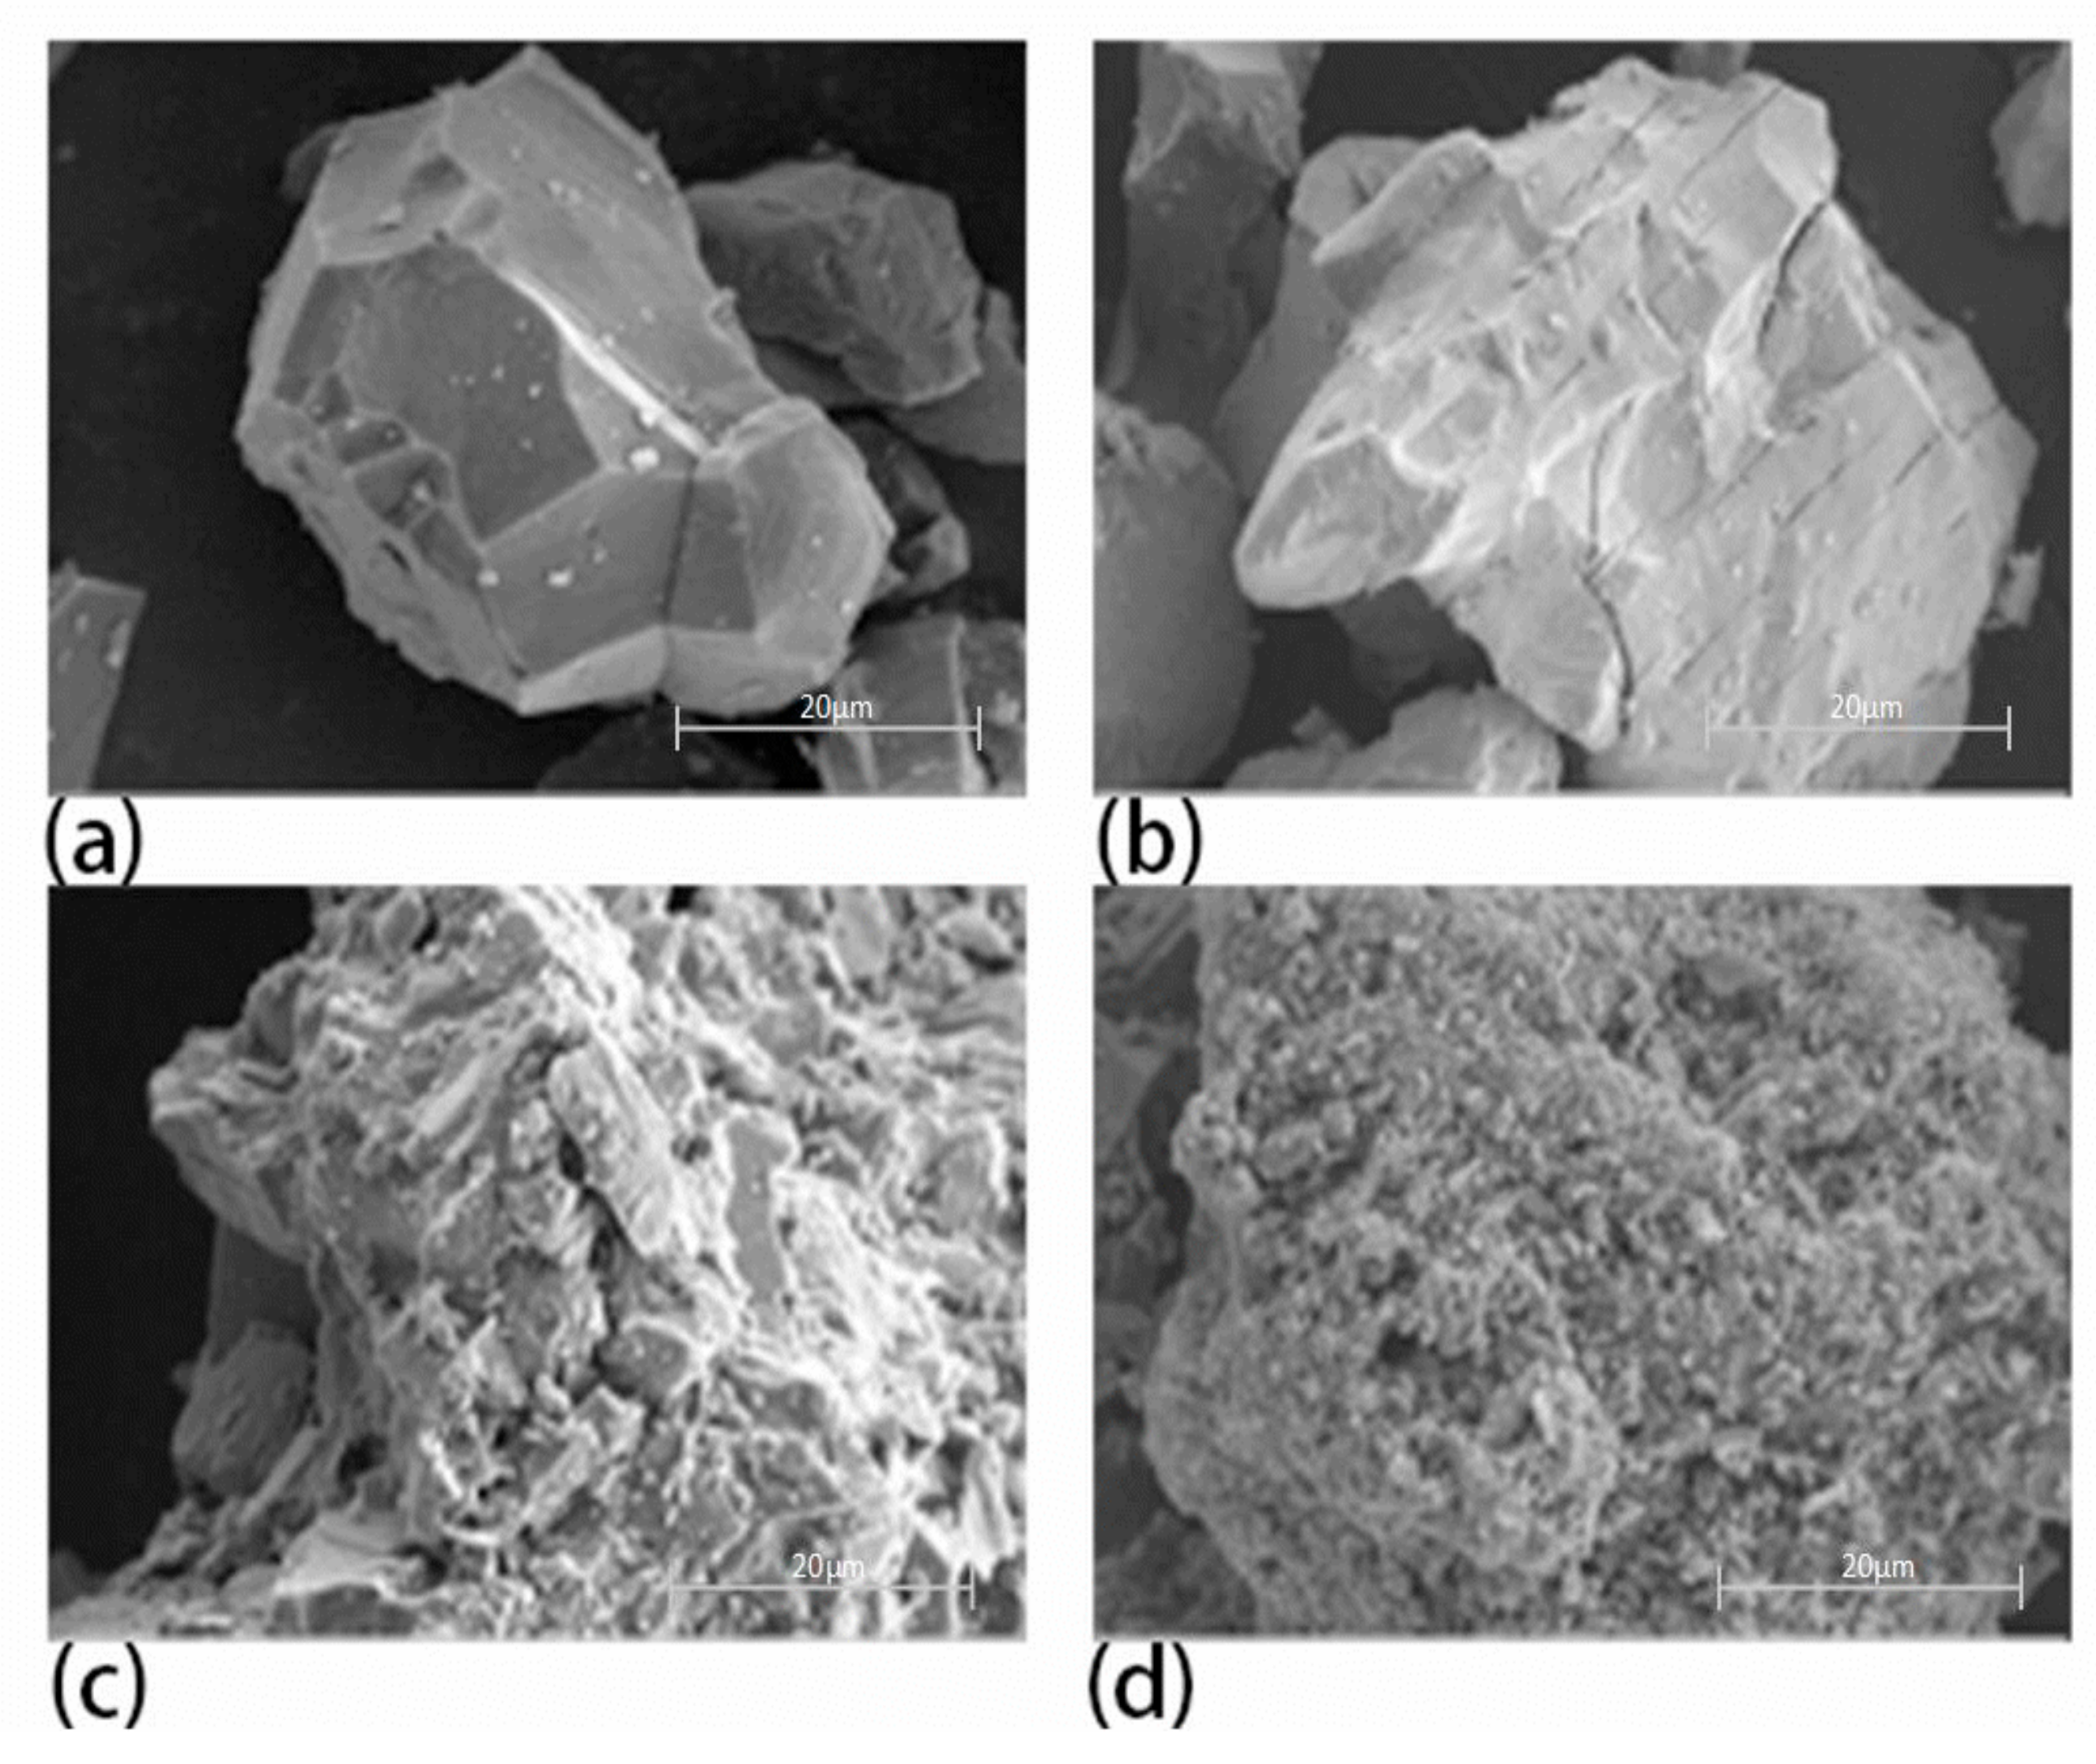
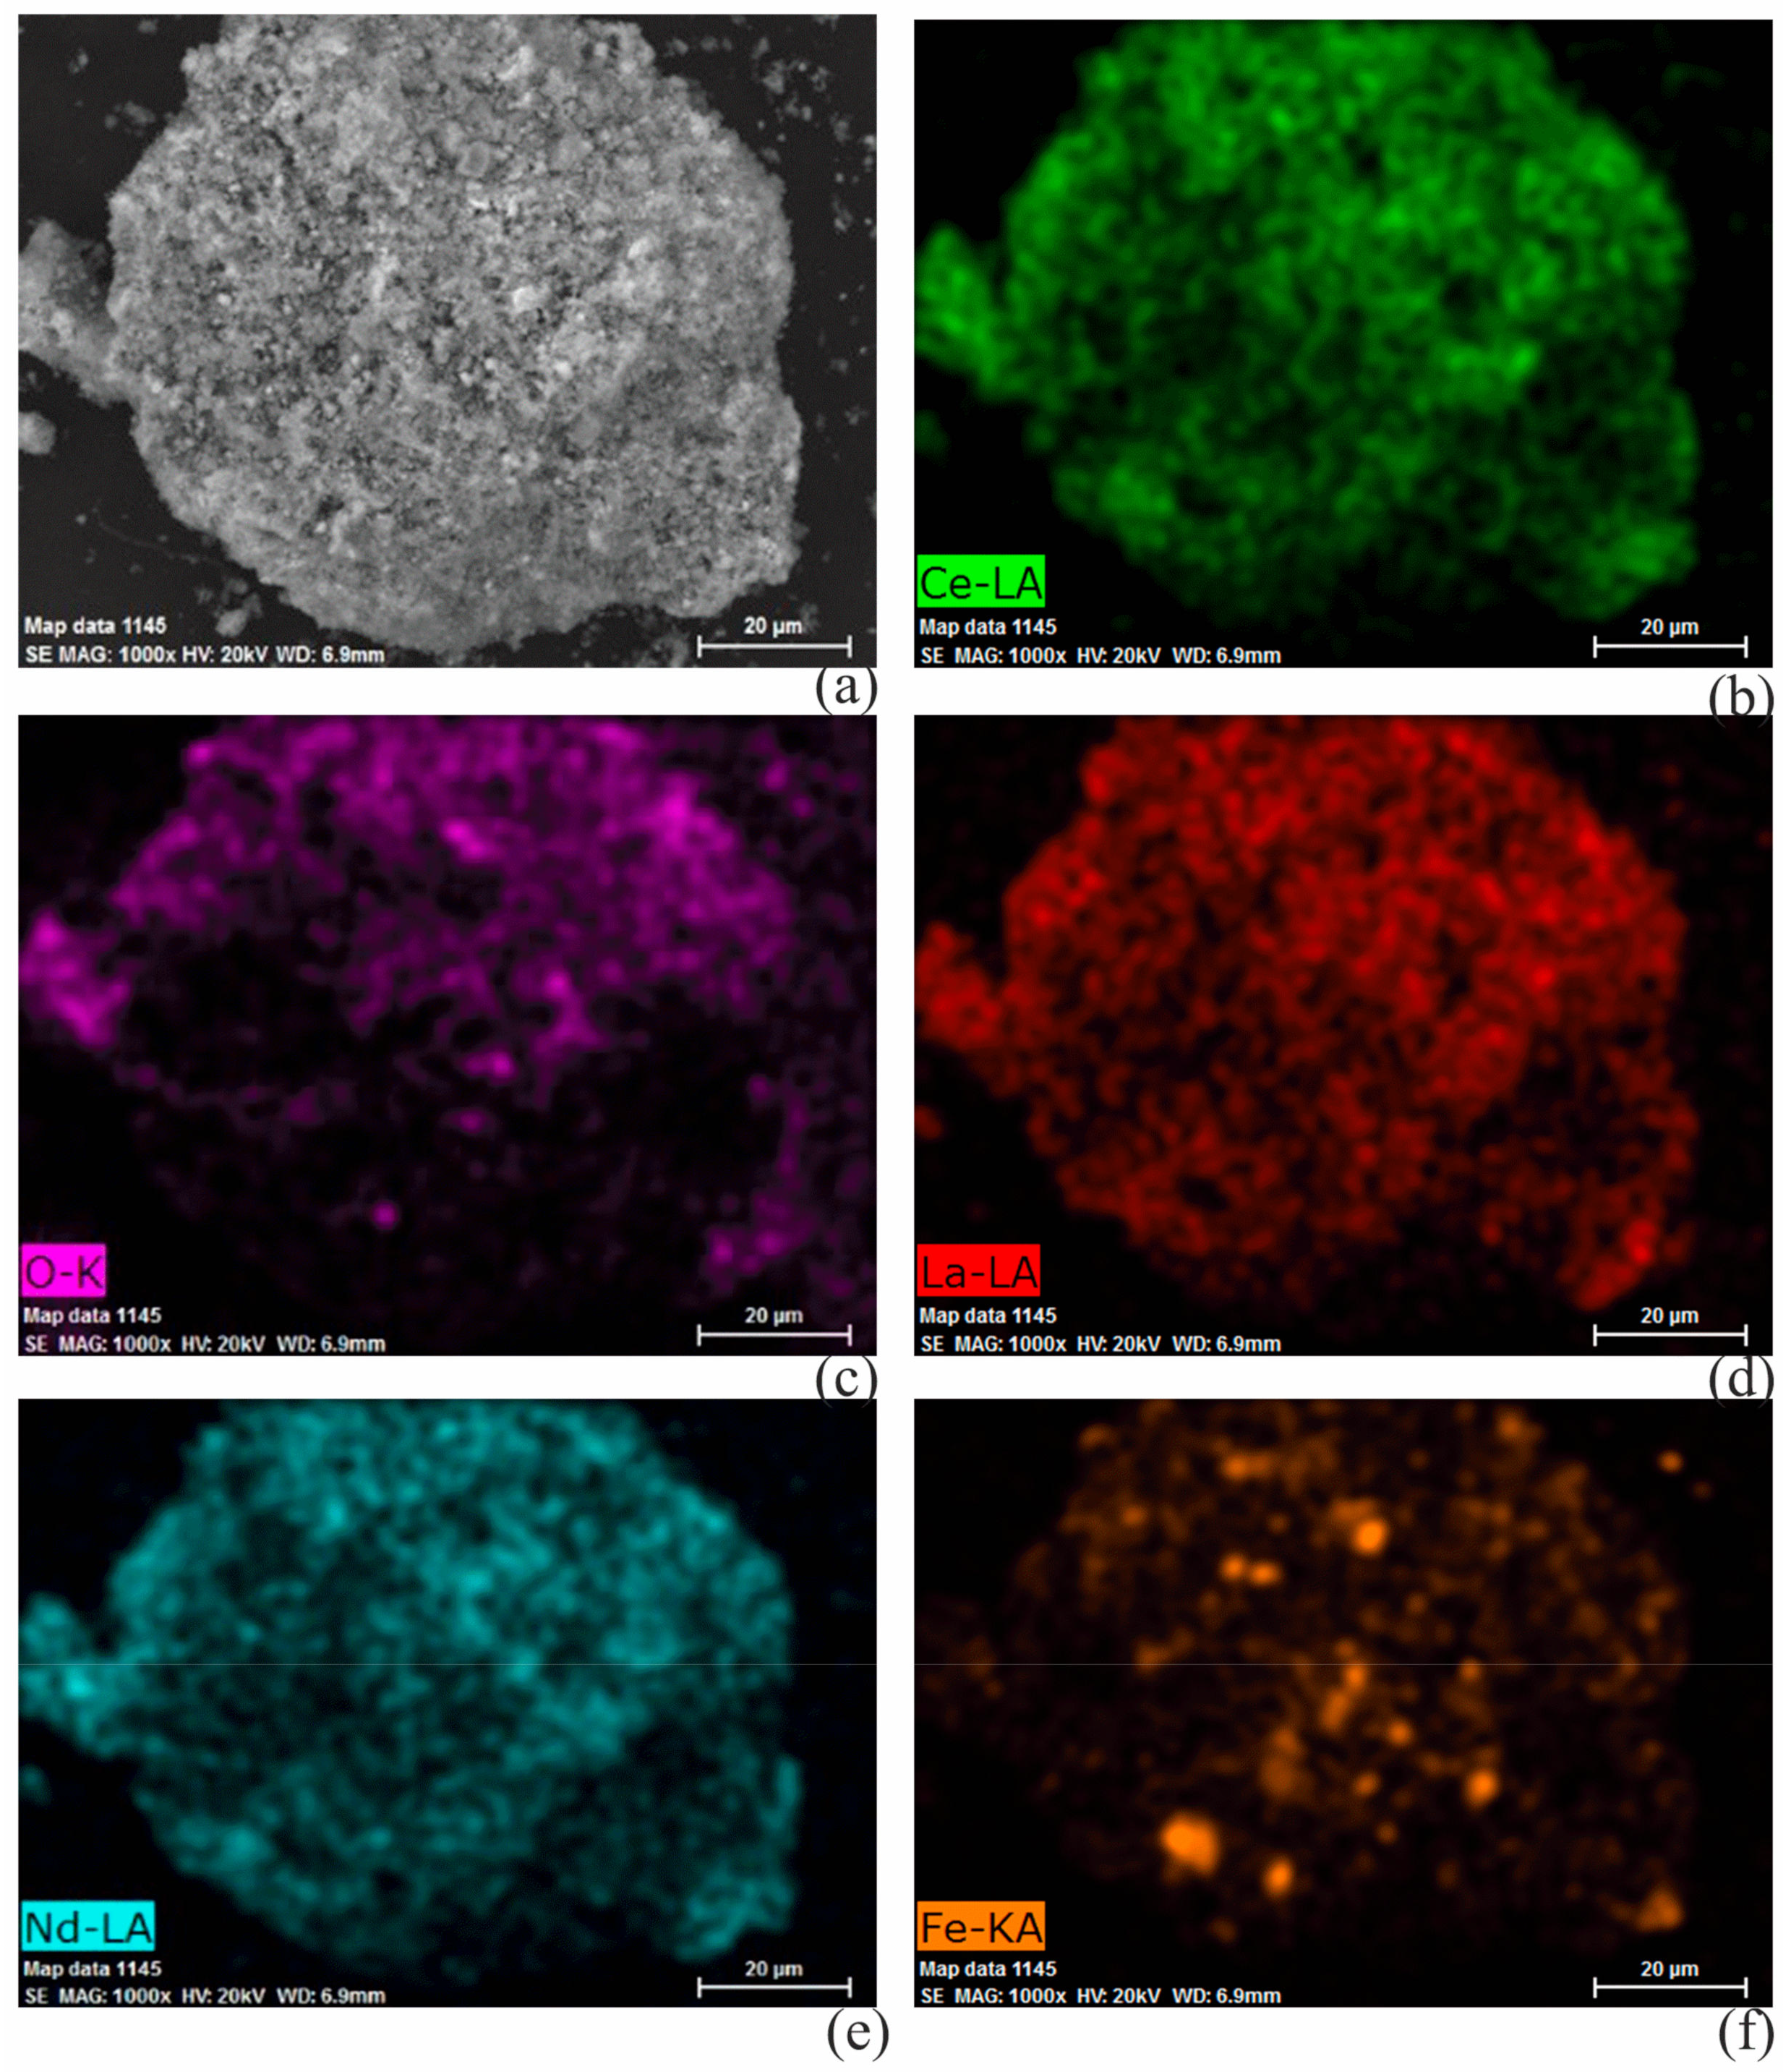
3.4.2. Microscopic Appearance of the Modified Rare Earth Concentrate

Scanning electron microscope (SEM) images of the modified rare earth concentrate are shown in Figure 11.
As shown in the SEM images (Figure 11a,b), after direct roasting the surfaces of the minerals changed from smooth to folded, and cracks appeared. After alkali modification, there were many uneven corrosion marks on the surface of the ore. After acid modification, the original structure of the ore collapsed and broke, and the powder was refined. After the alkali–acid co-modification treatment, a lot of debris appeared on the surface of the ore, there were many pore structures, and the specific surface area increased significantly. Through SEM mapping analysis, it can be seen that Ce, La, Nd, Fe, and other active metal elements existed in the active components after the catalyst formed. The Ce7O12 particles were found in selected large particles. Energy-dispersive X-ray spectroscopy (EDS) mapping showed that the La, Nd, and Pr rare earth elements that originated from CeFCO3 were uniformly distributed in Ce7O12, forming a solid solution (Figure 12).

4. Conclusions

The dissolution of impurities (Ca, Si) has an important effect on the surface properties of pores and can increase redox of the surface of rare earth concentrates and the adsorption properties of NH3 and NO. After impurity removal treatment, the Ce7O12 content of Baiyun Obo rare earth concentrate increased and the dispersion was more uniform, the specific surface area increased, the average pore diameter decreased, and the pore volume increased. Some Ce, La, Nd, Pr, Fe, Mn, and other components formed solid melts during preparation, which increased the synergistic catalytic effect. Ce coexists in the form of Ce3+ and Ce4+. Fe coexists in the form of Fe3+ and Fe2+, but Fe3+ is abundant. Denitrification efficiency of the catalyst sample was 92.8% under the conditions of reaction temperature 400 °C, NO content was 600 ppm, NH3/NO ratio was 1.5, and O2 concentration was 4%.

Author Contributions

Conceptualization, K.Z.; Investigation, S.Z.; Project administration, N.L. and H.L.; Validation, B.L. and Z.Z.; Writing–original draft, J.Z.; Writing–review & editing, W.W. and G.J.

Funding

The investigation was financially supported by the National Natural Science Foundation of China (51866013) and by the Natural Science Foundation of the Inner Mongolia Autonomous Region (2018MS02013).

Conflicts of Interest

The authors declare no conflict of interest.

References

  1. Shi, Z.; Yang, X.; Yan, S. Photocatalytic activity of cerium-doped mesoporous TiO2 coated Fe3O4 magnetic composite under UV and visible light. J. Rare Earths 2012, 30, 355–360. [Google Scholar] [CrossRef]
  2. Al-Musa, A.; Al-Saleh, M.; Ioakeimidis, Z.C.; Ouzounidou, M.; Yentekakis, I.V.; Konsolakis, M.; Marnellos, G.E. Hydrogen production by iso-octane steam reforming over Cu catalysts supported on rare earth oxides (REOs). Int. J. Hydrogen Energy 2014, 39, 1350–1363. [Google Scholar] [CrossRef]
  3. Thirupathi, B.; Smirniotis, P.G. Co-doping a metal (Cr, Fe, Co, Ni, Cu, Zn, Ce, and Zr) on Mn/TiO2 catalyst and its effect on the selective reduction of NO with NH3 at low-temperatures. Appl. Catal. B Environ. 2011, 110, 195–206. [Google Scholar] [CrossRef]
  4. Kim, Y.J.; Kwon, H.J.; Heo, I.; Nam, I.-S.; Cho, B.K.; Choung, J.W.; Cha, M.-S.; Yeo, G.K. Mn–Fe/ZSM5 as a low-temperature SCR catalyst to remove NOx from diesel engine exhaust. Appl. Catal. B Environ. 2012, 126, 9–21. [Google Scholar] [CrossRef]
  5. Yang, S.; Qi, F.; Xiong, S.; Dang, H.; Liao, Y.; Keung, W.; Li, J. MnOX supported on Fe–Ti spinel: A novel Mn based low temperature SCR catalyst with a high N2 selectivity. Appl. Catal. B Environ. 2016, 181, 570–580. [Google Scholar] [CrossRef]
  6. Casanova, M.; Schermanz, K.; Llorca, J.; Trovarelli, A. Improved high temperature stability of NH3-SCR catalysts based on rare earth vanadates supported on TiO2–WO3–SiO2. Catal. Today 2012, 184, 227–236. [Google Scholar] [CrossRef]
  7. Wei, Y.; Chen, Y.; Wang, R. Rare earth salt of 12-tungstophosphoric acid supported on iron oxide as a catalyst for selective catalytic reduction of NOX. Fuel Process. Technol. 2018, 178, 262–270. [Google Scholar] [CrossRef]
  8. Zhao, K.; Meng, J.; Lu, J.; He, Y.; Huang, H.; Tang, Z.; Zhen, X. Sol-gel one-pot synthesis of efficient and environmentally friendly iron-based catalysts for NH3-SCR. Appl. Surf. Sci. 2018, 445, 454–461. [Google Scholar] [CrossRef]
  9. Shi, A.; Wang, X.; Yu, T.; Shen, M. The effect of zirconia additive on the activity and structure stability of V2O5/WO3–TiO2 ammonia SCR catalysts. Appl. Catal. B Environ. 2011, 106, 359–369. [Google Scholar] [CrossRef]
  10. Vuong, T.H.; Radnik, J.; Rabeah, J.; Bentrup, U.; Scheneider, M.; Atia, H.; Armbruster, U.; Grunert, W.; Bruckner, A. Efficient VOX/Ce–XTiXO2 Catalysts for Low-Temperature NH3-SCR: Reaction Mechanism and Active Sites Assessed by in Situ/Operando Spectroscopy. Acs Catal. 2017, 7, 1693–1705. [Google Scholar] [CrossRef]
  11. Zhou, C.; Zhang, Y.; Wang, X.; Xu, H.; Sun, K.; Shen, K. Influence of the addition of transition metals (Cr, Zr, Mo) on the properties of MnOX–FeOX catalysts for low-temperature selective catalytic reduction of NOX by Ammonia. J. Colloid. Interface Sci. 2013, 392, 319–324. [Google Scholar] [CrossRef]
  12. Yue, B.; Zhou, R.; Wang, Y.; Zheng, X. Influence of transition metals (Cr, Mn, Fe, Co and Ni) on the methane combustion over Pd/Ce–Zr/Al2O3 catalyst. Appl. Surf. Sci. 2006, 252, 5820–5828. [Google Scholar] [CrossRef]
  13. Fernandez-Garcia, M.; Martinez-Arias, A.; Iglesias-Juez, A.; Hungria, A.B.; Anderson, J.A.; Conesa, J.C.; Soria, J. Behavior of bimetallic Pd/Cr/Al2O3 and Pd/Cr/(Ce,Zr)OX/Al2O3 catalysts for CO and NO elimination. J. Catal. 2003, 214, 220–233. [Google Scholar] [CrossRef]
  14. He, H.; Dai, H.X.; Au, C.T. Defective structure, oxygen mobility, oxygen storage capacity, and redox properties of RE-based (RE = Ce, Pr) solid solutions. Catal. Today 2004, 90, 245–254. [Google Scholar] [CrossRef]
  15. Tran, U.P.N.; Le, K.K.A.; Phan, N.T.S. Expanding Applications of Metal−Organic Frameworks: Zeolite Imidazolate Framework ZIF-8 as an Efficient Heterogeneous Catalyst for the Knoevenagel Reaction. ACS Catal. 2011, 1, 120–127. [Google Scholar] [CrossRef]
  16. Lan, X.; Gao, J.; Du, Y.; Guo, Z. Mineral evolution and separation of rare-earth phases from Bayan Obo rare-earth concentrate in a super-gravity field. J. Alloy. Compd. 2018, 731, 873–880. [Google Scholar] [CrossRef]
  17. Wang, L.; Liang, T.; Zhang, Q.; Li, K. Rare earth element components in atmospheric particulates in the Bayan Obo mine region. Environ. Res. 2014, 131, 64–70. [Google Scholar] [CrossRef]
  18. Xu, C.; Campbell, L.H.; Kynicky, J.; Allen, C.M.; Chen, Y.; Huang, Z.; Qi, L. Comparison of the Daluxiang and Maoniuping carbonatitic REE deposits with Bayan Obo REE deposit, China. Lithos 2008, 106, 12–24. [Google Scholar] [CrossRef]
  19. Wu, Z.; Jiang, B.; Liu, Y. Effect of transition metals addition on the catalyst of manganese/titania for low-temperature selective catalytic reduction of nitric oxide with ammonia. Appl. Catal. B Environ. 2008, 79, 347–355. [Google Scholar] [CrossRef]
  20. Gao, G.; Shi, J.-W.; Liu, C.; Cao, C.; Fan, Z.; Niu, C. Mn/CeO2 catalysts for SCR of NOX with NH3: Comparative study on the effect of supports on low-temperature catalytic activity. Appl. Surf. Sci. 2017, 411, 338–346. [Google Scholar] [CrossRef]
  21. Yang, J.; Ma, H.; Yanamoto, Y.; Yu, J.; Xu, G.; Zhang, Z.; Suzuki, Y. SCR catalyst coated on low-cost monolith support for flue gas denitration of industrial furnaces. Chem. Eng. J. 2013, 230, 513–521. [Google Scholar] [CrossRef]
  22. Yao, X.; Kong, T.; Yu, S.; Li, L.; Yang, F.; Dong, L. Influence of different supports on the physicochemical properties and denitration performance of the supported Mn-based catalysts for NH3-SCR at low temperature. Appl. Surf. Sci. 2017, 402, 208–217. [Google Scholar] [CrossRef]
  23. Xu, C.; Liu, J.; Zhao, Z.; Yu, F.; Cheng, K.; Wei, Y.; Duan, A.; Jiang, G. NH3-SCR denitration catalyst performance over vanadium-titanium with the addition of Ce and Sb. J. Environ. Sci. 2015, 31, 74–80. [Google Scholar] [CrossRef]
  24. Jiang, B.; Li, Z.; Lee, S.-C. Mechanism study of the promotional effect of O2 on low-temperature SCR reaction on Fe–Mn/TiO2 by DRIFT. Chem. Eng. J. 2013, 225, 52–58. [Google Scholar] [CrossRef]
  25. Klukowski, D.; Ballea, P.; Geigera, B.; Wagloehnera, S.; Kuretia, S.; Kimmerleb, B.; Baikerb, A.; Grunwaldtc, J.-D. On the mechanism of the SCR reaction on Fe/HBEA zeolite. Appl. Catal. B Environ. 2009, 93, 185–193. [Google Scholar] [CrossRef]
  26. Priolkar, K.R.; Parthasarathi Bera, P.R.; Sarode, M.S.; Hegde, S.; Emura, S.; Kumashiro, R.; Lalla, N. Formation of Ce1-xPdxO2-δ solid solution in combustion-synthesized Pd/CeO2 catalyst: XRD, XPS, and EXAFS investigation. Chem. Mater. 2002, 14, 2120–2128. [Google Scholar] [CrossRef]
  27. Yamashita, T.; Hayes, P. Analysis of XPS spectra of Fe2+ and Fe3+ ions in oxide materials. Appl. Surf. Sci. 2008, 254, 2441–2449. [Google Scholar] [CrossRef]
Figure 1. TG curve of the rare earth concentrate.
Minerals 09 00246 g001
Figure 2. XRD pattern of the rare earth concentrate.
Minerals 09 00246 g002
Figure 3. XRD patterns of the modified rare earth concentrates after calcination.
Minerals 09 00246 g003
Figure 4. Relationship between the particle size and denitrification rate of primary ore.
Minerals 09 00246 g004
Figure 5. Activity test for different treatments of concentrate.
Minerals 09 00246 g005
Figure 6. XPS spectrum of the Ce 3d orbital.
Minerals 09 00246 g006
Figure 7. XPS spectrum of the Fe 2p orbital on the surface of the modified rare earth concentrate.
Minerals 09 00246 g007
Figure 8. H2-TPR (temperature-programmed reduction) diagram of modified rare earth concentrate.
Minerals 09 00246 g008
Figure 9. NH3-TPD diagram of modified rare earth concentrate.
Minerals 09 00246 g009
Figure 10. NO-TPD curve of modified rare earth concentrate.
Minerals 09 00246 g010
Figure 11. SEM images of rare earth concentrate: (a) sample 1, (b) sample 2, (c) sample 3, and (d) sample 4.
Minerals 09 00246 g011
Figure 12. EDS mapping of Ce7O12 particles: (a) SEM image, (b) Ce, (c) O, (d) La, (e) Nd, and (f) Fe.
Minerals 09 00246 g012
Table 1. Elemental analysis of rare earth concentrates (unit: assemblage percentage).
CompositionSample 1 (%)Sample 3 (%)Sample 4 (%)Sample 5 (%)
Ce24.20023.89424.61631.509
O22.60031.31935.59626.298
Ca16.5005.1625.4345.612
La12.60012.61410.85715.513
Fe7.5307.4907.89410.824
Nd7.1004.1253.4245.285
P2.1902.4001.6431.478
Pr2.0701.9211.5441.401
Ba1.4900.2190.2010.159
Si0.7320.5080.5140.322
S 0.5590.4120.1570.142
Mn0.5120.5270.6310.465
Zn0.2100.0300.1090.116
Ti0.2010.1190.0870.067
Gd0.1901.2751.1560.059
Th0.1660.0430.0340.037
Y0.1550.0460.0370.091
Sr0.1320.0320.0320.037
Nb0.1200.0210.0180.019
Pb0.0810.1500.1090.279
Mg0.0650.8570.9740.547
K0.0610.0300.0290.018
Al0.0290.1580.1190.101
Cu0.0150.0110.0130.009
Sm0.4540.4270.4310.361
Table 2. Preparation procedure and test plan of rare earth concentrate samples.
Sample Serial NumberRaw MaterialSample PreparationSampleTest Methods
Drying TemperatureCalcination TemperatureRoasting Time
Sample 1Concentrate110 °C--ConcentrateXRD/TG-DSC/SEM
Sample 2Concentrate110 °C500 °C4 hDirect roasting concentrateXRD/BET/H2-TPR/NH3-TPD/NO-TPD/SEM
Sample 3NaHCO3 (4 g) + Concentrate (10 g) + H2O (50 mL)110 °C500 °C4 hAlkali treatment concentrateXRD/BET/H2-TPR/NH3-TPD/NO-TPD/SEM
Sample 4H2C2O4 (4 g) + Concentrate (10 g) + H2O (50 mL)110 °C500 °C4 hAcid treated concentrateXRD/BET/H2-TPR/NH3-TPD/NO-TPD
Sample 5NaHCO3 (4 g) + H2C2O4 (4 g) + Concentrate (10 g) + H2O (50 mL)110 °C500 °C4 hAcid-base co-processing concentrateXRD/BET/XPS/H2-TPR/NH3-TPD/NO-TPD/SEM
TG-DSC: Thermogravimetric Analysis-Differential scanning calorimetry. BET: Brunauer Emmett Teller.
Table 3. Physical properties of the modified rare earth concentrates.
Physical PropertiesSample 2Sample 3Sample 4Sample 5
Specific surface area (m2/g)154.9190.5212.4208.0
Pore volume (mL/g)0.40.40.570.6
Average aperture (nm)12.711.910.110.7

