Article

Estimating Bubble Loading in Industrial Flotation Cells

1
Faculty of Mining & Metallurgical Engineering, Yazd University, Yazd 98195, Iran
2
GeoRessources Laboratory, University of Lorraine, 2 rue du Doyen Marcel Roubault, 54505 Vandoeuvre-lès-Nancy, France
*
Author to whom correspondence should be addressed.
Minerals 2019, 9(4), 222; https://doi.org/10.3390/min9040222
Submission received: 6 March 2019 / Revised: 3 April 2019 / Accepted: 4 April 2019 / Published: 8 April 2019

Abstract

:
Bubble loading is the ratio of the weight of the solid particles to the bubble’s surface, and it has an effective role in the flotation efficiency. This paper investigates bubble loading an industrial processing circuit through considering the important role of the bubble diameter in calculating bubble loading, and the effect of the aeration rate and frother dosage on the bubble diameter. The ratio of the weight of solid particles to the bubble volume was estimated to be in the range of 8 to 24 g/L. Although increasing the aeration could result in increasing the weight of the particles attached to the bubbles, the bubble loading was reduced by increasing the aeration rate due to its impact on the bubble diameter and the percentage of bubble surface coverage. For example, when the aeration rate was increased from 45 to 146 m3/h, the bubble loading decreased from 23 to 12 g/L. By increasing the frother dosage from 70 to 150 mL/min, the bubble loading increased from 16 to 19 g/L.

1. Introduction

The structure and stability of the froth can greatly affect the concentrate grade and recovery in the flotation process [1]. Parameters such as hydrophobicity, particle size distribution, amount and type of frother and collector, temperature, pH, and soluble ions affect the structure and stability of the froth [1,2,3,4,5,6,7,8]. King et al. [9] in 1974 studied the maximum bubble loading and they showed that the shape and placement of particles could form a cumulative particle with a maximum bubble-carrying capacity.
It has been reported that bubble diameter, particle size, particle density, particle shape, and the geometric arrangement of particles have the greatest impact on the bubble loading [10]. In theory, if the size and shape of particles are assumed to be similar and spherical, the maximum number of particles (nmax) that can be connected to a bubble is calculated by Equation (1):
n max = π ( d b d p ) 2
where db and dp are the bubble and particle diameter, respectively. According to Equation (2), the maximum bubble loading based on the ratio of the bubble mass to its volume is equal to:
λ max = π ρ p d p d b
where λmax is the maximum bubble loading (g/cm3), and ρP is the mineral density (g/cm3).
It should be noted that in practice, only a fraction of the bubble surface is covered by particles, and full coverage is not possible. Therefore, bubble loading can be calculated using Equation (3) [11]:
λ B = K π ρ p d p d b
where K is the fraction of bubble surface coverage with a layer of particles.
The bubble loading can be defined in terms of mass of the particles attached to the bubble surface, as shown in Equation (4):
B l = λ B d b 6
where Bl is mass of the attached particles to the bubble surface (mg/mm2).
Bubble loading has been studied by many researchers [11,12,13,14,15,16,17]. Bradshaw [12] in 1996 estimated the mass fraction of particles per area of the bubble as 0.082 mg/mm2 for pyrite. Yianatos [11] in 2008 reported the bubble loading in an industrial copper flotation cell as 26.5 g/L and 59.0 g/L (about 0.006 mg/mm2 and 0.010 mg/mm2). In recent studies, the bubble loading in column flotation of quartz has been found to be in the range of 0.01 to 0.04 mg/mm2 [16,17]. A direct relationship between collector dosage and the bubble loading, especially for large particles, has been also reported [18].
In this paper, the bubble loading was calculated based on the aeration rate and frother dosage in an industrial mechanical flotation cell. Their effect on the bubble transport capacity was also investigated. It is acknowledged that bubble loading in either laboratory or industrial machines has been previously studied; however, in this study, a simple but practical relationship was applied to find the effect of practical flotation parameters on the bubble loading. The effect of froth depth on bubble loading has not been previously investigated, and it is targeted in the current work.

2. Materials and Methods

In order to measure the bubble loading and investigate the effect of operational parameters, tests were conducted in the industrial flotation cells of the Gol-e-Gohar Iron Company (Kerman, Iran). In this plant, PAX (potassium amyl xanthate) and Methyl isobutyl carbinol (MIBC) are used as collector and frother, respectively. The collector dosage was 60 g/ton, and it was kept constant for different tests throughout the study, while the frother dosage was varied. The flotation plant had two parallel flotation circuits of Metso RCL10 and RCL30 cells. Each circuit consisted of four flotation cells with a capacity of 10 m3, which were placed in series, and each circuit had four froth outputs. All the tests were conducted in the first cell.

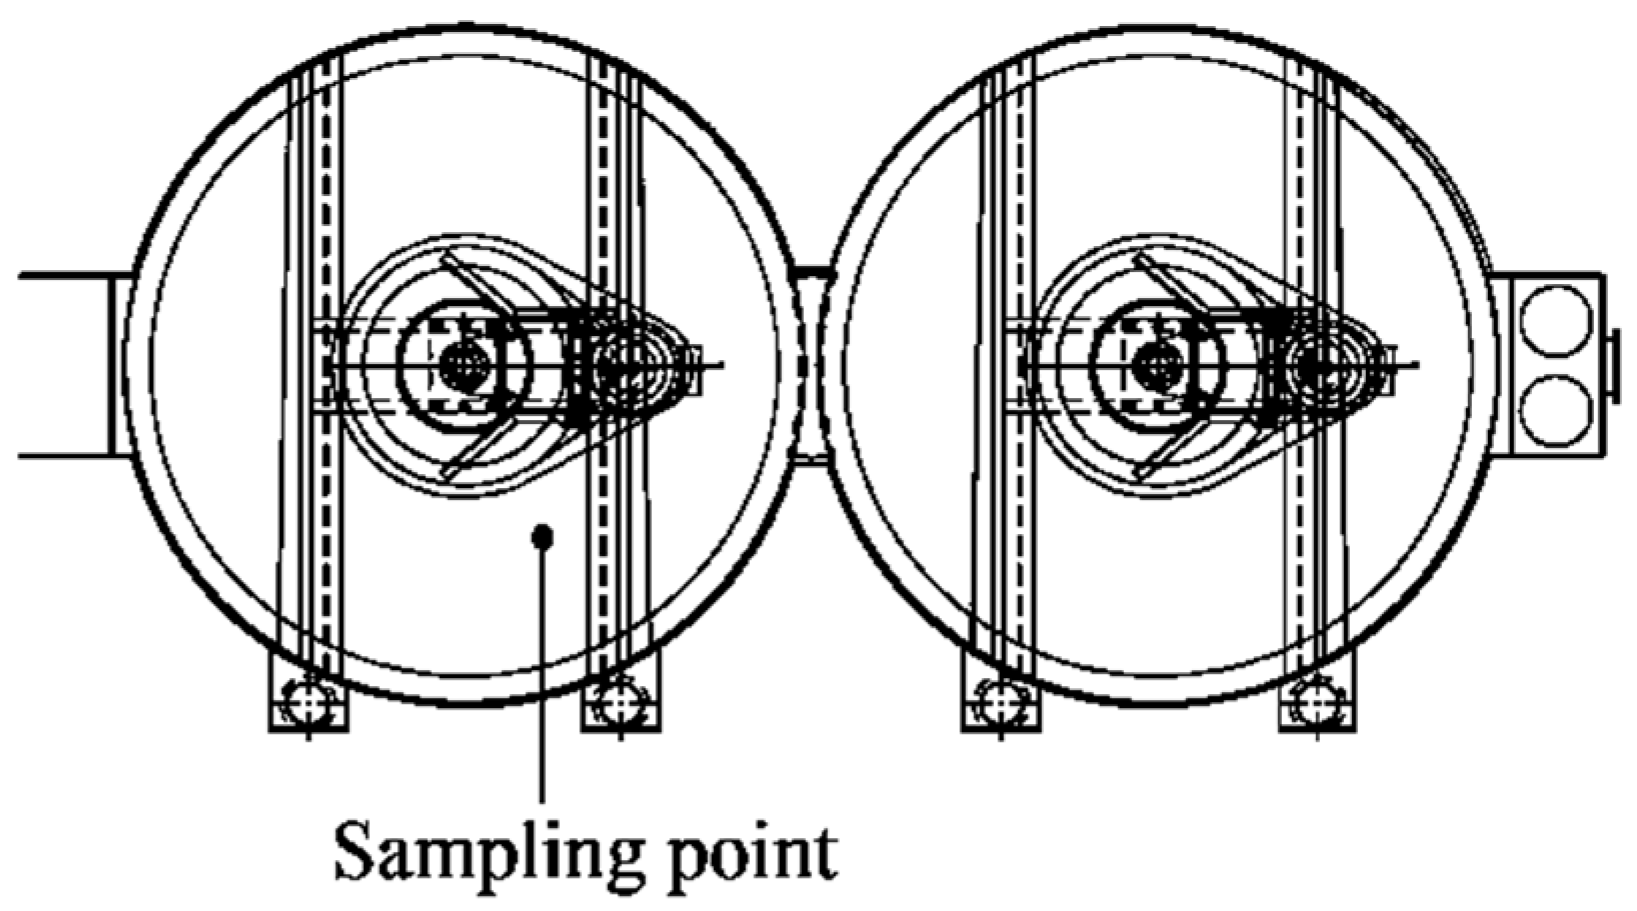
2.1. Test Conditions

The bubble loading depends on the bubble diameter and the characteristics of the connected particles to the bubble; these factors are affected by various parameters. For example, bubble diameter is influenced by aeration rate, frother dosage, and type [19], as well as solid% and particle size distribution [20]. The aeration rate and frother dosage are the most important factors affecting the bubble diameter. Due to the different conditions of the processing plant, experiments were designed and conducted in two different blocks. The conditions and specifications of each block are given in Table 1. The froth depths for blocks 1 and 2 were set at 5 cm and 30 cm, respectively.
The position of bubble loading measurement in the flotation circuit is also schematically shown in Figure 1.

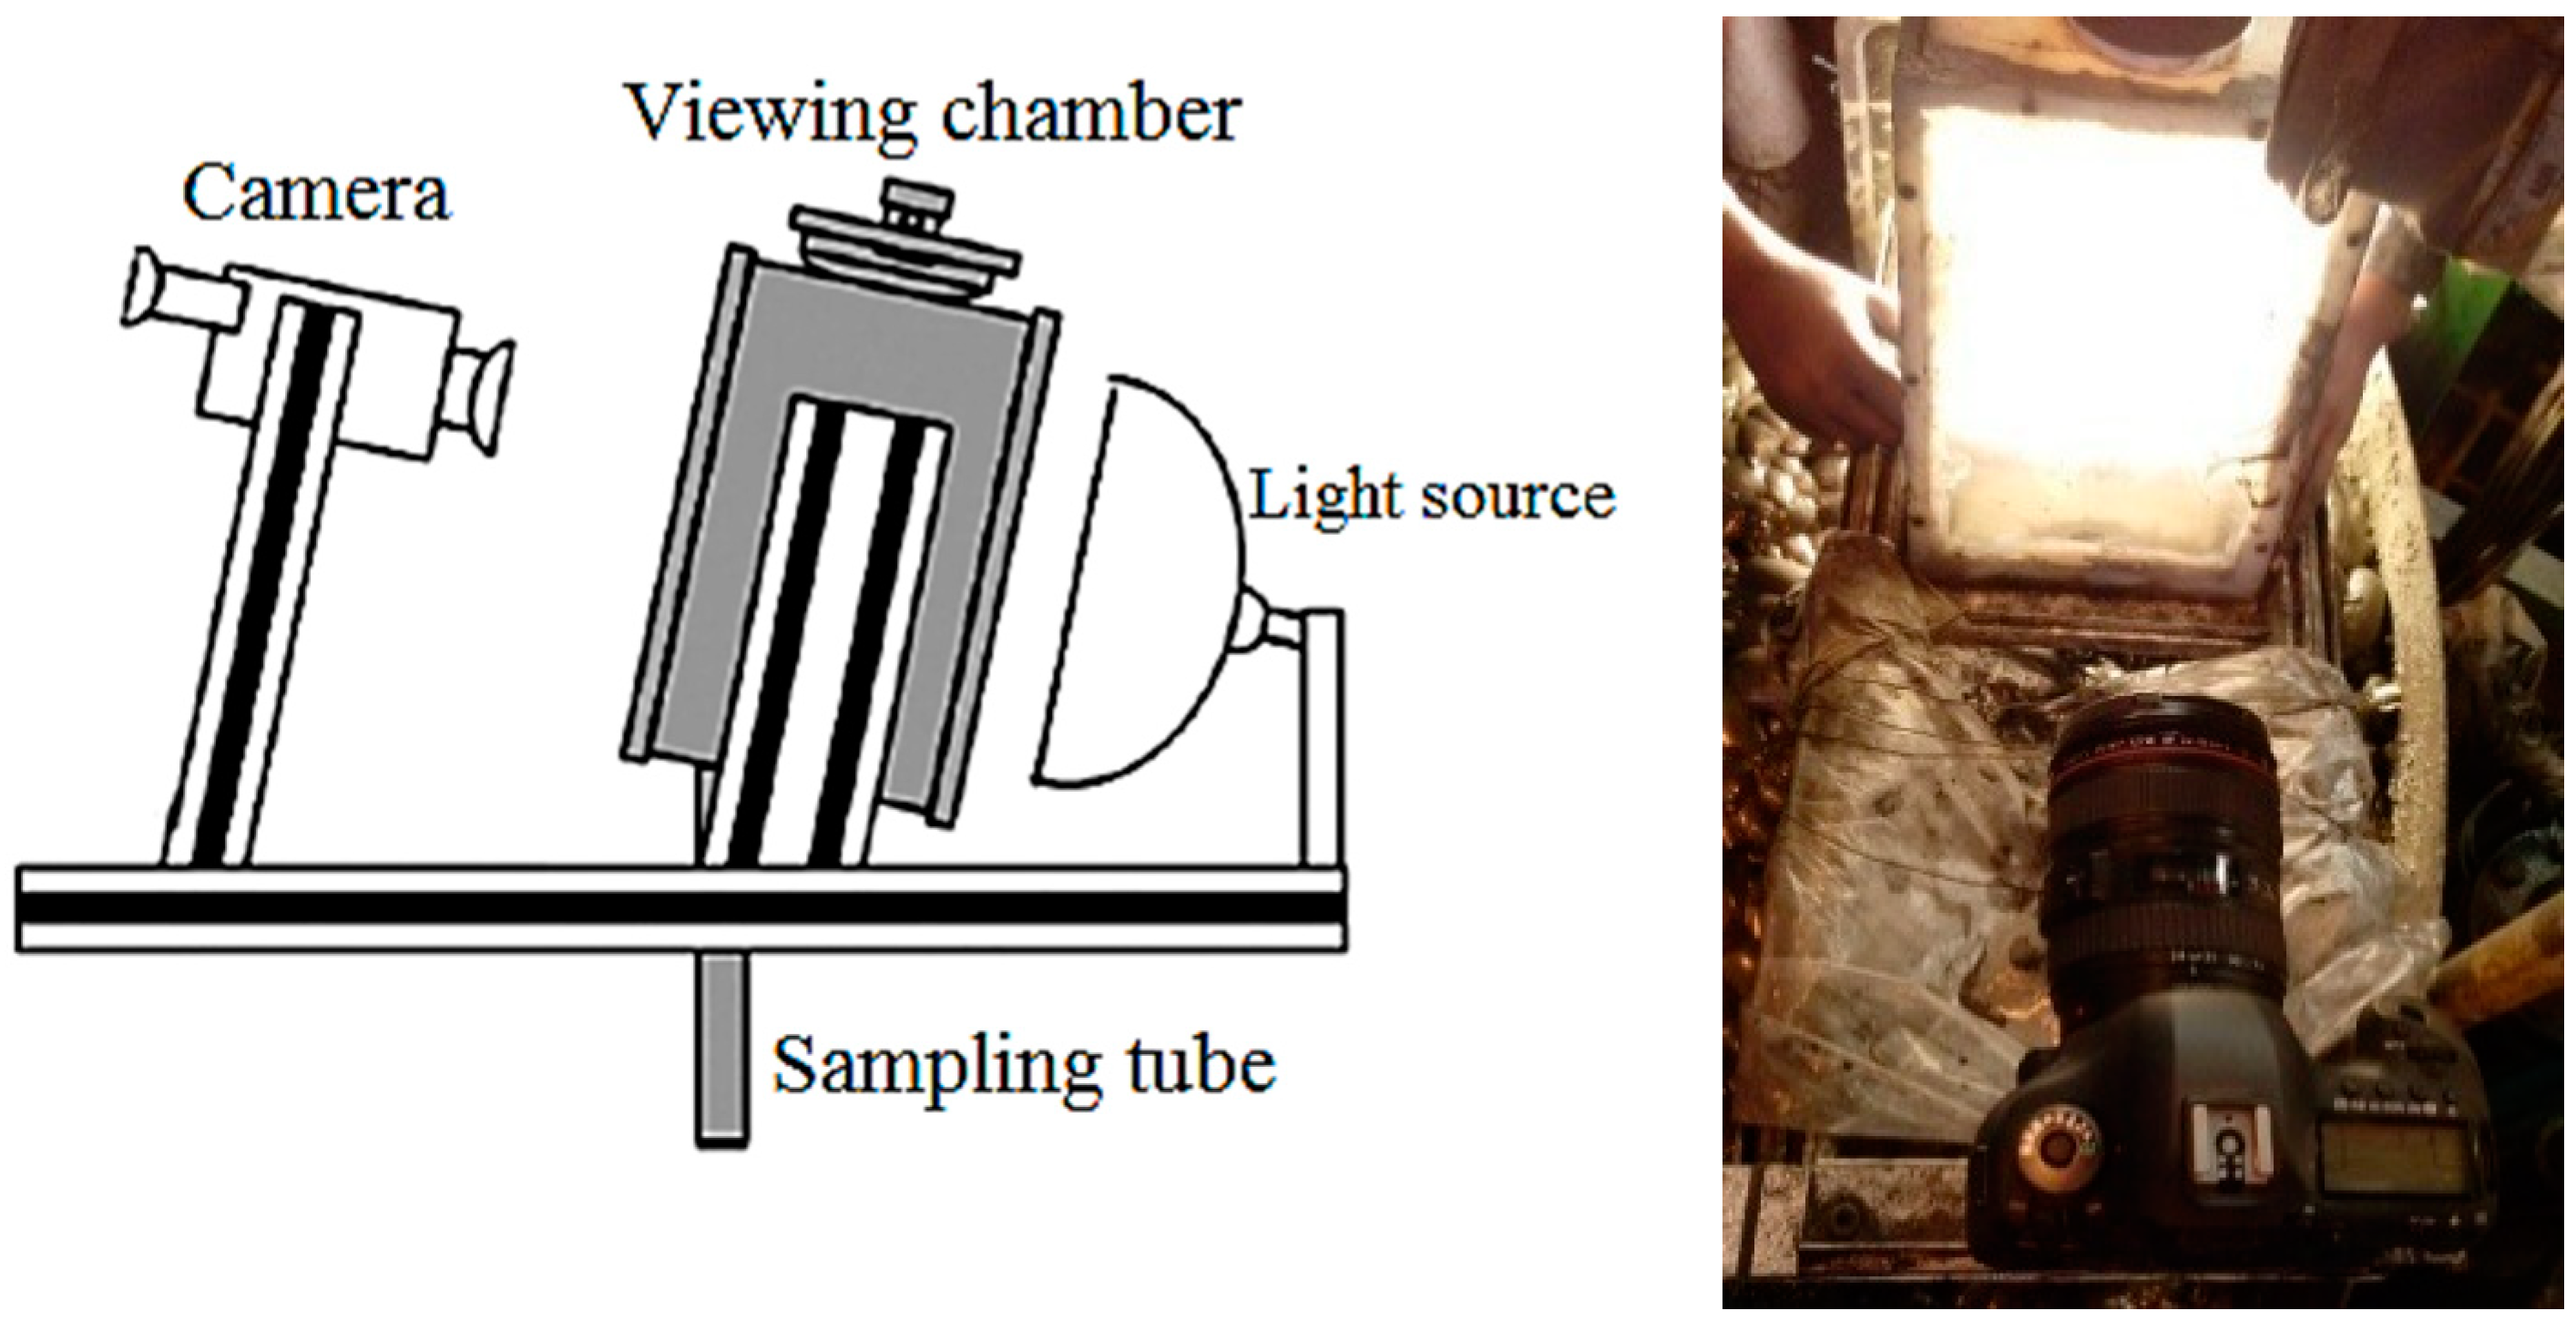
2.2. Measuring the Bubble Diameter
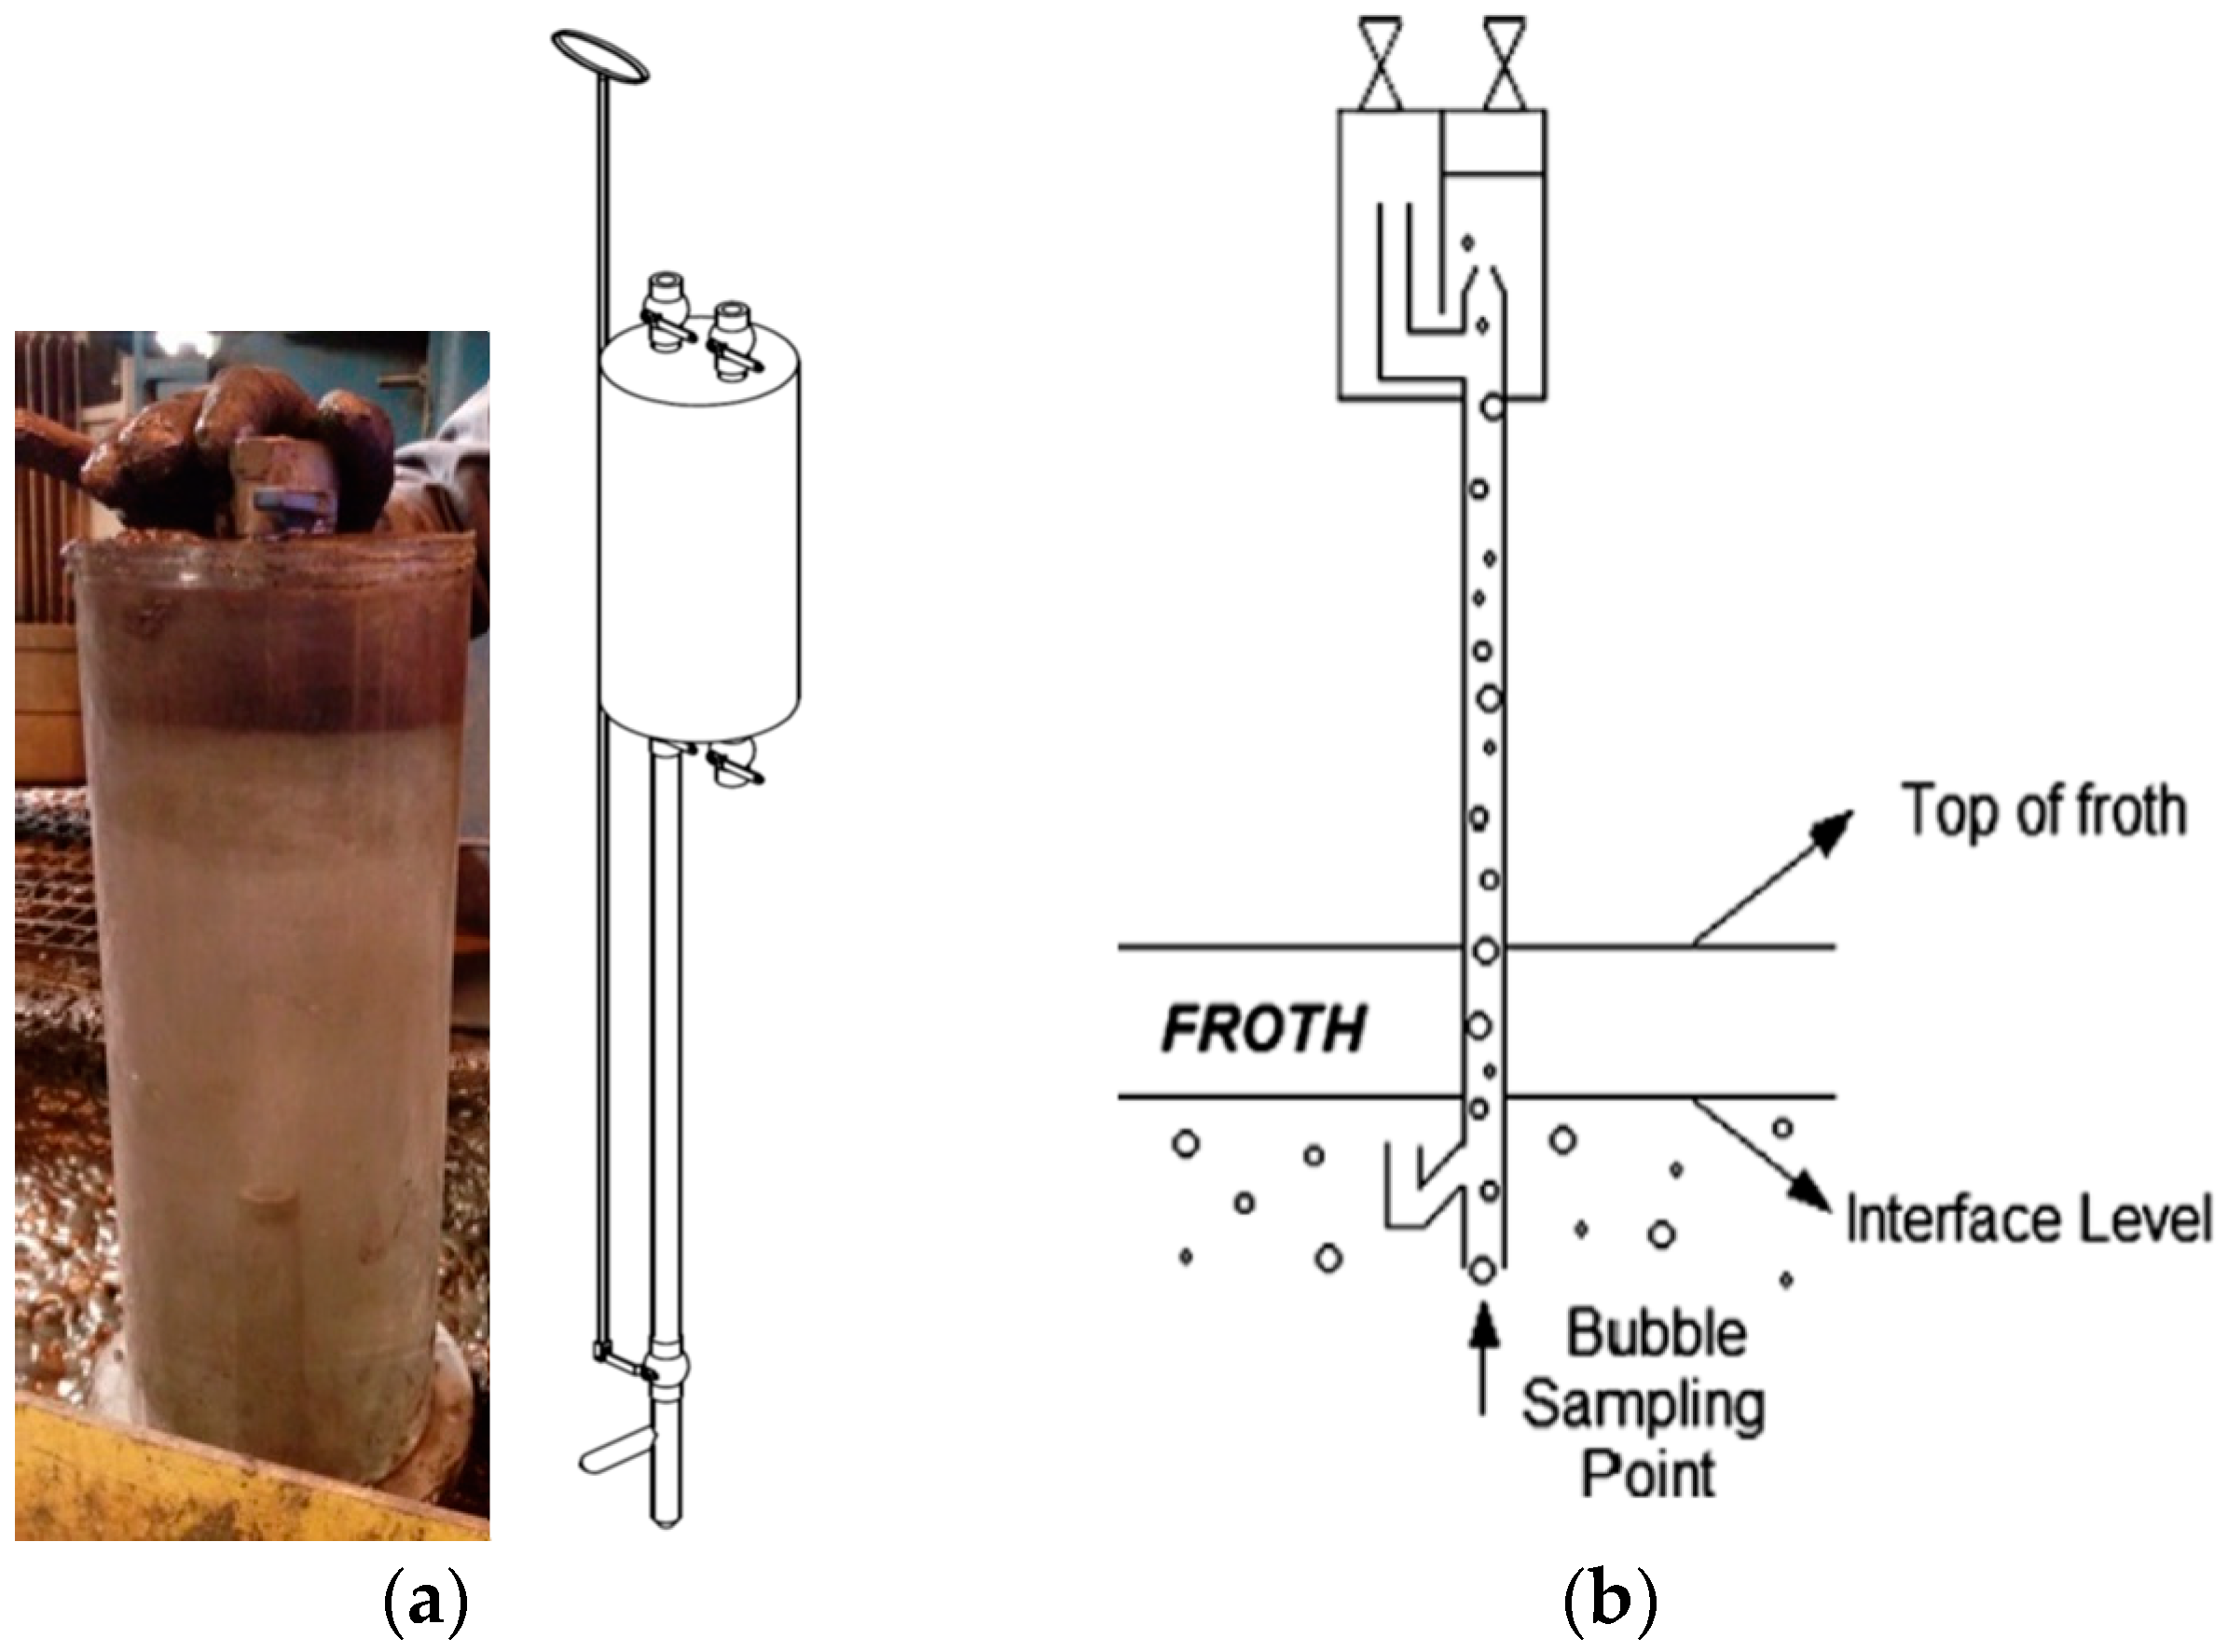
In order to determine the number of particles and bubbles, the diameter of the equivalent bubbles and particles must be given to determine the capacity of the bubble carrier. There are several methods for measuring bubble diameter and coalescence speed. The most common method for determining the bubble size is using visual methods [21,22,23]; electrical resistivity tomography has been also used to measure the bubble diameter and bubble loading [24]. In the visual method, images are analyzed with video processing software [25]. Equation (5) was used to determine the diameter of the equivalent bubble (Sauter mean diameter) or d32b [26]:
d 32 b = i = 1 n d i 3 i = 1 n d i 2
where di is the bubble diameter and n is number of the bubbles.
For this purpose, a device was used as shown in Figure 2, and several pictures were taken using a digital camera. The images were then analyzed using ImageJ software (an open source image analysis available at https://imagej.net), and the Sauter diameters were calculated according to the distribution of the bubble diameters for each test.

2.3. Bubble Loading

In order to determine the bubble carrying capacity, a device was fabricated according to Moyes and Yianatos [11,27,28] (Figure 3). The procedure is such that the tank was initially filled with water, and the nozzle of the device was about 10 cm below the froth–pulp intersection. After a certain time, the air volume and particle mass inside the tank were measured. The equipment must have the following features: (i) the sample of collected bubbles should represent the whole bubbles; (ii) no particle should be removed from the bubble when it moves upwards in the riser; (iii) the hydrodynamic characteristics of the collector machine should ensure that the particles or carrier gas do not appear and also prevent the collection of entrainment particles; and (iv) it should be easily used in an industrial environment.

2.4. Measurement of the Diameter and Density of Particles

The density of collected particles was calculated by assuming that they are spherical, and the number of particles in each dimensional range was determined. The Sauter diameter was estimated according to the experimental conditions.

2.5. Rate of Mass Transfer of Particles to the Froth Phase

The rate of mass transfer of particles to the froth phase was calculated using Equation (6):
B = λ B Q g / 1000
where B is the mass transfer rate of the connected particles to the bubbles (ton/h), and Qg is the aeration rate (m3/h).

2.6. Statistical Analysis

A two-level factorial design [29,30] was applied to study the effect of flotation parameters on the bubble loading. The analysis reveals the significance of each factor, as well as if there is any interaction between these factors [30]. The conditions and specifications of the flotation feed for each test are given in Table 1.

3. Results and Discussion

Based on the test conditions, the bubble loading (λB), bubble diameter (db), particle diameter (dp), and solids density (ρp) were obtained. The fraction of the bubble surface covered by the particles (K), the mass of solid particles carried by a bubble (mbp), as well as the number of bubbles entered in the tank per minute (nb) were calculated as shown in Table 2. Sb is the bubble superficial surface (s−1).

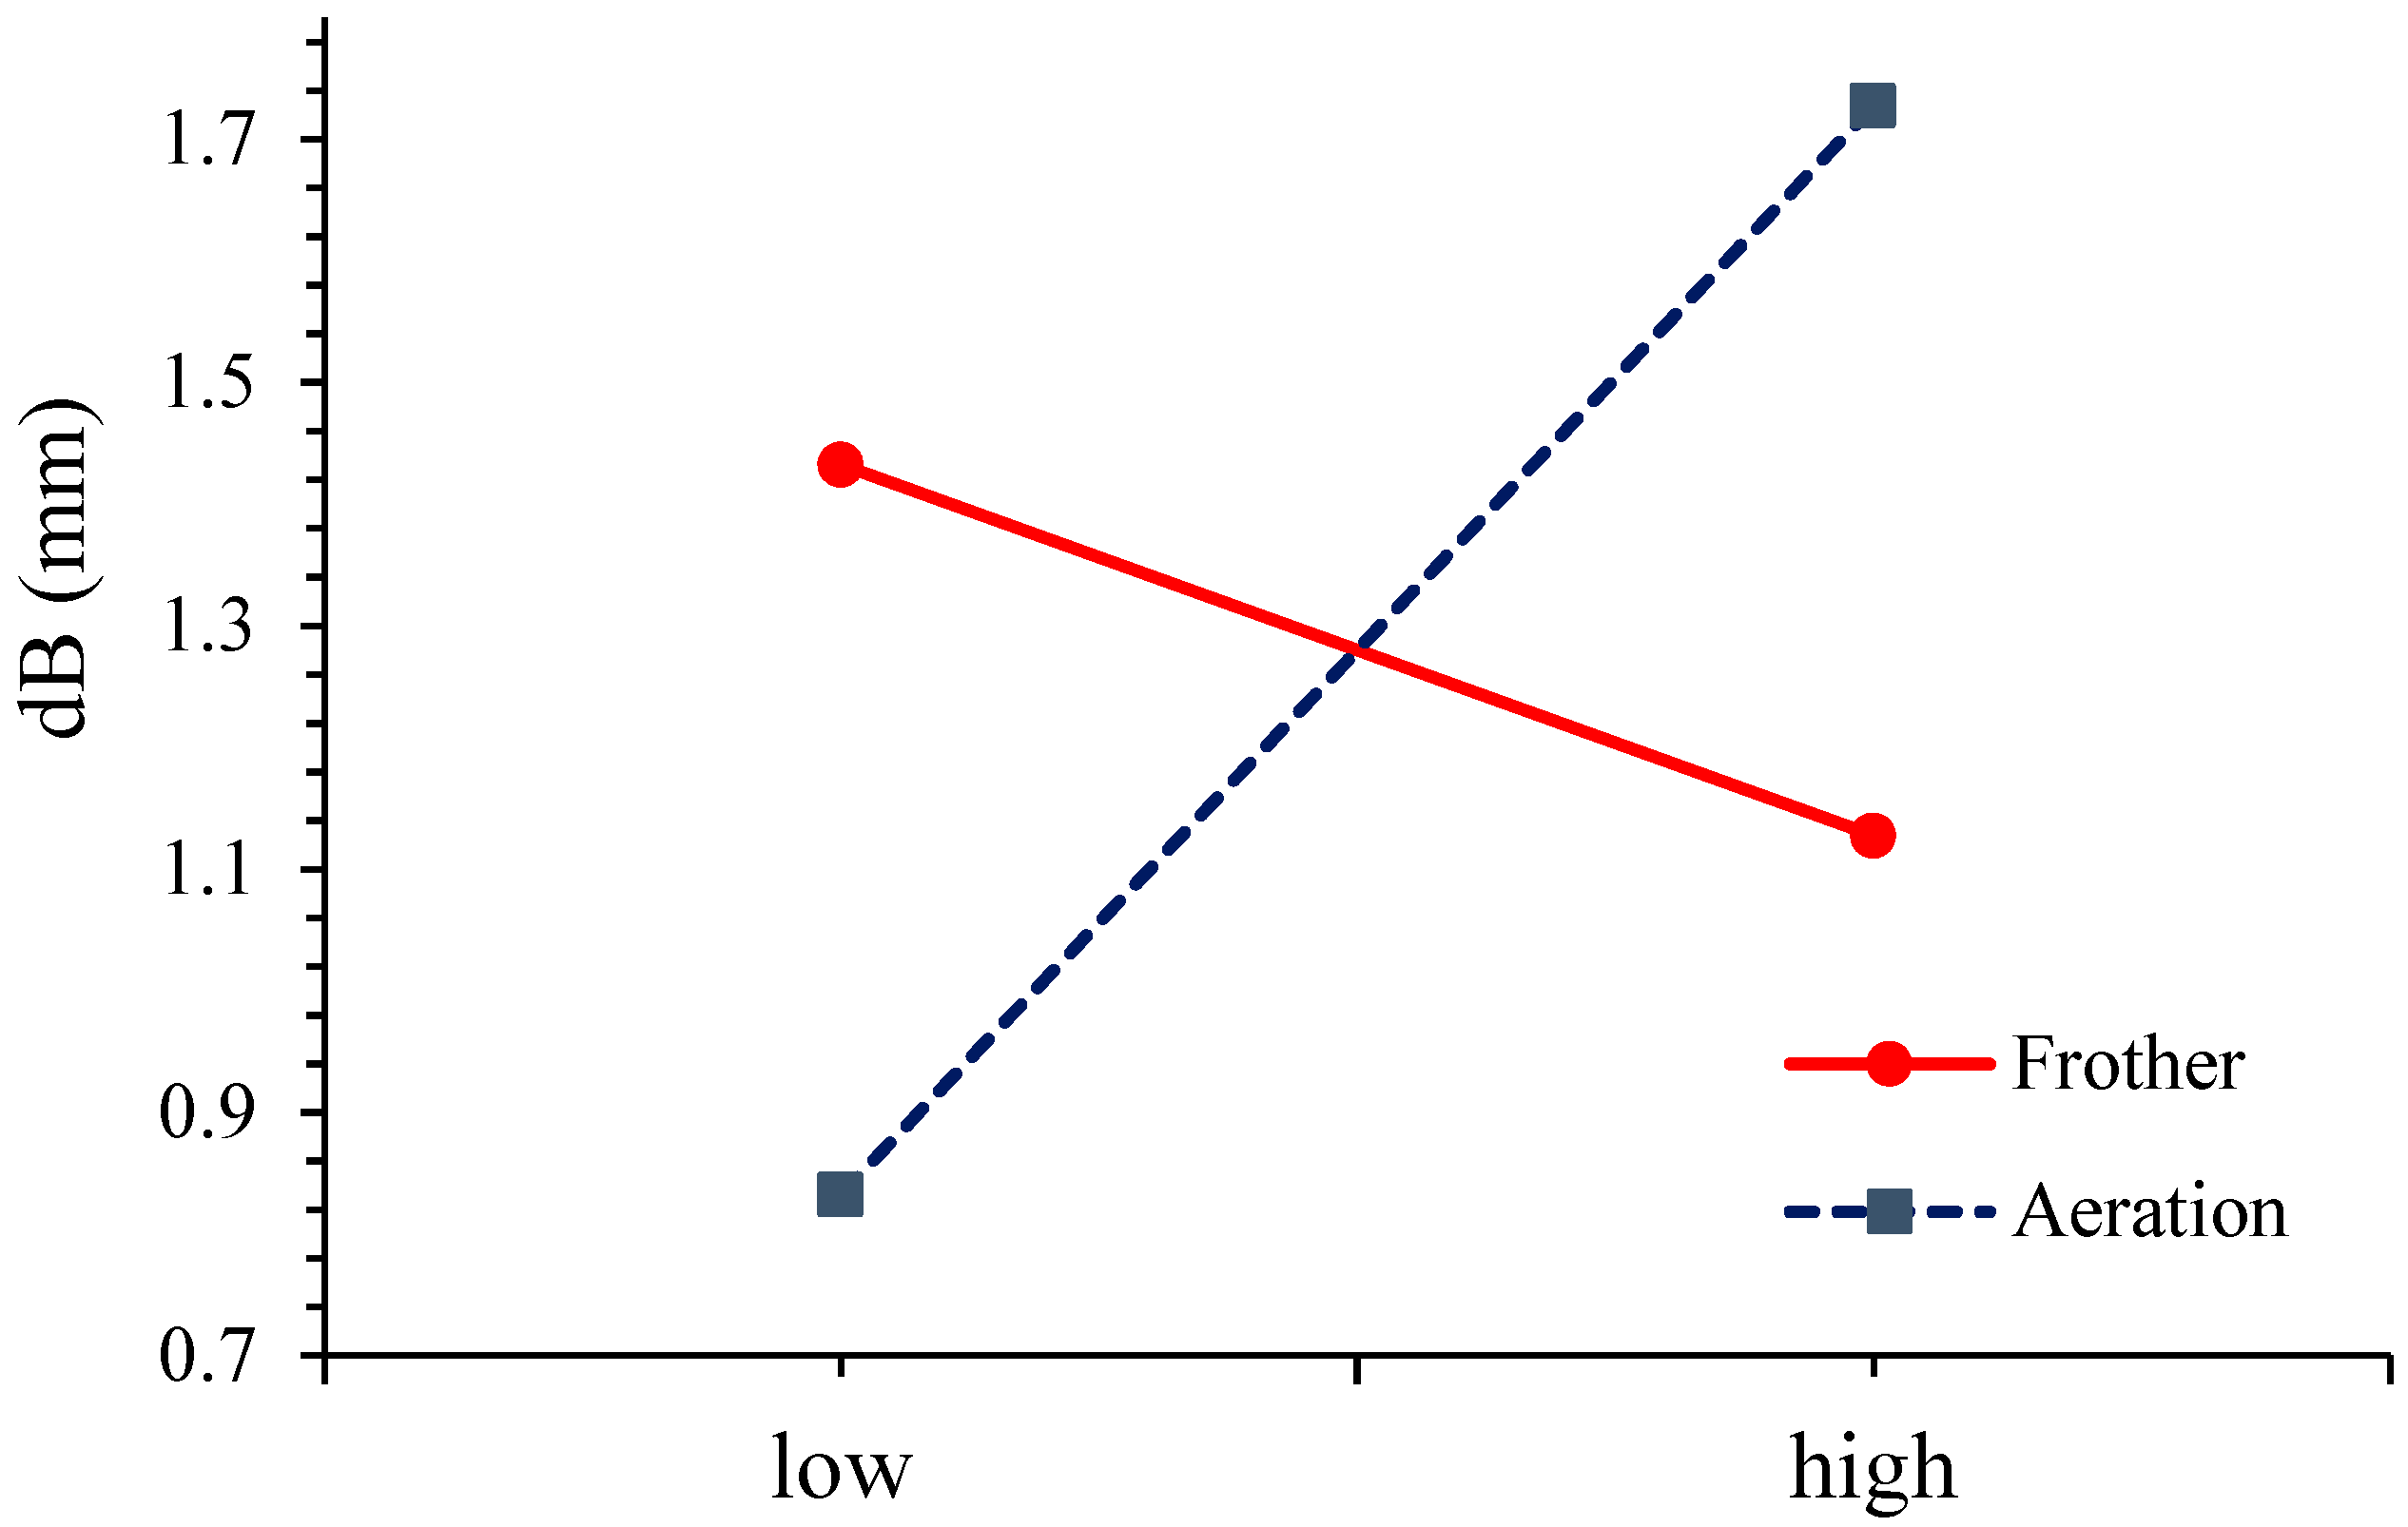
3.1. The Effect of Parameters on the Bubble Diameter

The P value for each factor was low, and the correlation coefficient was desirable. When the aeration rate rises from 45 m3/h to 146 m3/h, the bubble diameter was between 0.8–1.7 mm, and when the frother dosage was doubled, the bubble diameter decreased by 21%. Therefore, increasing the frother dosage resulted in reducing the bubble diameter (Figure 4). A two-level factorial design method was used to evaluate the correlation throughout this study, as explained earlier in this paper.
Increasing the aeration rate results in an enhanced gas superficial velocity, which in turn causes the bubble diameter to increase [18,22]. In fact, the frother reduces the surface tension, and consequently, it reduces the bubble coalescence, which can be a reason for the reduction of the bubble size in the lower pulp–froth interface in the current study [25].

3.2. Effect of Operational Parameters on the Bubble Superficial Surface

The statistical results show that the bubble superficial surface per cell surface increases by increasing the frother dosage or aeration rate (Figure 5). The maximum bubble superficial surface for the aeration rate of 146 m3/h and frother dosage of 150 mL/min are 41.8 s−1 and 51.3 s−1, for Blocks 1 and 2, respectively. Decreasing the aeration or increasing the frother dosage both reduces the bubble diameter, resulting in a higher bubble superficial surface [31]. A difference of almost 10 s−1 in the bubble surface area flux as a result of changing the froth depth is observed. The reason for this difference is not clear, but it is known that the bubble diameter is inversely related to the pressure. Therefore, in high froth depth, the pressure is probably higher and consequently, the bubble diameter reduces. This needs to be investigated further.

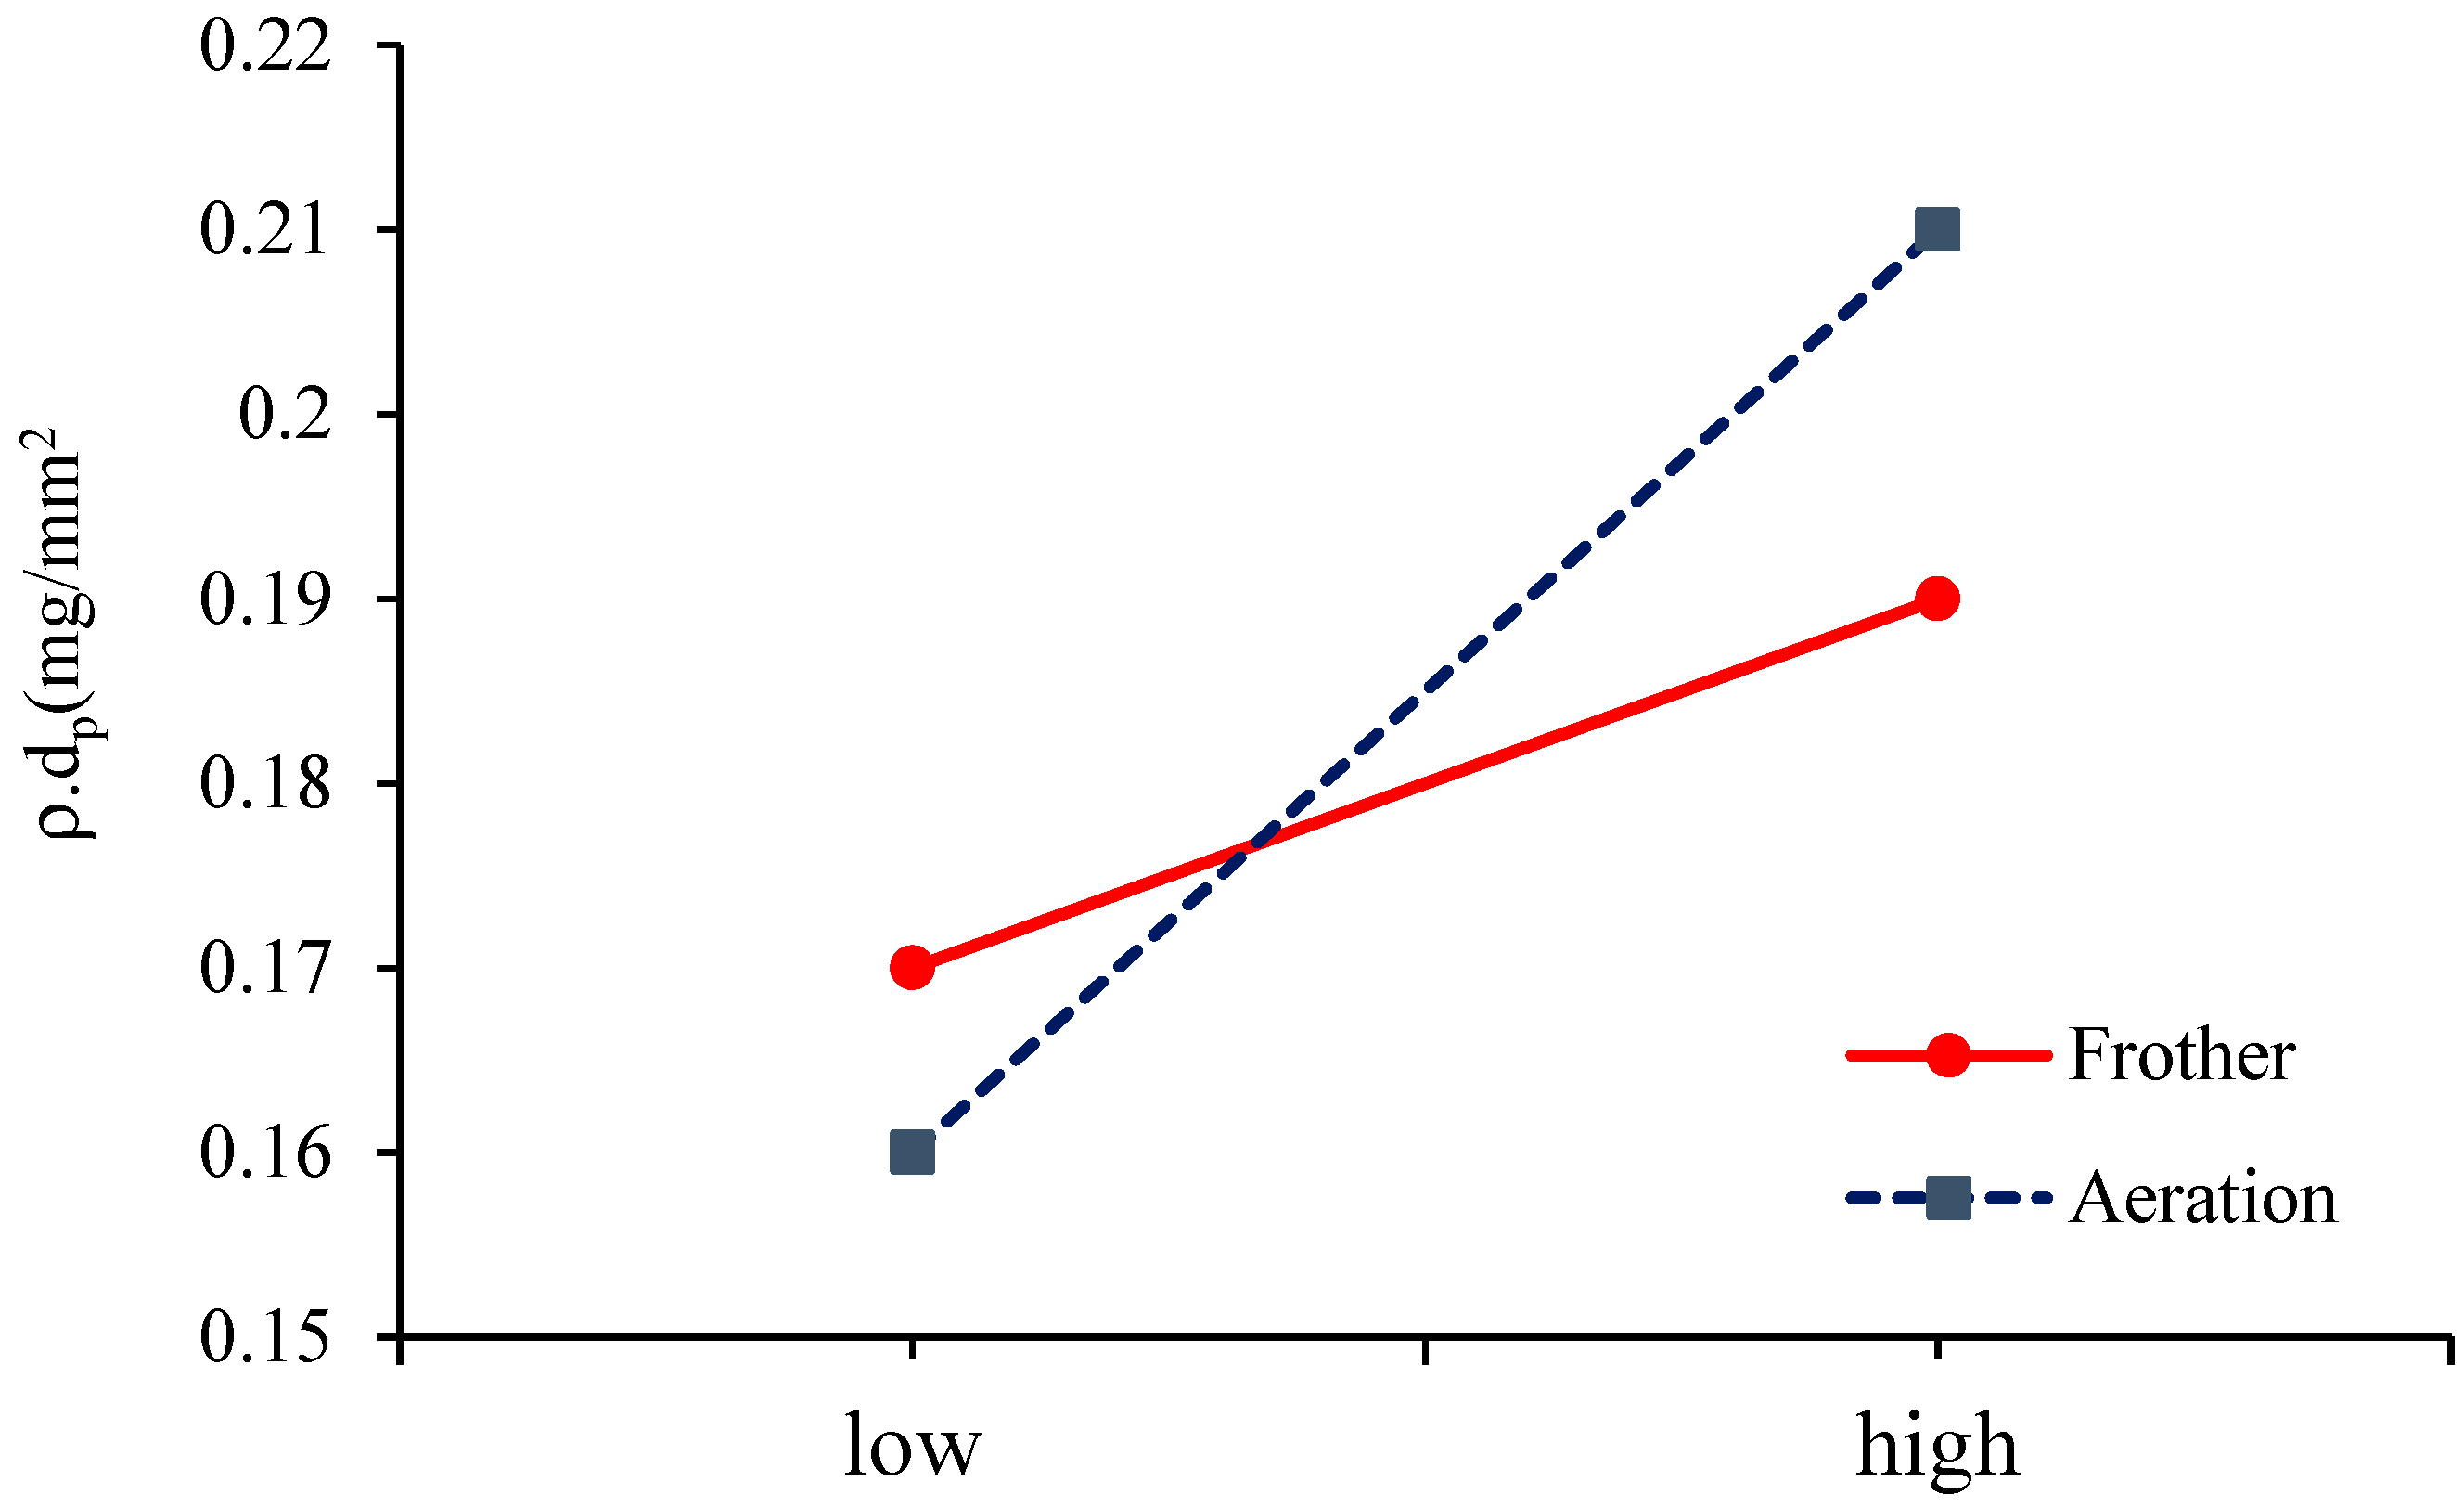
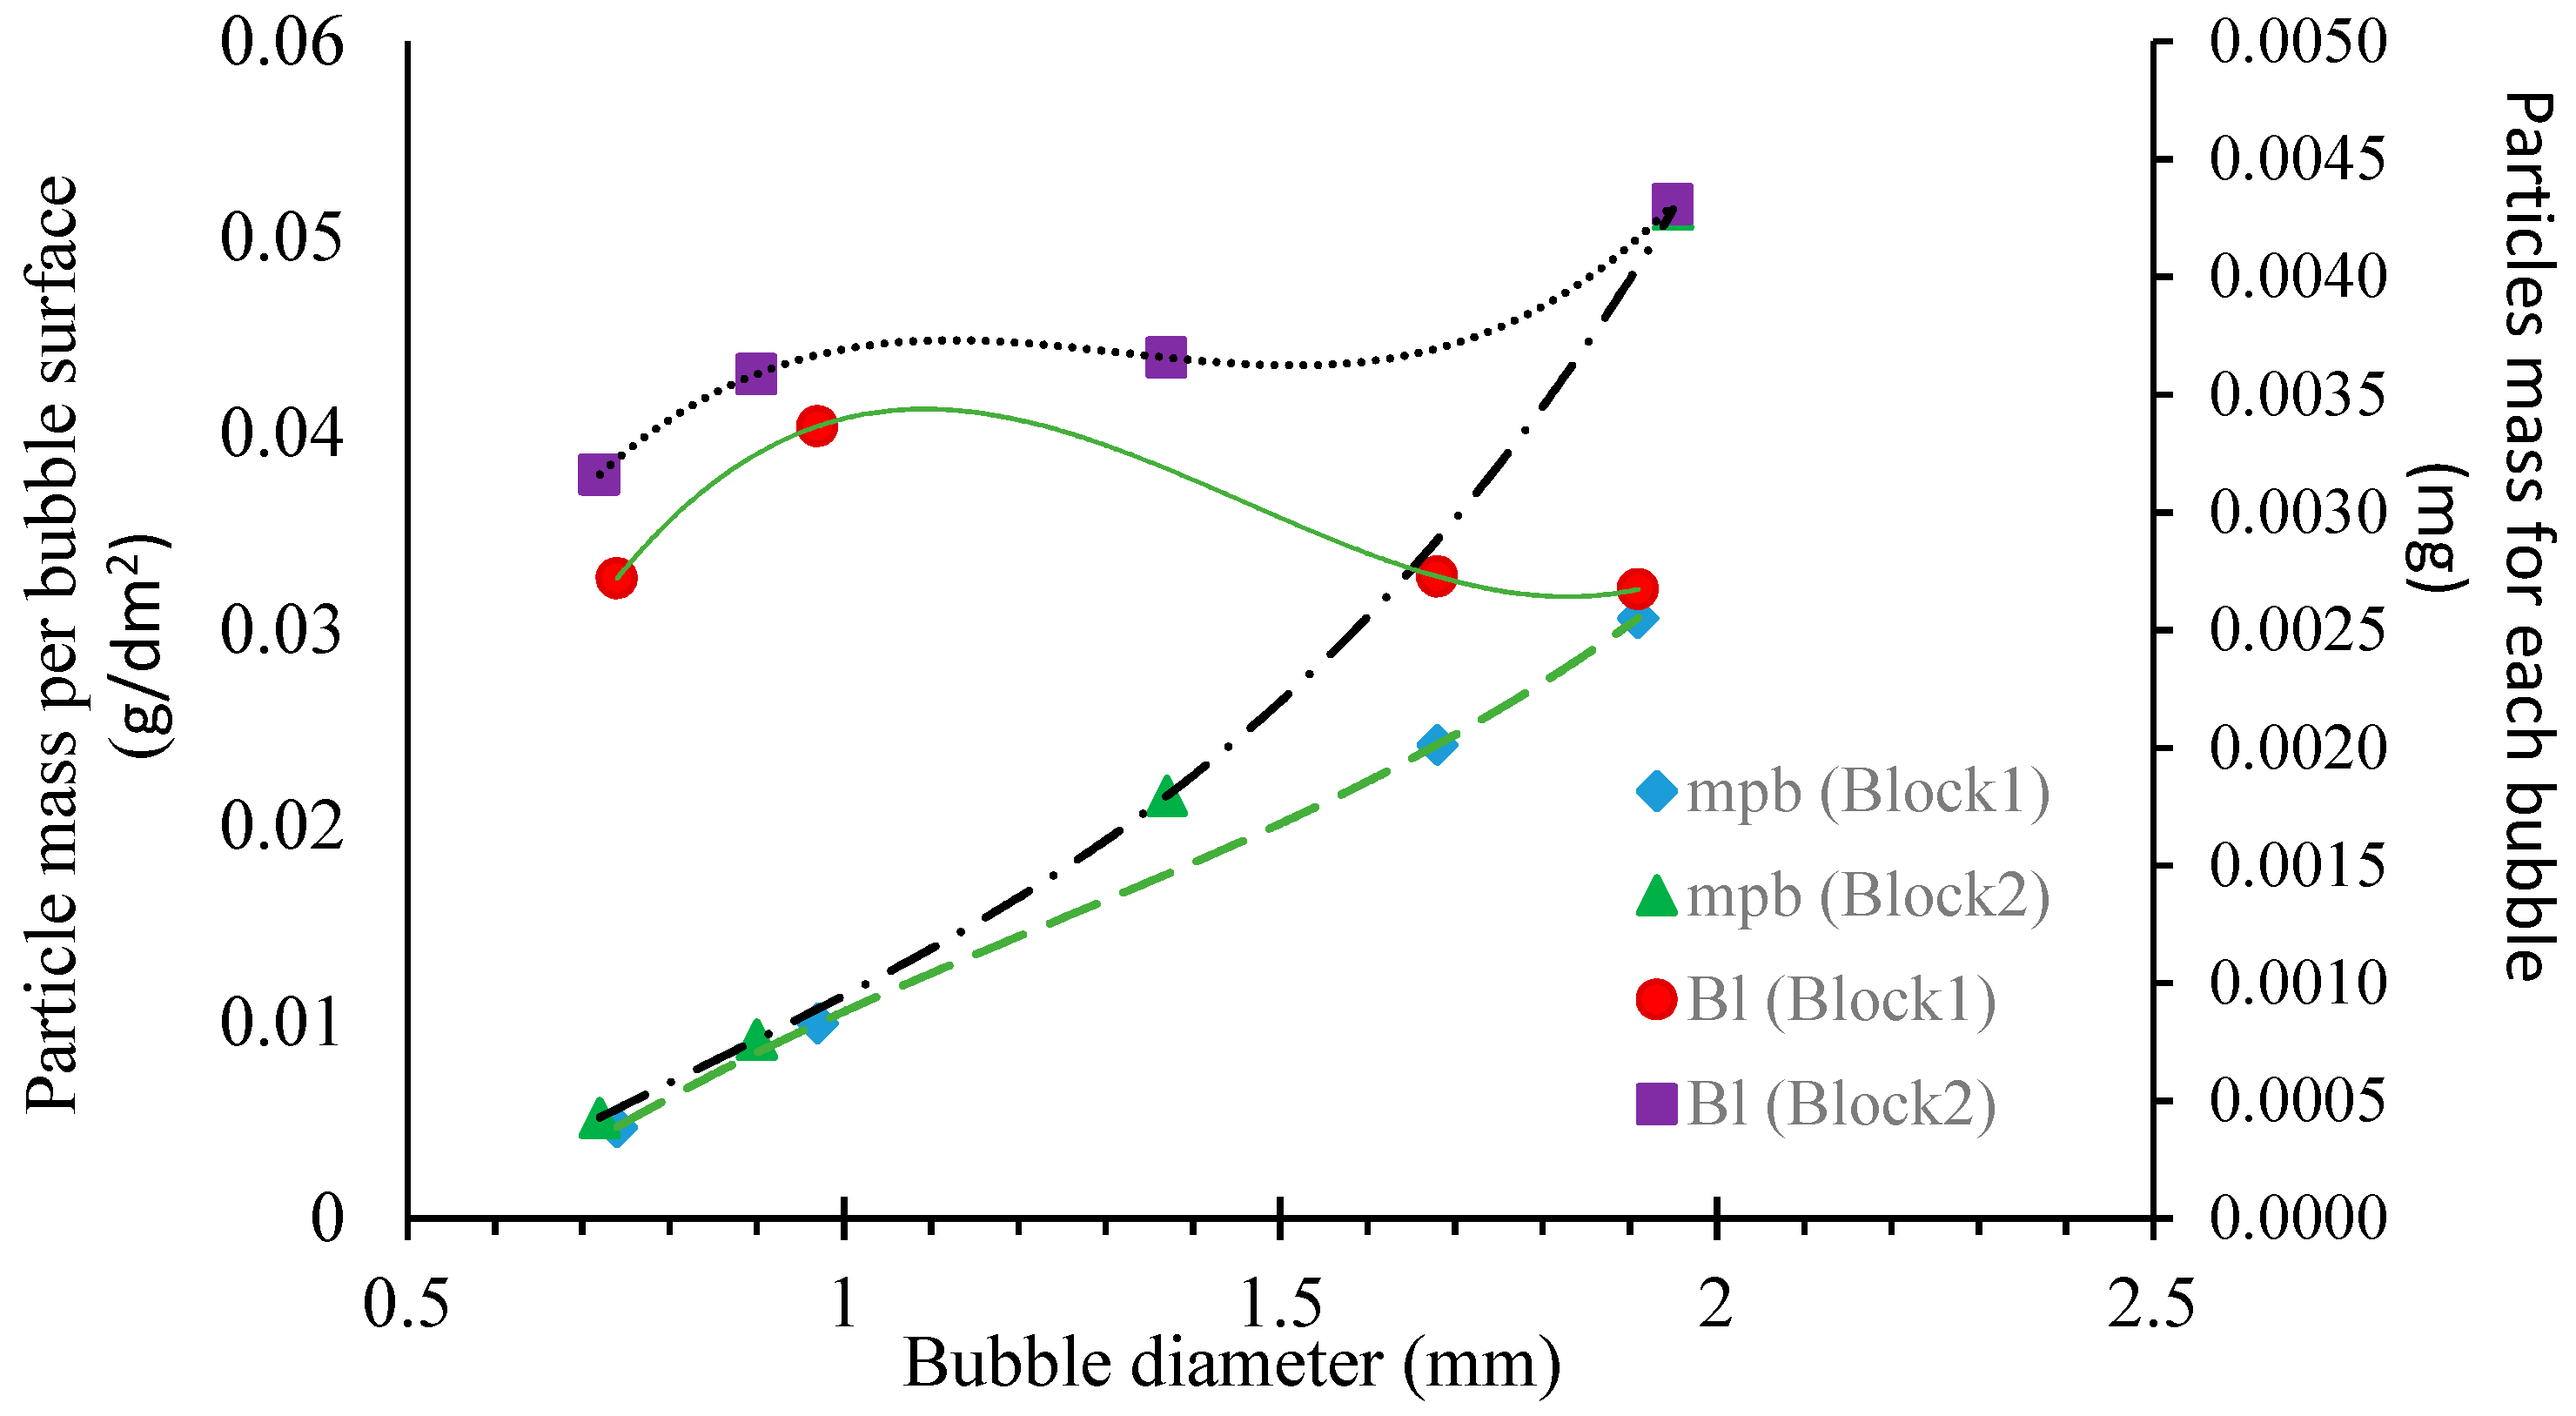
3.3. The Diameter and Density of the Solid Particles
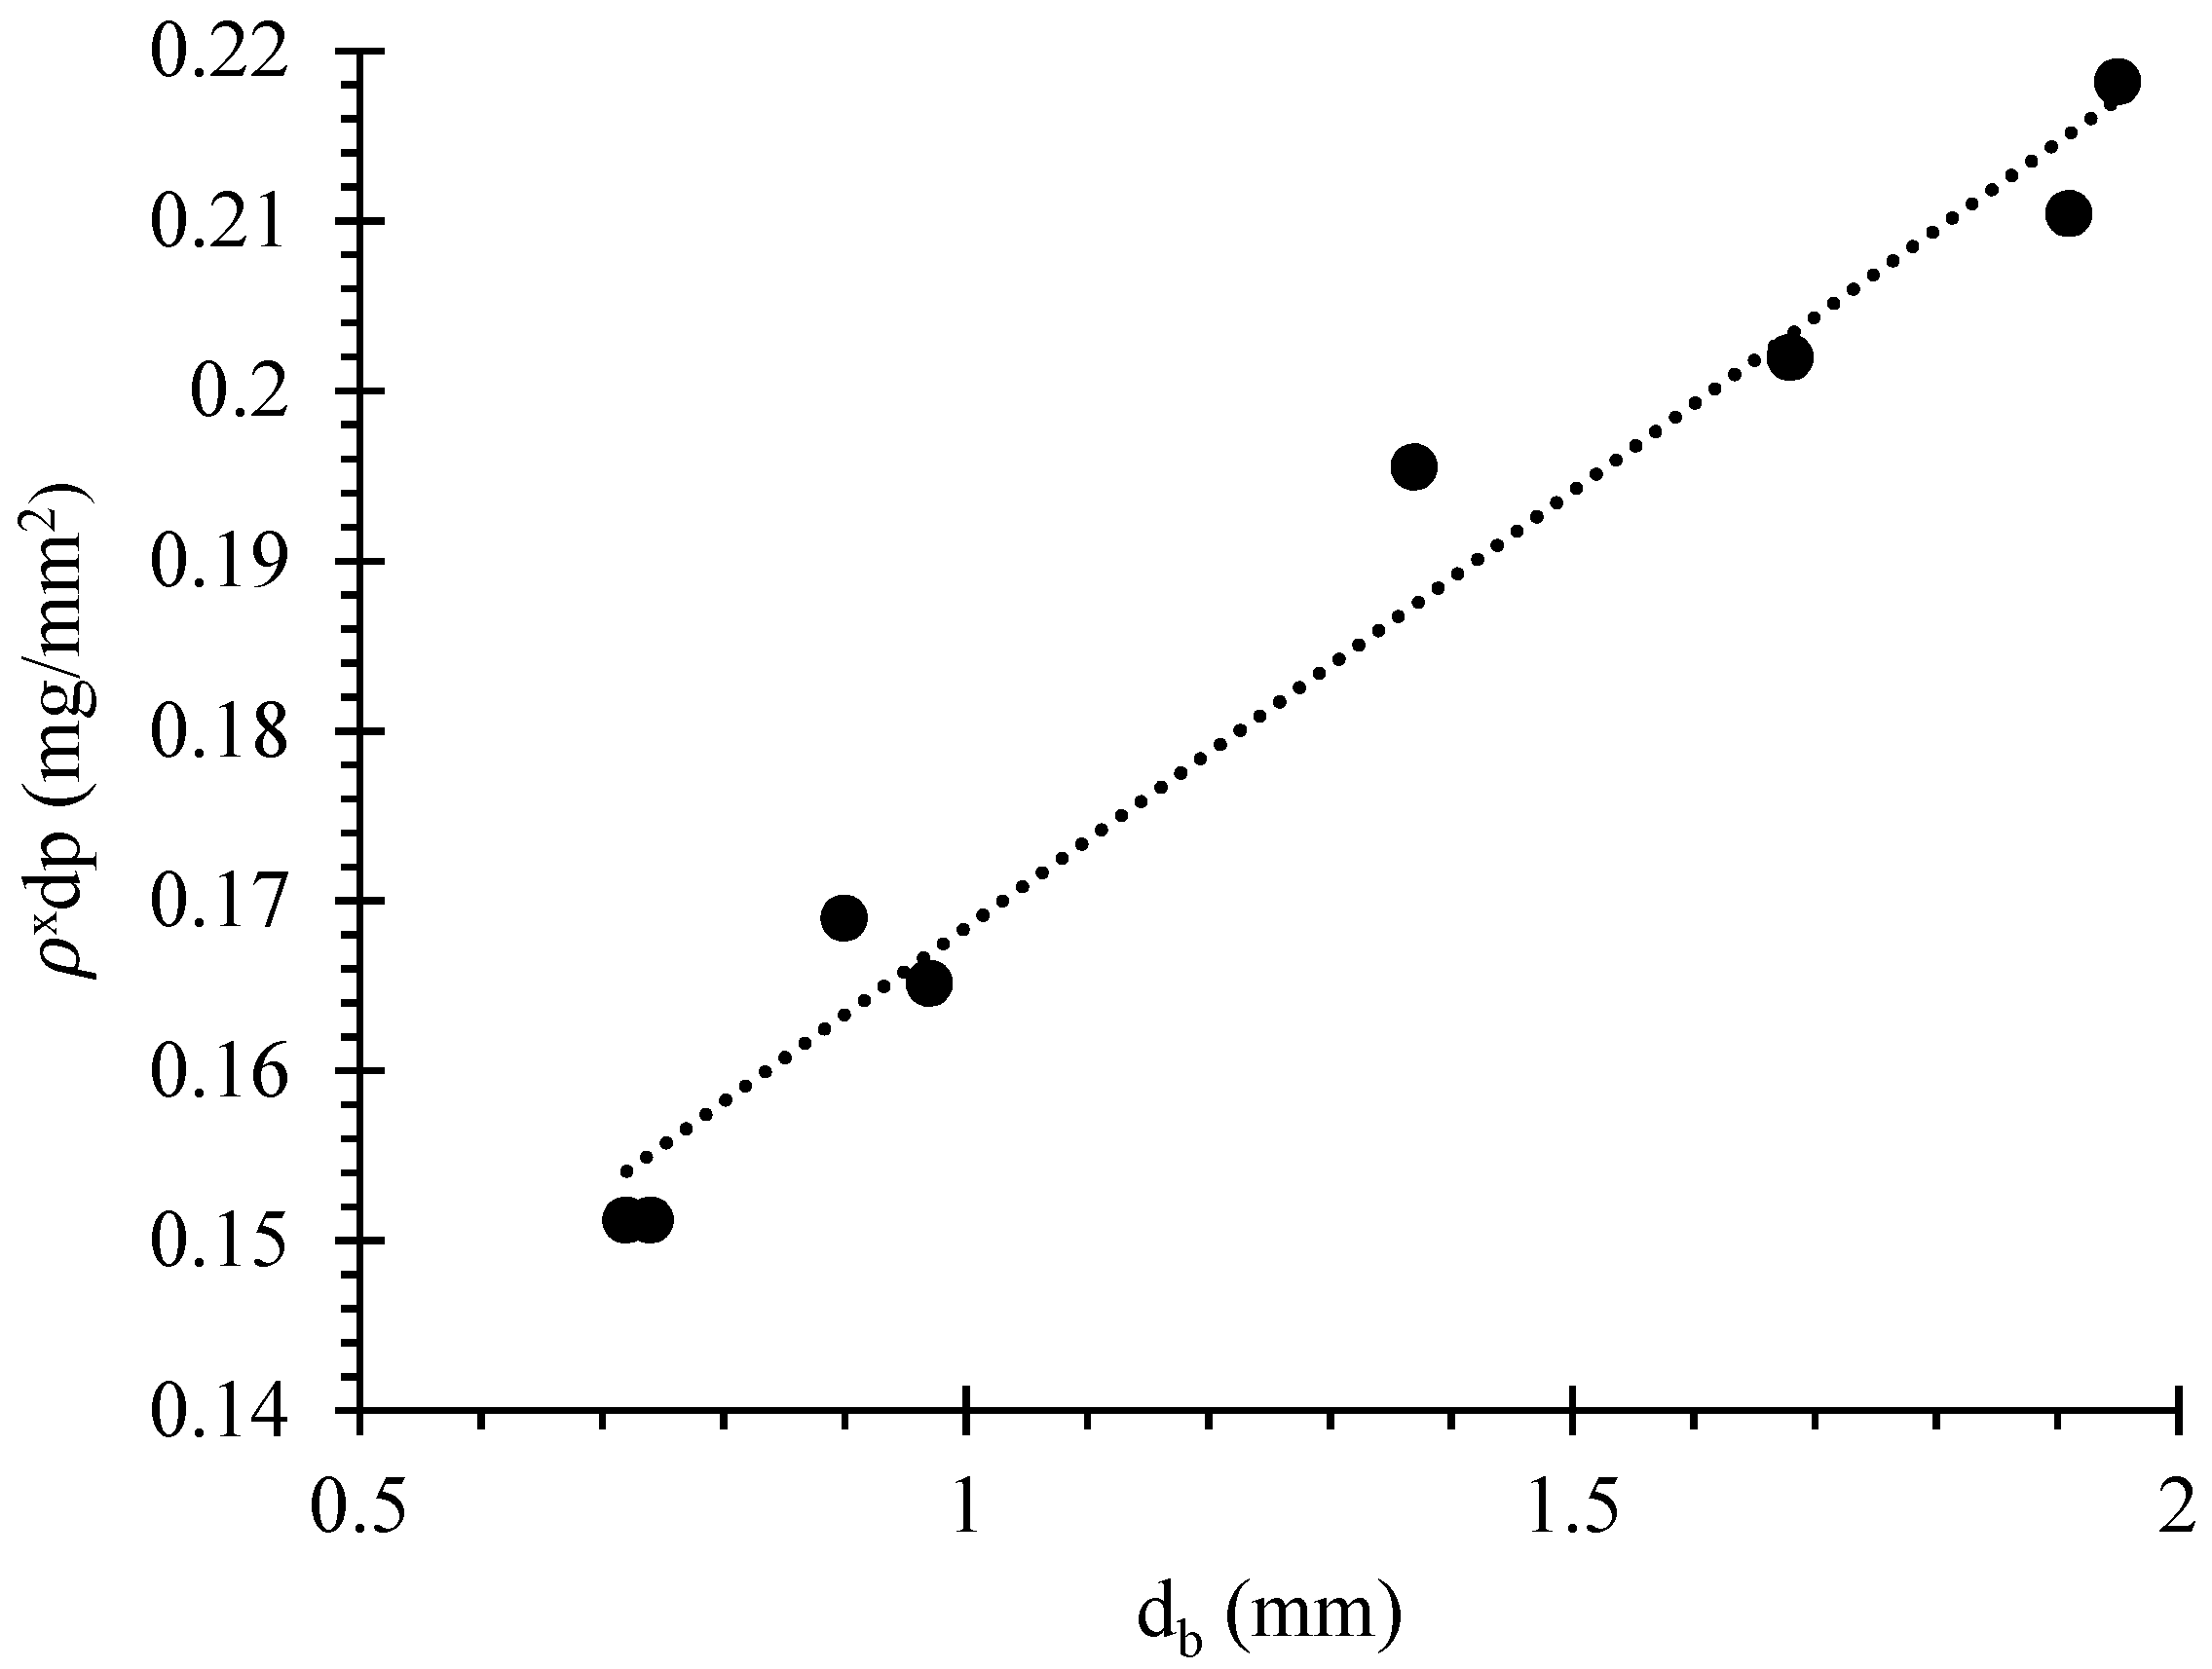
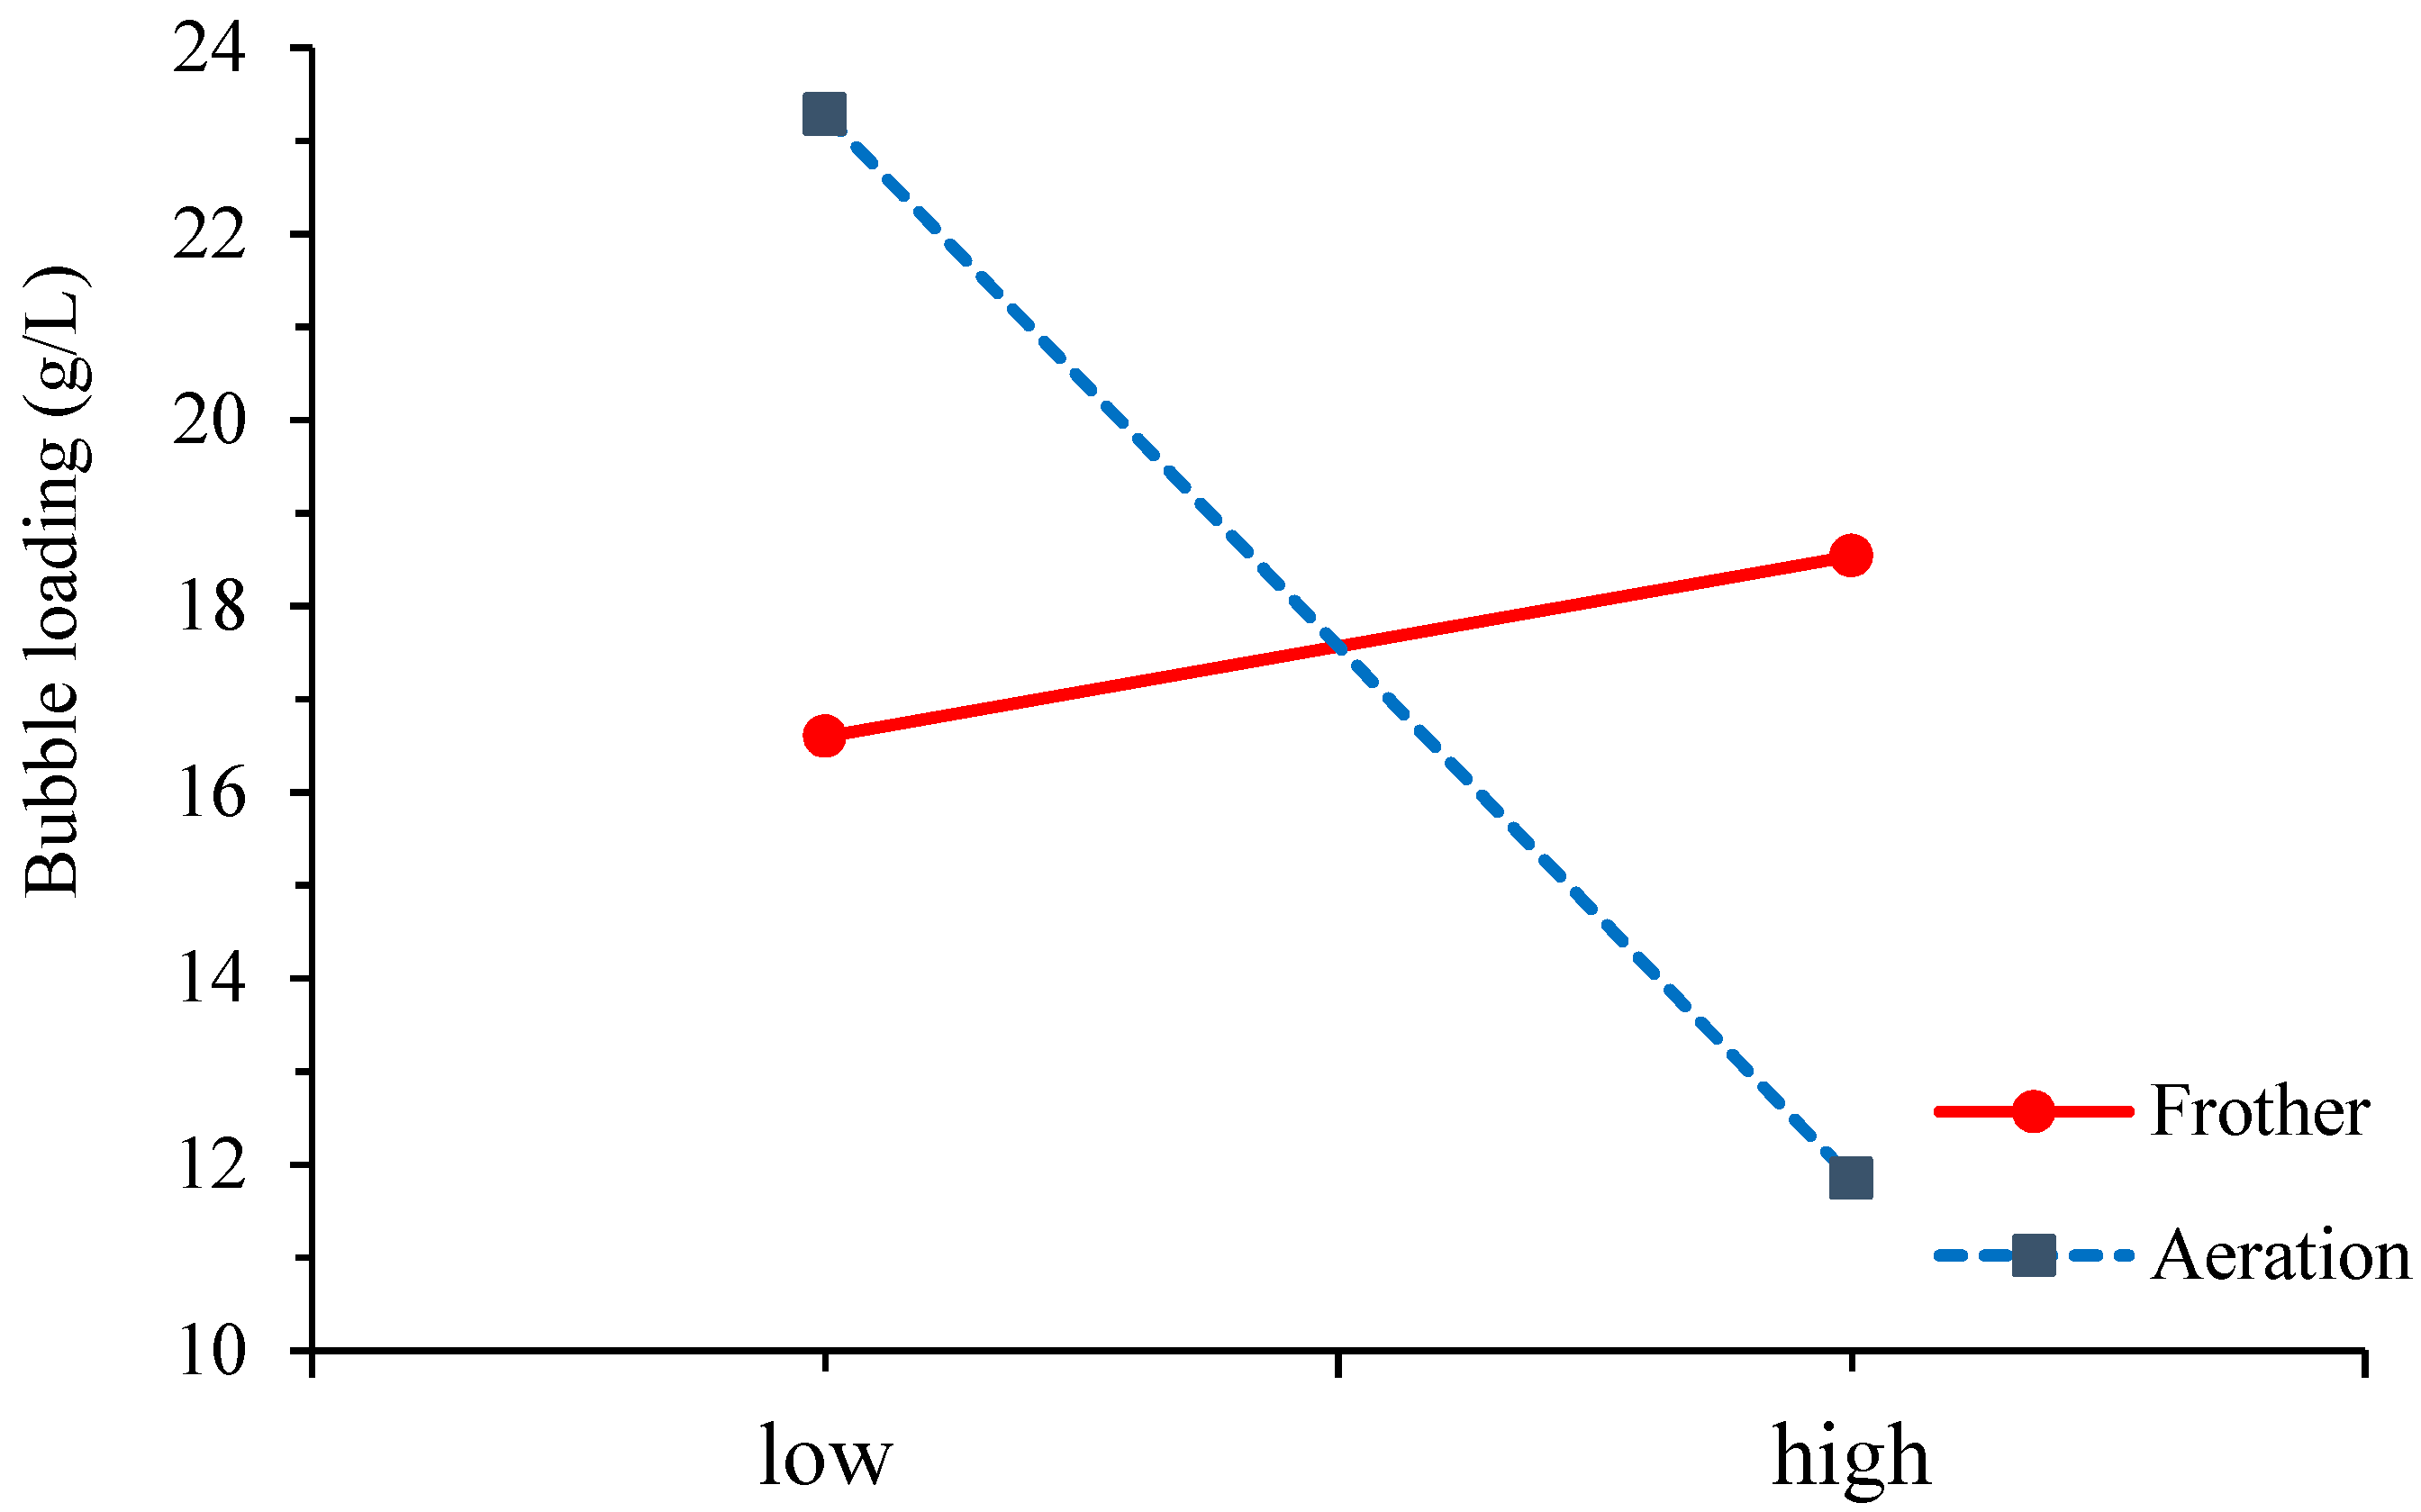
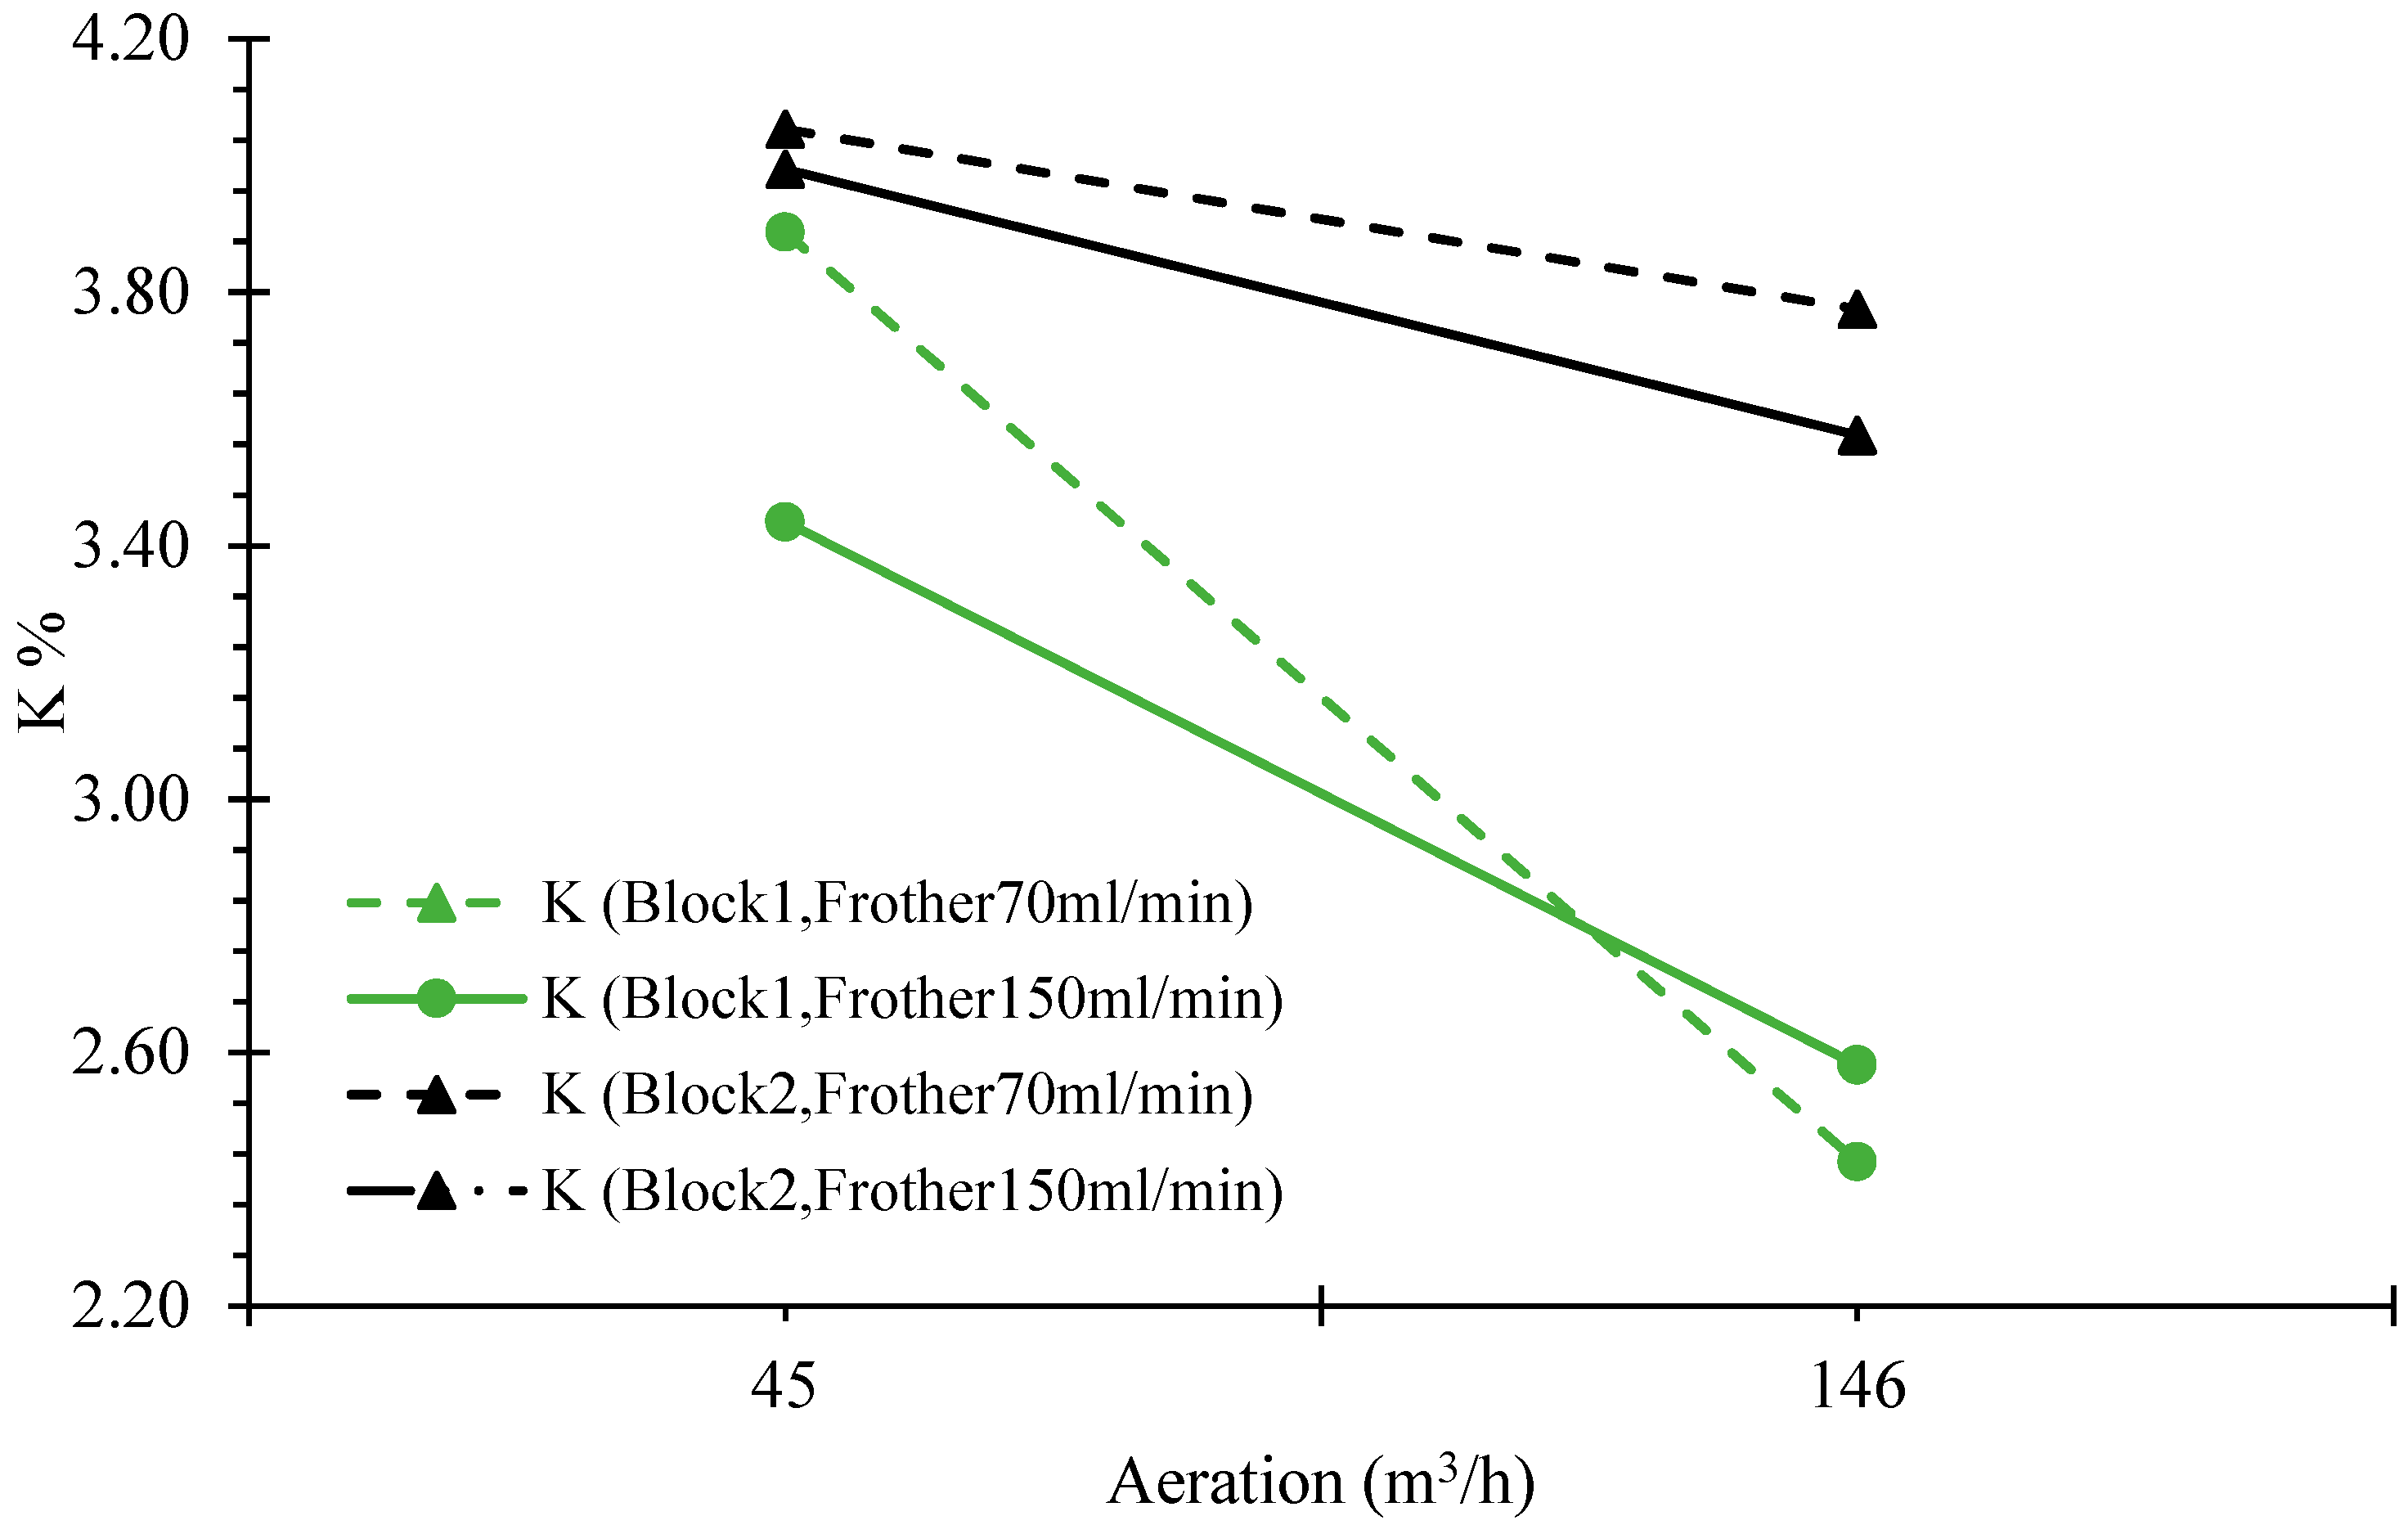
The results of variance analysis (ANOVA) show that the aeration rate and frother dosage have a logical relation with the solid particles’ diameter and density. According to the results (Figure 6), increasing the aeration rate, as well as decreasing the frother dosage, both result in enhancing the bubble size. It should be noted that when the bubble diameter increases from 0.75 mm to about 2 mm, the density also increases from 0.15 to 0.22 mg/mm2, so the bubble diameter is directly related to the diameter and density of the transported particles, as shown in Figure 7.

3.4. Bubble Loading

According to the ANOVA results, the effect of tested parameters in the confidence level of 95% is statistically significant. The results indicated that the bubble loading decreases when increasing the aeration rate, but it increases when increasing the frother dosage (Figure 8). Regarding the aeration rate, it can be seen that increasing the aeration rate results in decreasing the bubble surface coverage (Figure 9). Therefore, increasing the aeration rate leads to decreasing the bubble loading.
Moreover, Figure 9 shows that by increasing the aeration rate and frother dosage at high froth depths, the f bubble surface coverage only slightly changes. This may be due to the drop back phenomenon in the high-froth depths (Block 2), as the reattachment of particles to the bubble increases [3] and consequently, the bubble surface coverage slightly changes.
Figure 10 shows that increasing bubble diameter increases the mass of particles attached to the bubbles, but the ratio of the weight of these particles to the bubble surface area does not necessarily increase. However, for the same particle size, the active surface area of large bubbles that allows the particles to attach is more than that of the small bubbles [32].

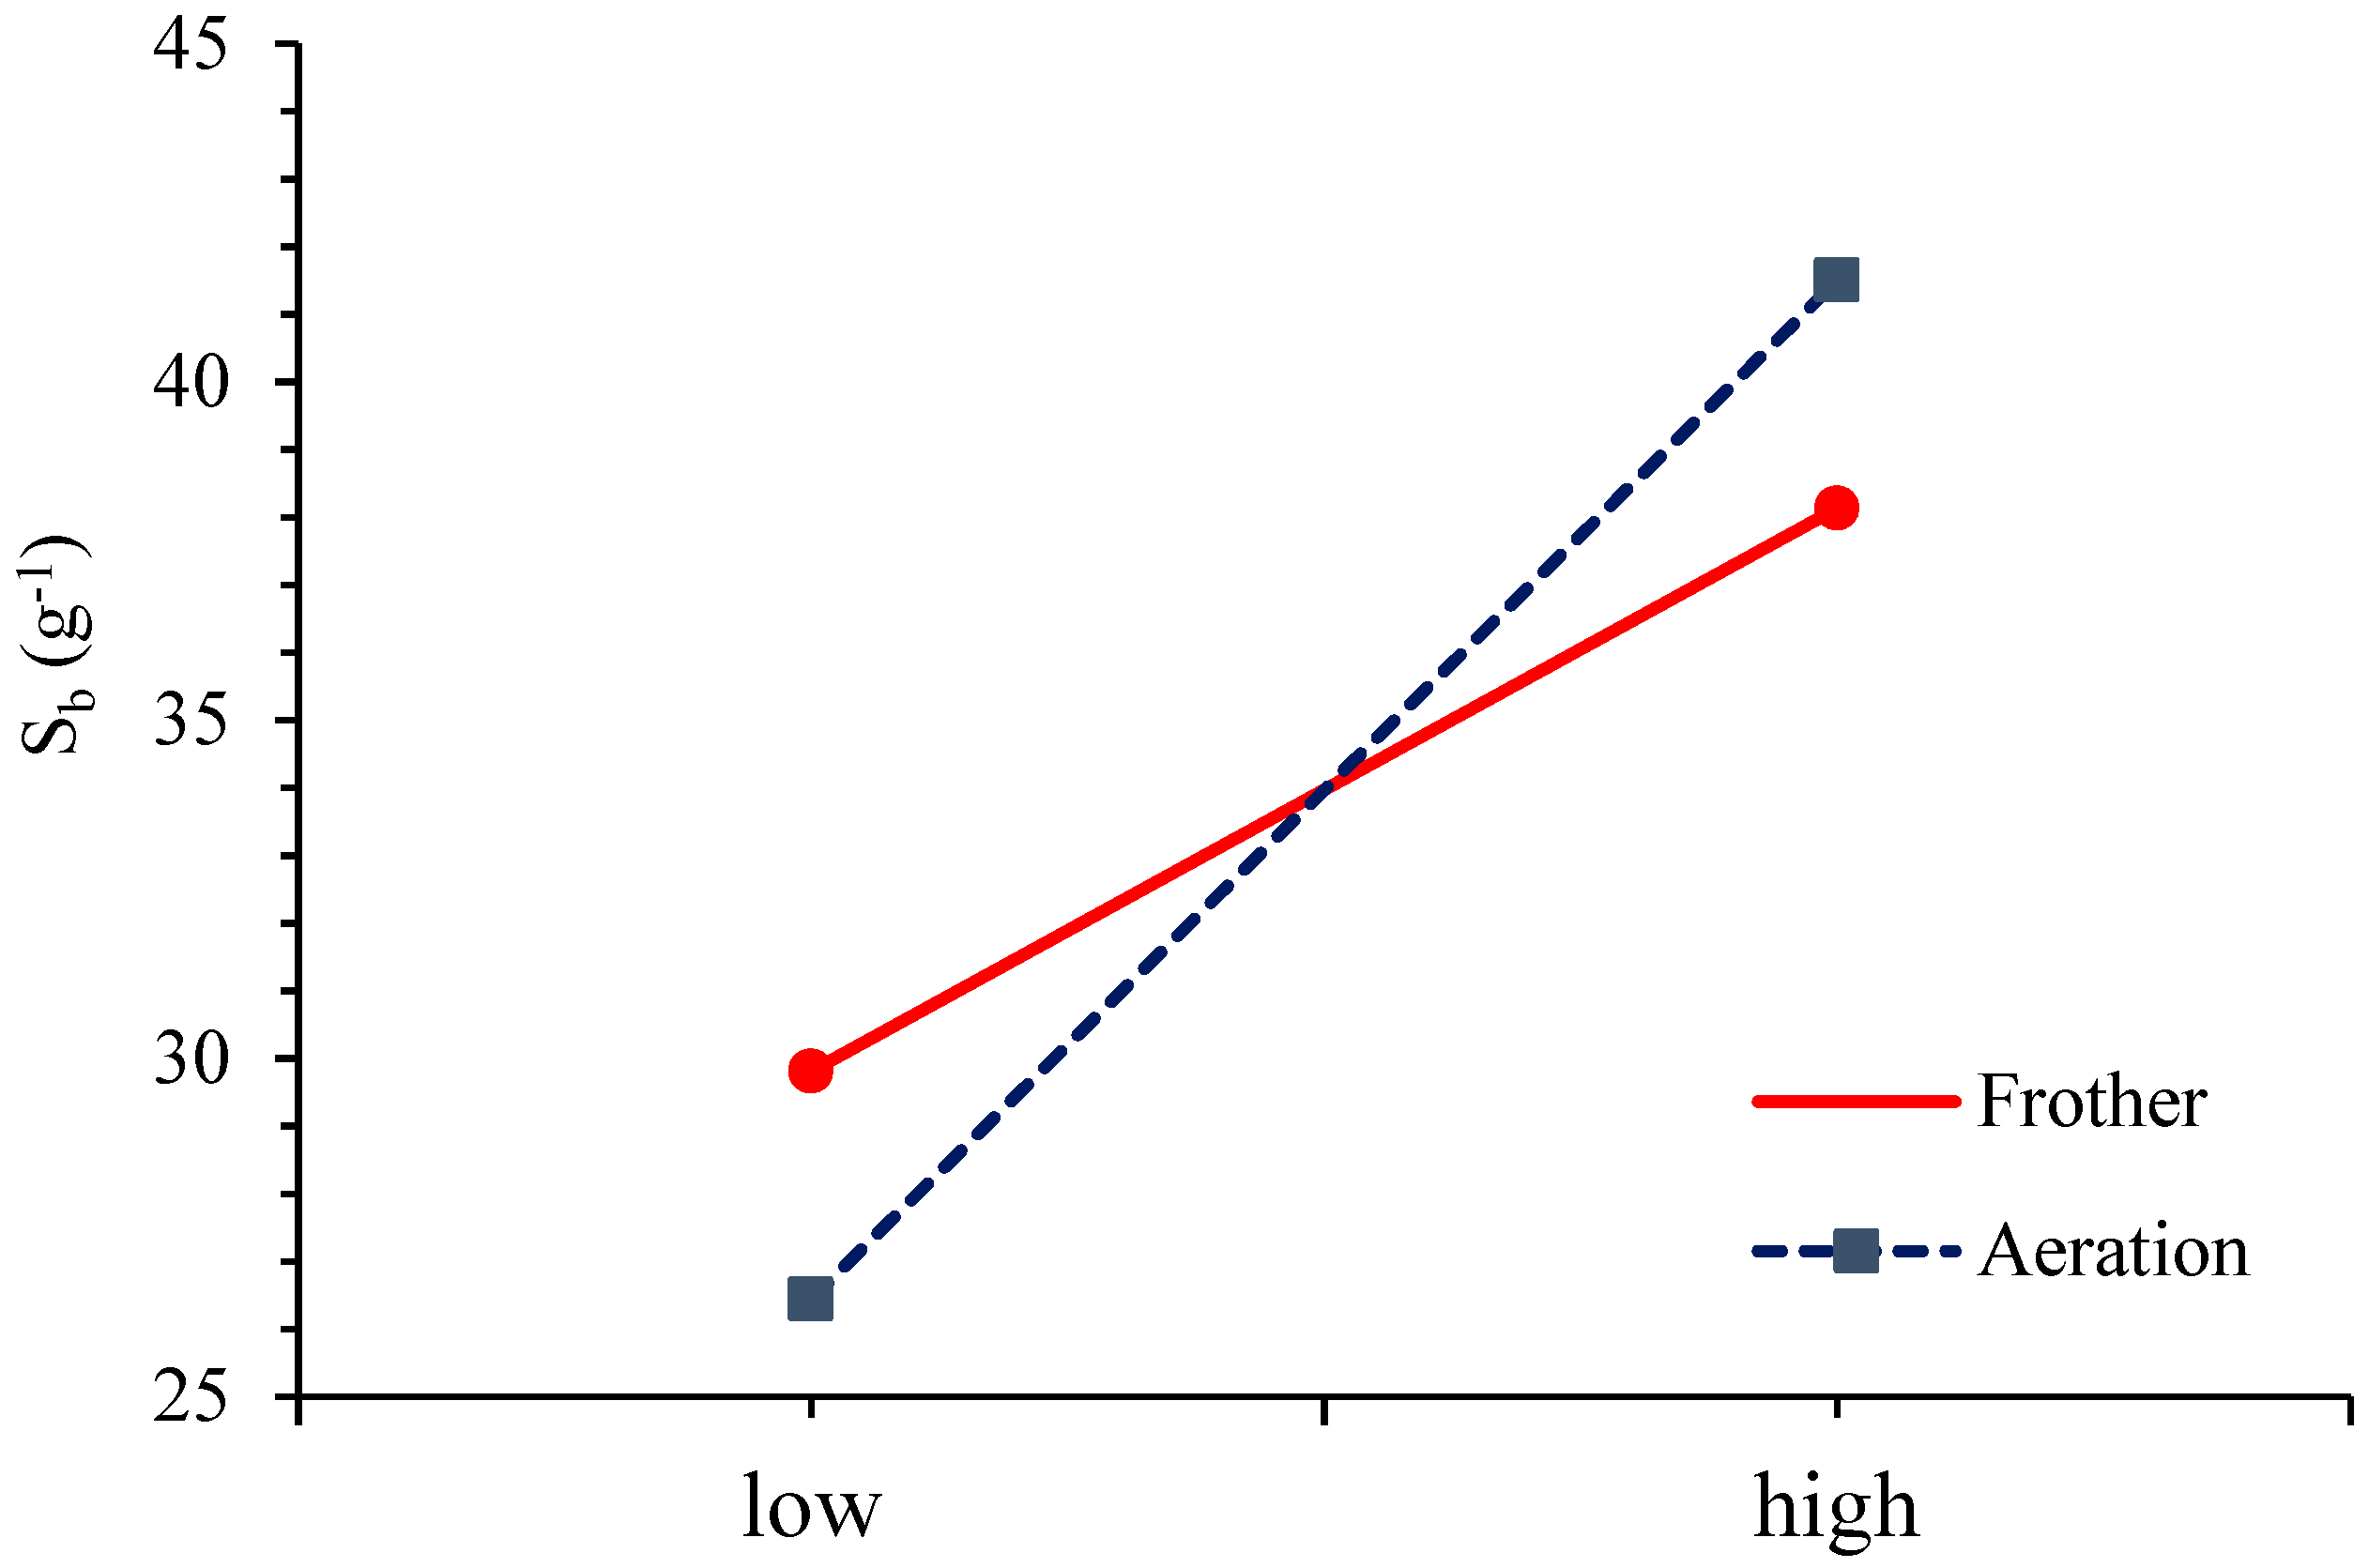
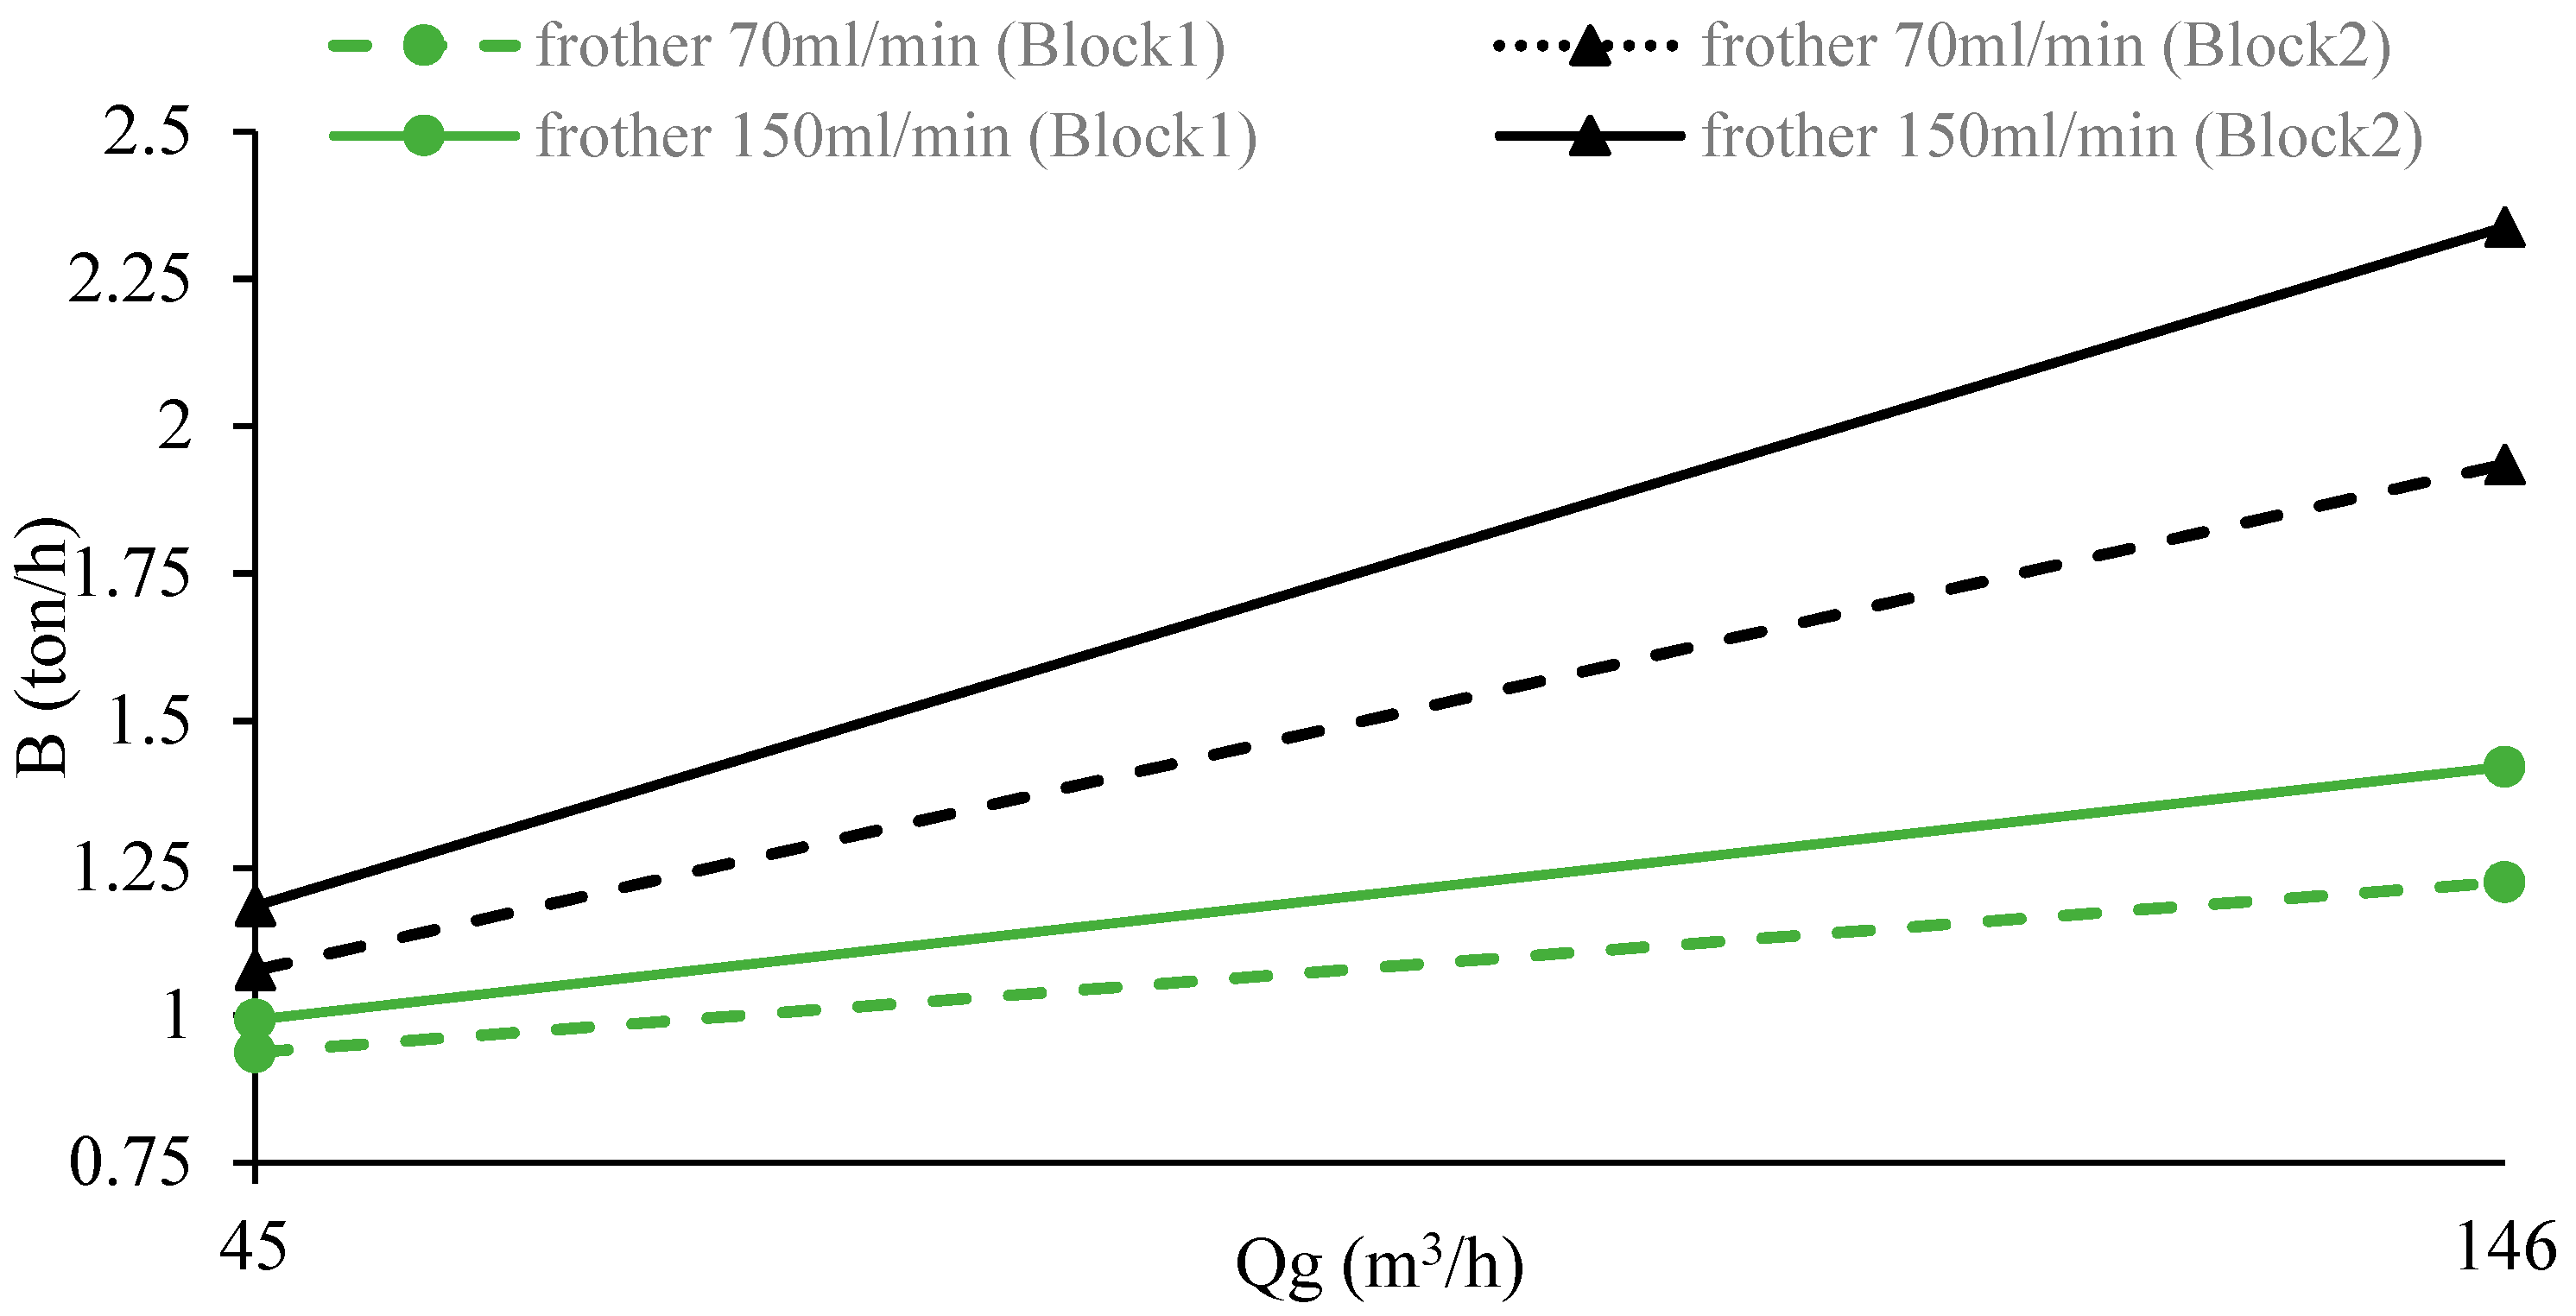
3.5. Mass Transfer Rate of Particles Attached to the Froth Phase

Figure 11 shows that the rate of particle mass transfer to the froth phase is directly related to the aeration rate, even though the bubble loading is inversely proportional to the aeration rate.
According to Figure 11, the mass of particles attached to the bubbles that enter the froth phase increases by increasing the frother dosage (due to the higher bubble load). It must be noted that by increasing the frother dosage and the aeration rate at high froth depth (block 2), the mass transfer rate of particles attached to the bubbles that enter the froth phase is higher compared to the low froth depth (block 1).

4. Conclusions

The bubble loading is directly related to the amount of attached solid particles to the bubbles. It has also an inverse relationship with the bubble diameter, which is influenced by various factors, including aeration rate and frother dosage. The results of this study show that the bubble loading decreases with increasing the aeration rate or frother dosage, although the former has a more significant effect. When the aeration rate decreases from 146 m3/h to 45 m3/h, the bubble loading changes to approximately double. The mass of attached particles to the bubble increases with increasing the bubble diameter, but the ratio of particle mass to the bubble surface (bubble loading) is not statistically significant, and its maximum value was found to be 0.004 mg/mm2. The results also show that approximately 2.5% of the bubble’s surface is covered with particles, which it decreases by increasing the aeration rate.

Author Contributions

Formal analysis, M.O.; Investigation, M.O.; Methodology, M.O.; Project administration, K.G.; Supervision, K.G., A.D. and S.F.; Writing—original draft, M.O.; Writing—review & editing, A.D. and S.F.

Funding

This research received no external funding.

Conflicts of Interest

The authors declare no conflict of interest.

References

  1. Farrokhpay, S. The significance of froth stability in mineral flotation—A review. Adv. Colloid Interface Sci. 2001, 166, 1–7. [Google Scholar] [CrossRef] [PubMed]
  2. Farrokhpay, S.; Zanin, M. An investigation into the effect of water quality on froth stability. Adv. Powder Technol. 2012, 23, 493–497. [Google Scholar] [CrossRef]
  3. Ata, S. Phenomena in the froth phase of flotation—A review. Int. J. Miner. Process. 2012, 102–103, 1–12. [Google Scholar] [CrossRef]
  4. Xing, Y.; Gui, X.; Cao, Y.; Wang, Y.; Xu, M.; Li, C. Effect of compound collector and blending frother on froth stability and flotation performance of oxidized coal. Powder Technol. 2017, 305, 166–173. [Google Scholar] [CrossRef]
  5. Norori-McCormac, A.; Brito-Parada, P.R.; Hadler, K.; Cole, K.; Cilliers, J.J. The effect of particle size distribution on froth stability in flotation. Sep. Purif. Technol. 2017, 184, 240–247. [Google Scholar] [CrossRef]
  6. Achaye, I. Effect of Particle Properties on Froth Stability. Ph.D. Thesis, University of Cape Town, Cape Town, South Africa, 2017. [Google Scholar]
  7. Cilek, E.C.; Uysal, K. Froth stabilization using nanoparticles in mineral flotation. Physicochem. Probl. Miner. Process. 2018, 54, 878–889. [Google Scholar]
  8. Ata, S. The role of frother on the detachment of particles from bubbles. Miner. Eng. 2011, 24, 476–478. [Google Scholar] [CrossRef]
  9. King, R.P.; Hatton, T.A.; Hulbert, D.G. Bubble loading during flotation. Trans. Inst. Mining Metall. 1974, 83, 112–115. [Google Scholar]
  10. Gallegos-Acevedo, P.M.; Pérez-Garibay, R.; Uribe-Salas, A. Maximum bubble loads: Experimental measurement vs. analytical estimation. Miner. Eng. 2006, 19, 12–18. [Google Scholar] [CrossRef]
  11. Yianatos, J.B.; Moys, M.H.; Contreras, F.; Villanueva, A. Froth recovery of industrial flotation cells. Miner. Eng. 2008, 21, 817–825. [Google Scholar] [CrossRef]
  12. Bradshaw, D.J.; Connor, C.T. Measurement of the sub-process of bubble loading in flotation. Miner. Eng. 1996, 9, 443–448. [Google Scholar] [CrossRef]
  13. Alexander, D.J.; Franzidis, J.P.; Manlapig, E.V. Froth recovery measurement in plant scale flotation cells. Miner. Eng. 2003, 16, 1197–1203. [Google Scholar] [CrossRef]
  14. Moys, M.H.; Yianatos, J.; Larenas, J. Measurement of particle loading on bubbles in the flotation process. Miner. Eng. 2010, 23, 131–136. [Google Scholar] [CrossRef]
  15. Seaman, D.R.; Franzidis, J.P.; Manlapig, E.V. Bubble load measurement in the pulp zone of industrial flotation machines—A new device for determining the froth recovery of attached particles. Int. J. Miner. Process. 2004, 74, 1–13. [Google Scholar] [CrossRef]
  16. Hemmati, C.M.; Abdollahy, M.; Khalesi, M.R. Bubble loading measurement in a continuous flotation column. Miner. Eng. 2016, 85, 49–54. [Google Scholar] [CrossRef]
  17. Eskanlou, A.; Khalesi, M.R.; Abdollahy, M.; Hemmati, C.M. Interactional effects of bubble size, particle size, and collector dosage on bubble loading in column flotation. J. Min. Environ. 2018, 9, 107–116. [Google Scholar]
  18. Gorain, B.; Franzidis, J.P.; Manlapig, E.V. Studies on impeller type, impeller speed and air flow rate in an industrial scale flotation cell. Part 1: Effect on bubble size distribution. Miner. Eng. 1995, 8, 615–635. [Google Scholar] [CrossRef]
  19. Fuerstenau, M.C.; Jameson, G.J.; Yoon, R.-H. Froth Flotation: A Century of Innovation; Society for Mining, Metallurgy, and Exploration: Englewood, CO, USA, 2007. [Google Scholar]
  20. Vinnett, L.; Yianatos, J.; Alvarez, M. Gas dispersion measurements in mechanical flotation cells-Industrial experience in Chilean concentrators. Miner. Eng. 2014, 57, 12–15. [Google Scholar] [CrossRef]
  21. Kaartinen, J.; Hätönen, J.; Hyötyniemi, H.; Miettunen, J. Machine-vision-based control of zinc flotation—A case study. Control Eng. Pract. 2006, 14, 1455–1466. [Google Scholar] [CrossRef]
  22. Grau, R.A.; Heiskanen, K. Visual technique for measuring bubble size in flotation machines. Miner. Eng. 2002, 15, 507–513. [Google Scholar] [CrossRef]
  23. Morar, S.H. The Use of Machine Vision to Describe and Evaluate Froth Phase Behaviour and Performance in Mineral Flotation Systems. Ph.D. Thesis, University of Cape Town, Cape Town, South Africa, 2010. [Google Scholar]
  24. Nissinen, N.; Lehikoinen, A.; Mononen, M.; Lähteenmäki, S.; Vauhkonen, M. Estimation of the bubble size and bubble loading in a flotation froth using electrical resistance tomography. Miner. Eng. 2014, 69, 1–12. [Google Scholar] [CrossRef]
  25. Gorain, B.; Oravainen, H.; Allenius, H.; Peaker, R.; Weber, A.; Tracyzk, F. Mechanical froth flotation cells. In Froth Flotation a Century of Innovation; Fuerstenau, M.C., Jameson, G.J., Yoon, Eds.; Society for Mining, Metallurgy, and Exploration: Englewood, CO, USA, 2007; pp. 637–779. [Google Scholar]
  26. Gallegos-Acevedo, P.M.; Pérez-Garibay, R.; Uribe-Salas, A.; Nava-Alonso, F. Bubble load estimation in the froth zone to predict the concentrate mass flow rate of solids in column flotation. Miner. Eng. 2007, 20, 1210–1217. [Google Scholar] [CrossRef]
  27. Bhondayi, C.; Moys, M.H. Determination of sampling pipe (riser) diameter for a flotation bubble load measuring device. Miner. Eng. 2011, 24, 1664–1676. [Google Scholar] [CrossRef]
  28. Yianatos, J.; Vinnett, L.; Carrasco, C.; Alvarez-Silva, M. Effect of entrainment in bubble load measurement on froth recovery estimation at industrial scale. Miner. Eng. 2015, 72, 31–35. [Google Scholar] [CrossRef]
  29. Napier-Munn, T. Statistical Methods for Mineral Engineers: How to Design Experiments and Analyse Data; JKMRC: Indooroopilly, Australia, 2014. [Google Scholar]
  30. Li, C.; Runge, K.; Shi, F.; Farrokhpay, S. Effect of flotation conditions on froth rheology. Powder Technol. 2018, 340, 537–542. [Google Scholar] [CrossRef]
  31. Gupta, A.; Yan, D.S. Mineral Processing Design and Operations; Elsevier Science: Amsterdam, The Netherlands, 2016. [Google Scholar]
  32. Ralston, J.; Fornasiero, D.; Hayes, R. Bubble- particle attachment and detachment in flotation. Int. J. Miner. Process. 1999, 56, 133–164. [Google Scholar] [CrossRef]
Figure 1. The position of bubble loading measurement in the flotation circuit.
Minerals 09 00222 g001
Figure 2. The imaging device to measure bubble diameter.
Minerals 09 00222 g002
Figure 3. The direct measurement device for carrying the bubble (a) and its location in the flotation cell (b).
Minerals 09 00222 g003
Figure 4. Effect of frother dosage and aeration rate on the bubble size (frother dosage for low and high are 70 mL/min and 150 mL/min, and the aeration rate for low and high are 45 m3/h and 146 m3/h; see Table 1).
Minerals 09 00222 g004
Figure 5. Effect of aeration rate and frother dosage on the bubble superficial surface (frother dosage for low and high are 70 mL/min and 150 mL/min, and the aeration rate for low and high are 45 m3/h and 146 m3/h; see Table 1).
Minerals 09 00222 g005
Figure 6. Effect of frother dosage and aeration rate on the solid density surface (frother dosage for low and high are 70 mL/min and 150 mL/min, and the aeration rate for low and high are 45 m3/h and 146 m3/h; see Table 1).
Minerals 09 00222 g006
Figure 7. Effect of bubble diameter on the density of solid particles.
Minerals 09 00222 g007
Figure 8. Effect of frother dosage and amount of aeration rate on the bubble loading surface (frother dosage for low and high are 70 mL/min and 150 mL/min, and aeration rate for low and high are 45 m3/h and 146 m3/h; see Table 1).
Minerals 09 00222 g008
Figure 9. Effect of aeration rate on the percentage of bubble surface coverage.
Minerals 09 00222 g009
Figure 10. Effect of bubble diameter on the mass of attached particles to the bubbles and its ratio to the bubble surface.
Minerals 09 00222 g010
Figure 11. Effect of aeration rate on the mass transfer rate of particles to the froth phase.
Minerals 09 00222 g011
Table 1. Statistical factorial design of the experiments for measuring the bubble diameter.
No.Block No.Frother Dosage
mL/min
Aeration Rate
m3/h
ton/hFeed
% Fe% S
11704510865.71.09
21504511065.021.09
37014610466.60.83
415014611565.751.06
52704510866.151.04
6150459865.711.19
77014610565.420.93
815014611666.20.9
Table 2. The calculated froth recovery values based on the mass and grade of samples.
No.db (mm)dp (μm)ρp (g/cm3)λB (g/L)Bl (mg/mm2)K (%)mpb (mg)Sb (s−1)
10.97433.8420.820.00343.610.01222.33
20.74403.7822.050.00272.490.00529.28
31.91533.978.40.00273.020.0236.8
41.68513.969.740.00272.480.01941.84
50.9443.8423.920.00363.610.01224.07
60.72403.7826.340.00322.490.00630.09
71.95544.0413.260.00434.520.04536.05
81.37503.9116.020.00373.080.0251.31

