Article

Ore-Fluid Evolution of the Sizhuang Orogenic Gold Deposit, Jiaodong Peninsula, China

1
State Key Laboratory of Geological Processes and Mineral Resources, China University of Geosciences, Beijing 100083, China
2
Sizhuang Gold Deposit, Shandong Gold Mining (Laizhou) Co., Ltd., Laizhou 261400, China
*
Author to whom correspondence should be addressed.
Minerals 2019, 9(3), 190; https://doi.org/10.3390/min9030190
Submission received: 14 January 2019 / Revised: 15 March 2019 / Accepted: 16 March 2019 / Published: 21 March 2019
(This article belongs to the Special Issue Polymetallic Metallogenic System)

Abstract

:
The Sizhuang gold deposit with a proven gold resource of >120 t, located in northwest Jiaodong Peninsula in China, lies in the southern part of the Jiaojia gold belt. Gold mineralization can be divided into altered rock type, auriferous quartz vein type, and sulfide-quartz veinlet in K-feldspar altered granite. According to mineral paragenesis and mineral crosscutting relationships, three stages of metal mineralization can be identified: early stage, main stage, and late stage. Gold mainly occurs in the main stage. The petrography and microthermometry of fluid inclusion shows three types of inclusions (type 1 H2O–CO2 inclusions, type 2 aqueous inclusions, and type 3 CO2 inclusions). Early stage quartz-hosted inclusions have a trapped temperatures range 303–390 °C. The gold-rich main stage contains a fluid-inclusion cluster with both type 1 and 2 inclusions (trapped between 279 and 298 °C), and a wide range of homogenization temperatures of CO2 occurs to the vapor phase (17.6 to 30.5 °C). The late stage calcite only contains type 1 inclusions with homogenization temperatures between 195 and 289 °C. With evidences from the H–O isotope data and the study of water–rock interaction, the metamorphic water of the Jiaodong Group is considered to be the dominating source for the ore-forming fluid. The ore-fluid belonged to a CO2–H2O–NaCl system with medium-low temperature (160–360 °C), medium-low salinity (3.00–11.83 wt% NaCl eq.), and low density (1.51–1.02 g/cm3). Fluid immiscibility caused by pressure fluctuation is the key mechanism in inducing gold mineralization in the Sizhuang gold deposit.

1. Introduction

The giant Jiaodong gold deposit, with more than 4500 t proven gold reserves [1], is the most important gold producer of China [2,3]. More than 150 deposits in Jiaodong area are generally divided into two styles, Jiaojia-style and Linglong-style [4]. The mineralization of the former is the disseminated-stockwork type which occurs in the pyrite-sericite-quartz alteration belt and the latter’s is the auriferous quartz vein type which is mostly controlled by subsidiary faults [5]. However, both styles invariably occur in every single deposit in Jiaodong [6,7], with similar mineral paragenesis, alteration assemblages, and gold deposition ages [1,8].
Many previous inclusion studies show that three types of primary inclusions (H2O–CO2, aqueous, and CO2 inclusions) have been founded in both the mineralization styles [6,9,10]. They belong to the CO2–H2O–NaCl ± CH4 fluid system with a medium-high temperature (158–393 °C) and a medium-low salinity (≤11.2 wt % NaCl eq.) [6,7,8,9,10]. The fluid immiscible system was discussed and considered as a significant role in gold mineralization [6,10]. The source of ore-forming fluids still remains a controversy: Magmatic water, mixing with meteoric water before and/or at mineralization, is considered the source based on a H–O isotope composition in many studies [11,12]. Deng et al. (2015) [13] and Yang et al. (2017) [14] considered that the source of Jiaodong gold deposit may be from both the crust and mantle by carbon and sulfur isotope study; The δD values of hydrothermal sericite together with the O–S isotope indicate that the source of ore-forming metal is derived from the paleo-Pacific oceanic slab and its overlying sediments [6].
For the Sizhuang gold deposit, there are few studies including the geology, structures, and hydrothermal alteration [15], and only one published paper includes a fluid inclusion study. Wei et al (2015) [16] identified H2O–CO2 and aqueous inclusions in quartz (hosted in auriferous quartz vein in early stage and main stage) and indicated a medium-low temperature (133–310 °C) and medium-low salinity (≤12 wt % NaCl eq.) H2O–CO2–NaCl fluid system. Just comparing the H–O isotope composition in the Sizhuang deposit with natural water, Wei et al (2015) [16] concluded that magmatic water was the dominating source of ore-fluid.
The origin of the Jiaodong gold province is still controversial. Only a simple comparison of isotopes cannot be convincing. In this study, three stages of quartz have been divided. Three mineralization styles have been identified and compared in the Sizhuang gold deposit which is well-known as a Jiaojia-style deposit. Three types of primary fluid inclusions were recognized by petrography and microthermometry. According to the H–O isotope, more comparisons with possibilities and the calculation of fluid compositions through a water–rock interaction will be done, the origin and evolution of ore-fluid in the Sizhuang gold deposit will be discussed.

2. Geological Background

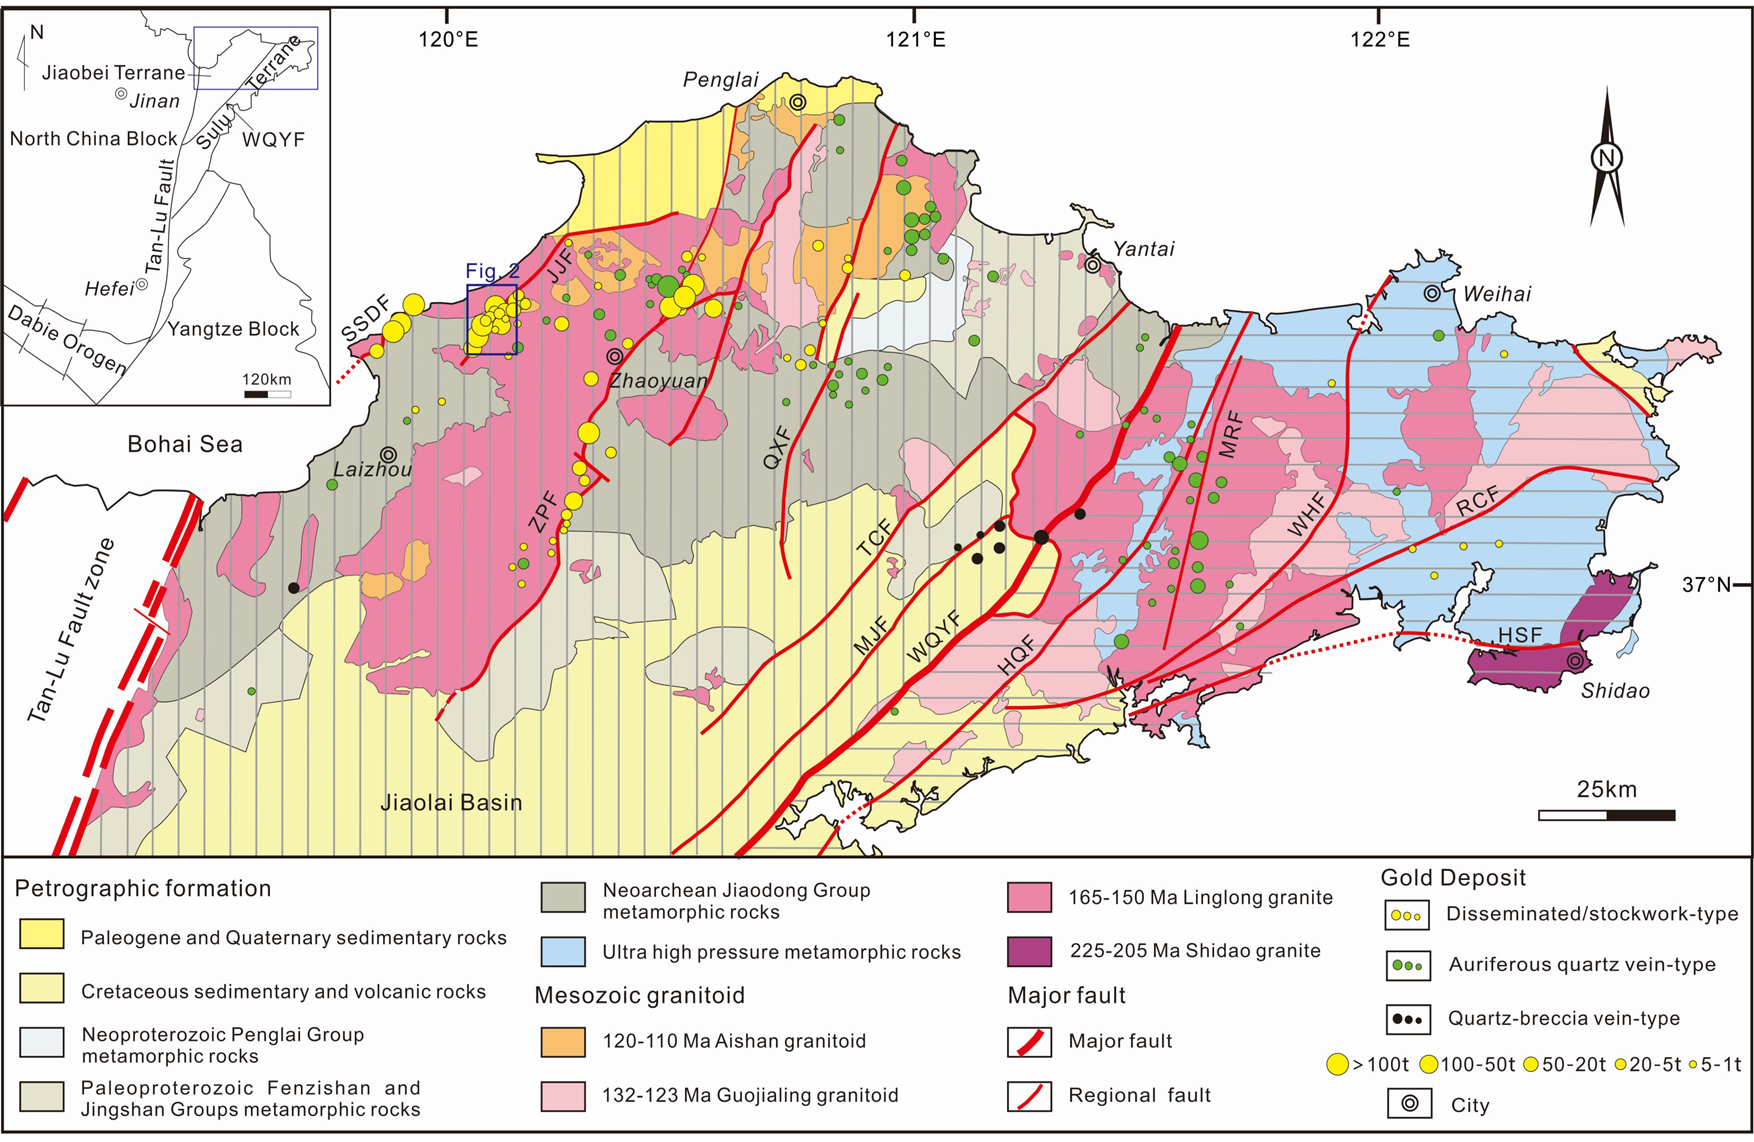
2.1. Regional Geology

The Jiaodong Peninsula consists of two tectonic units, the Jiaobei Terrane of the North China Block and the Sulu Terrane of the Yangtze Block, which are bounded by Wulian-Qingdao-Yantai Fault [17] (Figure 1). The Jiaobei Terrane contains the Jiaobei Uplift in the north and Jiaolai Basin in the south. The Jiaobei Uplift includes more than 90% gold reserves and hosts the largest gold deposits of Jiaodong gold province [10,17] (Figure 1).
The ca. 2.9 to 2.5 Ga tonalite-trondhjemite-granodiorite (TTG) gneisses near Zhaoyuan city, which form the basement of the Jiaodong Group, are the oldest rocks in this area [18,19]. The ca. 2.5 Ga folding of TTG and Jiaodong Group [20] and the ca. 2.2–2.0 Ga intrusion of amphibolite-facies [21,22] happened one after another. These events were followed with the forming of schist, paragneiss, calc-silicate, marble, and minor mafic granulite and amphibolite [23,24]. After the ca. 1.9 Ga continental collision of the rocks of the Jingshan and Fenzishan Group, the Neoproterozoic sedimentary cover (mainly includes marble, slate, and quartzite) [25] deposited (Figure 1).
The Mesozoic granites, commonly existing in the Jiaobei Uplift, is divided into three groups (Figure 1): The Late Jurassic (165–150 Ma) Linglong granite, the middle Early Cretaceous (132–123 Ma) Guojialing granite, and the late Early Cretaceous (120–110 Ma) Aishan granite [26,27,28]. The Linglong granite, which is the product of widespread Mesozoic magmatism, hosts the Sizhuang gold deposit [16,27,29] (Figure 2). The Linglong granites are composed of garnet granite, biotite granite, amphibole-bearing biotite granite, and muscovite granite [29,30].
The major gold deposits in the Jiaobei Uplift are controlled by the NE- to NNE-trending fault system which cut through Linglong granite [4]. The main faults from the west to east are Sanshadao, Jiaojia, Zhaoping, and Qixia Fault. All these faults are the subsidiary faults of the Tan-Lu Fault Zone (Figure 1). The Jiaojia Fault, which is the ore-controlling fault at the Sizhuang gold deposit (Figure 2), is one of the most significant faults in Jiaobei Uplift.

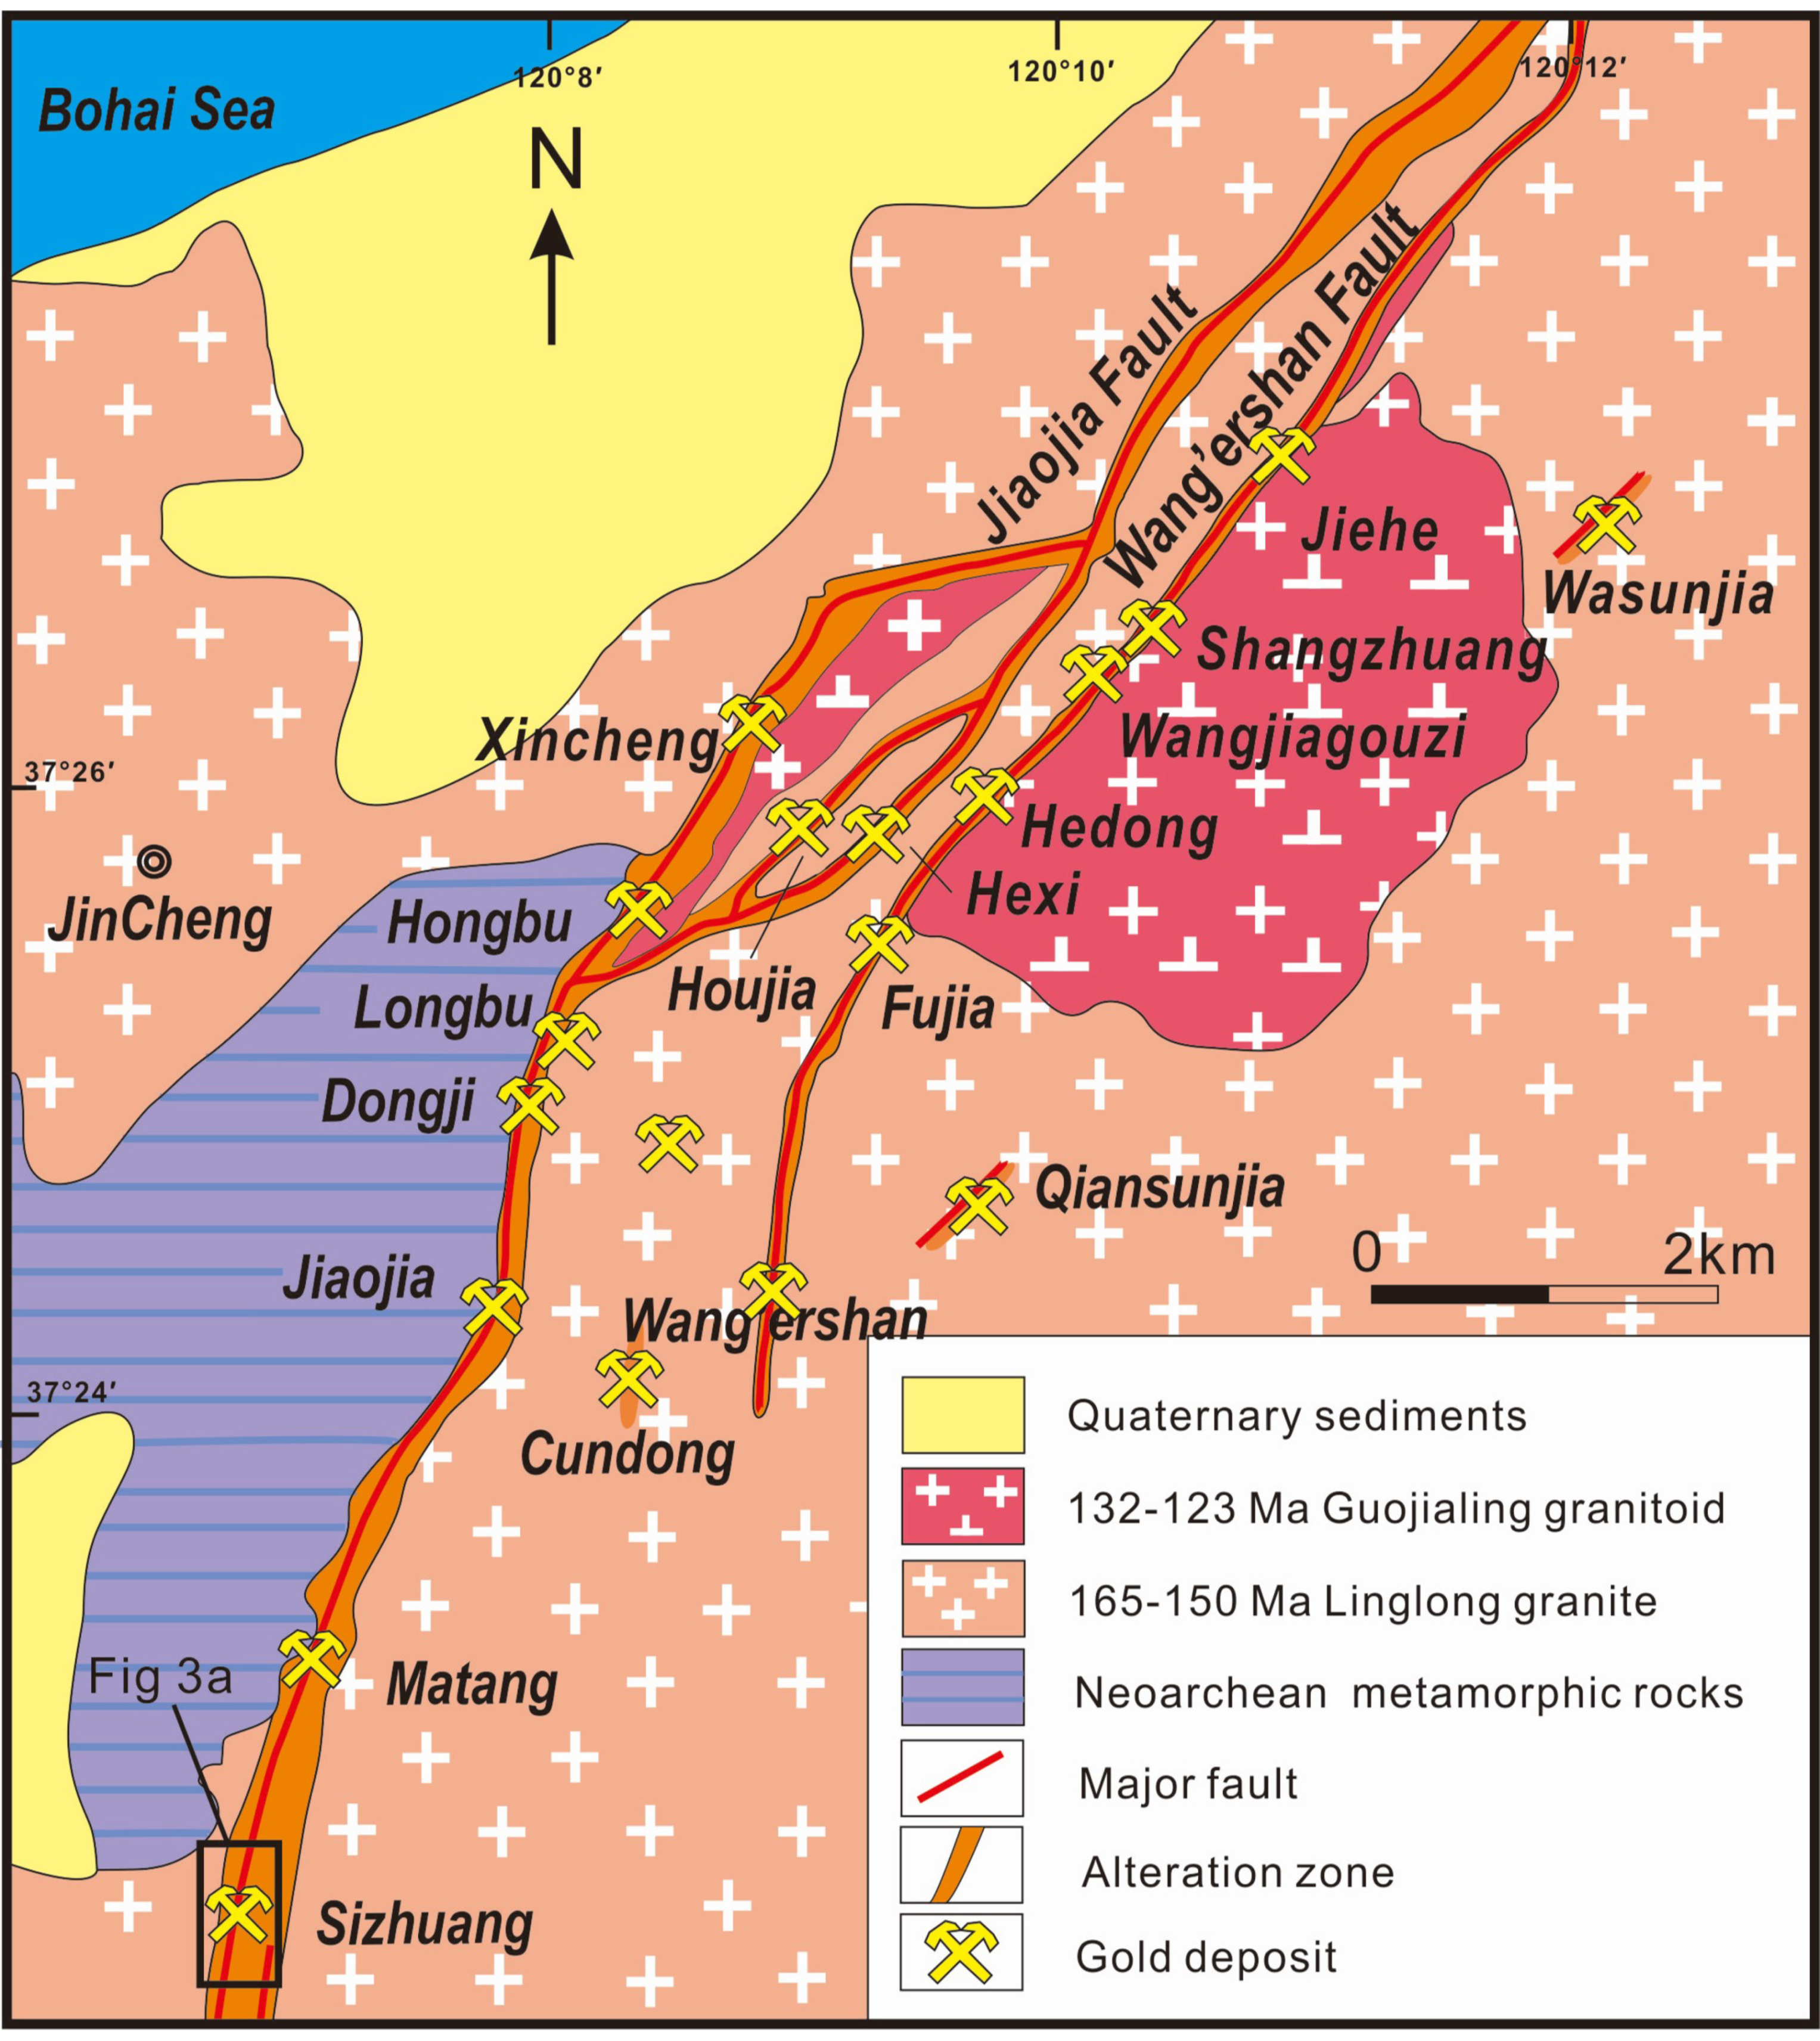
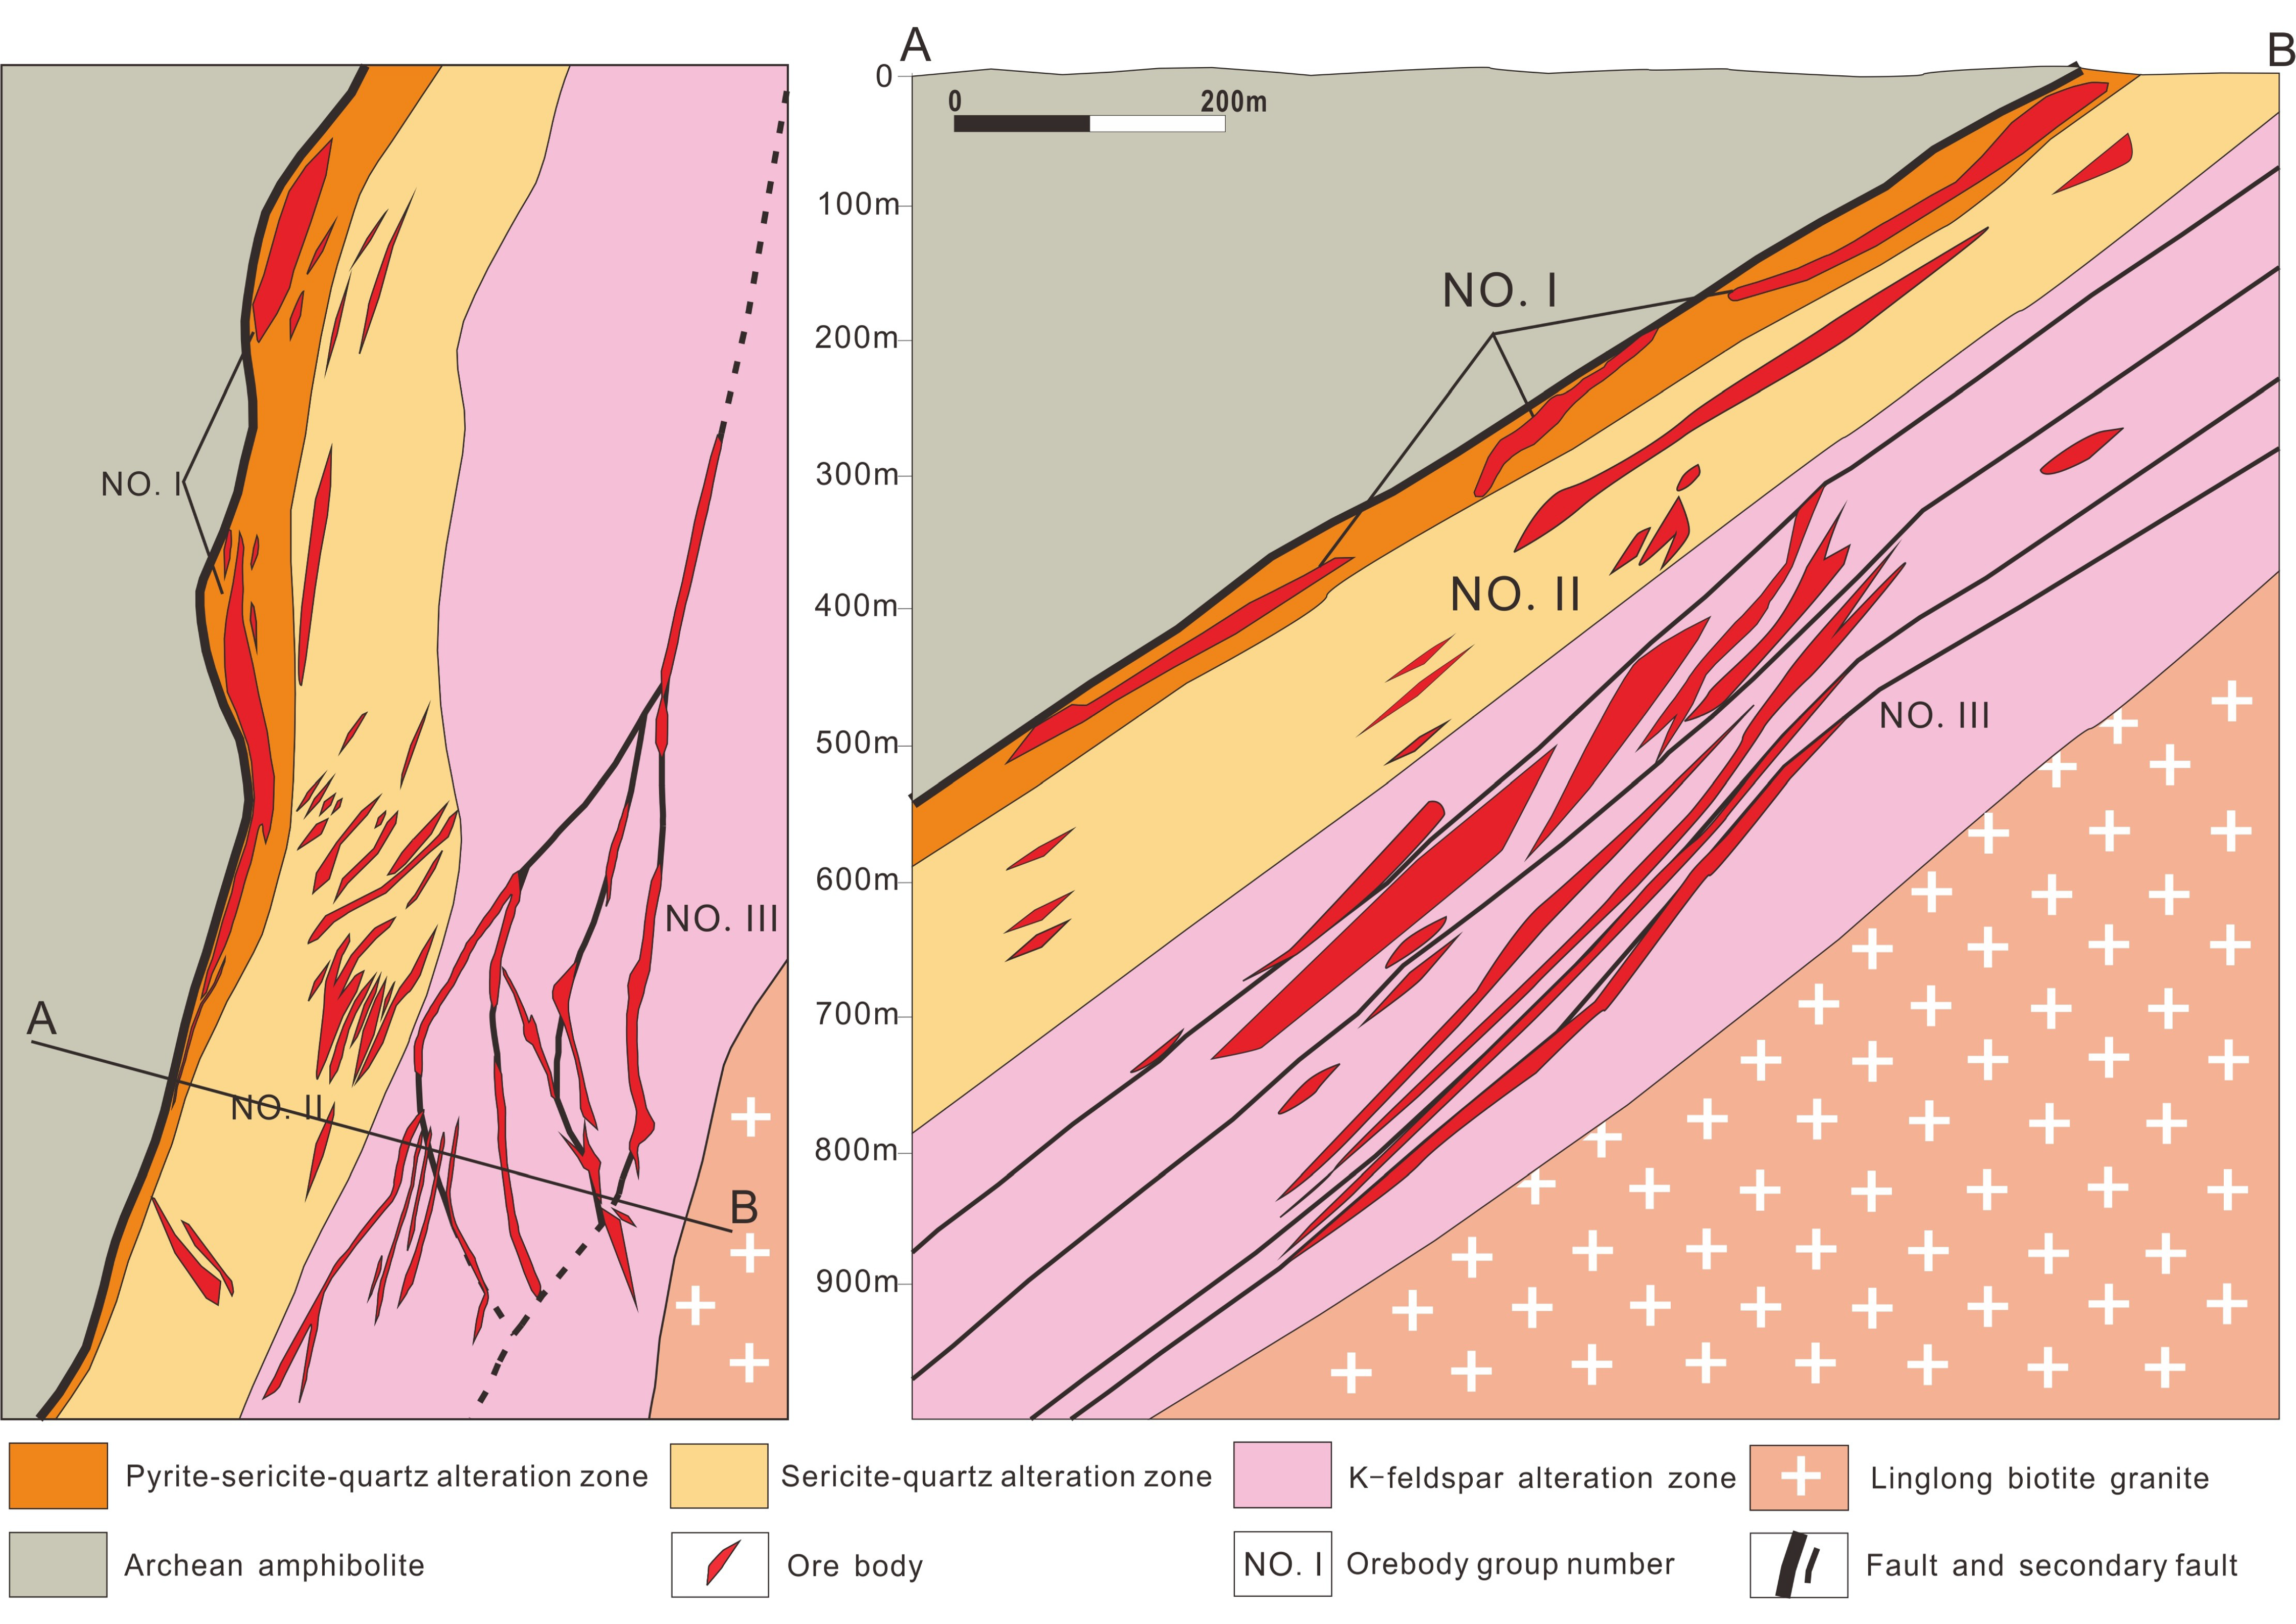
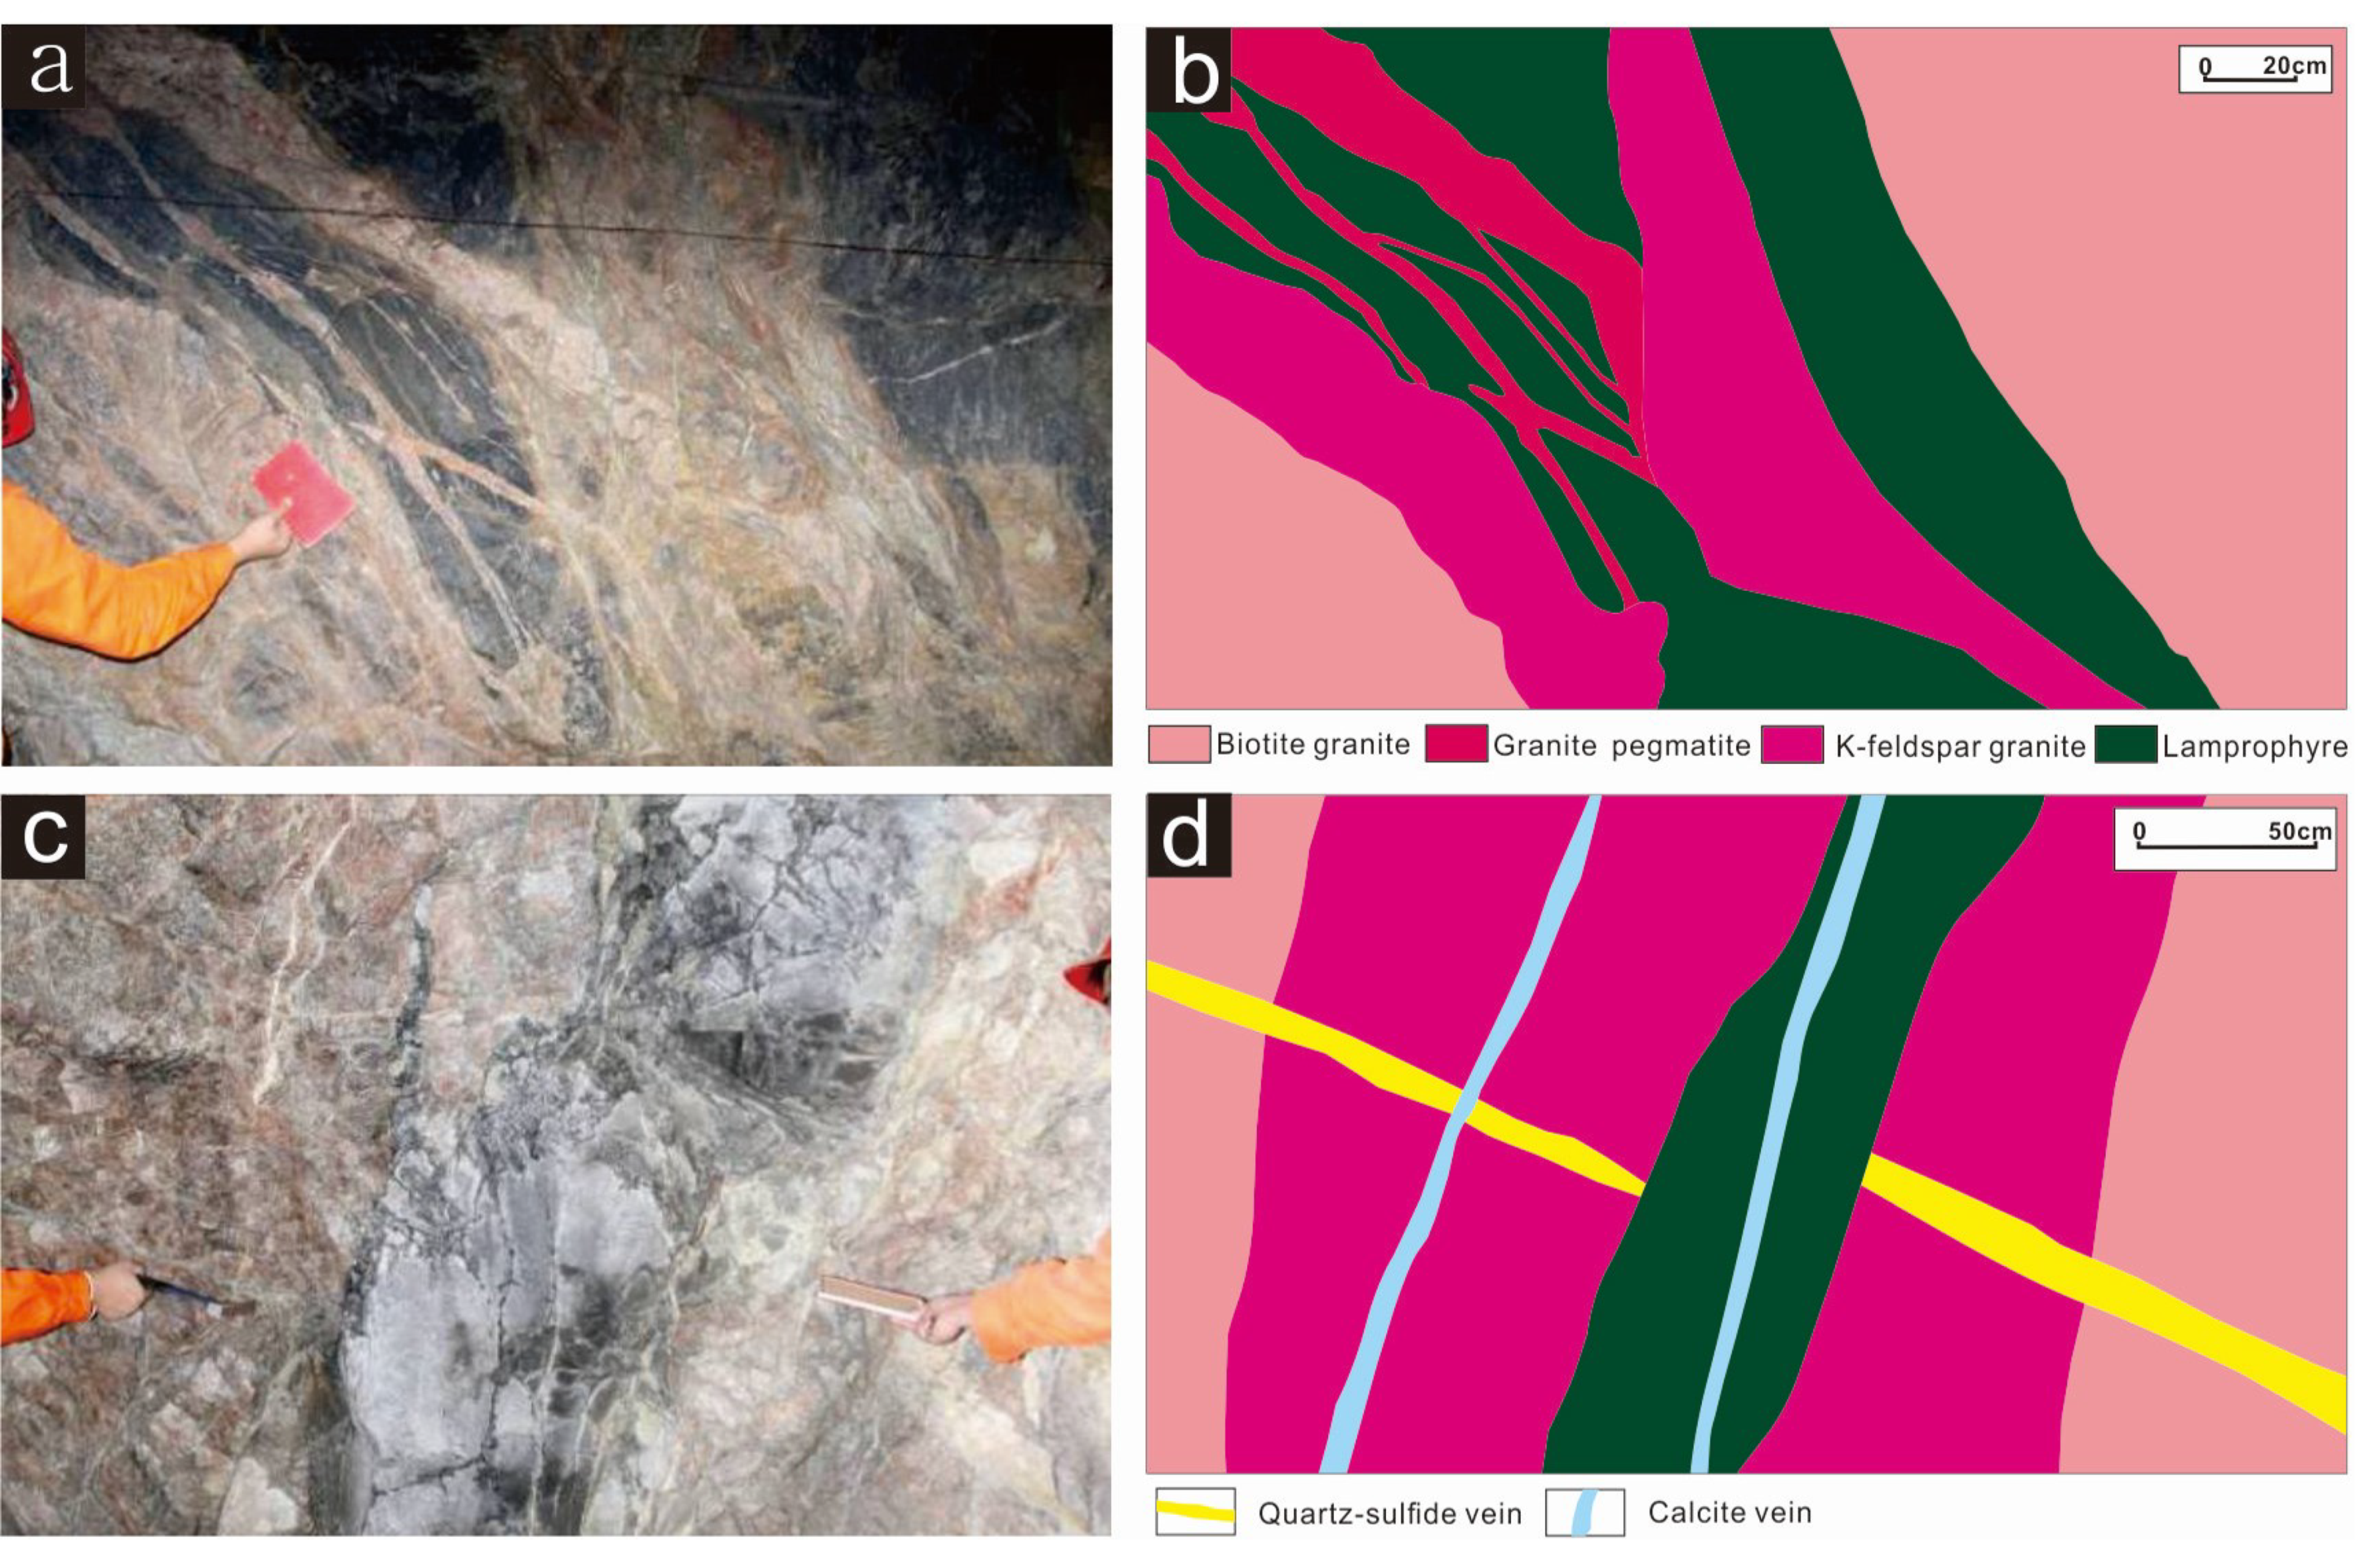
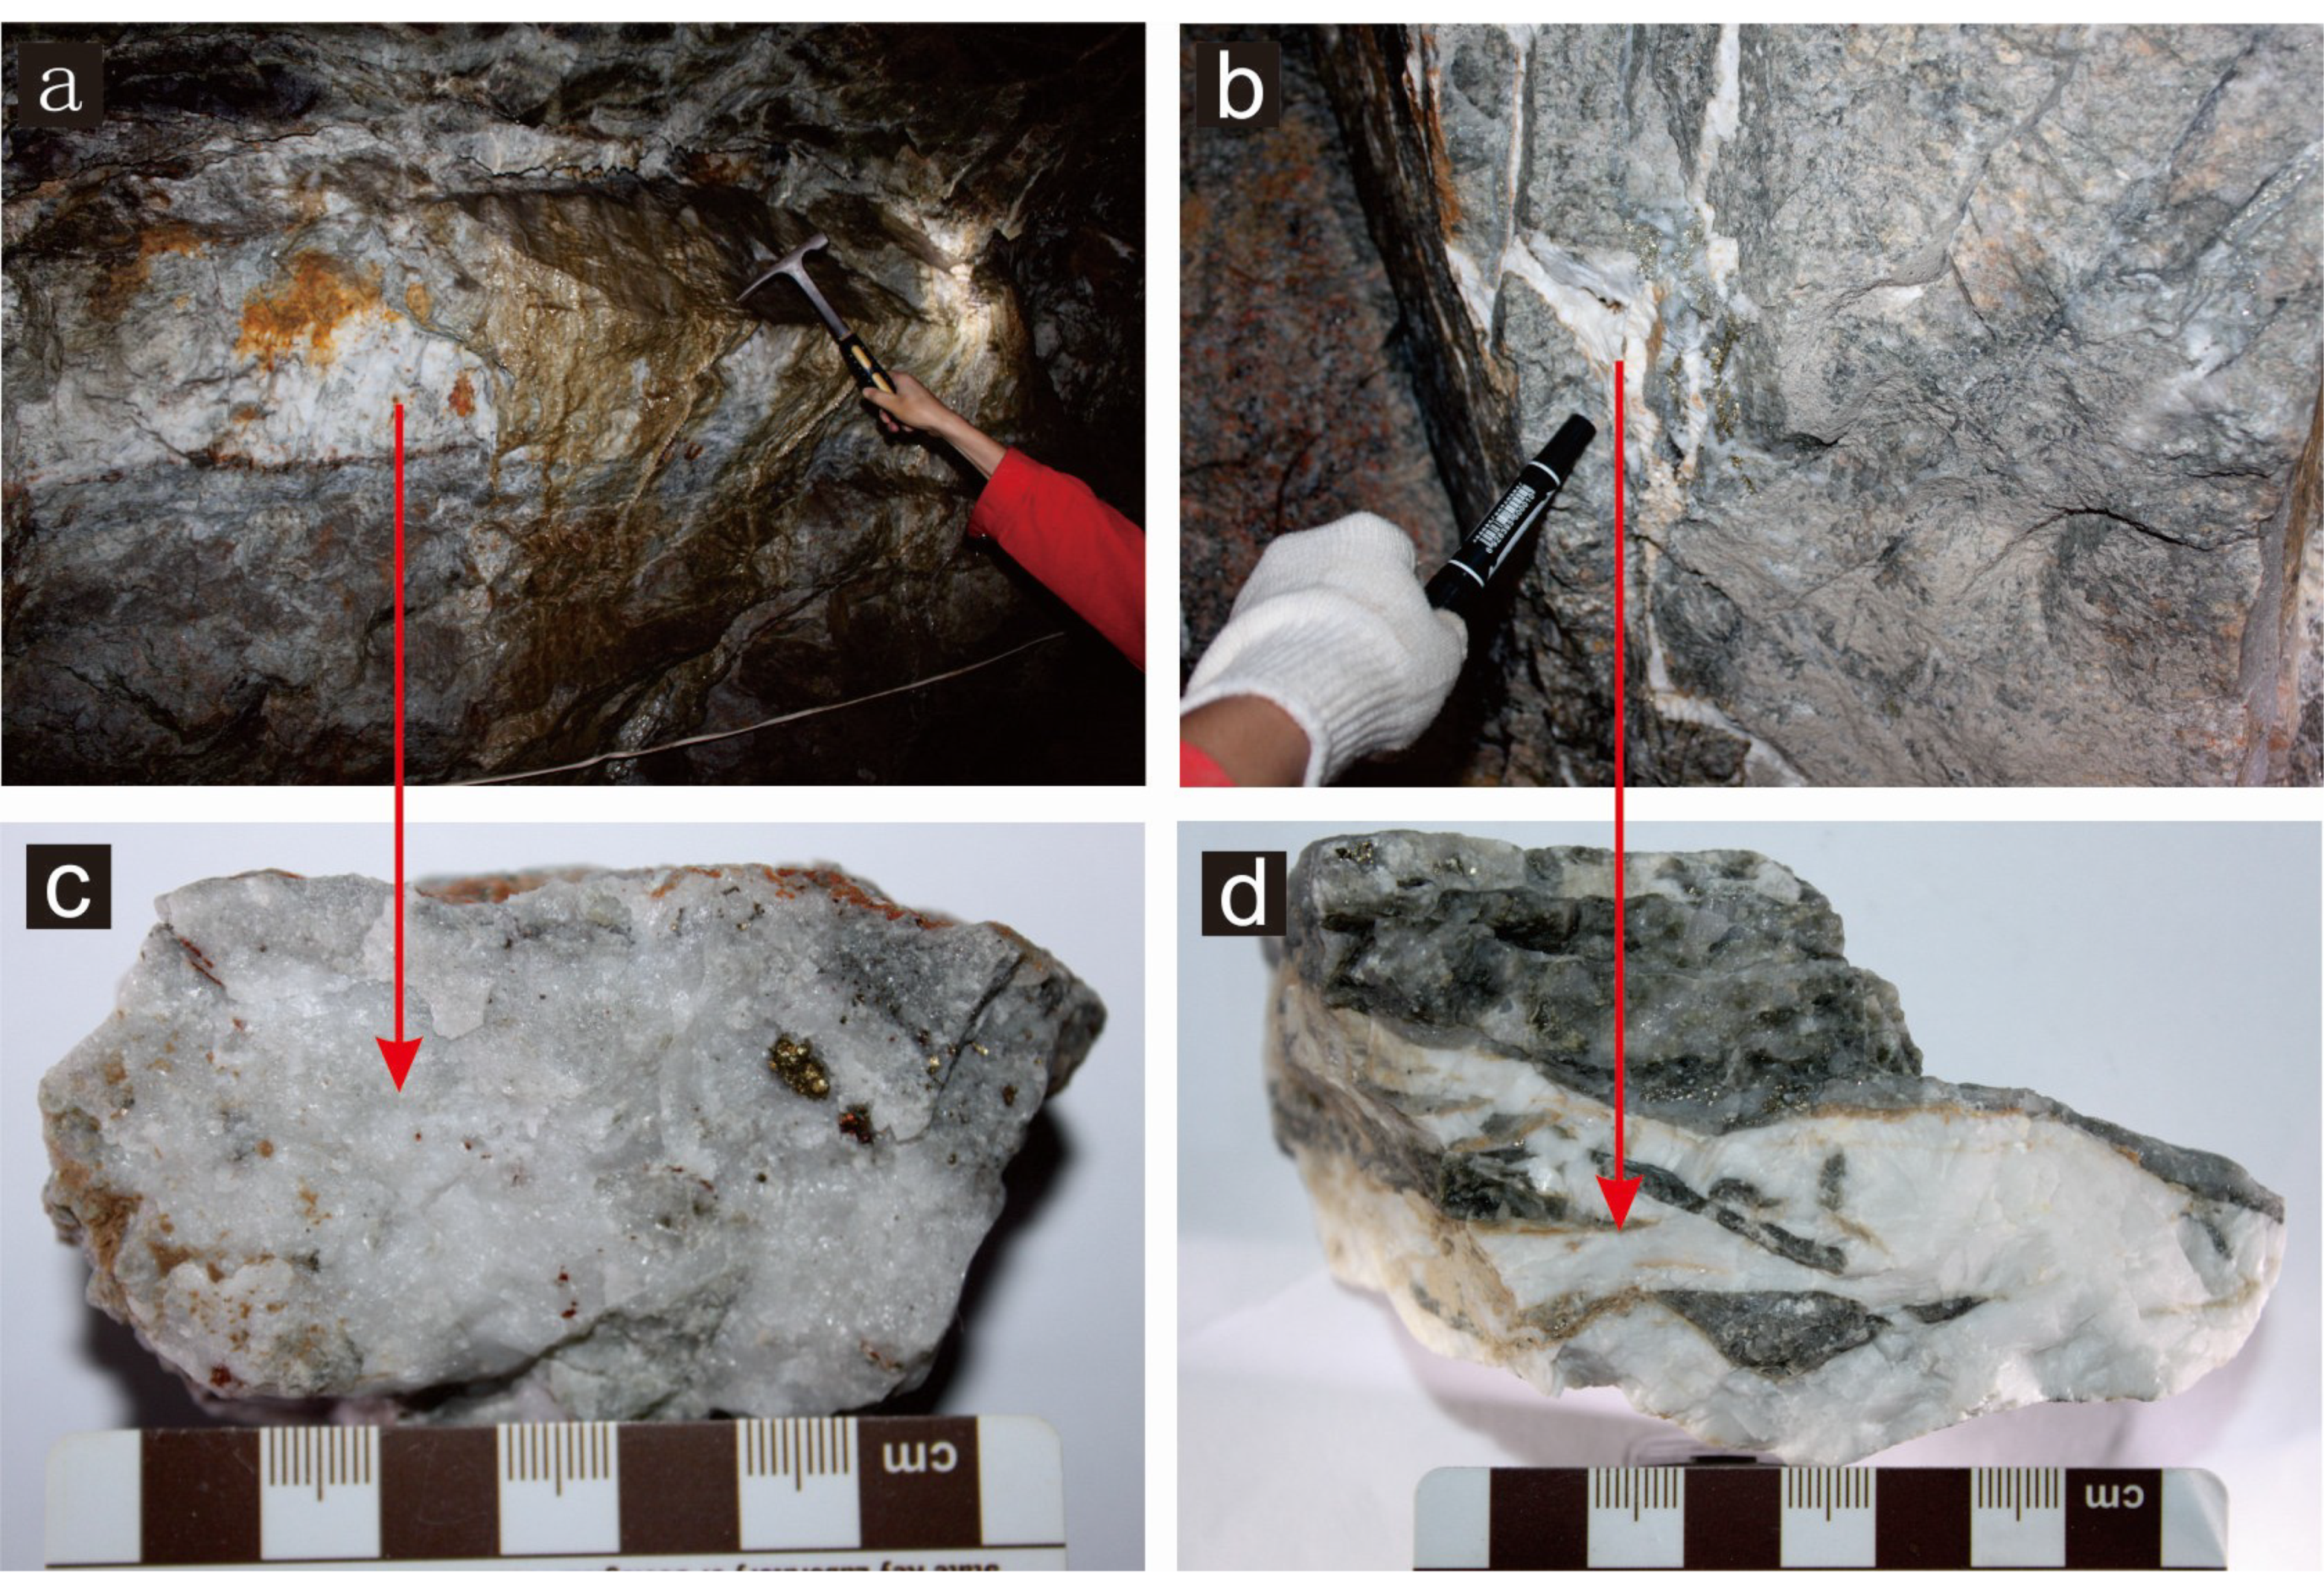
2.2. Deposit Geology

The Sizhuang gold deposit is situated in the footwall of the southern section of the Jiaojia Fault, about 28 km northeast to Laizhou City (Figure 1). It is a world-class gold deposit with a proven reserve of >120 t Au. Xenoliths of Jiaodong Group metamorphic rocks, mostly biotite amphibolite, only occurs in the hanging wall of Jiaojia Fault. The Linglong biotite granite is widely exposed in the mine and mainly in the footwall of the Jiaojia Fault (Figure 3).
The hydrothermal alteration zones, which develops along the Jiaojia Fault, can be divided into the pyrite-sericite-quartz alteration zone, sericite-quartz alteration zone, and K-feldspar alteration zone. The extent of sericite-quartz alteration is weaker and the volume of metallic sulfide (mostly pyrite) is fewer with the increasing distance to the Jiaojia Fault in the footwall. The content of K-feldspar in the alteration zone, especially in the K-feldspar alteration zone, is macroscopically higher than in Linglong biotite granite.
All gold mineralization occurs in the footwall of Jiaojia fault. The orebody is mainly controlled by the NE- to NNE-trending and SE-dipping Jiaojia fault system (Figure 2). The secondary faults, which are often filled with quartz veins and are surrounded by hydrothermal zones with a width from 0.5 m to more than ten meters, can be several hundreds to one thousand meters long and 0.1–1.5 m wide (Figure 3).
Although the Sizhuang gold deposit is known as Jiaojia-style mineralization, three mineralization styles can be identified in the Sizhuang gold deposit. The first one is disseminated-stockwork type (Jiaojia-style) mineralization which is hosted in the first-order Jiaojia Fault (Figure 4a,d). There is less Jiaojia-style mineralization surrounding the subsidiary second- or third-order faults. The second style is the auriferous quartz vein style (Linglong-style) which almost occurs along the subsidiary second- or third-order faults (Figure 4b,e). The third type is sulfide-quartz veinlet in the K-feldspar altered granite (Figure 4c,f). These three mineralization styles have almost the same mineral assemblages and mineral paragenesis (Figure 4g–i).
The No. I and No. II orebody, characterized by disseminated- and stockwork-type ores, are respectively hosted in the pyrite-sericite-quartz alteration zone and sericite-quartz alteration zone which are located in the footwall of the Jiaojia Fault. The biggest No. III orebody (reserves 57.91% Au) occurs in the K-feldspar altered alteration zone. It is characterized by both Jiaojia-style and Linglong-style mineralization. The auriferous quartz veins are surrounded by Sericite-quartz alterations.
The relationships between different veins in the field clearly shows their relative formation timing (Figure 5): (1) Biotite granite; (2) earlier lamprophyre vein; (3) K-feldspar granite and granite pegmatite; (4) quartz sulfide vein; (5) later lamprophyre vein; and (6) calcite vein.
As is pointed out above, there is no difference between different mineralization styles in mineral paragenesis in the Sizhuang gold deposit. The primary metallic mineral in ores is pyrite with lesser chalcopyrite, galena, sphalerite, pyrrhotite, and electrum. The gangue minerals mainly contain sericite, quartz, and calcite (Figure 6). With the study of cross-cutting relationships, textures, and mineral paragenesis, three mineralization stages have been divided which include the early stage, main stage, and late stage (Figure 7).
The early stage is characterized by sericite-quartz-altered rocks with magmatic K-feldspar and white-milky quartz veins. There are less pyrite and few gold in the early stage. Few gold is deposited in this stage.
The main stage is characterized by the formation of quartz-pyrite-base-metal-sulfide stockworks and veins/veinlets, with a mass of gold and grey quartz in it. Gold occurs along the crack of pyrite. According to mineral assemblage, the main stage can be divided into two parts. In the earlier part, pyrite is the dominating sulfide. The later part is featured with the sulfide assemblage of pyrite, chalcopyrite, galena, and sphalerite.
The late stage is characterized by calcite veins/veinlets crosscutting the veins of main stage, with less pyrite and no visible gold in it.

3. Sampling and Analytical Procedures

Samples with different stages and mineralization styles were chosen for the fluid inclusion analyses on the basis of detailed fieldwork (Table 1). Twenty 0.2 mm-thick polished sections were used in the petrographic study. Quartz is the host mineral of fluid inclusion in early stage and main stage (Figure 8a,c). Calcite is the host mineral in late stage (Figure 8b,d). At length, eight sections were selected for microthermometric analysis, and 168 sets of data were obtained.
Fluid-inclusion microthermometry was made on the Linkam THMSG 600 heating-cooling stage (−198 °C to 600 °C) on a Leitz microscope at the Fluid Inclusion Laboratories, China University of Geosciences, Beijing. Synthetic fluid inclusions were used to calibrate the stage to make sure for an accuracy of which the error is ±0.1 °C at temperatures <30 °C and ±1 °C at temperatures >30 °C, the heating rat of carbonic phase (TmCO2) and clathrate-melting temperatures (Tmclath) are 0.2 °C/min, and it is 1.0 °C/min for the carbonic phase (ThCO2).

4. Results

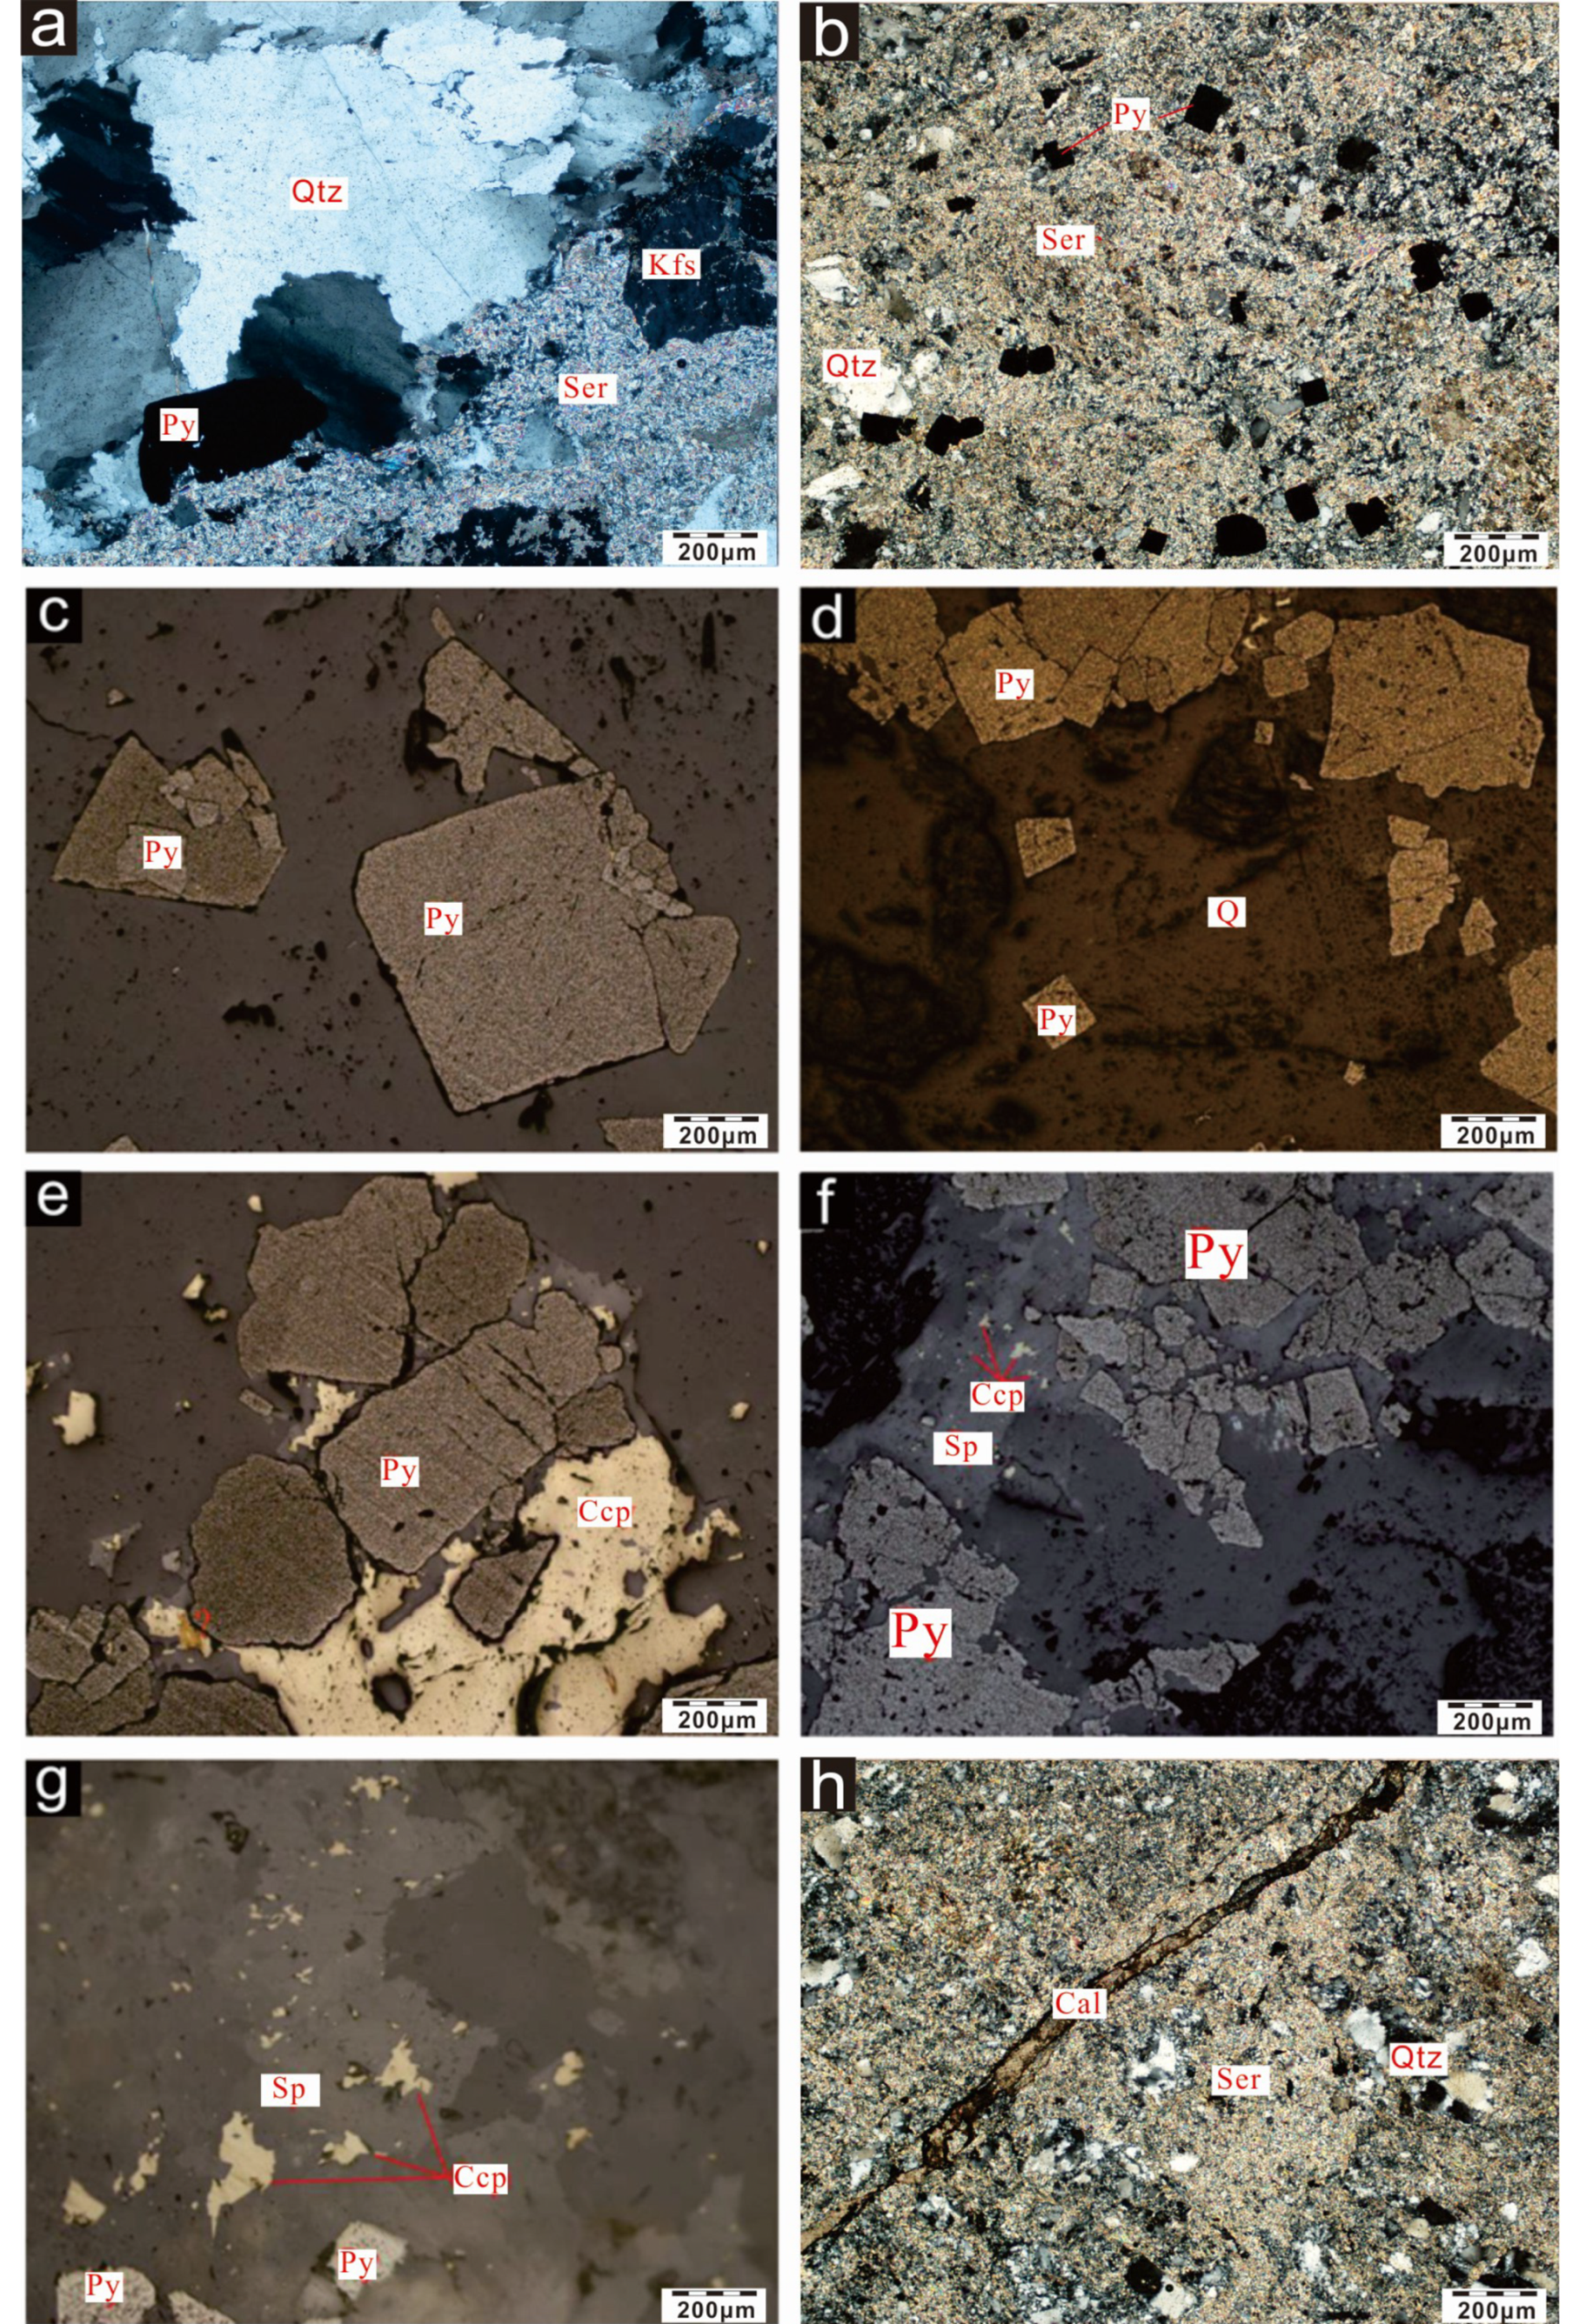
4.1. Fluid Inclusion Petrography

Quartz grains border upon or included by pyrite were chosen, and 27 inclusion clusters were identified, which are mostly interpreted to be primary in origin. The inclusions generally growing along trails, which may be secondary or pseudosecondary, are not used in following analysis.
By detailed petrography, following microthermometry and a comparison with a previous study in the Sizhuang gold deposit [16], three types of primary fluid inclusions were identified (Figure 9): H2O–CO2–NaCl inclusions (type 1), aqueous inclusions (type 2) and CO2 inclusions (type 3). Most type 1 inclusions contain two or three phases (liquid H2O + CO2 rich vapor or liquid H2O-liquid CO2– CO2 rich vapor, respectively) at room temperature (Figure 9c,d). These inclusions (3–11 μm in diameter), the carbonic phases of which mainly account for 10–40%, commonly appear as groups or along growth zones and are widespread in any stages. Type 2 aqueous inclusions, which are commonly 2–13 μm in diameter, consist of H2O liquid and H2O vapor (Figure 9a,b). The degree of fill of H2O vapor mostly range 10–40%. Like most of the gold deposit in Jiaodong [6,9,10,11], type 3 primary CO2 inclusions are small (2–4 μm in diameter) and are infrequent in this study. They include CO2 liquid and CO2 vapor (Figure 9e). There is a phenomenon in main stage that both type 1 and type 2 fluid inclusions with similar total homogenization temperatures occur in the same inclusion cluster (Figure 9f), which suggests immiscibility during main stage.

4.2. Microthermometry of Fluid Inclusions
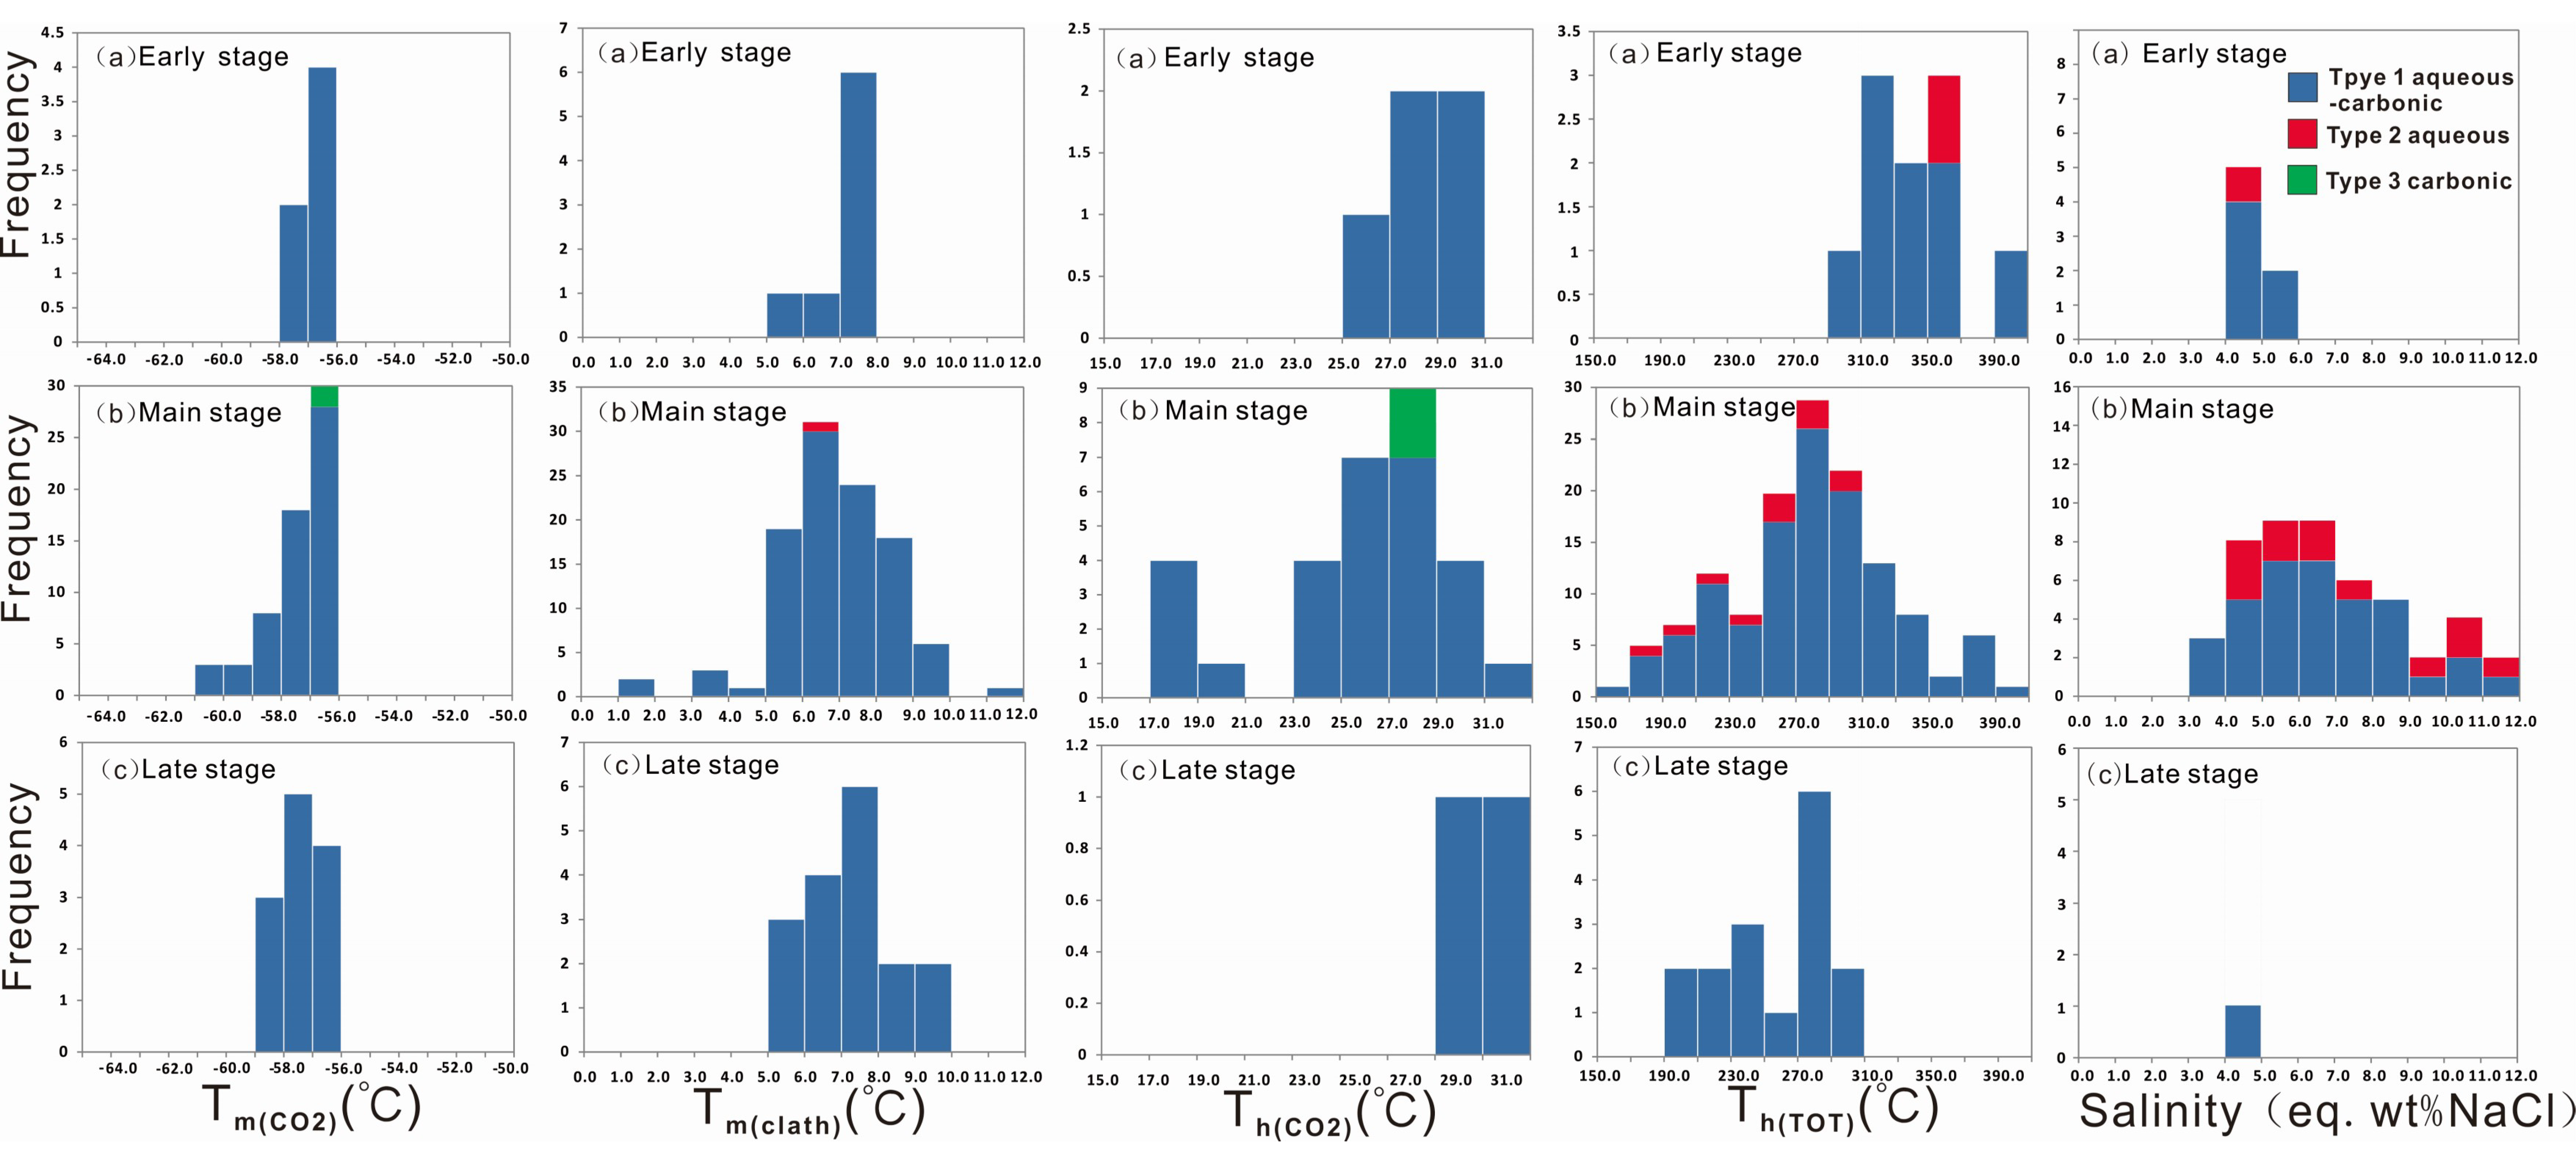
4.2.1. Early Stage

Type 1 H2O–CO2 inclusions and type 2 aqueous inclusions were identified in this stage. For type 1 inclusions, the carbonic phase melting temperatures (TmCO2) of H2O–CO2 inclusions ranged between −57.5 and −56.6 °C (mean −56.9 °C, n = 6) (Figure 10; Table 2). The integral clathrate-melting temperature (Tmclath) was 5.2–7.9 °C (mean 7.3 °C, n = 8) (Figure 10; Table 2). The homogenization of CO2 (ThCO2) occurred in the vapor phase range from 26.9 to 29.5 °C (mean 28.0 °C, n = 5) (Figure 10; Table 2). The total homogenization temperatures (ThTOT) occurred between 303 and 390 °C (mean 336 °C, n = 8) (Figure 10; Table 2). For type 2 inclusions, the final ice melting temperatures (Tmice) and total homogenization temperature (ThTOT) of type 2 inclusions were −2.7 °C (n = 1) and 350 °C (n = 1) (Figure 10; Table 2).

4.2.2. Main Stage

In main stage, the three inclusion types mentioned above were all observed.
For type 1 inclusions (Figure 10; Table 2), the carbonic phase melting temperatures (TmCO2) of H2O–CO2 inclusions ranged from −60.5 to −56.5 °C (mean −57.6 °C, n = 55). The integral clathrate-melting temperature (Tmclath) was between 5.2–7.9 °C (mean 6.9 °C, n = 92). The homogenization of CO2 (ThCO2) occurred in the vapor phase range 17.6 to 30.5 °C (mean 25.7 °C, n = 24) which was much wider than the range of the type 1’s ThCO2 in early stage, which suggested the possibility of a bigger density change in main stage. The total homogenization (ThTOT) into liquid occurred between 165 and 342 °C (mean 272 °C, n = 100). Some of the type 1 inclusions contained second phases at room temperature, which made them look like aqueous inclusions. However, when the temperature approximately cools down to 16 °C, they became 3-phases inclusions.
For type 2 fluid inclusions (Figure 10; Table 2), the final ice melting temperatures (Tmice) ranged between −8.7 and −2.5 (mean −4.7 n = 12). The total homogenization (ThTOT) into liquid occurred between 183 and 392 °C (mean 256, n = 13).
For CO2 inclusions (Figure 10; Table 2), the carbonic phase melting temperatures (TmCO2) of CO2 inclusions were −56.6 °C (n = 2). The homogenization of CO2 (ThCO2) occurred in the vapor phase at 27.1 °C, nearly the same as ThCO2 of the mean of type 1.

4.2.3. Late Stage

Only type 1 H2O–CO2 inclusions were identified in this stage. The carbonic phase melting temperatures (TmCO2) ranged between −58.3 and −56.6 °C (mean −57.5 °C, n = 12). The integral clathrate-melting temperature (Tmclath) was 5.0–9.6 °C (mean 7.2 °C, n = 12). The homogenization temperatures of CO2 (ThCO2) in the vapor phase ranged from 29.4 to 31.0 °C (mean 30.2 °C, n = 2), which was much wider than the range of ThCO2 in the early stage, suggesting that a larger density change occurred in this stage. The total homogenization temperatures (ThTOT) occurred between 195 and 289 °C (mean 242 °C, n = 16) (Figure 10; Table 2).

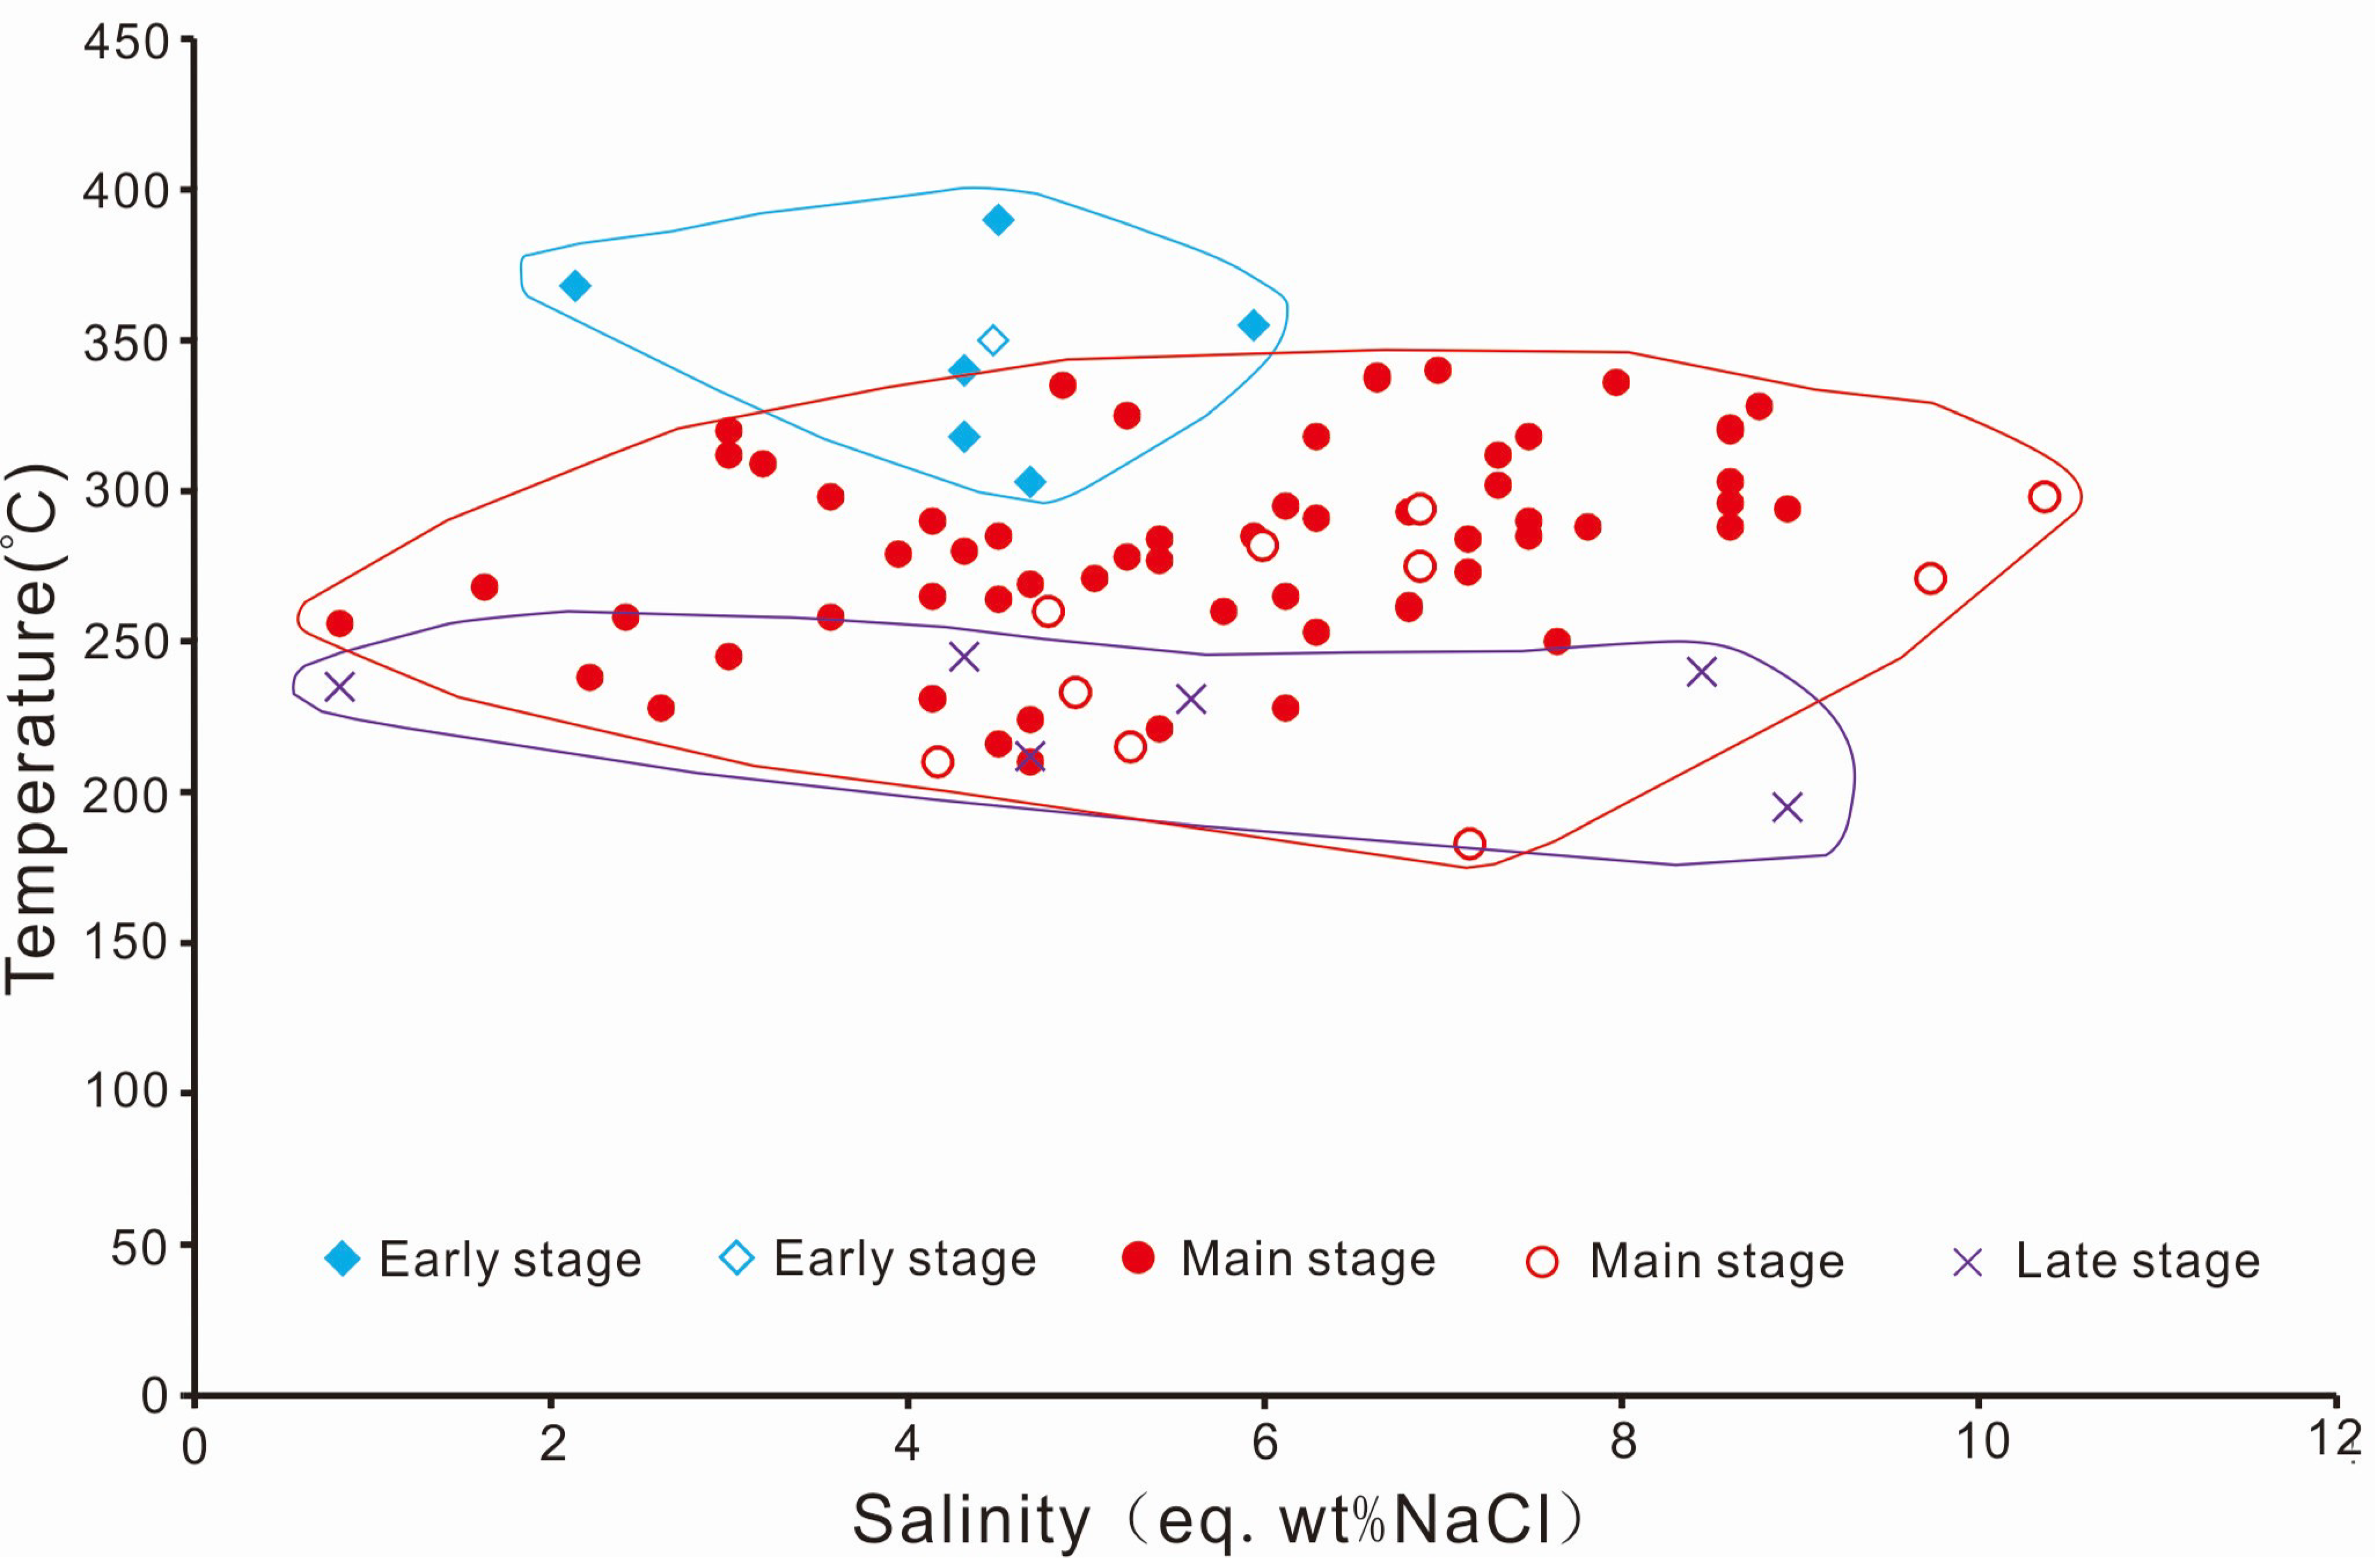
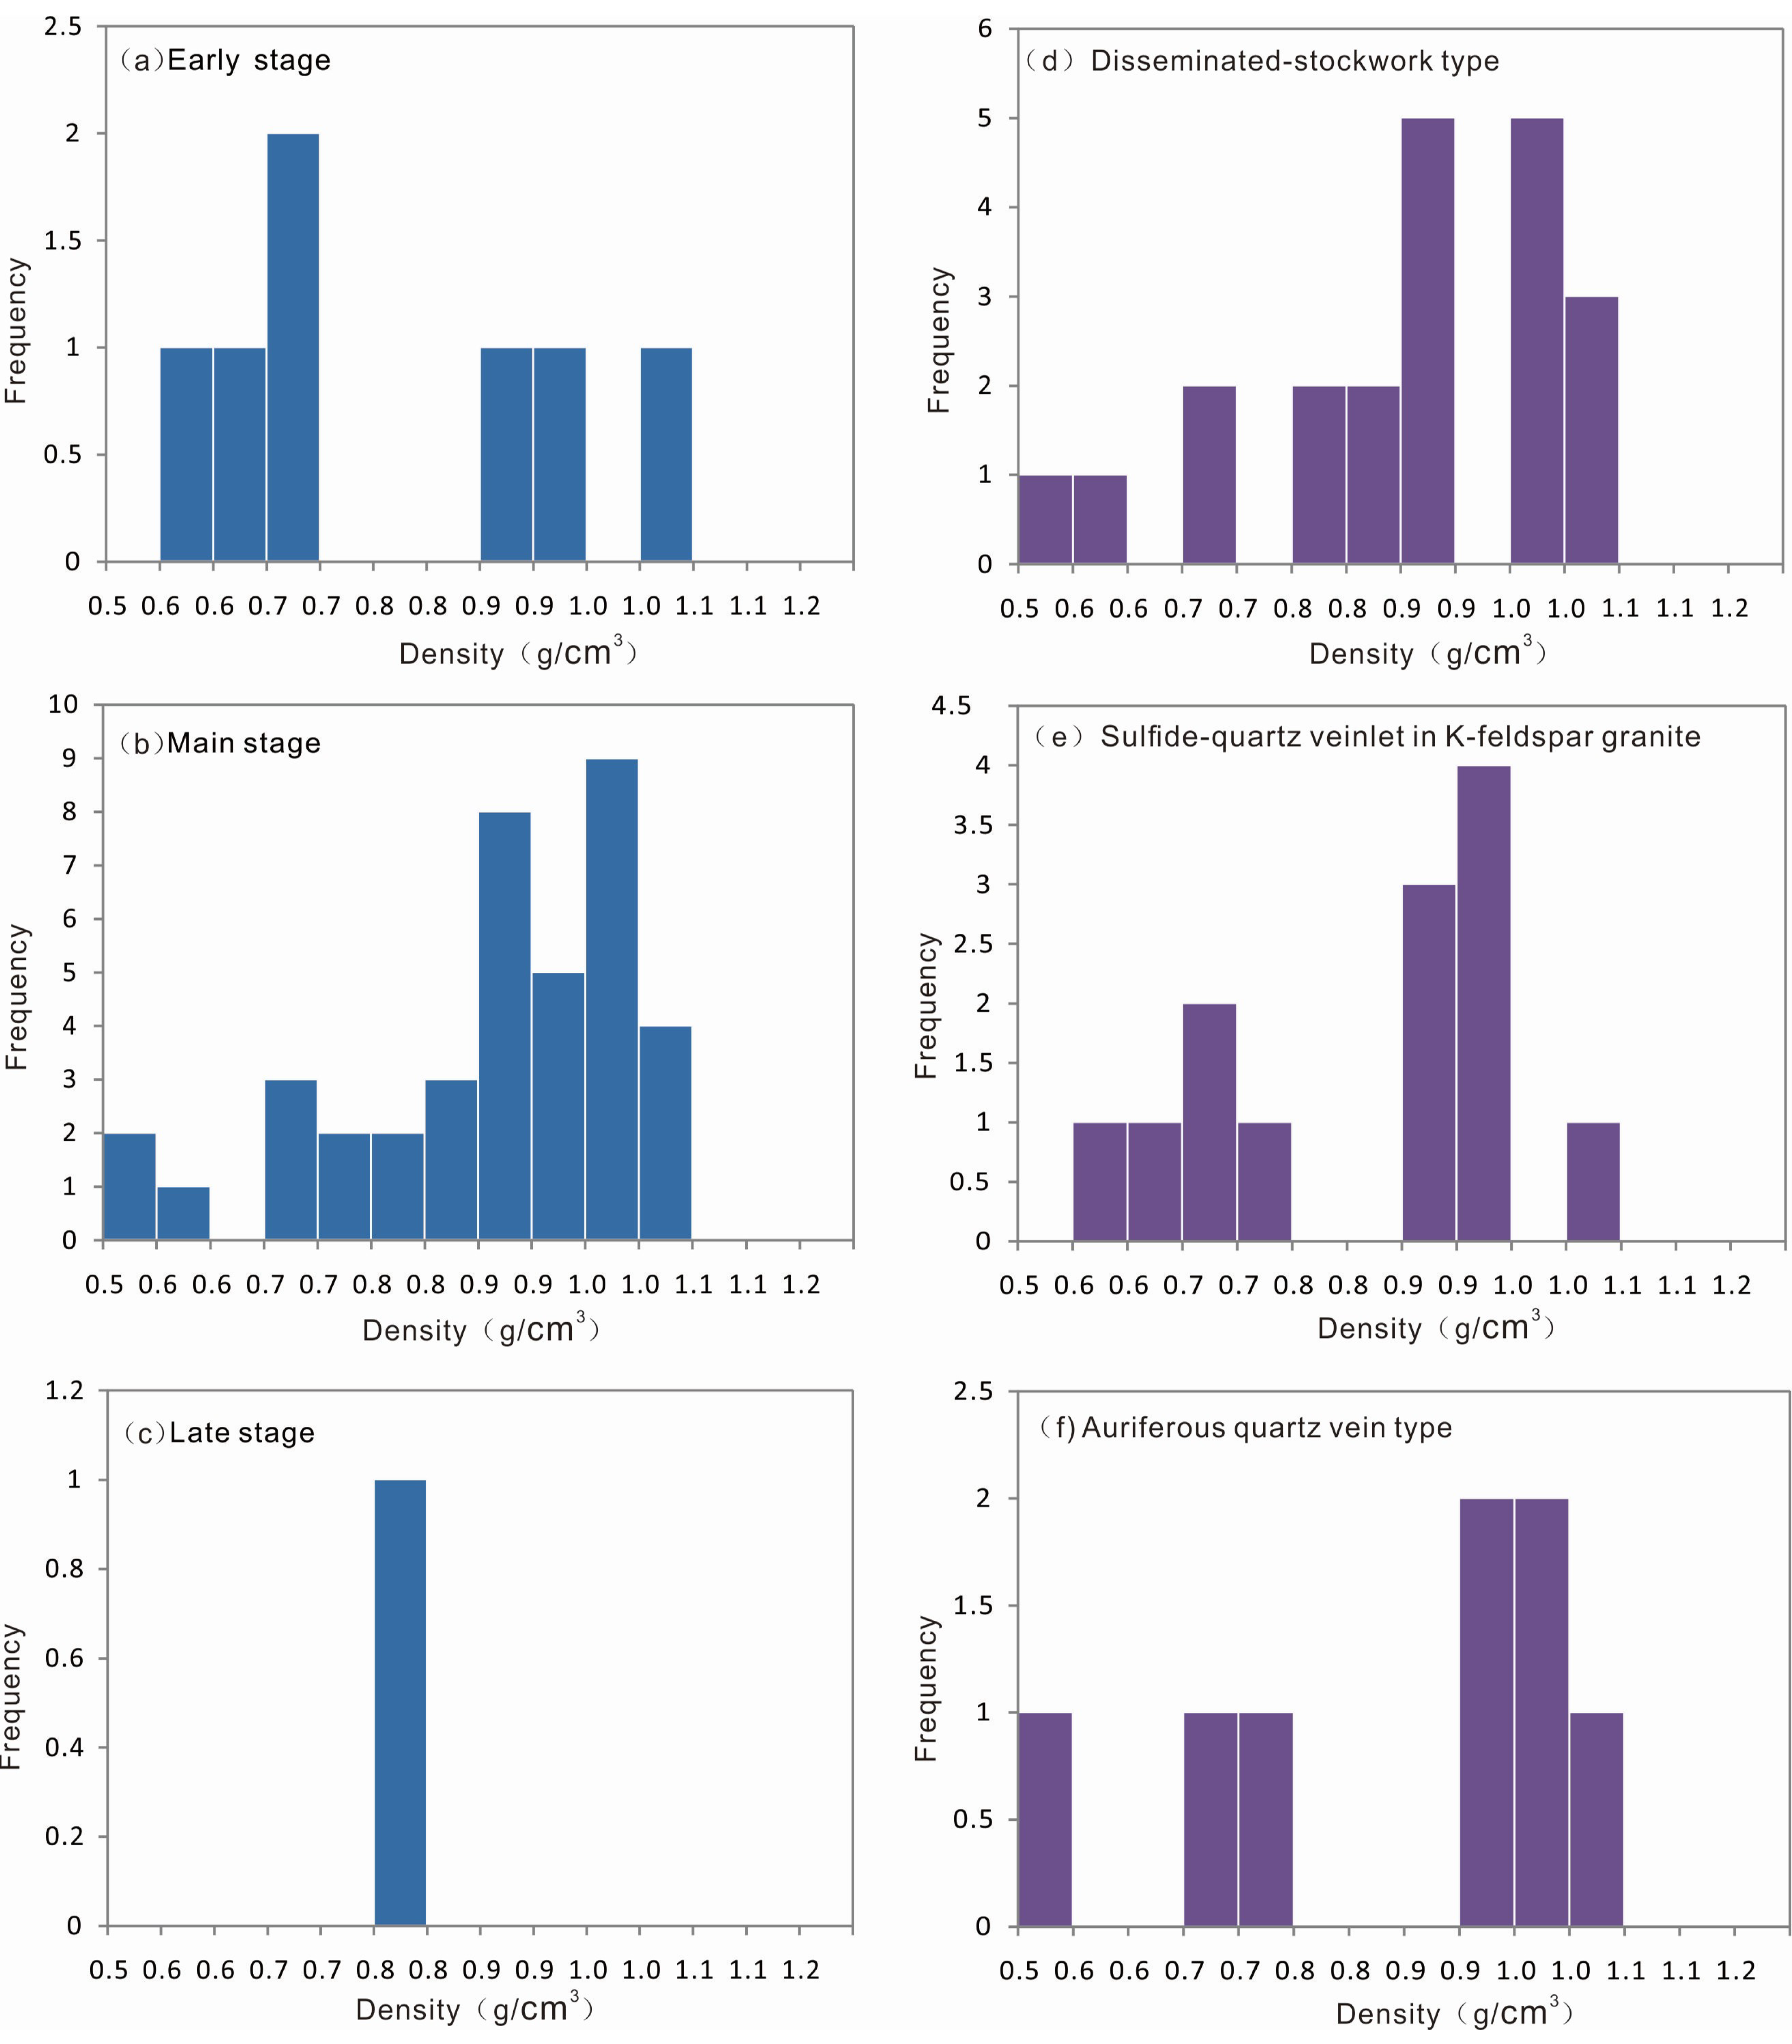
4.2.4. Salinity and Density

The salinity (wt % NaCl eq.) and density of fluid inclusions were calculated by the software MacFlincor [31]. These calculations were applied to the H2O–CO2 inclusions (Type 1) and aqueous inclusions (Type 2). The measured salinities of type 1 H2O–CO2 inclusions were between 4.14 and 8.93 wt % NaCl eq. (meanly 5.99–8.93 wt % NaCl eq.). Those of type 2 aqueous inclusions were 4.17–11.83 wt % NaCl eq. (meanly 4.17–9.73 wt % NaCl eq.). On the whole, the range of fluid salinity in the Sizhuang gold deposit was 4.14–11.83 wt % equiv. NaCl (Figure 10; Table 2).
The range of densities of type 1 H2O–CO2 inclusions was 0.516–1.017 g/cm3 (mean 0.886 g/cm3). The range of type 2 aqueous inclusions was 0.506–0.937 g/cm3. All in all, the density of fluid Sizhuang gold deposit ranged between 0.506 to 1.017 g/cm3.

5. Discussion

5.1. Fluid Immiscibility and Pressure Fluctuation

As is mentioned above, the H2O–CO2 and aqueous inclusions hosted in pyrite-related quartz in main stage can occur in a same inclusion cluster (Figure 9f), which can be considered as evidence of a fluid immiscibility. However, fluid mixing and necking down can result in this phenomenon as well [32,33]. First and foremost, it should be eliminated that the fluid mixing and/or necking down may be the reasons for co-occurrences of the H2O–CO2 inclusions and aqueous inclusions.
In a mixing fluid, the homogenization temperatures and salinities of H2O–CO2 inclusions are different from those of aqueous inclusions [34]. However, in this study, the ranges of salinities of H2O–CO2 inclusions and aqueous inclusions are similar and the homogenization temperatures are discrepant, which indicates the fluid mixing is not the reason for type 1 and type 2 being in the same fluid cluster. Although necking down could generate this assemblage, the relatively constant degree of filling of vapor in each inclusion clusters and the low deformation level of quartz can even suggest that it should be eliminated.
Moreover, more evidences of immiscibility are shown in this study: (1) Gold mineralization related H2O–CO2 inclusions and aqueous inclusions occupy in same assemblages (Figure 9f); (2) compared with H2O–CO2 inclusions, aqueous inclusions have slightly lower total homogenization temperatures and higher salinities (Figure 11), which correspond with fluid immiscibility [35,36]; and (3) the similar homogenization temperatures of type 1 and type 3 suggest the enrichment of CO2 may be caused by fluid immiscibility [37,38] (Figure 10; Table 2). Fluid immiscibility is vital in the Sizhuang deposit’s gold mineralization.
During fault movement, the fluid pressure decline can lead to the immiscibility of H2O–NaCl–CO2 crustal fluid [39]. Also, there is another argument that retrograde boiling can cause fluid immiscibility without a sharp decline in fluid pressure [40]. In this study, there is a phenomenon in main stage that the ThTOT of type 2 aqueous inclusions is about 40 °C lower than that of the coexisting type 1 H2O–CO2 inclusions (Figure 11). It can be caused by the partial CO2 boiling in saturated aqueous fluid [41]. Considering the Sizhuang gold deposit is controlled by a fault, CO2 boiling may cause the fluid pressure fluctuation in the structural controlled Sizhuang gold deposit during faulting [41,42].
Fluid pressure can be reflected by the density of the fluid inclusions [43,44]. In the Sizhuang gold deposit, the density ranges of the fluid inclusions in different stages and mineralization styles are wide (Figure 12), which show the evidence of a fluid pressure fluctuation during gold mineralization.

5.2. Source and Evolution of Ore-Fluid

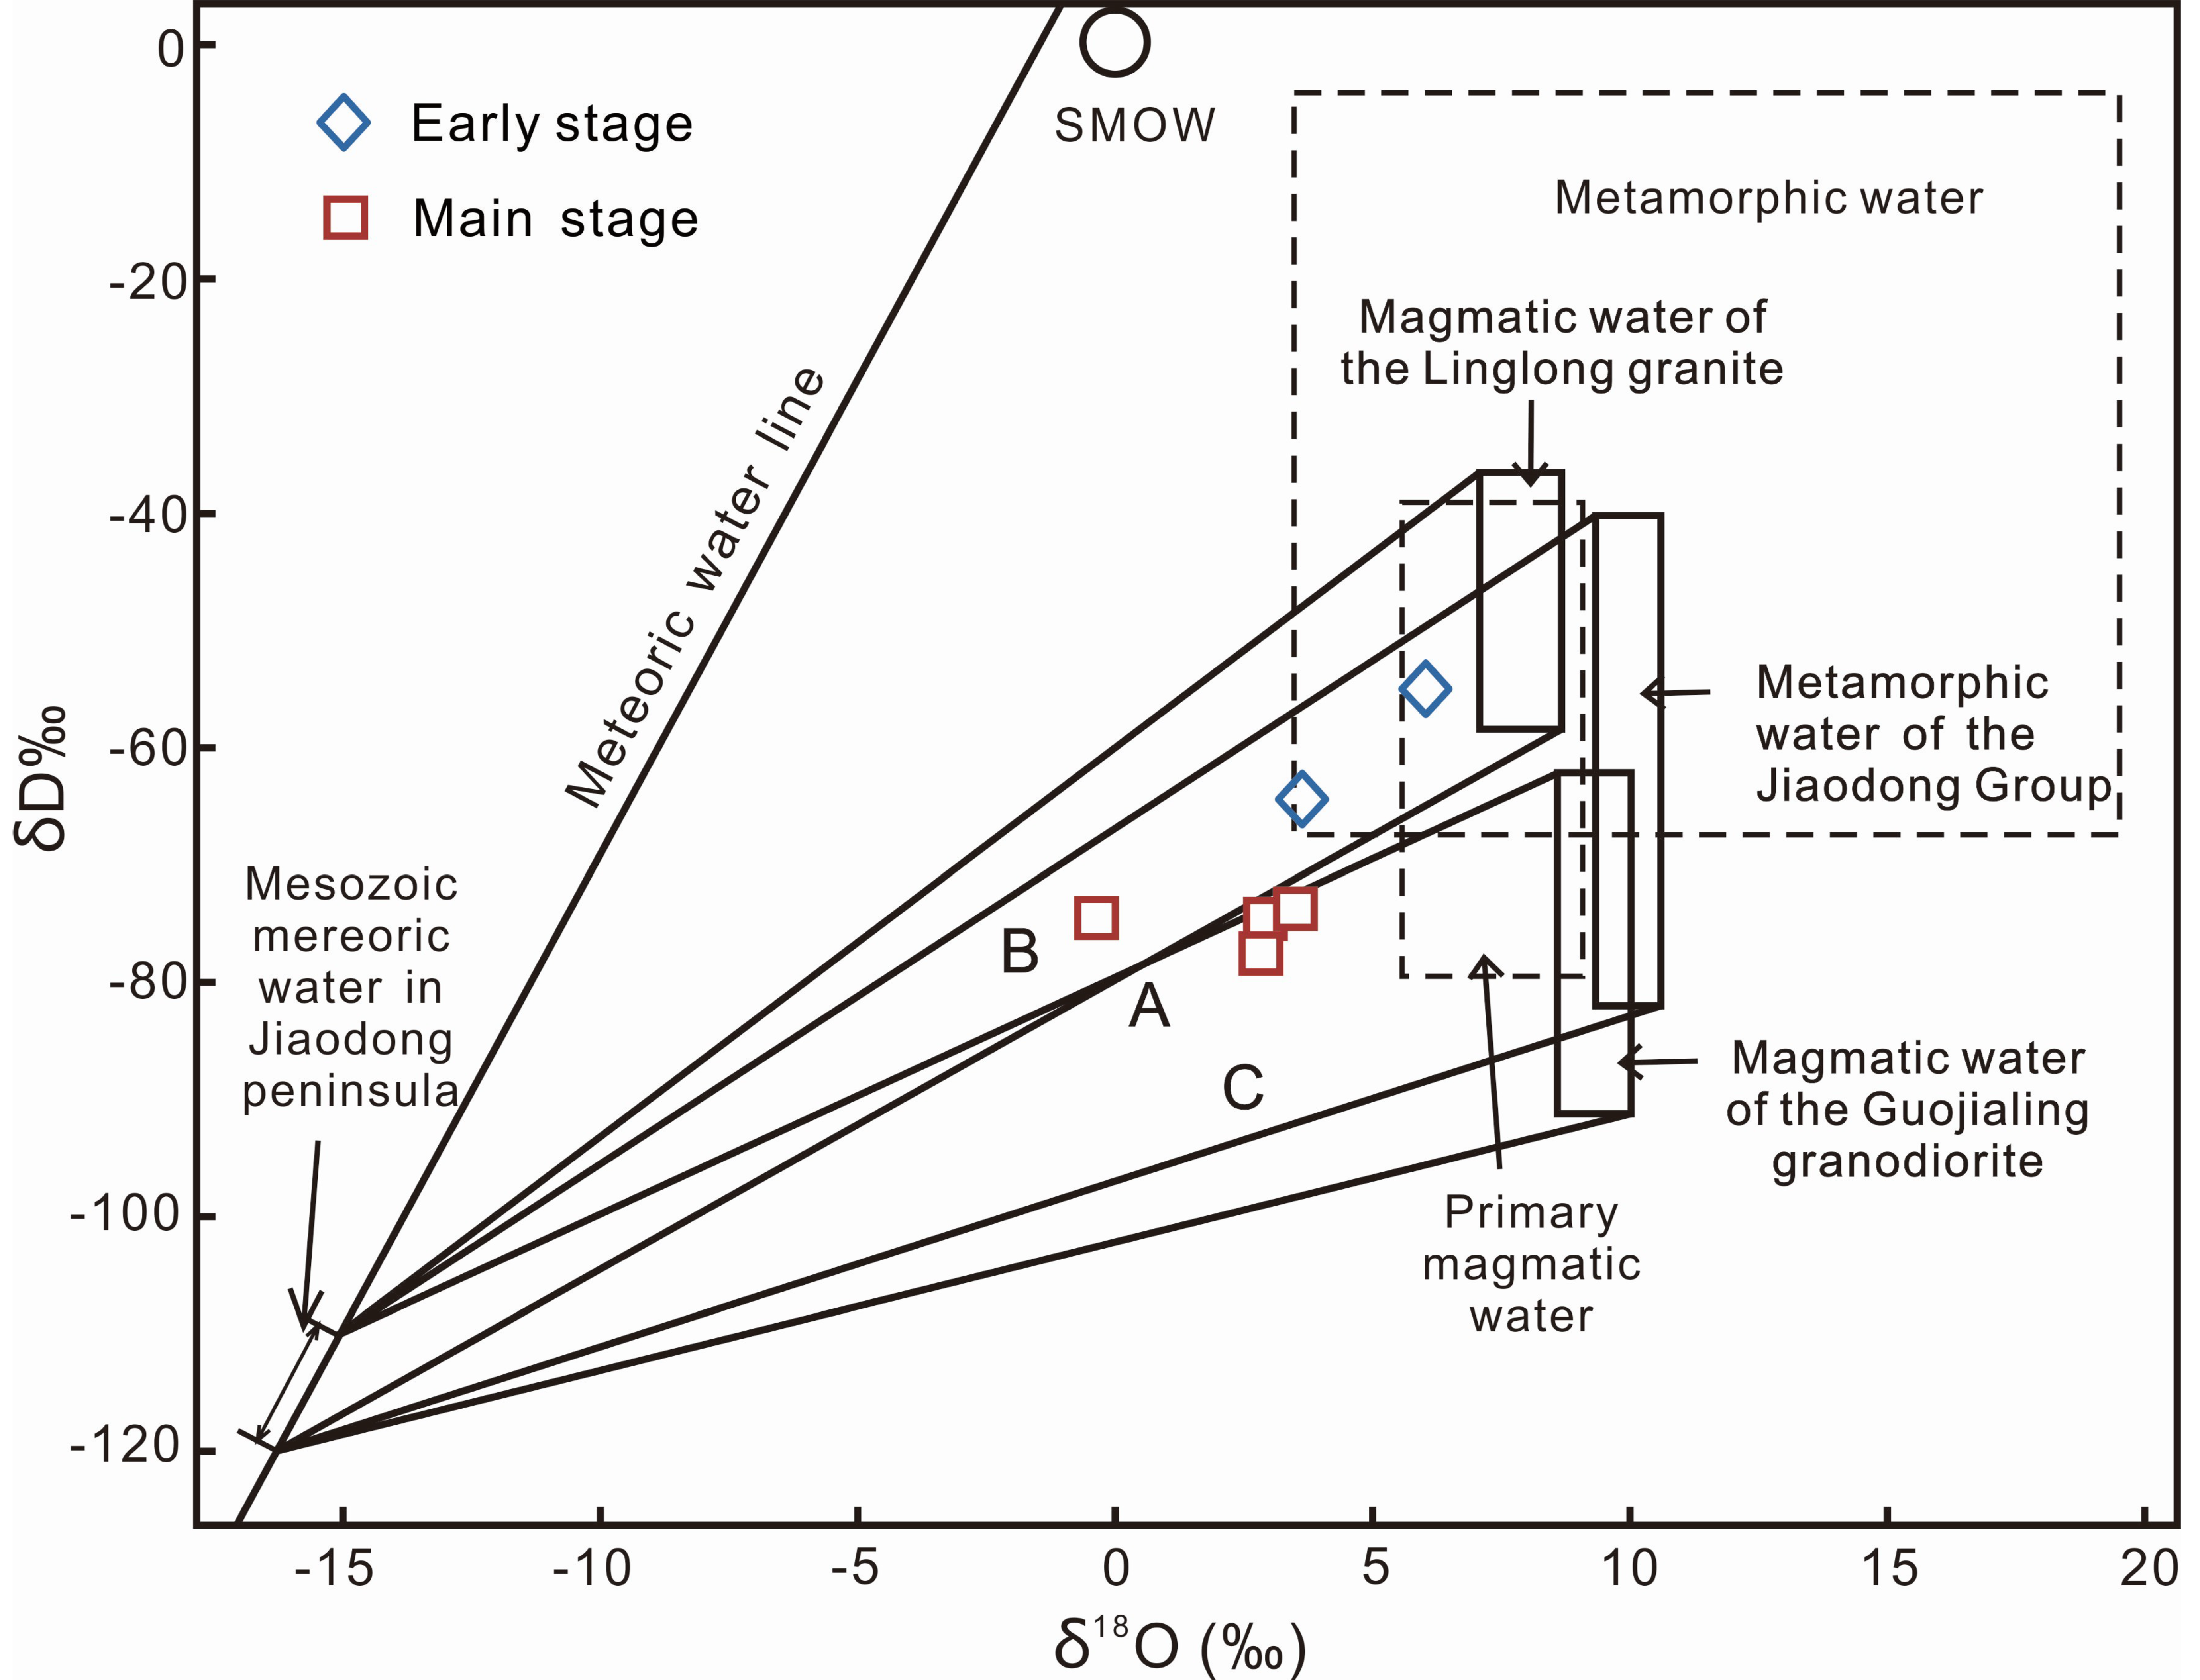
5.2.1. Source of Ore-Fluid

H–O isotopes are commonly used for studying the source of fluid. Many previous studies compare the H–O isotopes compositions with those of magmatic water, metamorphic water and meteoric water in order to speculate the source of fluid. On the one hand, the range of natural H–O isotopes are wide, which makes the result inaccurate. On the other hand, ore-fluid may have a complicated water–rock interaction during transportation and contacting with rocks [45]. Therefore, more natural waters which may have a possibility of mineralization in the Sizhuang deposit (metamorphic water of the Jiaodong Group, magmatic water of the Linglong granite, magmatic water of the Guojialing granite) are compared with the H–O isotope composition in this study.
The H–O isotope composition of the Sizhuang deposit, which were collected from previous studies (Sample 10SZ06, Z4974-5, 10SZ01 and 10SZ31 are from Wei et al., 2015; sample 10SZ28 and 10SZ32 are from Jiang et al., 2011) [16,46], shows that δ18Oquaitz values range from 9.7‰ to 14.2‰. The oxygen isotope composition of hydrothermal waters (δ18OH2O) and the δDH2O values of inclusions are calculated by a fractionation formula system of stable isotope from Clayton et al. (1972) [47] and Suzuoki and Epstein (1976) [48]. The δ18OH2O values range from −0.5‰ to 6.1‰, and δDH2O values range from −77.7‰ to −55‰ (Table 3).
In general, similar to the majority of the gold deposits in Jiaodong, the spots of δ18O and δD are located between metamorphic water/magmatic water and meteoric water (Figure 13). In view of the H–O isotope geochemical background in the Jiaojia gold belt (Table 4) and the absence of Guojialing granite in the Sizhuang god deposit, all spots located in region A and B suggest that the metamorphic water of the Jiaodong Group and the magmatic water of Linglong granite may take part in the mineralization (Figure 13). There is a trend of spots approach to Mesozoic meteoric water, which indicates meteoric water may be a part of mineralization. Therefore, the mixing fluid of magmatic water of Linglong granite, metamorphic water of the Jiaodong Group and meteoric water is the source of ore-fluid.

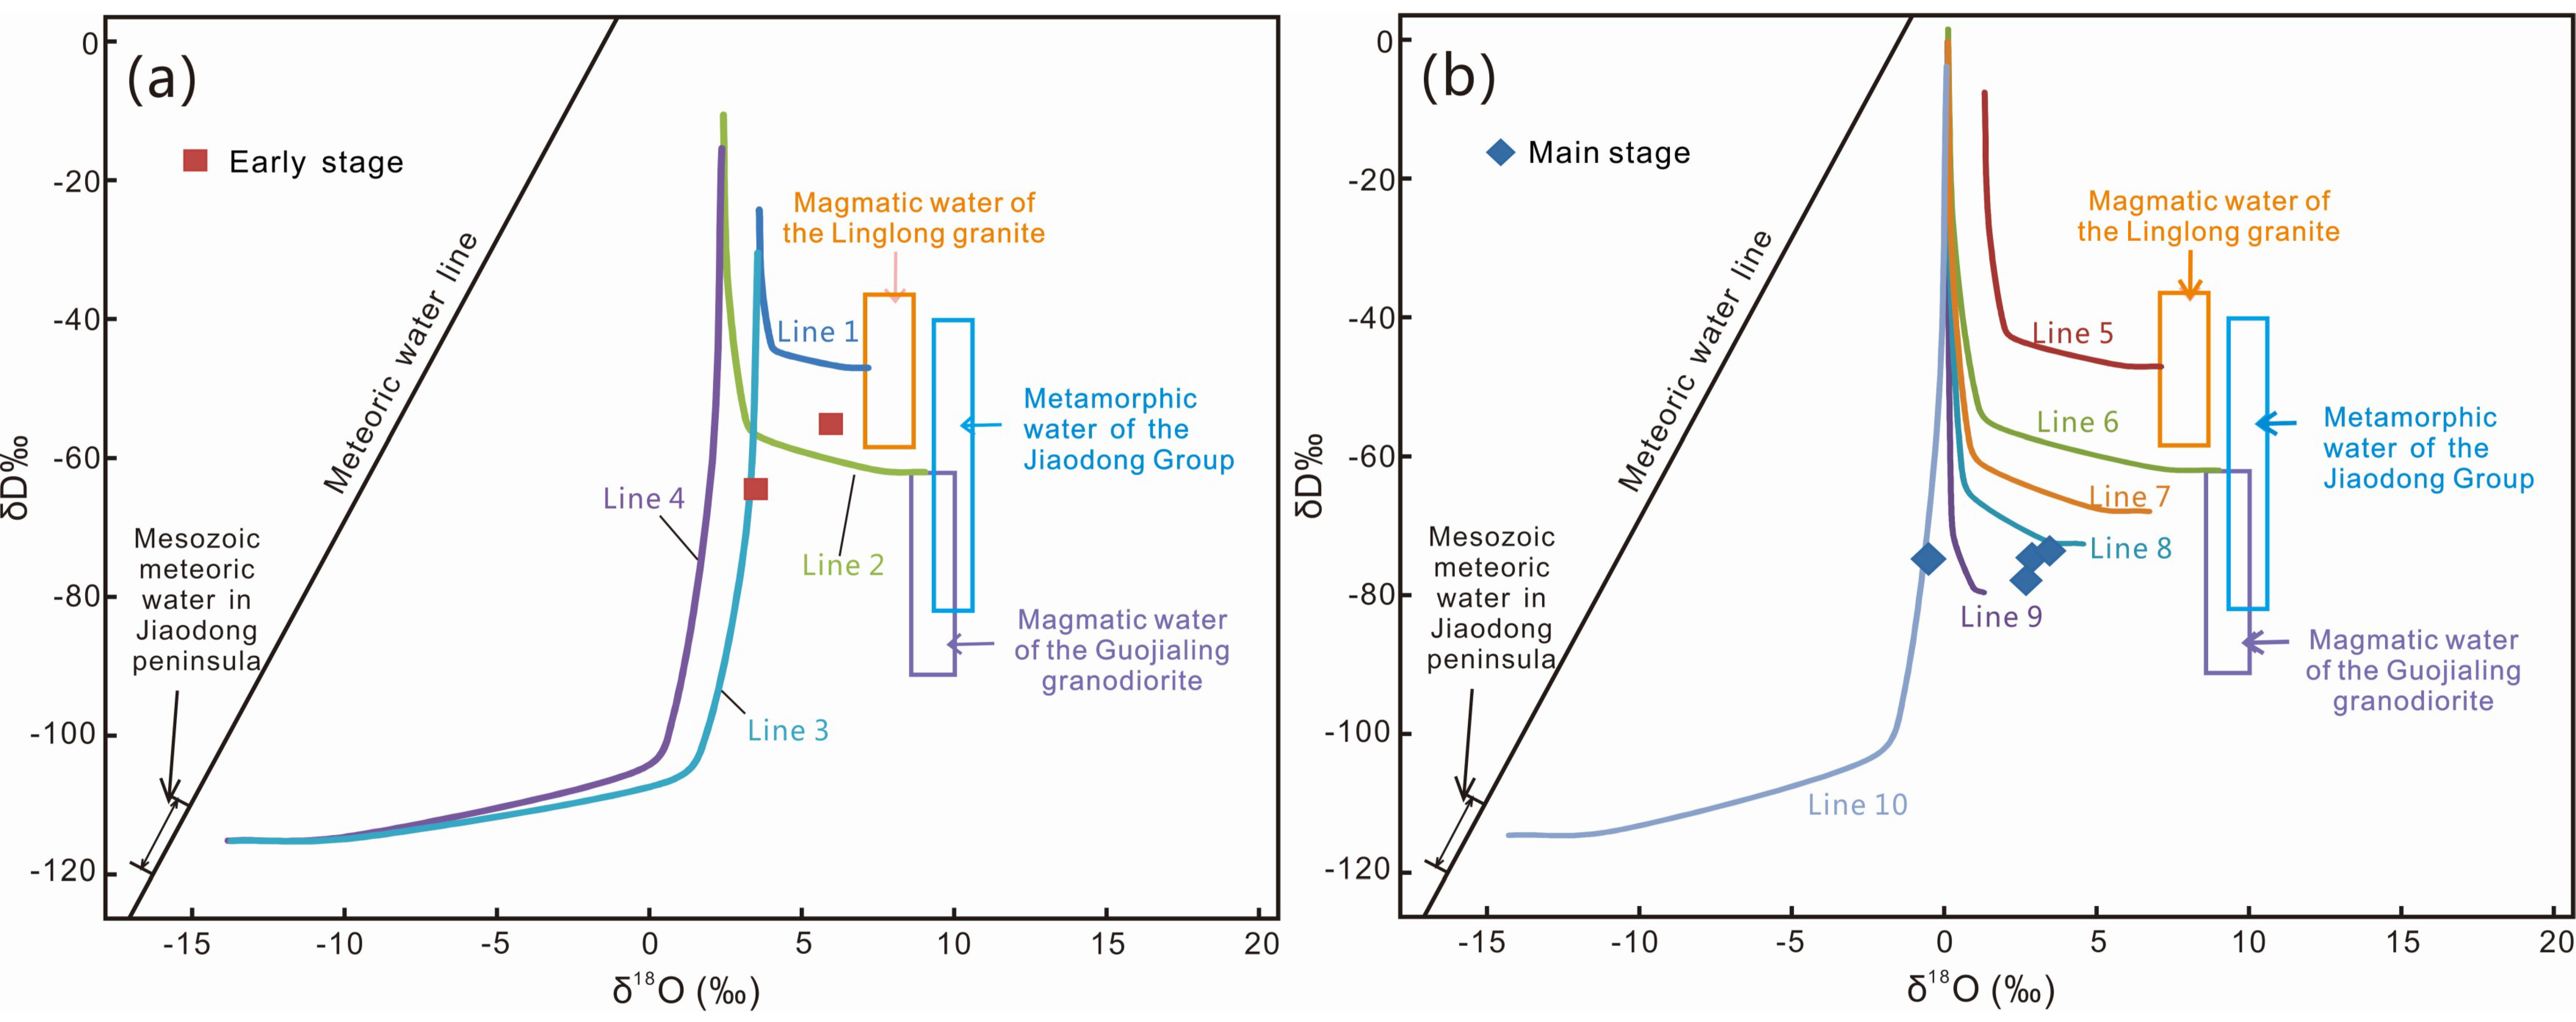
5.2.2. Fluid Evolution and Water–Rock Interaction

As is noted above, ore-fluid may experience the water–rock interaction before mineralization. The water–rock interaction of ore-fluid and wall rocks follows the equation of meteoric-hydrothermal system [54]:
W · δ water i + R · δ Rock i = W · δ water f + R · δ Rock f
where δ water i and δ Rock i are the values of isotope compositions before the water–rock interaction; δ water f and δ Rock f are the final values after exchange; W and R are the numbers of atoms (oxygen or hydrogen in this study) in fluid and wall rock, respectively. When the water–rock exchange system is at equilibrium ( Δ R - W = δ Rock f δ water f ), then [54]
δ W f = δ Rock f δ Rock i δ Water i ( δ Rock f Δ RW ) = δ R i ( W / R ) δ W i Δ RW 1 + ( W / R )
The H–O isotope composition of granite and metamorphic rocks in the giant Jiaodong gold deposit can be replaced by δDbiotite and δ18Oplagioclas (An30) [50]. Δ RW of δO18 and δD were calculated and demonstrated in this system as follows [48,55]:
Δ RW 18 O = 10 3 ln α plagioclas - water = 2.68 × 10 6 T 2 3.53
Δ R - W D = 10 3 ln α biotite - water = 21.3 × 10 6 T 2 2.8
The calculation of water–rock interaction uses the rate of quality of δD and δ18O in this study. In intermediate-acidic granite, the quality rates of oxygen and hydrogen have a stable relationship with the rates of atoms’ numbers as follows [56]:
O ( W / R ) atoms = 2 · O ( W / R ) quality
D ( W / R ) atoms = 100 · D ( W / R ) quality
Therefore, the final values of δO18 and δD can be worked out with detailed calculation (Table S1).
Figure 14a shows the H–O isotope composition and H–O isotope evolution after an exchange in the water–rock system in early stage (mean homogenization temperature 305 °C). Line 1 represents the evolution of exchange between the magmatic water of Linglong granite and Jiaodong Group metamorphic rocks. Line 2 represents the evolution of exchange between he metamorphic water of the Jiaodong Group and Linglong Granite. Line 3 represents the evolution of exchange between the meteoric water and Jiaodong Group metamorphic rocks. Line 4 represents the evolution of exchange between the meteoric water and Linglong granite.
Figure 14b shows the H–O isotope composition and H–O isotope evolution after exchange in the water–rock system in main stage (mean homogenization temperature 235 °C). Line 5 represents the evolution of exchange between the magmatic water of Linglong granite and Jiaodong Group metamorphic rocks. Line 6 represents the evolution of exchange between the metamorphic water of the Jiaodong Group and Linglong Granite. Lines 7–9 represents the evolution of exchange between the mixing fluid (metamorphic water of the Jiaodong Group and meteoric water mix with the rate 8:1, 4:1 and 2:1, respectively) and Linglong granite. Line 10 represents the evolution of exchange between the meteoric water and Linglong Granite.
In Figure 14a, the spots are under Line 1 distinctly, which suggests the magmatic water of Linglong granite may be not involved in fluid evolution in the early stage of the Sizhuang gold deposit. These spots are around Line 2, and one of them is on Line 3, indicating that the metamorphic water of the Jiaodong Group plays an important role in fluid evolution of the main stage.
In Figure 14b, the spots of the main stage mostly fall between Line 8 and Line 9, which suggest that the metamorphic water of the Jiaodong Group is the uppermost source of ore-fluid of the Sizhuang gold deposit. When the values of W/R are big (10–0.1), the mixing fluid of metamorphic water of the Jiaodong Group and meteoric water (with the mixing rate between 4:1 and 2:1) is propitious to gold mineralization.
In conclusion, the source of the ore-fluid is the metamorphic water of the Jiaodong Group in early stage. In main stage, the metamorphic water of the Jiaodong Group and meteoric water mix with the rate between 4:1 and 2:1. The mixing fluid reacts with Linglong granite and extracts mineralization-related elements for gold deposition.

6. Conclusions

  • Microthermometry showed less obvious differences between different mineralization styles, which suggested a similar mechanism of gold deposition.
  • The ore-forming fluid was in a medium-high temperature (210–368 °C), medium-low salinity (4.14–11.83 wt% NaCl eq.) and low density (0.516–1.02 g/cm3) CO2–H2O–NaCl system. The peak of ThTOT during mineralization appeared in 270–300 °C.
  • The fluid immiscibility caused by pressure fluctuation at the main stage was the key mechanism of gold mineralization in the Sizhuang gold deposit.
  • The source of ore-forming fluid in the metallogenic early stage was mainly the original metamorphic water of Jiaodong group. In main stage, the mixing fluid of the original metamorphic water of Jiaodong group and meteoric water in mixing ranged between 4:1 to 2:1 was most conducive to mineralization.

Supplementary Materials

The following are available online at https://www.mdpi.com/2075-163X/9/3/190/s1, Table S1: The calculations of the water–rock interaction.

Author Contributions

Y.-J.W., L.-Q.Y., and J.-Q.F. conceived and designed the ideas; Y.-J.W. and J.-Q.F. performed the experiments and analyzed the data; Y.-J.W. prepared the original draft; Y.-J.W., L.-Q.Y, and H.W. reviewed and edited the draft; G.-Y.L., W.-C.L., and S.-G.L. provided the resources.

Funding

This study was financially supported by the National Key Research Program of China (Grant No. 2016YFC0600107); the National Natural Science Foundation of China (41572069); the MOST Special Fund from the State Key Laboratory of Geological Processes and Mineral Resources, China University of Geosciences (Grant No. MSFGPMR201804); the Key Laboratory of Gold Mineralization Processes and Resource Utilization Subordinated to the Ministry of Natural Resources and Key Laboratory of Metallogenic Geological Process and Resources Utilization in Shandong Province, Shandong Institute of Geological Sciences (Grant No. KFKT201801); the Key Laboratory of Gold Mineralization Processes and Resource Utilization Subordinated to the Ministry of Natural Resources and Key Laboratory of Metallogenic Geological Process and Resources Utilization in Shandong Province, Shandong Institute of Geological Sciences (Grant No. KFKT201802); and the 111 Project under the Ministry of Education and the State Administration of Foreign Experts Affairs, China (Grant No. B07011).

Acknowledgments

We would like to thank Rongxin Zhao at the Shandong Gold Mining (Laizhou) Corporation for his help during the field work, as well as Kunfeng Qiu and Liang Zhang for their suggestions and comments for this paper. We are grateful for constructive comments by the anonymous reviewers.

Conflicts of Interest

The authors declare no conflict of interest.

References

  1. Yang, L.Q.; Deng, J.; Wang, Z.L.; Zhang, L.; Guo, L.N.; Song, M.C.; Zheng, X.L. Mesozoic gold metallogenic system of the Jiaodong gold province, eastern China. Acta Petrol. Sin. 2014, 30, 2447–2467, (In Chinese with English abstract). [Google Scholar]
  2. Deng, J.; Yang, L.Q.; Li, R.H.; Groves, D.I.; Santosh, M.; Wang, Z.L.; Sai, S.X.; Wang, S.R. Regional structural control on the distribution of world-class gold deposits: An overview from the giant Jiaodong Gold Province, China. Geol. J. 2018, 54, 378–391. [Google Scholar] [CrossRef]
  3. Deng, J.; Liu, X.F.; Wang, Q.F.; Dilek, Y.; Liang, Y.Y. Isotopic characterization and petrogenetic modeling of Early Cretaceous mafic diking–Lithospheric extension in the North China craton, eastern Asia. Geol. Soc. Am. Bull. 2017, 129, 1379–1407. [Google Scholar] [CrossRef]
  4. Zhang, L.; Yang, L.Q.; Weinberg, R.F.; Groves, D.I.; Wang, Z.L.; Li, G.W.; Liu, Y.; Zhang, C.; Wang, Z.K. Anatomy of a world-class epizonal orogenic-gold system: A holistic thermochronological analysis of the Xincheng gold deposit, Jiaodong Peninsula, eastern China. Gondwana Res. 2019, in press. [Google Scholar] [CrossRef]
  5. Deng, J.; Wang, C.M.; Bagas, L.; Carranza, E.J.M.; Lu, Y.J. Cretaceous–Cenozoic tectonic history of the Jiaojia Fault and gold mineralization in the Jiaodong Peninsula, China: Constraints from zircon U–Pb, illite K–Ar, and apatite fission track thermochronometry. Mineral. Depos. 2015, 50, 987–1006. [Google Scholar] [CrossRef]
  6. Yang, L.Q.; Deng, J.; Guo, L.N.; Wang, Z.L.; Li, X.Z.; Li, J.L. Origin and evolution of ore fluid, and gold deposition processes at the giant Taishang gold deposit, Jiaodong Peninsula, eastern China. Ore Geol. Rev. 2016, 72, 585–602. [Google Scholar] [CrossRef]
  7. Goldfarb, R.J.; Santosh, M. The dilemma of the Jiaodong gold deposits: Are they unique? Geosci. Front. 2014, 5, 139–153. [Google Scholar] [CrossRef] [Green Version]
  8. Deng, J.; Wang, Q.F. Gold mineralization in China: Metallogenic provinces, deposit types and tectonic framework. Gondwana Res. 2016, 36, 219–274. [Google Scholar] [CrossRef]
  9. Wang, Z.L.; Yang, L.Q.; Guo, L.N.; Marsh, E.; Wang, J.P.; Liu, Y.; Zhang, C.; Li, R.H.; Zhang, L.; Zheng, X.L.; Zhao, R.X. Fluid immiscibility and gold deposition in the Xincheng deposit, Jiaodong Peninsula, China: A fluid inclusion study. Ore Geol. Rev. 2015, 65, 701–717. [Google Scholar] [CrossRef]
  10. Guo, L.N.; Goldfarb, R.J.; Wang, Z.L.; Li, R.H.; Chen, B.H.; Li, J.L. A comparison of Jiaojia- and Linglong-type gold deposit ore-forming fluids: Do they differ? Ore Geol. Rev. 2017, 88, 511–533. [Google Scholar] [CrossRef]
  11. Yang, L.Q.; Deng, J.; Zhang, J.; Wang, Q.F.; Gao, B.F.; Zhou, Y.H.; Guo, C.Y.; Jiang, S.Q. Preliminary studies of fluid inclusions in Damoqnjia gold deposit along Zhaoping fault zone, Shandong province, China. Acta Petrol. Sin. 2007, 23, 153–160. [Google Scholar]
  12. Yang, L.Q.; Deng, J.; Zhang, J.; Guo, C.Y.; Gao, B.F.; Gong, Q.J.; Wang, Q.F.; Jiang, S.Q.; Yu, H.J. Decrepitation thermometry and compositions of fluid inclusions of the Damoqujia Gold Deposit, Jiaodong Gold Province, China: Implications for metallogeny and exploration. J. China Univ. Geosci. 2008, 19, 378–390. [Google Scholar]
  13. Deng, J.; Liu, X.F.; Wang, Q.F.; Pan, R.G. Origin of the Jiaodong-type Xinli gold deposit, Jiaodong Peninsula, China: Constraints from fluid inclusion and C–D–O–S–Sr isotope compositions. Ore Geol. Rev. 2015, 65, 674–686. [Google Scholar] [CrossRef]
  14. Yang, L.Q.; Dilek, Y.; Wang, Z.L.; Weinberg, R.F.; Liu, Y. Late Jurassic, high Ba-Sr Linglong granites in the Jiaodong Peninsula, East China: Lower crustal melting products in the Eastern North China Craton. Geol. Mag. 2018, 155, 1040–1062. [Google Scholar] [CrossRef]
  15. Wang, Z.L. Metallogenic System of Jiaojia Gold Orefield, Shandong Province, China. Ph.D. Thesis, China University of Geosciences (Beijing), Beijing, China, 2012. [Google Scholar]
  16. Wei, Q.; Fan, H.R.; Lan, T.G.; Liu, X.; Jiang, X.H.; Wen, B.J. Genesis of Sizhuang gold deposit, Jiaodong Peninsula: Evidences from fluid inclusion and quartz solubility modeling. Acta Geol. Sin. 2015, 31, 1049–1062, (In Chinese with English abstract). [Google Scholar]
  17. Yang, L.Q.; Deng, J.; Wang, Z.L.; Guo, L.N.; Li, R.H.; Groves, D.I.; Danyushevskiy, L.; Zhang, C.; Zheng, X.L.; Zhao, H. Relationships between gold and pyrite at the Xincheng gold deposit, Jiaodong Peninsula, China: Implications for gold source and deposition in a brittle epizonal environment. Econ. Geol. 2016, 111, 105–126. [Google Scholar] [CrossRef]
  18. Jahn, B.M.; Liu, D.Y.; Wan, Y.S.; Song, B.; Wu, J.S. Archean crustal evolution of the Jiaodong Peninsula, China, as revealed by zircon shrimp Geochronology lemental and Nd-isotope Geochemistry. Am. J. Sci. 2008, 308, 232–269. [Google Scholar] [CrossRef]
  19. Deng, J.; Wang, Q.F.; Wan, L.; Liu, H.; Yang, L.Q.; Zhang, J. A multifractal analysis of mineralization characteristics of the Dayingezhuang disseminated-veinlet gold deposit in the Jiaodong gold province of China. Ore Geol. Rev. 2011, 40, 54–64. [Google Scholar] [CrossRef]
  20. Geng, Y.S.; Du, L.L.; Ren, L.G. Growth and reworking of the early Precambrian continental crust in the North China Craton: Constraints from zircon Hf isotopes. Gondwana Res. 2012, 21, 517–529. [Google Scholar] [CrossRef]
  21. Zhang, L.; Liu, Y.; Li, R.H.; Huang, T.; Zhang, R.Z.; Chen, B.H.; Li, J.K. Lead isotope geochemistry of Dayingezhuang gold deposit, Jiaodong Peninsula, China. Acta Petrol. Sin. 2014, 30, 2468–2480, (In Chinese with English abstract). [Google Scholar]
  22. Zhang, L.; Li, G.W.; Zheng, X.L.; An, P.; Chen, B.Y. 40Ar/39Ar and fission-track dating constraints on the tectonothermal history of the world-class Sanshandao gold deposit, Jiaodong Peninsula, Eastern China. Acta Petrol. Sin. 2016, 32, 2465–2476, (In Chinese with English abstract). [Google Scholar]
  23. Dong, C.Y.; Wang, S.J.; Liu, D.Y.; Wang, J.G.; Xie, H.Q.; Wang, W.; Song, Z.Y.; Wan, Y.S. Late palaeoproterozoic crustal evolution of the North China Craton and formation time of the Jingshan Group: Constraints from SHRIMP U-Pb zircon dating of meta-intermediate-basic intrusive rocks in eastern Shandong Province. Acta Petrol. Sin. 2010, 27, 1699–1706, (In Chinese with English abstract). [Google Scholar]
  24. Liu, P.H.; Liu, F.L.; Wang, F.; Liu, J.H.; Cai, J. Petrological and geochronological preliminary study of the Xiliu ~2.1 Ga meta-gabbro from the Jiaobei terrane, the southern segment of the Jiao-Liao-Ji Belt in the North China Craton. Acta Petrol. Sin. 2013, 29, 2371–2390, (In Chinese with English abstract). [Google Scholar]
  25. Faure, M.; Lin, W.; Monie, P.; Bruguier, O. Paleoproterozoic arc magmatism and collision in Liaodong Peninsula (north-east China). Terra Nova 2004, 16, 75–80. [Google Scholar] [CrossRef]
  26. Zhang, L.; Yang, L.Q.; Wang, Y.; Weinberg, R.F.; An, P.; Chen, B.Y. Thermochronologic constrains on the processes of formation and exhumation of the Xinli orogenic gold deposit, Jiaodong Peninsula, eastern China. Ore Geol. Rev. 2017, 81, 140–153. [Google Scholar] [CrossRef]
  27. Zhang, J.; Zhao, Z.F.; Zheng, Y.F.; Dai, M. Postcollisional magmatism: Geochemical constraints on the petrogenesis of Mesozoic granitoids in the Sulu orogen, China. Lithos 2010, 119, 512–536. [Google Scholar] [CrossRef]
  28. Wang, Z.L.; Yang, L.Q.; Deng, J.; Santosh, M.; Zhang, H.F.; Liu, Y.; Li, R.H.; Huang, T.; Zheng, X.L.; Zhao, H. Gold-hosting high Ba-Sr granitoids in the Xincheng gold deposit, Jiaodong Peninsula, East China: Petrogenesis and tectonic setting. J. Asian Earth Sci. 2014, 95, 274–299. [Google Scholar] [CrossRef]
  29. Deng, J.; Wang, C.M.; Bagas, L.; Santosh, M.; Yao, E. Crustal architecture and metallogenesis in the south-eastern North China Craton. Earth-Sci. Rev. 2018, 182, 251–272. [Google Scholar] [CrossRef]
  30. Jiang, N.; Chen, J.; Guo, J.; Chang, G. In situ zircon U–Pb, oxygen and hafnium isotopic compositions of Jurassic granites from the North China craton: Evidence for Triassic subduction of continental crust and subsequent metamorphism-related 18O depletion. Lithos 2012, 142, 84–94. [Google Scholar] [CrossRef]
  31. Brown, P.E.; Hagemann, S.G. MacFlincor and its application to fluids in Archaean lode-gold deposits. Geochim. Cosmochim. Acta 1995, 59, 3943–3952. [Google Scholar] [CrossRef]
  32. Anderson, M.R.; Rankin, A.H.; Spiro, B. Fluid mixing in the generation of isothermal gold mineralization in the Transvaal Sequence, Transvaal, South Africa. Eur. J. Mineral. 1992, 4, 933–948. [Google Scholar] [CrossRef]
  33. Bakker, R.J.; Jansen, J.B.H. A mechanism for preferential H2O leakage from fluid inclusions in quartz, based on TEM observations. Contrib. Mineral. Petrol. 1994, 116, 7–20. [Google Scholar] [CrossRef]
  34. Xavier, R.P.; Foster, R.P. Fluid evolution and chemical controls in the Fazenda Maria Preta (FMP) gold deposit, Rio Itapicuru greenstone belt, Bahia, Brazil. Chem. Geol. 1999, 154, 133–154. [Google Scholar] [CrossRef]
  35. Roedder, E. Fluid inclusions. Rev. Mineral. 1984, 12, 1–664. [Google Scholar]
  36. Jiang, N.; Xu, J.H.; Song, M.X. Fluid inclusion characteristics of mesothermal gold deposits in the Xiaoqinling District, Shaanxi and Henan Provinces, People’s Republic of China. Mineral. Depos. 1999, 34, 150–162. [Google Scholar]
  37. Oslen, S.N. High density CO2 inclusions in the Colorado Front Range. Contrib. Mineral. Petrol. 1988, 100, 226–235. [Google Scholar]
  38. Hollister, L.S. Enrichment of CO2 in fluid inclusions in quartz by removal of H2O during crystal–plastic deformation. J. Struct. Geol. 1990, 12, 895–901. [Google Scholar] [CrossRef]
  39. Sibson, Y.C.; Robert, F.; Poulsen, K.H. High angle reverse faults, fluid-pressure cycling, and mesothermal gold quartz deposits. Geology 1988, 16, 551–555. [Google Scholar] [CrossRef]
  40. Diamond, L.W. Fluid inclusion evidence for P–V–T–X evolution of hydrothermal solutions in late-Alpine gold–quartz veins at Brusson, Val d’Ayas, northwest Italian Alps. Am. J. Sci. 1990, 290, 912–958. [Google Scholar] [CrossRef]
  41. Robert, F.; Kelly, W.C. Ore-forming fluids in Archean goldbearing quartz veins at the Sigma mine, Abitibi greenstone belt, Quebec, Canada. Econ. Geol. 1987, 82, 1464–1482. [Google Scholar] [CrossRef]
  42. Dugdale, A.L.; Hagemann, S.G. The Bronzewing lode gold deposit, eastern Australia: P–T–X evidence for fluid immiscibility caused by cyclic decompression in gold-bearing quartz-veins. Chem. Geol. 2001, 173, 59–90. [Google Scholar] [CrossRef]
  43. Robert, F.; Boullier, A.M.; Firdaous, K. Gold–quartz veins in metamorphic terranes and their bearing on the role of fluids in faulting. J. Geophys. Res. 1995, 100, 12861–12879. [Google Scholar] [CrossRef]
  44. Qiu, K.F.; Marsh, E.; Yu, H.C.; Pfaff, K.; Gulbransen, C.; Gou, Z.Y.; Li, N. Fluid and metal sources of the Wenquan porphyry molybdenum deposit, Western Qinling, NW China. Ore Geol. Rev. 2017, 86, 459–473. [Google Scholar] [CrossRef]
  45. Yang, Z.F.; Xu, J.K.; Zhao, L.S.; Wu, Y.B.; Shen, Y.L. Geochemical studies of hydrogen and oxygen isotopes and ore-forming fluid compositions of fluid inclusions in quartz from two types of gold deposits in Jiaodong. Acta Mineral. Sin. 1991, 11, 365–369, (In Chinese with English abstract). [Google Scholar]
  46. Jiang, X.H. Fluid Evolution and Genesis of Altered Type Gold Deposits in Northwestern Jiaodong. Ph.D. Thesis, Institute of Geology and Geophysics, Chinese Academy of Sciences, Beijing, China, 2011. [Google Scholar]
  47. Clayton, R.N.; O’Neil, J.R.; Mayeda, T.K. Oxygen isotope exchange between quartz and water. J. Geophys. Res. 1972, 77, 3057–3067. [Google Scholar] [CrossRef]
  48. Suzuoki, T.; Epstein, S. Hydrogen isotope fractionation between OH-bearing minerals and water. Geochim. Cosmochim. Acta 1976, 40, 1229–1240. [Google Scholar] [CrossRef]
  49. Chen, Z.S.; Zhang, L.G.; Liu, J.X.; Wang, B.C.; Xu, J.F.; Zheng, W.S. A preliminary study on hydrogen and oxygen isotope geochemical backgrounds of geological bodies in Jiaodong (eastern Shandong) gold metallogenic region. Acta Petrol. Mineral. 1995, 14, 211–218, (In Chinese with English abstract). [Google Scholar]
  50. Lin, W.W.; Yin, X.L. Isotope geological characteristics of mineralizing fluids of gold deposits in Jiaodong area and a discussion on the application conditions of H.P. Taylor’s equation. Acta Petrol. Mineral. 1998, 17, 248–259, (In Chinese with English abstract). [Google Scholar]
  51. Mao, J.W.; Li, H.M.; Wang, Y.T.; Zhang, C.Q.; Wang, R.T. The relationship between mantle-derived fluid and gold ore-formation in the eastern Shandong peninsula: Evidences from D-O-C-S isotopes. Acta Geol. Sin. 2005, 79, 839–857, (In Chinese with English abstract). [Google Scholar]
  52. Zhang, L.G.; Chen, Z.S.; Liu, J.X.; Yu, G.X.; Wang, B.C.; Xu, J.F.; Zheng, W.S. Water-rock exchenge in the Jiaojia type gold deposit: A study of hydrogen and oxygen isotopic composition of ore-forming fluids. Mineral. Depos. 1994, 13, 193–200, (In Chinese with English abstract). [Google Scholar]
  53. Guo, L.N.; Zhang, C.; Song, Y.Z.; Chen, B.H.; Zhou, Z.; Zhang, B.L.; Xu, X.L.; Wang, Y.W. Hydrogen and oxygen isotopes geochemistry of the Wang’ershan gold deposit, Jiaodong. Acta Petrol. Sin. 2014, 30, 2481–2494, (In Chinese with English abstract). [Google Scholar]
  54. Taylor, H.P., Jr. The application of oxygen and hydrogen isotope studies to problems of hydrothermal alteration and ore deposition. Econ. Geol. 1974, 69, 843–883. [Google Scholar] [CrossRef]
  55. O’Neil, J.R.; Taylor, H.P., Jr. The oxygen isotope and cation exchange chemistry of feldspars. Am. Mineral. 1967, 52, 1414–1437. [Google Scholar]
  56. Zheng, Y.F.; Chen, J.F. Stable Isotope Geochemistry, 1st ed.; Science Press: Beijing, China, 2000; pp. 177–182. [Google Scholar]
Figure 1. A simplified geological map of the Jiaodong gold province showing the distribution of major fault zones, Precambrian metamorphic rocks, Mesozoic granitoid intrusions, sedimentary rocks, and gold deposits: Modified from Yang et al. (2016) [17]. The double concentric circles represent cities. The areas covered with vertical grey lines and horizontal grey lines respectively represent Jiaobei Terrane and Sulu Terrane in Jiaodong. Abbreviations: SSDF, Sanshandao Fault; JJF, Jiaojia Fault; ZPF, Zhaoping Fault; QXF, Qixia Fault; TCF, Taocun Fault; MJF, Muping-Jimo Fault; WQYF, Wulian-Qingdao-Yantai Fault; HQF, Haiyang-Qingdao Fault; MRF, Muping-Rushan Fault; WHF, Weihai Fault; RCF, Rongcheng Fault; HSF, Haiyang-Shidao Fault.
Minerals 09 00190 g001
Figure 2. A simplified geological map of the Jiaojia gold belt [17] showing the distribution of major faults and gold deposits: The Sizhuang gold deposit is located at the south segment of the Jiaojia Fault.
Minerals 09 00190 g002
Figure 3. A sketch map of the Sizhuang gold deposit showing the orebodies and hydrothermal alteration: (a) The plan view of the Sizhuang deposit and (b) the geological cross sections along lines AB. The orebody was defined by the gold cut-off grade (1 g/t).
Minerals 09 00190 g003
Figure 4. Photography of the three styles of ores: (a,d) Disseminated-stockwork style; (b,e) Auriferous quartz vein style; (c,f) sulfide-quartz veinlet in K-feldspar alteration granite; and (gi) photomicrographs in the reflected light of the disseminated-stockwork type, auriferous quartz vein style and sulfide-quartz veinlet in K-feldspar alteration granite, respectively.
Minerals 09 00190 g004
Figure 5. Field photographs showing the crosscutting relationships of the major geologic bodies from the Sizhuang gold deposit: (a,b) The K-feldspar altered granite crosscuts the biotite granite and (c,d) the quartz-sulfide vein crosscuts the K-feldspar altered granite, and the calcite vein crosscuts the quartz-sulfide vein.
Minerals 09 00190 g005
Figure 6. Photomicrographs under transmitted light (a,b,h) and reflected light (cg), showing important mineral assemblages in the Sizhuang gold deposit: (a) Sericite-quartz alteration consists of sericite and quartz, with few pyrite; (b) disseminated pyrite occurs in the matrix of sericite and quartz; (cg) the primary sulfides in the main stage of the Sizhaung deposit; and (h) the calcite vein crosscuts the sericite and quartz. Abbreviations: Kfs = K-feldspar, Ccp = chalcopyrite, Qtz = quartz, Ser = sericite, Py = pyrite, Sp = sphalerite, Cc = calcite.
Minerals 09 00190 g006
Figure 7. The paragenetic sequence of the hydrothermal alteration and mineralization at the Sizhuang gold deposit interpreted by crosscutting relationships and assemblages of minerals: The thickness means the abundance of minerals in the paragenetic sequence.
Minerals 09 00190 g007
Figure 8. Photographs of the field view and ores shows the inclusion-hosted quartz (a,c) and calcite (b,d).
Minerals 09 00190 g008
Figure 9. Photomicrographs of the fluid inclusions in the Sizhuang gold deposits: (a,b) Type 2 aqueous inclusions contain two phases (liquid H2O and vapor H2O); (c,d) Type 1 H2O–CO2 inclusions generally consist of three phases (liquid H2O, liquid CO2 and CO2 rich vapor); (e) Type 3 CO2 inclusions are small and infrequent in this study; and (f) the inclusions with a total homogenization temperature of 298 °C is a type 2 aqueous inclusion. The other inclusions are Type 1 H2O–CO2 inclusions.
Minerals 09 00190 g009
Figure 10. Histograms of the microthermometric data showing the temperatures of TmCO2, Tmclath, ThCO2 and ThTOT and the salinity.
Minerals 09 00190 g010
Figure 11. The temperatures (°C) of the total homogenization temperatures (ThTOT) versus salinity (wt% NaCl eq.): The solid and hollow signs represent the H2O–CO2 inclusions and aqueous inclusions, respectively.
Minerals 09 00190 g011
Figure 12. Histograms of the density of type 1 fluid inclusions: The range of inclusion density is wide in different stages or in different mineralization styles.
Minerals 09 00190 g012
Figure 13. The H–O composition of ore-fluids in early and main stages: Area A means metamorphic water of the Jiaodong Group mixed with meteoric water; Area B means magmatic water of the Linglong granite mixed with meteoric water; and Area C means magmatic water of the Guojialing granite mixed with meteoric water. The base map is modified after Guo et al. (2014) [53].
Minerals 09 00190 g013
Figure 14. The evolution of the H–O composition during the water–rock interaction.
Minerals 09 00190 g014
Table 1. The basic information of the samples in this study.
SampleStageOre Style
SZ13D008B3earlySulfide-quartz veinlet in K-feldspar granite
SZ13D008B2mainSulfide-quartz veinlet in K-feldspar granite
SZ13D020B2mainDisseminated-stockwork style
SZ14D019B2mainDisseminated-stockwork style
SZ13D005B1mainAuriferous quartz vein style
SZ13D008B3mainSulfide-quartz veinlet in K-feldspar granite
SZ14D016B1mainAuriferous quartz vein style
SZ14D020B4mainDisseminated-stockwork style
SZ14D017B2lateCalcite vein
Table 2. The results of fluid inclusions microthermometry.
SampleTypesVCO2 (%)TmCO2 (°C)Tmice (°C)Tmclath (°C)ThCO2 (°C)ThTOT (°C)Salinity (wt %)
Early Stage
SZ13D008B3
type 120–50
(37, n = 8)
−57.5–−56.6
(−56.8, n = 5)
5.2–7.9
(7.3, n = 7)
26.9–29.5
(28.0, n = 5)
303–368
(331, n = 6)
4.14–8.77
(5.27, n = 6)
type 220 −2.7(n = 1) 350(n = 1)4.48
Main Stage
SZ13D008B2
type 120–40
(33, n = 14)
−57–−56.6
(−56.9, n = 6)
5.3–7.8
(6.6, n = 9)
27.2–29.0
(26.9, n = 2)
285–321
(299, n = 10)
4.32–8.61
(6.38, n = 8)
SZ13D020B2type 115–40
(28, n = 20)
−58.5–−57.2
(−57.6, n = 6)
5.1–8.9
(7.5, n = 15)
27.7231–309
(272, n = 17)
4.22–8.93
(5.64, n = 14)
type 220–40
(43, n = 4)
−7–−6.9
(−7, n = 2)
6.6
(n = 1)
285–298
(292, n = 2)
10.37–10.49
(10.43, n = 2)
SZ14D019B2type 115–35
(28, n = 10)
−60.5–−56.9
(−58.6, n = 3)
5.1–6.5
(6.0, n = 3)
24–25.8
(25.2, n = 3)
296–332
(314, n = 7)
6.63–8.93
(7.52, n = 3)
type 220–30
(23, n = 5)
−4.3–−3.7
(4.1, n=3)
251–294
(275, n = 4)
5.99–6.87
(6.58, n = 3)
type 3-−56.6(n = 2) 27.1(n = 2)
SZ13D005B1type 120–45
(30, n = 18)
−59.8–−57
(−58.3, n = 8)
3.4–11.2
(7.7, n = 14)
17.8–28
(24.1, n = 3)
264–290
(276, n = 7)
4.32–11.43
(0.62, n = 7)
SZ13D008B3type 15–35
(19, n = 7)
−56.9–−56.8
(−56.9, n = 2)
6.1–8.4
(7.5, n = 4)
-224–275
(243, n = 6)
4.14–7.31
(5.38, n = 4)
type 220–30
(27, n = 4)
−8.1–−4.5
(−6.3, n = 3)
270–271
(271, n = 2)
7.15–11.83
(9.57, n = 3)
SZ14D016B1type 120–40
(30, n = 17)
−59.5–−56.7
(57.5, n = 10)
3.7–9.6
(6.8, n = 14)
18.3–28.3
(25.4, n = 6)
210–262
(232, n = 11)
4.32–11.01
(7.75, n = 11)
SZ14D020B4type 110–40
(36, n = 19)
−57.8–−56.5
(−57.1, n = 11)
5.2–8.7
(6.7, n = 13)
17.6–29.7
(25.0, n = 4)
253–288
(266, n = 8)
4.14–8.77
(7.18, n = 10)
type 210–40
(28, n = 5)
−3.2–−2.5
(−2.9, n = 4)
210–233
(219, n = 3)
4.17–5.25
(4.79, n = 3)
Late Stage
SZ14D017B2
type 110–30
(33, n = 19)
−58.3–−56.9
(57.6, n = 10)
5–9.6
(7.1, n = 15)
29.4–31
(30.2, n = 2)
195–289
(240, n = 15)
4.69–9.08
(7.18, n = 10)
Note: VCO2(%), degree of vapour filling; TmCO2, melting temperature of CO2 phase; Tmice, ice melting temperature; Tmclath, clathrate melting temperature; ThCO2, homogenization temperature of CO2; ThTOT, total homogenization temperature; “n”, number of measured inclusions; the number in brackets, average values.
Table 3. The H–O isotope composition of the Sizhuang gold deposit.
SampleStageδ18OquaitzEquilibrium Temperatureδ18OH2OδDH2O
(‰)(‰)(‰)
10SZ06Early stage10.33203.6−64.3
Z4974-5Early stage13.92906.1−55
10SZ01Main stage13.42302.9−74.7
10SZ31Main stage14.22253.5−73.8
10SZ28Main stage12.52452.8−77.7
10SZ32Main stage9.7235−0.5−74.6
Note: δDH2O is calculated by the equation: δDH2O = δ18Oquaitz + 22.1 × 10⁶T−2 − 19.1 (Suzuoki and Epstein, 1976) [48]. δDH2O is calculated by the equation: δDH2O = δ18Oquaitz − 33.8 × 10⁶T−2 + 3.40 (Clayton et al., 1972) [47].
Table 4. The H–O isotope geochemical background in the Jiaojia gold belt.
Rocks/Fluidδ18O (‰)δD (‰)Data Resources
Jiaodong Group metamorphic rocks8.2 ± 3.1−88.5 ± 7.5Chen, 1995 [49]
Linglong granite7−72 ± 11Lin and Yin, 1998 [50] and Mao et al., 2005 [51]
Guojialing granodiorite10.1 ± 0.4−102 ± 15Zhang et al., 1994 [52] and Mao et al., 2005 [51]
Metamorphic water of the Jiaodong Group9.9 ± 0.7−62 ± 21Zhang et al., 1994 [52]
Magmatic water of Linglong granite7.7 ± 1.0−47 ± 11Zhang et al., 1994 [52]
Magmatic water of Guojialing granite9.3 ± 0.8−77 ± 15Mao et al., 2005 [51]
meteoric water−15.6 ± 0.6−115 ± 5Zhang et al., 1994 [52]

