Article

Mine Backfilling in the Permafrost, Part II: Effect of Declining Curing Temperature on the Short-Term Unconfined Compressive Strength of Cemented Paste Backfills

Research Institute on Mines and the Environment, Université du Québec en Abitibi-Témiscamingue (UQAT), 445 Boul. de l’Université, Rouyn-Noranda, QC J9X 5E4, Canada
*
Author to whom correspondence should be addressed.
Minerals 2019, 9(3), 172; https://doi.org/10.3390/min9030172
Submission received: 30 January 2019 / Revised: 5 March 2019 / Accepted: 7 March 2019 / Published: 11 March 2019
(This article belongs to the Special Issue Backfilling Materials for Underground Mining)

Abstract

:
When cemented paste backfill (CPB) is used to fill underground stopes opened in permafrost, depending on the distance from the permafrost wall, the curing temperature within the CPB matrix decreases progressively over time until equilibrium with the permafrost is reached (after several years). In this study, the influence of declining curing temperature (above freezing temperature) on the evolution of the unconfined compressive strength (UCS) of CPB over 28 days’ curing is investigated. CPB mixtures were prepared with a high early (HE) cement and a blend of 80% slag and 20% General Use cement (S-GU) at 5% and 3% contents and cured at room temperature in a humidity chamber and under decreasing temperatures in a temperature-controlled chamber. Results indicate that UCS is higher for CPB cured at room temperature than under declining temperatures. UCS increases progressively from the stope wall toward the inside of the CPB mass. Under declines in curing temperature, HE cement provides better short-term compressive strength than does S-GU binder. In addition, the gradual decline in temperature does not appear to affect the fact that the higher the binder proportion, the greater the strength development. Therefore, UCS is higher for samples prepared with 5% than 3% HE cement. Findings are discussed in terms of practical applications.

1. Introduction

The reuse of tailings in backfill operations in the form of cemented paste backfill (CPB) is a tailings management method that allows up to 50% of tailings to be returned underground [1]. This represents an environmental benefit when the tailings are potentially acid-generating in the presence of water and atmospheric oxygen. However, the primary role of the CPB is to ensure a safe working environment by providing ground support for mine structures that surround underground mine openings created by ore stoping. Different backfilling methods are presented in the literature for metal and coal mines [2,3].
CPB consists of filtered tailings, binder, and water. The role of the binder, added at dosages from 2% to 8% of the dry tailings mass [4,5,6,7,8], is to strengthen the CPB so that the exposed filling faces are self-supporting when the surrounding edges are extracted. CPB strength is commonly determined in terms of unconfined compressive strength (UCS) [9,10,11]. CPB is designed to reach its target UCS after 28 days of curing [12,13]. The water used to homogenize the mixture makes it possible to achieve a desired consistency (generally expressed in terms of slump) and the rheological properties required to facilitate transport of the mixture via pipeline. Recent studies showed that superplasticizers could improve the consistency, rheological properties and strength of CPB [14,15,16,17].
For underground support in Arctic mines where stopes are excavated from the permafrost, ice-cemented backfills were the first type proposed by Bandopadhyay and Izaxon [18]. Ice-cemented backfill consists of fill materials (gravel, crushed rock, tailings) with ice used as a binder. The schedule of pillar recovery depends on the rate at which the backfill freezes. Bandopadhyay and Izaxon [18] developed a finite difference model to analyze the effects of various parameters on ice-cemented backfill in underground permafrost mines. They suggested that thin layers of backfill could be placed successively, with the next layer placed after the previous one freezes. Cold air ventilation was used to accelerate the freezing of the backfill. The temperature of the ventilation air and the thickness of the backfill layers were the two most important variables affecting the required freezing time. For example, 13.2 days were required to freeze a 0.5 m backfill layer. Backfilling a 25-m-high stope would therefore take 660 days, which is unacceptable for mining operations. Later, Cluff and Kazakidis [19] developed different formulations of frozen fill consisting of rock, tailings, ice, and water in specific proportions to replace more expensive cement-based backfill. Among other key parameters, the applicability is also controlled by the freezing rate and time.
As mentioned above, the use of CPB in underground stopes in permafrost provides an alternative to frozen backfill when freezing time is a constraint. However, the required strength must be achieved within a limited curing time (e.g., 28 days) and under particular thermal curing conditions imposed by heat exchanges between the CPB matrix and the permafrost. Numerous studies on backfilling operations in which the stope walls were at temperatures (T) above zero (T > 0) show that higher CPB curing temperatures resulted in higher UCS in the short term (7 to 28 days), mid-term (28 to 91 days), and long term (>91 days) [2], because higher temperatures accelerate binder hydration [20,21,22,23]. However, very little data exists on the effect of declining temperatures on the mechanical strength of CPB.
Two-dimensional (2D) numerical models were used by Ghoreishi-Madiseh, et al. [24] to study the effect of the initial CPB temperature (5–25 °C) on the extent of permafrost rock mass at an initial temperature ranging from −25 °C to −5 °C. A 10 m high × 10 m wide construction site was considered. The numerical results showed increasing thickness of the thawed rock with increasing initial CPB temperature, which implies more time required for the permafrost to refreeze. As part of Mine Project A, located in Nunavut Territory in northern Canada, Beya, et al. [25] (companion paper, Part I) (see also Beya [26]) investigated three-dimensional heat transfer in CPB placed in underground stopes excavated from permafrost at −6 °C. The 3D Heat Transfer Module in COMSOL Multiphysics® was used.
Once the CPB is frozen, its mechanical strength should increase compared to the unfrozen CPB. Han [27] performed a series of laboratory uniaxial compression tests on CPB specimens cured over 7, 28, and 90 days. Two room temperatures (20 °C and −6 °C) were used to represent thermal conditions in the permafrost. Results showed significantly higher resistance for frozen CPB cured at −6 °C compared to 20 °C, regardless of curing time. Therefore, the UCS for frozen CPB was 10.3, 9.9, and 6.9 times that for CPB cured at 20 °C after 7, 28, and 90 days, respectively. This large difference in UCS between frozen and unfrozen CPB samples can be explained by the reinforcing effect of ice. Moreover, it is well known that the mechanical strength of frozen soil is greater than that of unfrozen soil in saturated and unsaturated conditions (e.g., [28,29]).
Knowledge of the evolution of the temperature distribution within the CPB matrix is required in order to develop laboratory mix formulations. These laboratory mixes are used to investigate the time required for CPB to freeze when placed in stopes in the permafrost. The expected decreasing temperatures define the thermal curing conditions for CPB samples for strength assessment (UCS) during laboratory mix optimization. The objective of this article was to determine the impact of declining temperatures on CPB placed in stopes excavated from permafrost on the UCS at curing times of 3, 7, 14, and 28 days.

2. Characterization of Materials and Methodology

2.1. Characteristic of Tailings, Binder, and Mixing Water

The tailings used to prepare the CPB were obtained by grinding core samples from the above-mentioned Mine Project A. Once homogenized, the tailings were subjected to physical and mineralogical characterization. Details are given in the companion paper (Part I) [25].
Two binder agents were used to determine the effect of binder type on strength acquisition under declining curing temperatures. The first binder agent was high early (HE) Portland cement (formerly called Type III cement, according to ASTM [30]). This binder was selected for its early strength development, which is desirable for backfilling in the permafrost. Considering that mines are using fly ash and slag to partially replace cement with blended cements [5,17,31,32,33], the second binder agent was, a blend of 80% ground granular blast furnace slag and 20% Type I Portland cement, or general use (GU) (CP I) cement. This blend (hereinafter S-GU) is most often used for mine backfilling due to its advantages in terms of increased strength compared to GU cement alone (e.g., [5,32]).
For mines in northern conditions, saline pore water (brine) can be naturally derived from permafrost ice [34,35] or from anthropogenic sources, such as ore de-icing salts. Therefore, mixing water with a salt concentration of 5 g/L was used to prepare the backfill recipes, as proposed by the industrial partner. The salt type and concentration added to deionized water to obtain saline water mixture representative of the expected water composition at the backfill plant are presented in Part I [25].

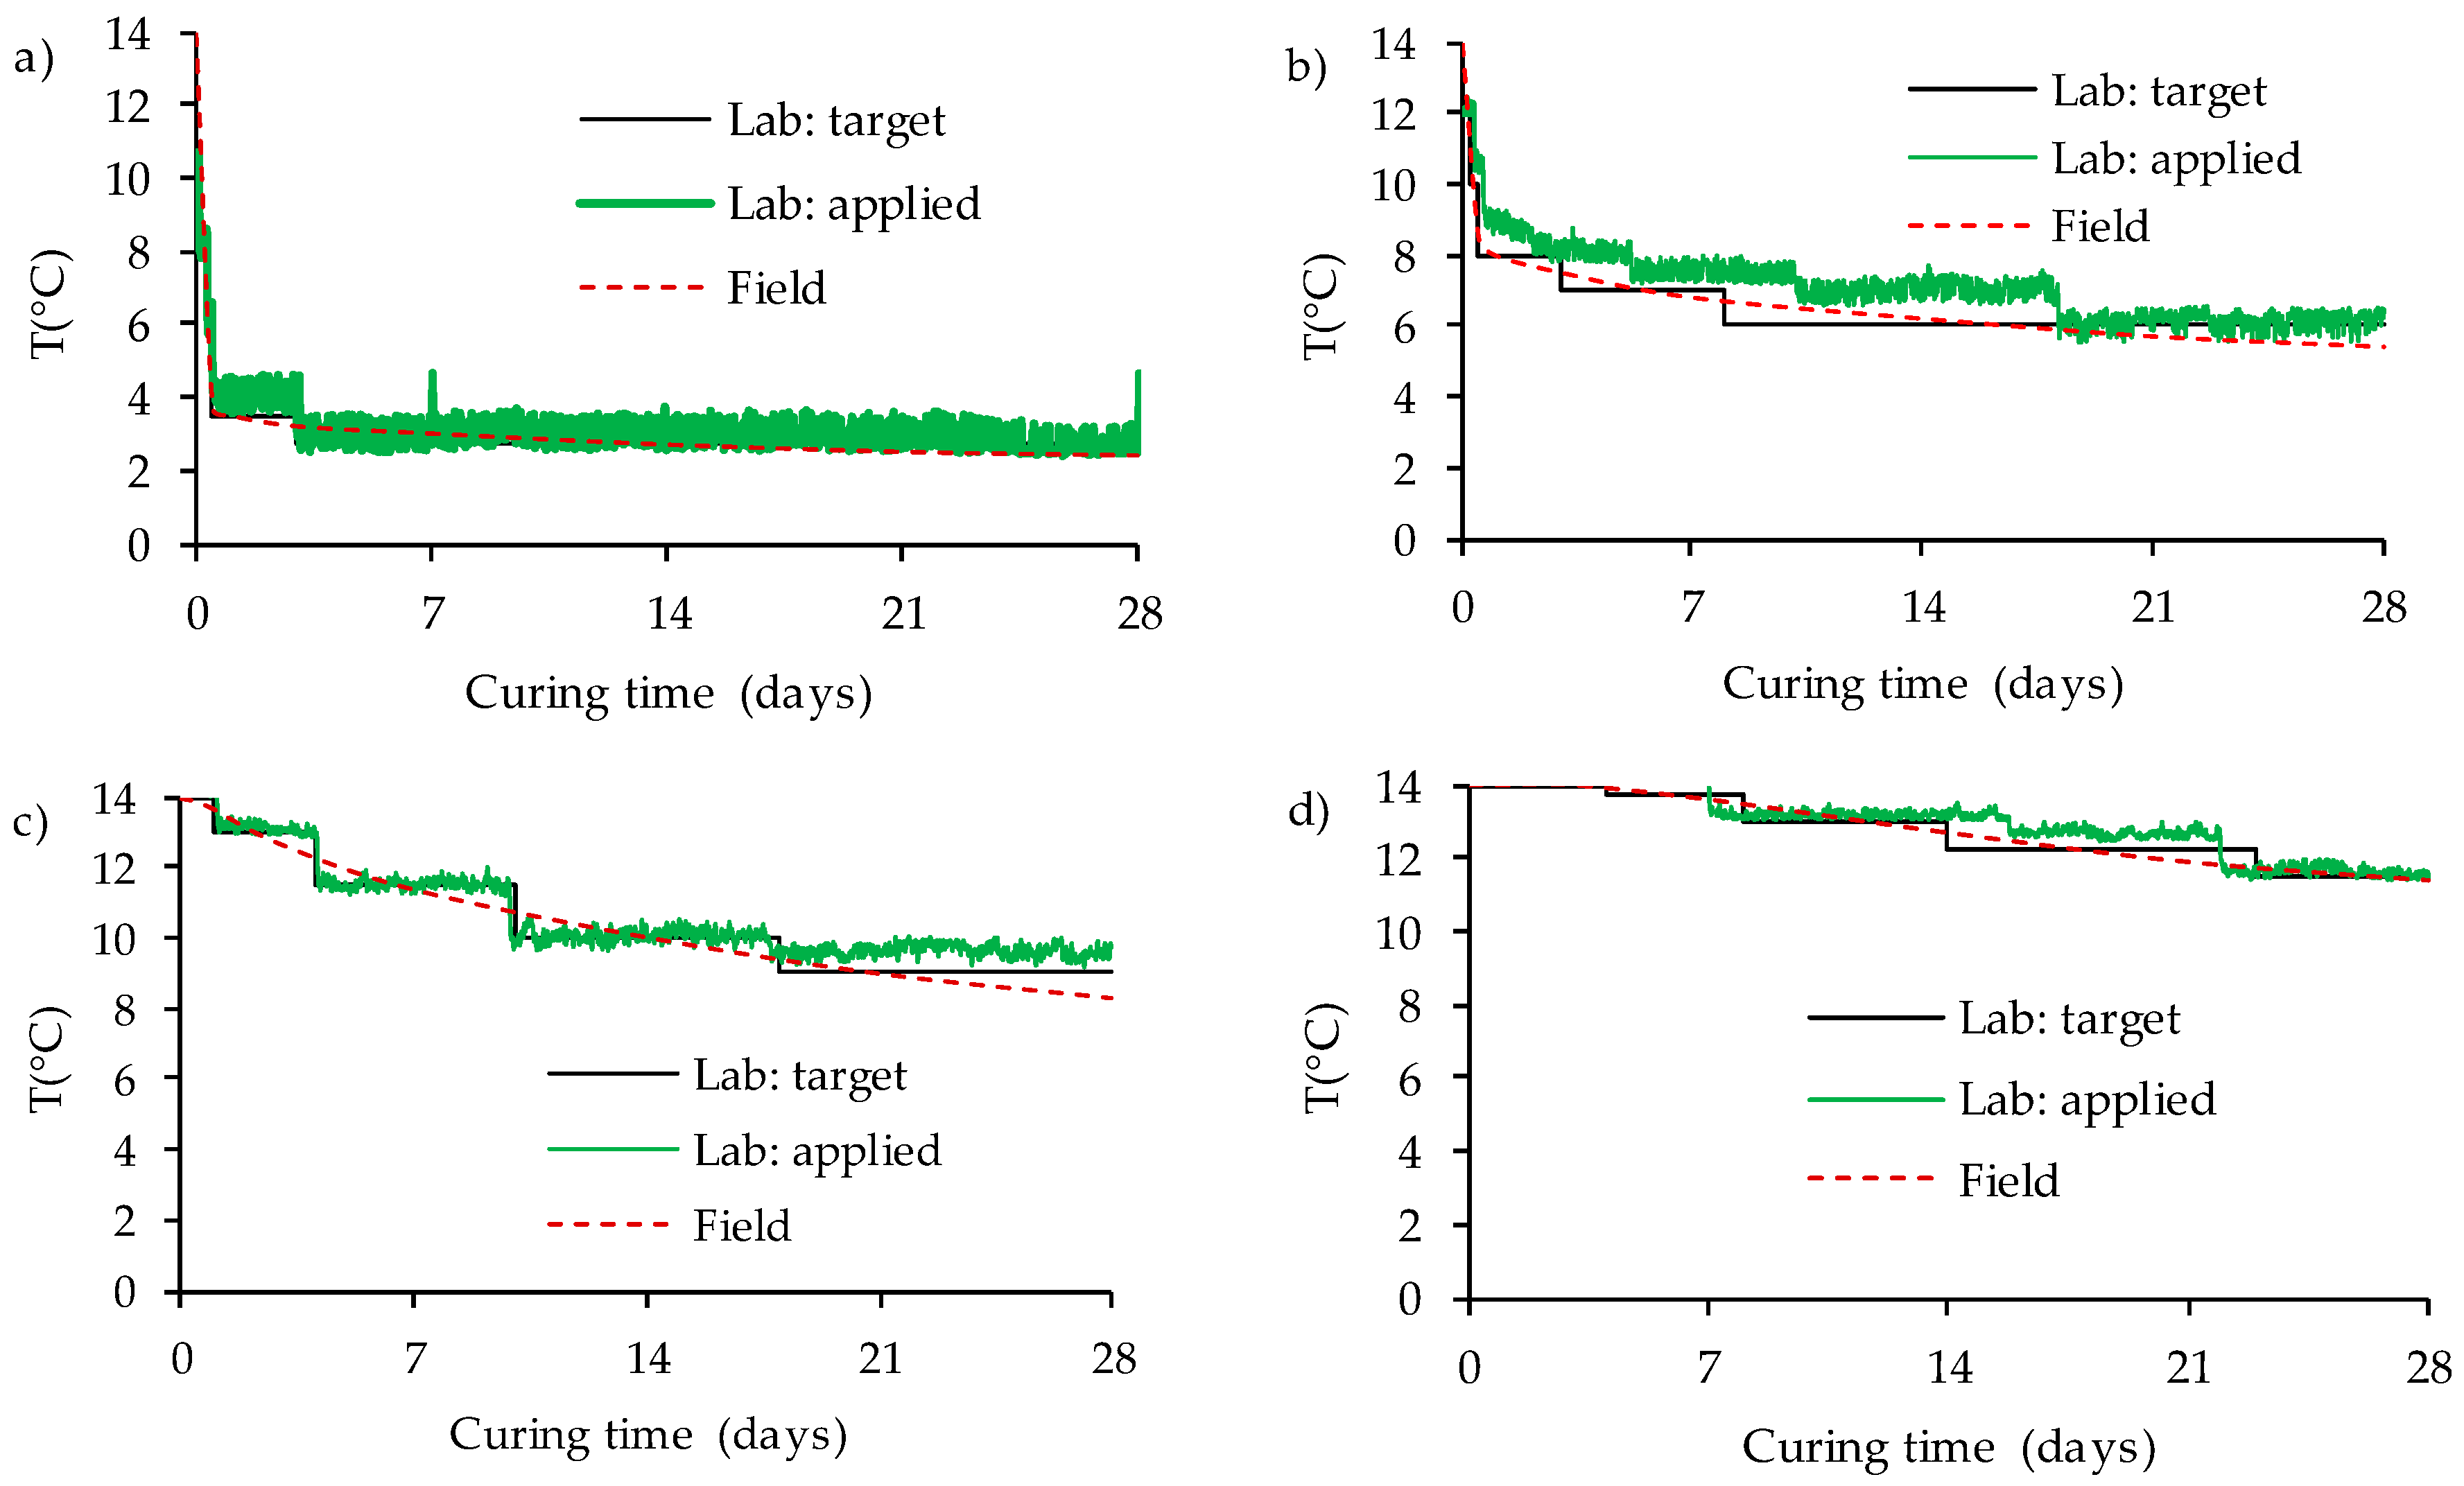
2.2. Mixture Preparation and Thermal Curing Conditions

The filtered tailings, binders (HE and S-GU), and saline water were mixed in a mortar mixer. The 5% binder content Bw (mass of cement/dry mass tailings) was set by the industrial partner. A 7-inch cone slump was targeted, corresponding to a solid mass concentration (Cw) of around 76.3%. The mixing duration was 7 min. Table 1 presents the characteristics of the mixtures prepared for this study. The backfill temperature was measured at the end of mixing.
A first control group of CPB mixtures (M1 and M7) was prepared with ingredients kept at room temperature (≈ 22 ± 1 °C) for 24 hours. A second group of CPB mixtures containing the HE binder (M2 to M6) and the S-GU binder (M8 to M11) was prepared such that the temperature at the end of mixing was 14 °C ± 1 °C. The latter corresponds to the CPB temperature at deposition in the stope, as determined by Kalonji [36] and used by Beya, et al. [25]. In this case, the ingredients (already proportioned) were kept for 24 hours inside a temperature-controlled chamber at about 4 °C. This conditioning temperature was determined after several preliminary mixing tests.
In the case of backfilling in the permafrost, where hydration occurs under declining temperature conditions, it would be useful to assess the extent to which the binder percentage affects the UCS. For this purpose, additional mixtures (M12 to M14) were prepared with the HE cement at a content Bw of 3%. CPB mixtures investigated for this purpose were considered at a distance of 0 m (M3) and 2 m (M13).
For each mixture, the backfill was poured into 12 plastic molds 20 cm in height and 10 cm in diameter for UCS determination after curing times of 3, 7, 14, and 28 days (triplicate samples were used). The molds were placed in either a humidity chamber (at ambient temperature for M1, M2, M7, and M12) or a temperature-controlled chamber (for the remaining mixtures). The samples in the temperature-controlled chamber underwent decreasing temperatures, as explained below. Relative humidity in both CPB curing chambers (humidity and temperature-controlled chambers) was maintained above 90% throughout the entire curing process.
A refrigerator was modified for use as a temperature-controlled chamber by installing a thermostat to control the temperature and a probe to monitor the actual interior temperature. For a targeted curing temperature, the thermostat allowed a temperature swing range around the target value to be entered. The minimum possible range was approximately 1 °F, or 0.5 °C. The temperature inside the temperature-controlled chamber was monitored with two rugged RT-1 and RT-2 probes (to compensate for any malfunctions). The sensors were connected to a data logger and readings were taken at 30-minute intervals for 28 days. The maximum absolute difference between the curing temperatures measured with the two probes was 0.2 °C. Consequently, an average curing temperature was considered.
The curing temperature for the different mixtures was adapted from numerical results obtained by Beya et al. [25] on heat transfer in CPB placed in underground stopes excavated from permafrost at −6 °C. The simulated stope dimensions were set at 25 m (height) × 18 m (depth) × 10 m (width). An initial CPB temperature of 14 °C was used, as proposed by Kalonji [36], who performed numerical modeling using the non-isothermal pipe flow module in COMSOL Multiphysics® 5.2 [37] to predict the CPB deposition temperature for an underground stope excavated from the permafrost. Results obtained by Beya, et al. [25] showed that the CPB temperature decreased over time depending on the distance from the CPB–rock interface. The entire CPB matrix froze 5 years after backfilling. The permafrost equilibrium temperature of −6 °C was not reached even after 20 years of curing time. Figure 1 illustrates the evolution of the CPB temperature over 28 days at different distances (0 m, 0.5 m, 1 m, and 2 m) from the CPB–rock wall interface, as obtained with COMSOL by Beya [26] (see also [26]). The temperature within the backfill dropped from 14 °C to 2.4 °C, 5.4 °C, 8.3 °C, and 11.4 °C at distances of 0 (interface), 0.5, 1, and 2 m from the permafrost wall, respectively. The backfill temperature in the CPB zone within a distance of 2 m to 5 m (central axis of the 10-m-wide stope) remains close to the deposition temperature of 14 °C (12.9 °C at 3 m and 13.8 °C at 5 m) after 28 days of curing.
These temperature variations were targeted for the curing of some CPB samples (see Table 1). However, it was practically impossible to apply this continuous temperature variation. Consequently, the curing temperature was decreased by constant temperature steps, as shown in Figure 1. Figure 1 also compares the measured variations over time in the curing temperature inside the temperature-controlled chamber to the targeted temperature path for each position (or distance) considered in the field. One of the challenges was the time required to change the temperature steps. These changes were made only on work days, which could have led to slight deviations from the target (see, e.g., Figure 1b). In general, actual and targeted temperatures showed a maximum absolute difference of less than 1 °C, which is negligible. Figure 1a shows that the temperature dropped from 14 °C to 2.4 °C for the backfill at the interface between the CPB matrix and the permafrost wall over 28 days. For comparison purposes, the UCS values were also determined on samples (M15) cured at the constant temperature reached after 28 days.

2.3. UCS Determination

In all cases, at the end of each curing time considered (3, 7, 14, and 28 days), triplicate samples (with a height-to-diameter ratio of approximately 2 for all samples) were subjected to uniaxial compression tests at a displacement rate of 1 mm/min using a servo-controlled mechanical press (MTS 10/GL) with a 50 kN normal loading capacity. The average UCS values are presented below. Because the press was not installed in a temperature-controlled chamber but instead in a room at ambient temperature (22 °C), some precautions were taken to minimize inevitable changes in the sample temperature when determining the UCS. It was assumed (not demonstrated) that this temperature change in CPB samples could potentially impact the UCS. A typical case of temperature change within a sample (20 cm in height and 10 cm in diameter) cured at 2 °C and exposed to ambient air was modeled with the 3D Heat Transfer Module in COMSOL Multiphysics®. Results (details not shown here) indicated that the sample temperature rose from 2 °C to 20 °C at 5 mm from the sample surface and to 4 °C in the central axis of the sample within six minutes of exposure to 22 °C. The curing chamber and press were installed side by side to minimize possible temperature changes during sample transport. Once the upper surface of each CPB sample was equalized, it was removed from the mold and weighed. After measuring the final dimensions, the specimen was reintroduced into the temperature-controlled chamber for at least 15 min to allow equilibrium with the curing temperature before uniaxial compression testing. However, it was assumed that the temperature change during the unconfined compressive test did not affect the UCS.
UCS values for all CPB mixtures were determined for a maximum curing time of 28 days, because only one temperature-controlled chamber was available to apply a specific decreasing temperature path (see Table 1 and Figure 1) for each mixture. It was not possible to test several mixtures simultaneously. For the 15 mixtures studied here, tests were performed over a period of more than 420 days.

3. Results

The effect of declining curing temperature on the UCS and the effect of binder type and content on the UCS of CPB cured under decreasing temperatures are presented below.

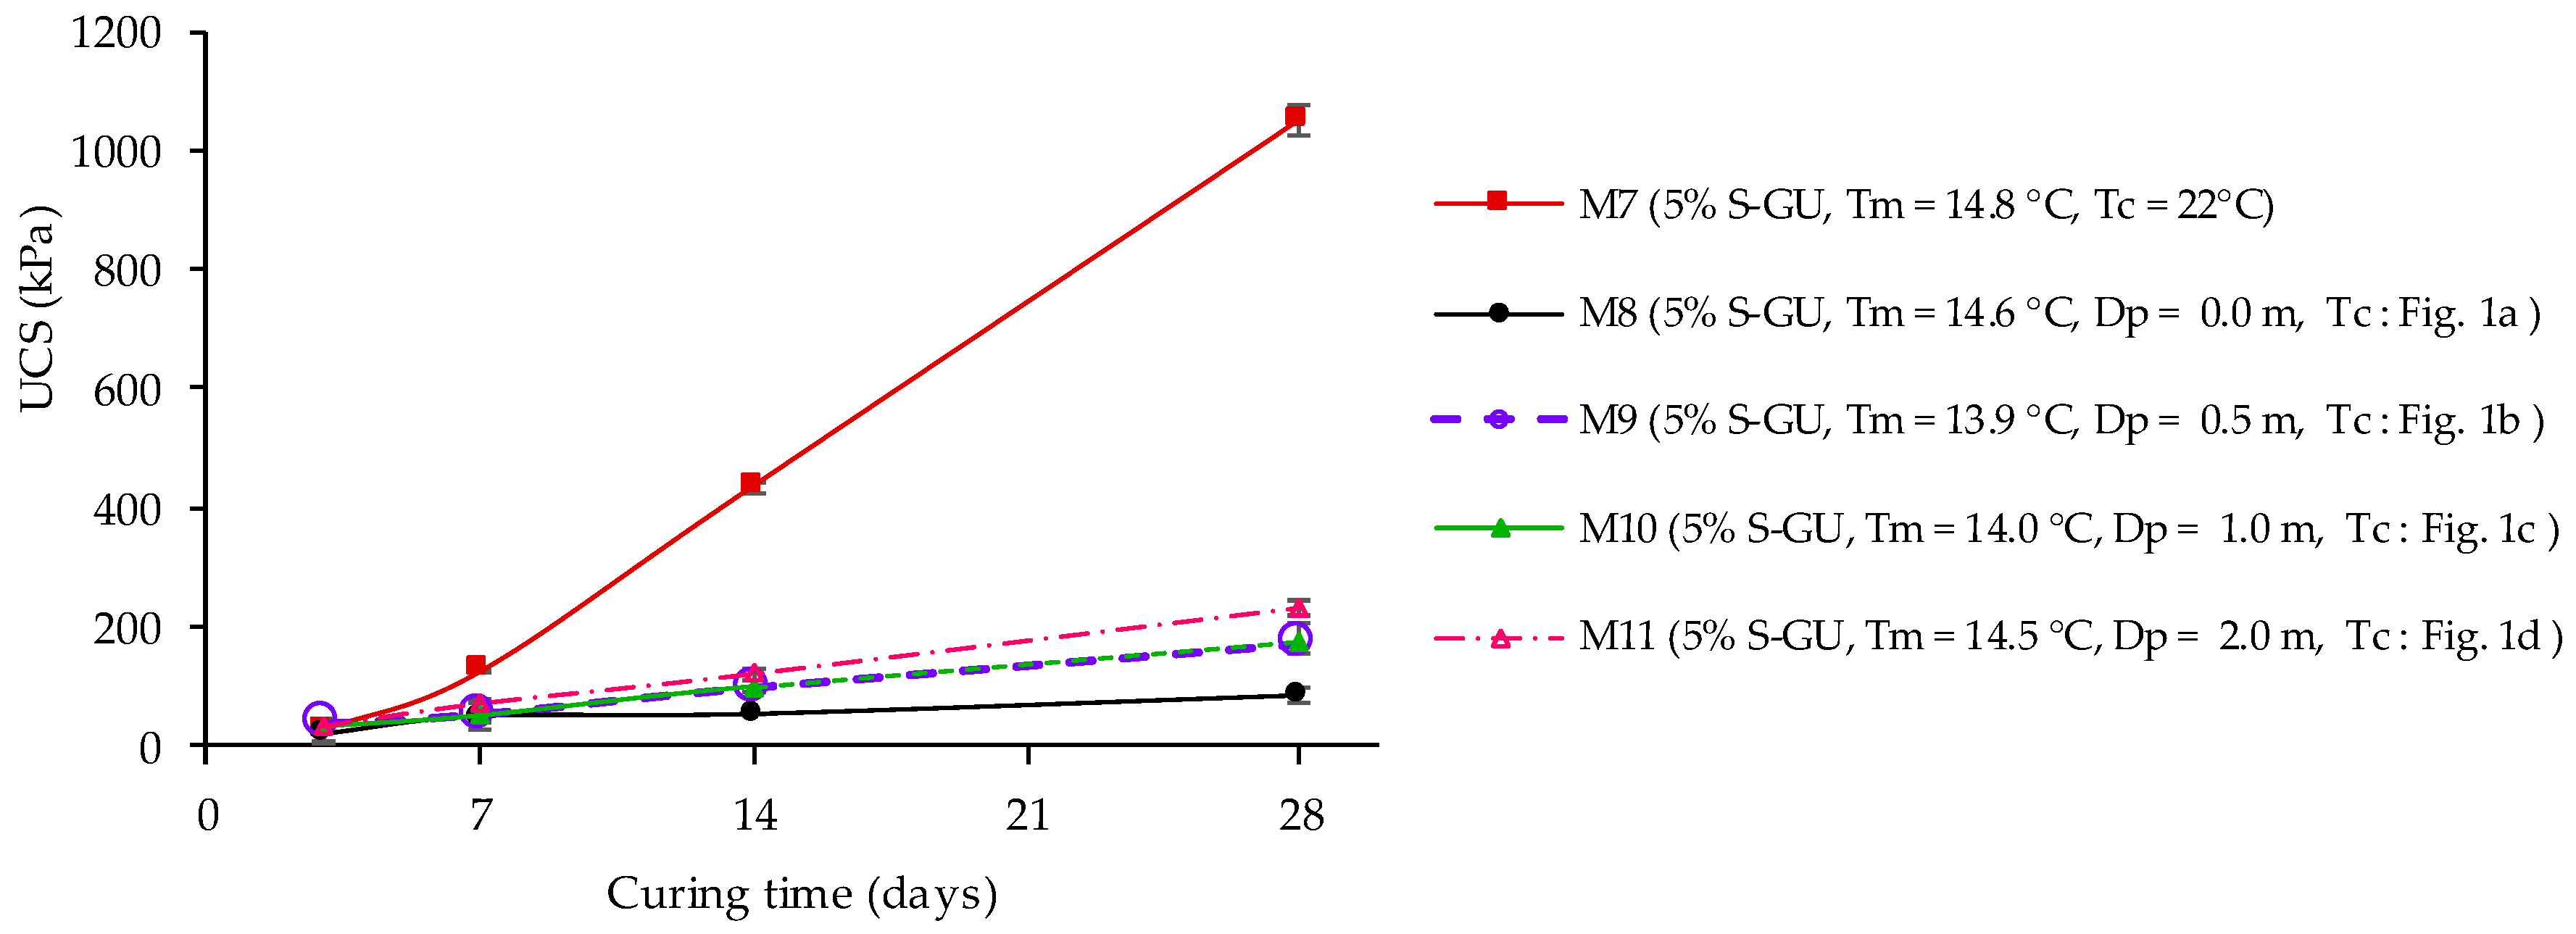
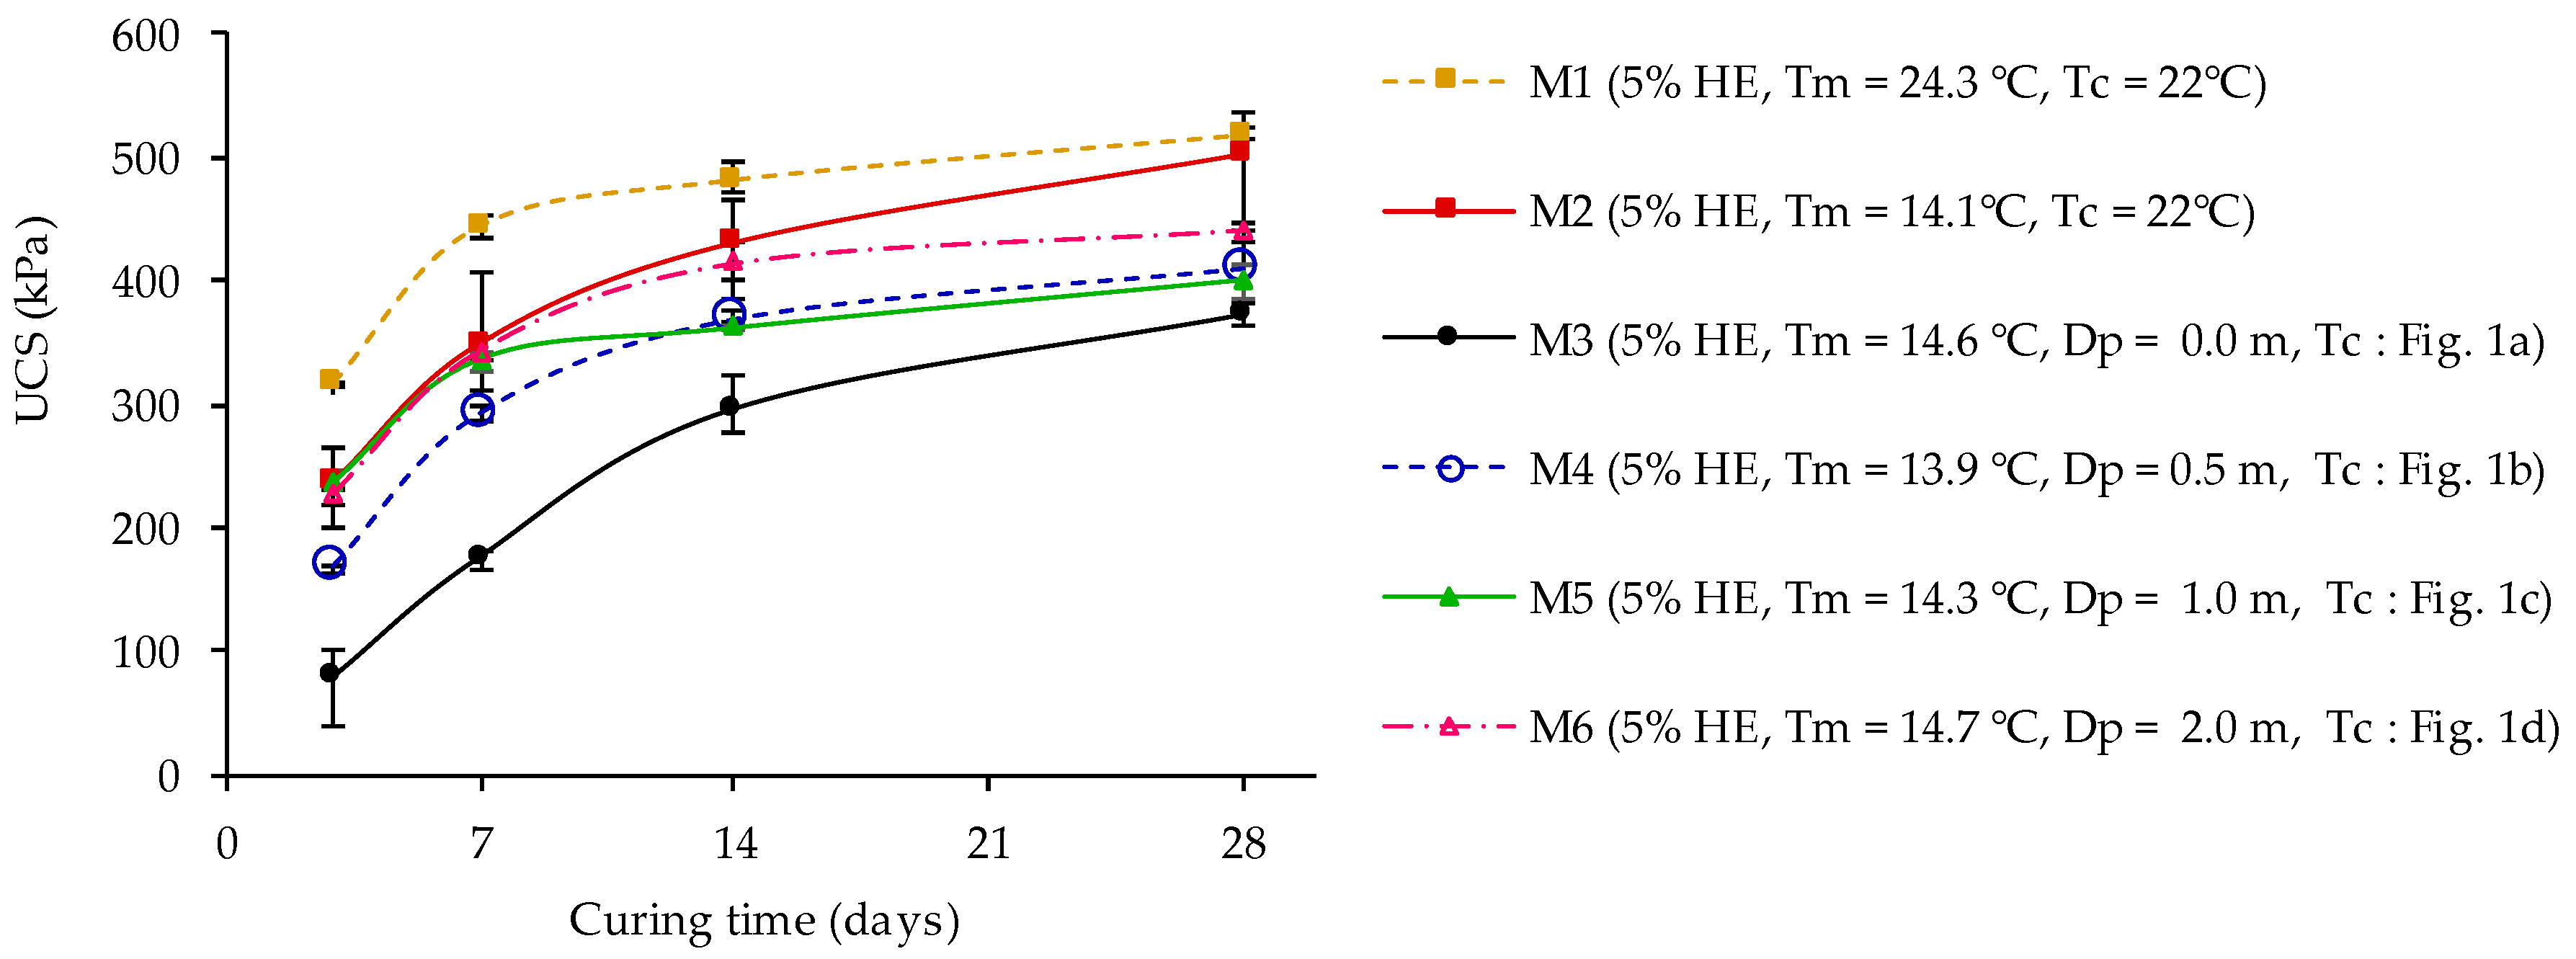
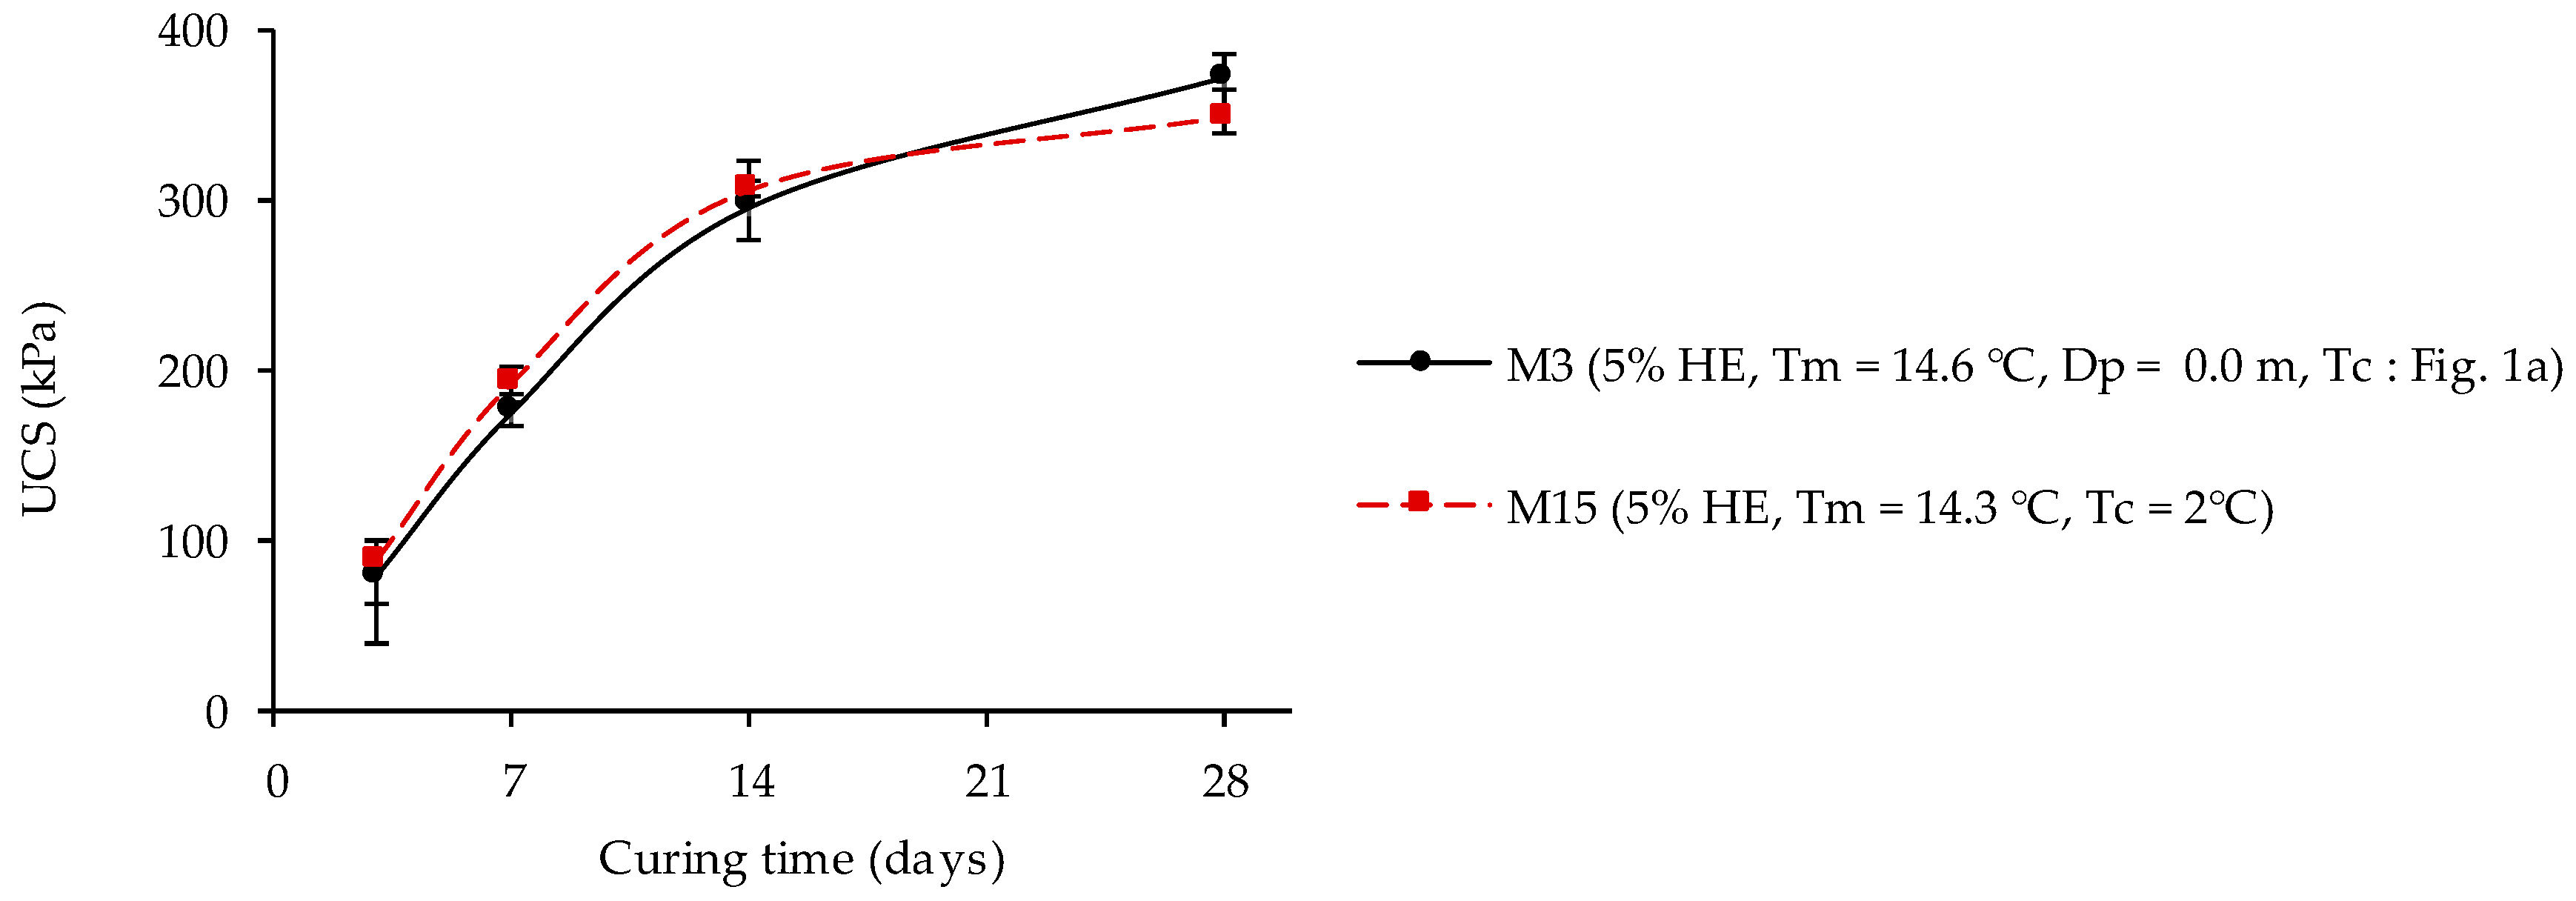
3.1. Effect of Declining Curing Temperature on the UCS

As a first step, the evolution of the UCS was determined for two CPB mixtures containing 5% HE cement with temperature at the end of the mixing (Tm) of 24.3 °C (M1) and 14.1 °C (M2) and which were cured in the humidity chamber. Figure 2 shows higher UCS for M1 than M2. When curing time was increased from three to 28 days, the UCS increased from 320 kPa to 520 kPa for M1 and from 240 kPa to 500 kPa for M2. The UCS difference between the two mixtures is more pronounced at early age (three days of curing) and fades thereafter with time. Therefore, the temperature of the backfill when placed in the molds appears to influence the hydration of HE cement, which is faster at 22 °C than at 14 °C, even for identical curing temperatures in the humidity chamber.
Figure 2 shows the second step: comparing the UCS of CPB samples containing 5% HE with temperatures at the end of mixing (Tm) at around 14 °C. These samples were cured in the humidity chamber (M2) and in the temperature-controlled chamber with the temperature paths shown in Figure 1 (M3 to M6; see Table 1). The UCS values for M5 cured under the thermal conditions prevailing at the rock–CPB interface (with a temperature decreasing rapidly from 14 °C to reach 3.5 °C within 0.5 day and 2.7 °C after three days; see Figure 1a) are the lowest over the curing period of 28 days. UCS varies from 80 kPa at three days to 370 kPa at 28 days. The higher the curing temperature (for distances from 0.5–2 m), the more the UCS increases for a given curing time. As mentioned in the introduction, it is generally known that cement hydration is faster at higher temperatures [14,15,16,17,30]. In other words, the mechanical performance of the CPB matrix increases progressively from the rock–CPB interface toward the center. The tendency of UCS to increase over the curing time is also more marked between three and seven days of curing than after the seventh day of curing.
The above procedure was repeated but with the HE cement replaced by the S-GU binder (blend of 80% Slag and 20% GU). Figure 3 compares the UCS of CPB mixtures containing 5% S-GU: temperatures at the end of mixing (Tm) were around 14 °C. These mixtures were cured in the humidity chamber (M7) and the temperature-controlled chamber with the temperature paths shown in Figure 1 (M8 to M11) depending on the distance from the CPB–permafrost wall interface. The UCS of M7 cured at 22 °C vary from 30 kPa to 1050 kPa when the curing time was increased from 3 to 28 days. The UCS of M8 to M11 cured under decreasing temperatures closely approach that of the M7 mixture cured at 22 °C in the humidity chamber up to the seventh curing day. Afterwards, the UCS of M8 to M11 increase very slightly compared to M7. At 28 days of curing, the UCS is only 235 kPa, 170 kPa, 171 kPa, and 85 kPa at a distance of 2 m (M11), 1 m (M10), 0.5 (M9), and 0 m (M8) from the CPB–rock wall interface. At a given curing time, the UCS increases with increasing curing temperature. More specifically, the CPB performance increases progressively from the interface toward the center of the CPB matrix, as shown in Figure 2 for the HE cement. For the S-GU binder, the increase in UCS over time is almost linear.

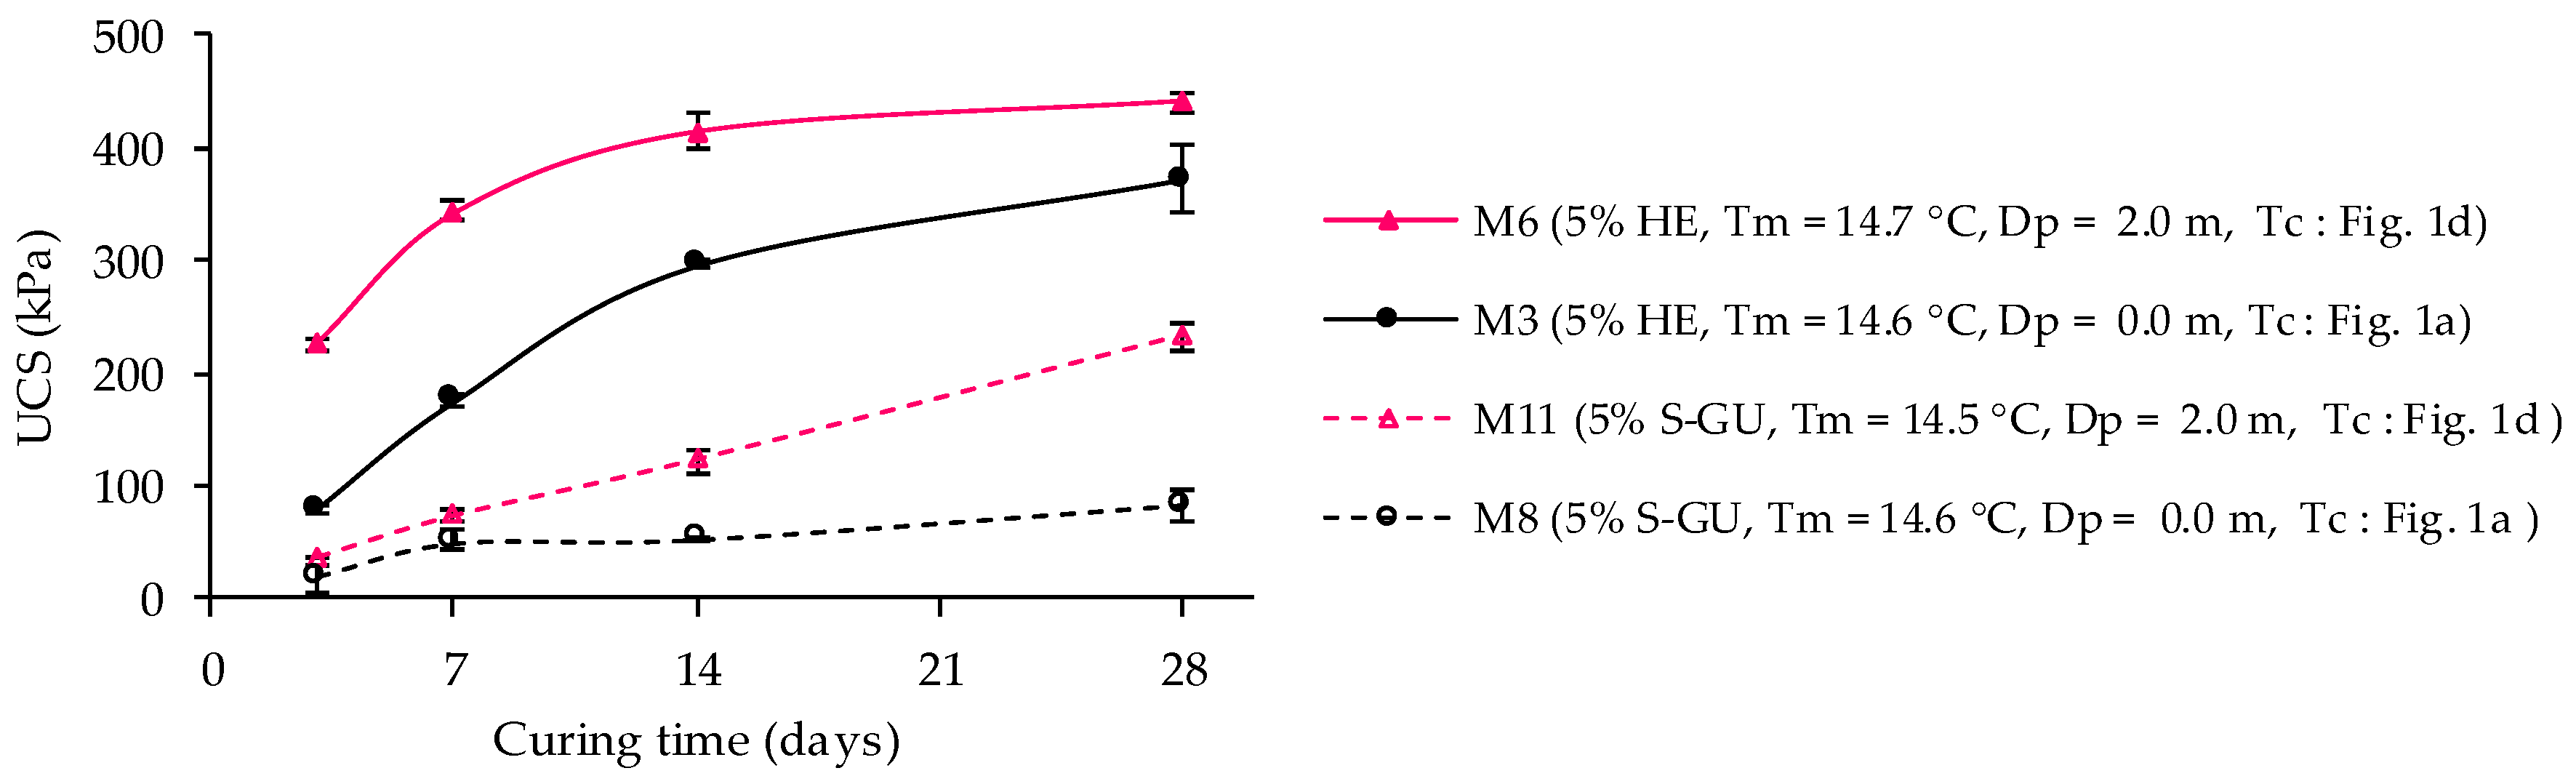
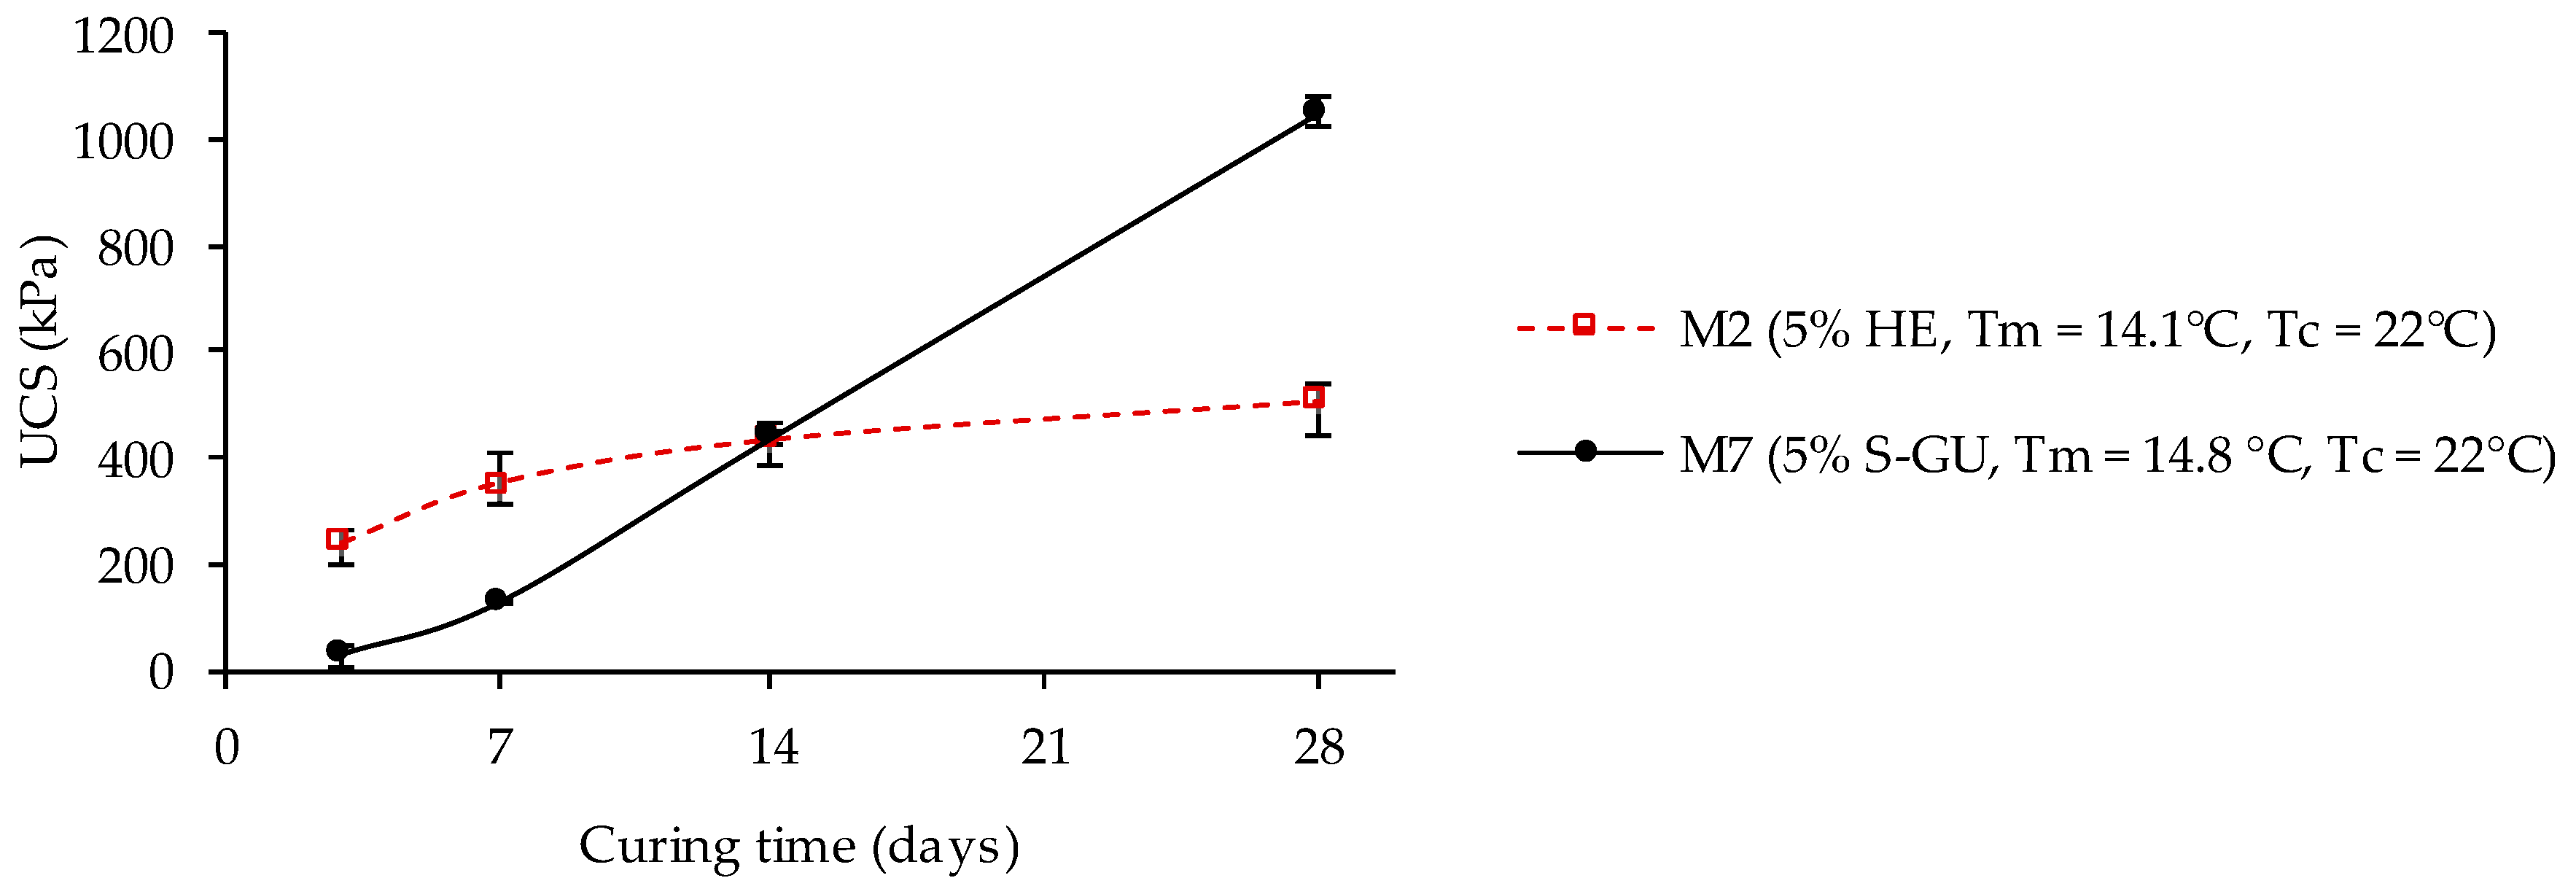
3.2. Effect of Binder Type on the UCS of CPB Cured under Declining Temperature

The effect of binder type was examined by comparing the UCS of CPB mixtures prepared with 5% HE (M2) and S-GU (M7) with average temperature at the end of mixing (Tm) at 14.4 ± 0.3 °C. First, the UCS of M2 and M7 cured in a humidity chamber at a constant temperature (22 ± 1 °C) are compared in Figure 4. For curing times less than 14 days, the UCS of M7 (with 5% S-GU) remains lower than that of M2 (with 5% HE). Beyond 14 days of curing, the UCS of M7 increases drastically to exceed that of M2 (more than 128% gain). For the curing period from the 14th to the 28th day, the UCS increases at an average linear rate of 4.6 and 43.8 kPa/d for M2 and M7, respectively.
Second, the UCS of CPB mixtures containing 5% HE (M3 and M6) and S-GU (M8 and M11) cured under decreasing temperature in the temperature-controlled chamber are compared in Figure 5. The decreasing curing temperatures applied are representative of thermal conditions at distances of 0 m (M3 and M8) and 2 m (M6 and M11) from the permafrost wall. The mixtures made with S-GU binder (M8 and M11) have lower UCS compared to mixtures made with HE binder (M3 and M6). Therefore, the UCS of M3 and M8 at the interface (distance of 0 m) is 80 kPa and 20 kPa (i.e., a difference of 60 kPa) after three days of curing, and 370 kPa and 85 kPa (i.e., a difference of 285 kPa) after 28 days of curing, respectively. For M6 and M11 at a distance of 2 m, the UCS is 225 kPa and 40 kPa (a difference of 185 kPa), respectively, after three days of curing, and 440 kPa and 235 kPa (a difference of 205 kPa) after 28 days of curing.
Based on the results in Figure 5, the UCS of M7 would be expected to exceed that of M2 for curing times beyond 14 days. However, HE cement provides better mechanical strength than does S-GU binder over the entire curing time of 28 days. Furthermore, for the period from the 14th to 28th day of curing, the UCS increases at an average linear rate of 1.9 and 5.5 kPa/d for M3 and M6 (at a distance from the permafrost wall Dp of 0 and 2 m), respectively. These rates are 7.9 and 2.2 kPa/d for M3 and M8 (at a distance Dp of 0 m), respectively. Compared to the increasing UCS rates of M2 (with HE) and M7 (with S-GU), which were cured in a humidity chamber at a constant temperature of 22 ± 1 °C (see Figure 5), the increasing UCS rate drops more significantly for the CPB with S-GU than with HE. Assuming that the UCS and its increasing rate are due to hydration (neglecting other factors such as consolidation), we may conclude that, in the short term (up to 28 days of curing), the hydration kinetics of the S-GU binder are more negatively affected by the progressive decrease in curing temperature compared to the HE cement. Therefore, the use of HE cement may be beneficial in the short term for mine backfilling of stopes excavated from the permafrost.

3.3. Effect of Cement Content on the UCS of CPB Curing under Decreasing Temperature

Several previous studies have shown that increasing the percentage of binder increases the UCS, all other conditions being equal [14,38,39]. In the case of backfilling in the permafrost where hydration occurs under decreasing temperature conditions, it would be useful to determine the extent to which the binder content affects the UCS. For this purpose, the UCS of the CPB mixtures prepared with 5% and 3% HE cement and cured under the same thermal conditions was compared. CPB mixtures at distances from the CPB–permafrost interface of 0 m (M3 and M13) and 2 m (M6 and M14) were considered. Results are shown in Figure 6. For comparison purposes, this graph also shows the UCS of CPB mixtures prepared with 5% and 3% HE binder and cured at a temperature of 22 °C (M2 and M12, respectively). It can be observed that the samples containing 5% HE have higher UCS than samples prepared with 3% HE, regardless of the curing conditions. The effects of the temperature on hydration and the resulting UCS thus remain closely related to the binder proportion, even under decreasing temperatures.

4. Discussion

The results on the effect of declining curing temperature on mechanical strength were obtained using curing thermal paths that closely approach the temperature variations predicted by Beya, et al. [25] (see also [26]). These results show that the curing temperature at the CPB–permafrost wall interface (mixtures M3 and M13 with 5% and 3% HE cement, respectively), which decreases rapidly from 14 °C (at 0 days), reaches 3.5 °C after 0.5 days, 2.7 °C after three days, and remains almost constant (around 2.4 °C) up to the 28th day (see Figure 1a), represents the worst-case curing condition with the lowest UCS values (see Figure 2, Figure 5 and Figure 6). Given the long period of time when the temperature remains between 2 and 3 °C (from the third to the 28th day of curing), it would be informative to compare the UCS obtained on M3 to the UCS obtained on samples cured at a constant curing temperature of 2 °C (M15 in Table 1). This latter curing procedure is simpler than that shown in Figure 1a. The results are presented in Figure 7, showing that the two curing procedures produce almost identical UCS for a curing time of up to 28 days. In other words, applying the rapidly declining curing thermal path is not required for mixtures with HE binder.
As explained above, the results presented in this study are limited to 28 days of curing time. When placed in permafrost walls, CPB freezes after a certain time (several years). As mentioned in the introduction, it is known that the UCS of frozen CPB increases over that for unfrozen CPB [27]. It would be worthwhile investigating the impact on the long-term mechanical behavior of CPB of decreasing curing temperature until freezing is reached. This would provide an opportunity to investigate the potential impact of sulfate attack. Indeed, the tailings used contained 0.35% of pyrite and the backfill recipes were prepared using mixing water containing soluble sulfates [25]. A deleterious effect of the presence of soluble sulfates as well as sulfide minerals on the strength of CPB due to sulfate attack can be expected.

5. Conclusions

The purpose of this article was to investigate the influence of declining curing temperatures on the strength of cemented paste backfills (CPB) placed in open underground stopes in the permafrost. Decreasing temperature variations generated within the CPB matrix by heat exchange with the permafrost were used in the laboratory as curing temperatures. CPB temperatures that decreased progressively over time—depending on the distance from the CPB–permafrost wall interface—were considered. The unconfined compressive strength (UCS) values were measured after curing times of 3, 7, 14, and 28 days. The effect of binder type on the UCS development was examined by considering a high early (HE) type cement and a blend of 80% slag and 20% GU cement (S-GU). Binder contents of 3% and 5% were considered for the HE cement. For CPB mixtures cured in the humidity chamber, results indicated that the HE cement produces higher UCS than does the S-GU binder. Afterwards, the UCS of the mixtures containing S-GU binder increased drastically to exceed that for the mixtures containing HE cement. For both binder types, results showed higher UCS for CPB cured in the humidity chamber than under decreasing temperatures in a temperature-controlled chamber, regardless of curing time. For a given curing temperature, UCS increased progressively from the permafrost wall toward the center of the CPB matrix. For curing times less than 28 days under decreasing temperatures, HE cement provides better mechanical strength than S-GU binder, indicating that the use of the HE cement for backfilling in the permafrost can be beneficial in the short term. Binder content maintains its influence on the hydration process and the ensuing UCS development, even under decreasing curing temperatures. Indeed, samples containing 5% HE cement showed higher UCS than samples prepared with 3%, regardless of curing conditions.

Author Contributions

Conceptualization, M.M., and T.B.; methodology, M.M., T.B., and P.K.; validation, M.M.; formal analysis, P.K. and M.M. investigation, P.K.; resources, M.M.; data curation, K.P. and M.M.; writing—original draft preparation, M.M. and P.K.; writing—review and editing, M.M., and T.B.; visualization, P.K. and M.M.; supervision, M.M. and T.B.; project administration, M.M.; funding acquisition, M.M.

Funding

This research was funded by the Natural Sciences and Engineering Research Council of Canada (NSERC); Discovery Grants Program–Individual provided to Mbonimpa; grant number RGPIN-2015-05172).

Acknowledgments

The authors would like to acknowledge the technical staff of the Research Institute on Mines and the Environment (RIME) for assistance during testing.

Conflicts of Interest

The authors declare no conflicts of interest.

References

  1. Hassani, F.; Archibald, J. Mine Backfill; CD-ROM; CIM: Montreal, QC, Canada, 1998. [Google Scholar]
  2. Sheshpari, M. A review of underground mine backfilling methods with emphasis on cemented paste backfill. Electron. J. Geotech. Eng. 2015, 20, 5183–5208. [Google Scholar]
  3. Zhang, J.; Li, M.; Taheri, A.; Zhang, W.; Wu, Z.; Song, W. Properties and Application of Backfill Materials in Coal Mines in China. Minerals 2019, 9, 53. [Google Scholar] [CrossRef]
  4. Belem, T.; Benzaazoua, M.; Bussière, B. Mechanical behaviour of cemented paste backfill. In Proceedings of the 53th Canadian Geotechnical Conference, Geotechnical Engineering at the Dawn of the Third Millennium, Montreal, QC, Canada, 15–18 October 2000; Volume 1, pp. 373–380. [Google Scholar]
  5. Benzaazoua, M.; Fall, M.; Belem, T. A contribution to understanding the hardening process of cemented pastefill. Miner. Eng. 2004, 17, 141–152. [Google Scholar] [CrossRef]
  6. Brackebusch, F.W. Basics of paste backfill systems. Int. J. Rock Mech. Min. Sci. Geomech. Abstr. 1995, 3, 122A. [Google Scholar]
  7. Kesimal, A.; Yilmaz, E.; Ercikdi, B. Evaluation of paste backfill mixtures consisting of sulphide-rich mill tailings and varying cement contents. Cem. Concr. Compos. 2004, 34, 1817–1822. [Google Scholar] [CrossRef]
  8. Landriault, D.; Verburg, R.; Cincilla, W.; Welch, D. Paste technology for Underground Backfill and Surface Tailings Disposal Applications; Short Course Notes, Canadian Institute of Mining and Metallurgy, Technical Workshop; Canadian Institute of Mining and Metallurgy: Montreal, QC, Canada, 1997; Volume 27, p. 1997. [Google Scholar]
  9. Belem, T.; Benzaazoua, M. An overview on the use of paste backfill technology as a ground support method in cut-and-fill mines. In Proceedings of the 5th International Symposium on Ground Support in Mining and Underground Construction, Perth, Australia, 28–30 September 2004; Villaescusa, E., Potvin, Y., Eds.; CRC Press: Boca Raton, FL, USA, 2004; pp. 28–30. [Google Scholar]
  10. Fourie, A.B.; Helinski, M.; Fahey, M. Using effective stress theory to characterize the behaviour of backfill. In Proceedings of the Minefill Conference, Montreal, QC, Canada, 29 April–2 May 2007; Volume 29. [Google Scholar]
  11. Mitchell, R.J.; Olsen, R.S.; Smith, J.D. Model studies on cemented tailings used in mine backfill. Can. Geotech. J. 1982, 19, 14–28. [Google Scholar] [CrossRef]
  12. Belem, T.; Benzaazoua, M. Design and Application of Underground Mine Paste Backfill Technology. Geotech. Geol. Eng. 2008, 26, 147–174. [Google Scholar] [CrossRef]
  13. Thompson, B.D.; Bawden, W.F.; Grabinsky, M.W. In situ measurements of cemented paste backfill at the Cayeli Mine. Can. Geotech. J. 2012, 49, 755–772. [Google Scholar] [CrossRef]
  14. Ouattara, D.; Belem, T.; Mbonimpa, M.; Yahia, A. Effect of superplasticizers on the consistency and unconfined compressive strength of cemented paste backfills. Constr. Build. Mater. 2018, 181, 59–72. [Google Scholar] [CrossRef]
  15. Ouattara, D.; Mbonimpa, M.; Yahia, A.; Belem, T. Assessment of rheological parameters of high density cemented paste backfill mixtures incorporating superplasticizers. Constr. Build. Mater. 2018, 190, 294–307. [Google Scholar] [CrossRef]
  16. Ouattara, D.; Yahia, A.; Mbonimpa, M.; Belem, T. Effects of superplasticizer on rheological properties of cemented paste backfills. Int. J. Miner. Process. 2017, 161, 28–40. [Google Scholar] [CrossRef]
  17. Zhang, J.; Deng, H.; Taheri, A.; Deng, J.; Ke, B. Effects of Superplasticizer on the Hydration, Consistency, and Strength Development of Cemented Paste Backfill. Minerals 2018, 8, 381. [Google Scholar] [CrossRef]
  18. Bandopadhyay, S.; Izaxon, V. Ice-cemented backfill for underground support in arctic mines. In Proceedings of the SME Annual Meeting, Denver, CO, USA, 6 February 2004. [Google Scholar]
  19. Cluff, D.L.; Kazakidis, V. Frozen Baclfill Mix Formulations and Process for Use Thereof in Underground Mining Applications. U.S. Pat. Appl. Publ. US 2012/0114429 A1, 10 May 2012. [Google Scholar]
  20. Fall, M.; Belem, T.; Samb, S.; Benzaazoua, M. Experimental characterization of the stress–strain behaviour of cemented paste backfill in compression. J. Mater. Sci. 2007, 42, 3914–3922. [Google Scholar] [CrossRef]
  21. Li, H.; Yang, H.; Chang, C.; Sun, X. Experimental Investigation on Compressive Strength of Frozen Soil versus Strain Rate. J. Cold Reg. Eng. 2001, 15, 125–133. [Google Scholar] [CrossRef]
  22. Nasir, O.; Fall, M. Coupling binder hydration, temperature and compressive strength development of underground cemented paste backfill at early ages. Tunn. Undergr. Space Technol. 2010, 25, 9–20. [Google Scholar] [CrossRef]
  23. Yilmaz, E.; Belem, T.; Bussière, B.; Benzaazoua, M. Relationships between microstructural properties and compressive strength of consolidated and unconsolidated cemented paste backfills. Cem. Concr. Compos. 2011, 33, 702–715. [Google Scholar] [CrossRef]
  24. Ghoreishi-Madiseh, S.A.; Hassani, F.; Mohammadian, A.; Abbasy, F. Numerical modeling of thawing in frozen rocks of underground mines caused by backfilling. Int. J. Rock Mech. Min. 2011, 48, 1068–1076. [Google Scholar] [CrossRef]
  25. Beya, F.K.; Mbonimpa, M.; Belem, T.; Li, L.; Kalonji, K.; Benzaazoua, M.; Ouellet, S. Mine backfilling in the permafrost, Part I: Numerical prediction of thermal curing conditions within the cemented paste backfill matrix. Minerals 2019, 9, 165. [Google Scholar] [CrossRef]
  26. Beya, F.K. Étude du Transfert de chaleur dans les remblais en pâte cimentés curant sous les conditions aux frontières des chantiers miniers dans le pergélisol. Master’s Thesis, UQAT—École Polytechnique de Montréal, Montreal, QC, Canada, 2016. [Google Scholar]
  27. Han, F.S. Geotechnical Behaviour of Frozen Mine Backfills. Master’s Thesis, Université d’Ottawa/University of Ottawa, Ottawa, ON, Canada, 2011. [Google Scholar]
  28. Evirgen, B.; Onur, M.I.; Tuncan, M.; Tuncan, A. Determination of the Freezing Effect on Unconfined Compression Strength and Permeability of Saturated Granular Soils. Int. J. GEOMATE 2015, 8, 1283–1287. [Google Scholar] [CrossRef]
  29. Li, H.; Zhu, Y.; Pan, W. Uniaxial compressive strength of saturated frozen silt. In Proceedings of the 8th International Conference on Permafrost, Zürich, Switzerland, 21–25 July 2003; pp. 679–684. [Google Scholar]
  30. ASTM. C150-07 Standard Specification for Portland Cement; ASTM: West Conshohocken, PA, USA, 2007. [Google Scholar]
  31. Sivakugan, N.; Veenstra, R.; Naguleswaran, N. Underground Mine Backfilling in Australia Using Paste Fills and Hydraulic Fills. Int. J. Geosynth. Ground Eng. 2015, 1, 18. [Google Scholar] [CrossRef]
  32. Tariq, A.; Yanful, E.K. A review of binders used in cemented paste tailings for underground and surface disposal practices. J. Eniron. Manag. 2013, 131, 138–149. [Google Scholar] [CrossRef] [PubMed]
  33. Zhao, Y.; Soltani, A.; Taheri, A.; Karakus, M.; Deng, A. Application of Slag–Cement and Fly Ash for Strength Development in Cemented Paste Backfills. Minerals 2019, 9, 22. [Google Scholar] [CrossRef]
  34. Hivon, E.G.; Sego, D.C. Distribution of saline permafrost in the Northwest Territories, Canada. Can. Geotech. J. 1993, 30, 506–514. [Google Scholar] [CrossRef]
  35. Williams, J.R. Ground Water in the Permafrost Regions of Alaska; US Government Printing Office: Washington, DC, USA, 1970.
  36. Kalonji, K. Étude des propriétés rhéologiques et du transport du remblai cimenté en pâte en condition nordique. Master’s Thesis, UQAT—École Polytechnique de Montréal, Montreal, QC, Canada, 2016. [Google Scholar]
  37. COMSOL Multiphysics. Heat Transfer Module User’s Guide; COMSOL: Burlington, MA, USA, 2015; Volume 5.2. [Google Scholar]
  38. Benzaazoua, M.; Belem, T.; Bussière, B. Chemical aspect of sulfurous paste backfill mixtures. Cem. Concr. 2002, 32, 1133–1134. [Google Scholar] [CrossRef]
  39. Kesimal, A.; Yilmaz, E.; Ercikdi, B.; Alp, I.; Deveci, H. Effect of properties of tailings and binder on the short-and long-term strength and stability of cemented paste backfill. Mater. Lett. 2005, 59, 3703–3709. [Google Scholar] [CrossRef]
Figure 1. Variation over time in curing temperature estimated with COMSOL (Beya, et al. [25]), and targeted and applied in the laboratory for different distances from the CPB–rock wall interface: (a) 0 m, (b) 0.5 m, (c) 1 m, and (d) 2 m.
Minerals 09 00172 g001
Figure 2. UCS variation with curing time for CPB containing 5% HE cured at constant temperature (22 °C) in the humidity chamber (M1 and M2) and at decreasing temperatures (M3 to M6) depending on the distance Dp from the CPB–permafrost wall interface: 0 m (M3), 0.5 m (M4), 1 m (M5), and 2 m (M6).
Minerals 09 00172 g002
Figure 3. UCS variation with curing time for CPB containing 5% S-GU (blend of 80% Slag and 20% GU) cured at a constant temperature (22 °C) in the humidity chamber (M7) and at decreasing temperatures (M8 to M11) depending on the distance from the CPB–permafrost wall interface: 0 m (M8), 0.5 m (M9), 1 m (M10), and 2 m (M11).
Minerals 09 00172 g003
Figure 4. Comparison of the UCS of CPB samples containing 5% HE (M2) and S-GU (M7) with temperature at the end of mixing at 14 °C and at constant curing temperature (22 °C) in the humidity chamber.
Minerals 09 00172 g004
Figure 5. Comparison of the evolution of the UCS of CPB samples containing 5% HE (full lines) and S-GU (dashed lines) cured at decreasing temperatures depending on the distance from the CPB–permafrost wall interface (Dp): 0 m (M3 and M8) and 2 m (M6 and M11).
Minerals 09 00172 g005
Figure 6. Evolution of the UCS in mixtures (M2, M3, and M6) containing 5% HE (full lines) and mixtures (M12–M14) containing 3% HE (dashed lines) cured under a constant temperature of 22 °C (M2 and M12) and under decreasing temperatures depending on the distance from the CPB–permafrost wall interface (Dp): 0 m (M3 and M13) and 2 m (M6 and M14).
Minerals 09 00172 g006
Figure 7. Effect of decreasing (M3) and constant (M15) curing temperatures on CPB strength.
Minerals 09 00172 g007
Table 1. Characteristics of the studied CPB mixtures.
MixturesBinder TypeBw
(%)
Temperature at the End of the Mixing Tm (°C)Distance to the Interface Dp (m)Target and Applied Curing Temperature
M1HE524.3-22 ± 1 °C
M2HE514.1 22 ± 1 °C
M3HE514.60.0see Figure 1a
M4HE513.90.5see Figure 1b
M5HE514.31.0see Figure 1c
M6HE514.72.0see Figure 1d
M7S-GU514.8 22 ± 1 °C
M8S-GU514.60.0see Figure 1a
M9S-GU513.90.5see Figure 1b
M10S-GU514.01.0see Figure 1c
M11S-GU514.52.0see Figure 1d
M12HE314.8-22 ± 1 °C
M13HE314.40.0see Figure 1a
M14HE314.02.0see Figure 1d
M15HE514.3-2 ± 1 °C

