Article

Effects of Single and Mixed Energy Sources on Intracellular Nanoparticles Synthesized by Acidithiobacillus ferrooxidans

1
School of Minerals Processing & Bioengineering, Central South University, Changsha 410083, China
2
Key Laboratory of Biohydrometallurgy of Ministry of Education, Changsha 410083, China
*
Author to whom correspondence should be addressed.
Minerals 2019, 9(3), 163; https://doi.org/10.3390/min9030163
Submission received: 22 January 2019 / Revised: 28 February 2019 / Accepted: 5 March 2019 / Published: 8 March 2019

Abstract

:
Effective biosynthesis of magnetite nanoparticles using current technology is challenging. We investigated the synthesis of nanoparticles by Acidithiobacillus ferrooxidans grown on ferrous iron, elemental sulphur, and mixtures of both substrates. A comparison of tests with different doping amounts of elemental sulphur in ferrous-containing medium showed that the addition of 0.25 and 0.5 M elemental sulphur to the medium resulted in an increased delay of microbial growth and ferrous iron oxidation. TEM suggested that the ferrous material was an essential energy source for the synthesis of nanoparticles in cells. TEM results indicated that the different ratios of ferrous and sulphur had no significant effect on the morphology of bacteria and the size of nanoparticles. High-resolution transmission electron microscopy (HRTEM), energy dispersive X-ray spectroscopy (EDX), and X-ray absorption near edge structure (XANES) showed that the nanoparticles were composed of magnetite. For the first time, HRTEM and XANES spectra in-situ characterization was conducted to investigate the nanoparticles that were synthesized by A. ferrooxidans. The findings from this study indicated that the different ratios of ferrous and sulphur had no significant effect on size and shape of nanoparticles synthesized by A. ferrooxidans.

1. Introduction

Nanoparticles play a crucial role in a number of industries due to their dimension, high surface area, quantum confinement, and dispersal without agglomeration [1,2,3]. Various physical and chemical methods are used to produce monodisperse nanoparticles [4,5]. The stability and the use of non-toxic chemicals are of paramount importance, thus there is a strong demand for environmentally friendly and sustainable methods. Since magnetite particles were discovered in magnetotactic bacteria [6], microbial synthesis of nanoparticles is under investigation as an environmentally friendly approach that interconnects nanotechnology and microbial biotechnology [7,8].
Magnetotactic bacteria (MTB), first discovered by Blakemore in 1975 [6], are a polyphyletic group of bacteria that have the ability to orient and move along the magnetic and geomagnetic field lines. Species of magnetotactic bacteria have been observed in diverse gram-negative phylogenetic groups, including the Alphaproteobacteria, Gammaproteobacteria, Deltaproteobacteria, and Nitrospira [9,10,11]. The magnetotactic behavior is enabled by the synthesis of ferrimagnetic intracellular organelles termed the magnetosome [12]. As the most important component of MTB, magnetosomes can sense the Earth’s magnetic field and drive the MTB into the suitable environment for their growth [13]. It has been reported that magnetosomes are magnetite (Fe3O4) or greigite (Fe3S4) nanocrystals enveloped by a phospholipid bilayer membrane [14,15]. Owing to their magnetic properties, magnetosomes have already been successfully applied in various fields, including analytical labeling of DNA and RNA, magnetic resonance imaging, tumor diagnosis, and nanoprobes [16,17,18,19]. Nearly all known MTB are microaerophilic, anaerobic, or facultatively anaerobic microaerophilic microbes. They are widely dispersed in the environment, including the soil, lakes, oceans, and other underwater sludges [20]. Some have also been observed in extreme environments including thermophilic, alkaliphilic, psychrophilic, acidophilic, and halophilic habitats [21,22]. However, only a few types of MTB have been isolated and cultured, and large-scale culture is limited due to their strict growth conditions. At present, this is the primary limiting factor for their application [23].
Acidithiobacillus ferrooxidans is an economically significant bacterium in the field of biohydrometallurgy [24,25,26] and is easily cultured on a large scale [27,28]. Additionally, it can continuously produce leaching agents when it obtains energy by oxidizing elemental sulphur, ferrous iron, and metal sulphide ores [29,30,31,32]. Interestingly, A. ferrooxidans has also been shown to intracellularly produce magnetite nanoparticles [22,33,34]. A study by Yan et al. [35] demonstrated that these nanoparticles were not cytotoxic, septicaemic, or genotoxic, and could be applied in medical and biotechnological applications. Therefore, A. ferrooxidans is a promising alternative strain to magnetotactic bacteria. Zhang et al. [36] demonstrated that the optimal conditions for cell growth and magnetosome growth are different. Additionally, oxygen concentration and magnetic field intensity can affect the formation of nanoparticles [34,37]. When oxygen concentration is low, bacteria are more likely to synthesize nanoparticles, and A. ferrooxidans synthesizes nanoparticles more easily under a magnetic field. Liu et al. [33] further demonstrated that the expression of mpsA, magA, thy, and mamB genes, which can affect the formation of nanoparticles, is regulated by ferrous ion concentrations. They found that the expression of these genes was decreased under iron-deficient and iron-excessive conditions, and the cells synthesized fewer nanoparticles. Several researchers have investigated the effect of using ferrous iron and elemental sulphur as either the sole or mixed energy sources for mineral bioleaching [38,39]. Their studies focused on the influence of bioleaching, but little is known about the influence on bacterial growth [40]. In a prior study, we found that A. ferrooxidans had the ability to synthesize inhomogeneous intracellular nanoparticles containing iron [41]. Based on this, we investigated the effect of sole and mixed energy sources on nanoparticles synthesized by A. ferrooxidans.
In the previous studies [34,35,42], researchers isolated nanoparticles from A. ferrooxidans first and then characterized them with XRD. However, the X-ray absorption near edge structure (XANES) spectrum allows us to work with a whole cell, avoiding the process of extraction of nanoparticles [43]. Thus, XANES and high-resolution transmission electron microscopy (HRTEM) in-situ characterization was conducted to investigate the nanoparticles that were synthesized by A. ferrooxidans in this work.

2. Materials and Methods

2.1. Bacterial Enrichment

The A. ferrooxidans strain ATCC 23270 was provided by the Key Laboratory of Biohydrometallurgy of Ministry of Education, Central South University, China. The strain was cultured in 9 K basal medium containing (NH4)2SO4 (3.09 g/L), KCl (0.1 g/L), K2HPO4 (0.5 g/L), MgSO4·7H2O (0.5 g/L), and Ca(NO3)2 (0.01 g/L) at 30 °C. pH was adjusted to 1.97 using 50% H2SO4. The strain was cultivated in 250 mL flasks with FeSO4·7H2O (0.16 M) as an energy source. The strain was collected in the logarithmic phase by centrifugation (Beckman Coulter, Inc. Avanti J-E) at 10,000 rpm at 25 °C for 15 min. The bacteria were re-suspended in sterilized distilled water and then collected for experiments.

2.2. Experimental Design

All experiments were conducted in 250 mL flasks containing 100 mL sterilized 9 K basal medium. The experiment was divided into four groups (Table 1), where the first group (1#) received 0.16 M FeSO4·7H2O, the second group (2#) received 0.16 M FeSO4·7H2O and 0.25 M elemental sulphur, the third group (3#) received 0.16 M FeSO4·7H2O and 0.5 M elemental sulphur, and the fourth group (4#) received 0.31 M elemental sulphur. Each flask was inoculated with 5.0 × 10⁶ cells/mL (cell density was measured using blood cell counting chambers under an optical microscope) A. ferrooxidans. All experiments were carried out in triplicate at 30 °C in a rotary platform incubator at 170 rpm for 156 h. Samples (0.2 mL) were collected every 12 h, and evaporation loss was compensated periodically by adding distilled water.

2.3. Analytical Methods

Cell density was measured using blood cell counting chambers under an optical microscope (BX-41TF, Olympus, Tokyo, Japan). The ferrous ions were detected by the 1,10-phenanthroline method [44], and the total iron was assayed after reducing ferric to ferrous by ascorbic acid [45]. The pH and oxidation-reduction potential (ORP) value in the solutions were measured using a pH meter (PHSJ-4A) and a Pt electrode in reference to an Ag/AgCl electrode (3M KCl) (BPP-922). These analyses were performed on the experimental system. Values presented show means ± SD of triplicate samples analyzed individually.

2.4. TEM Analysis

Cells were collected after 156 h of culture and fixed at 4 °C in 2.5% glutaraldehyde for 24 h, post-fixed in 1% OsO4 for 50 min, dehydrated in graded ethanol, and then embedded in epoxy resin. Ultrathin sections (100 nm) were cut using an ultramicrotome (LKB-5, LKB, Sweden). The ultrathin sections were collected on carbon-coated copper grids and stained with uranyl acetate and lead citrate. The observations and images were performed with TEM (FEI Tecnai Spirit, Hillsboro, OR, USA) with an accelerating voltage of 80 kV. The crystal structures and chemical compositions of nanoparticles were analyzed using HRTEM and energy dispersive X-ray spectroscopy (EDX) using a TEM (JEM 2100F) with an accelerating voltage of 200 kV. The size of bacteria and nanoparticles was measured using TEM images imported into Adobe Photoshop. The length and width of bacteria were measured. The longest length of nanoparticles was measured. The size is presented as means ± SD.

2.5. XANES Analysis

The XANES analysis was performed at the 1W1B beamline in the Beijing Synchrotron Radiation Facility (BSRF), Beijing, China. Reference sample of spectra of Fe K-edge XANES was collected from pure compounds, including FeCl2, Fe2O3, Fe(OH)3, and Fe3O4. Each reference sample was placed on the Kapton tape, and the A. ferrooxidans collected from the experimental system was injected into a 10-mm-thick cell with Kapton film windows. Fe foil was used to calibrate the monochromator. Data were collected with a step of 1 eV and dwell time of 1 s under a transmission model using a Si (311) double crystal monochromator. The XANES spectra were normalized using the Athena program [46].

3. Results and Discussion

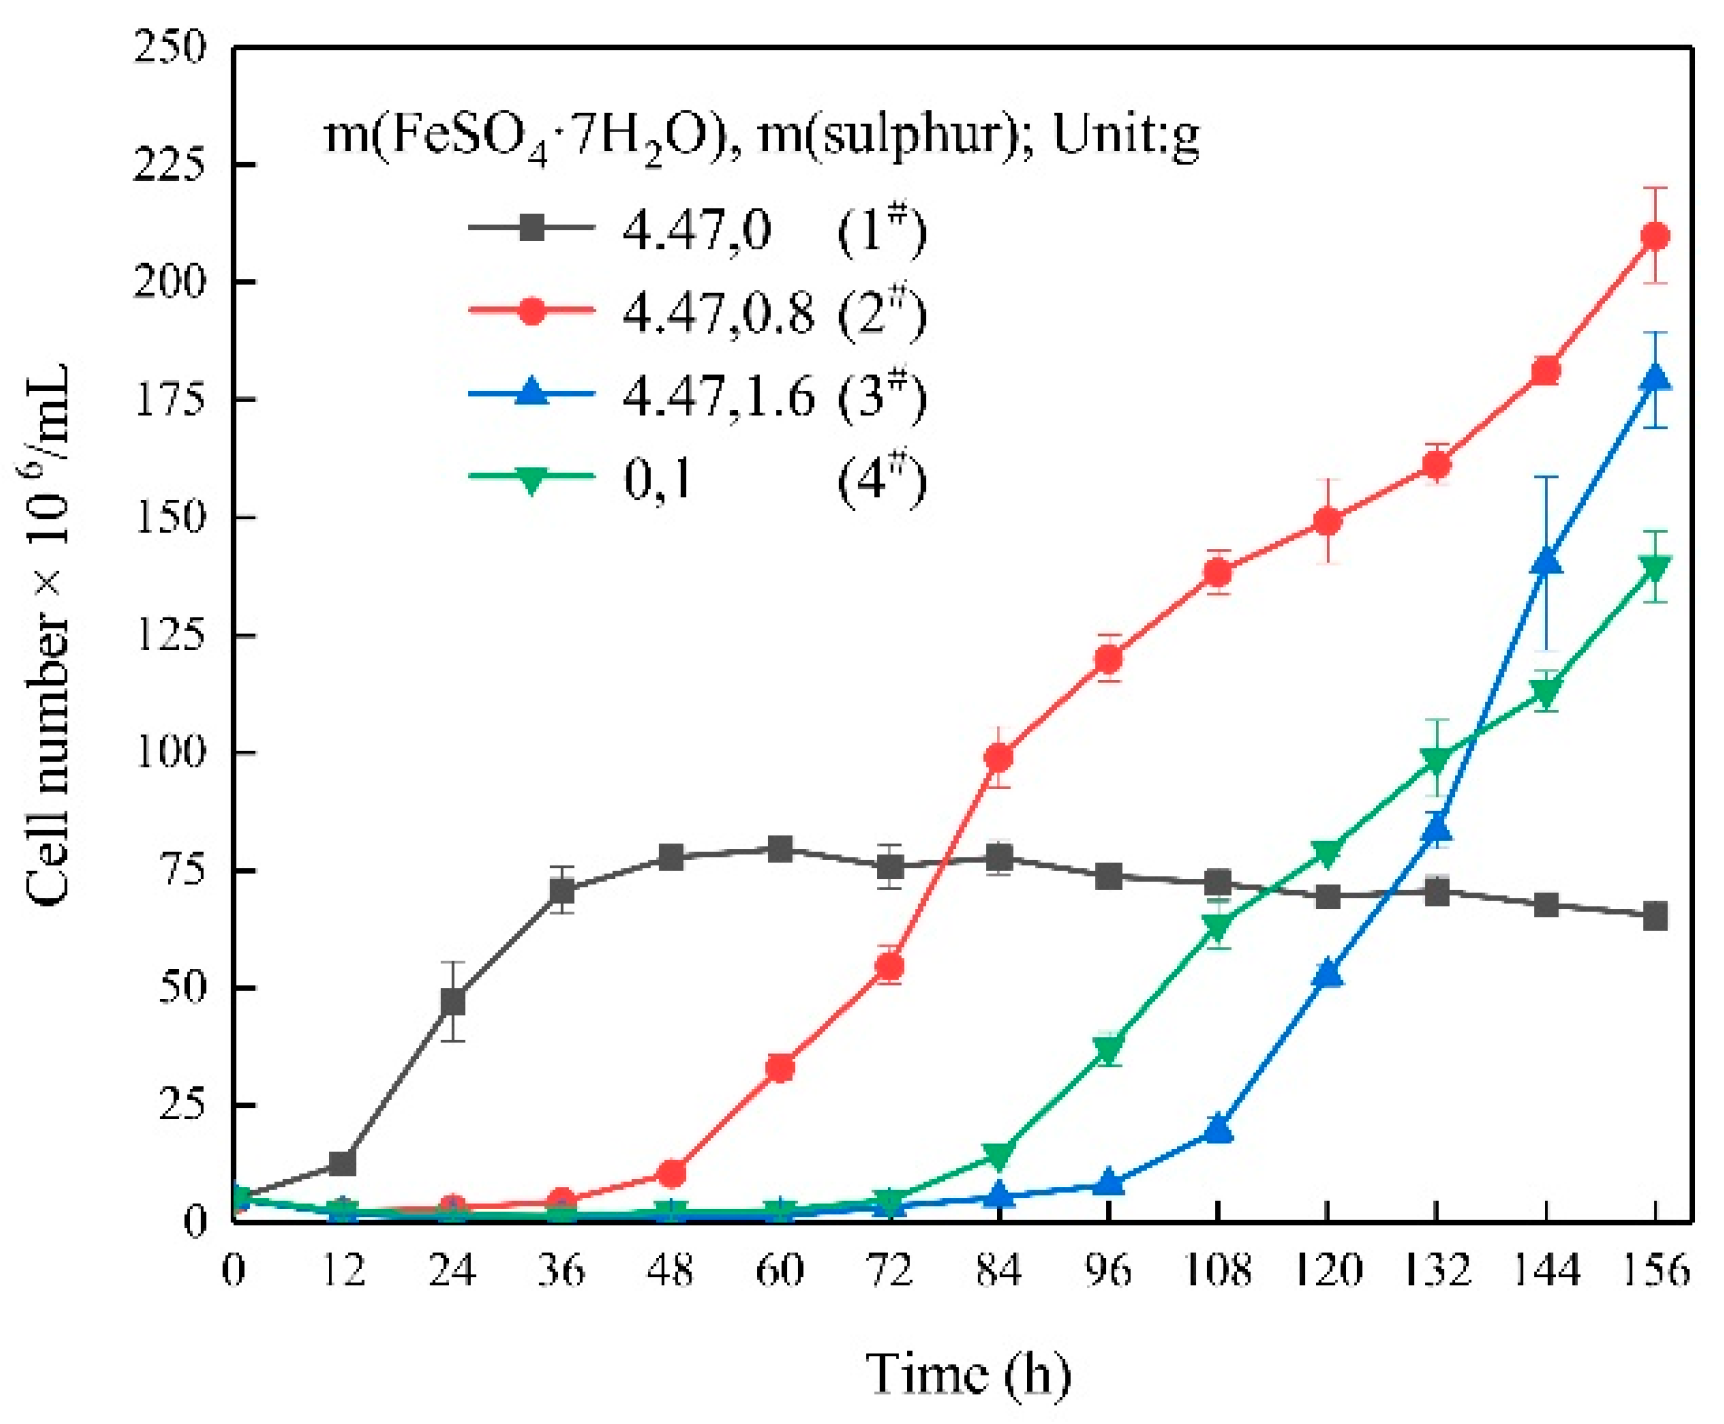
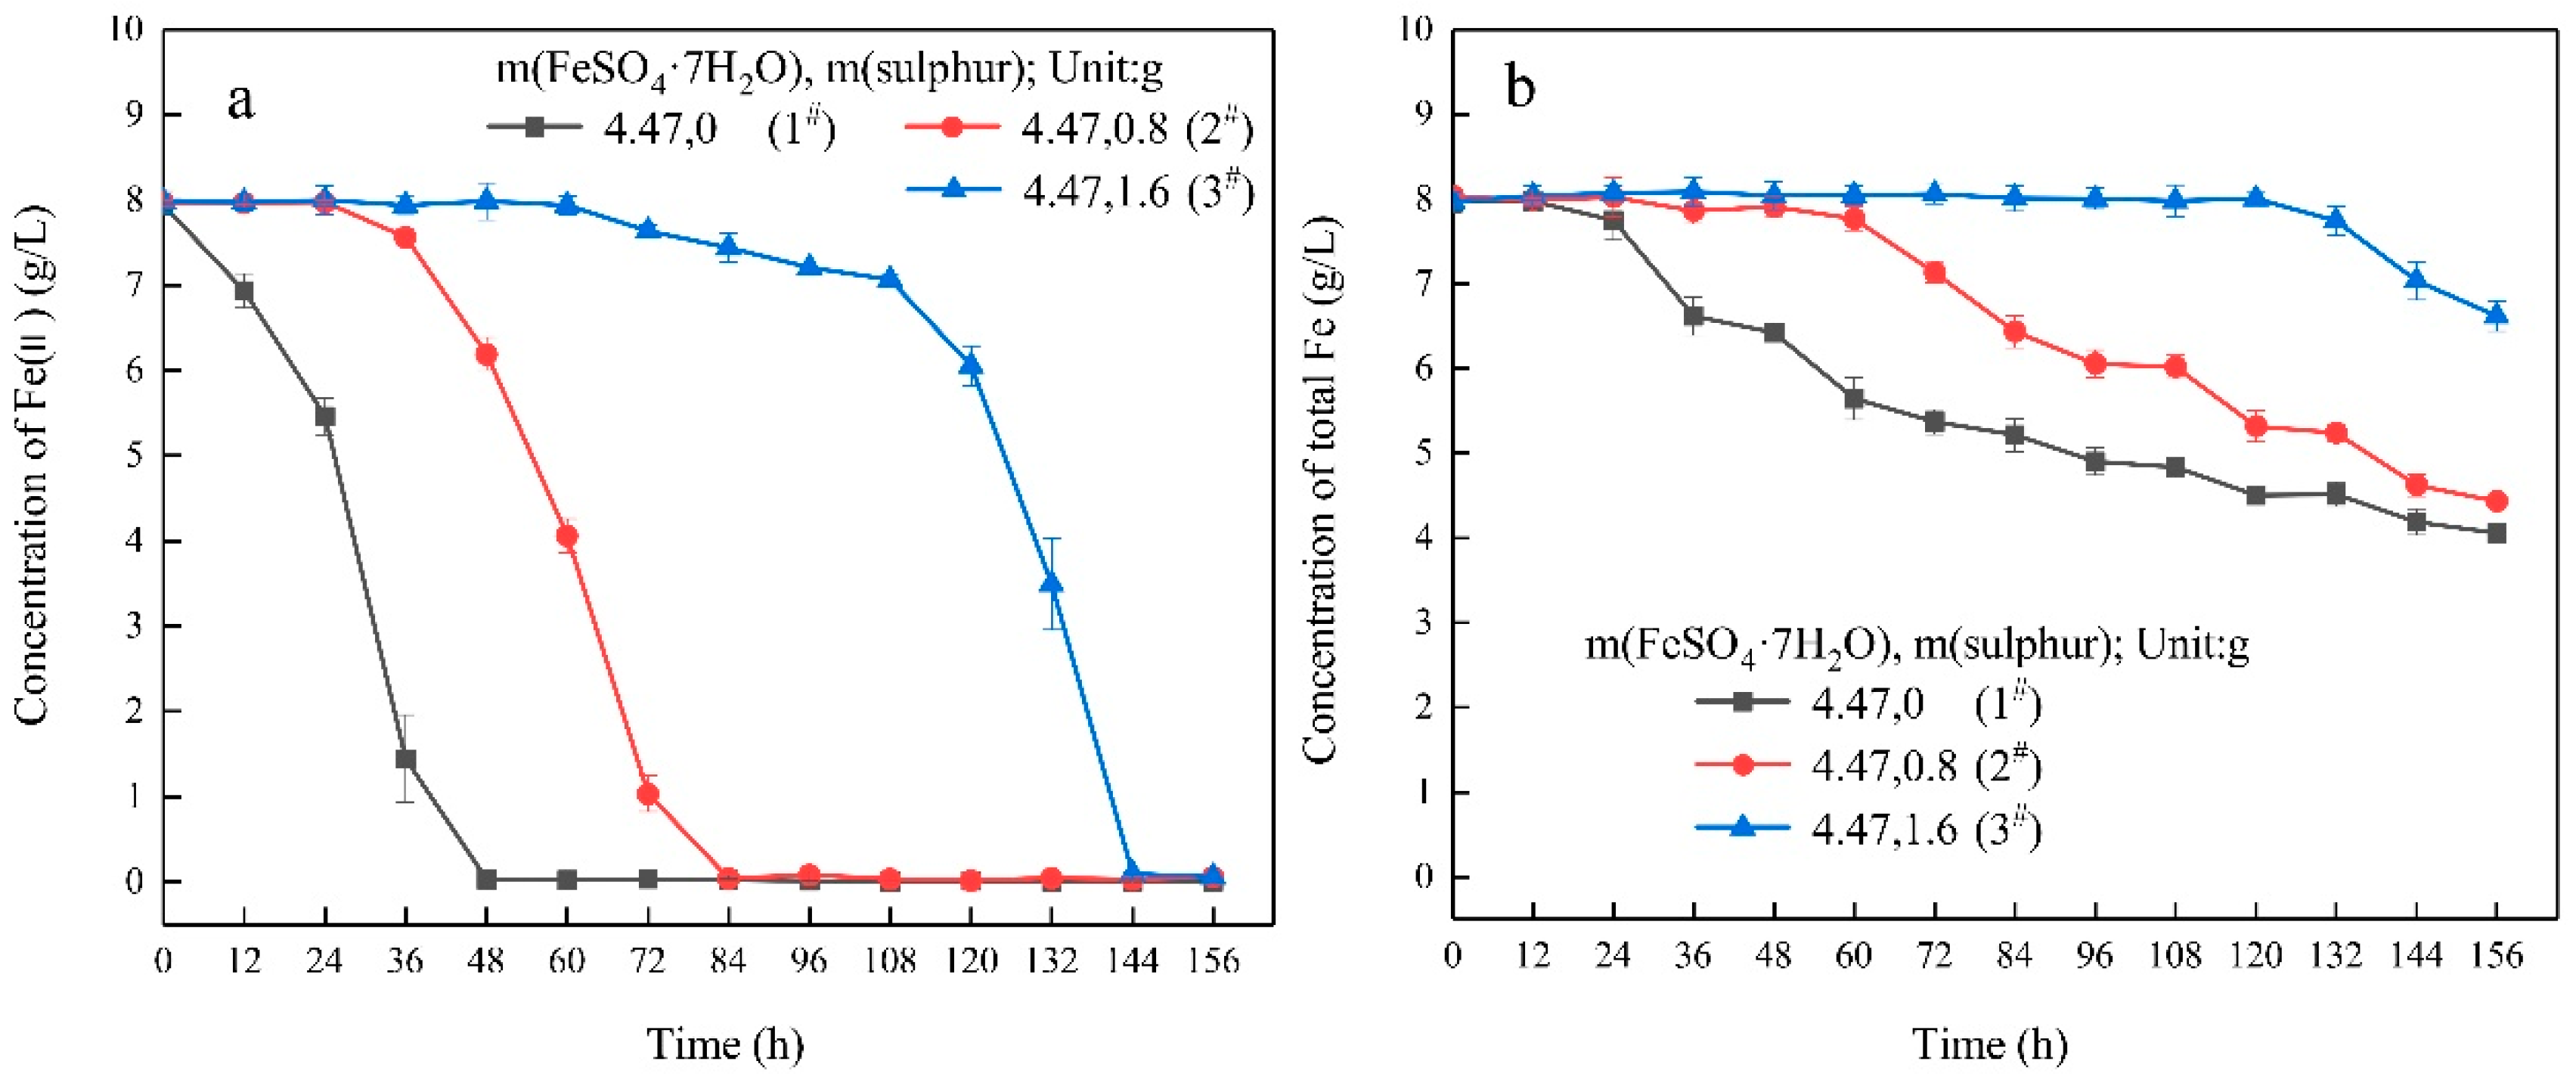
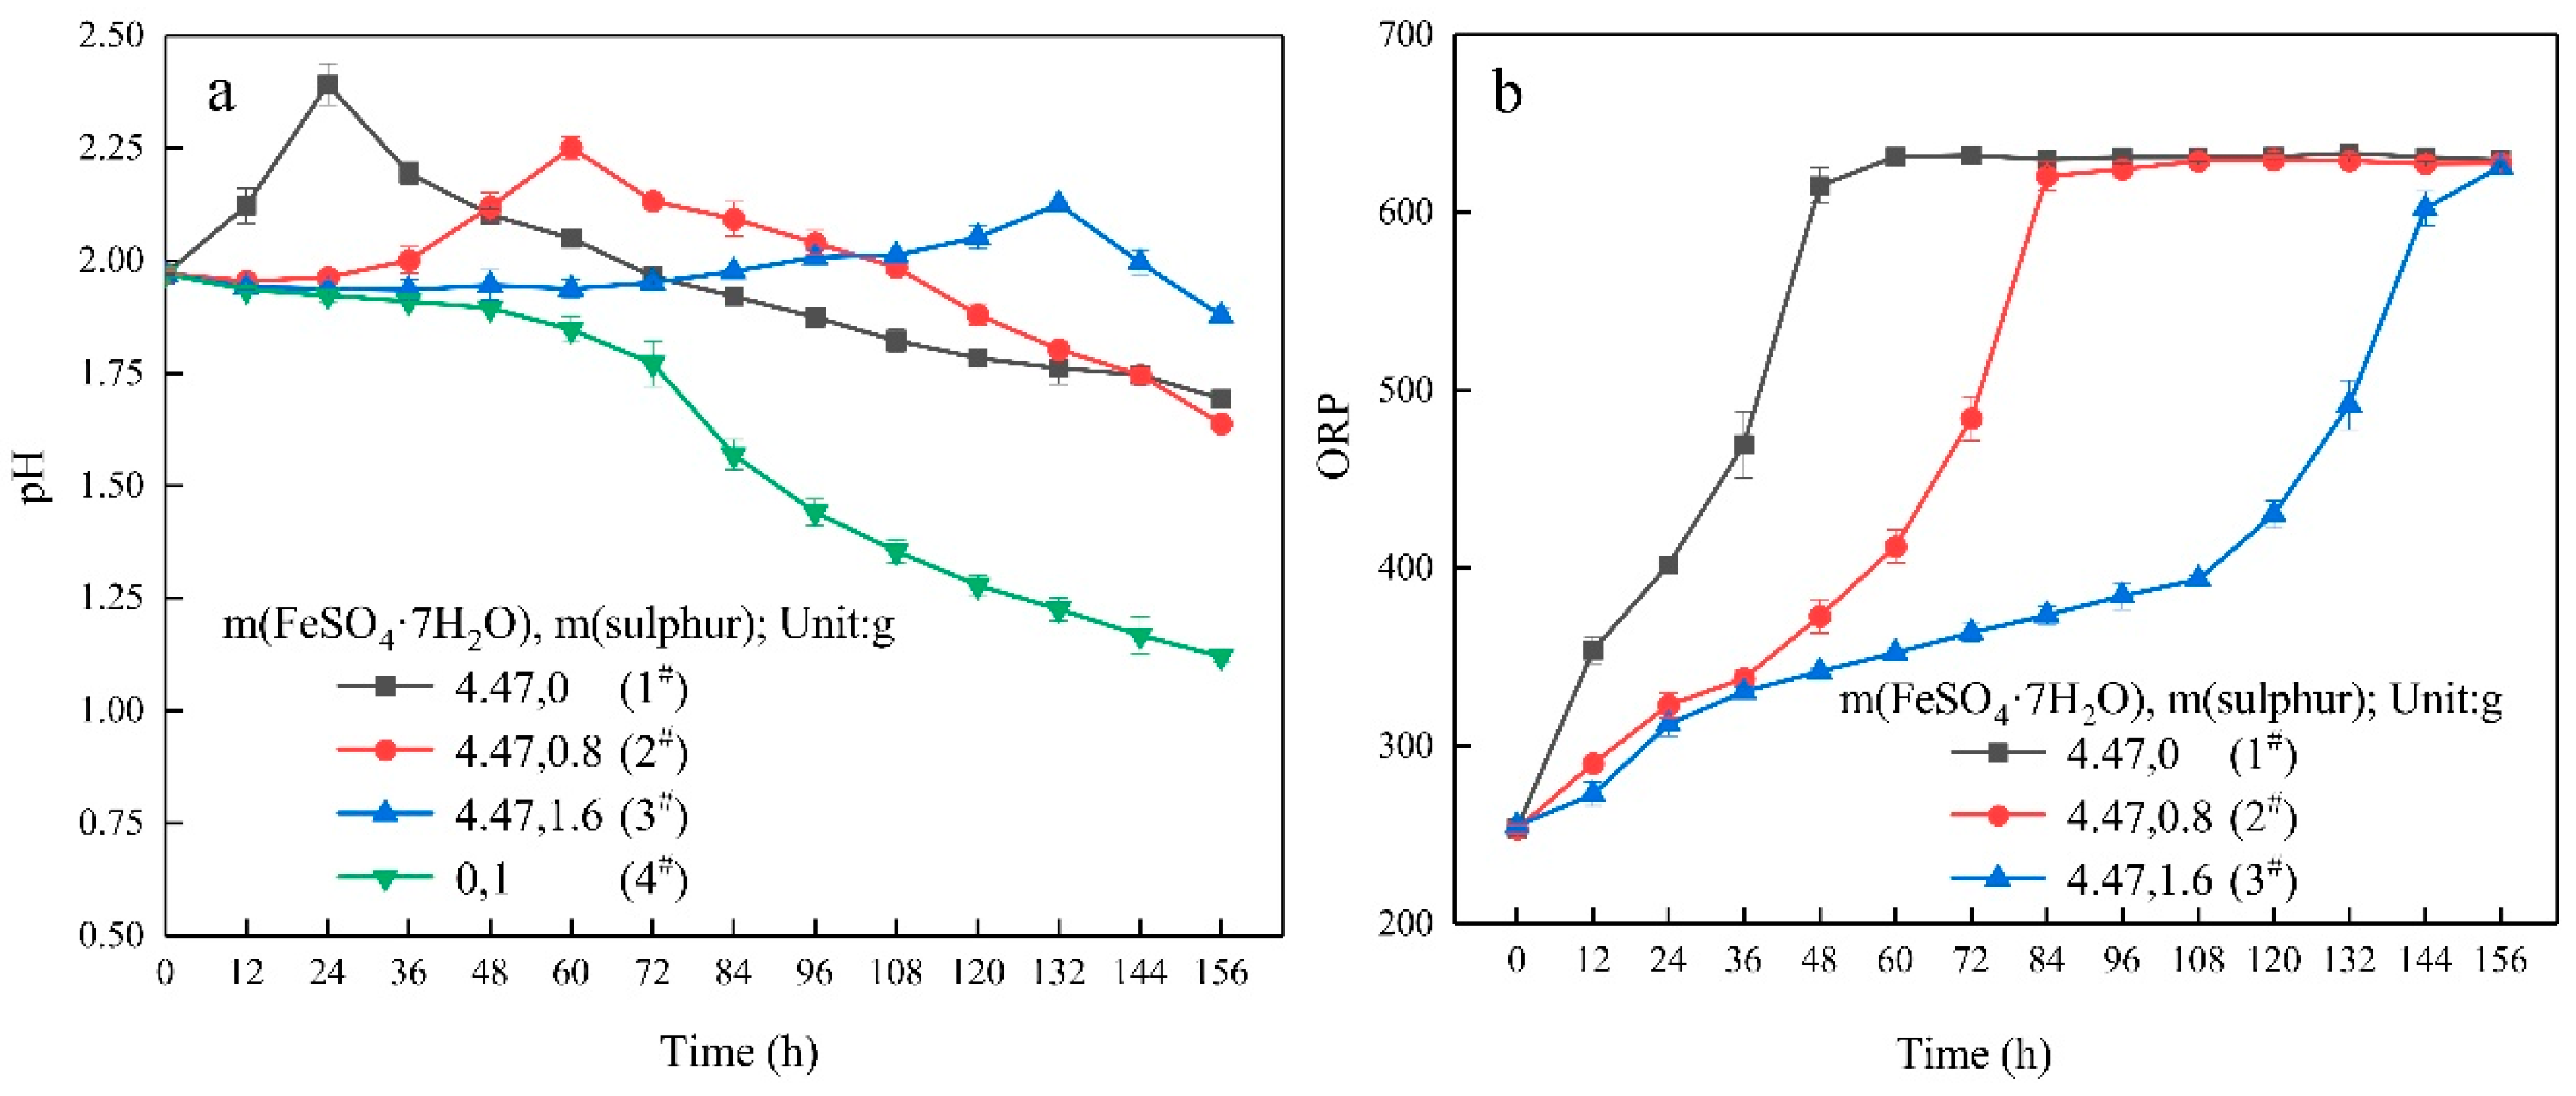
3.1. Growth Characteristics

As shown in Figure 1, in medium 1#, the logarithmic phase of the bacteria started at 12 h and ended at 48 h with a peak cell density of 8.0 × 10⁷ cells/mL. There was a slight decrease in bacteria density in the 2#, 3#, and 4# media during the initial growth period, which was attributed to the adsorption of a free population on the surface of elemental sulphur [47,48]. The lag phase of bacteria in the medium with added elemental sulphur was longer than that in the medium using ferrous iron as the sole energy source because of a period of adaptation in the ferrous grown culture to a mixed substrate and sulphur-only environment. The final cell densities for 2#, 3#, and 4# media were 2.1 × 10⁸, 1.8 × 10⁸, and 1.4 × 10⁸ cells/mL, respectively. The cell density in the 4# medium was higher than the maximum density of bacteria in the 1# medium at 156 h. A previous study reported that sulphur-grown cells give a higher yield of carbon dioxide fixation than cells grown on ferrous ions [49]; furthermore, carbon dioxide fixation is the only option available for chemolithotrophic bacteria to generate biomass [50]. Therefore, the density of sulphur-grown cells is higher than that of ferrous-grown cells.
Ferrous ion concentration decreased in the 1#, 2#, and 3# media (Figure 2a) due to the oxidation of ferrous ions to ferric ions by A. ferrooxidans (Equation (1)) [51]. The concentration of ferrous ions in the 1# medium decreased sharply during the first 48 h. The ferrous ions were completely oxidized in the 2# and 3# media at 84 h and 144 h, respectively. When elemental sulphur was added to the medium, the oxidation of ferrous iron was delayed. Previous investigations have shown that ferrous irons and elemental sulphur are used simultaneously by A. ferrooxidans [39,52]. Therefore, an increase in the proportion of sulphur in energy results in an increased delay of ferrous iron oxidation. Figure 2b shows the variation in soluble total iron during cultivation, with a decrease in soluble total iron due to the formation of ferruginous substances such as jarosite [47], which can be expressed as Equation (2). In addition, Fang et al. [41] found that a small amount of iron was taken into cells for synthesis of ferruginous nanoparticles.
2Fe2+ + 1/2O2 + 2H+ → 2Fe3+ + H2O
3 Fe 3 + + 2 SO 4 2 + K + + 6 H 2 O KFe 3 ( SO 4 ) 2 ( OH ) 6 + 6 H +
The variation of pH is shown in Figure 3a. In the 1# medium, pH increased from 1.97 to 2.40 at 24 h then decreased to 1.69 at 156 h. This was likely due to the consumption of H+ in the early period when bacteria utilized ferrous iron, as shown in Equation (1). Later decreases were likely due to the abiotic hydrolysis of ferric sulphate (Equation (3)) and the formation of ferruginous substances such as jarosite (Equation (2)). The variation of pH in the 2# and 3# media was also initially increased and then decreased. The decrease was likely due to the abiotic hydrolysis of ferric sulphate and the synthesis of jarosite, as well as the oxidation of sulphur (Equation (4)). In the 4# medium, the pH value decreased slowly in the first 72 h then decreased more significantly. The oxidation of elemental sulphur by A. ferrooxidans is an acid-producing reaction [47], as shown in Equation (4). The ORP increased from 350 mV at 12 h to 620 mV at 48 h in the 1# medium. In the 2# and 3# media, a lag period of 36 h and 108 h was observed before the ORP obviously increased (Figure 2b). The variation in ORP showed a negative correlation with the ferrous concentration.
Fe3+ + 3H2O → Fe(OH)3 + 3H+
2S0 + 3O2 + 2H2O → 2H2SO4

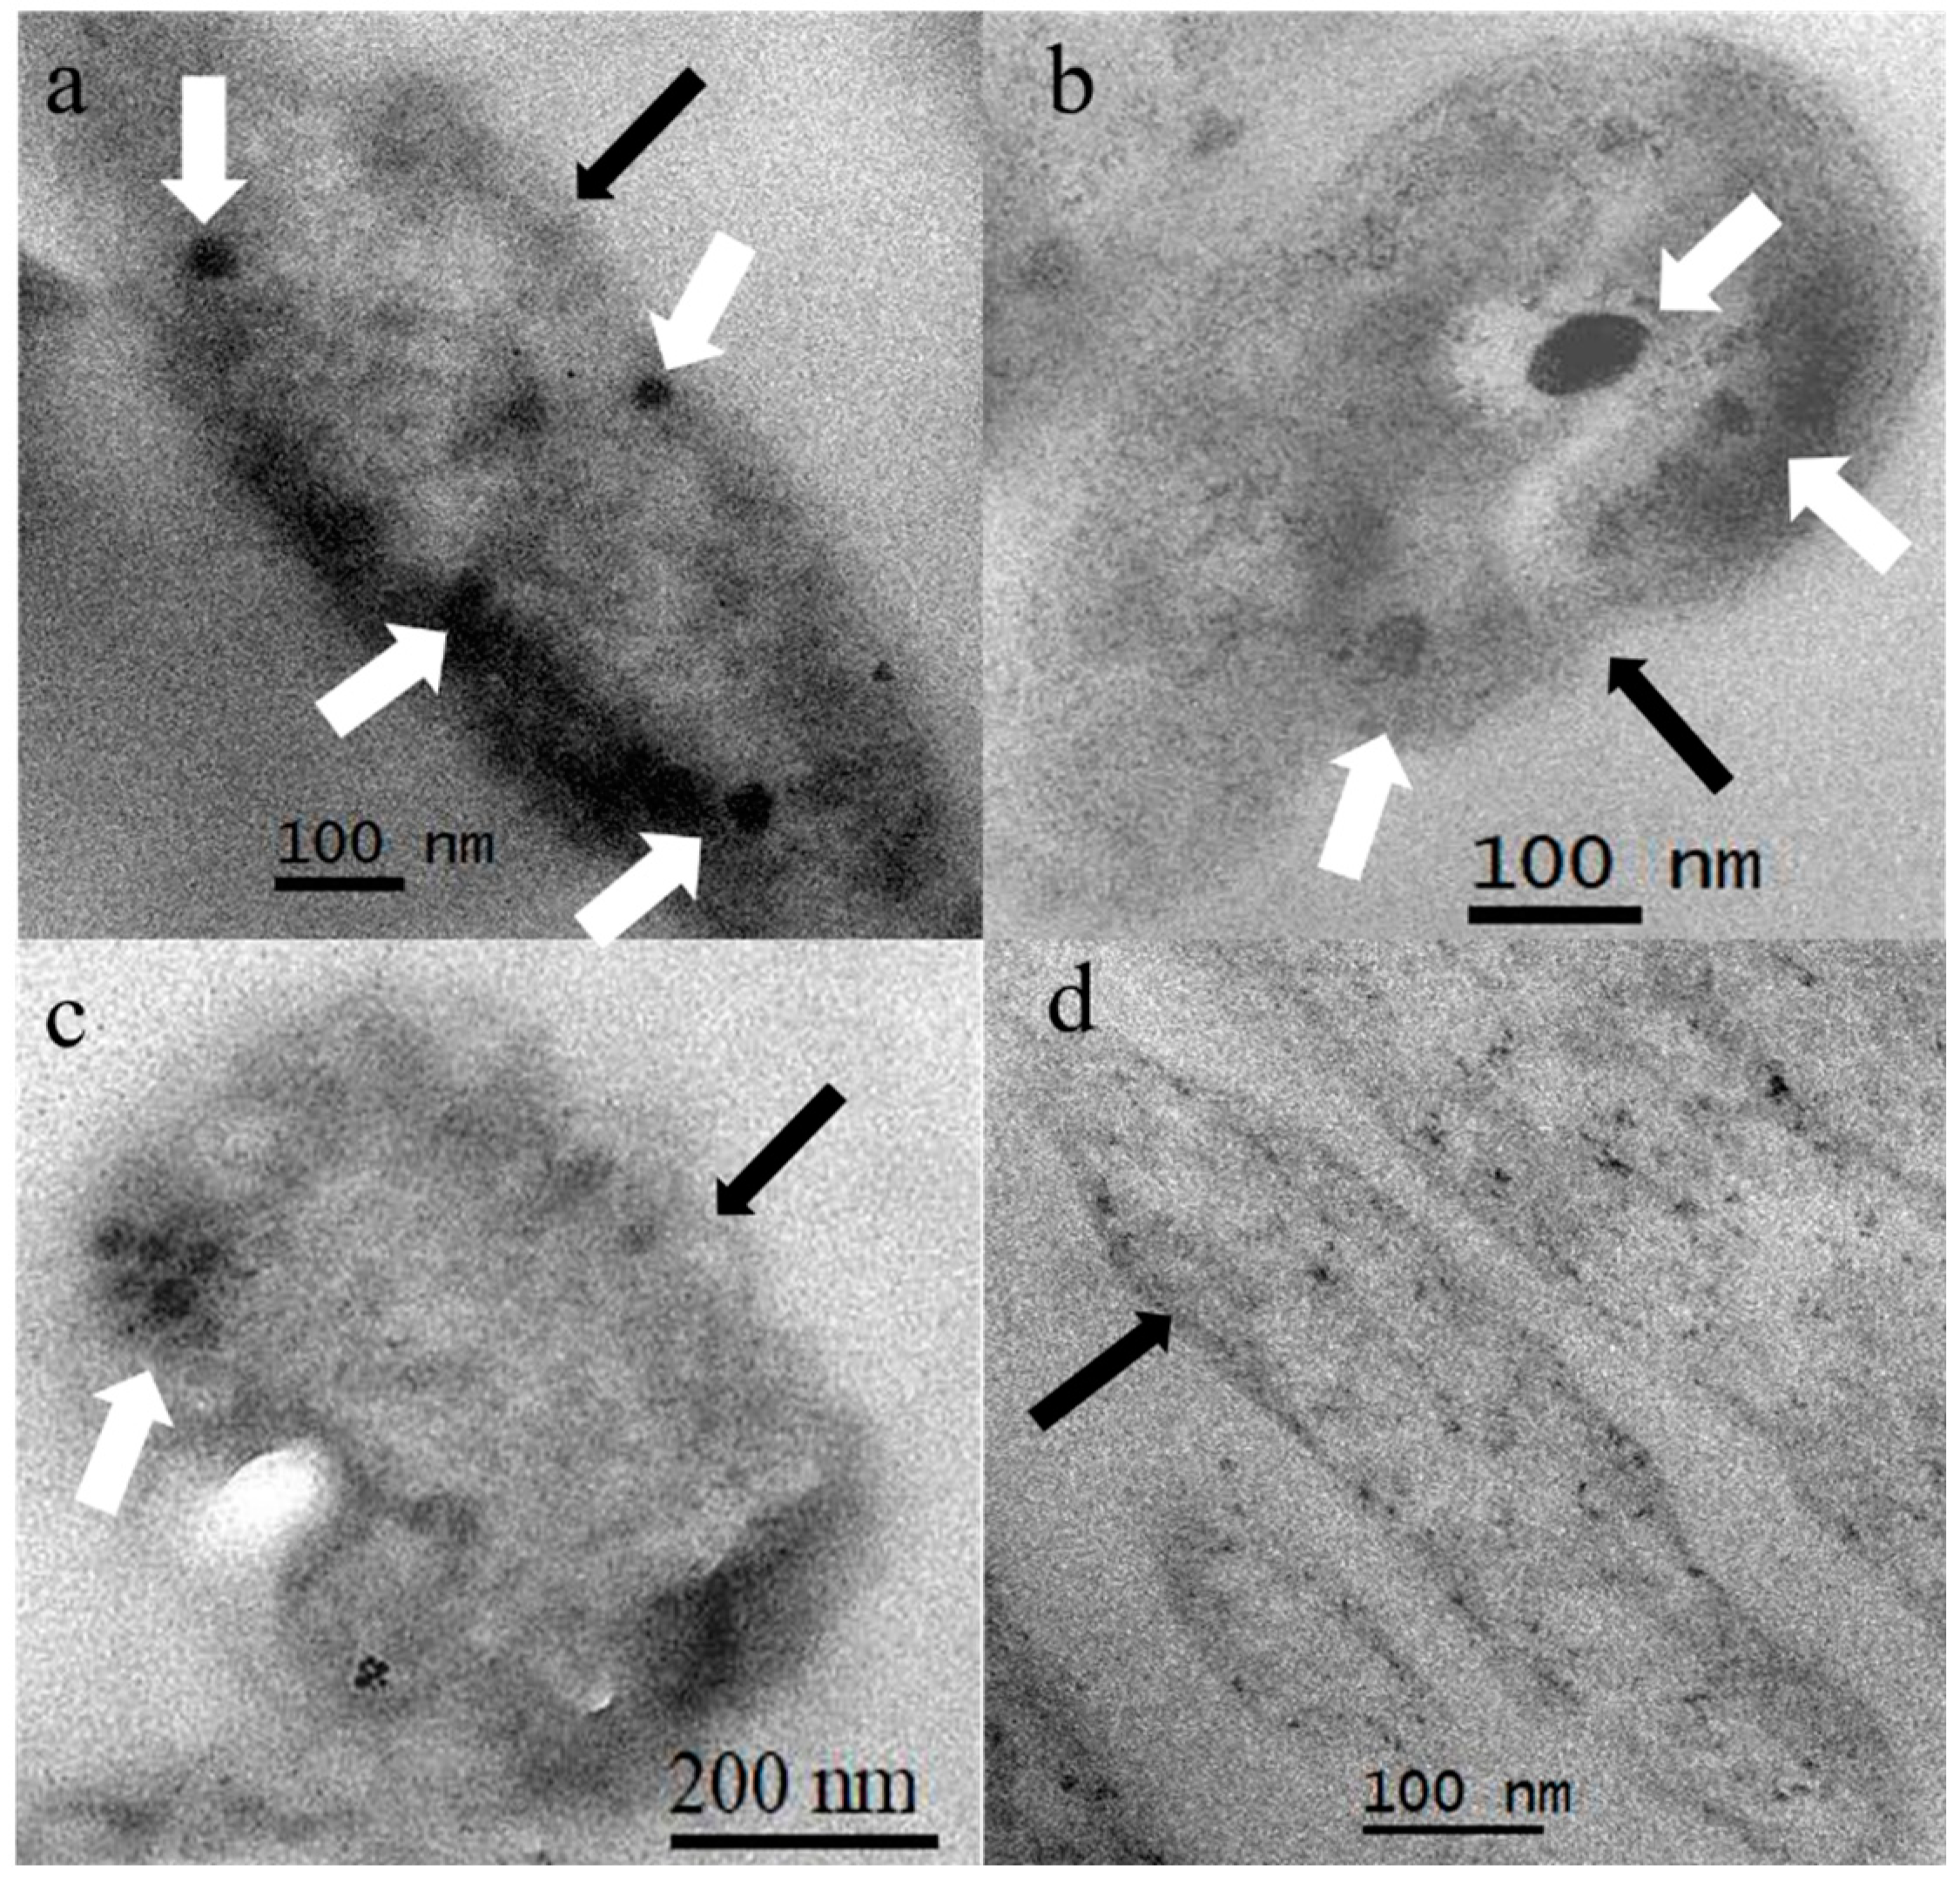
3.2. Morphology of Bacteria
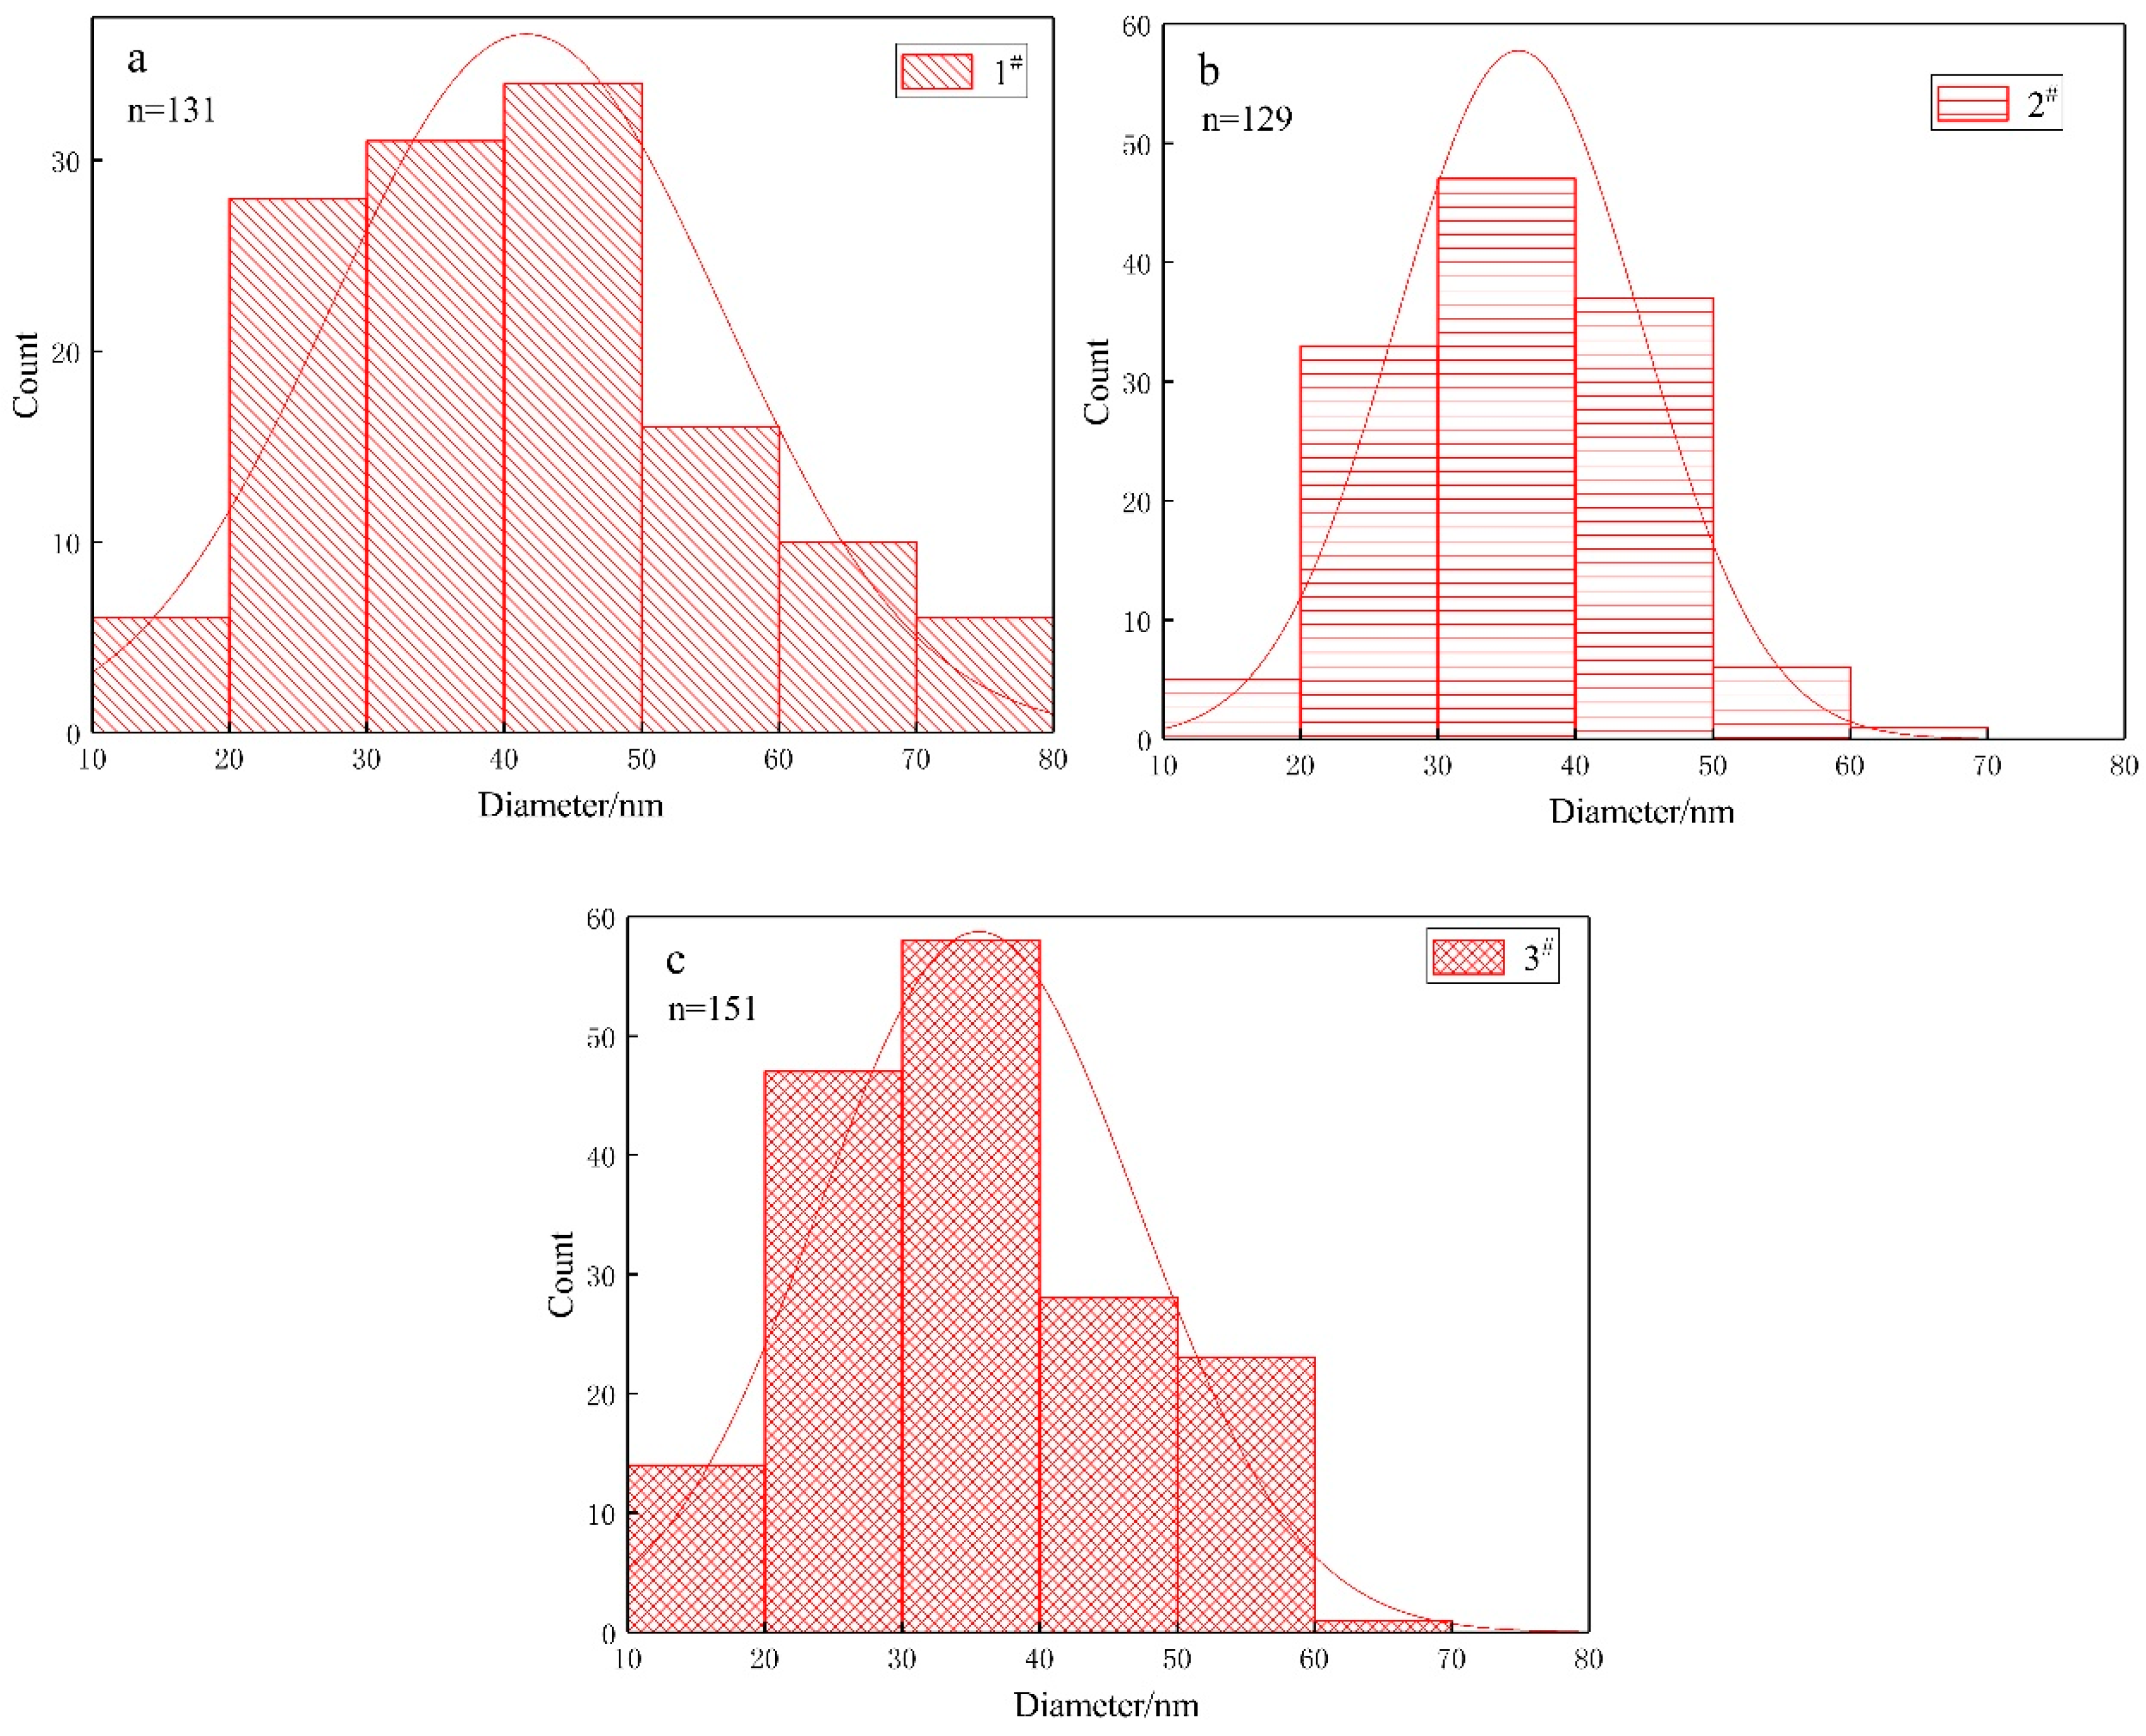
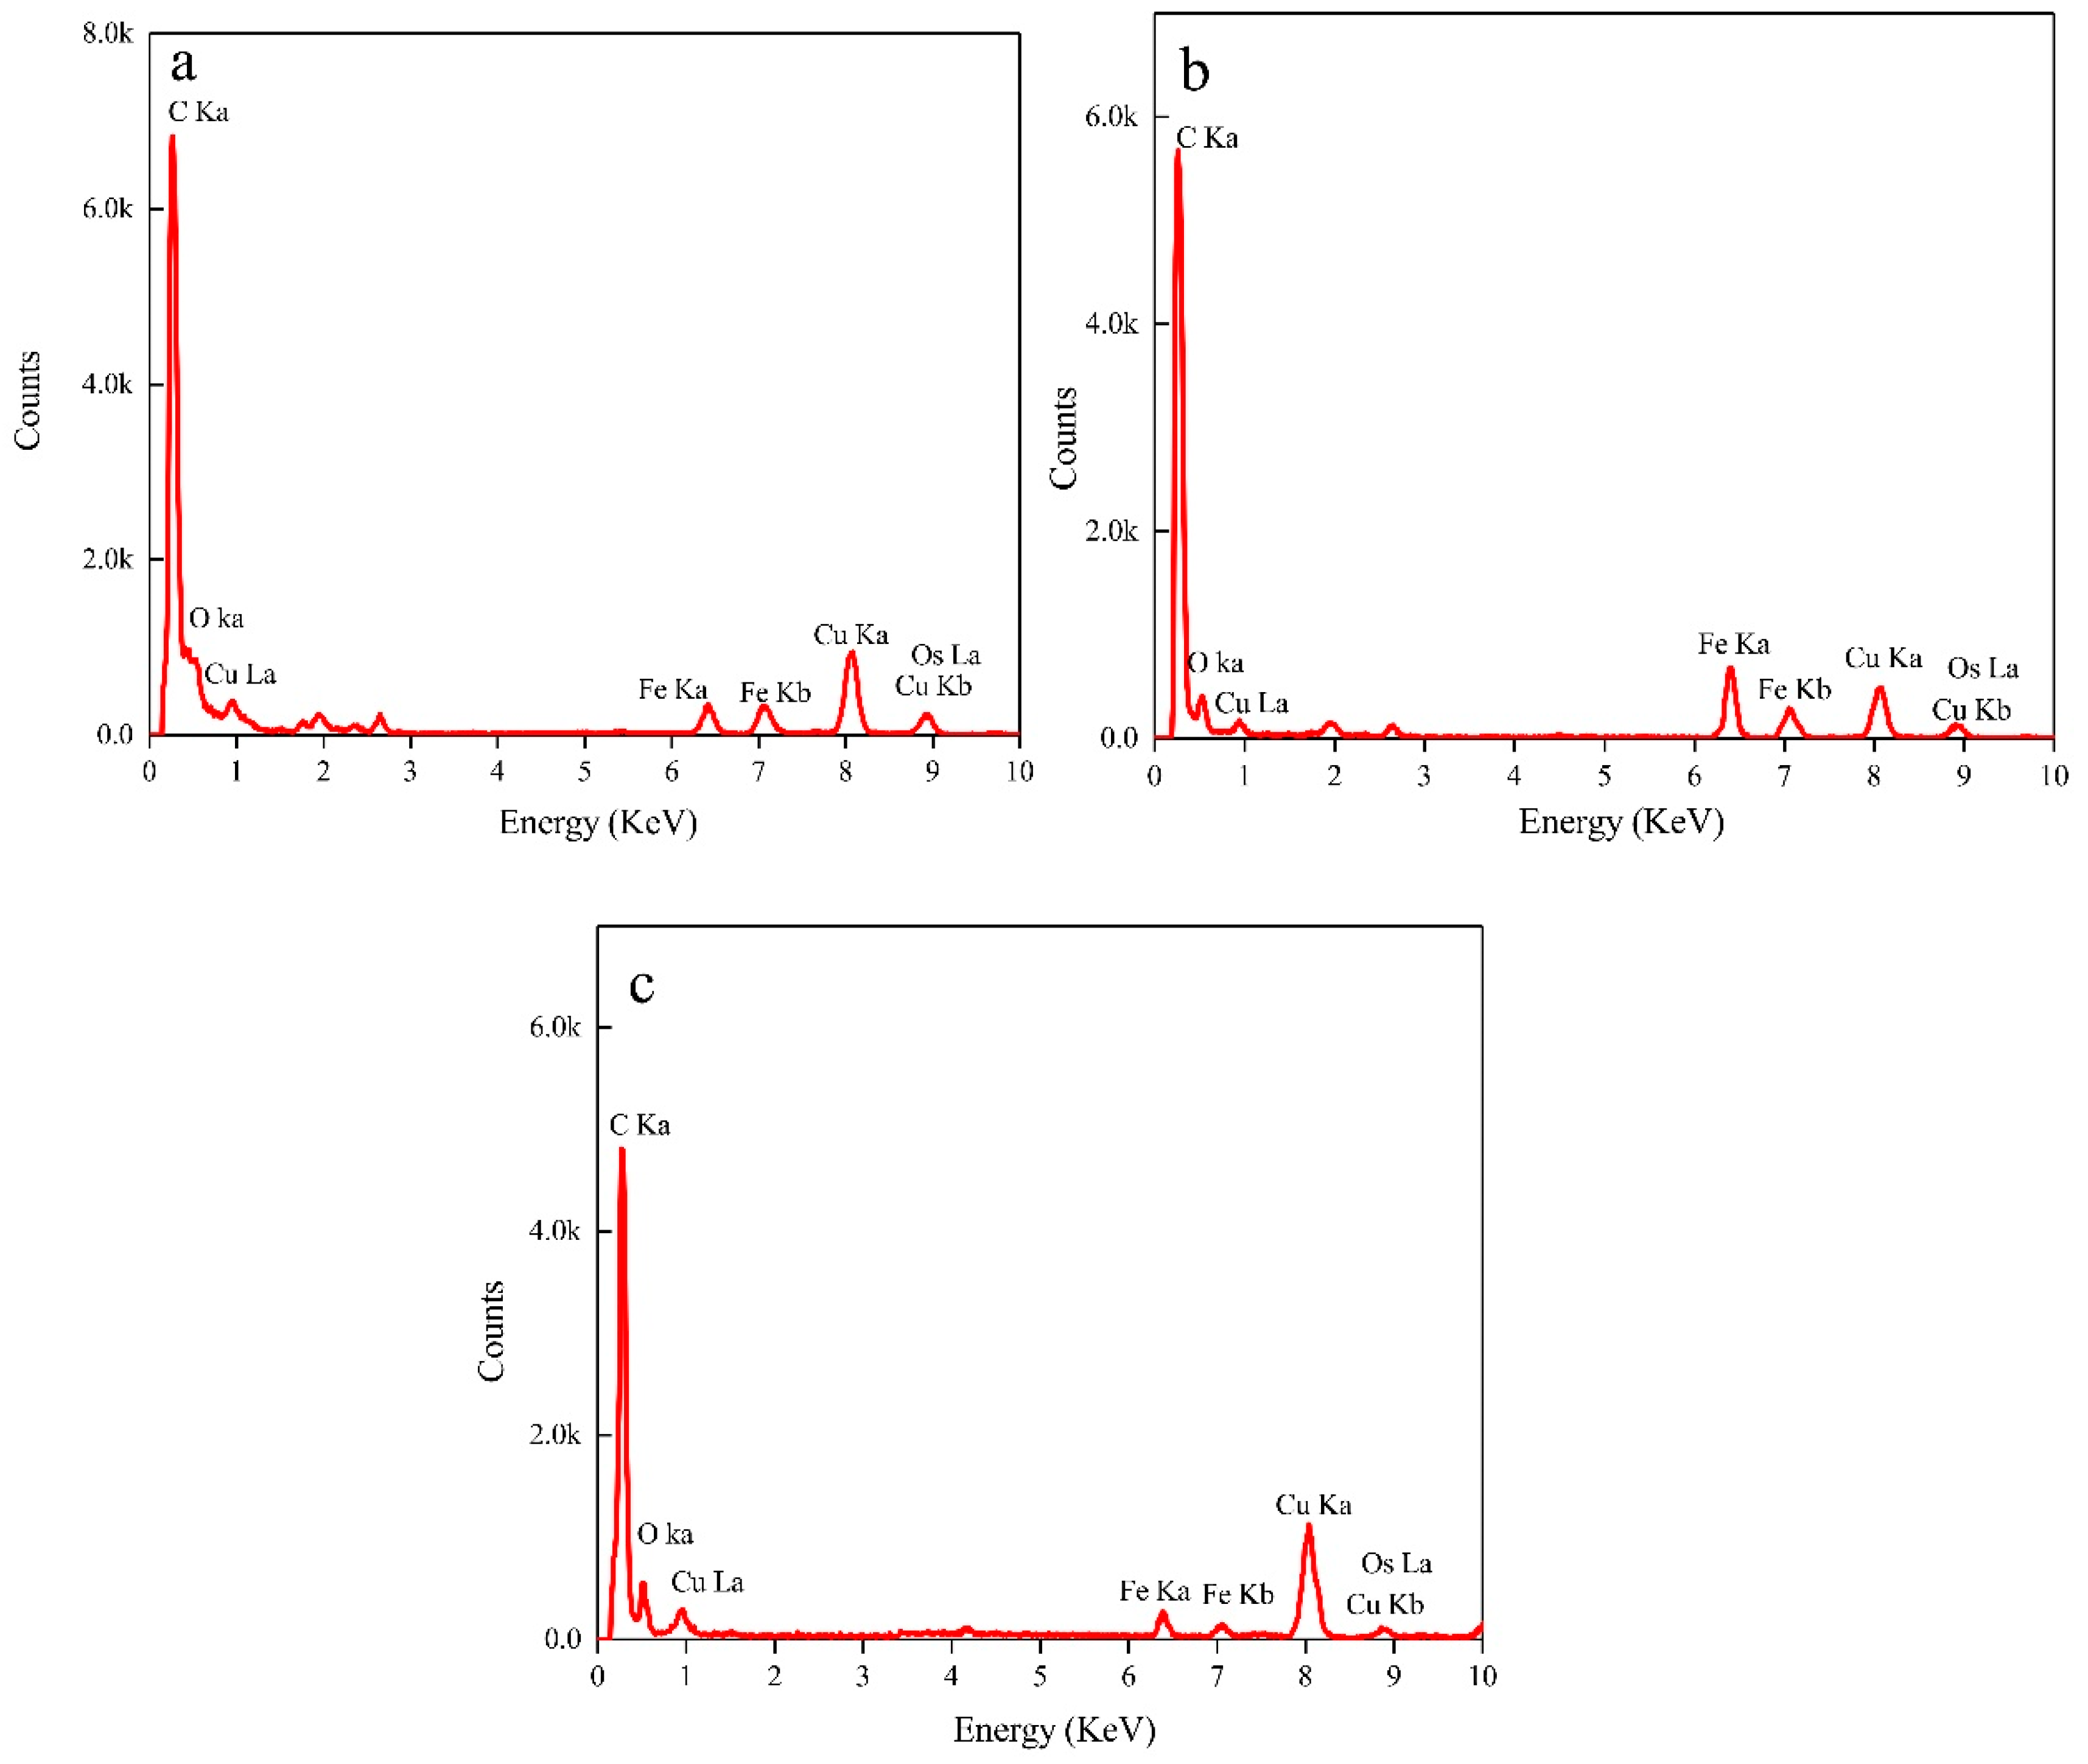
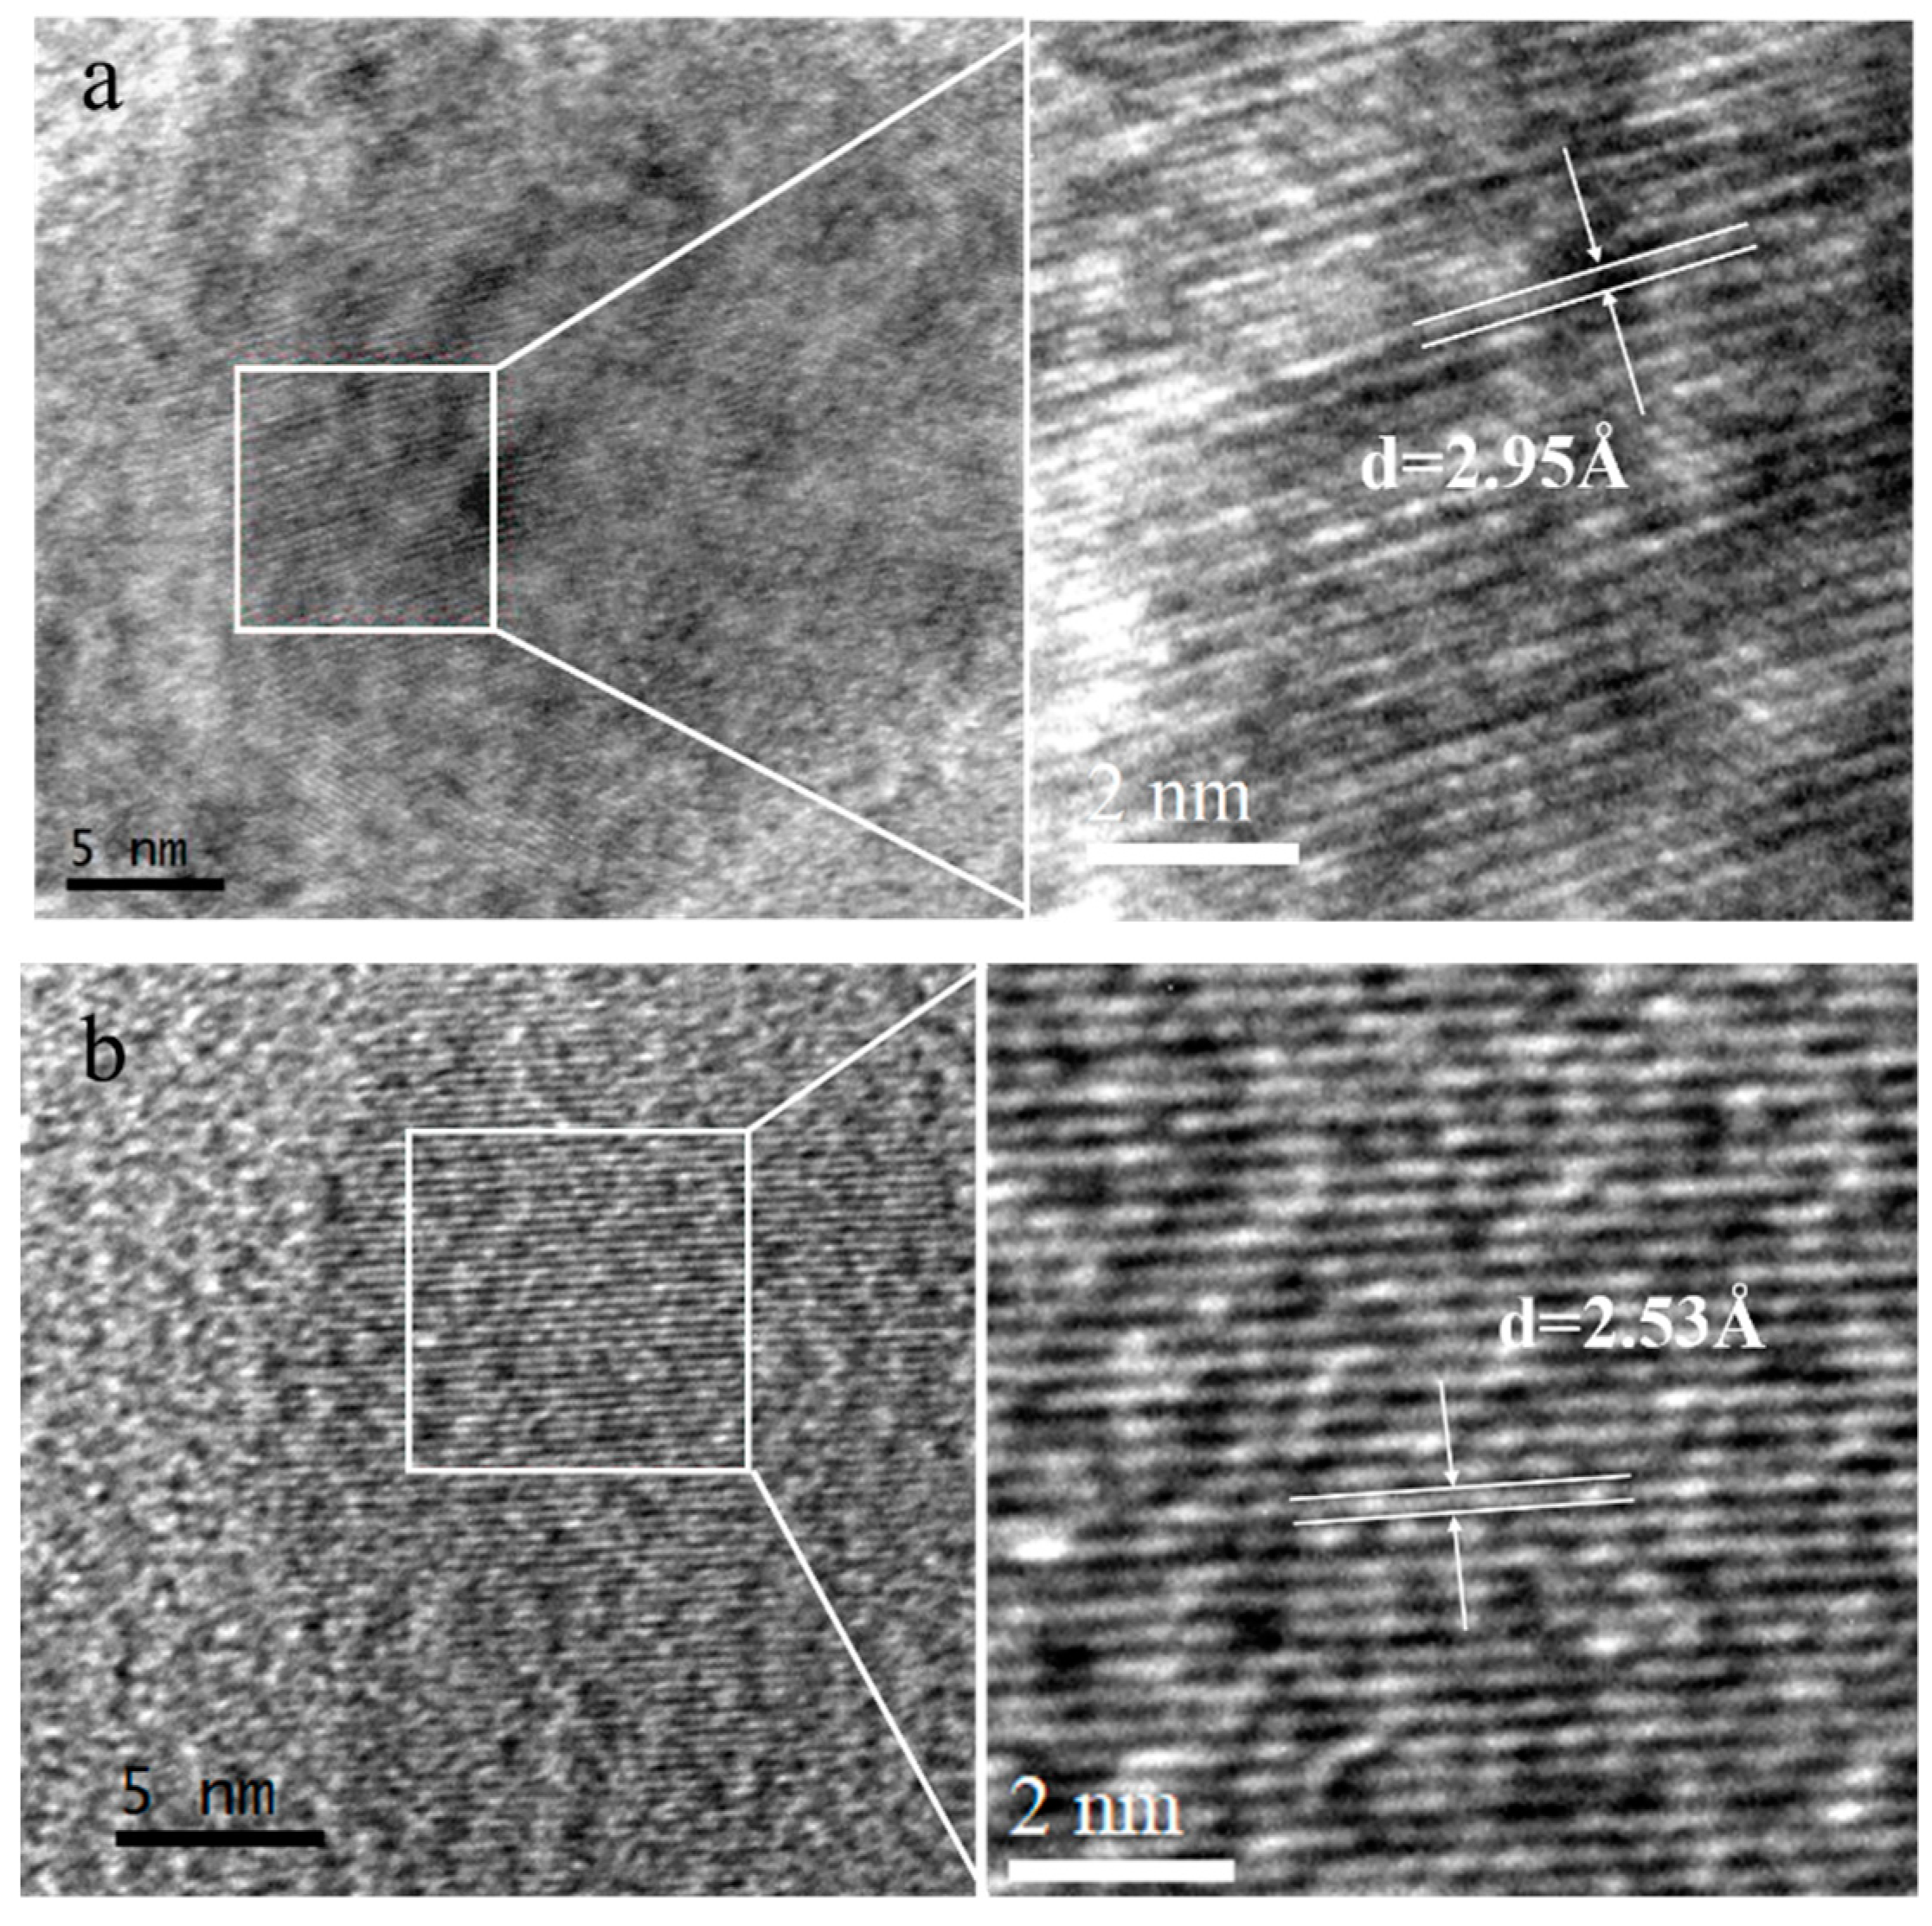
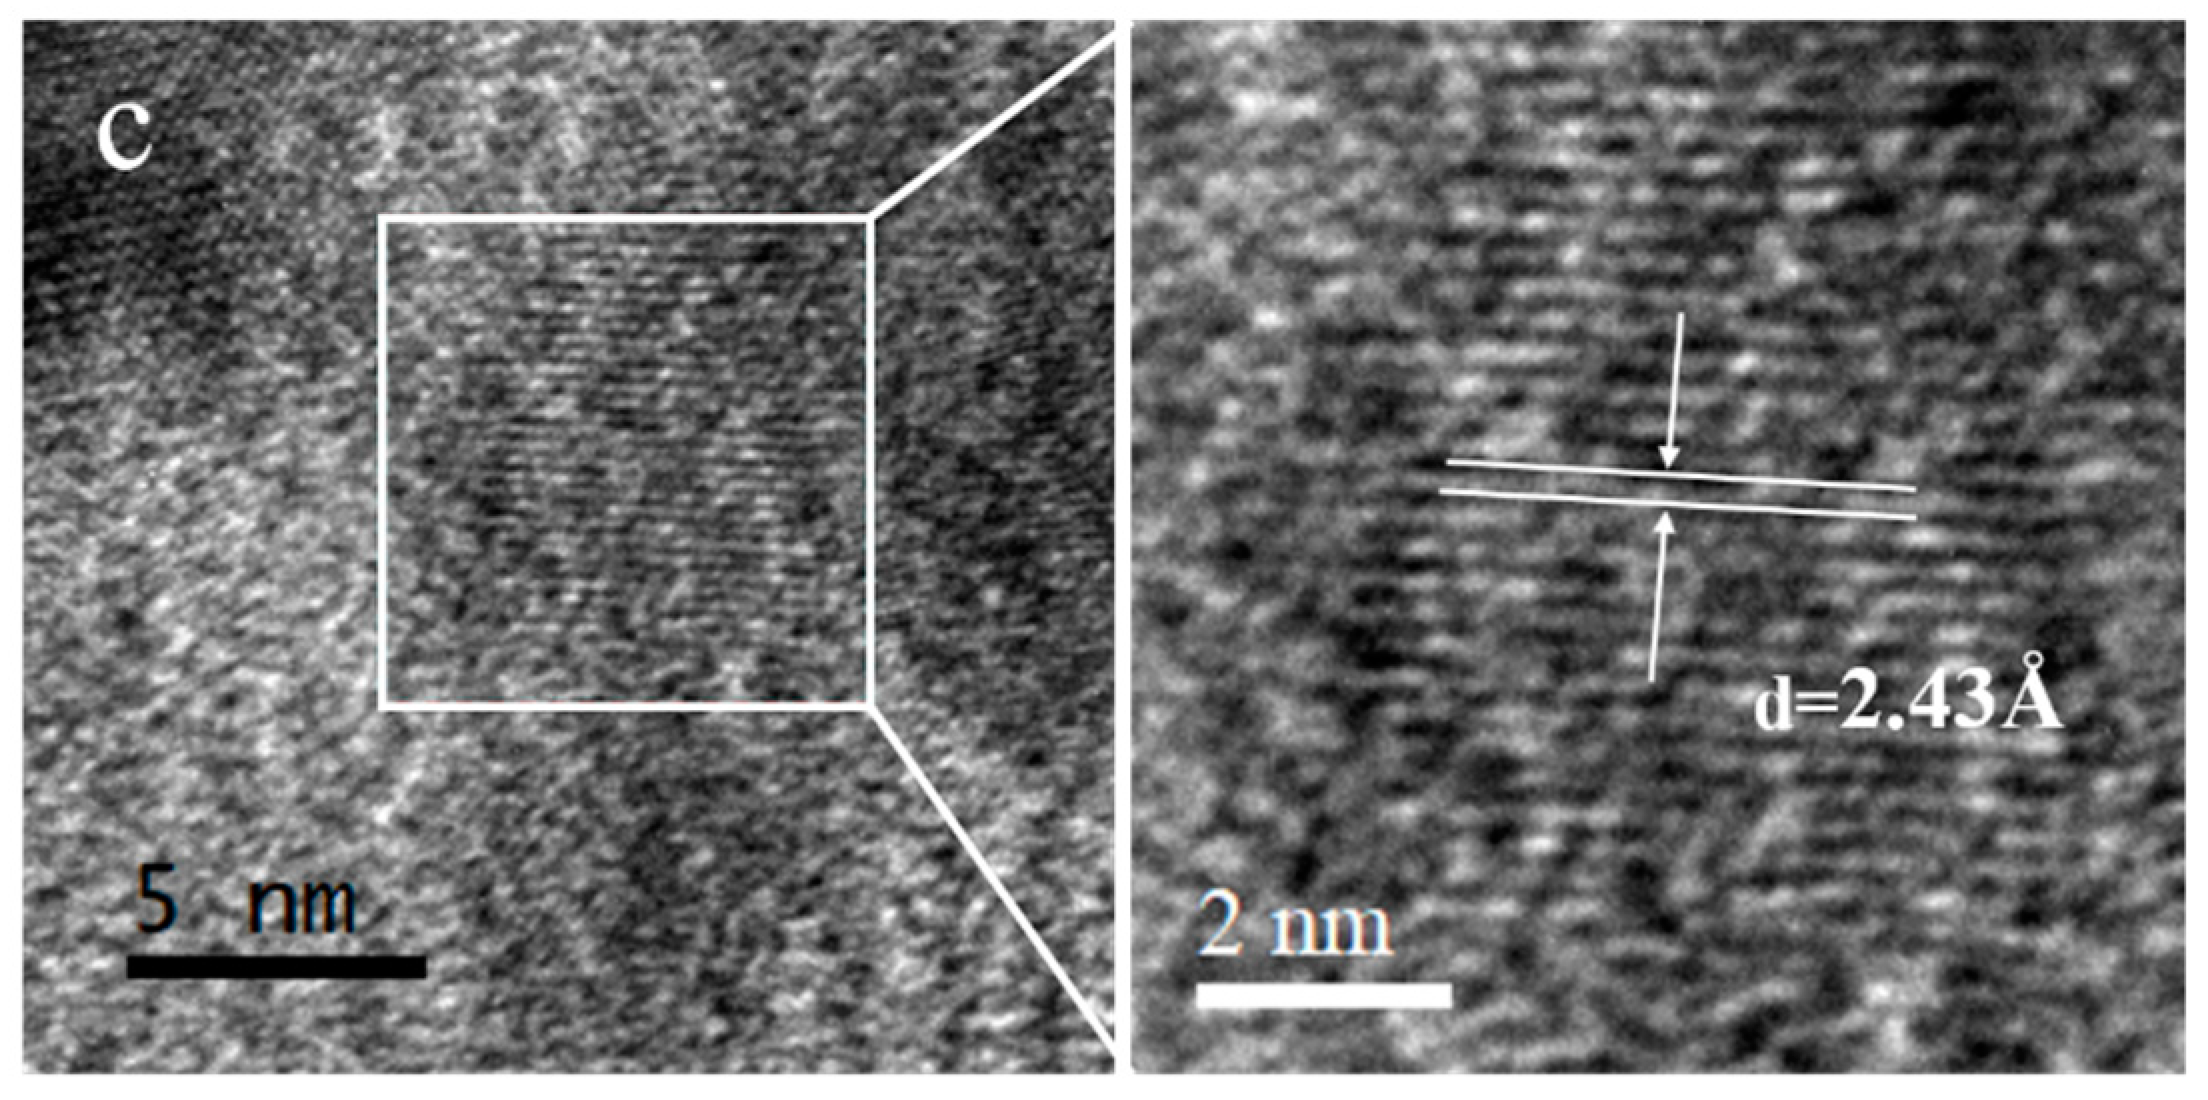
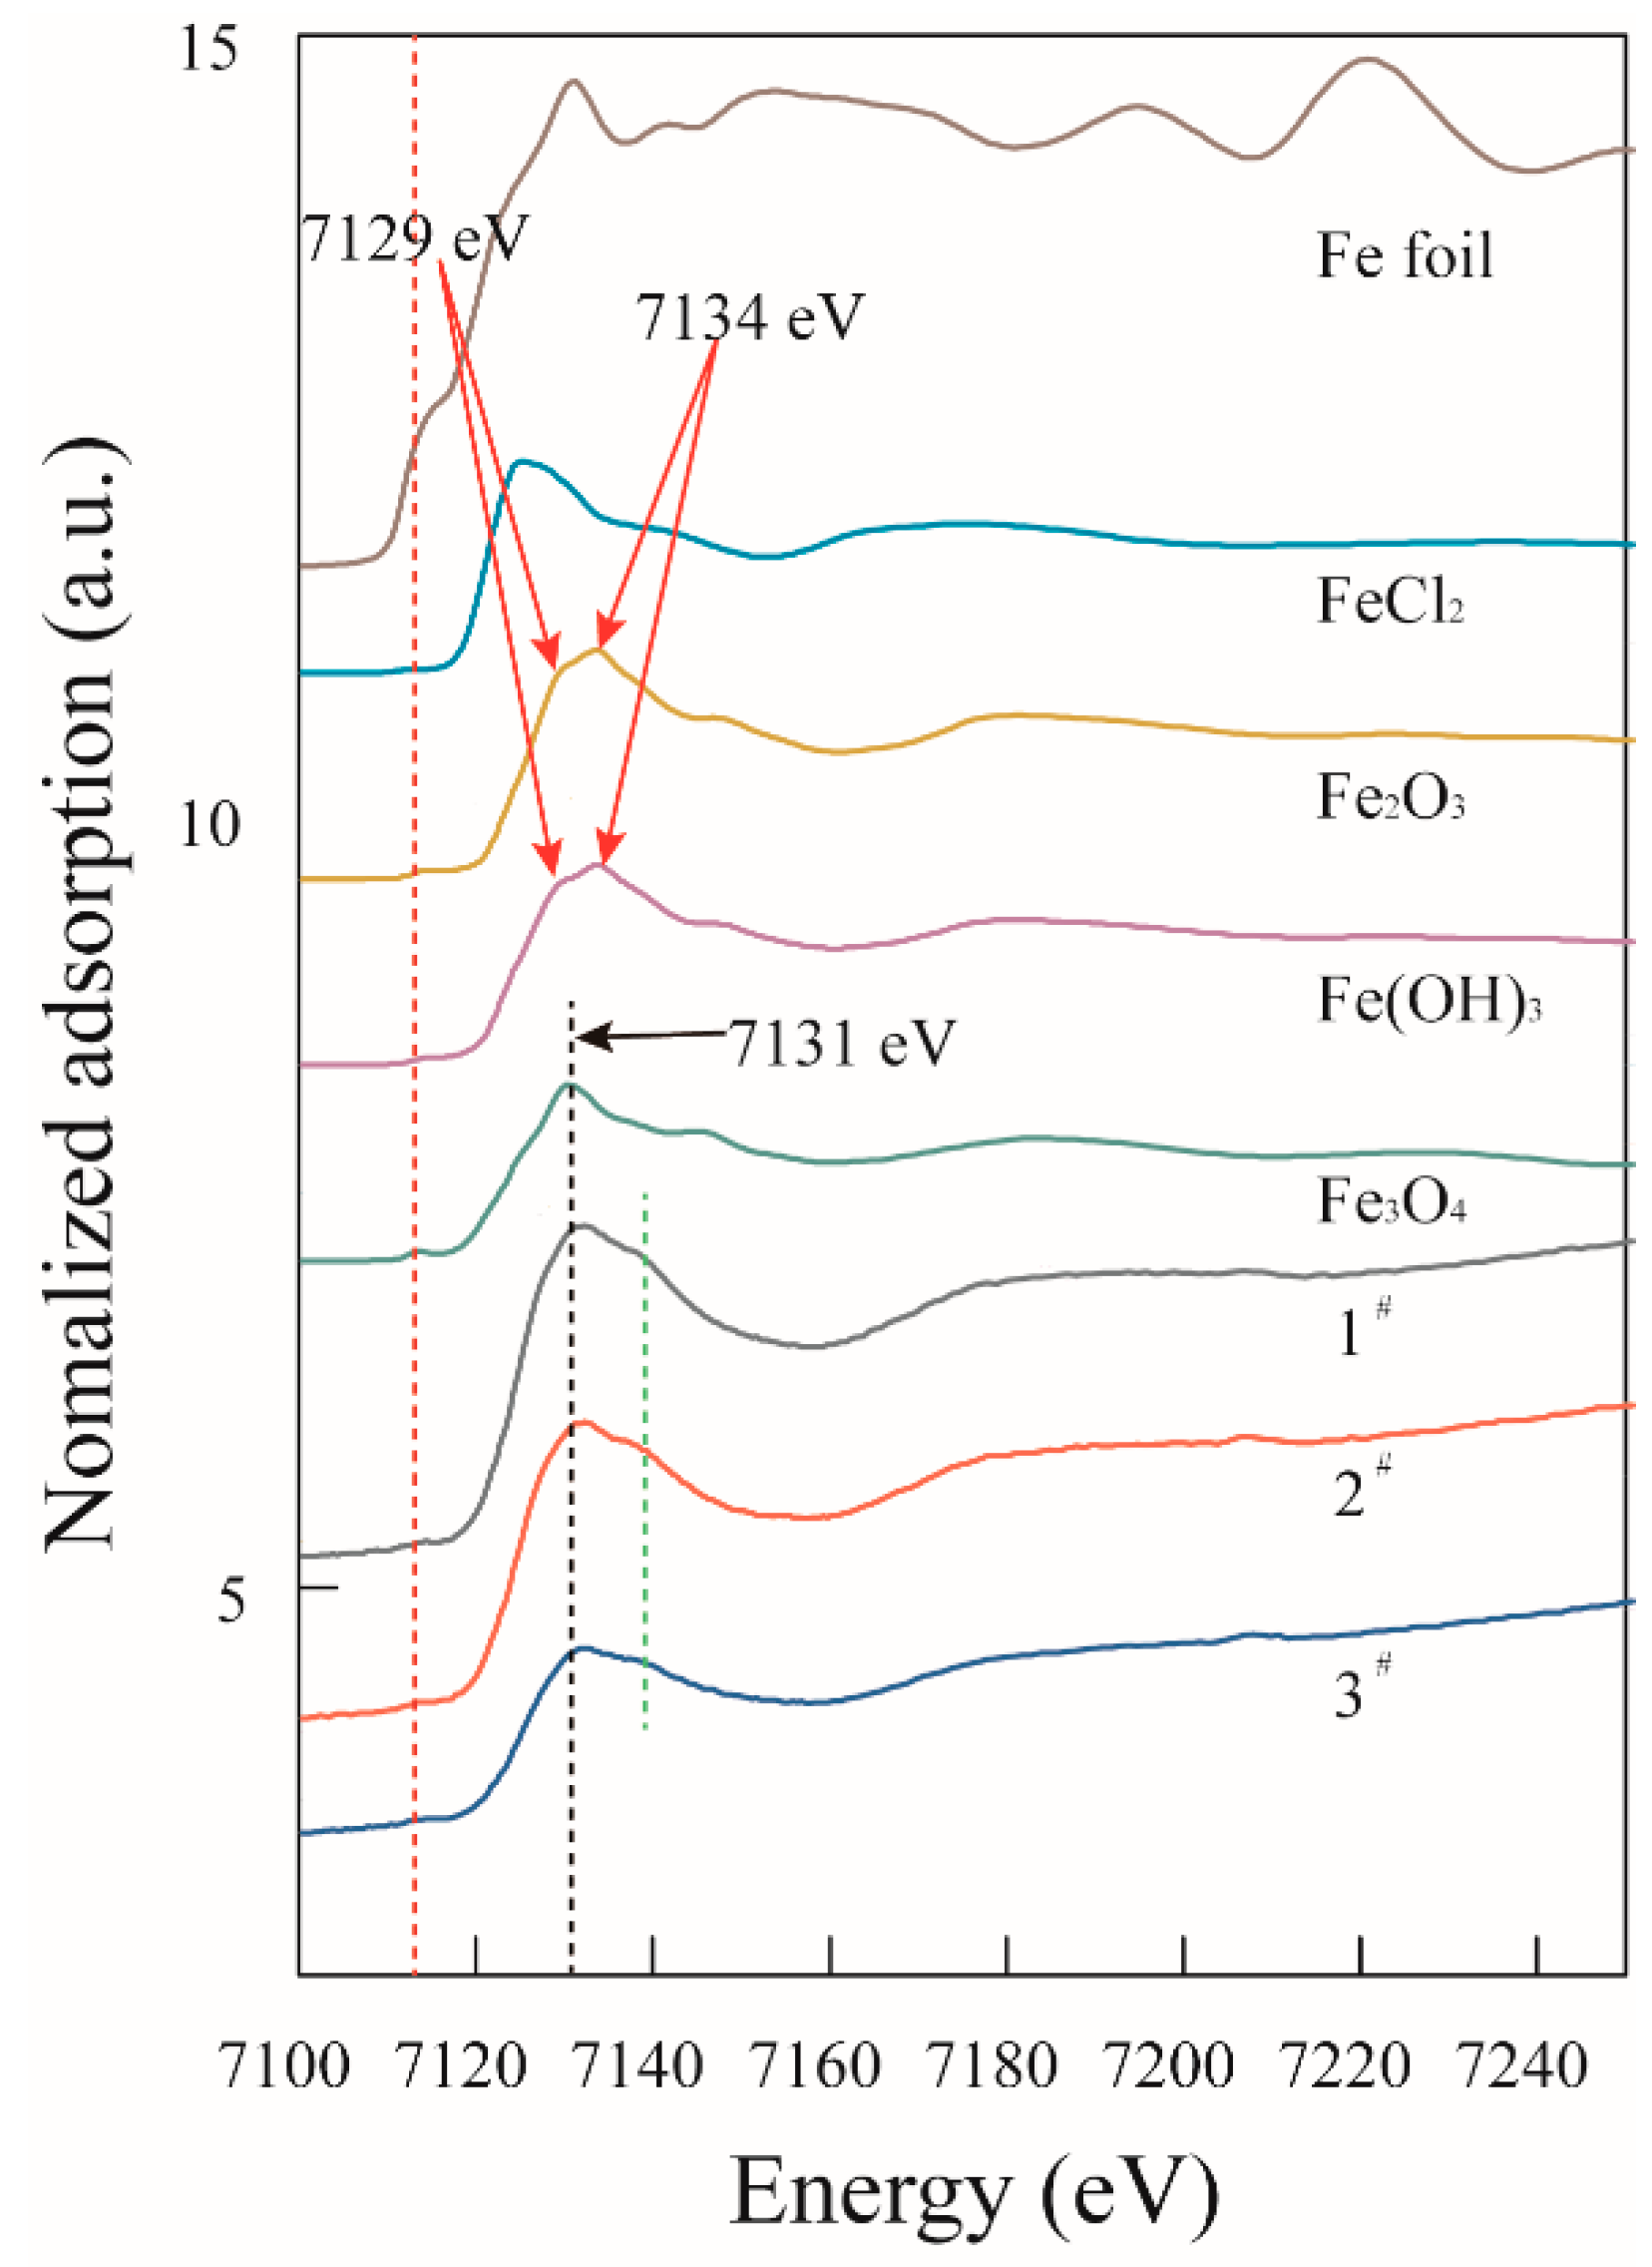
Figure 4a–d shows representative TEM images of bacteria in all four media. The average size of bacteria in the 1# medium was 0.80 ± 0.21 μm × 0.36 ± 0.05 μm (n = 72) (Table 2). With the addition of 0.8 g and 1.6 g elemental sulphur to the ferrous-containing medium, the average size of bacteria was 0.82 ± 0.32 μm × 0.32 ± 0.04 μm (n = 64) and 0.84 ± 0.31 μm × 0.34 ± 0.05 μm (n = 69), respectively. When only elemental sulphur was added to the medium, the size of bacteria was 1.03 ± 0.40 μm × 0.35 ± 0.05 μm (n = 75). These results indicate that bacteria were a little longer when using elemental sulphur as the sole energy source. However, there was no significant difference in size observed. Bacterial cell morphology may vary according to energy source, and the morphology observed here was club-shaped under ferrous iron and rod-shaped under elemental sulphur [53].

3.3. Nanoparticles

TEM images are shown in Figure 4, and the arrangements of nanoparticles (white arrow) can be observed. The bacteria cannot synthesize nanoparticles without a ferrous energy source in the medium, as shown in Figure 4d. Ferrous material is an essential energy source for the synthesis of nanoparticles in A. ferrooxidans [36] and can stimulate the expression of magnetosome synthetic genes [33]. In the other three conditions, the nanoparticles were not arranged in a chain as in the case of MTB [11,12]. Rather, the nanoparticles cultured in the 1# medium were distributed against the cell wall. Additionally, the nanoparticles cultured in the 2# and 3# media were respectively dispersed and aggregated. The δ ratio is an indicator of the arrangement of magnetosomes in bacteria [54]. Yan et al. [42] used low-temperature magnetic experiments and found that A. ferrooxidans had a low δ ratio, which indicates no intact chains in the cell. However, for the majority of MTB, magnetosomes are arranged in one, two, or multiple chains, which are usually fixed to the cell and parallel to each other along the length of the chain to minimize magnetostatic energy [55]. We performed TEM analysis of images for three conditions. The diameters of nanoparticles cultured in the 2# and 3# media were 38.1 ± 9.3 nm and 36.1 ± 12.6 nm, respectively, while the diameter of nanoparticles cultured in the 1# medium was 41.5 ± 14. nm. The mean size of nanoparticles cultured in the 1# medium was slightly larger than that in the 2# and 3# media. However, the difference was not significant, and the range of these sizes fell within one standard deviation. Figure 5 presents the histograms of the diameter of nanoparticles for three cases. In these radius distribution patterns, the majority of nanoparticles cultured in the 1# medium were in the size range of 40–50 nm, whereas the majority of nanoparticles cultured in the 2# and 3# media were around 30–40 nm. Faivre et al. [56] showed that the sizes and morphologies of mature magnetosomes synthesized by MTB were affected by the rates of Fe uptake. The lower the rates of Fe uptake, the smaller the nanoparticles synthesized by bacteria were. This showed that Fe uptake rate played a key role in magnetosome formation. In our study, the oxidation of ferrous iron was delayed when elemental sulphur was added to the medium; however, there was no significant effect on the size of nanoparticles.
EDX and HRTEM analyses were performed on nanoparticles. Fe and O peaks were present in all three samples, as shown in Figure 6a–c. EDX analysis indicated that nanoparticles were composed of iron and oxygen. Meanwhile, the carbon-coated copper grids explained the carbon and copper peaks, and osmium oxide explained the oxygen and osmium peaks. However, Fang et al. [41] found that nanoparticles synthesized by Ferroplasma thermophilum contained iron, oxygen, and cobalt. Meanwhile, as shown in Figure 7, the lattice spacing of nanoparticles cultured in the media 1#, 2#, and 3# was 2.95 Å, 2.53 Å, and 2.43 Å, respectively. The fringes with spacing clearly corresponded to magnetite, which has been previously demonstrated in A. ferrooxidans [35,42].
To determine Fe species of nanoparticles, Fe K-edge XANES analyses were carried out. As shown in Figure 8, the spectra of standard Fe-containing compounds showed differences in the peaks’ positions. When we examined the XANES spectra of 1#, 2#, and 3#, we observed a shoulder feature at 7139 eV (green dotted line, Figure 8), which was consistent with Baumgartner’s finding [57]. This shoulder was also observed in the XANES spectrum of poorly ordered ferric phosphates [58]. It has been reported that magnetite formation in magnetotactic bacteria proceeds from disordered ferric phosphate [57]. In our study, the medium contained K2HPO4, hence we speculated the nanoparticle formation in A. ferrooxidans may have proceeded from a ferric phosphate. We also observed a shoulder feature at 7114 eV (red dotted line, Figure 8) and strong peaks at 7131 eV (black arrow, Figure 8). The spectra of Fe2O3 and Fe(OH)3 had two peaks at 7129 and 7134 eV (red arrow, Figure 8). The spectra of Fe3O4 had one peak at 7131 eV (black arrow, Figure 8). Moreover, the spectra of nanoparticles cultured in the media 1#, 2#, and 3# had strong peaks at 7131 eV and had no peak at 7134 eV. Therefore, the spectra of 1# to 3# were more similar to Fe3O4 than Fe(OH)3 and Fe2O3. Overall, by combining the results of EDX, HRTEM, and XANES, it could be inferred that the composition of the nanoparticles was magnetite.

4. Conclusions

We investigated changes in A. ferrooxidans growth and nanoparticle production during culture with different concentration ratios of ferrous iron and elemental sulphur. The following results were produced:
  • In the ferrous-containing medium, more elemental sulphur in the medium resulted in an increased delay in microbial growth and ferrous iron oxidation.
  • Different ratios of ferrous and sulphur had no significant effect on the morphology of bacteria or the size of nanoparticles synthesized by A. ferroxidans.
  • EDX, HRTEM, and XANES results showed that the nanoparticles were composed of magnetite.
These findings help to gain a better understanding into the formation of nanoparticles under different energy sources and further enrich the theory of nanoparticle synthesis by extremely environmental microbes.

Author Contributions

G.Q. and J.W. conceived and designed the experiments; L.W., B.W. and W.H. performed the experiments; L.W. and X.W. analysed the data; L.W. wrote the paper; J.W., M.G. and B.Y. improved the paper.

Funding

This work was supported by the Natural Science Foundation of Hunan Province, China (No. 2018JJ1041), the National Natural Science Foundation of China (No. 51774332), the Open Funds of BSRF (No. 2016-BEPC-PT-000855). The authors thank Beamline 1W1B (Beijing Synchrotron Radiation Facility) for providing the beam time and help during experiments.

Conflicts of Interest

The authors declare no conflict of interest.

References

  1. Duan, X.P.; Li, Y.P. Physicochemical Characteristics of Nanoparticles Affect Circulation, Biodistribution, Cellular Internalization, and Trafficking. Small 2013, 9, 1521–1532. [Google Scholar] [CrossRef] [PubMed]
  2. Narayanan, K.B.; Sakthivel, N. Biological synthesis of metal nanoparticles by microbes. Adv. Colloid Interface Sci. 2010, 156, 1–13. [Google Scholar] [CrossRef] [PubMed]
  3. Verma, P.; Maheshwari, S.K. Applications of Silver nanoparticles in diverse sectors. Int. J. Nano Dimens. 2019, 10, 18–36. [Google Scholar]
  4. De Matteis, V.; Cascione, M.; Toma, C.; Leporatti, S. Silver nanoparticles: Synthetic routes, in vitro toxicity and theranostic applications for cancer disease. Nanomaterials 2018, 8, 319. [Google Scholar] [CrossRef] [PubMed]
  5. Tartaj, P.; del Puerto Morales, M.; Veintemillas-Verdaguer, S.; González-Carreño, T.; Serna, C.J. The preparation of magnetic nanoparticles for applications in biomedicine. J. Phys. D Appl. Phys. 2003, 36, R182. [Google Scholar] [CrossRef]
  6. Blakemore, R. Magnetotactic bacteria. Science 1975, 190, 377–379. [Google Scholar] [CrossRef] [PubMed]
  7. Liu, J.W.; Zheng, Y.; Hong, Z.L.; Cai, K.; Zhao, F.; Han, H.Y. Microbial synthesis of highly dispersed PdAu alloy for enhanced electrocatalysis. Sci. Adv. 2016, 2, 8. [Google Scholar] [CrossRef] [PubMed]
  8. Zhao, S.L.; Li, Y.C.; Yin, H.J.; Liu, Z.Z.; Luan, E.X.; Zhao, F.; Tang, Z.Y.; Liu, S.Q. Three-dimensional graphene/Pt nanoparticle composites as freestanding anode for enhancing performance of microbial fuel cells. Sci. Adv. 2015, 1, 8. [Google Scholar] [CrossRef] [PubMed]
  9. Lefèvre, C.T.; Trubitsyn, D.; Abreu, F.; Kolinko, S.; Jogler, C.; de Almeida, L.G.P.; de Vasconcelos, A.T.R.; Kube, M.; Reinhardt, R.; Lins, U. Comparative genomic analysis of magnetotactic bacteria from the D eltaproteobacteria provides new insights into magnetite and greigite magnetosome genes required for magnetotaxis. Environ. Microbiol. 2013, 15, 2712–2735. [Google Scholar]
  10. Kolinko, S.; Richter, M.; Glöckner, F.O.; Brachmann, A.; Schüler, D. Single-cell genomics of uncultivated deep-branching magnetotactic bacteria reveals a conserved set of magnetosome genes. Environ. Microbiol. 2016, 18, 21–37. [Google Scholar] [CrossRef]
  11. Uebe, R.; Schüler, D. Magnetosome biogenesis in magnetotactic bacteria. Nat. Rev. Microbiol. 2016, 14, 621. [Google Scholar] [CrossRef] [PubMed]
  12. Jacob, J.J.; Suthindhiran, K. Magnetotactic bacteria and magnetosomes–Scope and challenges. Mater. Sci. Eng. C 2016, 68, 919–928. [Google Scholar] [CrossRef]
  13. Faivre, D.; Schuler, D. Magnetotactic bacteria and magnetosomes. Chem. Rev. 2008, 108, 4875–4898. [Google Scholar] [CrossRef] [PubMed]
  14. Keim, C.N.; Lins, U.; Farina, M. Manganese in biogenic magnetite crystals from magnetotactic bacteria. FEMS Microbiol. Lett. 2009, 292, 250–253. [Google Scholar] [CrossRef] [PubMed] [Green Version]
  15. Mathuriya, A.S. Magnetotactic bacteria: Nanodrivers of the future. Crit. Rev. Biotechnol. 2016, 36, 788–802. [Google Scholar] [CrossRef] [PubMed]
  16. Yoza, B.; Matsumoto, M.; Matsunaga, T. DNA extraction using modified bacterial magnetic particles in the presence of amino silane compound. J. Biotechnol. 2002, 94, 217–224. [Google Scholar] [CrossRef]
  17. Herborn, C.; Papanikolaou, N.; Reszka, R.; Grünberg, K.; Schüler, D.; Debatin, J. Magnetosomes as biological model for iron binding: Relaxivity determination with MRI. RoFo Fortschr. Geb. Rontgenstrahlen Nukl. 2003, 175, 830–834. [Google Scholar]
  18. Schuler, D.; Frankel, R.B. Bacterial magnetosomes: Microbiology, biomineralization and biotechnological applications. Appl. Microbiol. Biotechnol. 1999, 52, 464–473. [Google Scholar] [CrossRef] [PubMed]
  19. Yang, W.T.; Guo, W.S.; Le, W.J.; Lv, G.X.; Zhang, F.H.; Shi, L.; Wang, X.L.; Wang, J.; Wang, S.; Chang, J.; et al. Albumin-Bioinspired Gd:CuS Nanotheranostic Agent for In Vivo Photoacoustic/Magnetic Resonance Imaging-Guided Tumor-Targeted Photothermal Therapy. Acs Nano 2016, 10, 10245–10257. [Google Scholar] [CrossRef]
  20. Bazylinski, D.A.; Frankel, R.B. Magnetosome formation in prokaryotes. Nat. Rev. Microbiol. 2004, 2, 217. [Google Scholar] [CrossRef]
  21. Bazylinski, D.A.; Lefevre, C.T. Magnetotactic Bacteria from Extreme Environments. Life-Basel 2013, 3, 295–307. [Google Scholar] [CrossRef] [Green Version]
  22. Yan, L.; Da, H.Y.; Zhang, S.; Lopez, V.M.; Wang, W.D. Bacterial magnetosome and its potential application. Microbiol. Res. 2017, 203, 19–28. [Google Scholar] [CrossRef] [PubMed]
  23. Araujo, A.C.V.; Abreu, F.; Silva, K.T.; Bazylinski, D.A.; Lins, U. Magnetotactic Bacteria as Potential Sources of Bioproducts. Mar. Drugs 2015, 13, 389–430. [Google Scholar] [CrossRef] [PubMed] [Green Version]
  24. Brierley, C.L.; Brierley, J.A. Progress in bioleaching: Part B: Applications of microbial processes by the minerals industries. Appl. Microbiol. Biotechnol. 2013, 97, 7543–7552. [Google Scholar] [CrossRef] [PubMed]
  25. Zhao, H.; Wang, J.; Hu, M.; Qin, W.; Zhang, Y.; Qiu, G. Synergistic bioleaching of chalcopyrite and bornite in the presence of Acidithiobacillus ferrooxidans. Bioresour. Technol. 2013, 149, 71–76. [Google Scholar] [CrossRef]
  26. Olson, G.J.; Brierley, J.A.; Brierley, C.L. Bioleaching review part B: Progress in bioleaching: Applications of microbial processes by the minerals industries. Appl. Microbiol. Biotechnol. 2003, 63, 249–257. [Google Scholar] [CrossRef] [PubMed]
  27. Jafari, M.; Shafaei, S.Z.A.; Abdollahi, H.; Gharabaghi, M.; Chelgani, S.C. A Comparative Study on the Effect of Flotation Reagents on Growth and Iron Oxidation Activities of Leptospirillum ferrooxidans and Acidithiobacillus ferrooxidans. Minerals 2017, 7, 2. [Google Scholar] [CrossRef]
  28. Zhang, Y.S.; Qin, W.Q.; Wang, J.; Zhen, S.J.; Yang, C.R.; Zhang, J.W.; Nai, S.S.; Qiu, G.Z. Bioleaching of chalcopyrite by pure and mixed culture. Trans. Nonferrous Met. Soc. China 2008, 18, 1491–1496. [Google Scholar] [CrossRef]
  29. Wei, D.P.; Liu, T.; Zhang, Y.M.; Cai, Z.L.; He, J.T.; Xu, C.B. Vanadium Bioleaching Behavior by Acidithiobacillus ferrooxidans from a Vanadium-Bearing Shale. Minerals 2018, 8, 24. [Google Scholar] [CrossRef]
  30. Li, Q.; Wang, Q.F.; Zhu, J.Y.; Zhou, S.; Gan, M.; Jiang, H.; Sand, W. Effect of Extracellular Polymeric Substances on Surface Properties and Attachment Behavior of Acidithiobacillus ferrooxidans. Minerals 2016, 6, 100. [Google Scholar] [CrossRef]
  31. Wang, J.; Zhao, H.B.; Qin, W.Q.; Qiu, G.Z. Bioleaching of complex polymetallic sulfide ores by mixed culture. J. Cent. South Univ. 2014, 21, 2633–2637. [Google Scholar] [CrossRef]
  32. Zhao, H.; Huang, X.; Wang, J.; Li, Y.; Liao, R.; Wang, X.; Qiu, X.; Xiong, Y.; Qin, W.; Qiu, G. Comparison of bioleaching and dissolution process of p-type and n-type chalcopyrite. Miner. Eng. 2017, 109, 153–161. [Google Scholar] [CrossRef]
  33. Liu, W.B.; Wu, H.Y.; Liu, X.D.; Liu, X.X. Influence of different Fe sources and concentrations on formation of magnetosomes in Acidithiobacillus ferrooxidans. Trans. Nonferrous Met. Soc. China 2008, 18, 1379–1385. [Google Scholar] [CrossRef]
  34. Yan, L.; Zhang, S.; Liu, H.; Wang, W.; Chen, P.; Li, H. Optimization of magnetosome production by Acidithiobacillus ferrooxidans using desirability function approach. Mater. Sci. Eng. C 2016, 59, 731–739. [Google Scholar] [CrossRef] [PubMed]
  35. Yan, L.; Yue, X.X.; Zhang, S.; Chen, P.; Xu, Z.L.; Li, Y.; Li, H.Y. Biocompatibility evaluation of magnetosomes formed by Acidithiobacillus ferrooxidans. Mat. Sci. Eng. C-Mater. 2012, 32, 1802–1807. [Google Scholar] [CrossRef]
  36. Zhang, S.; Yan, L.; Li, H.; Liu, H. Optimal conditions for growth and magnetosome formation of Acidithiobacillus ferrooxidans. Afr. J. Microbiol. Res. 2012, 6, 6142–6151. [Google Scholar] [CrossRef]
  37. Wang, L.; Li, H.X.; Guo, Y.C.; Li, A. Explore the effects of magnetic field intensity change on Acidithiobacillus ferrooxidans growth and magnetism. In New Materials And Advanced Materials, Pts 1 And 2; Jiang, Z.Y., Han, J.T., Liu, X.H., Eds.; Trans Tech Publications Ltd.: Stafa-Zurich, Switzerland, 2011; Volume 152, pp. 1783–1787. [Google Scholar]
  38. Li, L.L.; Lv, Z.S.; Zuo, Z.Y.; Yang, Z.H.; Yuan, X.L. Effect of energy source and leaching method on bio-leaching of rock phosphates by Acidithiobacillus ferrooxidans. Hydrometallurgy 2016, 164, 238–247. [Google Scholar] [CrossRef]
  39. Chen, P.; Yan, L.; Leng, F.F.; Nan, W.B.; Yue, X.X.; Zheng, Y.N.; Feng, N.; Li, H.Y. Bioleaching of realgar by Acidithiobacillus ferrooxidans using ferrous iron and elemental sulfur as the sole and mixed energy sources. Bioresour. Technol. 2011, 102, 3260–3267. [Google Scholar] [CrossRef]
  40. Govender, E.; Bryan, C.G.; Harrison, S.T. Effect of physico-chemical and operating conditions on the growth and activity of Acidithiobacillus ferrooxidans in a simulated heap bioleaching environment. Miner. Eng. 2015, 75, 14–25. [Google Scholar] [CrossRef]
  41. Fang, J.-h.; Yong, L.; He, W.-l.; Qin, W.-q.; Qiu, G.-z.; Jun, W. Transformation of iron in pure culture process of extremely acidophilic microorganisms. Trans. Nonferrous Met. Soc. China 2017, 27, 1150–1155. [Google Scholar] [CrossRef]
  42. Yan, L.; Zhang, S.; Chen, P.; Wang, W.D.; Wang, Y.J.; Li, H.Y. Magnetic properties of Acidithiobacillus ferrooxidans. Mat. Sci. Eng. C-Mater. 2013, 33, 4026–4031. [Google Scholar] [CrossRef] [PubMed]
  43. Fdez-Gubieda, M.L.; Muela, A.; Alonso, J.; Garcia-Prieto, A.; Olivi, L.; Fernandez-Pacheco, R.; Barandiaran, J.M. Magnetite Biomineralization in Magnetospirillum gryphiswaldense: Time-Resolved Magnetic and Structural Studies. Acs Nano 2013, 7, 3297–3305. [Google Scholar] [CrossRef] [PubMed]
  44. Pham, A.L.-T.; Lee, C.; Doyle, F.M.; Sedlak, D.L. A Silica-Supported Iron Oxide Catalyst Capable of Activating Hydrogen Peroxide at Neutral pH Values. Environ. Sci. Technol. 2009, 43, 8930–8935. [Google Scholar] [CrossRef] [PubMed] [Green Version]
  45. Khan, M.T.; Martell, A.E. Metal ion and metal chelate catalyzed oxidation of ascorbic acid by molecular oxygen. I. Cupric and ferric ion catalyzed oxidation. J. Am. Chem. Soc. 1967, 89, 4176–4185. [Google Scholar] [CrossRef] [PubMed]
  46. Ravel, B.; Newville, M. ATHENA, ARTEMIS, HEPHAESTUS: Data analysis for X-ray absorption spectroscopy using IFEFFIT. J. Synchrot. Radiat. 2005, 12, 537–541. [Google Scholar] [CrossRef] [PubMed]
  47. Sharma, P.K.; Das, A.; Rao, K.H.; Forssberg, K.S.E. Surface characterization of Acidithiobacillus ferrooxidans cells grown under different conditions. Hydrometallurgy 2003, 71, 285–292. [Google Scholar] [CrossRef]
  48. Harneit, K.; Sand, W. Influence of growth substrate and attachment substratum on EPS and biofilm formation by Acidithiobacillus ferrooxidans. Adv. Mat. Res. 2007, 20, 385. [Google Scholar]
  49. Lizama, H.; Zielinski, P.; Kerby, L.; Abraham, C. Comparison of biooxidation with carbon dioxide assimilation during bacterial growth on ferrous ion or elemental sulfur. Biotechnol. Bioeng. 2002, 77, 111–117. [Google Scholar] [CrossRef]
  50. Nagpal, S.; Dahlstrom, D.; Oolman, T. Effect of carbon dioxide concentration on the bioleaching of a pyrite–arsenopyrite ore concentrate. Biotechnol. Bioeng. 1993, 41, 459–464. [Google Scholar] [CrossRef]
  51. Brierley, C.L.; Le Roux, N.W. Bacterial leaching. CRC Crit. Rev. Microbiol. 1978, 6, 207–262. [Google Scholar] [CrossRef]
  52. Zhang, Y.F.; Yang, Y.; Liu, J.S.; Qiu, G.Z. Isolation and characterization of Acidithiobacillus ferrooxidans strain QXS-1 capable of unusual ferrous iron and sulfur utilization. Hydrometallurgy 2013, 136, 51–57. [Google Scholar] [CrossRef]
  53. Zhang, S.; Yan, L.; Xing, W.J.; Chen, P.; Zhang, Y.; Wang, W.D. Acidithiobacillus ferrooxidans and its potential application. Extremophiles 2018, 22, 563–579. [Google Scholar] [CrossRef] [PubMed]
  54. Moskowitz, B.M.; Frankel, R.B.; Bazylinski, D.A. Rock magnetic criteria for the detection of biogenic magnetite. Earth Planet. Sci. Lett. 1993, 120, 283–300. [Google Scholar] [CrossRef] [Green Version]
  55. Lefevre, C.T.; Abreu, F.; Lins, U.; Bazylinski, D.A. A Bacterial Backbone: Magnetosomes in Magnetotactic Bacteria; Springer: Berlin/Heidelberger, Germany, 2011; pp. 75–102. [Google Scholar] [CrossRef]
  56. Faivre, D.; Menguy, N.; Pósfai, M.; Schuler, D. Environmental parameters affect the physical properties of fast-growing magnetosomes. Am. Mineral. 2008, 93, 463–469. [Google Scholar] [CrossRef]
  57. Baumgartner, J.; Morin, G.; Menguy, N.; Gonzalez, T.P.; Widdrat, M.; Cosmidis, J.; Faivre, D. Magnetotactic bacteria form magnetite from a phosphate-rich ferric hydroxide via nanometric ferric (oxyhydr) oxide intermediates. Proc. Natl. Acad. Sci. 2013, 110, 14883–14888. [Google Scholar] [CrossRef] [PubMed]
  58. Voegelin, A.; Kaegi, R.; Frommer, J.; Vantelon, D.; Hug, S.J. Effect of phosphate, silicate, and Ca on Fe (III)-precipitates formed in aerated Fe (II)-and As (III)-containing water studied by X-ray absorption spectroscopy. Geochim. Cosmochim. Acta 2010, 74, 164–186. [Google Scholar] [CrossRef]
Figure 1. The graph of cell density over time from experimental systems.
Minerals 09 00163 g001
Figure 2. A graph of ferrous iron concentrations (a) and total iron concentrations (b) over time from experimental systems supplemented with ferrous.
Minerals 09 00163 g002
Figure 3. A graph of pH (a) and oxidation-reduction potential (ORP) (b) over time from experimental systems.
Minerals 09 00163 g003
Figure 4. TEM micrographs of individual cells collected from media 1# (a), 2# (b), 3# (c), and 4# (d). White arrows refer to nanoparticles and black arrows refer to the cell wall.
Minerals 09 00163 g004
Figure 5. Histograms of the diameter of the nanoparticles synthesized by bacteria in media 1# (a), 2# (b), and 3# (c). n represents the number of nanoparticles analyzed in each medium.
Minerals 09 00163 g005
Figure 6. Energy dispersive X-ray spectroscopy (EDX) analysis of the nanoparticles synthesized by bacteria in media 1# (a), 2# (b), and 3# (c).
Minerals 09 00163 g006
Figure 7. High-resolution transmission electron microscopy (HRTEM) analysis of the nanoparticles cultured in media 1# (a), 2# (b), and 3# (c).
Minerals 09 00163 g007aMinerals 09 00163 g007b
Figure 8. X-ray absorption near edge structure (XANES) spectra of bacteria cultured in media 1#, 2#, and 3#.
Minerals 09 00163 g008
Table 1. The composition of energy source in experimental systems.
Experimental SystemsFeSO4·7H2O and Sulphur Composition Ratios
(FeSO4·7H2O: Sulphur; Unit: g)
1#4.47:0
2#4.47:0.8
3#4.47:1.6
4#0:1
Table 2. Summary of physical properties of cultured A. ferrooxidans.
Name of StrainComponentConcentration (g/100 mL) in Growth MediumSize of Bacterium (μm)Size of Nanoparticles (nm)
A. ferrooxidans1#ferrous4.47(0.80 ± 0.21) × (0.36 ± 0.05)(41.5 ± 14.2)
2#ferrous4.47(0.82 ± 0.32) × (0.32 ± 0.04)(38.1 ± 9.3)
sulphur0.8
3#ferrous4.47(0.84 ± 0.31) × (0.34 ± 0.05)(36.1 ± 12.6)
sulphur1.6
4#sulphur1(1.03 ± 0.40) × (0.35 ± 0.05)None

