Article

Clay Mineralogical Characteristics of Sediments Deposited during the Late Quaternary in the Larsen Ice Shelf B Embayment, Antarctica

1
Department of Earth System Sciences, Yonsei University, Seoul 03722, Korea
2
Korea Polar Research Institute, Incheon 21990, Korea
*
Author to whom correspondence should be addressed.
Minerals 2019, 9(3), 153; https://doi.org/10.3390/min9030153
Submission received: 21 January 2019 / Revised: 21 February 2019 / Accepted: 27 February 2019 / Published: 3 March 2019
(This article belongs to the Special Issue Clays and Micro-Organisms: From Nature to Industry)

Abstract

:
Variations in grain size, clay mineral composition, and stable isotopes (δ13C and δ15N) are closely linked to the sedimentary facies that reflect mineralogical and geochemical modification during the retreat and advance of the Larsen ice shelf. A whole round core of marine sediment (EAP13-GC17, 236 cm below the sea floor) was collected on the northwestern Larsen B embayment of the Antarctic Peninsula during a marine geological expedition (the ARA13 Cruise Expedition by the Korea Polar Research Institute, 2013). Four sedimentary facies (U1–U4) were clearly distinguishable: bioturbated sandy mud (open marine, U1), laminated sandy mud (sub–floating ice shelf, U2), sandy clay aggregates (deglacial, U3), and muddy diamictons (sub-glacial, U4), as well as interbedded silty. Clay minerals, including smectite, chlorite, illite, and kaolinite, were detected throughout the core. An increase in the clay mineral ratio of smectite/(illite + chlorite) was clearly observed in the open marine condition, which was strongly indicated by both a heavier isotopic composition of δ13C and δ15N (−24.4‰ and 4.3‰, respectively), and an abrupt increase in 10Be concentration (~30 times). An increase in the average values of the crystal packet thickness of illite (~1.5 times) in U1 also indicated sediments transported in open marine conditions. Based on the clay mineral composition in U1, the sediments are likely to have been transported from the Weddell Sea. The clay mineralogical assessments conducted in this region have significant implications for our understanding of paleodepositional environments.

1. Introduction

Mineralogical and geochemical investigations of marine sediments from the continental shelf around Antarctica provide significant clues about the stability and proximity of ice shelves, and the influx of terrigenous sediments and meltwater during deglaciation [1,2]. Since clay minerals are major components of continental shelf sediments [3], their assemblages [4,5,6], structures [7], and chemistry [8,9] are frequently used to determine the paleoceanography and paleoclimatology. Smectite clay minerals, typical of the chemical alteration of mafic igneous rocks in warm and humid climates [10], and structurally defect-rich hydrous minerals [11] are good indicators of sediments provenance from a warm and humid location; in contrast, illite and chlorite result from the physical weathering of metamorphic and sedimentary rocks under cold climate conditions [12]. Variations in clay mineral composition are therefore useful for investigating the provenance and source rock of sediments, particularly in Antarctic environments where secondary mineral alteration is minimal [9,13]. The relatively high percentage of kaolinite in the sediments of the Amundsen Sea strongly indicates the presence of pre-Oligocene sedimentary rocks in the subglacial Byrd Basin and Marie Byrd Land [14]. Based on clay mineral composition, sediment sources can be subdivided into an illite province (western Bellingshausen Sea), a chlorite province (eastern Bellingshausen Sea), and a kaolinite province (Amundsen Sea) [14]. Clay mineralogy in the seabed surface sediments also demonstrates the reconstruction of movements and drainage areas of paleo-ice streams and ice shelves in the southern Bellingshausen Sea and Weddell Sea [3,15]. The clay mineralogical heterogeneity of the diamictons indicates that the ice streams were derived from different source areas on the southern Bellingshausen Sea shelf and in the West Antarctic hinterland, during different glacial–interglacial periods [15]. Illite and smectite-rich sediments, transported from the catchment areas of the Ronne and Filcher ice shelves to the deep sea, indicate the involvement of the Weddell cold bottom water current and the Weddell Gyre during the interglacial period [3]. Analyses of the clay volume size distribution for ice cores has revealed past climatic cycles, including ocean circulation patterns and environmental conditions from the Last Glacial Maximum (LGM) to the Holocene [16]. Clay concentration slightly decreased in the interglacial period, compared to the more gradual changes seen in open marine conditions. Nonetheless, a good understanding of the clay mineralogical characteristics in the eastern coast of the Antarctic Peninsula has been accomplished, particularly in the western Weddell Sea; it is difficult to access the area to collect the continental shelf sediment samples, because it is covered by sea-ice throughout the year.
Geochemical properties, such as stable isotopic compositions of δ13C and δ15N and meteoric 10Be concentrations within marine sediments, are widely used to reveal the depositional environments and sources of organic matter in continental shelf sediments [17,18,19,20]. The isotope compositions of δ13C and δ15N can trace inputs of marine and terrestrial organic matter that respond to the physical mixing among those end-members from different sources [21]. Terrestrial organic matter is isotopically lighter (δ15N averaging around 3‰) than marine sources (averaging around 7‰). Values of δ13C ranging from −25.5‰ to −30.0‰ determine a terrestrial end-member at many coastal sites that is much lighter than those of a marine end-member [18,21,22,23,24]. Moreover, meteoric 10Be concentrations within marine sediments reflect changes in depositional environments and the extent and collapses of ice shelves [25].
In this research, we gather mineralogical and geochemical observations, including sediment facies, grain-size distribution, clay mineralogy, relative proportions of clay minerals, microscopic measurements, and stable isotopic compositions that improve our interpretation of paleoenvironmental changes in the Antarctic region. This study also provides new mineralogical and geochemical data for the worldwide database on Holocene paleoclimatic observations, which will allow for comparisons of the Holocene environmental changes of different continental shelves. For this study, a marine geological expedition (4th April to 15th May, 2013) recovered a gravity core (EAP13-GC17) in the northwestern Weddell Sea, which made possible marine geological investigation in this previously inaccessible region (Figure 1).
The Larsen ice shelf (LIS) region of the Antarctic Peninsula is one of the fastest-warming places on the earth [26]. The rate of temperature increase is more than five times the global mean (0.6 °C ± 0.2 °C during the 20th century), resulting in the rapid disintegration of ice shelves and retreat of continental glaciers [27,28]. The LIS, the third-largest ice shelf system in Antarctica, is the largest to be affected until now. In fact, LIS-A and LIS-B disintegrated catastrophically in 1995 and 2002, respectively. The breakup of these ice shelves along the eastern coast of the Antarctic Peninsula is considered one of the most dramatic environmental changes observed anywhere in a climate-sensitive glacial system [29,30]. Therefore, the LIS regions are the best place to study mineralogical evidence concerning depositional environments throughout the Holocene. The present study demonstrates a comprehensive understanding of the paleo-depositional environment through analysis of the clay minerals and geochemical properties of a sediment core from the LIS-B embayment, the largest remaining ice shelf system on the Antarctic Peninsula.

2. Materials and Methods

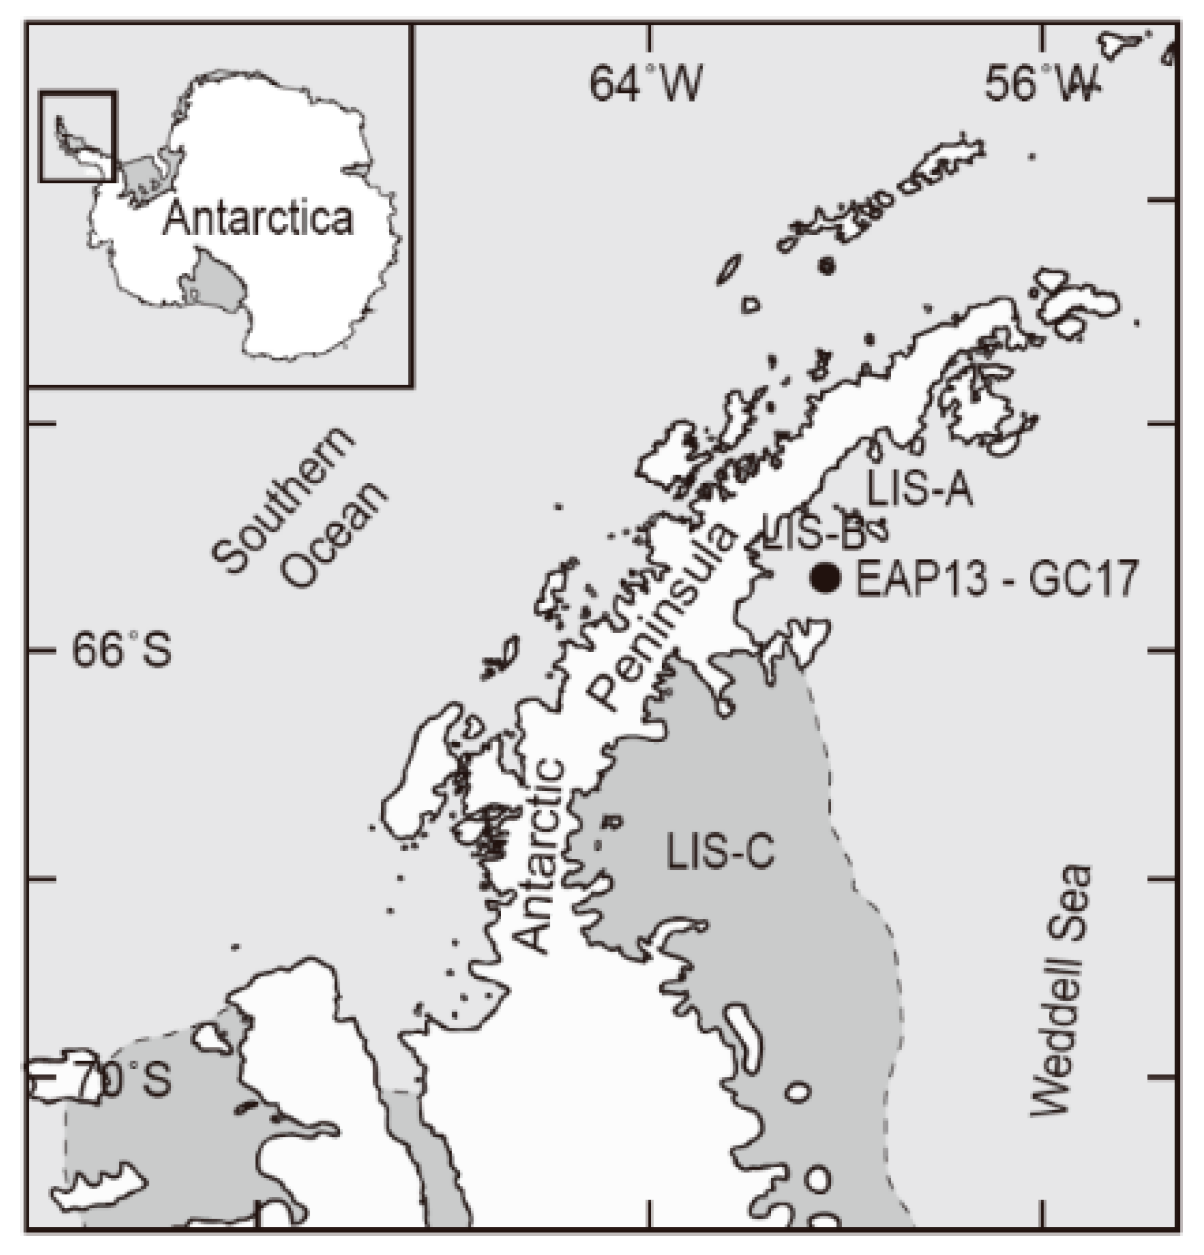
2.1. Sampling Location

A whole round core (EAP13-GC17, 236 cm below the sea floor) of marine sediments was recovered (65° 48.16’ S, 60° 39.42’ W; 526 m) in the LIS-B embayment of the Antarctic Peninsula during a marine geological expedition in 2013 (the ARA13 Cruise Expedition by the Korea Polar Research Institute (KOPRI), Figure 1). The ice sheet on the Antarctic Peninsula grounded on the nearby continental shelf edge at the LGM [31,32]. Retreat of the ice sheet began at the outer shelf at ~18.3 kyr BP [33]. Paleo-climate records suggest the Holocene Climate Optimum occurred ~11 kyr BP, but there is no evidence for disintegration of ice shelves until the Mid-Holocene warming ~4.5–3 kyr BP [34,35]. Over the last 50 years, the Antarctic Peninsula has undergone recent rapid regional warming, which has progressed considerably faster than the global mean [28]. Prior to 1995, three parts of the LIS, referred to as LIS-A, LIS-B, and LIS-C, filled three adjacent embayments. LIS-B was continuously persistant during the Holocene until 2005, based on a comparison of diatom abundance between the LIS-A and LIS-B [36]. LIS-A and LIS-B collapsed suddenly in 1995 and 2002, respectively; only small parts of the LIS-A and LIS-B remain now.

2.2. Analysis of Sedimentary Facies and Grain Size

The sediment core was divided into two halves; one half was scanned by X-ray radiograph, and the second half was archived at KOPRI. A qualitative color scale (Munsell color chart and code) was used to describe the color variations in the sediment column. Grain size was measured every 4 cm to determine the size fractions of gravel (>2 mm), sand (62.5 µm–2 mm), silt (2 µm–62.5 µm), and clay (<2 µm) following a conventional separation method [37]. Gravel and sand size particles (>62.5 µm) were determined by wet sieving. The content of silt and clay (fine particles smaller than 62.5 µm) was measured with a laser grain size analyzer (Micrometrics Sedigraph 5100) at KOPRI, Incheon, Korea.

2.3. X-ray Diffraction

X-ray diffraction (XRD) analyses were conducted on air-dried and glycolated size fraction samples (<2 µm) at a 1.5°/min scan speed, with an automated diffractometer (Rigaku Miniflex II) using Cu-Kα radiation at Yonsei University, Seoul, Korea. The clay mineralogy of sediments was analyzed at 15 cm intervals, depending on changes in sedimentary facies and colors. Clay size fraction samples were dispersed in distilled water (0.7 mg/mL) and put in an ultrasonic water bath for 30 s to prevent flocculation of particles. Then, air-dried samples were made by pipetting sediment dispersions onto slide glasses for XRD analysis [38]. Semi-quantitative evaluations of clay minerals were measured after the glycolation treatment. The relative percentage of each clay mineral was calculated using weighting factors [39,40], then the clay mineral ratio of smectite/(illite + chlorite) was measured to interpret the relative significance of the clay mineral sources [41]. Crystallographical Search-Match software (version 2.0.3.1) was used to identify the clay mineralogy, and semi-quantitative analysis was followed to estimate the relative proportions of smectite, illite, kaolinite and chlorite [39,40]. The Biscaye method is widely used in this study, and has been proven for tracing the provenance of marine sediments in recent studies [3,42,43,44]. In total, six sets of clay samples were measured by XRD for statistical evaluation, such as average and standard deviation (SD).

2.4. Transmission Electron Microscopy

Based on the XRD results, representative depths from U1 (18 cm below seafloor (cmbsf)), U2 (125 cmbsf), U3 (170 cmbsf), and U4 (200 cmbsf) of the EAP13-GC17 core were selected for transmission electron microscopy (TEM) measurements. Clay particles separated from sediments were impregnated with LR White resin, to prevent structural alterations resulting from the dehydration of clay minerals under the high-energy TEM beam condition [45]. TEM specimens were sectioned at a thickness of 100 nm using an ultramicrotome (ULTRACUT TCT; at the Korea Basic Science Institute) and then put on a holey carbon grid [38]. Variations in structure and elemental composition of clay minerals were measured by JEOL JEM-ARM 200F TEM equipped with energy-dispersive x-ray spectroscopy (EDS) at Yonsei University, Incheon, Korea. Lattice-fringe images were used to differentiate the illite layers (10 Å) from the smectite layers (12–13 Å), while the EDS was used to measure the elemental composition of each mineral. Around 80–100 illite packets for each unit were measured on the lattice-fringe images using Digital MicrographTM software by counting 10 Å fringes parallel to c* across well-defined illite packets. The packet is defined by discrete domains with coherent layers of illite distinguished by dislocation or contrast [45]. Illite layers were also confirmed by selected area electron diffraction (SAED) patterns, with the strongest Bragg reflections of 1.0, 0.5, and 0.33 nm. Then, mean thickness and standard deviation (SD) were calculated.

2.5. Isotopic Composition (δ13C and δ15N)

A total of 56 subsamples (~50 mg each sample) were collected into tin capsules to analyze isotopic composition of δ13C and δ15N in sediment with depths. These 56 subsamples were analyzed using elemental analyzer-isotope ratio mass spectrometry (EA-IRMS) (Iso-Analytical Limited, Cheshire, United Kingdom) to determine their δ13C and δ15N isotope compositions. Isotopic composition of δ13C and δ15N, with a precision of 0.03‰–0.04‰ and 0.07‰–0.09‰, were measured. Then, average values were calculated from each unit. Samples were prepared with 1 M of hydrochloric acid overnight to remove inorganic carbon in sediments. The samples were then neutralized by washing them three times with distilled water, and subsequently oven dried at 60 °C. The reference material used during δ13C analysis of acid-washed sediment samples was IA-R001 (wheat flour: δ13CV-PDB = −26.43‰). IA-R001 is calibrated against and traceable to IAEA–CH–6 (sucrose: δ13CV-PDB = −10.43‰), which is an inter-laboratory comparison standard distributed by the International Atomic Energy Agency (IAEA), Vienna, Austria.
For 15N analysis, samples and reference materials were dropped in sequence into a furnace held at 1000 °C, where they were combusted in an oxygen rich environment. The resultant gases—N2, NOx, H2O, O2, and CO2—were swept through a reduction stage of pure copper wires held at 600 °C. Gas species of different masses were separated in a magnetic field, then the isotopomers of N2 at m/z 28, 29, and 30 were simultaneously measured using a Faraday cup collector array. The reference materials used during δ 15N analysis were IA-R001 (wheat flour: δ15NAIR = 2.55‰) and IA-R046 (ammonium sulfate: δ15NAIR = 22.04‰). IA-R001 and IA-R046 were calibrated against and traceable to IAEA-N-1 (ammonium sulfate, δ15NAIR = 0.4 ‰), which is an inter-laboratory comparison standard distributed by the IAEA, Vienna, Austria.

3. Results

3.1. Lithological Units and Isotope Data

The sediment core (EAP13-GC17) was subdivided into four distinct lithological units from top (U1) to bottom (U4) via X-ray radiograph images and optical observation (Figure 2). A distinct color and lithology of bioturbated light olive gray (5Y 5/2) sandy clay and lamination, including ice-rafted debris, was identifiable in the upper 35 cm (U1) of the core, compared to the homogeneous silty clay and discontinuous laminations visible between 35–129 cmbsf (U2). In U2, two sub-units were clearly observed in U2: (1) light olive gray (5Y 5/2), to moderate olive brown (5Y 4/4), slightly bioturbated, laminated sandy mud (35–70 cmbsf); and (2) light olive gray (5Y 5/2) homogeneous silty clay (70–129 cmbsf). Moving down the core, U3 contained three distinct sub-units: (1) olive gray (5Y 4/1) interbedded silty clay and granulated, sandy silt–clay aggregates (129–134 cmbsf); (2) dark greenish-gray (5G 4/1), stratified, granule-rich, sandy, gravely mud (134–155 cmbsf); and (3) dark greenish-gray (5G 4/1), muddy, uncompacted diamicton (155–180 cmbsf). Dark greenish-gray (5G 4/1) muddy diamicton with granules was observed at the bottom of the core (180–236 cmbsf, U4). The isotopic compositions of δ13C and δ15N measured, on average, to be −24.4‰ and 4.3‰ (U1), −25.8‰ and 1.5‰ (U2), −26.9‰ and 1.7‰ (U3), and −26.0‰ and 1.5‰ (U4, Figure 2), respectively. Meteoric 10Be concentration increased gradually from the bottom of the sample upwards, and reached its maximum values (599.17 ± 6.56 × 10⁶ atoms·g−1) in the uppermost part (0–35 cmbsf) of the core [20].

3.2. Semi-Quantification of Clay Minerals and Mineralogy

Major mineral composition in bulk sediments are smectite, illite, chlorite, kaolinite, albite, and quartz with whole depths. There are no significant mineralogical variations with depth. The average clay mineral composition was dominated by illite (60.5%) and chlorite (23.2%) in U1, with less abundant clay minerals of kaolinite (12.9%) and smectite (6.0%, Table 1). Similar clay compositions were observed in U2, U3, and U4, consisting of illite (50.6%), chlorite (31.3%), kaolinite (16.8%) and smectite (2.7%). The clay mineral ratio, smectite/(illite + chlorite), varied from 0.018 to 0.094, with an average of 0.041 (Figure 2). The ratio reached a maximum (0.078–0.094) in the uppermost part of the core. Air-dried and ethylene-glycolated size-fraction samples were used to confirm the content of smectite, chlorite, illite, and kaolinite. XRD profiles showed that the major mineral compositions were smectite (S), chlorite (Ch), kaolinite (K), illite (I), illite–smectite mixed-layer (I/S), plasioclase (Pl), and clay-sized quartz (Q), consistent through all depths of the core (Figure 3). In addition, there is little shoulder between 9–10 two-theta degrees, indicating interstratified I/S. Nonetheless, no TEM lattice fringe images were measured. Chlorite (14 Å), illite (10 Å), and kaolinite (7 Å) showed strong peaks at all depths, and smectite peaks (~17.5 Å) were very weak at all depths (Figure 3). Comparing the relative peak intensity of the minerals showed little difference of intensities through the depths, but the intensities of smectite and illite peaks slightly increased in U1 (3–33 cmbsf) compared to other depths.

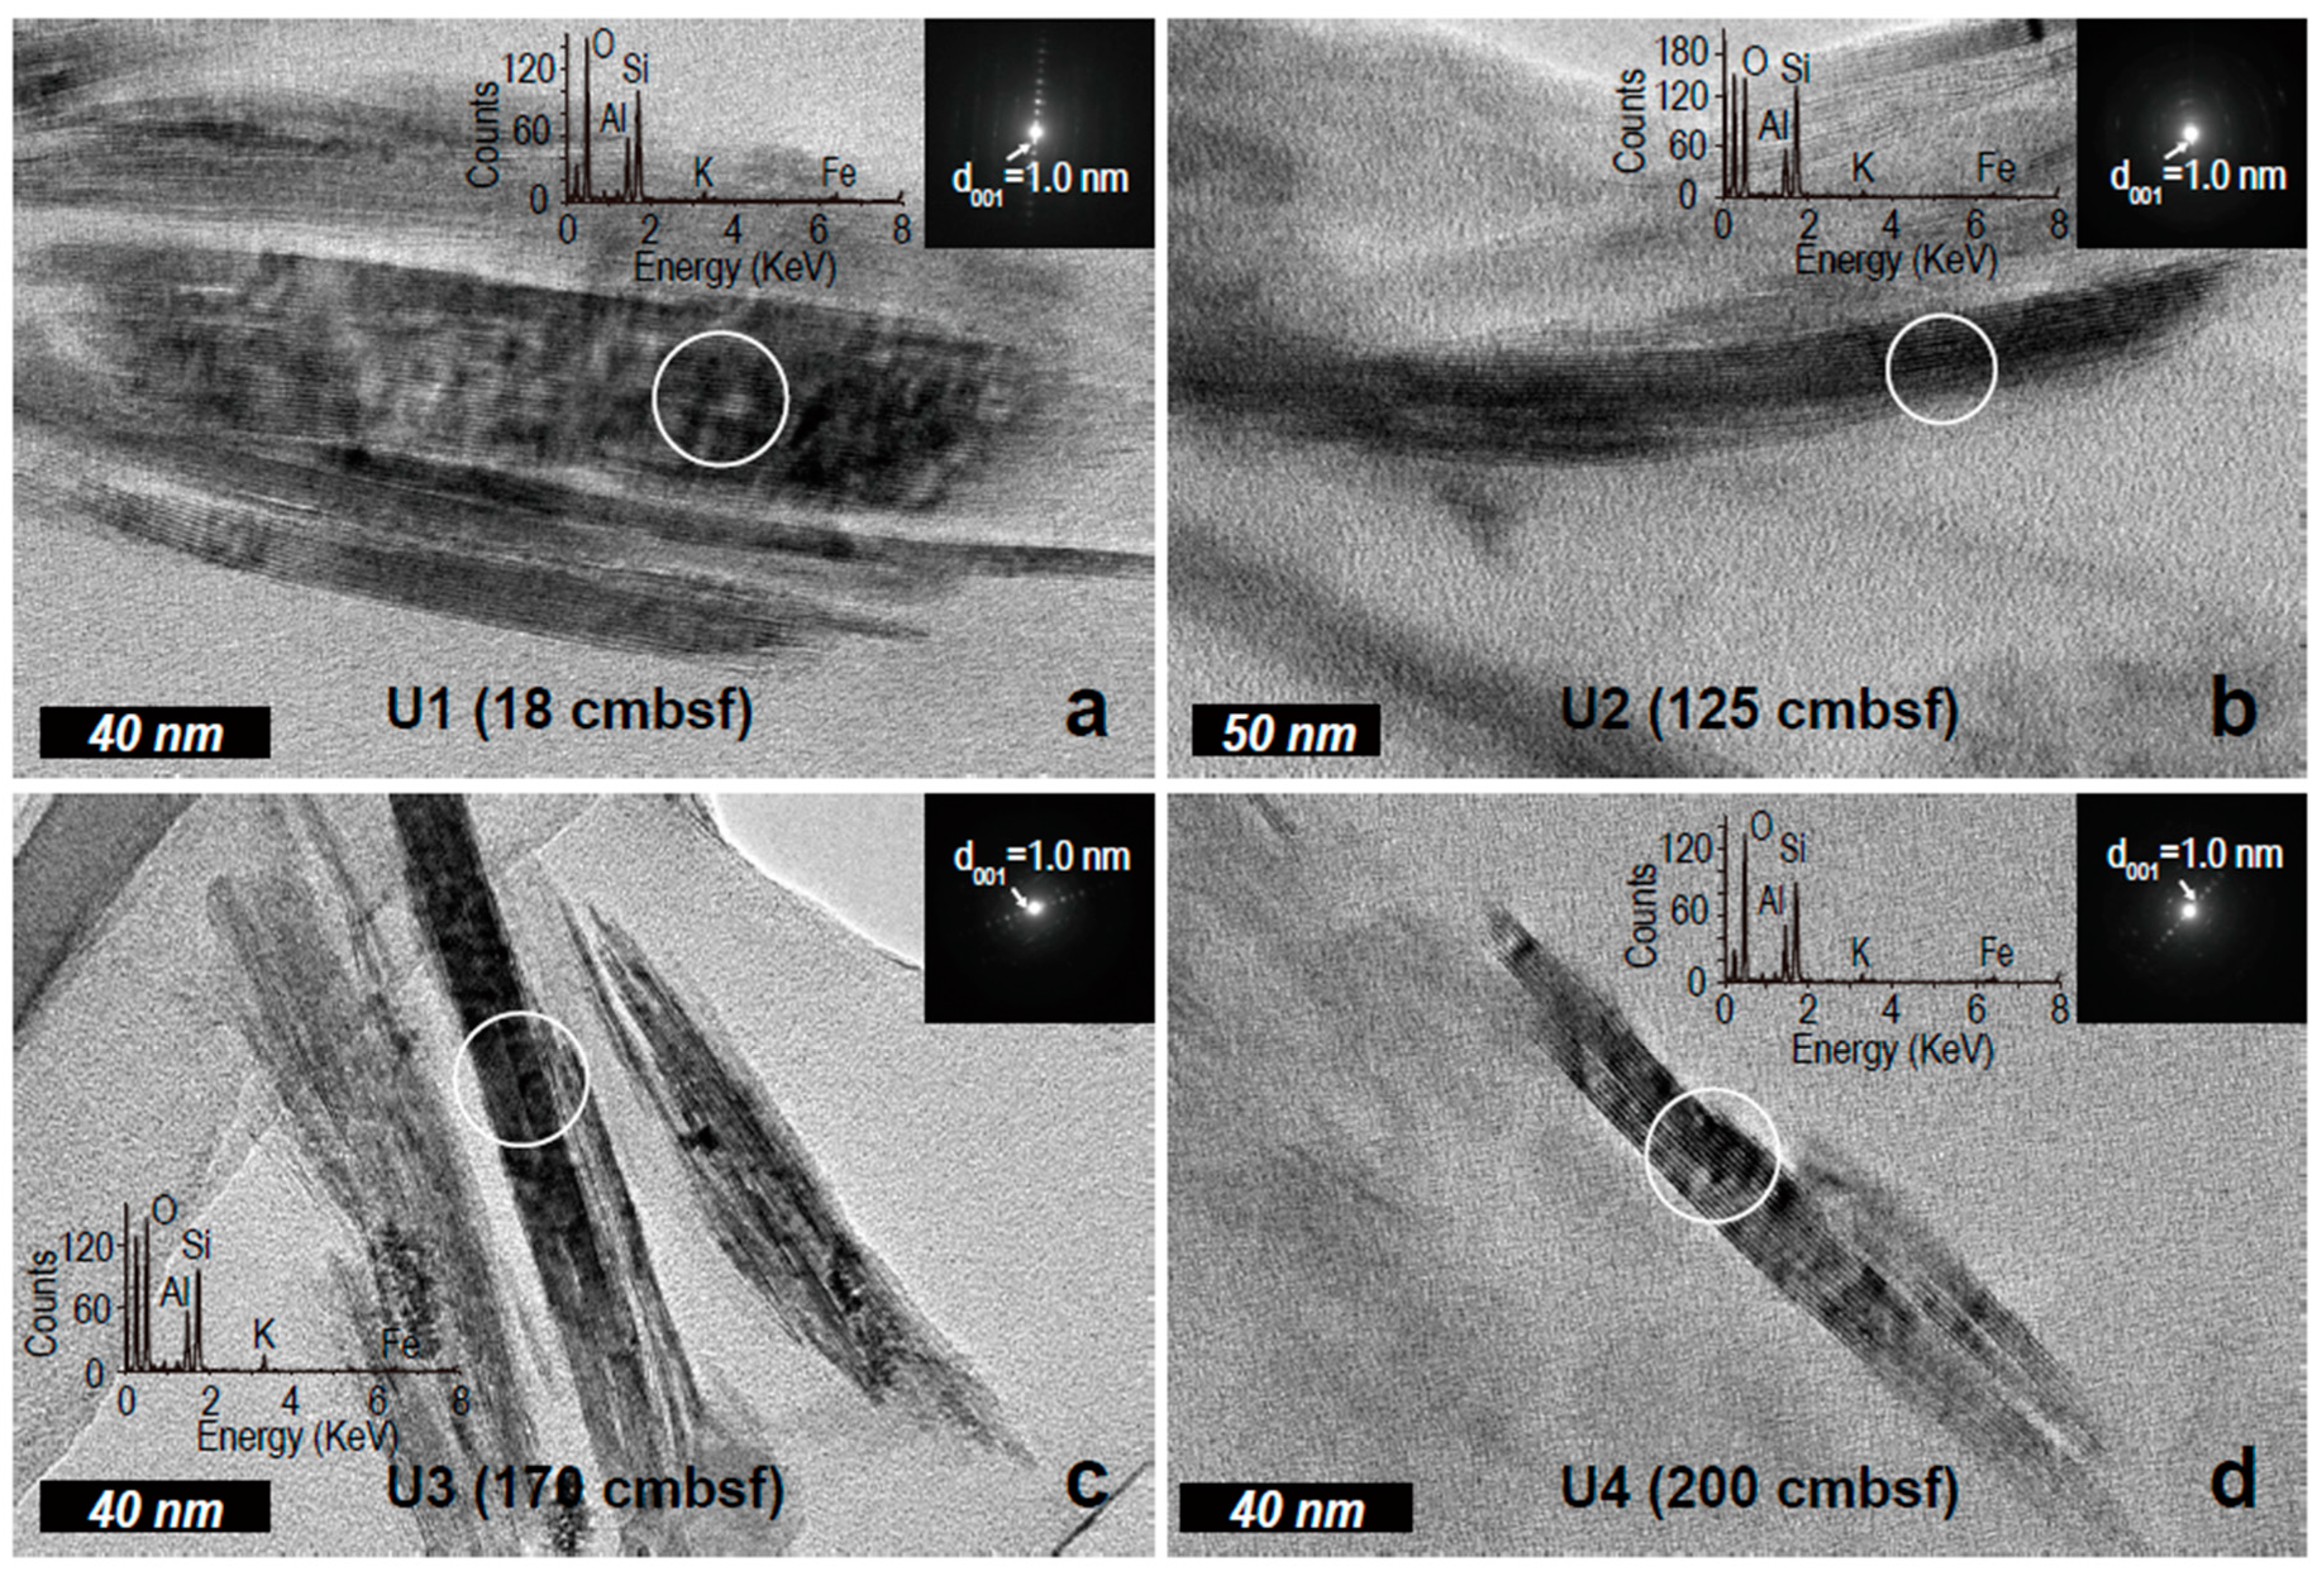
3.3. Electron Microscopic Measurement

A representative clay mineral packet from each unit of the core was measured in the TEM lattice-fringe images, as well as the insets of the corresponding SAED patterns and EDS (Figure 4). The TEM images in the U1 (Figure 4a) showed large packets (mean thickness = 7.4 nm, SD = 3.1 for 99 particles), and an elemental composition of the circled area of (Ca00.08Na0.23K0.58)(Al1.21Mg0.25Fe0.64)(Si3.56Al0.66)O10(OH)2 that is typical of illite. The mean crystal thickness of clay minerals in U2 (Figure 4b) was 5.3 nm (SD = 1.9 for 94 particles), and had an elemental composition of (Ca0.06Na0.021K0.47)(Al1.23Mg0.18Fe0.41)(Si3.63Al0.67)O10(OH)2. The TEM micrograph of U3 (mean thickness = 7.1 nm, SD = 2.8 for 80 particles) displayed an elemental composition of (Ca0.05Na0.18K0.40)(Al1.50Mg0.05Fe0.28)(Si3.60Al0.54)O10(OH)2 (Figure 4c), and U4 (mean thickness = 6.9 nm, SD = 2.3 for 83 particles) showed a similar elemental composition of (Ca0.07Na0.20K0.41)(Al1.56Mg0.07Fe0.29)(Si3.68Al0.59)O10(OH)2 (Figure 4d). The SAED patterns of U1, U3, and U4 showed a discrete Bragg’s reflection of d001 = 1.0 nm, compared to the diffuse and randomly oriented pattern in U2. The 1.0 nm-phase of illite clay minerals in U1–4 also showed variation in the values of Al/Si (0.53 ± 0.03, 0.52 ± 0.06, 0.56 ± 0.03, and 0.58 ± 0.05, respectively).

4. Discussion

4.1. Depositional Environments

Sediment structures with a distinct lithological unit revealed the depositional environments for the advance and retreat of ice shelves in the glacial and interglacial periods, corroborated by the isotopic fractionations. The appearance of ice-rafted debris and foraminifera in the bioturbated sediment (U1) indicates the occasionally open marine conditions that supplied the marine organic matter corresponding to the rapid increases of δ13C and δ15N and the maximum concentration of 10Be (Figure 2). Muddy facies, particularly abundant in U1, also support the idea that sediment input came from the distal sub-ice shelf [32]. The development of lamination in U2 is likely associated with subglacial melt water and tidal pumping from the grounding zone, when ice shelves retreated under an ice-thinning process [7]; as indicated by the gradual increase in 10Be concentration, these processes resulted in the stratified layers, with sorted granules seen in U2. Furthermore, the slight increase in δ13C and consistent values of δ15N in U2 indicate a stable sub–ice shelf environment controlled by proximity to the grounding zone of the ice shelf. The deposition of dark gray sandy diamictons in U3 and U4 indicate their proximity to the grounding zone of the ice shelf during the deglaciation and LGM. The negative values for δ13C and δ15N seen in U3 and U4 suggest that little organic matter was supplied from the marine environment, in comparison with U1. The negative values of δ13C, ranging from −25.5‰ to −30.0‰, and values of δ15N less than 3‰, also indicate the terrestrial end-member in continental shelf sediments [46,47], compatible with the lowest value of meteoric 10Be (U4). These results are correlated with the glacially sculpted streamline on the sea floor, reported from analyses of multibeam data and the petrologic composition of terrigenous grains on the Antarctic Peninsula [36]. The LIS has experienced an accelerated thinning process [48], resulting in the unique depositional history of the LIS-B embayment revealed in the glacial detritus (U4), compared to the upper units (U1–2) that are more distal from the grounding line.

4.2. Illite Structure Responding to Depositional Environments

The average packet size of illite for the units showed a thickness difference of 2.1 nm between U1 and U2, suggesting depositional environments such as open marine condition and sub-ice shelf condition. This also indicates that a new population of clay particles was transported in open marine conditions [16]. There were different elemental compositions of illite—for example, a higher Fe content (1.2–1.7 times) measured in U1–2 than in U3–4 (Figure 4). We measured around 100 illite packets to acquire the Al/Si ratio for each unit. These values with SD (0.53 ± 0.03, 0.52 ± 0.06, 0.56 ± 0.03, and 0.58 ± 0.05, respectively) showed a variation between those values from U1–2 and U3–4, suggesting different depositional conditions or likely different sources. In addition, bio-reduced smectite showed an Al/Si difference of 0.02–0.05, compared with the non-reduced smectite [49], indicating that small variation in Al/Si may respond to the geochemical alteration of minerals as observed in the present study. However, the present study is for the natural sediments that may have more factors to modify the illite composition, such as chemical/physical weathering as well as microbial alteration [5,50]. These results may support two possible scenarios: (1) there were multiple sources of illite supply in the occasionally open marine conditions; or (2) alteration of illite modifies the chemical composition of the illite in response to the redox condition during the transition from glacial, to sub–ice shelf, to occasionally open marine conditions. Structural differences in the two groups of illite were measured in the Bragg’s reflection of the SAED patterns, displaying diffused, randomly ordered (U3–4, Figure 4c,d), and discretely ordered patterns (U1-2, Figure 4a,b). Modification of illite crystal structures can be ascribed to the Fe-redox reaction that changes the lattice energy, causing Fe to be released from the structure [49]. Indeed, the content of structural Fe in illite for U3–4, the oxygen-limited conditions, is shown to be less than the content in U1–2, which was deposited in more oxygen-rich conditions when the open marine condition reached.

4.3. Provenance of Late Quaternary Glacial and Interglacial Sediments

The percentage of illite and smectite increased only in the upper unit (U1, Table 1) of the core; the composition of clay minerals in the other core units was similar to the average clay composition of the Weddell Sea region [3] (illite: ~60%, chlorite: ~20%, kaolinite: ~5–10%, smectite: ~10–20%, Figure 5). The smectite/(illite + chlorite) ratio was highest in U1 and lowest in the glacial period (U3–4), suggesting a change in the relative significance of clay mineral sources [41]. Due to the retreat of these ice shelves in the interglacial period, the influence of the circulation of the Weddell Sea Gyre and bottom water currents increased [13,51,52]. As a result, illite-rich suspensions containing smectite were transported from the Weddell Sea by bottom waters and the Weddell Sea Gyre [13,53]. Moreover, the ratio of the 5 Å/10 Å peak decreased in U1–2 (Figure 3), indicating that Mg and Fe replaced Al in the octahedral sheet of illite [54]. Illite with 10–12 wt % Fe content in U1–2 (Figure 4), which is very uncommon in marine sediments, can be ascribed to biotite-bearing, highly metamorphic rocks frequently found in the East Antarctic craton [55]. The crystal structure of illite has less Al substitution at tetrahedral sites than mica [56]. This shows that the average chemical structure formula of illite is (Ca0.05Na0.03K0.61)(Al1.53Fe3+0.22Fe2+0.03Mg0.28)(Si3.4Al0.6)O10(OH)2, which is very similar to the measured chemical formula, although results showed more Fe and Mg in the octahedral sheet. A high silica component in illite for U1 is likely to be ascribed to the amorphous silica on the illite surface, as is often observed in the deep sub-seafloor sediments (Pers. Com., Kogure). In general, biotite (whose ideal composition is K(Mg, Fe2+, Rx3+)3(Si3-xAl1+x)O10(OH)2) is a trioctahedral subgroup that shows a higher Al content (more than 1) than Al in an illite tetrahedral sheet. For these reasons, it is clear that sediments at the upper part of EAP13-GC17 are mainly derived from the Weddell Sea region by Weddell Sea currents. On the other hand, illite and smectite were less abundant in U3–4, and higher 5 Å/10 Å ratios, with a 7–8 wt % Fe content, were observed in the illite. This illite was derived from low-grade metamorphic and felsic igneous rocks from West Antarctica [3,55]. These results suggest that sediments were transported by the movements of glaciers, and supplied by melting water near the grounding zone of the LIS in the glacial period.

5. Conclusions

A series of spectroscopic, microscopic, and chemical analyses of clay minerals in the continental shelf sediment beneath the LIS-B embayment reveals that the clay mineral composition and structure reflect changes in depositional environments during the glacial–interglacial periods. Mineralogical characteristics and geochemical data from the sediments suggest that they were mainly derived from the Weddell Sea during the interglacial period, and the Antarctic Peninsula during the glacial period. The variations in clay mineral composition in sedimentary facies reflect the different depositional settings from the LGM through the Holocene. These results are consistent with the variations of δ13C and δ15N values that determine whether sediments derived from terrestrial or marine sources. Moreover, altered illite with laminated facies and negative isotopic values indicates a sub-ice shelf condition. Overall, EAP13-GC17 demonstrated clear sedimentary sequences, mineralogical characteristics, and isotopic evidence from the LGM through the Holocene, including transitions from the glacial to sub-ice shelf conditions, and occasionally to open-sea conditions as well.

Author Contributions

J.K. designed the study concept and data interpretation, and revised the manuscript. J.J. contributed to the data production, experimental settings, and manuscript preparation. K.-C.Y. and J.I.L. collected the sediment core and interpreted the sedimentary facies and depositional environments. K.-H.L. conducted XRD analysis. Y.K.P. interpreted TEM data.

Funding

This work was supported by the National Research Foundation of Korea (NRF) grant (No. NRF-2018R1A2B6002036) and the Antarctic Project of KOPRI (PE18030) to J.K.

Acknowledgments

We thank the many scientists and crew member of KOPRI’s ice breaker R/V Araon for their efforts in collecting and analyzing samples.

Conflicts of Interest

The authors declare no conflict of interest.

References

  1. Domack, E.W.; Ishman, S.E.; Stein, A.B.; McClennen, C.E.; Jull, A.T. Late holocene advance of the müller ice shelf, antarctic peninsula: Sedimentological, geochemical and palaeontological evidence. Antarct. Sci. 1995, 7, 159–170. [Google Scholar] [CrossRef]
  2. Domack, E.W.; Burnett, A.; Leventer, A. Environmental setting of the antarctic peninsula. Antarct. Penins. Clim. Var. Hist. Paleoenviron. Perspect. 2003, 79. [Google Scholar] [CrossRef]
  3. Petschick, R.; Kuhn, G.; Gingele, F. Clay mineral distribution in surface sediments of the south Atlantic: Sources, transport, and relation to oceanography. Mar. Geol. 1996, 130, 203–229. [Google Scholar] [CrossRef]
  4. Pandarinath, K. Clay minerals in SW Indian continental shelf sediment cores as indicators of provenance and palaeomonsoonal conditions: A statistical approach. Int. Geol. Rev. 2009, 51, 145–165. [Google Scholar] [CrossRef]
  5. Wang, Q.; Yang, S. Clay mineralogy indicates the Holocene monsoon climate in the Changjiang (Yangtze River) Catchment, China. Appl. Clay Sci. 2013, 74, 28–36. [Google Scholar] [CrossRef]
  6. Griffin, J.J.; Windom, H.; Goldberg, E.D. The Distribution of clay Minerals in the World Ocean, Deep Sea Research and Oceanographic Abstracts; Elsevier: Amsterdam, The Netherlands, 1968; pp. 433–459. [Google Scholar]
  7. Domack, E.W.; Jacobson, E.A.; Shipp, S.; Anderson, J.B. Late Pleistocene–Holocene retreat of the West Antarctic Ice-Sheet system in the Ross Sea: Part 2—Sedimentologic and stratigraphic signature. Geol. Soc. Am. Bull. 1999, 111, 1517–1536. [Google Scholar] [CrossRef]
  8. Rosenheim, B.E.; Santoro, J.A.; Gunter, M.; Domack, E.W. Improving Antarctic Sediment 14C Dating Using Ramped Pyrolysis: An Example from the Hugo Island Trough. Radiocarbon 2013, 55, 115–126. [Google Scholar] [CrossRef]
  9. Johnsson, M.J. The System Controlling the Composition of Clastic Sediments; Special papers; Geological Society of America: Boulder, CO, USA, 1993. [Google Scholar]
  10. Weaver, C.E. Clays, Muds, and Shales; Elsevier: Amsterdam, The Netherlands, 1989; Volume 44. [Google Scholar]
  11. Tsipursky, S.I.; Drits, V. The distribution of octahedral cations in the 2:1 layers of dioctahedral smectites studied by oblique-texture electron diffraction. Clay Miner. 1984, 19, 177–193. [Google Scholar] [CrossRef]
  12. Jeong, G.; Yoon, H. The origin of clay minerals in soils of King George Island, South Shetland Islands, West Antarctica, and its implications for the clay-mineral compositions of marine sediments. J. Sediment. Res. 2001, 71, 833–842. [Google Scholar] [CrossRef]
  13. Lee, J.I.; Yoon, H.I.; Yoo, K.-C.; Lim, H.S.; Lee, Y.I.; Kim, D.; Bak, Y.-S.; Itaki, T. Late quaternary glacial–interglacial variations in sediment supply in the southern drake passage. Quat. Res. 2012, 78, 119–129. [Google Scholar] [CrossRef]
  14. Hillenbrand, C.-D.; Grobe, H.; Diekmann, B.; Kuhn, G.; Fütterer, D.K. Distribution of clay minerals and proxies for productivity in surface sediments of the Bellingshausen and Amundsen seas (West Antarctica)—Relation to modern environmental conditions. Mar. Geol. 2003, 193, 253–271. [Google Scholar] [CrossRef]
  15. Hillenbrand, C.-D.; Ehrmann, W.; Larter, R.D.; Benetti, S.; Dowdeswell, J.; Cofaigh, C.Ó.; Graham, A.G.; Grobe, H. Clay mineral provenance of sediments in the southern Bellingshausen Sea reveals drainage changes of the West Antarctic Ice Sheet during the Late Quaternary. Mar. Geol. 2009, 265, 1–18. [Google Scholar] [CrossRef] [Green Version]
  16. Delmonte, B.; Petit, J.; Maggi, V. Glacial to Holocene implications of the new 27,000-year dust record from the EPICA Dome C (East Antarctica) ice core. Clim. Dyn. 2002, 18, 647–660. [Google Scholar]
  17. Gearing, J.; Gearing, P.; Rudnick, D.; Requejo, A.; Hutchins, M. Isotopic variability of organic carbon in a phytoplankton-based, temperate estuary. Geochim. Cosmochim. Acta 1984, 48, 1089–1098. [Google Scholar] [CrossRef]
  18. Sweeney, R.E.; Kaplan, I. Natural abundances of 15N as a source indicator for near-shore marine sedimentary and dissolved nitrogen. Mar. Chem. 1980, 9, 81–94. [Google Scholar] [CrossRef]
  19. Quan, T.M.; Wright, J.D.; Falkowski, P.G. Co-variation of nitrogen isotopes and redox states through glacial–interglacial cycles in the Black Sea. Geochim. Cosmochim. Acta 2013, 112, 305–320. [Google Scholar] [CrossRef]
  20. Jeong, A.; Lee, J.I.; Seong, Y.B.; Balco, G.; Yoo, K.-C.; Yoon, H.I.; Domack, E.; Rhee, H.H.; Yu, B.Y. Late Quaternary deglacial history across the Larsen B embayment, Antarctica. Quat. Sci. Rev. 2018, 189, 134–148. [Google Scholar] [CrossRef]
  21. Rumolo, P.; Barra, M.; Gherardi, S.; Marsella, E.; Sprovieri, M. Stable isotopes and C/N ratios in marine sediments as a tool for discriminating anthropogenic impact. J. Environ. Monit. 2011, 13, 3399–3408. [Google Scholar] [CrossRef] [PubMed]
  22. Waldron, S.; Tatner, P.; Jack, I.; Arnott, C. The impact of sewage discharge in a marine embayment: A stable isotope reconnaissance. Estuar. Coast. Shelf Sci. 2001, 52, 111–115. [Google Scholar] [CrossRef]
  23. Costanzo, S.D.; Udy, J.; Longstaff, B.; Jones, A. Using nitrogen stable isotope ratios (δ15N) of macroalgae to determine the effectiveness of sewage upgrades: Changes in the extent of sewage plumes over four years in Moreton Bay, Australia. Mar. Pollut. Bull. 2005, 51, 212–217. [Google Scholar] [CrossRef] [PubMed]
  24. Wada, E.; Minagawa, M.; Mizutani, H.; Tsuji, T.; Imaizumi, R.; Karasawa, K. Biogeochemical studies on the transport of organic matter along the Otsuchi River watershed, Japan. Estuar. Coast. Shelf Sci. 1987, 25, 321–336. [Google Scholar] [CrossRef]
  25. Scherer, R.P.; Aldahan, A.; Tulaczyk, S.; Possnert, G.; Engelhardt, H.; Kamb, B. Pleistocene collapse of the West Antarctic ice sheet. Science 1998, 281, 82–85. [Google Scholar] [CrossRef] [PubMed]
  26. Mulvaney, R.; Abram, N.J.; Hindmarsh, R.C.; Arrowsmith, C.; Fleet, L.; Triest, J.; Sime, L.C.; Alemany, O.; Foord, S. Recent Antarctic peninsula warming relative to Holocene climate and ice-shelf history. Nature 2012, 489, 141–144. [Google Scholar] [CrossRef] [PubMed]
  27. Cook, A.; Fox, A.; Vaughan, D.; Ferrigno, J. Retreating glacier fronts on the Antarctic peninsula over the past half-century. Science 2005, 308, 541–544. [Google Scholar] [CrossRef] [PubMed]
  28. Vaughan, D.G.; Marshall, G.J.; Connolley, W.M.; Parkinson, C.; Mulvaney, R.; Hodgson, D.A.; King, J.C.; Pudsey, C.J.; Turner, J. Recent rapid regional climate warming on the Antarctic Peninsula. Clim. Chang. 2003, 60, 243–274. [Google Scholar] [CrossRef]
  29. Domack, E.; Leventer, A.; Gilbert, R.; Brachfeld, S.; Ishman, S.; Camerlenghi, A.; Gavahan, K.; Carlson, D.; Barkoukis, A. Cruise reveals history of Holocene Larsen ice shelf. Eos Trans. Am. Geophys. Union 2001, 82, 13–17. [Google Scholar] [CrossRef]
  30. Vaughan, D.; Doake, C. Recent atmospheric warming and retreat of ice shelves on the Antarctic Peninsula. Nature 1996, 379, 328–331. [Google Scholar] [CrossRef]
  31. Brachfeld, S.; Domack, E.; Kissel, C.; Laj, C.; Leventer, A.; Ishman, S.; Gilbert, R.; Camerlenghi, A.; Eglinton, L.B. Holocene history of the Larsen-A Ice Shelf constrained by geomagnetic Paleointensity dating. Geology 2003, 31, 749–752. [Google Scholar] [CrossRef]
  32. Evans, J.; Pudsey, C.J.; ÓCofaigh, C.; Morris, P.; Domack, E. Late Quaternary glacial history, flow dynamics and sedimentation along the eastern margin of the Antarctic Peninsula Ice Sheet. Quat. Sci. Rev. 2005, 24, 741–774. [Google Scholar] [CrossRef]
  33. Heroy, D.C.; Anderson, J.B. Ice-sheet extent of the Antarctic Peninsula region during the Last Glacial Maximum (LGM)—Insights from glacial geomorphology. Geol. Soc. Am. Bull. 2005, 117, 1497–1512. [Google Scholar] [CrossRef]
  34. Bentley, M.J.; Hodgson, D.; Smith, J.; Cofaigh, C.; Domack, E.; Larter, R.; Roberts, S.; Brachfeld, S.; Leventer, A.; Hjort, C. Mechanisms of Holocene palaeoenvironmental change in the Antarctic Peninsula region. Holocene 2009, 19, 51–69. [Google Scholar] [CrossRef] [Green Version]
  35. Davies, B.J.; Hambrey, M.J.; Smellie, J.L.; Carrivick, J.L.; Glasser, N.F. Antarctic Peninsula ice sheet evolution during the Cenozoic Era. Quat. Sci. Rev. 2012, 31, 30–66. [Google Scholar] [CrossRef]
  36. Domack, E.; Duran, D.; Leventer, A.; Ishman, S.; Doane, S.; McCallum, S.; Amblas, D.; Ring, J.; Gilbert, R.; Prentice, M. Stability of the Larsen B ice shelf on the Antarctic Peninsula during the Holocene epoch. Nature 2005, 436, 681–685. [Google Scholar] [CrossRef] [PubMed]
  37. Jones, K.; McCave, I.; Patel, D. A computer-interfaced sedigraph for modal size analysis of fine-grained sediment. Sedimentology 1988, 35, 163–172. [Google Scholar] [CrossRef]
  38. Yang, K.; Kim, J.-W.; Kogure, T.; Dong, H.; Baik, H.; Hoppie, B.; Harris, R. Smectite, illite, and early diagenesis in South Pacific Gyre subseafloor sediment. Appl. Clay Sci. 2016, 134, 34–43. [Google Scholar] [CrossRef]
  39. Biscaye, P. Distinction between kaolinite and chlorite in recent sediments by X-ray diffraction. Am. Mineral. 1964, 49, 1281–1289. [Google Scholar]
  40. Biscaye, P.E. Mineralogy and sedimentation of recent deep-sea clay in the Atlantic Ocean and adjacent seas and oceans. Geol. Soc. Am. Bull. 1965, 76, 803–832. [Google Scholar] [CrossRef]
  41. Liu, Z.; Trentesaux, A.; Clemens, S.C.; Colin, C.; Wang, P.; Huang, B.; Boulay, S. Clay mineral assemblages in the northern South China Sea: Implications for East Asian monsoon evolution over the past 2 million years. Mar. Geol. 2003, 201, 133–146. [Google Scholar] [CrossRef]
  42. Diekmann, B.; Hofmann, J.; Henrich, R.; Fütterer, D.K.; Röhl, U.; Wei, K.-Y. Detrital sediment supply in the southern Okinawa Trough and its relation to sea-level and Kuroshio dynamics during the late Quaternary. Mar. Geol. 2008, 255, 83–95. [Google Scholar] [CrossRef]
  43. Ehrmann, W.U.; Melles, M.; Kuhn, G.; Grobe, H. Significance of clay mineral assemblages in the Antarctic ocean. Mar. Geol. 1992, 107, 249–273. [Google Scholar] [CrossRef]
  44. Kuhn, G.; Hillenbrand, C.-D.; Kasten, S.; Smith, J.A.; Nitsche, F.O.; Frederichs, T.; Wiers, S.; Ehrmann, W.; Klages, J.P.; Mogollón, J.M. Evidence for a palaeo-subglacial lake on the Antarctic continental shelf. Nat. Commun. 2017, 8, 15591. [Google Scholar] [CrossRef] [PubMed] [Green Version]
  45. Kim, J.-W.; Peacor, D.R.; Tessier, D.; Elsass, F. A technique for maintaining texture and permanent expansion of smectite interlayers for TEM observations. Clays Clay Miner. 1995, 43, 51–57. [Google Scholar] [CrossRef]
  46. Li, G.; Andrews, J.; Riding, R.; Dennis, P.; Dresser, Q. Possible microbial effects of stable carbon isotopes in hot-spring travertines. J. Sediment. Res. 1996, 66, 468–473. [Google Scholar] [CrossRef]
  47. Meksumpun, S.; Meksumpun, C. Stable carbon and nitrogen isotope ratios of sediment in ban don bay: Evidence for understanding sources of organic matters in the coastal environment. Kasetsart J. (Nat. Sci.) 2002, 36, 75–82. [Google Scholar]
  48. Shepherd, A.; Wingham, D.; Payne, T.; Skvarca, P. Larsen ice shelf has progressively thinned. Science 2003, 302, 856–859. [Google Scholar] [CrossRef] [PubMed]
  49. Koo, T.-H.; Jang, Y.-N.; Kogure, T.; Kim, J.H.; Park, B.C.; Sunwoo, D.; Kim, J.-W. Structural and chemical modification of nontronite associated with microbial Fe (III) reduction: Indicators of “illitization”. Chem. Geol. 2014, 377, 87–95. [Google Scholar] [CrossRef]
  50. Dong, H.; Kukkadapu, R.K.; Fredrickson, J.K.; Zachara, J.M.; Kennedy, D.W.; Kostandarithes, H.M. Microbial reduction of structural Fe (III) in illite and goethite. Environ. Sci. Technol. 2003, 37, 1268–1276. [Google Scholar] [CrossRef]
  51. Hernández-Molina, F.; Larter, R.; Rebesco, M.; Maldonado, A. Miocene reversal of bottom water flow along the pacific margin of the Antarctic Peninsula: Stratigraphic evidence from a contourite sedimentary tail. Mar. Geol. 2006, 228, 93–116. [Google Scholar] [CrossRef]
  52. Pudsey, C.J. Late quaternary changes in Antarctic bottom water velocity inferred from sediment grain size in the northern Weddell sea. Mar. Geol. 1992, 107, 9–33. [Google Scholar] [CrossRef]
  53. Kuhn, G.; Weber, M.E. Acoustical characterization of sediments by Parasound and 3.5 kHz systems: Related sedimentary processes on the southeastern Weddell Sea continental slope, Antarctica. Mar. Geol. 1993, 113, 201–217. [Google Scholar] [CrossRef]
  54. Esquevin, J. Influence de la composition chimique des illites sur leur cristallinité. Bull. Cent. Rech. Pau-SNPA 1969, 3, 147–153. [Google Scholar]
  55. Tingey, R. The regional geology of Archean and Proterozoic rocks in Antractica. Geol. Antarct. 1991, 1–73. [Google Scholar]
  56. Weaver, C.E.; Pollard, L.D. The Chemistry of Clay Minerals (Developments in Sedimentology); Elsevier: Amsterdam, The Netherlands, 1973; Volume 15. [Google Scholar]
Figure 1. Location map of the EAP13-GC17 core (65°48.16’ S, 60°39.42’ W), Larsen ice shelf embayment, Weddell Sea, Antarctica.
Minerals 09 00153 g001
Figure 2. Down-core variations in sedimentary facies in four distinct lithological units from top (U1) to bottom (U4): relative grain size, clay mineral ratio of smectite/(illite + chlorite), and isotopic composition (δ13C and δ15N), with 10Be concentration (Jeong et al., 2018) [20].
Minerals 09 00153 g002
Figure 3. X-ray diffraction (XRD) patterns of air-dried and glycolated clay (<2 μm) in sediment core from site EAP13-GC17 at various depths (S: smectite, Ch: chlorite, K: kaolinite, I: illite, Pl: plagioclase, Q: quartz).
Minerals 09 00153 g003
Figure 4. Representative transmission electron microscopy (TEM) lattice-fringe images and insets of corresponding selected area electron diffraction (SAED) patterns and energy-dispersive X-ray spectroscopy (EDS) from depths of (a) U1 (18 cmbsf), (b) U2 (125 cmbsf), (c) U3 (170 cmbsf), and (d) U4 (200 cmbsf) of the EAP13-GC17 core.
Minerals 09 00153 g004
Figure 5. Average clay mineral composition of sediments in the upper unit of the core. Deep and shallow water circulation paths are taken from the compilation of Hernández-Molina et al. (2006) [51]. Compositional variations in sediment core EAP13-GC17, as displayed by clay mineralogical wheel diagrams. Two different relative proportions of clay minerals are related to glacial and interglacial periods.
Minerals 09 00153 g005
Table 1. Relative abundance of clay minerals in the EAP13-GC17 core.
Unit.Depth (cm)Smectite (%)Illite (%)Chlorite (%)Kaolinite (%)
134.5 ± 0.161.2 ± 1.423.4 ± 0.612.7 ± 0.4
185.3 ± 0.168.4 ± 1.818.1 ± 0.510.2 ± 0.3
338.2 ± 0.552.1 ± 3.028.3 ± 1.615.9 ± 0.9
2482.5 ± 0.061.5 ± 0.923.7 ± 0.413.5 ± 0.2
632.9 ± 0.155.8 ± 1.128.6 ± 0.614.2 ± 0.3
762.5 ± 0.149.3 ± 0.932.7 ± 0.616.8 ± 0.3
822.7 ± 0.041.7 ± 0.837.0 ± 0.720 ± 0.4
973.1 ± 0.148.3 ± 1.132.8 ± 0.717.5 ± 0.4
1122.1 ± 0.047.3 ± 0.733.6 ± 0.618.1 ± 0.3
1253.1 ± 0.146.5 ± 0.933.9 ± 0.718.3 ± 0.4
31403.0 ± 0.155.0 ± 1.127.7 ± 0.615.9 ± 0.4
1551.6 ± 0.056.0 ± 0.628.0 ± 0.415.3 ± 0.1
1702.4 ± 0.148.9 ± 0.833.1 ± 0.616.9 ± 0.3
41851.7 ± 0.152.7 ± 0.729.9 ± 0.416.6 ± 0.1
2002.8 ± 0.148.6 ± 0.933.7 ± 0.616.5 ± 0.4
2153.9 ± 0.148.9 ± 1.331.7 ± 0.917.6 ± 0.5
2304.2 ± 0.448.9 ± 1.531.3 ± 0.717.9 ± 0.6

