1. Introduction
The North China Craton (NCC) hosts several world-class gold deposits and contributes more two thirds of gold production in China [
1]. The mineralized sulfides in gold deposits are dominated by pyrite with lesser quantities of chalcopyrite, arsenopyrite, marcasite, pyrrhotite, as well as Zinc–Lead sulfides. Moreover, these pyrite and some arsenopyrite, contain free, visible gold or host refractory gold [
1,
2,
3,
4,
5]. Invisible gold was first defined to include both lattice-bound gold in common sulfides and submicroscopic inclusions of gold minerals [
6,
7]. Abundant studies have shown that the invisible gold normally has a close association with As-rich pyrite or arsenopyrite [
7,
8,
9,
10,
11] and the common conception of Au-As solid solution has resulted in a paradigm for gold trapped in pyrite in which As is considered essential for Au to enter the pyrite structure [
7,
8,
12]. For example, the Fairview gold deposit in South Africa, one of the highest contents of Au and As gold deposits contains 1400 ppm invisible Au and 9.6 wt. % As in pyrite [
13]. However, many gold deposits (e.g., Dongping tellurium—gold deposit and Yangzhaiyu gold deposit in NCC, Maldon gold deposit in the Central Victorian gold province, Australia) have little quantities of As but contain significant amounts of Te [
14,
15,
16].
The Qingchengzi district is an important multi-metal producing region in China. A series of large-medium scale gold deposits (e.g., the Baiyun gold deposit, Xiaotongjiapuzi gold deposit, Taoyuan gold deposit, Yangshu gold deposit. etc.) have been identified. The Baiyun gold deposit is the second largest gold deposit in the district (the proven reserves are 31.7 t with an average grade of 2.85 g/t, The Bureau of Non-Ferrous Geology of Liaoning Province 103 Team, 2015). However, the origin of the deposit, the age of mineralization and the origin of the ore-forming fluids remain in controversial [
17,
18,
19,
20,
21,
22,
23,
24].
This study presents petrological, mineralogical and geochemical data of major ore minerals (pyrite and tellurides) from the Baiyun gold deposit aimed at (1) re-examining the distribution of gold (2) addressing relationships between trace element in pyrite, (3) calculating the formation conditions of tellurides and (4) revealing the evolution of mineralization.
2. Geology Setting
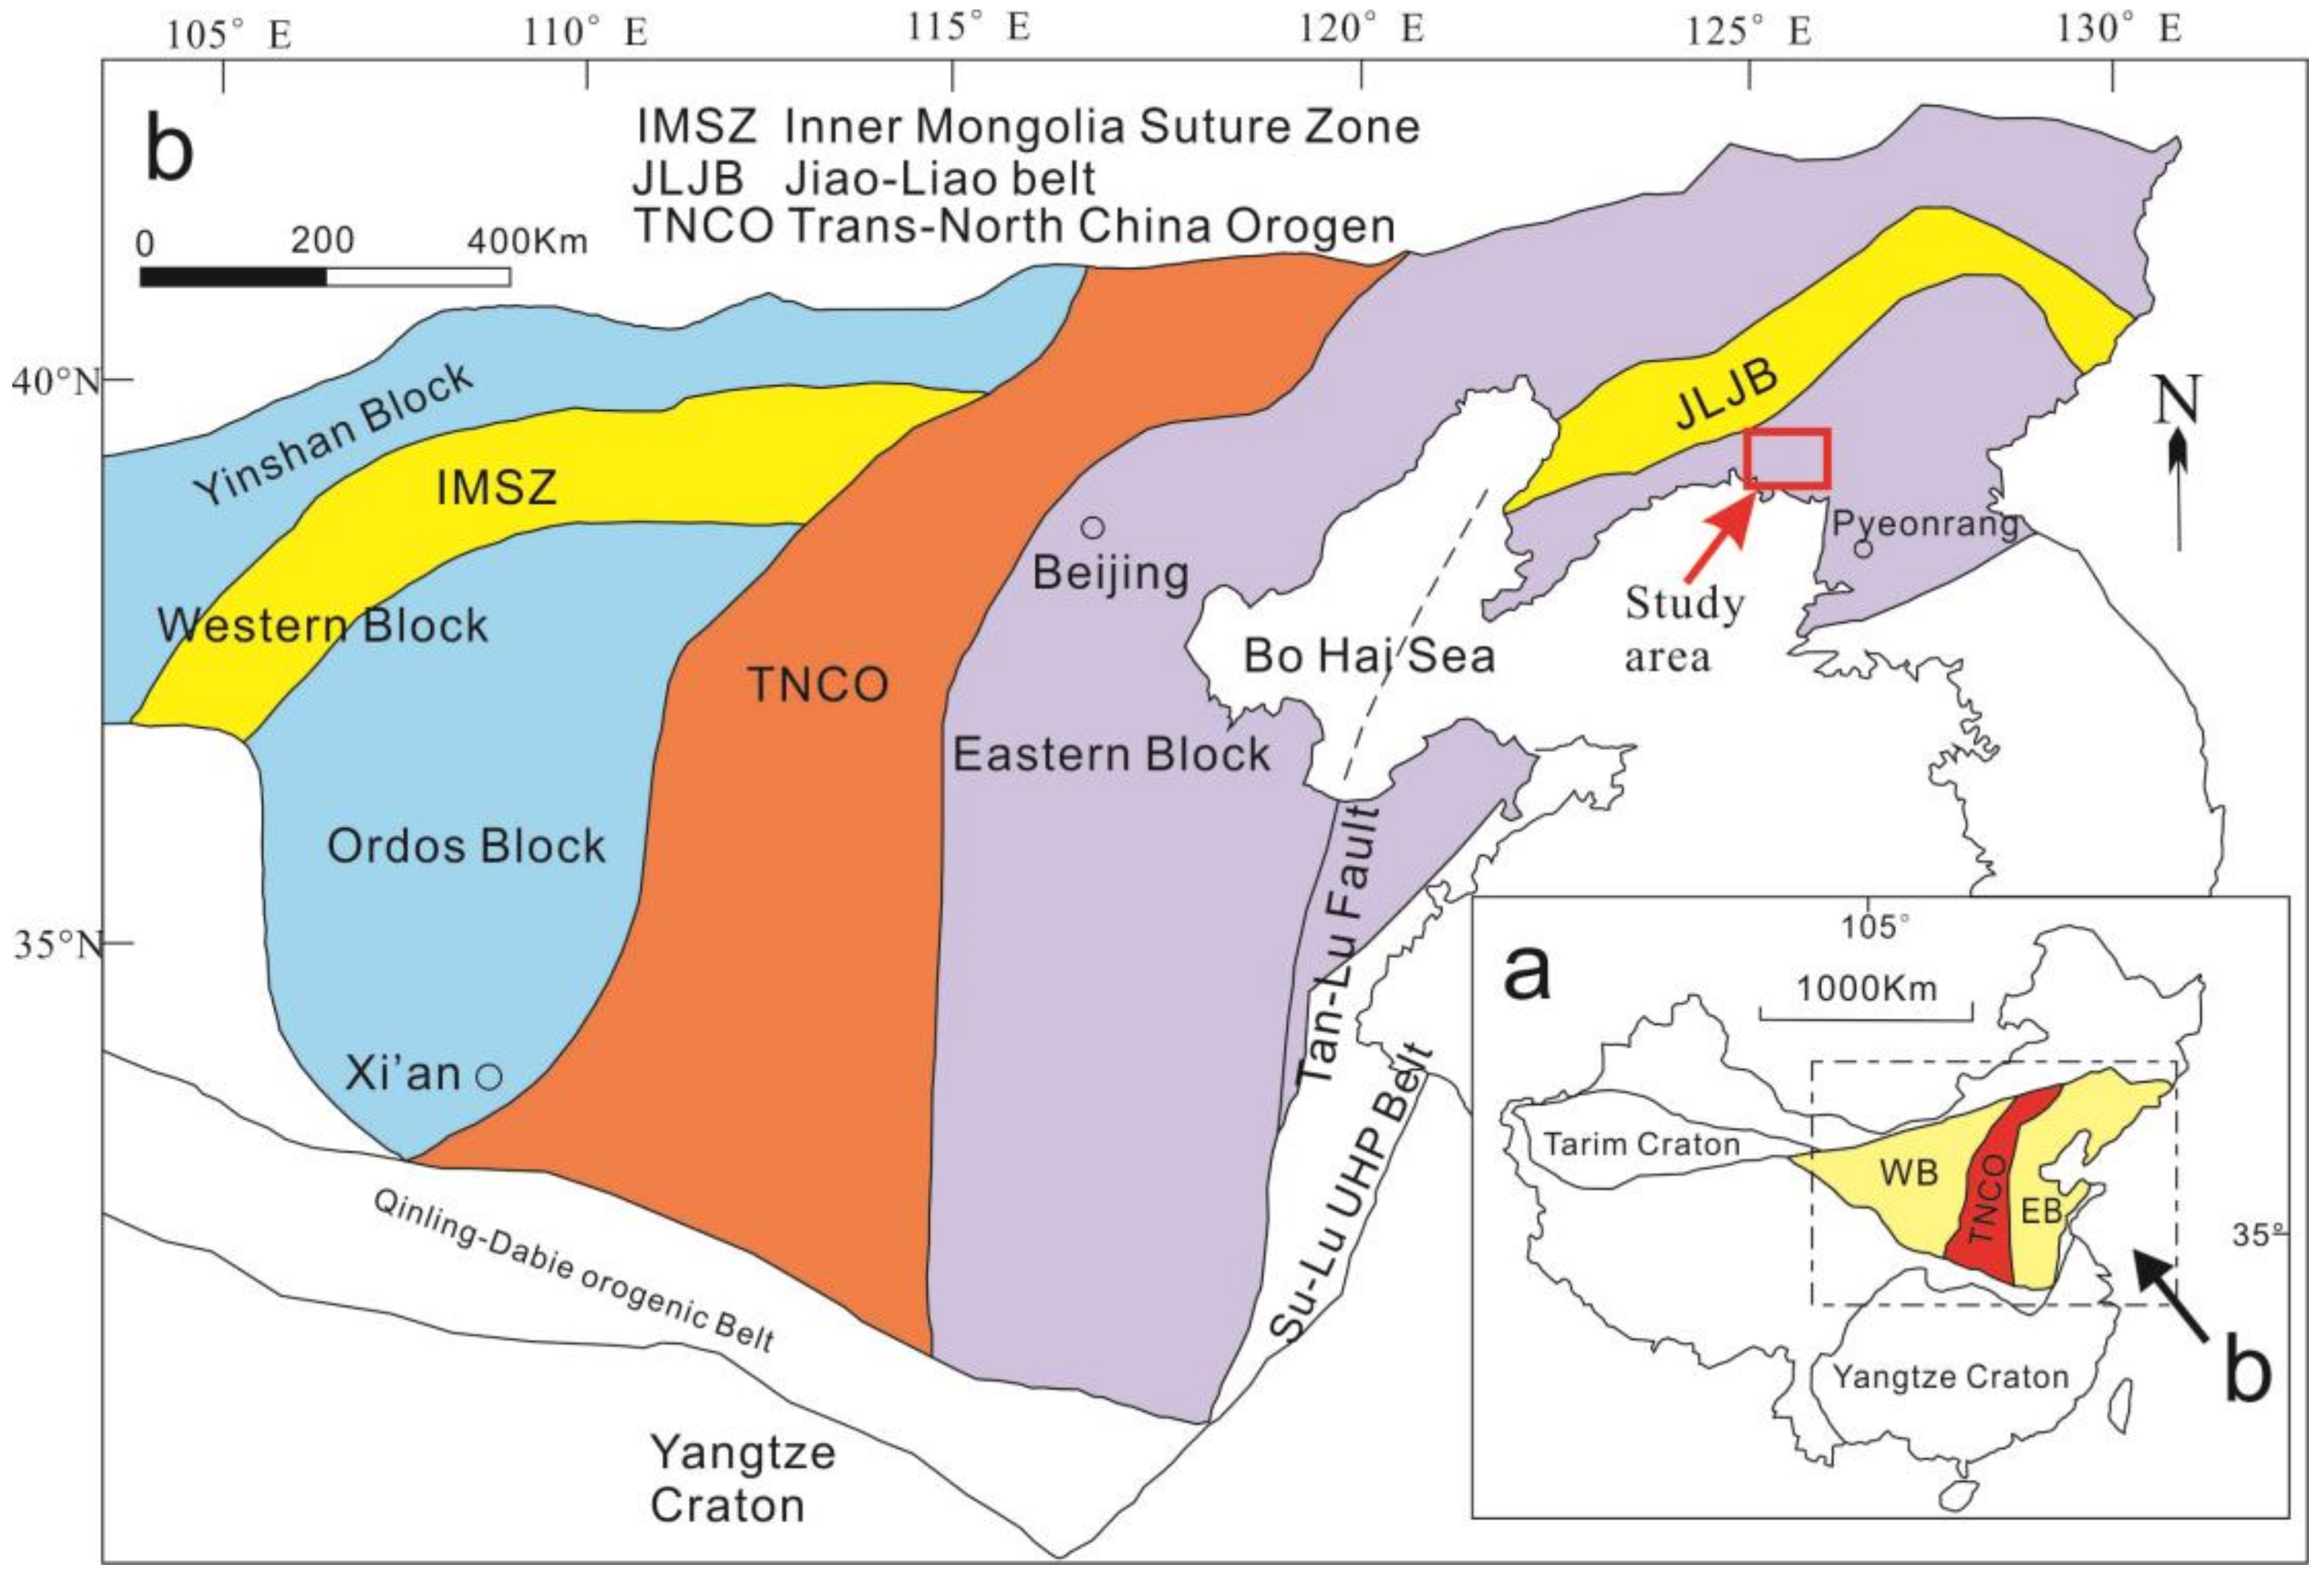
The NCC consists of Eastern and Western Blocks, that developed independently in the Archean (
Figure 1), assembled to form a coherent craton along the central orogenic belt (Trans-North China Orogen) during global Paleoproterozoic collision at 1.85 Ga [
25,
26]. Since the final formation of the NCC, the craton remained “calm” (little crustal deformation, weak seismicity and magmatism, a lithosphere of ca. 200 km thick and refractory lithospheric mantle strongly coupled with crust) until the Mesozoic when extensive magmatism and lithospheric destruction occurred, associated with major mineralization [
27,
28,
29,
30,
31]. Petrology, geochemistry and geophysics studies, have indicated lithospheric thinning of about 60–100km since the late Mesozoic [
32,
33]. The unsteady mantle flow caused by subduction of the western paleo-Pacific plate caused the destruction of the eastern part of the NCC [
34].
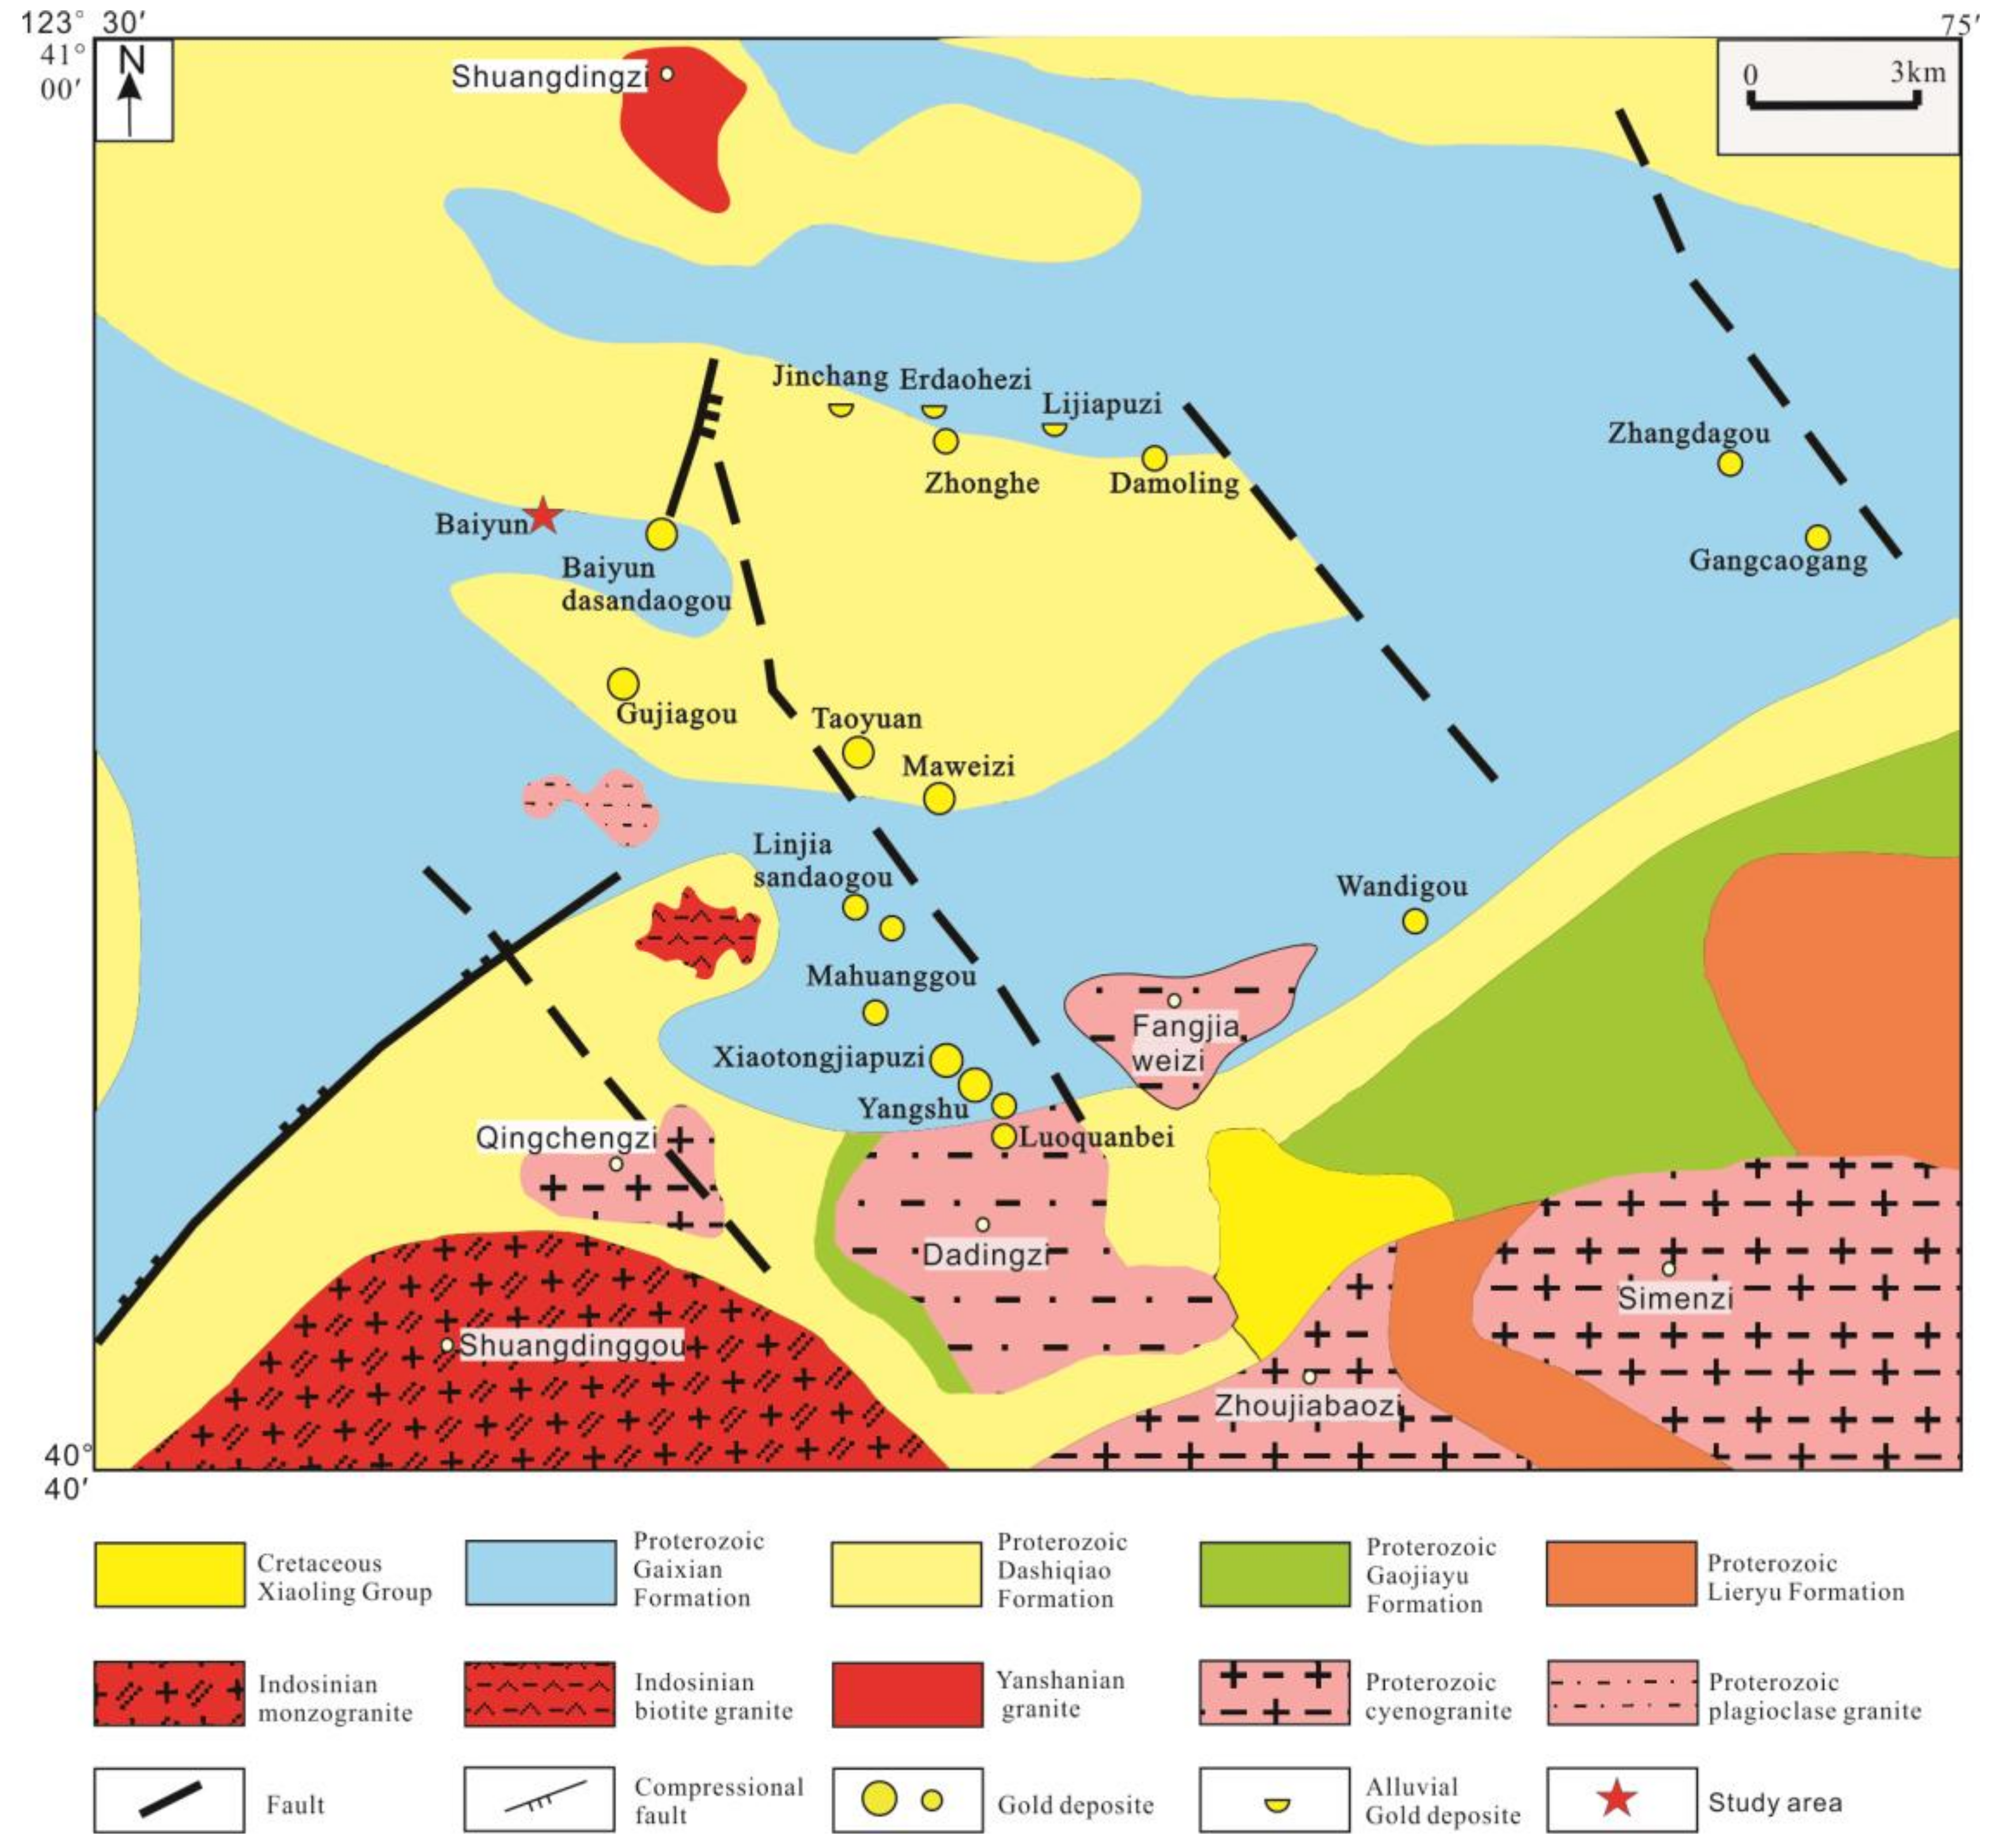
The Qingchengzi gold district is located in Liaoning Province, northeastern the NCC (
Figure 1). This area is dominated by amphibolite and marble of the late Proterozoic Liaohe Group, including the Lieryu Formation; Gaojiayu Formation, Dashiqiao Formation and Gaixian Formation. The Liaohe Group formed in the Paleoproterozoic (2.05–1.92 Ga) based on zircon U–Pb dating evidence [
35]. The Liaohe Group consists of amphibolites, felsic gneiss, Bt-Pl gneiss, Sil-Grt gneiss and marble (
Figure 2). The Cretaceous Xiaoling Formation, mainly containing rhyolite and andesite, is distributed in the southern Qingchengzi gold district.
Major magmatic episodes occur in the Paleoproterozoic, Indosinian (257–205 Ma) and Yanshanian (199–133 Ma). The Dadingzi biotite granite (
Figure 2) intruded into the Paleoproterozoic Dashiqiao and Gaixian Formations with whole-rock K–Ar ages of 1566 to 1624 Ma (The Bureau of Non-Ferrous Geology of Liaoning Province 103 Team, 2010). The Indosinian Shuangdinggou porphyritic biotite-monzonite (224.2 ± 1.2 Ma) and Xinling biotite granite (225.3 ± 1.8 Ma) were intruded into the Liaohe Group as batholiths and stocks. Their geochemical similarities indicate co-stage and co-magmatic evolution [
36,
37]. The Yanshanian Waling biotite monzogranite (162.4 ± 1.9 Ma) and Yaojiagou monzogranite (169.1 ± 0.5 Ma) are located in the west of the gold district and were intruded into the Liaohe Group and Indosinian granite [
36,
38].
Structurally, the Qingchengzi gold district propagated a series of NW striking faults and folds (
Figure 2). The Jianshanzi fault system, as one of several NW-SE striking faults in this area, has a close spatial correlation with the major gold deposits (distributed along the fault) and may serve as the main ore-controlling structure.
3. Characteristics of the Baiyun Gold Deposit
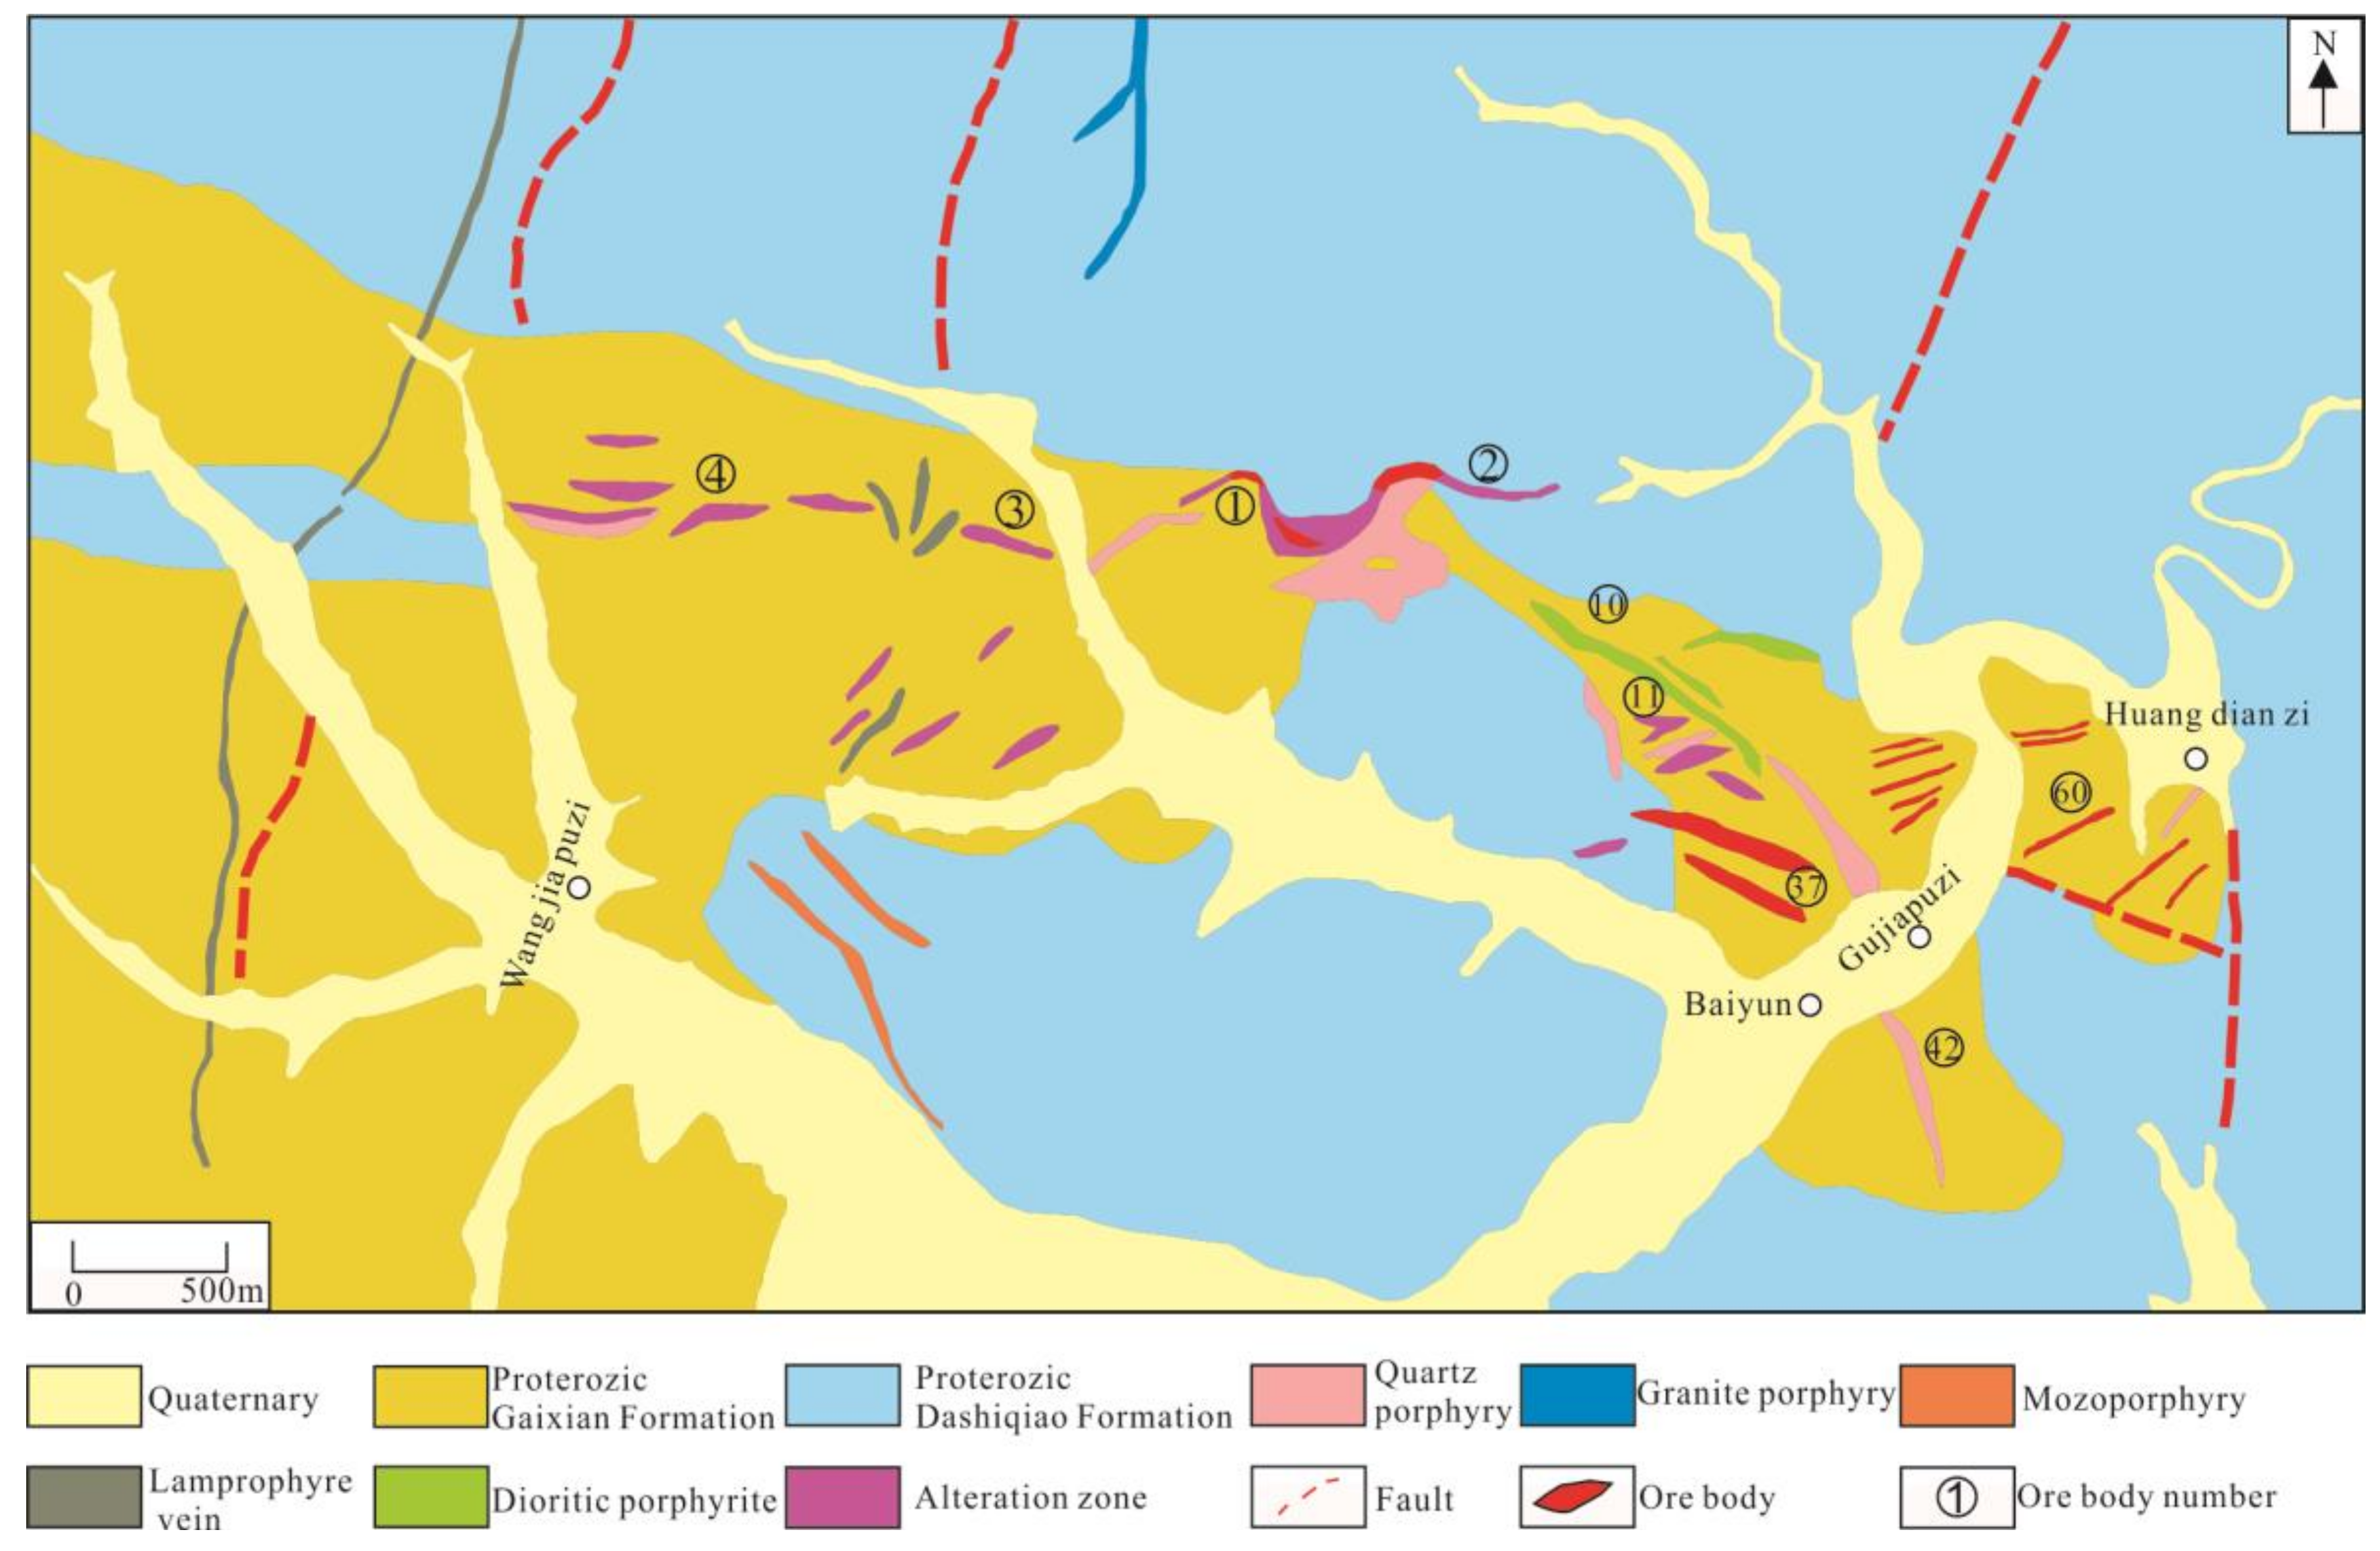
The Baiyun gold deposit is located in northeastern Qingchengzi district (
Figure 2), hosting a gold resource approaching 33 t Au with average gold grade 2.52 g/t [
23]. The sedimentary cover includes the Carbonaceous marble, the tremolite-schist of Dashiqiao Formation, the sillimanite-mica schist of Gaixian Formation and Quaternary sediments (
Figure 3). Ore-bodies in the Dashiqiao Formation and Gaixian Formation crop out as veins or stratiform structures. Magmatic veins with varied lithologies have been recognized in this area, including lamprophyre veins, dioritic porphyries, granite-porphyry, mozoporphyry and quartz-porphyry. The dioritic porphyries and quartz-porphyry had an affinity with mineralization, generally parallel to the ore-bodies and constrain the mineralization boundary. A lot of secondary faults with full of auriferous quartz veins and/or mafic dikes are the host structure (
Figure 3).
There are more than 200 gold ore veins in the Baiyun gold deposit and the principal mineralization types are hosted in Si–K altered rocks and auriferous quartz veins. From west to east, the major lode numbers are 4, 3, 1, 2, 10, 11, 37, 42 and 60. The ore-bodies above an altitude of 100 m are dominated by Si–K altered rocks, while the auriferous quartz vein type ore-bodies are mostly found at lower elevations. The ore-bodies generally extend 50–900 m and the thickness ranges from 0.7 to 5.4 m with an average gold grade of 2.85 g/t.
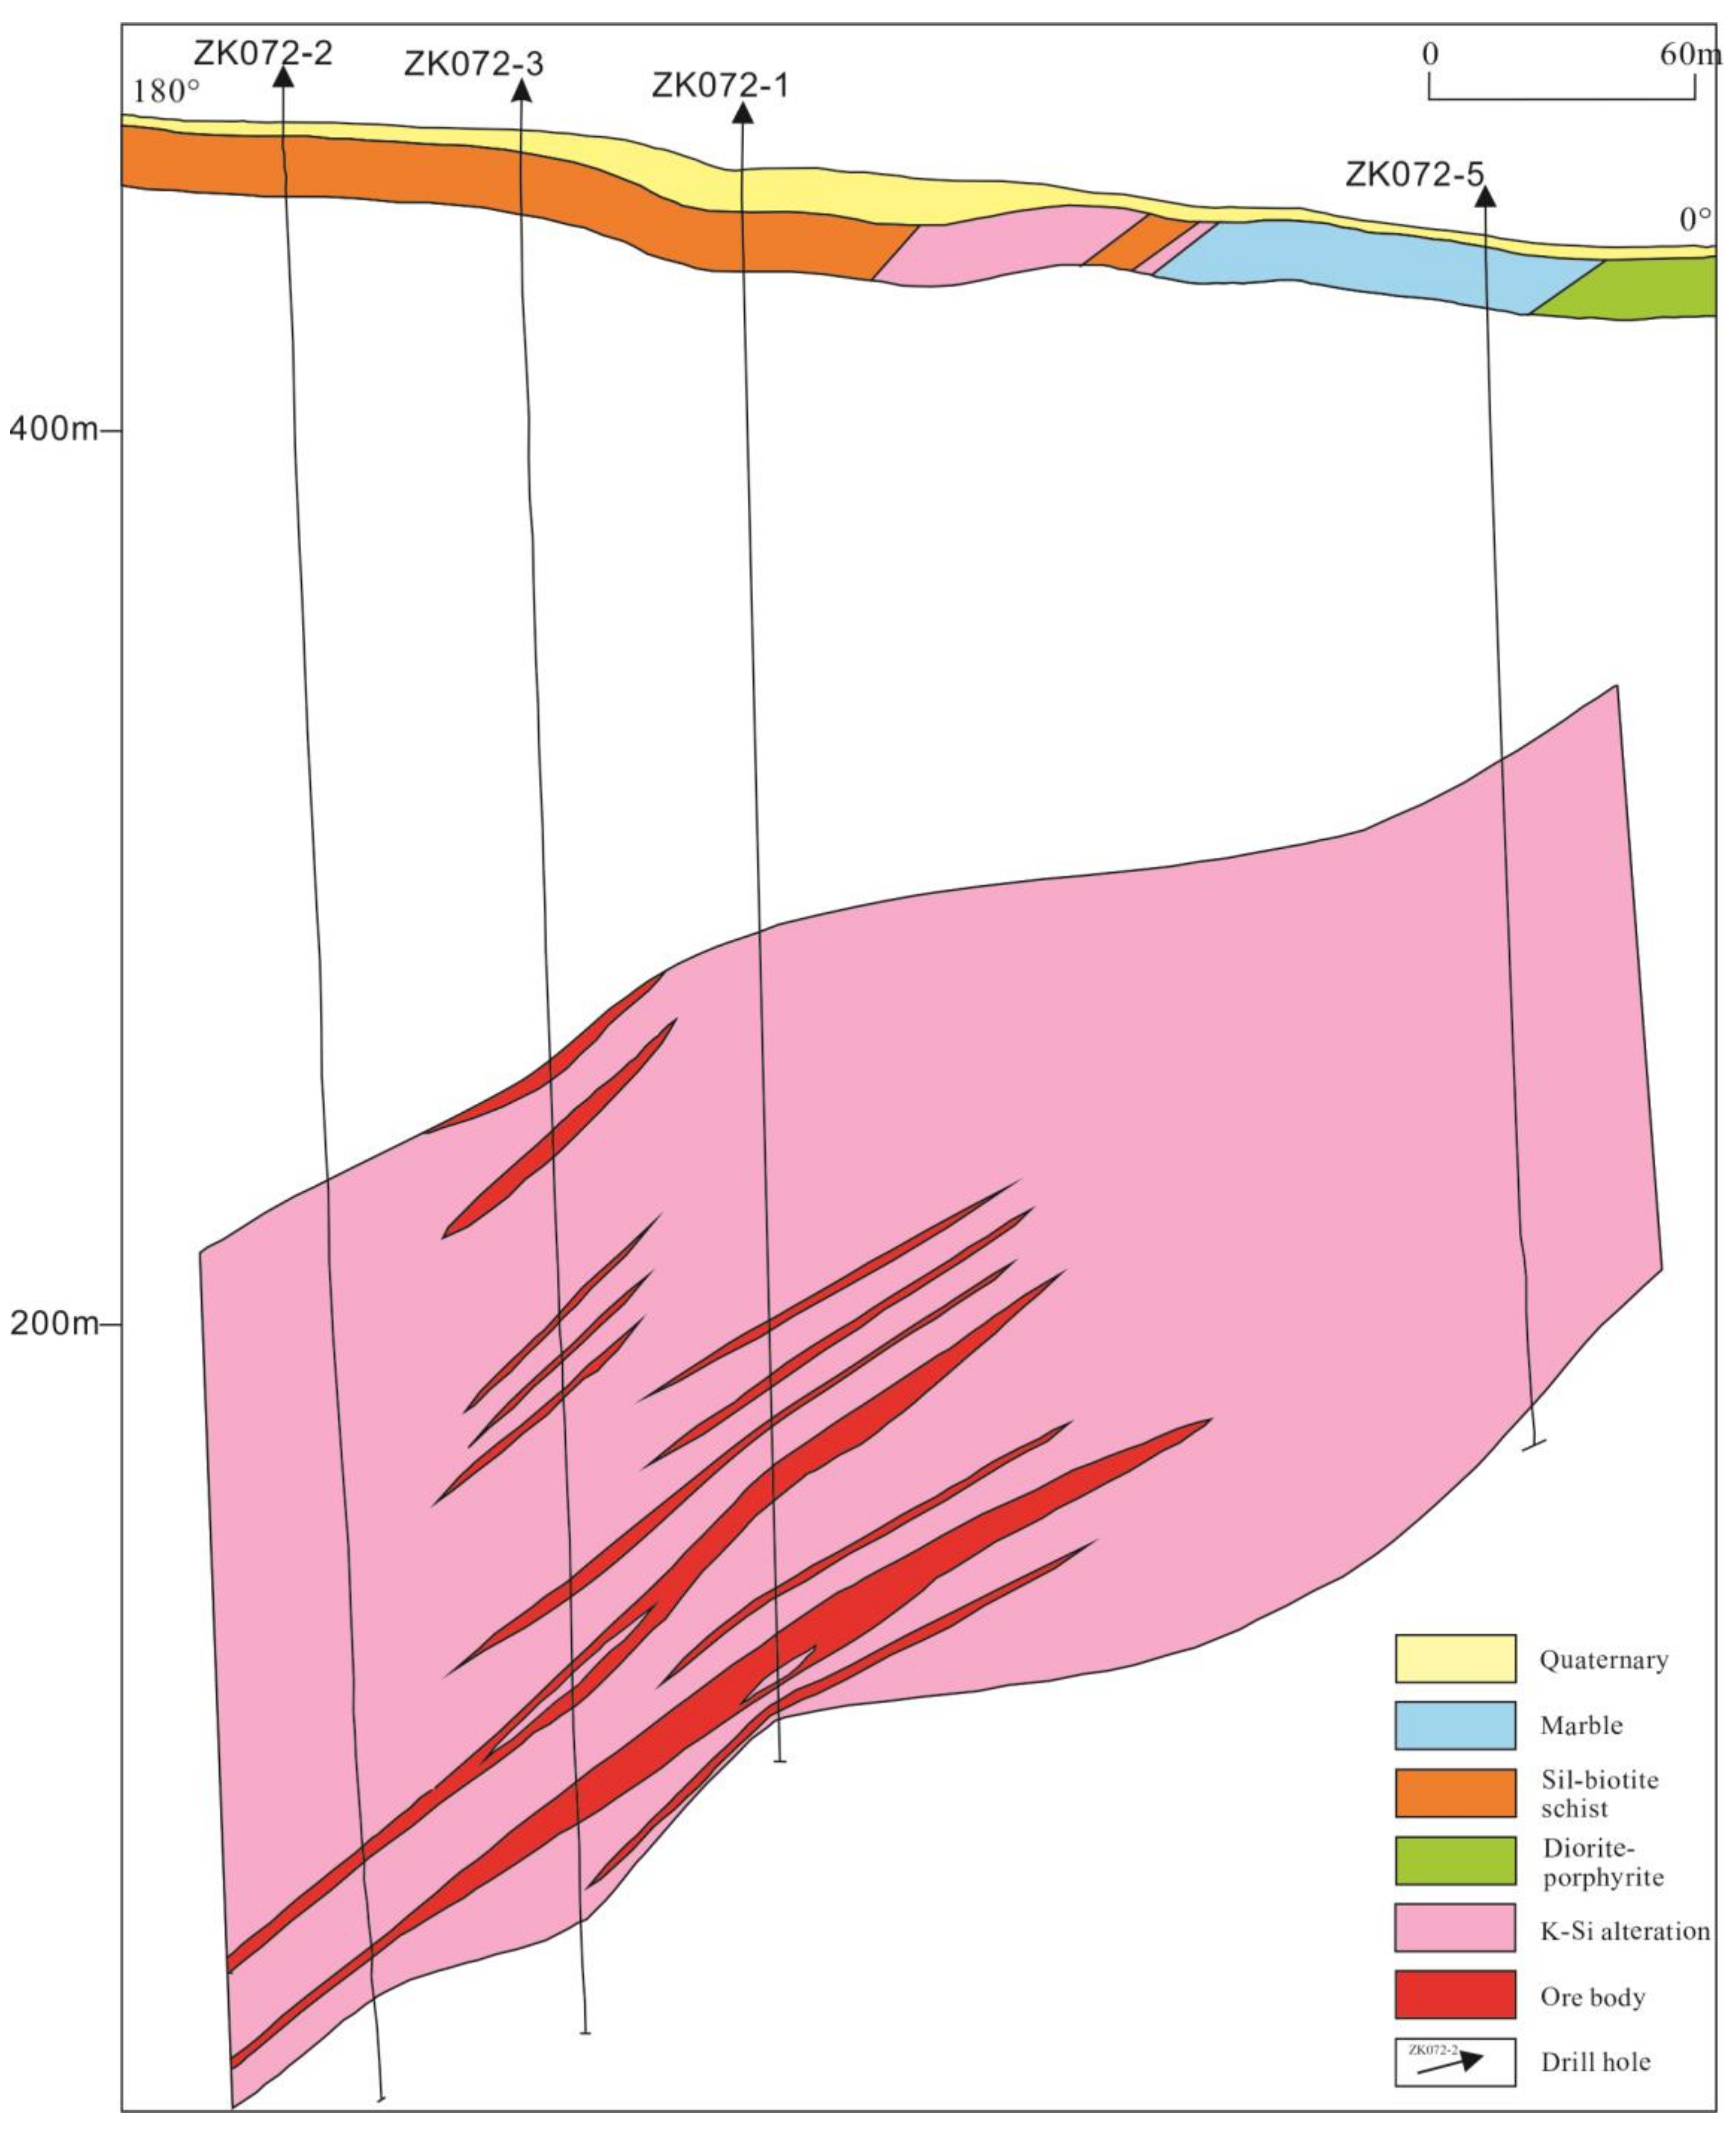
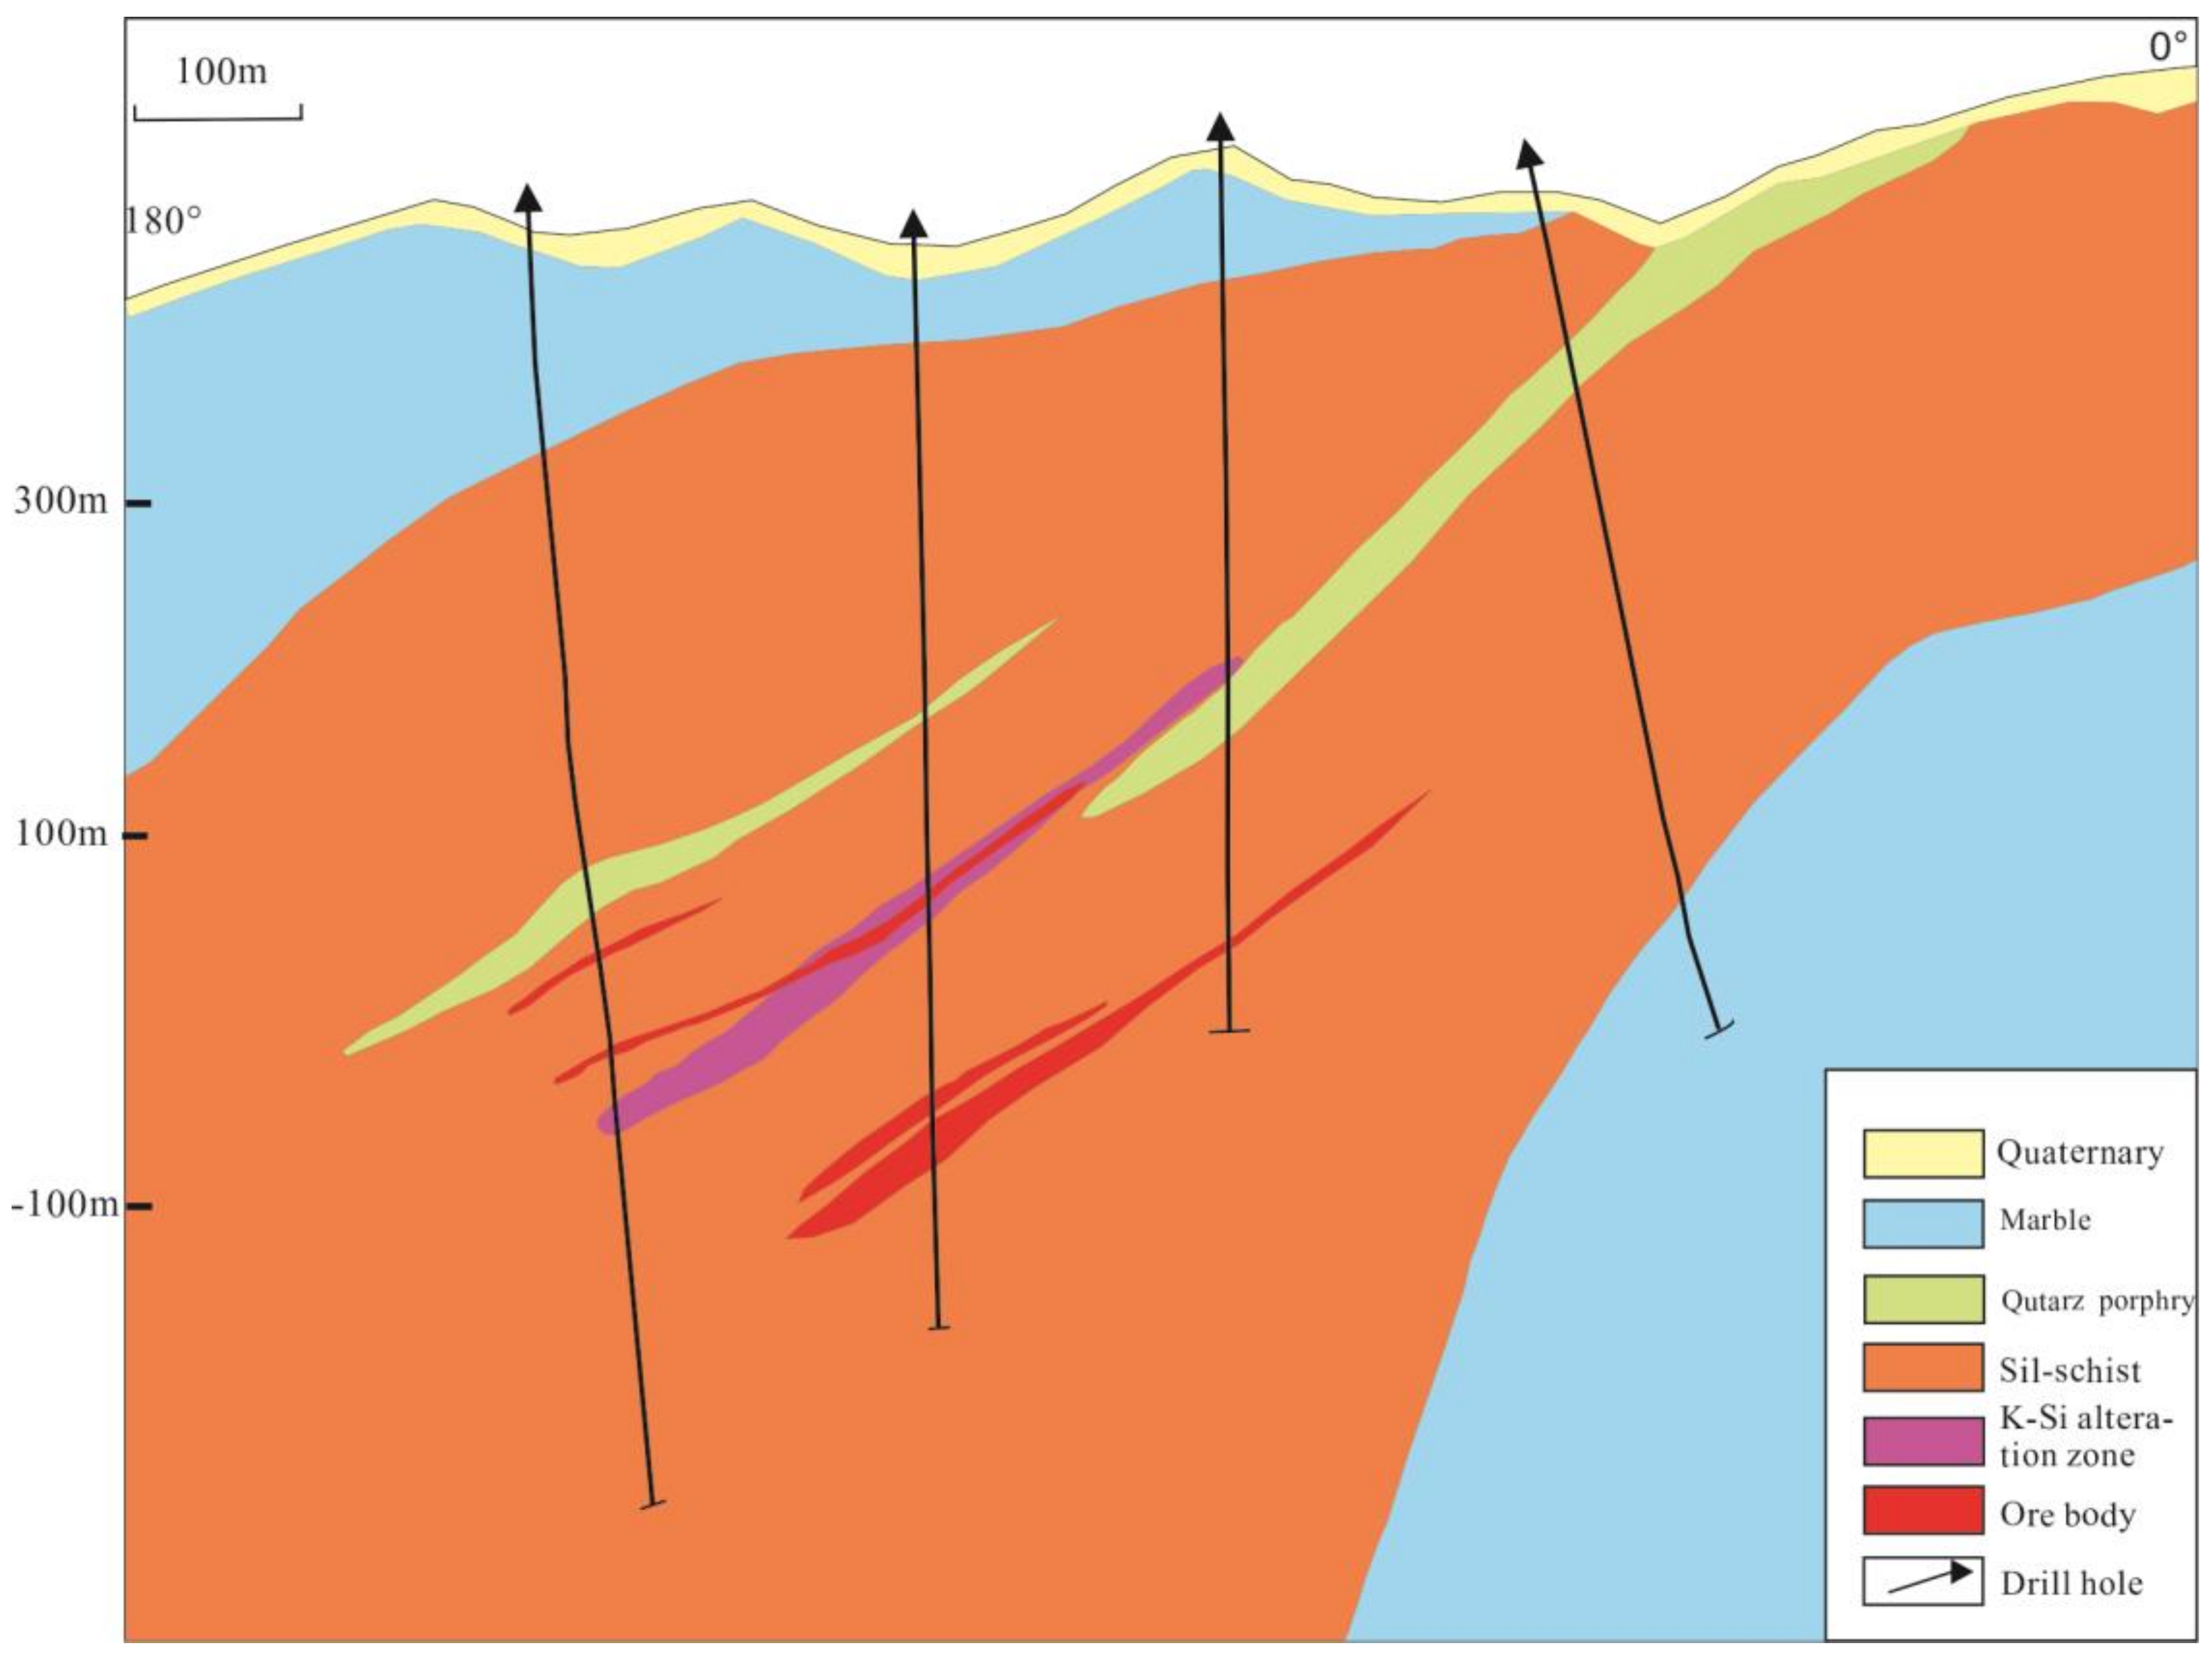
Lode 60 is the largest ore-body of the Baiyun deposit (the length is 1436m), is located in the east of the mining area and is EW trending. It is hosted by in the sillimanite-mica schist of the Gaixian Formation (
Figure 4) and its average Au grade is 3.32 g/t. Lode 2 is nearly E-W trending, more than 1000 m long and extends down over 600 m (
Figure 5). The mineralization type of Lode 2 is auriferous quartz veins controlled by fractures. The gold grade of Lode 2 ranges from 2.35 to 53.48 g/t. In the Baiyun gold deposit, relatively simple mineral assemblages have been recognized; and metallic minerals are dominated by pyrite, containing a small amount of pyrrhotite, chalcopyrite, galena and so forth.
Hydrothermal alteration is well developed, and the main alteration types include silicification, sulphidation, sericitization, potassic-alteration, chloritization and carbonatization. The widely distributed potassic-alteration (
Figure 6a) is mainly present as coarse-grained K-feldspar (
Figure 7a) and generally crosscut by quartz, pyrite and carbonate veinlets which formed in the late mineralization stage. Silicification is characterized by multiple phases, always coexisting with pyrite and other sulfide minerals (
Figure 6b,d,f). In the early stage, gray color quartz is presents as a disseminated structure (
Figure 6c,e). Milky color quartz occurs in veins or stockworks (
Figure 6d,e,g) at late stage. Veinlets of Carbonatization (
Figure 6c,h) occurred in the final stage of mineralization and pyrite is seldom found associated with it.
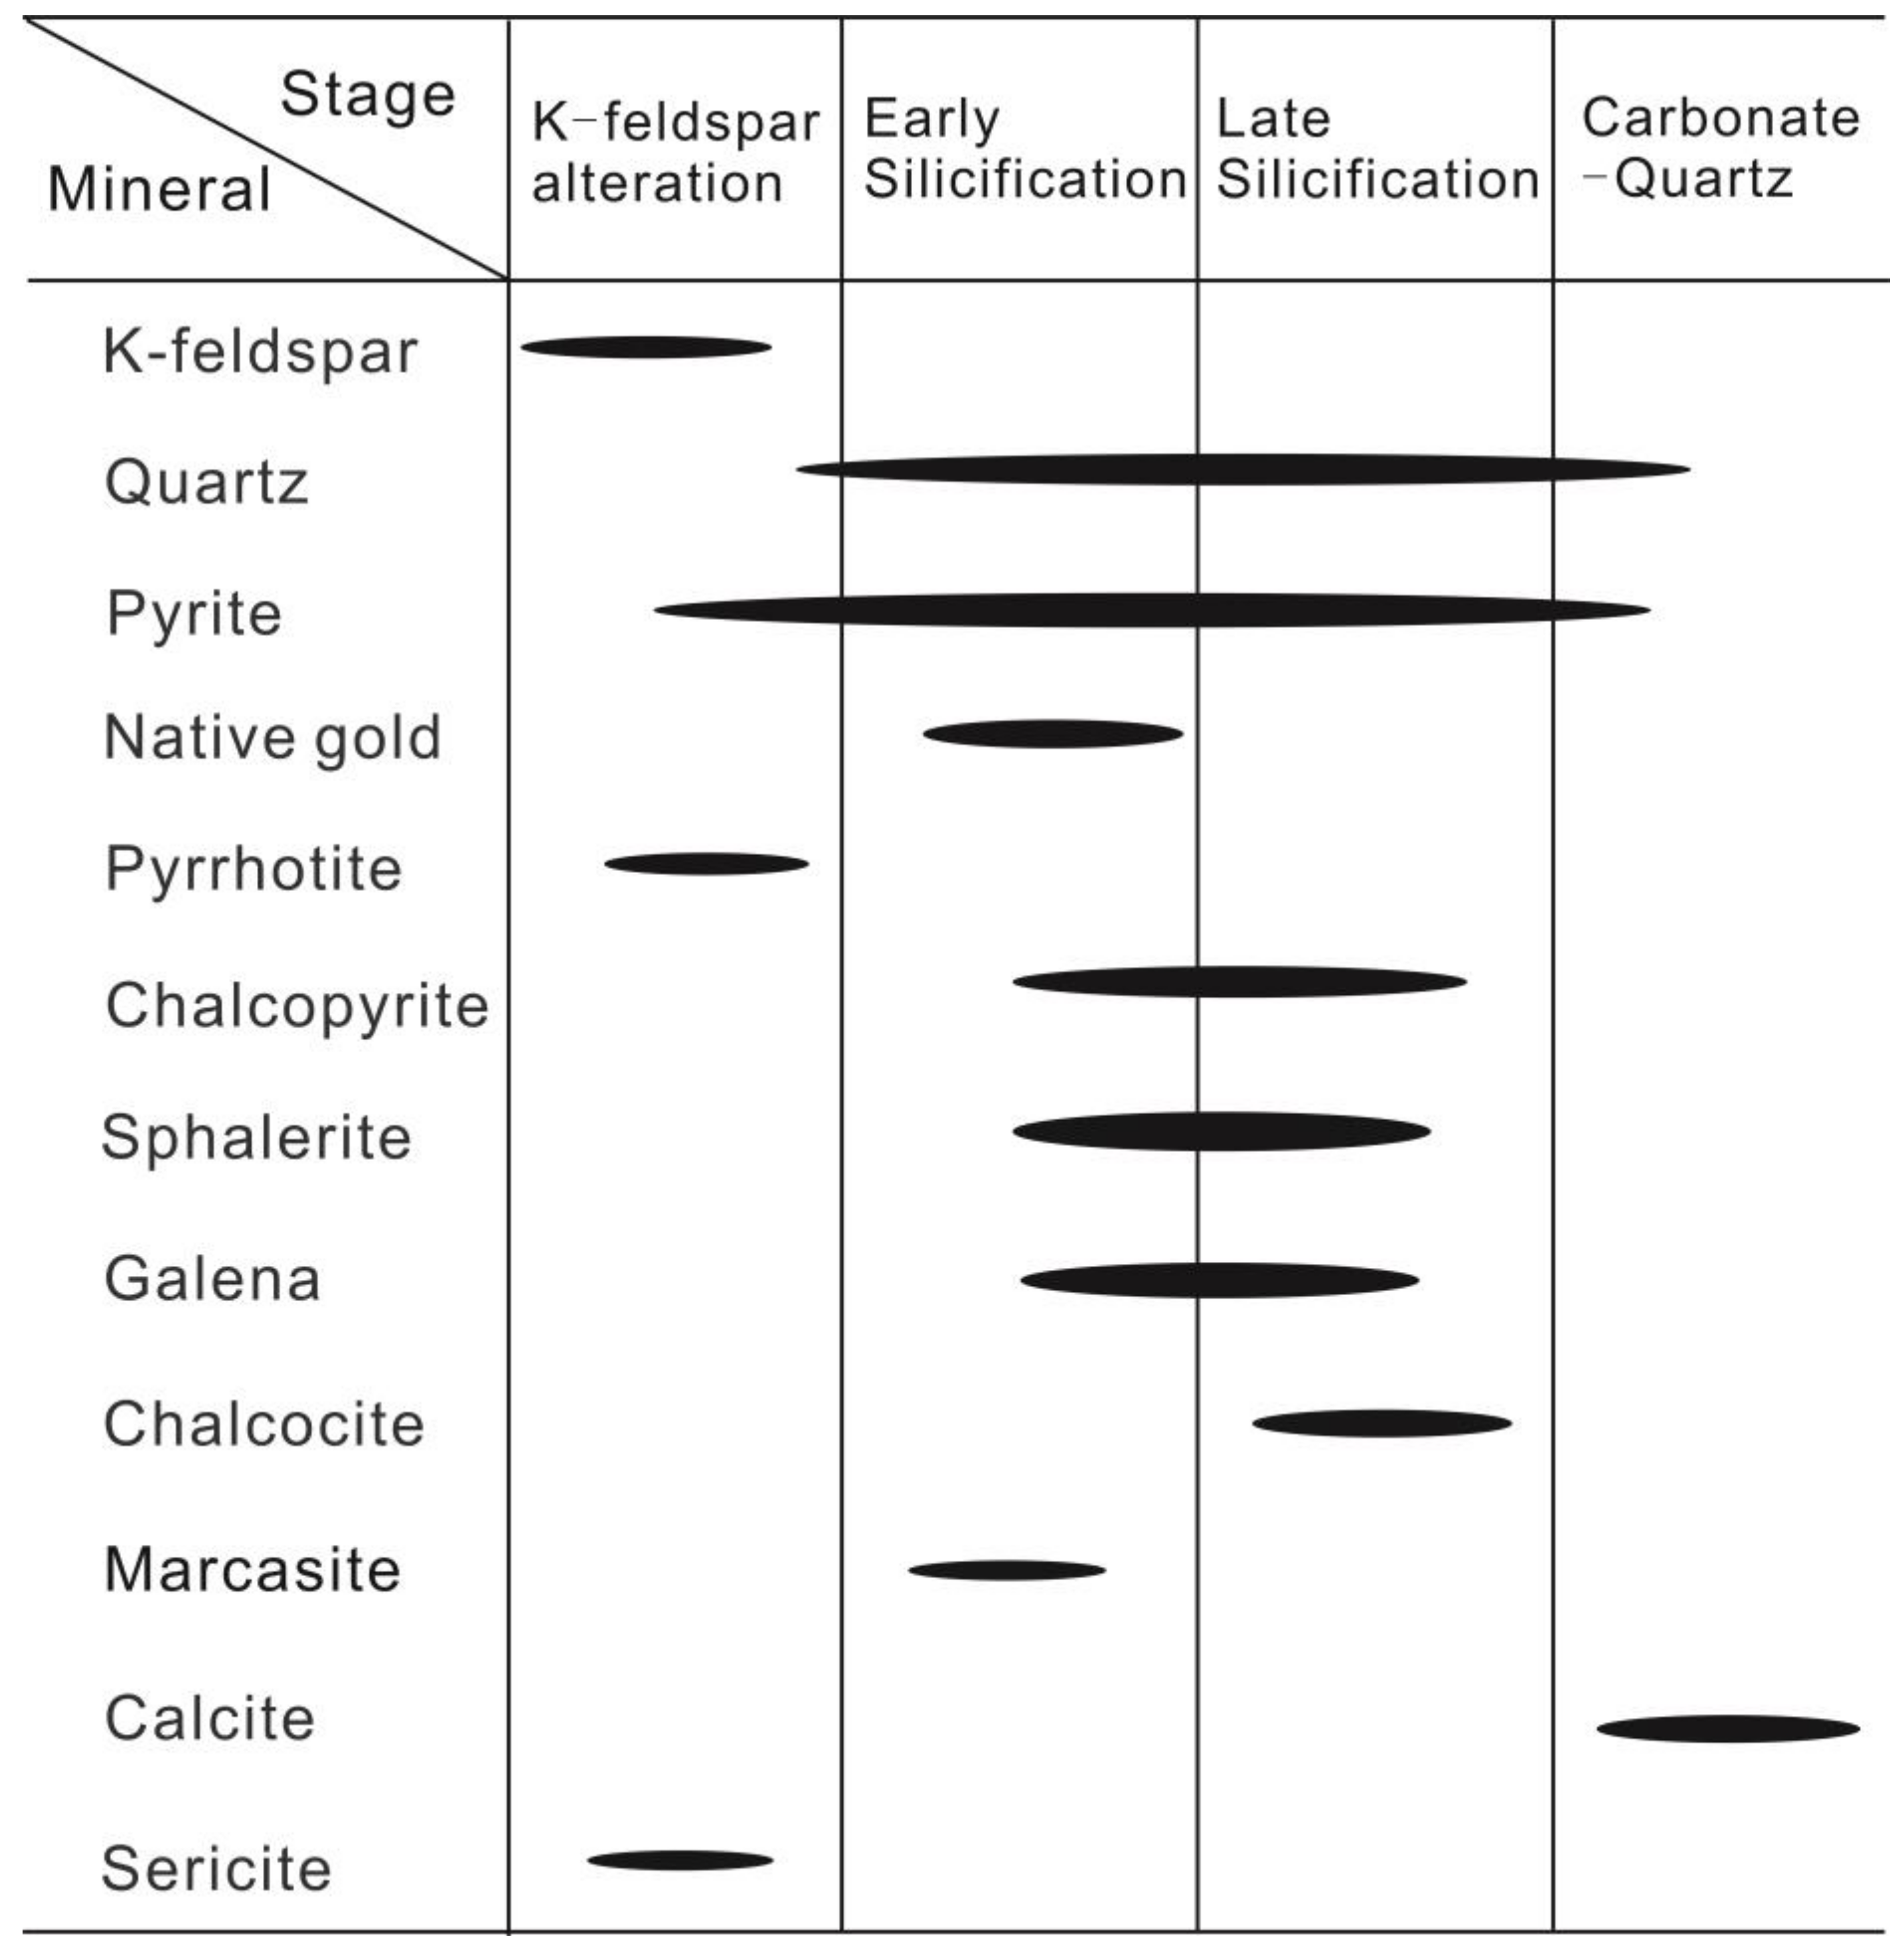
Four stages of mineral precipitation are recognized based on field and microscopic observations. Stage 1 (K-feldspar–pyrite) is represented by the pale red coarse-grained K-feldspar and small amounts of coarse-grained, euhedral to subhedral pyrite. Stage 2(Early Silicification) is marked by the gray quartz and polymetallic sulfide assemblage consisting of pyrite (with massive structure), chalcopyrite, galena and sphalerite. Milky quartz and abundant fine-grained pyrite characterize stage 3 (Late Silicification). The final stage (Stage 4; Carbonate-Quartz), with trace pyrite, is composed of centimeter-wide carbonate and quartz veins (
Figure 8). Stages 2 and 3 are the most critical in terms of gold deposition.
4. Sampling and Analytical Techniques
Thirty-five samples were collected from lode 60 and lode 2. The studied polished blocks and thin sections were initially examined by reflected and transmitted light microscopy to characterize the mineralogy, textures and paragenesis. Selected thin sections were nickel coated and investigated with an environmental scanning electron microscope (Leo145VP, with a resolution of 1 nm @ 20 kv, Oberkochen, Germany) equipped with an energy dispersive spectrometer (Inca Energy 300, Oxford Instruments, Oxford, UK), at the China University of Geosciences, Beijing, China.
Element analyses of sulfide in thin sections with Ni coating removed were conducted by LA-ICP-MS at Nanjing FocuMS Technology Co., Ltd using the method described by Gao et al. (2015) [
41]. A Teledyne Cetac Technologies Analyte Excite laser-ablation system (Bozeman, MT, USA) and Agilent Technologies 7700x quadrupole ICP-MS (Hachioji, Tokyo, Japan) were combined for the experiments. The 193 nm ArF excimer laser, homogenized by a set of beam delivery systems, was focused on sulfide surface with fluence of 4.0 J/cm
2. Each spot comprised “pre-ablation” (3–5 laser pulses with diameter of 80 μm) to remove contamination resulting from polishing. This material was flushed from the system (1.5 s) prior to ablation. The ablation protocol employed a spot diameter of 40 μm at 7 Hz repetition rate for 40 s (equating to 280 pulses). Helium was used as the carrier gas to efficiently transport the aerosol to the ICP-MS. Standard Reference Sulfides and USGS Basaltic Glasses (GSE-1G) were combined for external calibration. A total of 26 elements, including
49Ti,
51V,
52Cr,
55Mn,
56Fe,
59Co,
61Ni,
65Cu,
66Zn,
72Ge,
75As,
82Se,
85Rb,
88Sr,
95Mo,
109Ag,
115In,
118Sn,
121Sb,
126Te,
137Ba,
197Au,
202Hg,
205Tl,
208Pb and
209Bi, were monitored.
To allow quantification of multi-phase mineral assemblages, standardization was achieved via external calibration against United States Geological Survey (USGS) synthetic basaltic glass reference material GSE-1G, coupled with ablation yield correction via normalization to 100% total element abundance [
42], performed on a spot-by-spot basis. To extend the calibration to S, which is not present in GSE-1G, surrogate calibration was applied using S/Fe sensitivity ratios determined by ablation of pure pyrrhotite. The sensitivity factor (k[S/Fe]) of Fe in pure pyrrhotite relative to S was taken as the “bridge.” The sensitivity factor (k[Fe/X]) of element X of interest in GSE-1G relative to Fe, was converted into sensitivity factor k[S/X] of element relative to S. The calculation process is as follows:
, where I is net signal intensity, C refers to concentration. The converted relative sensitivity factor is then substituted into next formula (
, where i refers to analytical element and j refers to jth analytical element). According to the algorithms, software was developed to calculate concentrations via external standardization and internal normalization to 100%. The external standard was analyzed once every 7 unknown spots. This method can be used to calculate concentrations but will be strongly influenced by matrix effects, especially when using a glass reference material for the analysis of sulfide minerals, so the results are semi-quantitative. Nevertheless, differences in concentration of trace elements in the different pyrite generations are large enough to be observed with this semi-quantitative method.
5. Results
5.1. Pyrite Morphology
Pyrite is the predominant sulfide in the mineralization stages. Visual examination and petrographic observations show three types of pyrite, marked by distinct morphology, textures and paragenesis (
Figure 9). The first type (Py1) is present as a single particle or a small mass dispersed in the K-feldspar altered zone (or bleached zone), consisting of coarse-grained, euhedral to subhedral crystals with a cubic form and it is 100 μm to 2 mm (generally between 200 μm and 500 μm) in diameter. Some grains have micro-fractures and porous texture filled with quartz (
Figure 9a) or other sulfide minerals. The second type of pyrite (Py2) occurs as aggregate masses, veins or stockworks generally associated with gray quartz. Py2 (mostly 500–1500 μm) is anhedral to subhedral and grows with chalcopyrite, galena and sphalerite. Many grains contain abundant micro-fractures that are usually filled with other sulfide minerals or native gold (
Figure 9c,d). In addition, some inclusions of native gold can be found in Py2 (
Figure 9b). Py3, commonly intergrown with tellurides (
Figure 10c), is characterized by euhedral crystals with 0.05–1 mm in diameter and fine-grained with some inclusions of native gold (
Figure 9f). These three generations of pyrite broadly match with the first three metallogenic stages (
Figure 6 and
Figure 9).
5.2. LA-ICP-MS Profile Characteristics for Pyrite from Baiyun
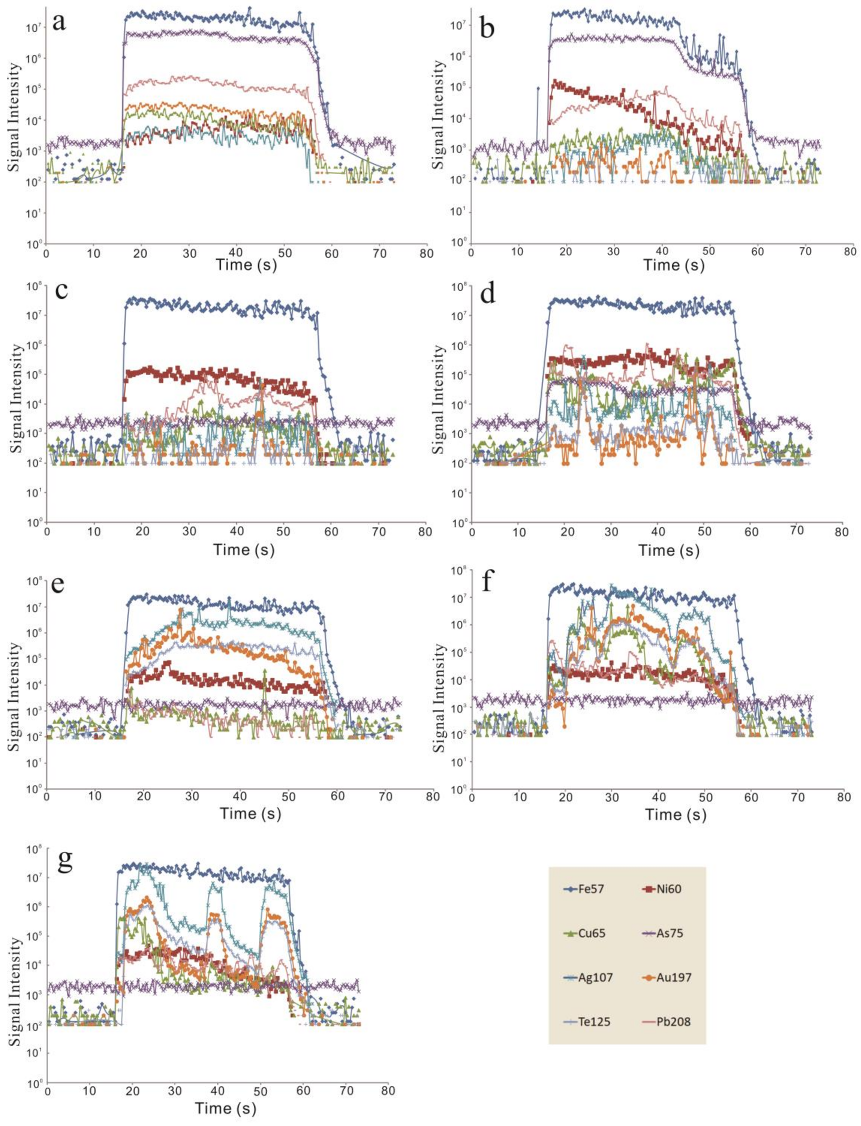
LA-ICP-MS depth profiles for Au, Ag, Te, Cu, Pb and As are generally irregular, suggesting the presence of inclusions in the ablated material; several representative depth profiles from the three stages are illustrated in
Figure 11. The spot on the Py1 with fewer micro-fractures shows smooth spectra of elements and the signal intensity of Au is higher than background values by two orders of magnitude (
Figure 11a). Smooth spectra of elements in the depth profile indicate that elements are very finely distributed if not lattice-bound then at least distributed homogeneously or distributed nanoparticles no more than a few tens of nanometers in size [
6,
16]. Thus, invisible gold in this spot analysis exists homogeneously or as nanoscale inclusions. The spot on the Py1 grains with more micro-fractures yields Au and Ag comparable to respective background values (
Figure 11b). Tellurium intensities are nearly consistent with background in both cases. The ablation signals, away from micro-fractures in Py2, yield spiky depth-concentration profiles for Au and Ag with signal intensities much higher than the background (
Figure 11c). The ratio between Au and Ag is close to unity, so the results are well explained by the presence of submicron inclusions of electrum in Py2 [
10]. Other spots close to micro-fractures in Py2 show that the Te spectra mirror those of Au and Ag with high signal intensities (
Figure 11d). It indicates that there are submicron inclusions of Au–Ag–Te minerals in Py2. From the Au-Ag-Te signal intensities of Py3, it can be seen that the concentration of the three elements are much higher than Py1 and Py2 by several orders of magnitude. According to the characterization of Py3 spectra, these three elements exist as homogeneously/nanoscale-inclusions (
Figure 11e); or some spiky depth-concentration profiles indicate that there are submicron inclusions of Au–Ag–Te minerals (
Figure 11f,g).
In Py1, Cu is uniformly distributed in the lattice of pyrite due to the smooth spectra of Cu that mirror Fe (
Figure 11a,b). In Py3, the rugged Cu spectra are much higher than the background and reveal the presence of submicron inclusions of Cu and it has the same trend as the variation in the Au spectra, implying close relationships with the migration of Au. The spectra of Pb have similar characteristics as the Cu spectra. In all spots, the smooth spectra of Ni reveal that nickel is easily incorporated into the pyrite crystal lattice (
Figure 11).
5.3. Correlation Trends of Semi-Quantitative Value
The trace element geochemistry of the various pyrite types was performed by LA-ICP-MS for 81 points of 12 representative samples. These data are given in
Table 1. The other elements (Ti, V, Cr, Mn, Zn, Ge, Rb, Sr, Mo, In, Sn, Ba, Hg, Tl) are not tabulated here because of their contents are so low, often at or below the minimum detection limits (MDL). Iron, as the major element of pyrite, has a small change in content relative to its high content, so it is not listed in the table.
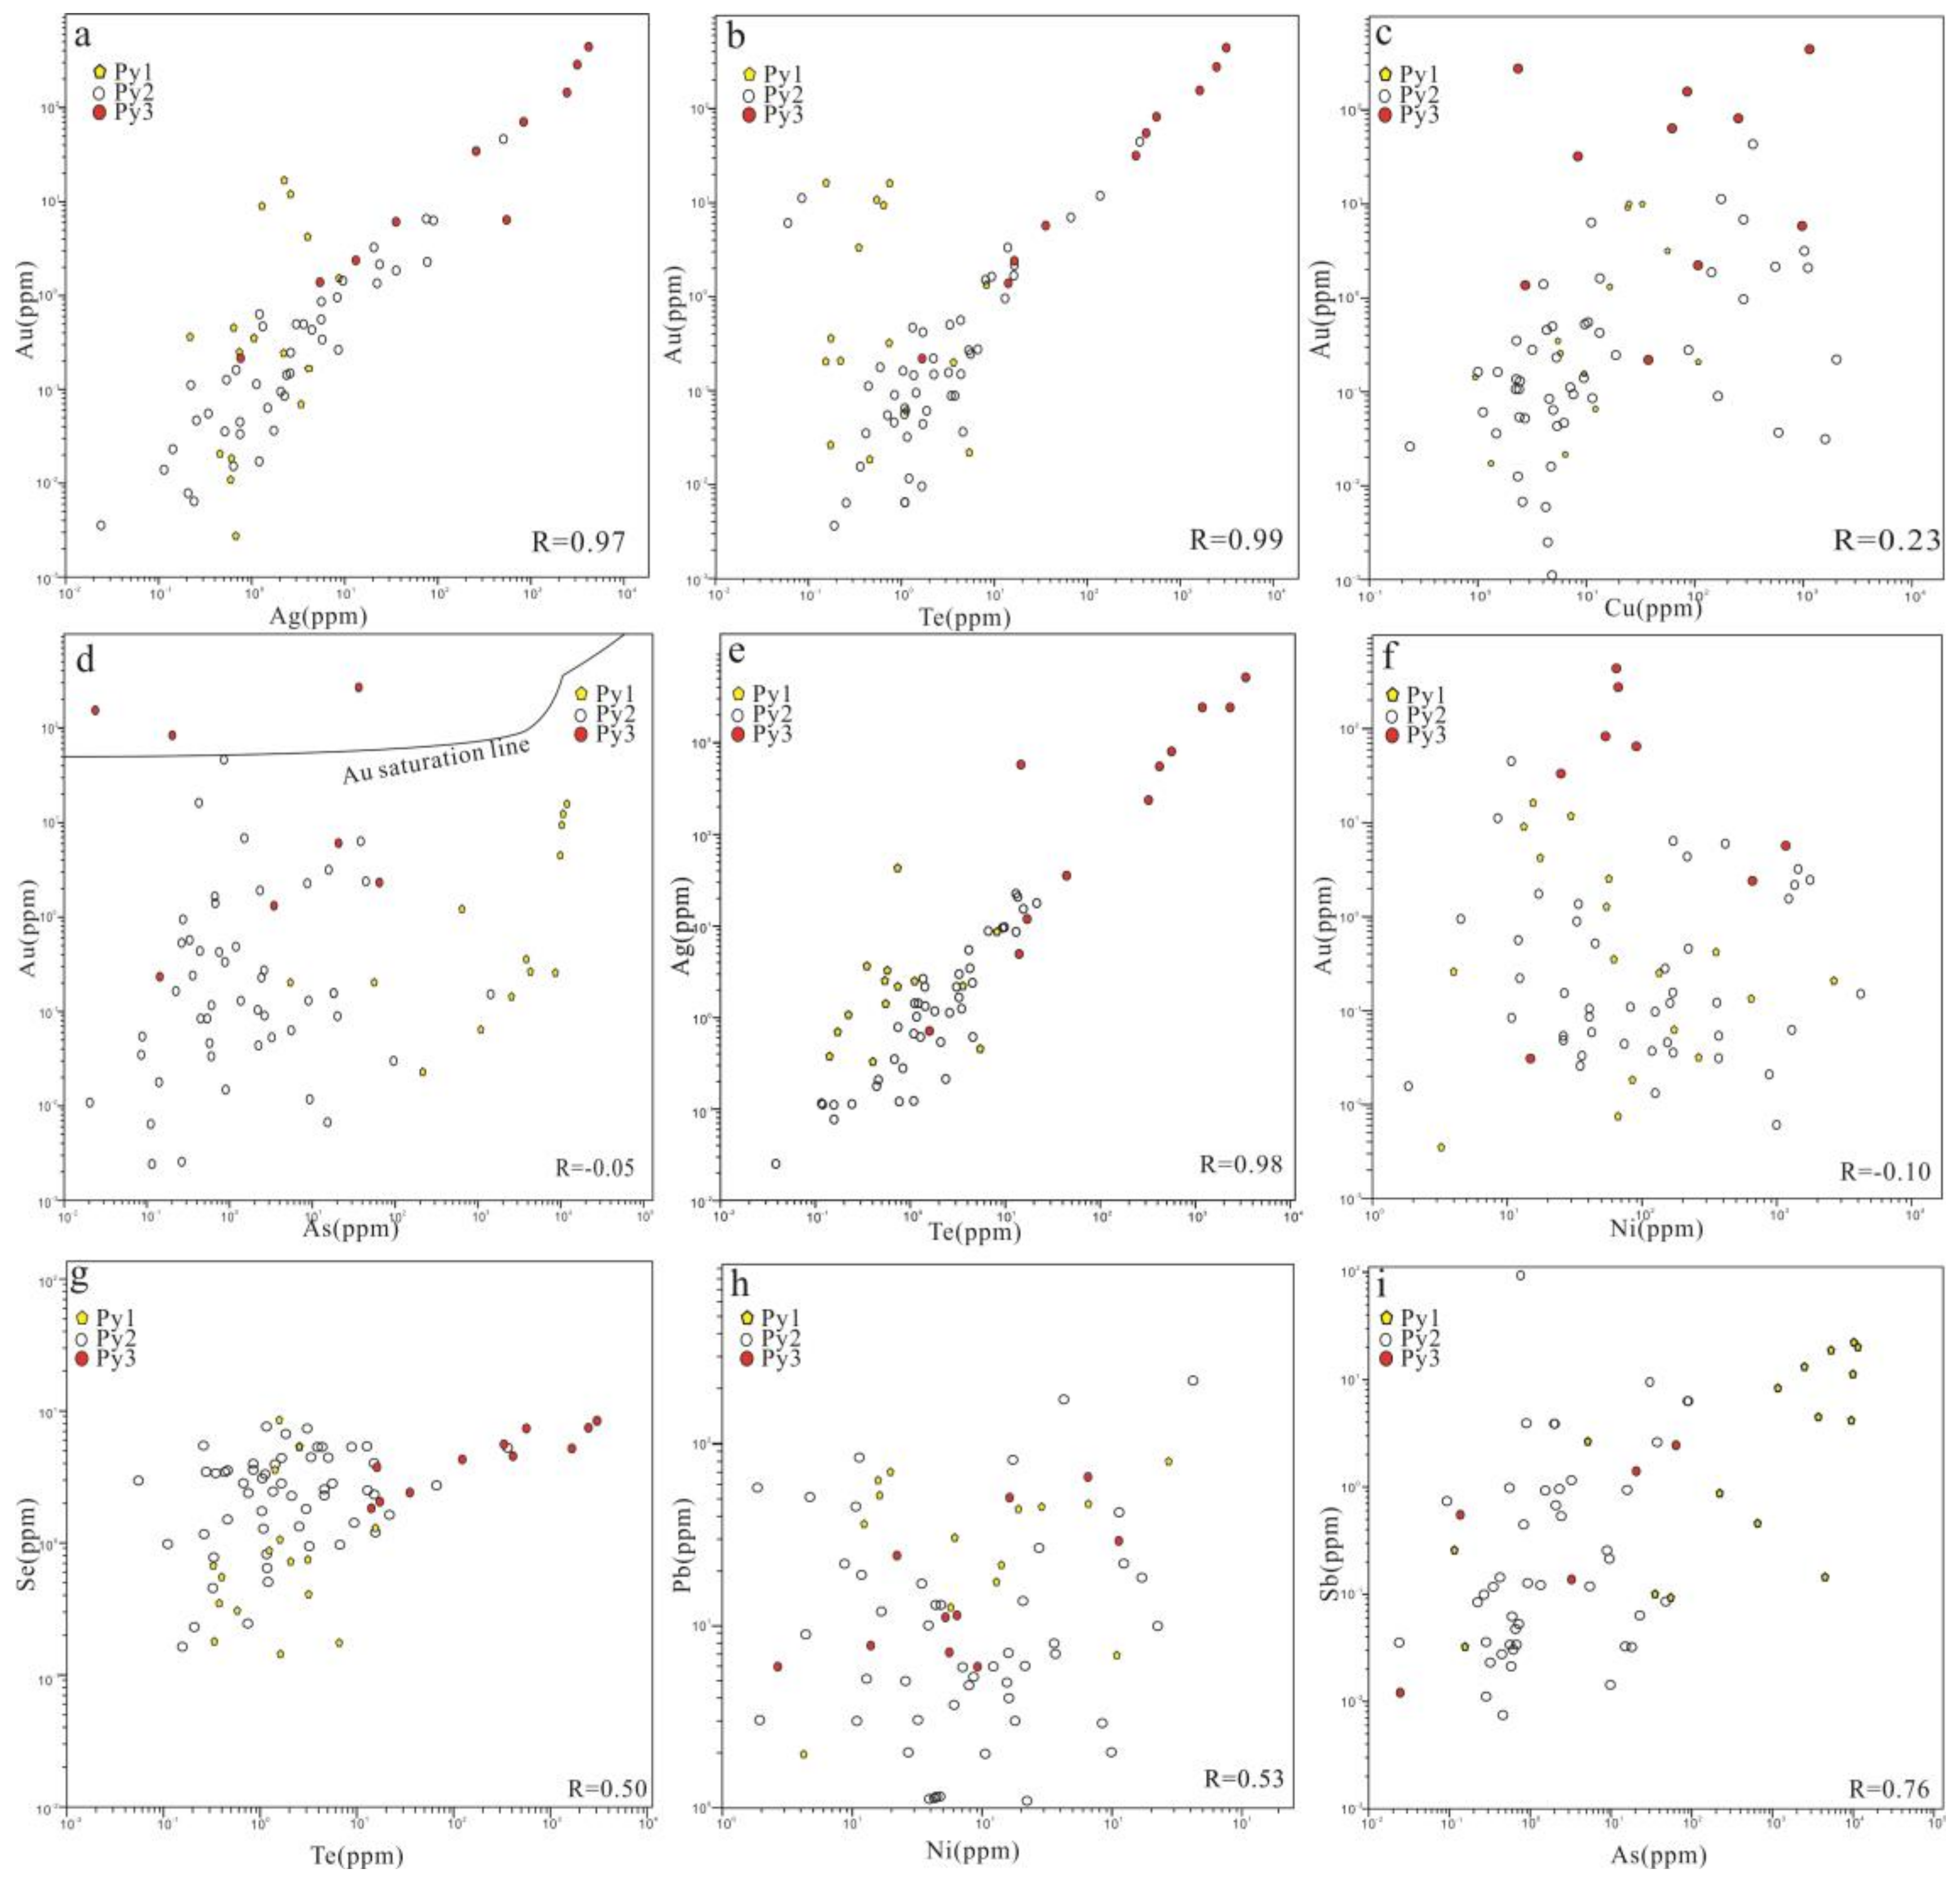
Each sample describes a specific range of gold concentrations; however, each distribution is a function of our choice of locations for each analytical spot; hence no mean analyses are calculated. Absolute concentrations of gold vary over several orders of magnitude in each sample; they can attain as much as 432 ppm at maximum. The invisible gold content in Py1 is relatively low (generally less than 10.7 ppm,
Table 1) but there is a positive correlation between Au and As in this stage (
Figure 12d). The content of arsenic of this stage is very high reaching 11,541 ppm, compared to Ag and Te (less than 10 ppm). The invisible gold content in Py2 varies from undetectable to 44 ppm. Silver content has a strong positive correlation with Au, ranging from less than 1 ppm to 521 ppm. Compared to Py1, the contents of Te in Py2 are higher (maximum 384 ppm, mean 13.5 ppm). Furthermore, Te has the highest content in py3 (maximum 3034 ppm; mean 876), meanwhile invisible gold and silver contents also increase significantly. Au-Ag-Te shows a strong positive correlation in this stage (
Table 2;
Figure 12a,b,e). The latter two kinds of pyrite are almost free of arsenic (generally undetectable or only a few ppm).
The Cu content exhibits large variation from levels at or below the detection limit to several hundreds or thousands of ppm. Compared with Py2 and Py3, the content of Cu in Py1 is minimal. Copper in Py3 shows relatively positive correlation with Au (Table2;
Figure 12c).
The data for correlation coefficients calculation was derived from table 1. If the value of the element is less than the minimum detection limit, it was assigned a value of 50% of the corresponding MDL value. Data given in bold are those coefficients that indicate positive correlation.
Transition metals, such as Co and Ni, have concentrations on the order of thousands ppm to less than 1ppm and vary markedly from sample to sample (
Table 1;
Figure 12f). There is no correlation between Au and Co or Ni (
Table 2).
5.4. Telluride Assemblages
In this study, a large number of tellurides have been recognized under the optical microscope and SEM-EDS (
Figure 10), including petzite, calaverite and hessite. Notably, tellurides are produced in the fissures of Py2, adjacent to Py3 or hosted in quartz (milky quartz vein) but seldom native tellurium. Chalcopyrite is the only sulfide coexisting with tellurides. Tellurides formation was later than Py3 (
Figure 10c) and formation of calaverite is earlier than petzite and hessite (
Figure 10a,b). This shows the interpenetration between these minerals. Tellurides show a close relationship with native gold (
Figure 10d).
6. Discussion
6.1. Gold Distribution in Pyrite
6.1.1. Invisible Gold
This study indicates that both invisible and visible gold are hosted in pyrite.
Py1 has the lowest Au concentrations with less than 0.5 ppm. However, three analyzed points in Py1 grains that contain fewer micro-fractures have higher levels of gold (up to 10.7 ppm Au) and arsenic. The element diagram of Au and As suggests that gold in Py1 exists in solid solution. Depth profiles of Py1 (
Figure 11a,b) show smooth gold signal intensities that mirror As, indicating gold occurs as homogeneously or nanoscale-inclusions in Py1 grains [
15,
16]. Comparing the well-preserved grains in Py1, gold may be initially enriched in arsenic-rich pyrite in the early mineralization stage and then removed from pyrite grains during the later hydrothermal stage.
Py2 contains a little invisible Au with a positive relationship of Ag and Te, which was revealed by LA-ICP-MS. As depth profiles (
Figure 11a,b) and correlation diagrams (
Figure 12 a–e) illustrate, in Py2, Au may presents as submicron inclusions of electrum or Au-Ag-tellurides. Instead, the fine-grained Py3, intergrown with tellurides, contains high concentrations of invisible gold. The depth profiles show a positive relationship between Au and Te, Ag, (
Figure 11a,b,e). In Py2 and Py3, arsenic is relatively low while native gold is relatively high, so the Baiyun gold deposit was mainly controlled by Te rather than As. Previous studies have proposed two models for similar situations. Tellurium raises the apparent coefficient of Au distribution “mineral-solution” acting as a gold “precipitant,” whereas As and Se favor an increase of gold content in the fluid phase acting as “gold-guide” elements [
44]. The other one is Au can be efficiently scavenged by Te [
10]. However, the exact mechanism remains controversial, Cabri et al. (2000) [
45] considered that Te distorts the S site in a similar way as the As dianion does, thus allowing Au into the Fe site independent of the As content and others consider that substitution of As for S at the growth surface promotes substitution of Au
+ into As-pyrite [
6,
12]. Similarly characterized gold deposits are also recognized in NCC, such as the Dongping tellurium-gold deposit, the Yangzhaiyu As-free gold deposit and the Guilaizhuang tellurium-gold deposit [
14,
16,
46].
6.1.2. Visible gold
Visible gold is recognized in Py2 and Py3, occurring as inclusions ranging from 5 to 100 μm or stringers along the micro-fractures and crystal boundaries extending for 50–150 μm (
Figure 9b–d). Gold grains contain 78.8–85.2 wt. % Au and 28.5–10.3 wt. % Ag (The Bureau of Non-Ferrous Geology of Liaoning Province 103 Team, 2010). Native gold in Py2 grains is particularly related to micro-fractures of pyrite (
Figure 9d), suggesting that native gold may have resulted from mobilization of preexisting invisible gold in the structure of Py2 grains [
14,
16,
47,
48,
49,
50,
51]. However, native gold in Py3 generally is founds as inclusions in the host pyrite. Combined with Py3 are mostly euhedral grains without fractures, we could indicate that Au precipitated directly from the late stage fluid.
Rough mass balance calculation are based on Grant’s approach [
52], using Sb as the immobile element:
, where δC refers to the concentration of gain or loss, CPy2 and CPy3 are the concentration in the Py2 and Py3, respectively. The results show that 91.6% of Au and 81.4% of Te in Py3 were added by the late ore-forming fluid.
6.2. Conditions of Telluride Formation
Based on SEM and LA-ICP-MS analysis, it was found that Te and telluride were absent in Py1 and Py2. It is predicted that there are not easily formed under conditions of high sulfur fugacity, that is, a large amount of sulfide precipitation. Similar phenomena have also been found in other tellurium-gold deposits in NCC [
19,
46,
53]. Another possibility is the loss of telluride due to the lack of Te in the early ore-forming fluid. Through rough mass balance calculation, Te, Au and Ag are generally enriched in Py3, indicating that the late ore-forming fluid is rich in Te. However, no tellurides were found in Py3 under both the optical microscope and SEM. Subsequently, LA-ICP-MS depth profiles showed that the Te-Au-Ag phase was present in Py3 as submicron inclusions.
Based on the above analysis, we propose that the tellurides in the Baiyun deposit were likely precipitated in two stages under two distinctly metallogenic conditions. In the first stage, the invisible gold-Telluride formed synchronously with Py3 under conditions of high sulfur fugacity. The second stage is the formation of a visible gold-telluride after stage 3. In Stage3, calaverite, petzite, hessite were found, with less sulfide. Only a small amount of chalcopyrite was found in the telluride phase (
Figure 10). We analyzed crystallization of these tellurides at low
fS
2 and/or high
fTe
2 conditions. Based on these results, we put forward two hypotheses. First, the precipitation of a large amount of sulfide (mainly pyrite) consumes most of the sulfur budget, resulting in a decrease in
fS
2, which increases the
fTe
2/
fS
2 ratio. Another mechanism may be the addition of a large number of Te-rich fluids from an external source into the ore-forming fluid. It is also possible that these two mechanisms work together but in the Baiyun gold deposit we prefer the latter.
Constraining the ore-forming fluid
fTe
2 and
fS
2 values of precipitated tellurides is based on Py3 and telluride combinations, combined with gold-bearing quartz vein fluid inclusion data. Microthermometry of fluid inclusions in auriferous quartz veins constrains the principal mineralization stage at 240–310 °C [
21]. This paper uses the following method to calculate thermodynamic data of sulfides and tellurides and chooses 270 °C (543.15 k) as the temperature of telluride deposition.
Knowledge of the Gibbs free energy (
. KJ/mol) of each reactant and product at a given temperature is required for the fugacity calculation. Given an equilibrium reaction, the Gibbs free energy of the reaction is computed to derive
, where K is the equilibrium constant, R refers to the gas constant, 0.008314 kJ/mol K and T the temperature in Kelvin. Assuming that the solid phase medium is pure, the equilibrium constant will be a function that varies with temperature. Thus, we obtain the fugacity of the reaction: logF = lnK/−2.303. Since the volume change of the surrounding solid mineral is very small, previous fluid inclusions studies have speculated that the pressure during formation of the Baiyun deposit is 15.6 MPa (calculated by the data of [
21]) and any pressure correction is negligible. Here we subdivided the mineral equilibria into univariate and bivariate subsystems for fugacity calculations. In univariate systems, the fugacity of the gaseous components in a given reaction can be calculated from the above theoretical models (
Table 3). Only one reaction of bivariate subsystems had been calculated due to simple telluride assemblages (Ag
2Te + 0.5S
2(g) = Ag
2S + 0.5Te
2(g); lnk = −3.92; log
fTe
2(g) = log
fS
2(g) − 3.40). Petzite formation cannot be obtained, as thermodynamic data of this mineral is not available.
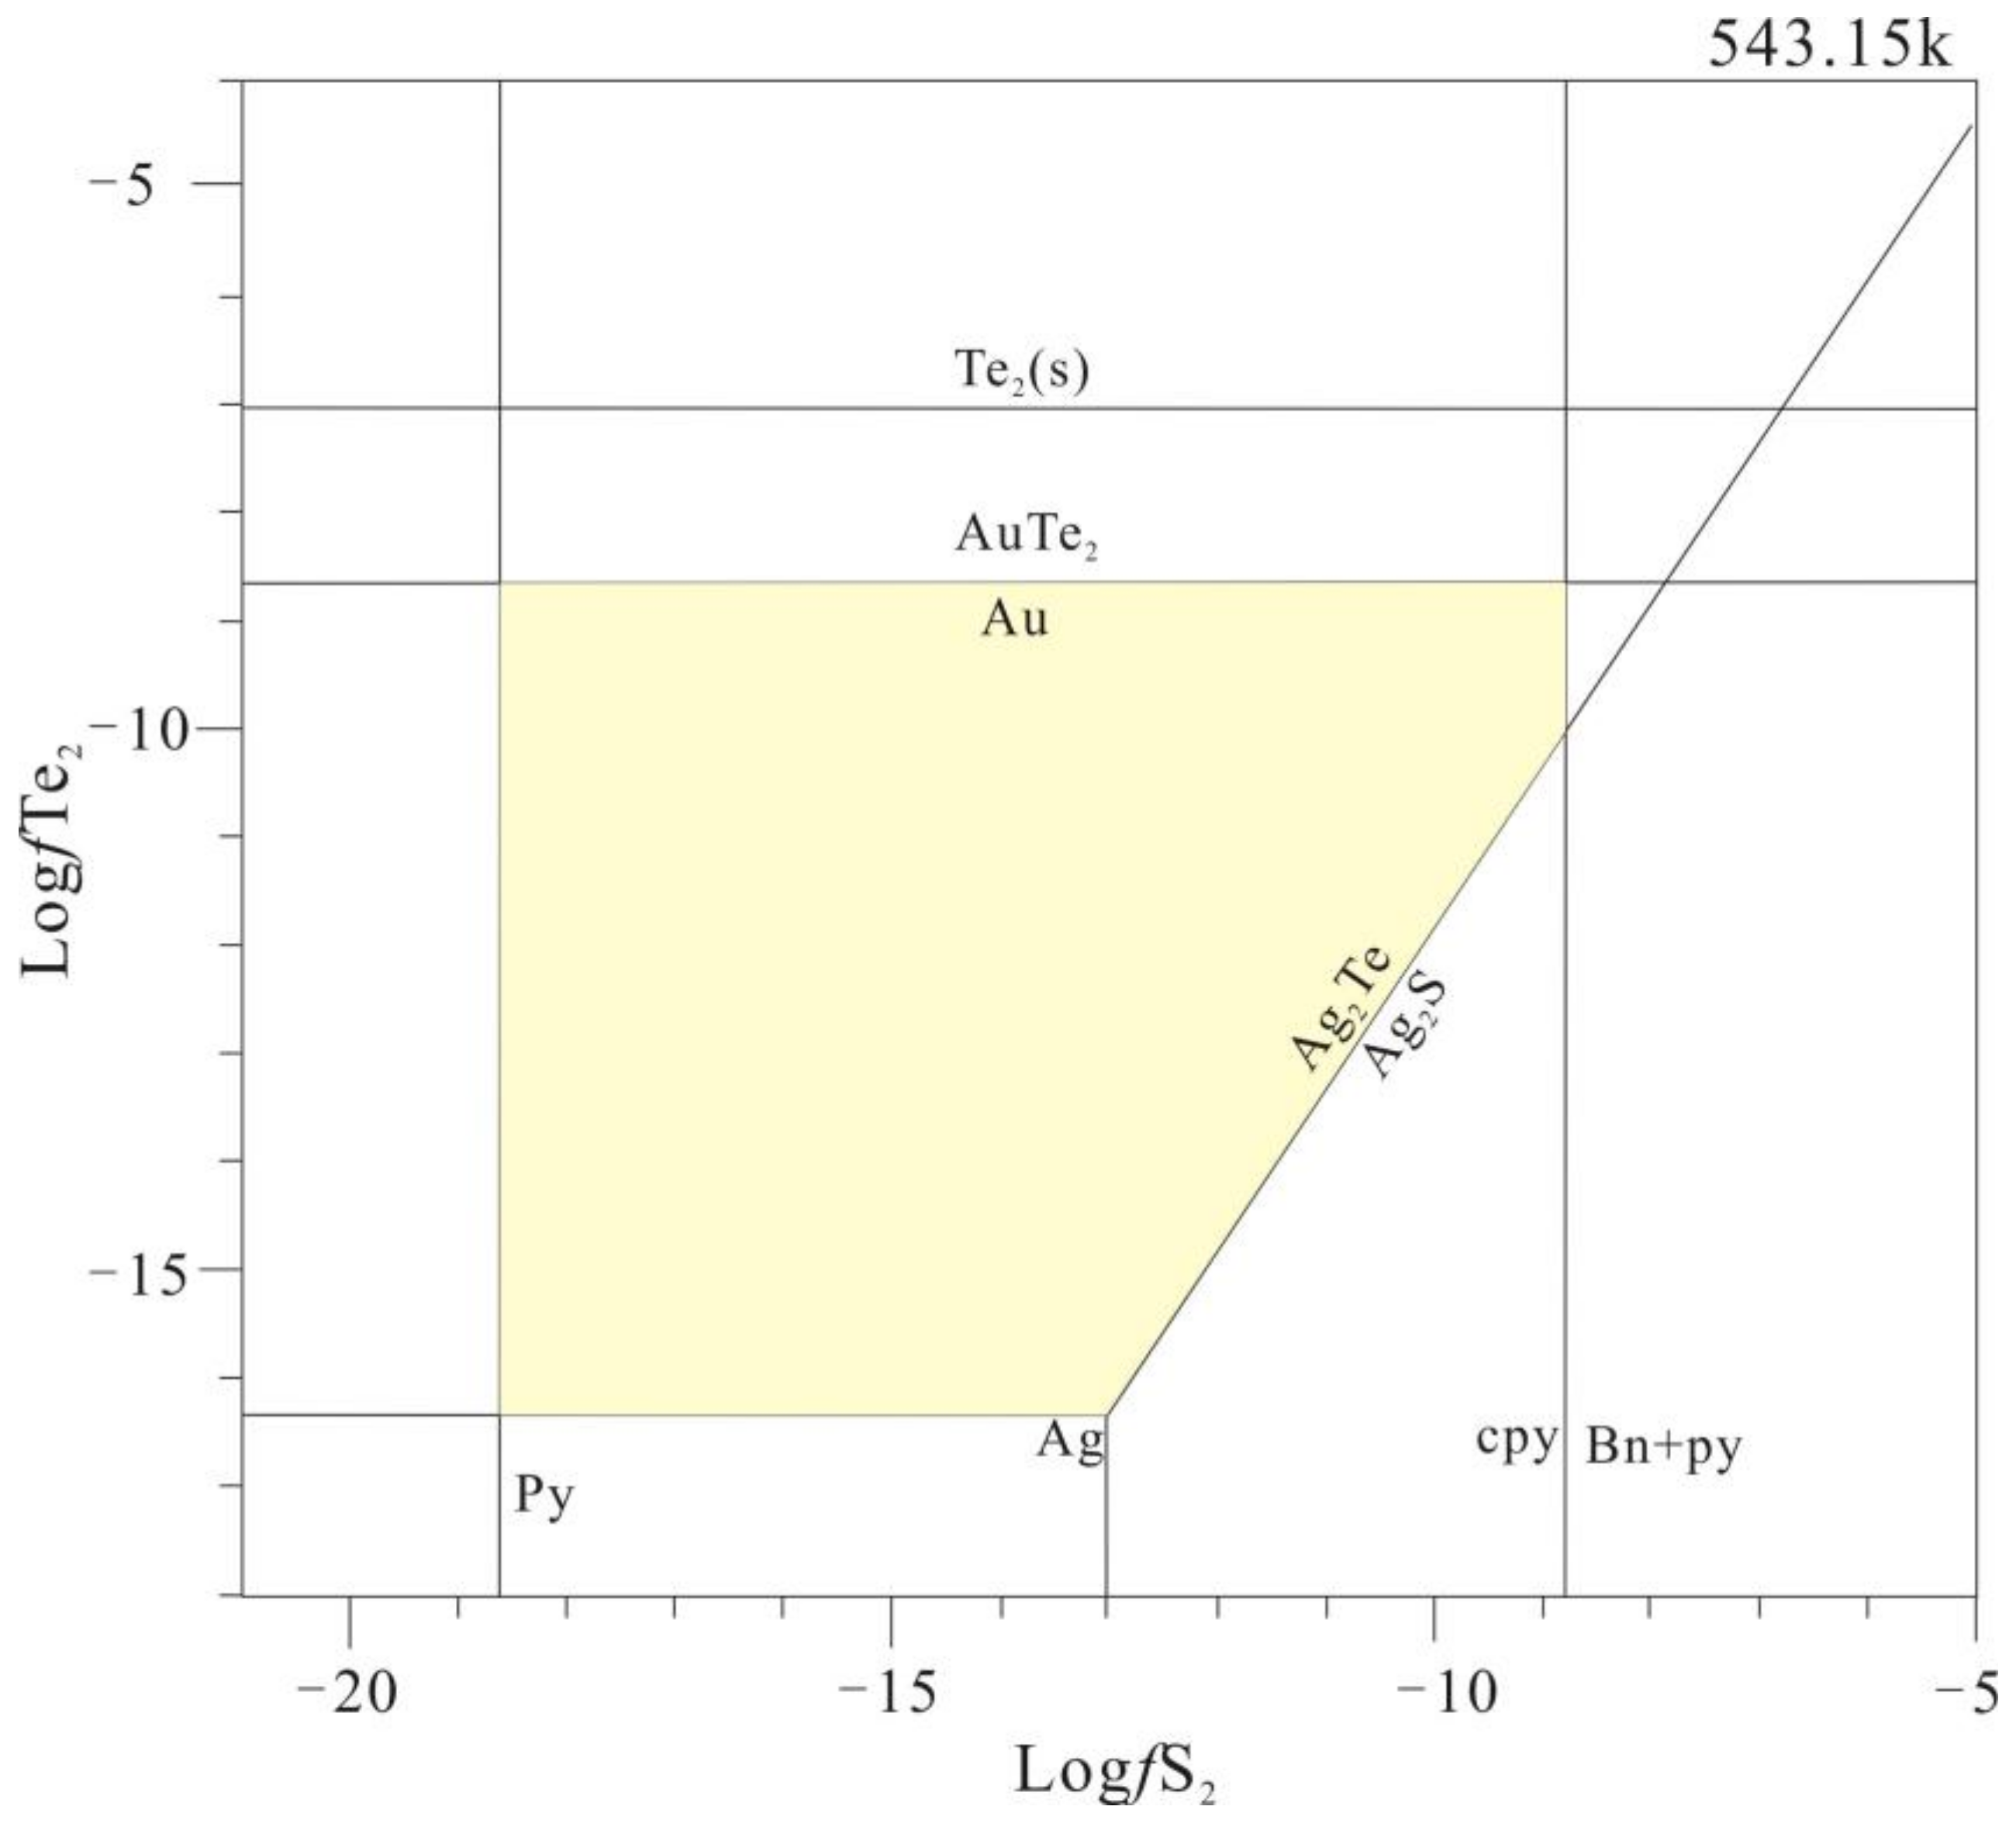
A Te-Au-Ag combination (calaverite, native gold and hessite) but no native tellurium was found in the Baiyun gold deposit, for which a restricted region of telluride precipitation was determined in the
fTe
2–
fS
2 phase diagram (
Figure 13). The growth of the pyrite and chalcopyrite observed under the optical microscope is limited to a log
fS
2 range of −7.87 to −18.16. The corresponding log
fTe
2 value is lower than the stable limit of native tellurium but still within the stable presence of calaverite (range from 7.01–8.54). From the phase diagram, we found that calaverite is first precipitated and this phenomenon was also supported in the growth relationship of minerals. Coexistence of native gold and hessite (
Figure 10) indicates that log
fTe
2 was between −8.54 and −16.41 (
Figure 13). The telluride assemblages recognized in this study is simple, thus we obtain a wide variation. However, this result still has certain significance for the conditions of telluride formation.
6.3. Implications for Ore Genesis
From this study, LA-ICP-MS depth profiles (
Figure 11) show Ni is incorporated into the pyrite crystal lattice. This is consistent with previous studies that Ni is easily incorporated into the pyrite crystal lattice and is not readily released during hydrothermal pyrite recrystallization [
49,
54,
55,
56,
57]. The Ni distribution patterns in pyrite may provide information on the pyrite-precipitating fluids, the chemistry of which is controlled by its primary composition and modifications via wall rock/fluid interaction. The high content of Ni in pyrite indicates the magmatic origin of pyrite and thus of the ore-forming fluid [
58]. The composition of the ore-forming fluid will change constantly in the continuous reaction with the wall rock. In the Baiyun gold deposit, all samples are close to each other but the content of Ni varies greatly (from 1.16 to 4102 ppm, average 333.1 ppm) and a similar situation applies to Co (from 0.24 to 2763 ppm, average 151.9 ppm). The high Co-Ni content and marked variability in pyrite indicate an origin from a magmatically-derived hydrothermal system [
59,
60]. This conclusion coincides with that obtained by Hao et al. (2017) [
18] through S isotope studies of pyrite. Their study showed that the negative δ
34S values of pyrite in ore-bodies were different from significant positive δ
34S values of pyrite in wall rocks, indicating a magmatic origin for the ore-forming fluid.
LA-ICP-MS data shows that there are at least two distinct sources of ore-forming fluids. One is As-rich and the other is Te-rich. As-rich fluids are far more likely to be associated with orogenic gold deposits [
61]. In the Earth’s crust, Te is present only in extremely small quantities (1 ppb on average, [
62]) and Te-rich fluids generally have an affinity with mantle-derived magma in China [
63,
64]. In the Baiyun gold deposit, the C–O isotopes values also suggest the addition of mantle-derived metallogenic material [
18]. Therefore, we could argue that the Baiyun gold deposit was generated by the superposition of ore-forming fluids from different sources (mantle and crust).
This view is further supported by metallogenic chronology. A pyrite Re-Os geochronology study has revealed an isochron age of ca. 225 ± 7.0 Ma [
23],
40Ar-
39Ar dating of quartz collected from Si-K alteration belt shows two metallogenic stages at ca. 207–209 and ca. 196–197 Ma [
65]. Summarizing the metallogenic ages of several gold deposits adjacent to the Baiyun gold deposit, we can summarize that it formed during the Indosinian period (ca. 233–238 Ma; [
20]). The intrusion ages of the Triassic magmatism (224–225 Ma) coincides with the metallogenic age, indicating the mineralization of Baiyun gold deposit was closely related to magmatic hydrothermal fluid during this period. Mao et al. (2003) [
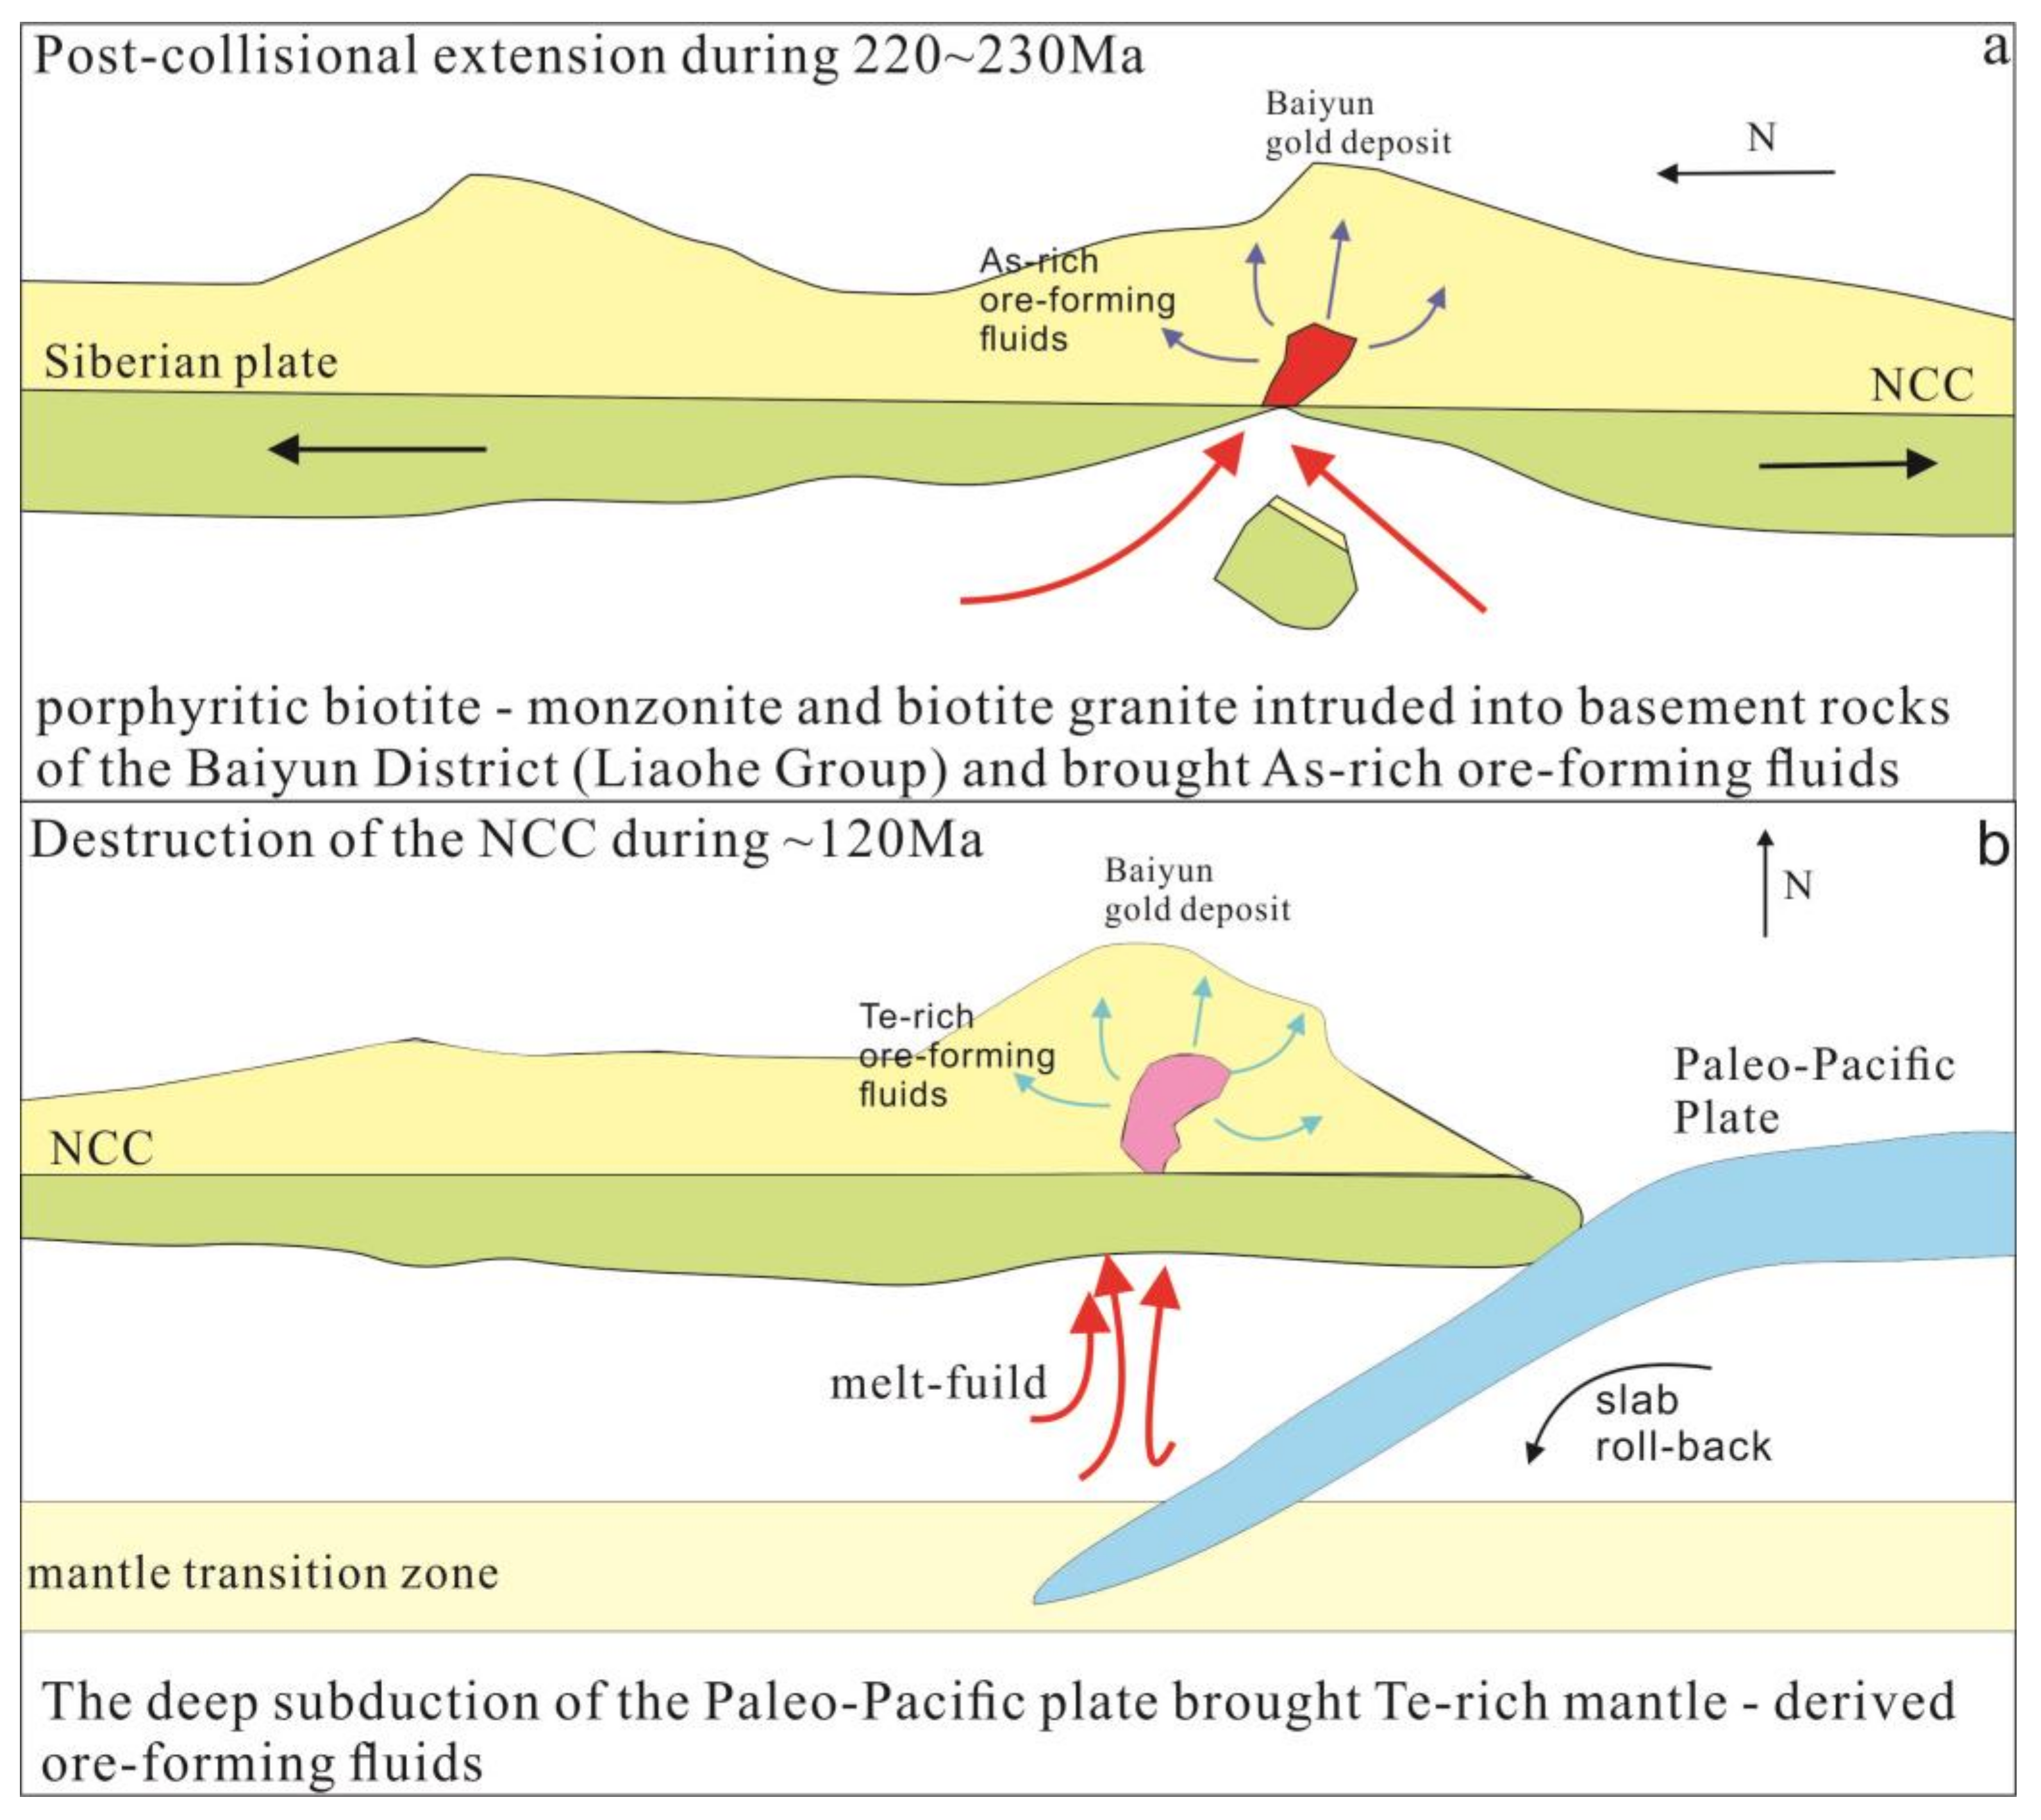
63], based on analysis of large-scale mineralization and geodynamic settings in northern China, suggested that the northern margin of NCC was still in the collision orogenic stage between the Siberian plate and the NCC from the late Triassic to the middle Jurassic period, with granitic magma formed during the extensional stage of orogeny. In conclusion, a metallogenic event happened in the Baiyun district, which is related to post-collisional extensional tectonics on the northern margin of the NCC during the Indosinian period (
Figure 14a). The latest zircon U–Pb geochronology dating of quartz porphyry and diorite-porphyrite, which have close spatial correlations with the ore body, constrained the metallogenic age to the early Cretaceous (126–128Ma; Zeng et al., unpublished date) and this period was the peak of the destruction of the NCC (120–130Ma, [
61]). The Mesozoic “decratonic gold deposits” were largely derived from a deeper magmatic hydrothermal system, probably with input from the astenospheric mantle [
29,
61]. We argue that Te-rich fluids from deep sources were closely related to the destruction of the NCC (
Figure 14b).
According to the data presented in this paper, combined with geochronological and isotopic data [
18,
20,
23], we here propose that early Indosinian magmatic hydrothermal fluids, which had an affinity with post-collisional extensional tectonics on the NCC northern margin, resulted in initial gold enrichment. Then, as a result of deformation or the addition of new hydrothermal fluids, visible gold-rich Py2 was formed. In the Early Cretaceous, the massive upwelling of mantle-derived magma, due to destruction of the eastern NCC, brought in a lot of Te-rich mineralized fluids. When the physical and chemical conditions changed, a large amount of visible/invisible gold and Au-Ag-Te mineral assemblages precipitated from these mineralized fluids.
7. Conclusion
Three types of pyrite (Py1, Py2 and Py3) have been identified. Au exists as two distinct forms, invisible and visible.
Py1 contains the lowest Au and highest As contents. Abundant native gold in Py2 is recognized. Fine-grained Py3 contains significant invisible gold, with an excellent positive correlation between Au, Ag and Te. Arsenic is very low in Py2 and Py3, implying Au can efficiently scavenged by Te in the late mineralization stage.
Sulfide did not grow with telluride and indicates crystallization under low fS2 and/or high fTe2 conditions. Thermodynamic calculations combined with microthermometry of fluid inclusions in auriferous quartz veins permit an estimate for the conditions responsible of tellurides formation (log fS2 ranging from −7.87 to −18.16 and logfTe2 between −8.54and −16.41).
LA-ICP-MS data shows at least two distinct sources of ore-forming fluids. Combined with geochronological data, the Baiyun gold deposit may have been a result of long consecutive episodes of mineralization, from the late Triassic to the early Cretaceous.
Author Contributions
C.-P.L. and J.-F.S. conceived this contribution; field investigation, C.-P.L. and F.-L.L.; C.-P.L. and Y.L. prepared the experiments; performing the experiments and writing-Original Draft Preparation, C.-P.L.; C.-P L., J.-F.S. and S.-R.L. reviewed and edited the draft.
Funding
This work is supported by the Ministry of Science and Technology of China for the State Key Research and Development Plan of China (2016YFC0600106).
Acknowledgments
We especially thank the senior engineer of Baiyun gold deposit Co., Ltd Xiang-Yang Li for support in the field survey and assistance of Liang Li with the LA-ICP-MS trace element analyses. We are also grateful to the three anonymous reviewers and Academic Editor David Chew for their constructive comments on the manuscript.
Conflicts of Interest
The authors declare no conflict of interest.
References
- Groves, D.I.; Goldfarb, R.J.; Gebre-Mariam, S.G.; Hagemann, S.G.; Robert, F. Orogenic gold deposits: A proposed classification in the context of their crustal distribution and their relationship to other gold deposit types. Ore. Geol. Rev. 1998, 13, 7–27. [Google Scholar] [CrossRef]
- Goldfarb, R.J.; Groves, D.I.; Gardol, S. Orogenic gold and geologic time, a global synthesis. Ore. Geol. Rev. 2001, 18, 1–73. [Google Scholar] [CrossRef]
- Oberthüt, R.; Weiser, T.W.; Amanor, J.A.; Chryssoulis, S.L. Mineralogical siting and distribution of gold in quartz veins and sulfide ores of the Ashanti mine and other deposits in the Ashanti belt of Ghana: Genetic implications. Miner. Depos. 1997, 32, 2–15. [Google Scholar] [CrossRef]
- Shen, J.F.; Li, S.R.; Santosh, M.; Dong, G.C.; Wang, Y.J.; Liu, H.M. Zircon U–Pb geochronology of the basement rocks and dioritic intrusion associated with the fushan skarn iron deposit, southern taihang mountains, China. J. Asian Earth Sci. 2015, 113, 1132–1142. [Google Scholar] [CrossRef]
- Shen, J.F.; Santosh, M.; Li, S.R.; Zhang, H.F.; Yin, N.; Dong, G.C. The beiminghe skarn iron deposit, eastern china: Geochronology, isotope geochemistry and implications for the destruction of the north china craton. Lithos 2013, 156–159, 218–229. [Google Scholar] [CrossRef]
- Cabri, J.J.; Newville, M.; Gordon, R.A.; Crozier, E.D.; Suton, S.R.; McMahon, G.; Jiang, D.T. Chemical speciation of gold in arsenopyrite. Can. Mineral. 2000, 38, 1265–1281. [Google Scholar] [CrossRef]
- Cook, N.J.; Chryssoulis, S.L. Concentration of “invisible gold” in the common sulfides. Can. Mineral. 1990, 28, 1–16. [Google Scholar]
- Genkin, A.D.; Bortnikov, N.S.; Cabri, L.J.; Wagner, F.E.; Stanley, C.J.; Safonov, Y.G.; McMahon, G.; Friedl, J.; Kersin, A.L.; Gamyanin, G.N. A multidisciplinary study of invisible gold in arsenopyrite from four mesothermal gold deposits in Siberia, Russian Federation. Econ. Geol. 1998, 93, 463–487. [Google Scholar] [CrossRef]
- Vaughan, J.P.; Kyin, A. Refractory gold ores in Archaean greenstones, Western Australia: Mineralogy, gold paragenesis, metallurgical characterization and classification. Mineral. Mag. 2004, 68, 255–5277. [Google Scholar] [CrossRef]
- Sung, Y.H.; Brugger, J.; Ciobanu, L.; Pring, A.; Skinner, W.; Nugus, M. Invisible gold in arsenian pyrite and arsenopyrite from a multistage Archaean gold deposit: Sunrise Dam, Eastern Goldfields Province, Western Australia. Miner. Depos. 2009, 44, 765–791. [Google Scholar] [CrossRef]
- Zachariáš, J.; Frýda, J.; Paterová, B.; Mihaljevič, M. Arsenopyrite and As-bearing pyrite from the Roundý deposit, Bohemian Massif. Mineral. Mag. 2004, 68, 31–46. [Google Scholar] [CrossRef]
- Pals, D.W.; Spry, P.G.; Chryssoulis, S. Invisible gold and tellurium in arsenic-rich pyrite from the Emperor gold deposit, Fiji: Implications for gold distribution and deposition. Econ. Geol. 2003, 98, 479–493. [Google Scholar] [CrossRef]
- Fleet, M.E.; Chryssoulis, S.L.; Maclean, P.J.; Davidson, R.; Weisener, G.G. Arsenian pyrite from gold deposits: Au and As distribution investigated by SIMS and EMP and color staining and surface oxidation by XPS and LIMS. Can. Mineral. 1993, 31, 1–17. [Google Scholar]
- Bi, S.J.; Li, J.W.; Zhou, M.F.; Li, Z.K. Gold distribution in As-deficient pyrite and telluride mineralogy of the Yangzhaiyu gold deposit, Xiaoqinling district, southern North China Craton. Miner. Depos. 2011, 46, 925–941. [Google Scholar] [CrossRef]
- Ciobanu, C.L.; Cook, N.J.; Spry, P.G. Preface-special issue: Telluride and selenides minerals in gold deposits—How and why? Mineral. Petrol. 2006, 87, 163–169. [Google Scholar] [CrossRef]
- Cook, N.J.; Ciobanu, C.L.; Mao, J.W. Textural control on gold distribution in As-free pyrite from the Dongping, Huangtuliang and Hougou gold deposits, North China craton, (Hebei Province, China). Chem. Geol. 2009, 264, 101–121. [Google Scholar] [CrossRef]
- Guan, G.Y.; Jin, C.Z. Genesis of Baiyun Gold Deposit. Geol. Prospect. 1983, 12, 12–20. (In Chinese) [Google Scholar]
- Hao, L.B.; Zhao, X.; Zhao, Y.Y. Stable isotope characteristics and ore genesis of the Baiyun gold deposit, Liaoning province. J. Jinlin Univ. (Earth Sci. Ed.) 2017, 47, 442–451, (In Chinese with English abstract). [Google Scholar]
- Liu, Y.; Li, S.R.; Santosh, M.; Xu, H.; Li, C.P.; Liu, S. Ore-forming physicochemical conditions of tellurium-gold deposits: A case study from the Guilaizhuang deposit, eastern North China. Geol. J. 2018, 1–19. [Google Scholar] [CrossRef]
- Xue, C.J.; Chen, Y.C.; Lu, Y.F.; Li, H.Q. Metallogenic epochs of Au and Ag deposits in Qingchengzi Ore-Clustered Area, Eastern Liaoning Province. Miner. Depos. 2003, 22, 176–184, (In Chinese with English abstract). [Google Scholar]
- Yang, F.C.; Song, Y.H.; Chai, P.; Li, B. Characteristics of ore-forming fluid and provenance of ore-forming material of Baiyun gold deposit in Liaoning. J. Mineral. Petrol. 2017, 37, 30–39, (In Chinese with English abstract). [Google Scholar]
- Yang, X.K. The new understanding to the geologic characteristics and deep exploration of the Baiyun gold deposit in Liao Province. Geool. Resour. 2011, 25, 376–379, (In Chinese with English abstract). [Google Scholar]
- Zhang, P.; Li, B.; Li, J.; Chai, P.; Wang, X.J.; Sha, D.M.; Shi, J.M. Re-Os isotopic dating and its geological implication of gold bearing pyrite from the Baiyun gold deposit in Liaoning rift. Geotecton. Metallog. 2016, 40, 731–738, (In Chinese with English abstract). [Google Scholar]
- Zhang, Y.N.; Yao, F.Q. Discovery and Significance of Si-K altered rock type gold deposit in Baiyun gold deposit. Northwest. Geol. 2013, 46, 122–128, (In Chinese with English abstract). [Google Scholar]
- Zhao, Z.B. The Evolution of the Precambrian Crust in the Sine-Korean paraplatform; Science Press: Beijing, China, 1993; pp. 389–390, (In Chinese with English abstract). [Google Scholar]
- Zhao, G.C.; Wilde, S.A.; Cawood, P.A.; Sun, M. Archean blocks and their boundaries in the North China Craton: Lithological, geochemical, structural and P-T path constraints and tectonic evolution. Precambrian Res. 2001, 107, 45–73. [Google Scholar] [CrossRef]
- Deng, J.; Wang, Q.F. Gold mineralization in China: Metallogenic provinces, deposit types and tectonic framework. Gondwana Res. 2016, 36, 219–274. [Google Scholar] [CrossRef]
- Li, S.R.; Santosh, M. Metallogeny and craton destruction: Records from the North China Craton. Ore Geol. Rev. 2014, 56, 376–414. [Google Scholar] [CrossRef]
- Li, S.R.; Santosh, M. Geodynamics of heterogeneous gold mineralization in the North China Craton and its relationship to lithospheric destruction. Gondwana Res. 2017, 50, 267–292. [Google Scholar] [CrossRef]
- Menzies, M.A.; Fan, W.; Zhang, M. Palaeozoic and Cenozoic lithoprobes and the loss of >120 km of Archaean lithosphere, Sino-Korean craton, China. Geol. Soc. 1993, 76, 71–81. [Google Scholar] [CrossRef]
- Santosh, M. Assembling North China Craton within the Columbia supercontinent: The role of double-sided subduction. Precambrian Res. 2010, 178, 149–167. [Google Scholar] [CrossRef]
- He, L.J. Thermal regime of the North China Craton: Implications for craton destruction. Earth-Sci. Rev. 2015, 140, 14–26. [Google Scholar] [CrossRef]
- Xu, Y.G. Thermo-tectonic destruction of the Archean lithospheric keel beneath the Sino-Korean Craton in China: Evidence, timing and mechanism. Phys. Chem. Earth 2001, 26, 747–757. [Google Scholar] [CrossRef]
- Zhu, R.X.; Zheng, T.Y. Destruction geodynamics of the North China Craton and its Paleoproterozoic plate tectonics. Chin. Sci. Bull. 2009, 54, 3354–3366. [Google Scholar] [CrossRef]
- Wang, F.; Liu, F.L.; Liu, P.H.; Cai, J.; Schertl, H.P.; Ji, L.; Liu, L.S.; Tian, Z.H. In situ zircon U–Pb dating and whole-rock geochemistry of metasedimentary rocks from South Liaohe Group, Jiao-Liao-Ji orogenic belt: Constraints on the depositional and metamorphic ages and implications for tectonic setting. Precambr. Res. 2017, 303, 764–780. [Google Scholar] [CrossRef]
- Yu, G.; Chen, J.F.; Xue, C.J.; Chen, Y.C.; Chen, F.K.; Du, X.Y. Geochronological framework and Pb, Sr isotope geochemistry of the Qingchengzi Pb-Zn-Ag-Au orefield, Northeastern China. Ore Gol. Rev. 2009, 35, 367–382. [Google Scholar] [CrossRef]
- Duan, X.X.; Liu, J.M.; Wang, Y.B.; Zhou, L.L.; Li, Y.G.; Li, B.; Zhuang, Z.Z.; Zhang, Z.L. Geochronology, geochemistry and geological significance of Late Triassic magmatism in Qingchengzi orefield, Liaoning. Acta Petrol. Sin. 2012, 28, 595–606, (In Chinese with English abstract). [Google Scholar]
- Yang, F.C.; Song, Y.H.; Hao, L.B.; Chai, P. Late Jurassic SHRIMP U–Pb age and Hf iostopic characteristics of granite from the Sanjiazi area in Liaodong and their geological significance. Acta Geol. Sin. 2015, 89, 1773–1782. [Google Scholar]
- Li, D.D.; Wang, Y.W.; Zhou, G.C.; Shi, Y.; Xie, H.J. Preliminary analysis of the relationship between dikes and gold mineralization in Baiyun gold deposit, Liaoning. Miner. Explor. 2016, 7, 113–119. [Google Scholar]
- Qi, E.B.; Wu, X.H. Investigation Report on Potential Resources of Baiyun Gold Deposit; Baiyun gold deposit Co., Ltd: Dandong, China, 2006. [Google Scholar]
- Gao, J.F.; Jackson, S.E.; Dubé, B.; Kontak, D.J.; De, S.S. Genesis of the Canadian Malartic, Côté Gold and Musselwhite gold deposits: Insights from LA-ICP-MS element mapping of pyrite. In Targeted Geoscience Initiative 4: Contributions to the Understanding of Precambrian Lode Gold Deposits and Implications for Exploration; Dubé, B., Mercier-Langevin, P., Eds.; Geological Survey of Canada, Open File; GEOSCAN: Ottawa, ON, Canada, 2015; Volume 7852, pp. 157–175. [Google Scholar]
- Halicz, L.; Günther, D. Quantitative analysis of silicates using LA-ICP-MS with liquid calibration. J. Anal. At. Spectrom. 2004, 19, 1539–1545. [Google Scholar] [CrossRef]
- Reich, M.; Kesler, S.E.; Utsunomiya, S.; Palenik, C.S.; Chryssoulis, S.L.; Ewing, R. Solubility of gold in arsenian pyrite. Geochim. Cosmochim. Acta 2005, 69, 2781–2796. [Google Scholar] [CrossRef]
- Tauson, V.L.; Smagunov, N.V. Effect of gold-accompanying elements on gold behavior in the Fe-S-aqua-salt solution system at 450 °C and 100 MPa. Russian Geol. Geophys. 1997, 38, 706–713. [Google Scholar]
- Cabri, L.J.; Chryssoulis, S.L.; DeVilliers, J.P.R.; Laflamme, J.H.G.; Buseck, P.R. The nature of “invisible” gold in arsenopyrite. Can. Mineral. 1989, 27, 353–362. [Google Scholar]
- Xu, W.G.; Fan, H.R.; Hu, F.F. Gold mineralization in the Guilaizhuang deposit, southwestern Shandong Province, China: Insights from phase relations among sulfides, tellurides, selenides and oxides. Ore Geol. Rev. 2014, 56, 276–291. [Google Scholar] [CrossRef]
- Cook, N.J.; Ciobanu, C.L.; Meria, D.; Silcock, D.; Wade, B. Arsenopyrite-pyrite association in an orogenic gold ore: Tracing mineralization history from textures and trace elements. Econ. Geol. 2013, 108, 1273–1283. [Google Scholar] [CrossRef]
- Kouhestani, H.; Ghaderi, M.; Large, R.R.; Zaw, K. Texture and chemistry of pyrite at chah zard epithermal gold–silver deposit, Iran. Ore Geol. Rev. 2017, 84, 80–101. [Google Scholar] [CrossRef]
- Large, R.R.; Danyushevsky, L.; Hollit, C.; Maslennikov, V.; Meffre, S.; Gilbert, S.; Bull, S.; Scott, R.; Emsbo, P.; Thomas, H.; et al. Gold and trace element zonation in pyrite using a laser imaging technique: Implications for the timing of gold in orogenic and Carlin-style sediment-hosted deposits. Econ. Geol. 2009, 104, 635–668. [Google Scholar] [CrossRef]
- Large, R.R.; Maslennikov, V.; Robert, F.; Danyushevsky, L.V.; Chang, Z. Multistage sedimentary and metamorphic origin of pyrite and gold in the giant Sukhoi Log deposit, Lena gold province, Russia. Econ. Geol. 2007, 102, 1232–1267. [Google Scholar] [CrossRef]
- Large, R.R.; Meffre, S.; Burnett, R.; Guy, B.; Bull, S.; Gilbert, S.; Geomann, K.; Danyushevsky, L.V. Evidence for an intrabasinal source and multiple concentration processes in the formation of the Carbon Leader Reef, Witwatersrand Supergroup, South Africa. Econ. Geol. 2013, 108, 1215–1241. [Google Scholar] [CrossRef]
- Grant, J.A. Isocon analysis: A brief review of the method and applications. Phys. Chem. Earth 2005, 30, 997–1004. [Google Scholar] [CrossRef]
- Gao, S.; Xu, H.; Li, S.R.; Santosh, M.; Zhang, D.S.; Yang, L.J.; Quan, S.L. Hydrothermal alteration and ore-forming fluids associated with gold-tellurium mineralization in the Dongping gold deposit, China. Ore Geol. Rev. 2017, 80, 166–184. [Google Scholar] [CrossRef]
- Huerta-Diaz, M.A.; Morse, J.W. Pyritization of trace metals in anoxic marine sediments. Geochim. Cosmochim. Acta 1992, 56, 2681–2702. [Google Scholar] [CrossRef]
- Koglin, N.; Frimmel, H.E.; Minter, W.E.L.; Brätz, H. Trace-element characteristics of different pyrite types in Mesoarchaean to Palaeoproterozoic placer deposits. Miner. Depos. 2010, 45, 259–280. [Google Scholar] [CrossRef]
- Morse, J.W.; Luther, G.W. Chemical influences on trace metal-sulphide interactions in anoxic sediments. Geochim. Cosmochim. Acta 1999, 63, 3373–3378. [Google Scholar] [CrossRef]
- Tribovillard, N.; Algeo, T.J.; Lyons, T.; Riboulleau, A. Trace metals as paleoredox and paleoproductivity proxies: An update. Chem. Geol. 2006, 232, 12–32. [Google Scholar] [CrossRef]
- Zhao, H.X.; Frimmel, H.E.; Jiang, S.Y.; Dai, B.Z. LA-ICP-MS trace element analysis of pyrite from the Xiaoqinling gold district, China: Implications for ore genesis. Ore Geol. Rev. 2011, 43, 142–153. [Google Scholar] [CrossRef]
- Bralia, A.; Sabatini, G.; Troja, F. A revaluation of the Co/Ni ratio in pyrite as geochemical tool in ore genesis problems. Miner. Depos. 1979, 14, 353–374. [Google Scholar] [CrossRef]
- Cook, N.J. Mineralogy of the sulphide deposits at Sulitjelma, northern Norway. Ore Geol. Rev. 1996, 11, 303–338. [Google Scholar] [CrossRef]
- Zhu, R.X.; Fan, H.R.; Li, J.W.; Meng, Q.R.; Li, S.R.; Zeng, Q.D. Decratonic gold deposits. Sci. China Earth Sci. 2015, 58, 1523–1537. [Google Scholar] [CrossRef]
- Climo, M.; Watling, H.R.; Bronswijk, V.W. Biooxidation as pre-treatment for a telluride-rich refractory gold concentrate. Miner. Eng. 2000, 13, 1219–1229. [Google Scholar] [CrossRef]
- Mao, J.W.; Zhang, Z.H.; Yu, J.J.; Wang, Y.T.; Niu, B.G. Geodynamic background of Mesozoic large-scale metallogenesis in North China and adjacent areas: Implications from metallogenic age of metal deposits. Sci. China Earth Sci. 2003, 33, 289–299. [Google Scholar]
- Mao, J.W.; Wei, J.X. Helium and Argon Isotopic Components of Fluid Inclusions and Tracing to the Source of Metallogenic Fluids in the Dashuigou Tellurium Deposit of Sichuan. Acta Geosientica Sin. 2000, 21, 397–399, (In Chinese with English abstract). [Google Scholar]
- Liu, G.P.; Ai, Y.F. Studies on the mineralization age of Baiyun Gold Deposit in Liaoning. Acta Petrol. Sin. 2000, 16, 627–632, (In Chinese with English abstract). [Google Scholar]
Figure 1.
Major tectonic units of the North China Craton. (Modified after [
26,
31]).
Figure 1.
Major tectonic units of the North China Craton. (Modified after [
26,
31]).
Figure 2.
Geological map of the Qingchengzi gold district (modified from The Bureau of Non-Ferrous Geology of Liaoning Province 103 Team, 2010 and [
36]).
Figure 2.
Geological map of the Qingchengzi gold district (modified from The Bureau of Non-Ferrous Geology of Liaoning Province 103 Team, 2010 and [
36]).
Figure 3.
Geological map of the Baiyun gold deposit showing the distribution and occurrence of major gold lodes (modified from [
39]).
Figure 3.
Geological map of the Baiyun gold deposit showing the distribution and occurrence of major gold lodes (modified from [
39]).
Figure 4.
Generalized geological sections of Lode 60 in the Baiyun deposit (modified after [
40])
Figure 4.
Generalized geological sections of Lode 60 in the Baiyun deposit (modified after [
40])
Figure 5.
Generalized geological sections of Lode 2 in the Baiyun deposit (modified after [
40]).
Figure 5.
Generalized geological sections of Lode 2 in the Baiyun deposit (modified after [
40]).
Figure 6.
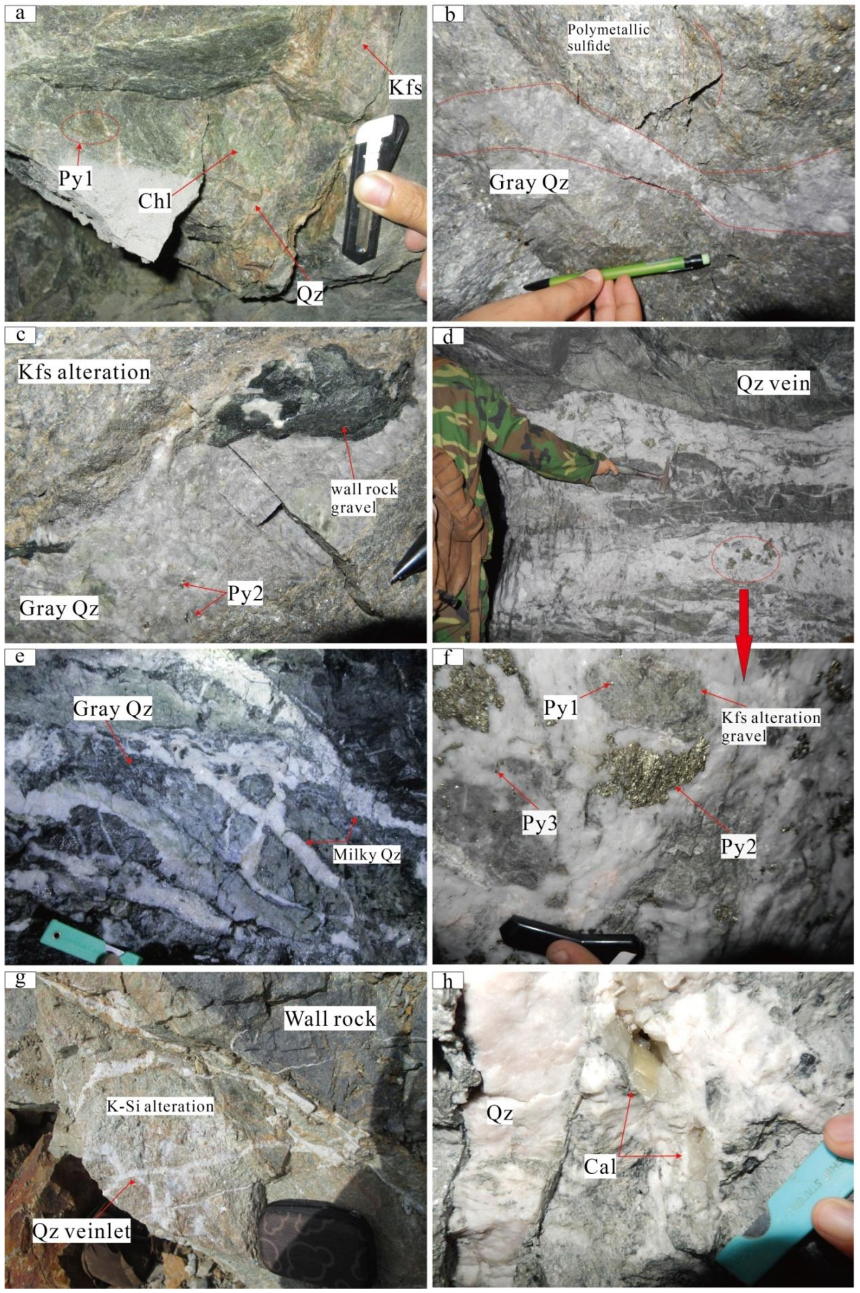
Photographs from underground and ground exposures in the Baiyun deposit. (a) K-feldspar altered zone, with coarse-grained K-feldspar, chlorite associated with alteration and, sporadically distributed pyrite and quartz. (b) Massive polymetallic sulfide in the silicification zone. (c) Pyrite presents as pyritohedron and coarse-grains in gray quartz. (d) A broad quartz vein of late silicification stage crosscuts the rock associated with early silicification in −80 tunnel and contains breccias and massive pyrite. (e) Milky quartz stockworks crosscut the gray quartz formed in the early stage. (f) The photograph is enlarged from the red circle denoted on (d), Py1 was found in breccias of K-feldspar altered wall-rock. In the quartz vein, there are two distinct forms of pyrite, which are agglomerated Py2 and isolated Py3. (g) It is can be seen from the photograph of ground that the quartz veinlets crosscut the K-Si alteration. (h) Quartz-calcite vein in the latest mineralization stage. Py: pyrite; Chl: chlorite; Kfs: K-feldspar; Qz: quartz; Cal: calcite.
Figure 6.
Photographs from underground and ground exposures in the Baiyun deposit. (a) K-feldspar altered zone, with coarse-grained K-feldspar, chlorite associated with alteration and, sporadically distributed pyrite and quartz. (b) Massive polymetallic sulfide in the silicification zone. (c) Pyrite presents as pyritohedron and coarse-grains in gray quartz. (d) A broad quartz vein of late silicification stage crosscuts the rock associated with early silicification in −80 tunnel and contains breccias and massive pyrite. (e) Milky quartz stockworks crosscut the gray quartz formed in the early stage. (f) The photograph is enlarged from the red circle denoted on (d), Py1 was found in breccias of K-feldspar altered wall-rock. In the quartz vein, there are two distinct forms of pyrite, which are agglomerated Py2 and isolated Py3. (g) It is can be seen from the photograph of ground that the quartz veinlets crosscut the K-Si alteration. (h) Quartz-calcite vein in the latest mineralization stage. Py: pyrite; Chl: chlorite; Kfs: K-feldspar; Qz: quartz; Cal: calcite.
![Minerals 09 00129 g006]()
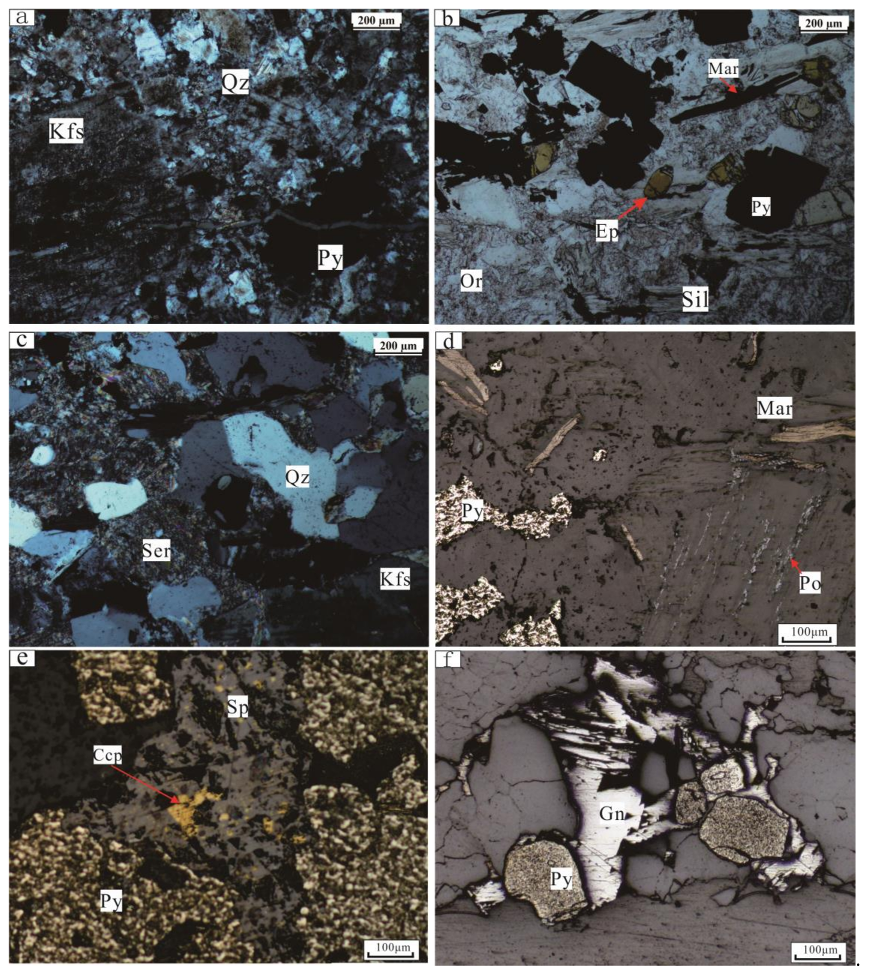
Figure 7.
Optical microscope photographs showing mineral assemblages. (a) and (b) The area of K-feldspar alteration under plane polarized light, respectively (c) the area of early silicification alteration under plane polarized light, respectively. Quartz fragments exhibit irregular shapes with sericite. (d), (e), (f) show the main metal mineral assemblages under reflected light. Kfs: K-feldspar; Py: pyrite; Qz: quartz; Or: orthoclase Ep: epidote; Sil: sillimanite Mar: marcasite; Ser: sericite; Po: pyrrhotite; Ccp: chalcopyrite; Sp: sphalerite; Gn: galena.
Figure 8.
Paragenetic sequence of gold mineralization and alteration of the Baiyun gold deposit.
Figure 8.
Paragenetic sequence of gold mineralization and alteration of the Baiyun gold deposit.
Figure 9.
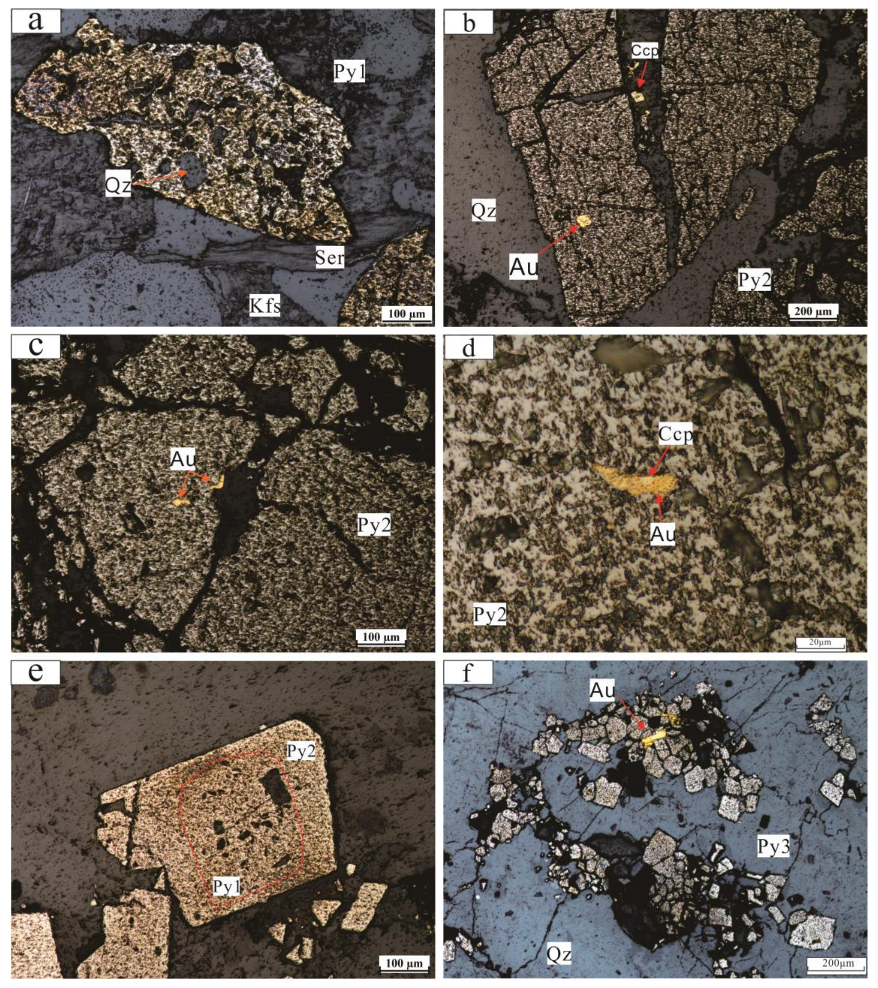
Reflected light photomicrographs of generations of pyrite. (a) Py1 characterized by micro-fractures and porous and filled with quartz. (b) and (c) Py2 characterized by micro-fractures and represent the largest grains. Au occurs as inclusions or stringers along the micro-fractures and crystal boundaries. (d) Native gold growing with chalcopyrite along micro-fractures in Py2. (e) Py 1 present in the core and Py 2 surround it as a rim (f) fine-grained Py3 growing with native gold. Ser: sericite; Ccp: chalcopyrite Qz: quartz; Kfs: K-feldspar.
Figure 9.
Reflected light photomicrographs of generations of pyrite. (a) Py1 characterized by micro-fractures and porous and filled with quartz. (b) and (c) Py2 characterized by micro-fractures and represent the largest grains. Au occurs as inclusions or stringers along the micro-fractures and crystal boundaries. (d) Native gold growing with chalcopyrite along micro-fractures in Py2. (e) Py 1 present in the core and Py 2 surround it as a rim (f) fine-grained Py3 growing with native gold. Ser: sericite; Ccp: chalcopyrite Qz: quartz; Kfs: K-feldspar.
Figure 10.
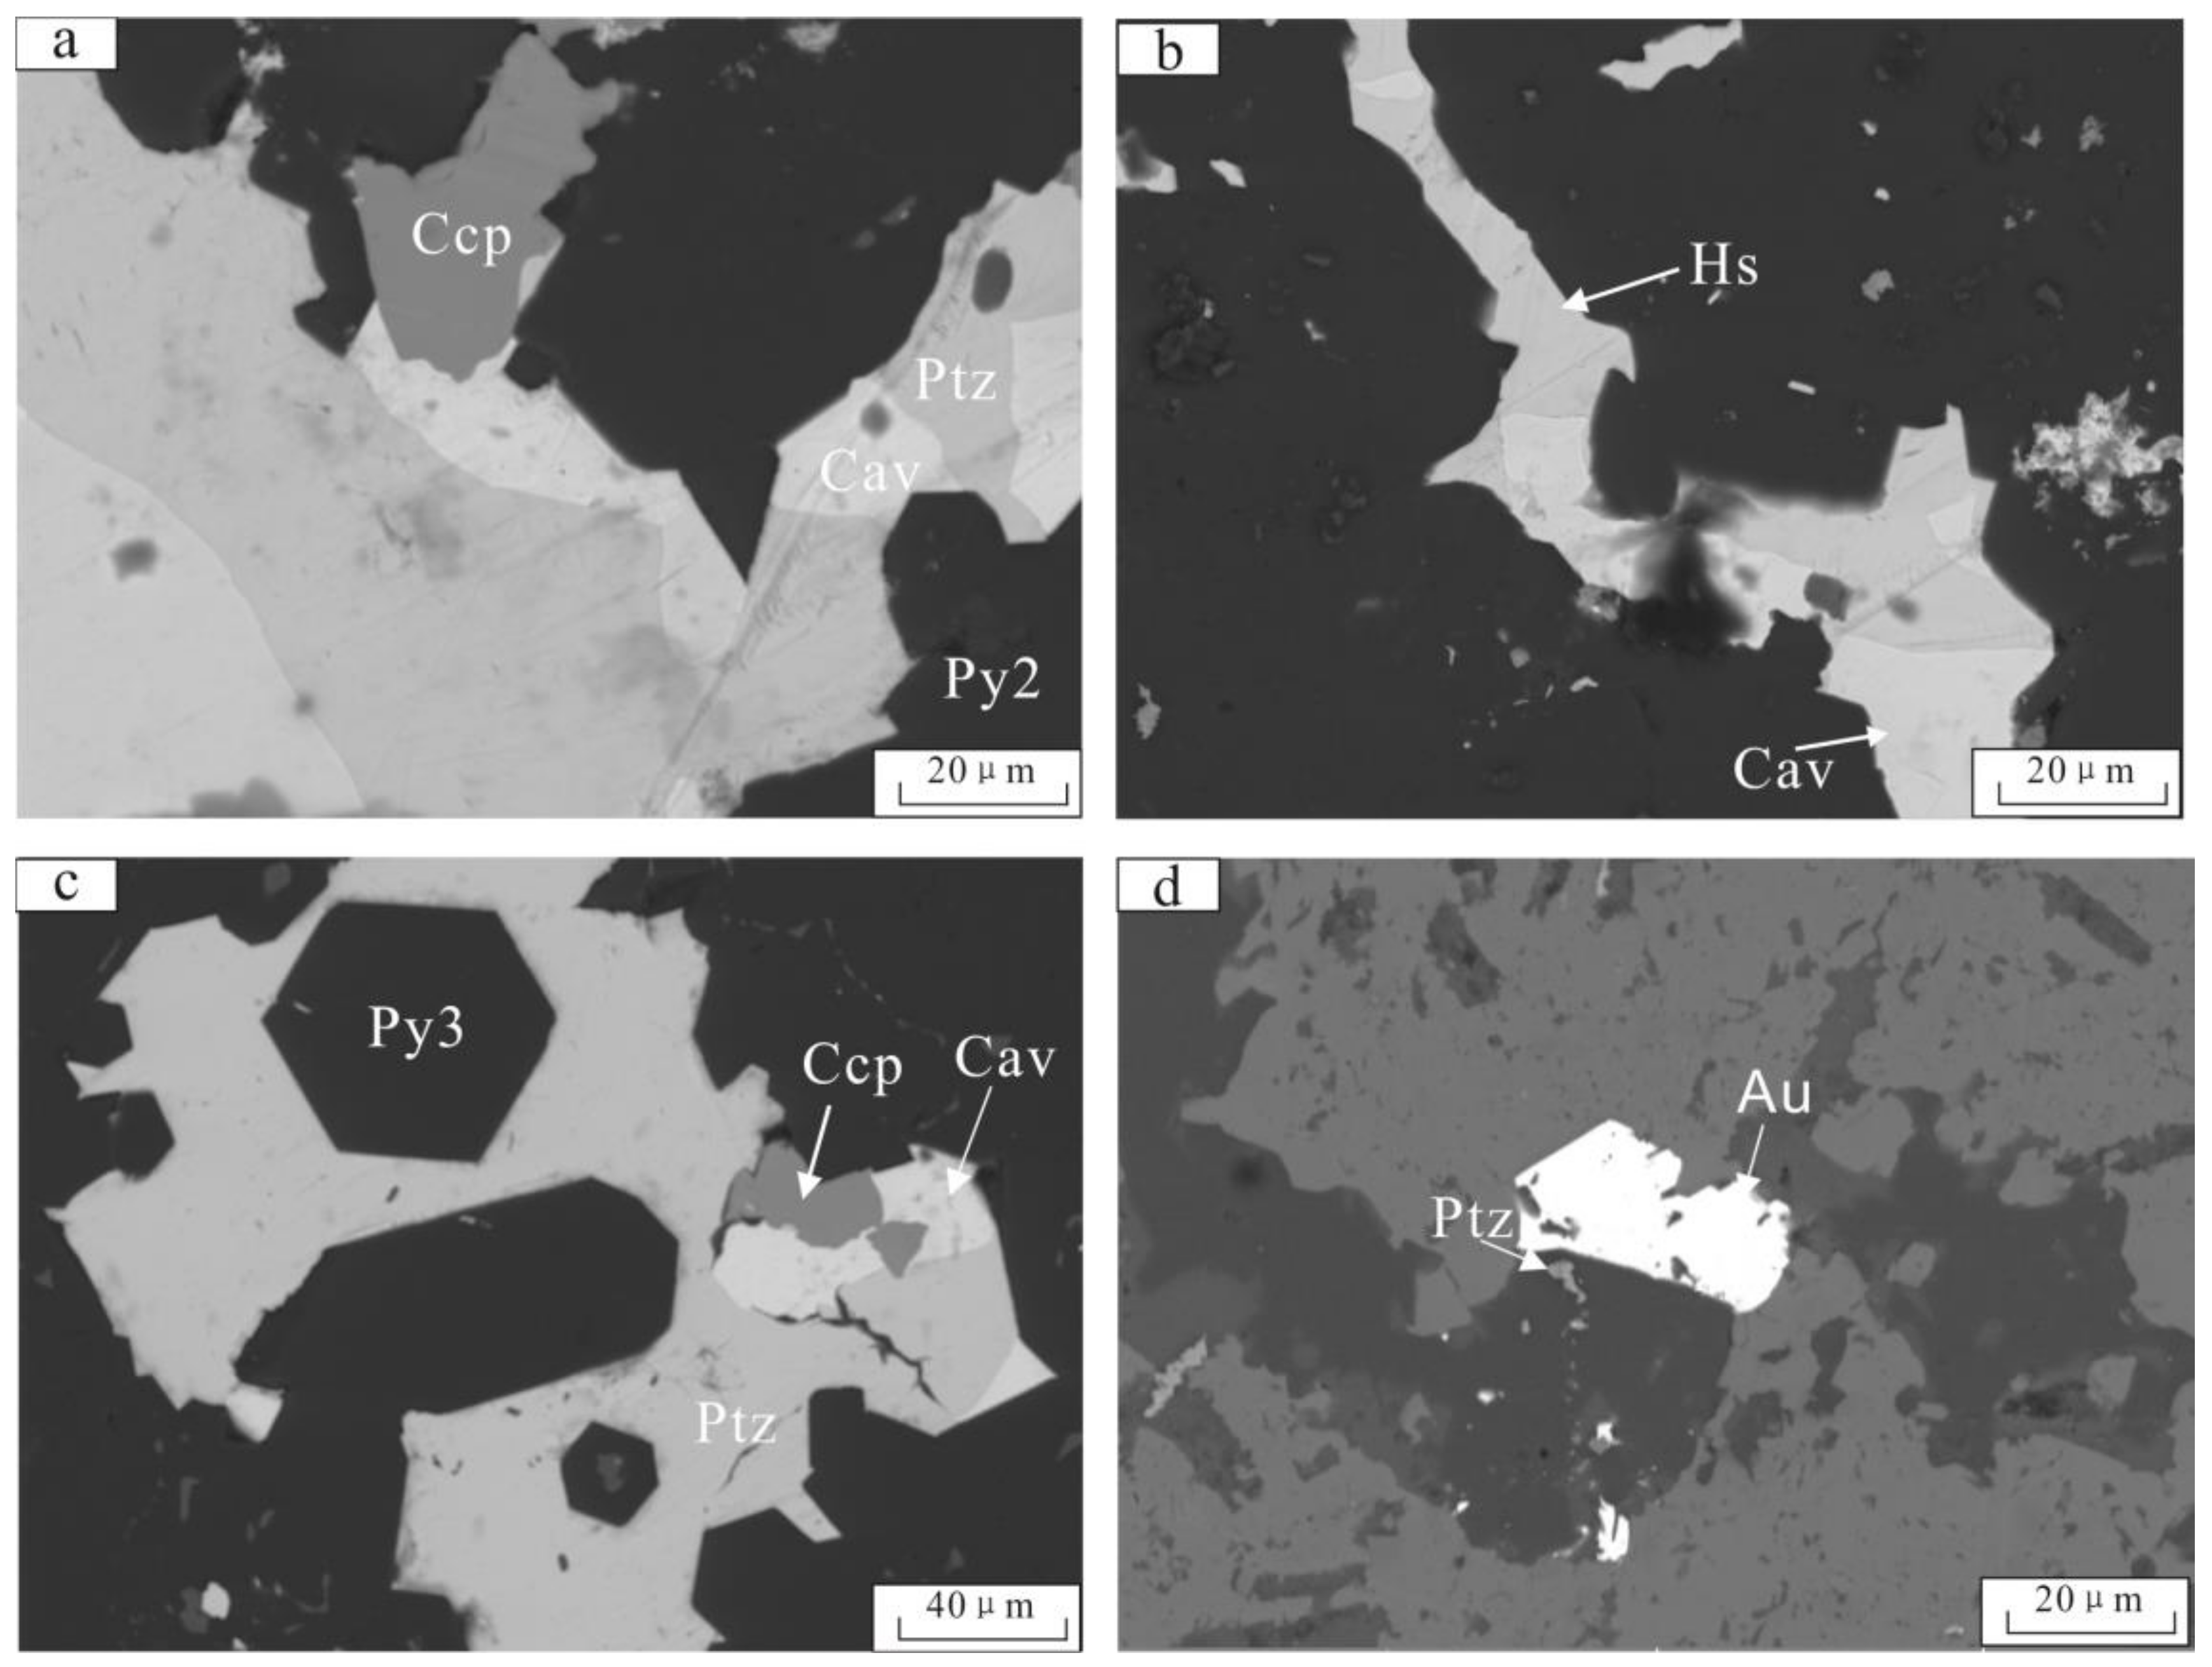
Back-scattered electron images of telluride assemblages. (a) In the microfracture of Py2, chalcopyrite grew with calaverite and petzite, and calaverite was generated earlier than petzite. (b) Hessite crosscut calaverite. (c) Chalcopyrite is coexisting with tellurides. Tellurides formation was later than Py3. (d) Native Au grew with petzite. Only simple telluride assemblages contain petzite, calaverite and hessite. As the only sulfide, chalcopyrite grows with telluride assemblages. Au has been recognized with telluride assemblages. Ptz: petzite; Cav: calaverite; Hs: hessite.
Figure 10.
Back-scattered electron images of telluride assemblages. (a) In the microfracture of Py2, chalcopyrite grew with calaverite and petzite, and calaverite was generated earlier than petzite. (b) Hessite crosscut calaverite. (c) Chalcopyrite is coexisting with tellurides. Tellurides formation was later than Py3. (d) Native Au grew with petzite. Only simple telluride assemblages contain petzite, calaverite and hessite. As the only sulfide, chalcopyrite grows with telluride assemblages. Au has been recognized with telluride assemblages. Ptz: petzite; Cav: calaverite; Hs: hessite.
Figure 11.
Representative LA-ICP-MS depth–concentration profiles (ion-signal intensity, counts per second) of Au, Ag, Te, Ni, Cu, As and Pb for pyrite grains of different types from the Baiyun gold deposit. The relationship between time and depth is 2.5 µm of ablation per second. (a) The spot in the Py1 pyrite grain contains fewer micro-fractures than sample by-380-1. (b) The spot in the Py1 pyrite grain contains more micro-fractures than sample by-380-1. (c) Spot analysis of Py2 (away from the micro-fractures) in sample by-160-1-3. (d) Py1 spot near micro-fractures in sample by-160-1-3. (e), (f) and (g) Three representative spots in the Py3 grain in sample hdz-100-5-1.
Figure 12.
Correlation diagrams of different elements vs. Au concentration in the LA-ICP-MS spots: (
a) Ag; (
b) Te; (
c) Cu; (
d) As; (
f) Ni. (
e) plot of Ag vs. Te; (
g) plot of Se vs. Te; (
h) plot of Pb vs. Ni; (
i) plot of Sb vs. As. R: correlation coefficients. The gold saturation line is from Reich et al. (2005) [
43].
Figure 13.
LogfS2(g)–logfTe2(g) diagram showing the relative stability of tellurides and sulfides at 543.15k. Because simple telluride assemblages have been recognized, the domain of variation (yellow color) is relatively wide.
Figure 13.
LogfS2(g)–logfTe2(g) diagram showing the relative stability of tellurides and sulfides at 543.15k. Because simple telluride assemblages have been recognized, the domain of variation (yellow color) is relatively wide.
Figure 14.
Schematic ore-genetic model for the Baiyun gold deposit. (a) Post-collisional extension during 220–230 Ma. (b) Destruction of the NCC during ~120 Ma.
Figure 14.
Schematic ore-genetic model for the Baiyun gold deposit. (a) Post-collisional extension during 220–230 Ma. (b) Destruction of the NCC during ~120 Ma.
Table 1.
Selected LA-ICP-MS analyses of different pyrite types from Baiyun deposit.
Table 1.
Selected LA-ICP-MS analyses of different pyrite types from Baiyun deposit.
| Sample Number | py Types | Au | Ag | Te | Cu | Pb | As | Sb | Se | Co | Ni |
|---|
| ppm | ppm | ppm | ppm | ppm | ppm | ppm | ppm | ppm | ppm |
|---|
| by-380-5 | Py1 | 0.16 | 3.05 | 0.59 | 9.76 | 47 | 2614 | 15.3 | 0.31 | 109 | 675 |
| by-380-5 | Py1 | 0.27 | 1.07 | 0.22 | 5.89 | 18 | 8950 | 4.09 | 0.24 | 61.3 | 139 |
| by-380-5 | Py1 | 0.28 | 0.12 | <0.5 | 4.39 | 2 | 4691 | 0.16 | 0.18 | 0.44 | 4.24 |
| by-380-5 | Py1 | 0.067 | 2.43 | 1.04 | 12.4 | 45 | 1198 | 8.78 | 1.76 | 281 | 191 |
| by-380-5 | Py1 | 0.36 | 0.70 | <0.36 | 5.44 | 31 | 3926 | 4.44 | 0.34 | 24.6 | 60.3 |
| by-380-5 | Py1 | 0.21 | 2.12 | 3.67 | 111 | 46 | 53.4 | 0.091 | 1.53 | 726 | 296 |
| by-380-5 | Py1 | <0.033 | 0.45 | 5.36 | 6.57 | 22 | 209 | 0.087 | 2.71 | 305 | 149 |
| by-380-1 | Py1 | 1.37 | 8.55 | 8.08 | 18.5 | 13 | 646 | 0.45 | 1.61 | 237 | 58.6 |
| by-380-1 | Py1 | <0.026 | 0.32 | 0.40 | 153 | 7 | 380.1 | 0.10 | 3.02 | 4.20 | 1197 |
| by-380-1 | Py1 | 10.7 | 2.19 | 0.72 | 24.5 | 64 | 11541 | 20.0 | 0.34 | 32.1 | 16.0 |
| by-380-1 | Py1 | 10.2 | 2.59 | 0.55 | 33.0 | 71 | 11295 | 20.8 | 0.40 | 42.8 | 20.0 |
| by-380-1 | Py1 | 9.05 | 1.41 | 0.65 | 24.0 | 37 | 10080 | 11.4 | 0.33 | 24.6 | 14.2 |
| by-380-1 | Py1 | 3.26 | 3.92 | 0.35 | 56.2 | 54 | 5095 | 19.0 | 0.39 | 13.9 | 17.0 |
| by-160-3 | Py2 | <0.032 | 0.38 | <0.39 | 6.89 | 74 | 0.49 | 13.7 | 1.69 | 94.3 | 11.2 |
| by-160-3 | Py2 | <0.032 | 0.12 | 0.77 | 5.20 | 53 | 0.50 | 1.38 | 3.08 | 33.9 | 4.86 |
| by-160-3 | Py2 | <0.026 | 0.072 | <0.55 | 4.70 | 58 | 0.62 | 2.33 | 6.71 | 2.24 | 1.90 |
| by-380-1 | Py2 | <0.075 | 0.12 | 0.25 | 2.48 | 4 | 0.72 | 0.27 | 0.73 | 19.0 | 60.2 |
| by-380-1 | Py2 | 0.019 | 0.19 | 0.44 | 1.40 | 5 | 0.85 | <0.069 | 0.34 | 98.0 | 81.9 |
| by-380-1 | Py2 | 0.21 | 42.5 | 0.72 | 2206 | 80 | 5.16 | 2.91 | 2.02 | 18.1 | 2861 |
| by-160-1-3 | Py2 | <0.022 | 0.025 | <0.39 | 0.48 | <0.021 | <0.7 | <0.053 | 3.00 | 102 | 258 |
| by-160-1-3 | Py2 | <0.041 | 0.60 | 1.30 | 8.02 | 3 | 9.48 | <0.081 | 0.51 | 519 | 828 |
| by-160-1-3 | Py2 | 2.25 | 17.8 | 16.1 | 533 | 43 | 43.4 | 0.075 | 1.33 | 2763 | 1215 |
| by-160-1-3 | Py2 | <0.025 | 0.22 | 1.24 | 4.14 | 2 | 15.9 | <0.057 | 0.87 | 1883 | 1000 |
| by-160-1-3 | Py2 | 0.16 | 2.40 | 4.32 | 9.24 | 239 | 1338 | <0.084 | 5.35 | 462 | 4102 |
| by-160-1-3 | Py2 | 1.79 | 9.31 | 9.40 | 13.0 | 10 | 0.64 | <0.076 | 1.44 | 133 | 1294 |
| by-160-1-3 | Py2 | <0.027 | 0.12 | <0.42 | 1.19 | 1 | 0.72 | <0.072 | 1.00 | 24.6 | 216 |
| by-80-1 | Py2 | 3.33 | 21.0 | 13.8 | 1015 | 23 | 17.0 | 0.97 | 2.63 | 251 | 1354 |
| by-80-1 | Py2 | 0.11 | 0.21 | 0.46 | 2.20 | 5 | 2.08 | 0.063 | 3.68 | 25.6 | 83.3 |
| by-80-1 | Py2 | 0.058 | 0.13 | 1.02 | 2.32 | 7 | 3.09 | 1.14 | 1.30 | 86.8 | 370 |
| by-80-1 | Py2 | 0.48 | 1.40 | 1.37 | 4.27 | 6 | 0.43 | <0.074 | 0.67 | 0.75 | 212 |
| by-80-1 | Py2 | 0.064 | 1.45 | 1.10 | 5.04 | 8 | 5.49 | 0.12 | 3.05 | 94.6 | 1368 |
| by-80-1 | Py2 | <0.022 | 0.025 | <0.39 | 0.19 | <0.01 | 3.01 | <0.053 | 1.18 | 5.53 | 187 |
| by-80-1 | Py2 | 0.17 | 0.69 | 1.02 | 1.60 | 3 | 18.4 | 0.032 | 1.89 | 73.1 | 187 |
| by-80-2 | Py2 | 0.50 | 3.00 | 3.30 | 4.97 | 5 | 1.25 | 0.14 | 0.91 | 8.63 | 27.0 |
| by-80-2 | Py2 | 6.46 | 18.9 | 21.2 | 11.9 | 184 | 39.5 | 2.89 | 1.74 | 181 | 417 |
| by-80-2 | Py2 | 0.031 | 1.50 | 1.19 | 1725 | 28 | 91.5 | 0.75 | 3.21 | 12.3 | 281 |
| by-80-2 | Py2 | 0.23 | 1.18 | 2.61 | 5.24 | 19 | 2.40 | 0.52 | 1.33 | 2.23 | 12.2 |
| by-80-2 | Py2 | 0.13 | 0.55 | 2.08 | 2.42 | 5 | 9.22 | 0.22 | 2.34 | 82.1 | 174 |
| hdz-100-5 | Py2 | 0.061 | 1.31 | 1.96 | 1.09 | 1 | <0.74 | <0.21 | 6.85 | 51.4 | 43.8 |
| hdz-100-5 | Py2 | 0.11 | 1.03 | 1.33 | 2.45 | 1 | 0.59 | <0.47 | 7.75 | 82.8 | 40.0 |
| hdz-100-5 | Py2 | 0.086 | 2.10 | 3.03 | 4.62 | 10 | 0.42 | 0.029 | 7.06 | 34.2 | 39.3 |
| hdz-100-5 | Py2 | <0.013 | <0.019 | 0.79 | 0.39 | <0.013 | <0.75 | 0.040 | 5.61 | 5.20 | 1.16 |
| hdz-100-5 | Py2 | 0.57 | 5.67 | 4.20 | 10.2 | 5 | 0.92 | 0.015 | 5.60 | 20.5 | 13.1 |
| hdz-100-5 | Py2 | 0.086 | 1.23 | 3.43 | 12.6 | 3 | 0.97 | 0.033 | 4.75 | 6.94 | 11.3 |
| hdz-100-5 | Py2 | 0.98 | 8.97 | 13.7 | 293 | 9 | 1.29 | 0.038 | 5.41 | 1.00 | 4.44 |
| hdz-100-5 | Py2 | 44.0 | 521 | 384 | 344 | 34 | 0.87 | 0.16 | 5.25 | 3.60 | 11.8 |
| hdz-100-5 | Py2 | 11.7 | 125 | 137 | 176 | 23 | 1.41 | 0.15 | 4.32 | 3.31 | 8.85 |
| hdz-100-5 | Py2 | 6.97 | 77.7 | 69.5 | 285 | 82 | 1.59 | 0.98 | 2.89 | 96.5 | 185 |
| hdz-160-2 | Py2 | 1.50 | 11.2 | 8.09 | 4.00 | 3 | 0.67 | 0.047 | 5.16 | 19.4 | 32.5 |
| hdz-160-2 | Py2 | 0.43 | 4.29 | 1.84 | 13.6 | 15 | 0.74 | 0.049 | 2.98 | 84.7 | 204 |
| hdz-160-2 | Py2 | 0.052 | 0.34 | 0.69 | 2.75 | 2 | 0.85 | <0.083 | 2.94 | 11.8 | 27.9 |
| hdz-160-2 | Py2 | 0.17 | 1.75 | 3.07 | 1.01 | 2 | 0.72 | 0.087 | 1.93 | 15.8 | 28.7 |
| hdz-160-2 | Py2 | 0.092 | 2.14 | 1.50 | 7.83 | 18 | 2.87 | 0.24 | 4.14 | 45.5 | 135 |
| hdz-160-2 | Py2 | 0.048 | 0.28 | 0.82 | 6.37 | 1 | 0.58 | 0.021 | 3.73 | 44.1 | 183 |
| by-343-1 | Py2 | 0.14 | 2.69 | 1.35 | 2.15 | 2 | 1.40 | 0.13 | 2.51 | 13.3 | 368 |
| by-343-1 | Py2 | <0.023 | 0.79 | 0.77 | 4.97 | 2 | 0.55 | 0.94 | 2.71 | 0.84 | 513 |
| by-343-1 | Py2 | 0.29 | 8.90 | 6.70 | 3.08 | 7 | 2.75 | 0.52 | 0.93 | 113 | 163 |
| by-343-1 | Py2 | 0.037 | 0.52 | 4.87 | 593 | 4 | 0.60 | 0.061 | 2.61 | 7.66 | 177 |
| by-343-1 | Py2 | 0.52 | 3.44 | 4.09 | 9.42 | 14 | 0.98 | 0.10 | 2.31 | 17.4 | 45.5 |
| by-343-1 | Py2 | <0.023 | <0.031 | 0.28 | 0.31 | <5 | 0.63 | 0.031 | 3.43 | 0.64 | 710 |
| by-343-1 | Py2 | <0.020 | 0.14 | 0.27 | 2.36 | 2 | 0.92 | 0.036 | 1.08 | 130 | 112 |
| by-343-1 | Py2 | 2.13 | 22.3 | 15.6 | 1093 | 19 | 8.72 | 0.27 | 2.25 | 378 | 1856 |
| by-343-1 | Py2 | 0.037 | 1.82 | 0.46 | 1.51 | 6 | <0.77 | 0.77 | 1.56 | 138 | 125 |
| hdz-100-7 | Py2 | 0.044 | 0.75 | 1.85 | 5.35 | 6 | 2.07 | 0.71 | 4.11 | 22.3 | 71.9 |
| hdz-100-7 | Py2 | 0.017 | 0.62 | 0.36 | 4.70 | 3 | 0.91 | 0.12 | 3.34 | 17.5 | 1.98 |
| hdz-100-7 | Py2 | 1.95 | 36.4 | 16.8 | 146 | 13 | 2.35 | 0.96 | 4.02 | 28.9 | 17.8 |
| hdz-100-7 | Py2 | 0.25 | 2.33 | 5.70 | 19.3 | 1 | 0.56 | 0.12 | 2.98 | 9.75 | 48.2 |
| hdz-100-7 | Py2 | <0.012 | 0.014 | <0.56 | 0.24 | <4 | 0.29 | <0.058 | 4.39 | 109 | 36.3 |
| hdz-100-7 | Py2 | 0.090 | 1.14 | 0.83 | 173 | 18 | 20.0 | 4.09 | 3.99 | 37.6 | 34.8 |
| hdz-100-7 | Py2 | 0.035 | 0.31 | 0.42 | 2.17 | 1 | <0.74 | <0.049 | 3.62 | 44.6 | 37.4 |
| hdz-100-7 | Py2 | 0.28 | 5.27 | 5.05 | 87.4 | 14 | 0.87 | 0.47 | 4.63 | 14.7 | 47.8 |
| by-80-2 | Py3 | 5.90 | 34.9 | 35.1 | 982 | 30 | 21.6 | 1.57 | 2.35 | 176 | 1161 |
| by-80-2 | Py3 | 1.42 | 5.01 | 14.5 | 2.80 | 6 | 3.41 | 0.15 | 1.89 | 0.24 | 2.78 |
| by-80-2 | Py3 | 2.33 | 13.8 | 17.6 | 110 | 64 | 66.7 | 2.30 | 2.04 | 1386 | 671 |
| hdz-100-5-1 | Py3 | 165 | 2613 | 1803 | 86.4 | 7 | <0.73 | <0.049 | 6.53 | 25.4 | 55.5 |
| hdz-100-5-1 | Py3 | 0.22 | 0.71 | 1.72 | 38.7 | 8 | <0.94 | 0.58 | 3.86 | 12.4 | 15.4 |
| hdz-100-5-1 | Py3 | 66.4 | 581 | 408 | 60.4 | 6 | <0.74 | <0.075 | 4.89 | 120 | 90.8 |
| hdz-100-5-1 | Py3 | 81.5 | 815 | 584 | 265 | 12 | <0.57 | <0.067 | 7.62 | 0.97 | 52.3 |
| hdz-100-5-1 | Py3 | 33.9 | 284 | 334 | 8.23 | 23 | <2.58 | 0.48 | 5.74 | 15.4 | 24.7 |
| hdz-100-5-1 | Py3 | 432 | 4119 | 3034 | 1257 | 12 | <0.95 | 0.027 | 8.22 | 83.3 | 64.0 |
| hdz-100-5-1 | Py3 | 293 | 2121 | 2528 | 2.35 | <0.005 | <0.97 | <0.079 | 7.75 | 35.0 | 67.8 |
Table 2.
Correlation coefficients between Au and other elements of interest.
Table 2.
Correlation coefficients between Au and other elements of interest.
| Au | Ag | Te | Cu | Pb | As | Sb | Se | Co |
|---|
| Ag | 0.97 | | | | | | | | |
| Te | 0.99 | 0.98 | | | | | | | |
| Cu | 0.23 | 0.24 | 0.20 | | | | | | |
| Pb | −0.07 | −0.08 | −0.08 | 0.13 | | | | | |
| As | −0.05 | −0.08 | −0.08 | −0.10 | 0.23 | | | | |
| Sb | −0.07 | −0.09 | −0.10 | −0.05 | 0.35 | 0.76 | | | |
| Se | 0.47 | 0.48 | 0.49 | 0.08 | −0.08 | −0.38 | −0.37 | | |
| Co | −0.06 | −0.06 | −0.06 | 0.08 | 0.17 | −0.07 | −0.06 | −0.19 | |
| Ni | −0.10 | −0.09 | −0.10 | 0.43 | 0.53 | −0.08 | −0.08 | −0.09 | 0.32 |
Table 3.
Equilibrium constant (lnK) and gaseous substance fugacity (logf) of the reactions in each mineral pair at 543.15k (Univariate system).
Table 3.
Equilibrium constant (lnK) and gaseous substance fugacity (logf) of the reactions in each mineral pair at 543.15k (Univariate system).
| Mineral Pair | Reactions | 543.15k |
|---|
| Sulfides | | lnk | LogfS2(g) |
| Ag2S–Ag | 4Ag + S2(g) = 2Ag2S | 29.96 | −13.01 |
| Fe–FeS2 | Fe+ S2(g) = FeS2 | 41.81 | −18.16 |
| Bn + Py–Cp | 5CuFeS2 + S2(g) = Cu5FeS4 + 4FeS2 | 18.13 | −7.87 |
| Tellurides | | lnk | LogfTe2(g) |
| Ag2Te–Ag | 4Ag + Te2(g) = 2Ag2Te | 37.80 | −16.41 |
| AuTe2–Au | Au + Te2(g) = AuTe2 | 19.67 | −8.54 |
| Te(s)–Te2(g) | Te2(g) = 2Te(s) | 16.15 | −7.01 |
© 2019 by the authors. Licensee MDPI, Basel, Switzerland. This article is an open access article distributed under the terms and conditions of the Creative Commons Attribution (CC BY) license (http://creativecommons.org/licenses/by/4.0/).


