Article

Risk Assessment of Contamination by Potentially Toxic Metals: A Case Study in the Vicinity of an Abandoned Pyrite Mine

1
College of Resource Environment and Tourism, Hubei University of Arts and Science, Xiangyang 440153, China
2
Key Laboratory of Soil Environment and Pollution Remediation, Institute of Soil Science, Chinese Academy of Sciences, Nanjing 210008, China
3
School of Civil Engineering and Architecture, Hubei University of Arts and Science, Xiangyang 441053, China
*
Author to whom correspondence should be addressed.
Minerals 2019, 9(12), 783; https://doi.org/10.3390/min9120783
Submission received: 9 October 2019 / Revised: 8 December 2019 / Accepted: 11 December 2019 / Published: 13 December 2019
(This article belongs to the Section Environmental Mineralogy and Biogeochemistry)

Abstract

:
Abandoned mining areas can display soil and water pollution and also a high incidence of endemic diseases. Here, based on preliminary results on mental retardation and high incidence rates of cancers, we investigate the contamination status and potential ecological risk at an abandoned pyrite mine located in Xianju village, Hubei province, central China. The study focused on the three potentially toxic metals As, Pb, and Zn and four other common elements, including Ca, Fe, S, and Se. Soil samples were collected from 12 sites and leachate seeping from five sites. Leachates were strongly acidic compared to the soil, with pH values <3.22. Soil As and Se concentrations exceeded the Chinese Grade II standards for soil environmental quality (GB 15618-2009) (30 and 3 mg·kg−1, respectively), ranging from 33.6 ± 0.7 to 78.2 ± 1.0 mg As·kg−1 dry matter (DM) and 5.3 ± 0.8 to 17.1 ± 1.4 mg Se·kg−1 DM. Arsenic, Fe, Se, and S in leachates all exceeded the Chinese Grade III standard for surface water environmental quality (GB 3838-2002) (0.1, 0.3, 0.03, and 1.0 mg·L−1). The potential ecological risks from Pb and Zn in soils were low, but As in soils and leachates represented a moderate or strong risk to children according to the Nemerow index and hazard quotient. Soil replacement combined with further remediation measures is required to remediate the contaminated area.

1. Introduction

Mining and associated activities have negative environmental impacts during mining operations and for many years afterward. There is more concern regarding the environmental effects of mine tailing sites because the tailings produced during ore processing are characterized by elevated levels of potentially toxic metals that can be released into the environment by erosion and leaching processes [1,2,3]. In most cases, mining areas show high concentrations of hazardous elements in surface waters, groundwaters, and soils and these may represent important geochemical risks to human health and the environment [4,5]. For example, As contained in water, soils, or food products may quickly enter the human body, and chronic As exposure causes gastrointestinal disorders, various types of cancer, hypertension, and cardiovascular disease [6]. Lead can cause induced-anemia, kidney cancer, and acute encephalopathy, the symptoms of which include persistent vomiting, ataxia, seizures, pappiledema, impaired consciousness, and coma, and miscarriages and stillbirths in women [7]. Acid mine drainage is one of the worst environmental problems associated with mining activity. The production of acid mine drainage usually, but not exclusively, occurs in iron sulfide-aggregated rocks when sulfide-bearing material is exposed to oxygen and water [8]. Characterized by a low pH and high concentrations of heavy metals and other toxic elements, acid mine drainage, also referred to as acid rock drainage, can severely contaminate surface and ground-water, as well as soils in the vicinity [9]. Due to the advanced tailings’ oxidation state, as well as the combination of other factors, complex challenges and threats have been presented [10], which are aggravated by the long-term persistence of many hazardous elements in the environment.
A state-owned enterprise for pyrite mining was established in the 1950s to exploit the abundant pyrite resources in Xianju village, Jingmen city, Hubei province. Most of the mined ores were used in the manufacture of sulfuric acid. Although this brought great economic benefits, the development of the project led to numerous secondary environmental problems. There were no management practices for environmental protection and the exploitation of pyrite resources for over forty years has resulted in uncontrolled pollution of spring water and agricultural soils, together with the elimination of plants and animals, and the project has been suspended. Environmental issues that require attention include cleanup of the waste storage yard, the remediation of contaminated soil and water, ecological restoration of the surrounding area, the replacement of soil on the restored agricultural land, rechanneling of the mountain spring, and the removal of auxiliary production equipment and accommodation facilities in the mining area.
The principal use of sulfuric minerals in China is the production of S and sulfuric acid, which consumes >70% of the S produced, which was especially the case in the 1990s [11]. Iron can be recycled in the burning of high-grade pyrite and cement ingredients can be obtained by the burning of low-grade pyrite. Small amounts of silver, gold, copper, aluminum, zinc, and cobalt may also be recovered in the pyrite cinders [12]. Furthermore, about 15 beneficial associated components in pyrite ore and its oxidized ore may be separated and sorted, including copper, gold, silver, gallium, tellurium, cobalt, cadmium, germanium, thallium, and manganese, and this is conducive to the comprehensive development and utilization of pyrite deposits [13]. Historical mining always plays a potential role in the distribution of contaminants in soils and potential human exposure via residential soil [14]. Based on geochemical analysis methods and considering the main potentially toxic metals released during mining operations, the target potentially toxic metals are As, Pb, and Zn, but Ca, Fe, S, and Se are also elements that merit attention because they may affect the storage or release of potentially toxic metals or control potential acidity (as FeS2 and CaCO3) [15].
The large area of the abandoned mine can lead to surface landscape damage, geological mishap, hydrological interference, water and atmospheric contamination, land resource occupation, soil erosion aggravation, and environmental damage [16]. In order to find possible ways of restoring the degraded agricultural soils, samples of soils and leachates were collected from the area and analyzed for concentrations of As, Ca, Fe, Pb, S, Se, and Zn. Compared with the Chinese Grade II standard for soil environmental quality (GB 15618-2009) [17] and Grade III standard for surface water environmental quality (GB 3838-2002) [18], the environmental risk assessment and health risk assessment of the target elements in the study area were examined. This information is required to create a safer farming environment in Xianju village, where agricultural production is the main economic activity.

2. Materials and Methods

2.1. Study Area

The mining area is located in central Hubei province (30°32′–31°36′ N, 111°51′–113°29′ E) near the middle and lower reaches of the Hanjiang river and has a total area of 12,400 km2 at an altitude of 96 m above the mean sea level. The local climate is that of the north subtropical monsoon, with four distinct seasons. The annual average temperature in Jingmen city is 16.6 °C and the annual rainfall is about 1000 mm, with 1690 h of sunshine annually.

2.2. Historical and Current Land Use
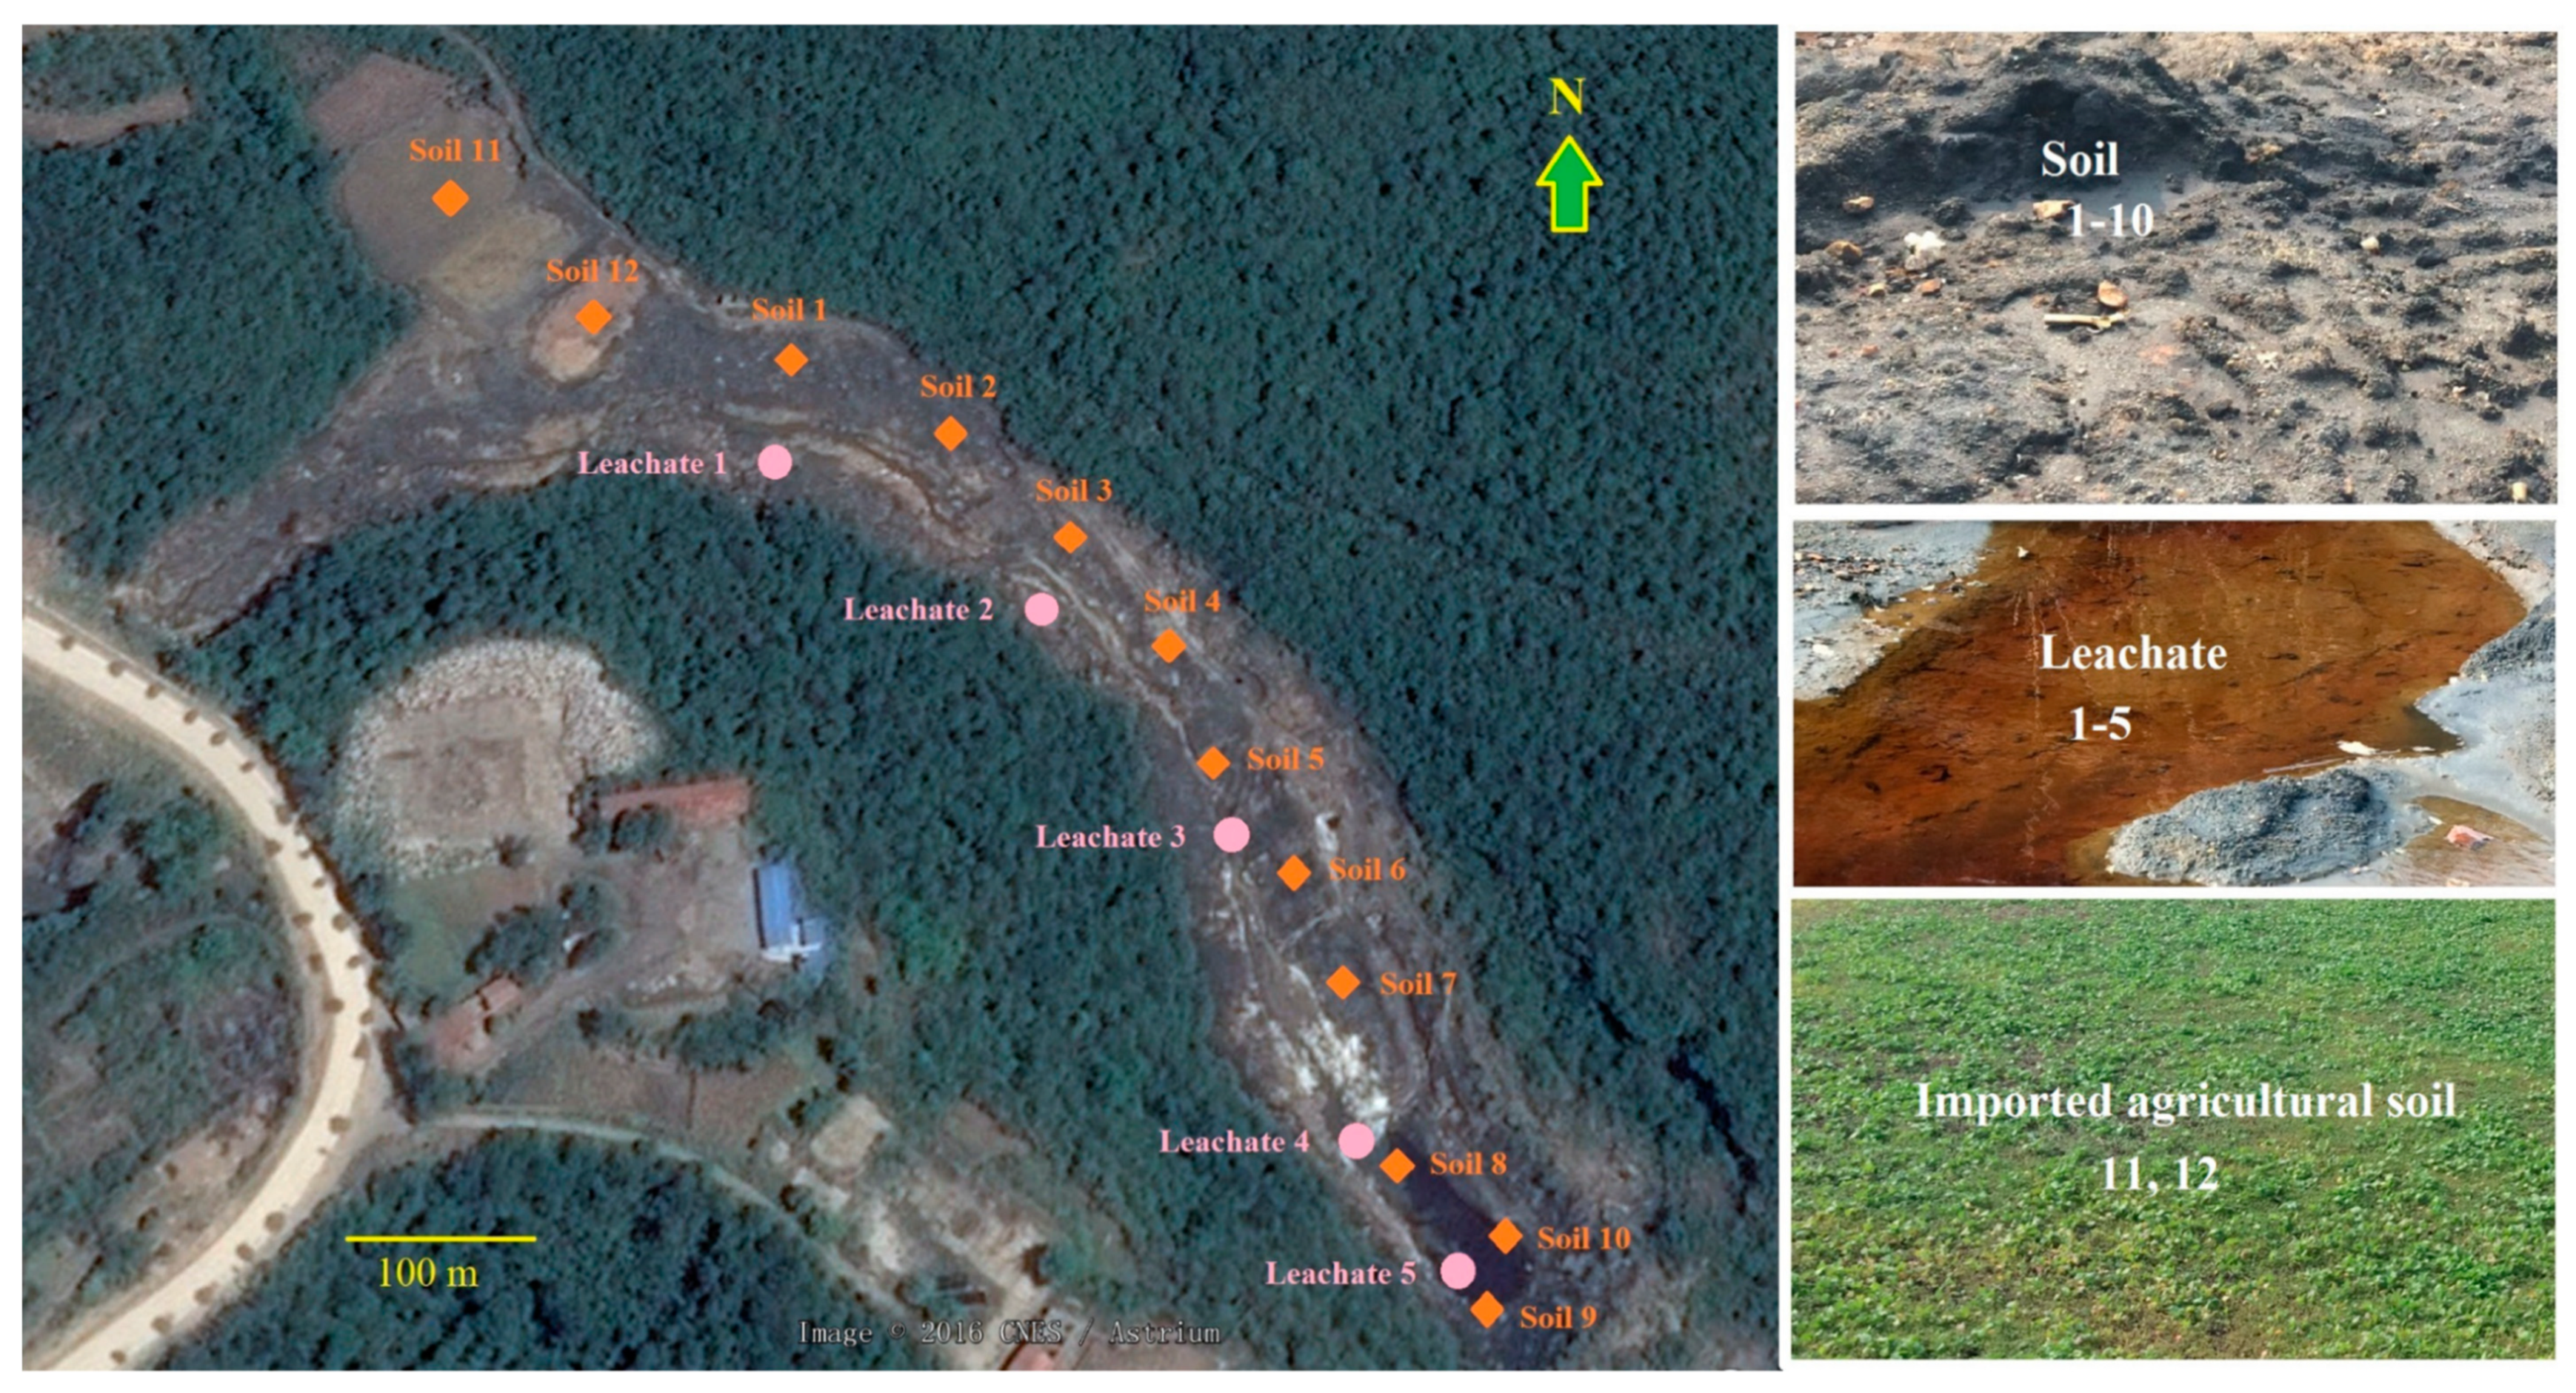
The study was carried out in the pyrite mining project area at Xianju village, Dongbao district, Jingmen, Hubei province, where pyrite extraction was conducted for forty years from the 1950s to the 1990s. Environmental damage has resulted from the construction of accommodation and processing facilities covering an area of about 6.3 × 10⁴ m2. An area of land (1.5 × 10⁵ m2) is covered by mining and washing waste, and 1.1 × 10⁵ m2 of agricultural land is degraded by drainage from mine shafts. More than 20 mountain springs have dried up. Surviving springs have been polluted with mining wastes from the main shaft. Orange-red acidic wastewaters can often be seen and there has been little plant growth for many years. A total area of agricultural land of 2.8 × 10⁵ m2 can potentially be restored and the drinking water of three villages needs to be remediated. Currently, only a small part of the pit area has been refilled with imported soil and leveled up for further agricultural use.

2.3. Sampling

Sampling was conducted in December 2017 using the standard serpentine pattern [19] in the main mining pit of about 2.2 × 10⁵ m2, where the color of the soil layer was clearly metallic black and that of the drainage was brownish red (Figure 1). Thirty-six soil samples were collected from 12 sampling sites almost evenly distributed in the main mining pit from the six 15-cm-deep increments of the soil profile from 0 to 90 cm in the study area. The samples were collected using a stainless-steel spade and transferred to linen cloth sample bags. In addition, fifteen drainage water samples were collected in triplicate from five sampling sites and transferred to brown glass bottles. The soil and water samples were transported to the laboratory. The soil samples were air-dried at room temperature and passed through 0.15-mm and 0.85-mm sieves for determination of the target elements and selected physico-chemical properties. The water samples were immediately stored at 4 °C, prior to chemical analysis.

2.4. Standards, Reagents, and Equipment

Certified reference materials (CRM) GBW07404 (GSS-4) were purchased from the Institute of Geophysical and Geochemical Exploration (Langfang, China). All reagents used were guaranteed reagents purchased from the National Pharmaceutical Group Chemical Reagent Co., Ltd., Shanghai, China and Aladdin (Aladdin Industries Corp., Hangzhou, China). All glassware used was immersed in 10% (v/v) HNO3 for >48 h before washing with Milli Q ultrapure water (18.2 MΩ·cm, Millipore, Burlington, MA, USA) >five times and blowing dry in a 100-class air clean bench. A standard solution of sulfur was purchased from Fluka Chemie AG, St. Gallen, Switzerland, and standards of the other target elements were purchased from Merck KGaA, Darmstadt, Germany. Working standard solutions of the target elements were prepared by dilution of the standard solutions with 70% (v/v) HNO3.

2.5. Sample Preparation

The soil pH was determined by the standard method in water at a soil:water ratio of 1:2.5 (w/v) using a glass electrode (Table 1 and Figure 2d). The average topsoil conductivity was 13.3 ± 2.3 mS·cm−1 and the cation exchange capacity (CEC) was 11.31 ± 0.52 c mol (+)·kg−1 [20]. The average texture of the soils collected was (dry matter/DM basis) 8.3% clay, 71.5% silt, 20.2% sand, and 3.2–10.9% organic matter. The soil also had total N, P, and K concentrations of 0.36 ± 0.07, 0.59 ± 0.03, and 1.30 ± 0.07 g·kg−1, and available N, P, and K concentrations of 69.7 ± 29.1, 34 ± 21, and 28 ± 3 mg·kg−1, respectively. The soil pH condition; organic matter content; mechanical composition; and (total and available) N, P, and K were determined according to the methods of Lu [20]. The water samples were transported to the laboratory and stored at 4 °C for <5 days before determination of the target elements.

2.6. Sample Analysis

The total contents of As, Ca, Fe, Pb, and Zn in the soil samples were determined by inductively coupled plasma-mass spectrometry (ICP-MS; Thermo X7, Thermo Scientific, Waltham, MA, USA) and Se was determined by UV-VIS spectrometry (UV-2550; Shimadzu Corporation, Kyoto, Japan) after digestion with a Multiwave GO microwave digestion system (Anton Paar GmbH, Graz, Austria), following the method of Reddy et al. [23]. Aliquots of 0.5000 ± 0.0005 g soil samples were transferred directly into separate microwave polytetrafluoroethylene vessels and mixed with 10 mL of 70% (v/v) HNO3 for 5 min, before sealing. The digestion power was ramped to 1200 W (15 min) and then held at 1200 W (15 min). The digests were filtered into 50 mL volumetric flasks, brought up to volume with Milli Q ultrapure water (18.2 MΩ·cm), transferred to plastic bottles, and stored at 4 °C before analysis [23].
Concentrations of sulfur were determined after digestion as follows. Aliquots of 0.1000 ± 0.0002 g soil samples were transferred to separate microwave polytetrafluoroethylene vessels with 6.0 mL of HNO3 and 1.5 mL of hydrogen fluoride (HF), after gentle swirling. The digestion power was ramped to 700 W (10 min), then to 1000 W (10 min), and then to 1500 W (35 min), before being turned down for one hour. The digests were heated at 180 °C to nearly dry before 2.1 mL of 6.0 mol·L−1 HNO3 was added, and were then heated again at 80 °C for 10 min. The digests were treated as above before analysis [24]. Silica (quartz sand) and Milli Q ultrapure water were used as blank samples of soil and water. CRM aliquots were also determined simultaneously together with blank and parallel samples in triplicate in each batch of samples. The confidence interval used for the results was 95%.
Before determination of the seven target elements in the water samples using ICP-MS, 2 mL of 70% HNO3 was added per 100 mL of drainage to maintain the stability of the samples after filtration through a 0.45-µm polycarbonate membrane filter [25,26]. Standard curves and regression equations were used for quantitative analysis of the target elements. The calculation of detection limits follows the description of Broekaert [27].

2.7. Potential Ecological Risk Assessment

The model developed by Hakanson [28] has been proposed as a critical diagnostic tool for the ecological risk assessment of potentially toxic metals and is widely used in water pollution control because of increasing potentially toxic metal contents in sediments and their subsequent release into the water, which may pose an environmental threat. Following the equation provided by Hakanson [28], the potential ecological risk coefficient ( E i r ) of single elements was calculated to evaluate the ecological risk of different elements in the soil and the potential ecological risk index (RI) of multiple elements was calculated:
E i r = T i r × C i f = T i r × C i s C i n ,
where T i r is the toxicity response factor of potentially toxic metal i, indicating the toxicity level and biological sensitivity; C i f is the contamination factor of potentially toxic metal i; C i s is the determined concentration of the target potentially toxic metal i in the soil; and C i n is the background or control concentration of potentially toxic metal i, namely 30, 280, and 200 for As, Pb, and Zn, respectively [28]. The toxicity response factors of the target elements As, Pb, and Zn were 10, 5, and 1, respectively [28]. The degree of ecological risk was categorized as low when <40, moderate when 40 to 80, considerable when 80 to 160, high when 160 to 320, and very high when >320.
R I = i = 1 n E i r ,
where n is the number of the evaluated potentially toxic metals in soil samples, which is 3 in this study. With reference to the modification recommended by Wu et al. [21], the category of RI degree is low risk when <100, moderate risk when 100 to 200, considerable risk when 200 to 400, and very high risk when >400.
To evaluate the water quality, an improved Nemerow index was calculated according to the modification of Deng et al. [29], as follows:
P i = ( p i j max ) 2 + ( p i j a v g ) 2 2 ,
where P i j max is the maximum single-factor pollution index value and P i j a v g is the average value of the single-factor pollution index. The index of single-factor pollution is achieved by determining the concentration of potentially toxic metal i divided by its value, according to the Grade III surface water quality of the national standard in China (GB 3838-2002) [18]. The classification of the Nemerow index P i is as follows [30]: <1, not contaminated; between 1 and 2, slightly contaminated; between 2 and 3, moderately contaminated; between 3 and 5, strongly contaminated; and >5, seriously contaminated.
The current study did not involve humans or experimental animals. Ecological security includes interactions between contaminated soils or waters and the living organisms in the contaminated area. Potentially toxic metal concentrations in the soils might directly affect human health, and health risk assessment is conducted by calculation of the hazard quotient (HQ) [31], according to the method of Li et al. [32]. The potential for chronic (non-carcinogenic) effects is evaluated by comparing an exposure (oral soil ingestion) level over a specified time period with a reference dose (RfD) for a similar exposure period [32], and is 0.0003, 0.0035, and 0.3 mg·d·kg−1 for As, Pb, and Zn, respectively [33,34]. The chronic effects of multiple elements are developed as the hazard index (HI) [31]. Indices are calculated by the following equations [31,33]:
A D D = C × I R × E F × E D B W × A T
H Q i = A D D R f D i
H I = i = 1 n H Q i ,
where ADD is the average daily dose; C is the determined potentially toxic metal concentration (mg·kg−1) in soil; and IR is the soil ingestion rate, which is suggested to be 100 mg·d−1 [35]. The average body weight (BW) is assumed to be 15 kg in children and 70 and 60 kg in adult males and females, respectively [32]. The exposure frequency (EF), exposure duration (ED), and average time (AT) for chronic effects are suggested to be 350 d·y−1, 6 y, and 2190 d, respectively [30]. The classification of HQ or HI values follows the scheme <1, no clear adverse risk, even in sensitive populations, and >1, potential for chronic effects must be seriously considered [31,33].

2.8. Statistical Analysis

All data were processed with Microsoft Excel 2013 (Microsoft Corporation, Redmond, WA, USA) and the Origin 2017 (OriginLab Corporation, Northampton, MA, USA) software package. Differences were assessed by one-way analysis of variance (ANOVA), followed by Tukey’s test, to compare the concentrations, E i r , RI, P i , and HI, and a probability level of p < 0.05 was considered to be significant. Correlation analysis was conducted using Pearson correlation at levels of p < 0.05, <0.01, and <0.001 with a two-tailed test of significance to find the correlations between different target elements in the soil samples collected. Normality and homoscedasticity were checked using the Shapiro–Wilk test before analysis of variance and Pearson correlation analysis. The principal component analysis (PCA) procedure followed Kulkarni et al. [36], after log ratio transformation of the data.

3. Results

The calibration curves and detection limits of the seven target elements determined are listed in Table S1 to confirm the reliability of the data. From the R values of different determined elements (all >0.999), the results of the instrumental analysis may be considered to be reliable. The detection limits of the different elements ranged from 0.533 to 6.173 µg·L−1, thus meeting the requirements for trace element analysis and detection. The CRM results indicate that the values determined were generally within the given confidence intervals, indicating that the procedures used produced quantitative measurements.
The positions of different sampling sites have been marked in Figure 1. At every sampling site, the samples were collected and determined in triplicate. All concentrations of the seven target elements in the 36 soil samples and 15 leachates collected and their pH values were determined. For the sake of comparison and subsequent calculations, pH values and the concentrations of As, Pb, and Zn are listed in Table 1, and concentrations of Ca, Fe, S, and Se are shown in Table S2. In order to assess the degree of elemental pollution, the standard values of different elements in Chinese soils and surface waters are also shown.
As shown in Table 1, there was large variation in the pH values and in the soil concentrations of As and Pb; pH values; and As, Pb, and Zn concentrations in water samples. Except for the soils at sites 11 and 12 (which were neutral), all the pH values of the soil and water samples were acidic. All the determined values of As in soils 1 to 10 and water samples 1 to 5 exceeded the corresponding Chinese standard for environmental quality, i.e., 30 mg·kg−1 in the Grade II standard for soil environmental quality (GB 15618-2009) [17] and 0.1 mg·L−1 in the Grade III standard for surface water environmental quality (GB 3838-2002) [18]. In Table S1, concentrations of Se in the same group of samples also exceeded the standard value, i.e., 3 mg·kg−1 in the Grade II standard for soil environmental quality (GB 15618-2009) [17] and 0.03 mg·L−1 in the Grade III standard for surface water environmental quality (GB 3838-2002) [18]. Determined values of Fe and S in leachates (but not in soils) were >0.3 and 1.0 mg·L−1, which is the Grade III standard for surface water environmental quality (GB 3838-2002) [18]. Compared with target values in the Netherlands for different potentially toxic metals, the soil exceedance rate changed little. However, Pb and Zn in all water samples greatly exceeded the Dutch target values.
The correlation coefficients of different elements obtained by Pearson correlation analysis in soils and leachates are listed in Table 2 and Table 3. Comparing the seven target elements in soils, the correlations between Se and all other elements (except Ca) were the highest (p < 0.001), and the correlations between the three physical and chemical properties of soils and seven target elements were almost all significant (p < 0.001), except Ca (p > 0.05) and Zn (p > 0.05). However, in leachates, the correlations between determined elements were weaker, especially in the case of Fe.
The concentrations of three potentially toxic metals at different depths in the soil profile are shown in Figure 2. In Figure 2a, the concentration distribution of As in the topsoil (0–15 cm depth) at each sampling site was relatively dispersed, ranging from 22.7 ± 0.8 to 78.2 ± 3.3 mg·kg−1, which can also be seen from the results of the one-way ANOVA followed by Tukey’s test (p < 0.05) in Table 1. The concentrations of As at different depths at sampling site 10 were higher than at other sampling sites and the concentration also decreased gradually with an increasing depth. The As concentration at 60 cm at sampling site 6 increased again, in contrast to the other sites. Arsenic in restored agricultural soils was relatively low compared with other samples from the abandoned mining area, especially in topsoils at depths 0 to 30 cm. In Figure 2b, the concentration ranges of Pb fell in two regions, namely the abandoned mining area between 33.0 ± 4.8 and 60.7 ± 5.8 mg·kg−1 and the restored farmland soil from 25.4 ± 2.3 to 26.7 ± 1.1 mg·kg−1. Although the standard errors of the average concentrations of Pb in the abandoned mining area were large, a significant difference (p < 0.05) was also found between these and the soils from the restored agricultural land. Lead in soils from sampling sites 9 and 10 showed similar trends to As at sampling site 10. In Figure 2c, no clear differences were observed in the concentrations of Zn among the various test soils (p > 0.05).
In Figure 3a, based on the PCA of 36 soil samples in terms of the contamination status from the study area (except sample 6-3), all soils samples can be divided into two groups: group A and group B, namely samples in the right circle and samples in the left small circle, respectively. The former are soil samples with lower pH values and higher concentrations of the seven target elements and the latter are samples with higher pH values (almost neutral) and lower contamination. However, in Figure 3b, leachates from different sampling sites showed considerable variability.
Using the method of Hakanson [28], the potential ecological risk coefficient ( E i r ) of single As, Pb, and Zn at 12 soil sampling sites was calculated to evaluate the ecological risks of the different elements in the soil and the potential ecological risk index (RI) values of multiple elements are listed in Table 4. According to the assessment classification of the potential ecological risk, the single potential ecological risks of As, Pb, and Zn were all at low levels. All the RI values of the 12 assessed sampling sites were <100, indicating low degrees of contamination.
Using the improved Nemerow index, the degree of contamination with As, Pb, and Zn in leachates from five sampling sites was assessed and the results are listed in Table 5. At all five sampling sites, moderate or strong contamination with As was found. The degrees of pollution with Pb and Zn were both low in the leachates. The HQ of target As, Pb, and Zn for single pollutant health risk assessment and the HI used in the assessment of chronic effects of multiple elements have been calculated and are listed in Table 6. According to the classification, an HQ or HI > 1 indicates the existence of a health risk, usually by oral soil ingestion exposure. From the results, at sampling sites 2–4, 7–10, the health risk to children is a matter of concern. No chronic exposure risk was found in the restored agricultural areas (sampling sites 11 and 12).

4. Discussion

This study was triggered by the first awareness of a high endemic disease incidence in the last 20 years, and observations of large areas of bare black land and the orange wastewater observed at the abandoned mining area (Figure 1). Clearly, the improper exploitation of mineral resources has brought about increasing environmental pollution and a decline in the agricultural production capacity.

4.1. Soil and Water Acidification

The Chinese soil pH classification system recognizes five levels [37]: Grade I, >7.5; Grade II, 6.5 to 7.5; Grade III, 5.5 to 6.5; Grade IV, 4.5 to 5.5; and Grade V, <4.5. However, no detailed standards have been set for soils of pH 0.0 to 6.5. There is no classification based on the soil pH for target values in the Netherlands and the target values for elements are relatively lower than those in China. The source of soil acidity in mining areas is mainly acid leachates and the danger is more difficult to assess than that of acid rain [38] because it is difficult to know the duration of flow of the leachate and the magnitude of the contribution to acidity and potentially toxic metals on an annual basis. Acid soils are harmful to many plant species and can affect the roots through direct contact with the soil. Acidic conditions can increase the membrane permeability, malondialdehyde (MDA) content, and H2O2 and O2 contents in plant roots [38], in addition to the main adverse effect of aluminum toxicity and occasionally, other metal ions, such as Mn2+ [39]. In the present study, soil pH values were significantly correlated with the two potentially toxic metals, As and Pb (p < 0.001), but not with Zn. In another study, the total arsenic in vegetable soil was reported to be significantly positively correlated with the pH value when soil samples collected from the surrounding areas of the Shuikoushan mining area in Hunan Province of south-central China were analyzed [40]. Even when investigating concentrations of As in soils of five industrial sites in an urban area of Beijing, China, the concentrations of As were significantly correlated with the soil pH [41]. Pb was significantly negatively correlated with the soil pH and organic matter content in the results of a geographical and pedological drivers of distribution investigation of seven metals (Cd, Cu, Cr, Ni, Pb, V, and Zn) in British soils [42]. Total concentrations of Pb in surface sediment from the East Dongting Lake wetlands were significantly correlated with soil pH [43]. In our study, soil pH values were also significantly correlated with the other target elements Ca, Fe, S, and Se (p < 0.05), indicating that soil pH conditions may have affected the morphology and activity of target elements. Many plant species are not adapted to survive in these conditions and cannot grow in contaminated areas because of acid erosion and elemental toxicity [44,45].
The leaching of nutrient ions from acid soils is also a major factor contributing to a decline in soil fertility [46] consistent with the contents of N, P, and K found in the soils of the study area (Table S3). Elements such as Fe, Cu, and Zn are more soluble with a higher bioavailability under acidic conditions, but other trace elements mainly existing as oxyanions such as Sb [47] show the opposite trend. There are high concentrations of Fe in pyrite cinders and Fe (hydr)oxides are expected to be the dominant sorbent for trace elements, and the concentrations of dissolved Fe in acid soils may increase significantly [48]. Furthermore, the soil microbiome can be affected by soil acidification [49], including a decline in bacterial richness through ecological filtering (EF). After soil acidification, the number of beneficial microorganisms in the soil may decline and the growth and activity of beneficial microorganisms may be inhibited, thus affecting the decomposition of soil organic matter and the cycling of C, N, P, and S in the soil [50,51]. Soil pH accounts for a large proportion of the variation in soil bacterial diversity across different terrestrial ecosystems and is integrated with the effects of numerous ecological factors, such as nutrient availability, vegetation type, and soil moisture content [52], and other factors (e.g., trace element contents) may also have some effects on soil bacterial diversity [49].

4.2. Contamination and Risk from Different Elements

The concentrations of Fe and S are high in pyrite mining areas, but the exceedance of the Grade II standard for soil environmental quality (GB 15618-2009) [17] (Table 1) in terms of As and Se concentrations in soil at sampling sites 1 to 10 and that of leachates 1 to 5 of the Grade III standard for surface water environmental quality (GB 3838-2002) [18] (Table S2) are unexpected. Arsenic is a known toxin and carcinogen that is present in the environment and may be responsible, at least in part, for the high incidence of cancer in the area. Positive correlations between the generation of reactive oxygen species (ROS), DNA damage, tumor promotion, and As exposure have been found [53]. The toxicity of As could also be affected by arsenic species [7]. Inorganic arsenicals are widely held to be the species that account for the toxic and carcinogenic effects of this metalloid, and both methylated and dimethylated arsenicals have been detected in human cells cultured in the presence of inorganic As and in the urine of individuals after chronic exposure to inorganic As [54]. Understanding the resource and metabolism of As may be critical in assessing the risk associated with chronic exposure to this element. Anthropogenic sources of As include municipal, industrial, and domestic waste disposal into the water system, and coal combustion is also a source of As pollution in different environmental matrices [55]. Arsenic exists in over 200 various forms in minerals, of which around 60% are arsenates; 20% are sulfides and sulfosalts; and 20% are oxides, arsenide, arsenates, silicates, and elemental As [56].
Although the degree of pollution with Pb in water samples was low, as calculated by Chinese standards, it is worth comparing the results with target values used in the Netherlands. The toxicity of Pb is a particularly insidious hazard, with the potential to cause irreversible health effects. It is known to primarily interfere with the central nervous, hematopoietic, hepatic, and renal systems, producing serious disorders [57], and this may explain the high rates of mental retardation found in children in the study village. Its chronic toxicity can present itself as persistent vomiting, encephalopathy, lethargy, delirium, convulsions, and coma [58]. From the results in Table 5, the degree of risk from As contamination in water samples is more than moderate, and there is a high probability of environmental risk to human beings. For abandoned mine areas, the local water resources are often severely contaminated with As, like in the abandoned tungsten mine in Shantou City, southern China [59]. Even in places without abandoned mines, the Nemerow pollution index of As, Zn, and Pb (average 5.8) suggests that 13 sampling sites from Deception Bay in Southeast Queensland, Australia, are heavily contaminated, highlighting the importance of increasing understanding of the consequent public health and ecological risks [60]. The most prevalent and permanent disability of childhood is mental retardation, which occurs in 1–3 percent of all children [61]. A significant relationship between mental retardation or developmental disability and As has been identified and Pb has been the most widely studied neurotoxic substance with respect to neurodevelopmental disorders. [61]. As and Pb have been associated with various forms of cancer, and the occurrence of As and Pb in drinking water is considered an important pathway of potential exposure for citizens of different nations [62]. The consistency between the high degree of As pollution, the potential risk from Pb, and the actual disease incidence in humans, including mental retardation of children and high incidence rates of cancers, testify to the importance of this study.
Contamination with Se is also a potential problem, as indicated in Table S2. Having similar chemical properties, Se and S are found together in weathered materials, reflecting a possible original association [63], which may explain the high concentrations of Se in the abandoned pyrite mining area. Based on the geochemical survey and land quality evaluation data collected in Hubei province, the background value and range of Se contents in the parent soil of the whole province have been found to be 0.304 and 0.152 to 0.609 mg·kg−1, respectively [64], which are higher values than the background values found nationally and globally in soils [65,66,67].
Inorganic and organic Se can exchange roles via a series of reactions in the intracellular environment [68]. After entering cells in animals and humans, inorganic Se is metabolized to selenide via different pathways [69]. It has been reported that low concentrations of Se are an efficacious anticarcinogen, whereas high concentrations of Se can induce carcinogenesis, cytotoxicity, and genotoxicity [70,71]. Arsenic and Se can also induce similar toxicity via different pathways [64] and this gives rise to concern in our study area. The pollution and ecological assessment showed low contamination and ecological risk, which is different from our previous assumptions, similar to a former study conducted by Xiang et al. [72].

4.3. Potential for Remediation and Land Use

The PCA results and the potential ecological risk assessment by calculation of the RI indicate that the soil is relatively healthy in the restored agricultural land, because the values of RI were very low; less than 1/4 compared with the references values of 100 for “low risk”. In another study, where ecological risk was calculated by the potential ecological RI of soils from four sampling sites from Daye City, site 1, site 2, and site 3 were at a low potential ecological risk, while site 4 was at a moderate ecological risk [73]. However, the values of the Nemerow index [60] and HQ indicate the possibility of some health risk resulting from As for children from 7/12 of the sampling sites (2–4, 7–10), because HI > 1 indicates the existence of a health risk (Table 5 and Table 6). The health risk to children should also be perceived as a great concern because the actual disease incidence for local children with mental retardation or cancers is so much higher than normal [61]. In contrast, the restored agricultural soil is much safer at the surface and this emphasizes the need for pollution control and abatement. However, the method by which the soil is replaced with soil from external sources is too expensive for the large volume of the pit area and the potential risk of re-contamination by capillary action which has already started to occur. In order to completely mitigate the adverse environmental impacts of acid leachate from the abandoned mining area, it is necessary to carry out a comprehensive project design treatment at a suitable cost, to ensure that the discharged leachates meet the standard limits for surface waters, and to guarantee that the contaminated soil is suitable for food production.
Soil washing with chelants can effectively remove the labile (mobile and available) part of heavy metal species present in a soil solution or weakly bound to the soil solid phases [74]. There are high stacks of gangue slime and tailings in the field and acid leaching fluid can flow directly onto the land at lower levels and cause acidification. In order to reduce the environmental pollution caused by the transfer of acid leachate, special ditches can be dug to collect the leachate into acidic water pools to facilitate centralized treatment. Based on the principle that acidic fluids can be neutralized with lime, the acidic wastewaters can be fully neutralized by controlling the amount of lime and the by-product (gypsum) can also be recycled. The neutralized acid byproduct with high concentrations of potentially toxic metals can be treated with Ethylene Diamine Tetraacetic Acid (EDTA) firstly, and may then be remediated with the aid of hyperaccumulator plant species such as Sedum plumbizincicola and Eremochloa ciliaris [75] before the resumption of productive use, in the case that the pH of the soils of the study area is too low for plant growth [76]. It is also necessary to apply moderate rates of calcium carbonate, although our results indicate that the concentrations of Ca in the abandoned mining area are quite high. Referring to early research, the establishment of a cover by the manual application of limestone, fertilizer, and selected plants for the remediation of acid heavy metal contaminated land could be proceeded [77,78,79,80,81,82]. To restore soil productivity before vegetation is introduced, abundant basal fertilizers (such as farmyard manures) must be applied to increase the soil organic matter content, increase the soil permeability, promote rhizosphere microbial activity, convert insoluble mineral elements into bioavailable soil nutrients, and generally increase land productivity. Acid-tolerant plants such as Estuca elata, Cynodon dactylon, Miscanthus sinensis, Indigofera pseudotinctoria, Lespedeza bicolor, Crotalaria pallida, Parthenoeissus trieuspidata, and Puerarialobata may be planted in acid soils or acid rock slopes in the study area [83]. Stereocaulon exutum has a possible practical application for the biomonitoring or risk assessment of heavy metal pollution at abandoned mine sites [84]. Additionally, the removal of heavy metals from metal containing soil or sediment could be performed by various groups of microorganisms, such as chemolith-autotrophic bacteria [85]. Laboratory remediation experiments have been carried out with several different combined chemical and phytoremediation methods. The details of methods for and effects of eliminating target metal contamination and health risk will be discussed in the future.

5. Conclusions

Both soil and surface water contamination in the abandoned mining area were observed and represent a potential risk to humans in the surrounding area. Contamination with As in the abandoned pyrite mine has resulted in a substantial contamination risk to children, but a low degree of pollution compared with the Chinese quality standards for soils and surface waters. However, it is not possible to cut off the acid effluent from mountain slopes at the abandoned mine and a suitable environmental improvement program needs to be devised based on methods used for sewage water treatment and recycling. A more effective method for the regeneration of land resources, treatment of the acidic leachate, and other remediation measures should be implemented for the long-term restoration of agricultural production.

Supplementary Materials

The following are available online at https://www.mdpi.com/2075-163X/9/12/783/s1, Table S1: Calibration curves and detection limits of target elements determined; Table S2: Determined concentrations of Ca, Fe, S, and Se in samples collected; Table S3: Determined values of nutrition elements.

Author Contributions

Conceptualization, W.Z.; formal analysis, T.M.; funding acquisition, T.M.; investigation, Y.L.; methodology, T.M. and X.Y.; project administration, X.Y. and Y.L.; resources, W.Z.; software, W.Z.; validation, X.Y.; visualization, P.C.; writing—original draft, T.M.; writing—review and editing, P.C. and Y.L.

Funding

This study was funded by the National Natural Science Foundation of China (41877127 and 41401581); the Original Agro-Environmental Pollution Prevention and Control Key Laboratory, Ministry of Agriculture/Tianjin Agro-Environment and Safe Product Key Laboratory (18nybcdhj-2); Hubei Province Natural Science Fund (2018CFC873); the Key Laboratory of Soil Environment and Pollution Remediation, Institute of Soil Science, Chinese Academy of Sciences (SEPR2017-02); and the Training Fund Program for Scientific Research of Hubei University of Arts and Science (2019 KYPY001).

Conflicts of Interest

The authors declare no conflicts of interest. The founding sponsors had no role in the design of the study; in the collection, analyses, or interpretation of data; in the writing of the manuscript; and in the decision to publish the results.

References

  1. Angelovičová, L.; Fazekašová, D. Contamination of the soil and water environment by heavy metals in the former mining area of Rudňany (Slovakia). Soil Water Res. 2014, 9, 18–24. [Google Scholar] [CrossRef] [Green Version]
  2. Musilova, J.; Arvay, J.; Vollmannova, A.; Toth, T.; Tomas, J. Environmental contamination by heavy metals in region with previous mining activity. Bull. Environ. Contam. Toxicol. 2016, 97, 1–7. [Google Scholar] [CrossRef] [PubMed]
  3. Baragaño, D.; Forján, R.; Aguado, J.M.M.; Martino, M.C.; García, P.D.; Rubio, J.M.; Rueda, J.J.Á.; Gallego, J.L.R. Reuse of Dunite Mining Waste and Subproducts for the Stabilization of Metal(oid)s in Polluted Soils. Minerals 2019, 9, 481. [Google Scholar] [CrossRef] [Green Version]
  4. Anawar, M.H.; Garcia-Sanchez, A.; Murciego, A.; Buyolo, T. Exposure and bioavailability of arsenic in contaminated soils from the La Parrilla mine, Spain. Environ. Geol. 2006, 50, 170–179. [Google Scholar] [CrossRef]
  5. Mileusnić, M.; Mapani, B.S.; Kamona, A.F.; Ružičić, S.; Mapaure, I.; Chimwamurombe, P.M. Assessment of agricultural soil contamination by potentially toxic metals dispersed from improperly disposed tailings, Kombat mine, Namibia. J. Geochem. Explor. 2014, 144, 409–420. [Google Scholar] [CrossRef]
  6. Jomova, K.; Jenisova, Z.; Feszterova, M.; Baros, S.; Valko, M. Arsenic: Toxicity, oxidative stress and human disease. J. Appl. Toxicol. 2011, 31, 95–107. [Google Scholar] [CrossRef]
  7. Papanikolaou, N.C.; Hatzidaki, E.G.; Belivanis, S.; Tzanakakis, G.N.; Tsatsakis, A.M. Lead toxicity update. A brief review. Med. Sci. Monit. 2005, 11, RA329–RA336. [Google Scholar]
  8. Akcil, A.; Koldas, S. Acid mine drainage (AMD): Causes, treatment and case studies. J. Clean. Prod. 2006, 14, 1139–1145. [Google Scholar] [CrossRef]
  9. Peppas, A.; Komnitsas, K.; Halikia, I. Use of organic covers for acid mine drainage control. Miner. Eng. 2000, 13, 563–574. [Google Scholar] [CrossRef]
  10. Elghali, A.; Benzaazoua, M.; Bussière, B.; Thomas Genty, T. Spatial Mapping of Acidity and Geochemical Properties of Oxidized Tailings within the Former Eagle/Telbel Mine Site. Minerals 2019, 9, 180. [Google Scholar] [CrossRef] [Green Version]
  11. Wei, E. Present situation, problems and suggestions as to pyrite-roasting sulphuric acid production in China. Sulphuric Acid Ind. 2002, 6, 1–4. [Google Scholar]
  12. Bilston, D.W.; Bruckard, W.J.; McCallum, D.A.; Sparrow, G.J.; Woodcock, J.T. Comparison of Methods of Gold and Silver Extraction from Hellyer Pyrite and Lead-Zinc Flotation Middlings; Springer: Dordrecht, The Netherlands, 1990. [Google Scholar]
  13. Luo, D.; Yi, P.; Liu, J. Study and Development on the Comprehensive Utilization of Iron Pyrite Cinder. Ind. Saf. Dust Cont. 2003, 29, 10–12. [Google Scholar]
  14. Middleton, D.; Watts, M.J.; Beriro, D.J.; Hamilton, E.M.; Polya, D.A. Arsenic in residential soil and household dust in Cornwall, south west England: Potential human exposure and the influence of historical mining. Environ. Sci. Process. Impacts 2017, 19, 517–527. [Google Scholar] [CrossRef] [PubMed] [Green Version]
  15. Liu, D.; Wen, S.M.; Xian, Y.J.; Shen, H.Y.; Bai, S.J.; Zheng, H.L. Comprehensive Utilization of Pyrite with High Content of Asrenic. Adv. Mater. Res. 2012, 524, 965–968. [Google Scholar] [CrossRef]
  16. Zhang, Q. Summarization of ecological restoration in mining wasteland. Jiangsu Environ. Sci. Technol. 2008, 21, 142–144. [Google Scholar]
  17. GB 15618-2009. Environmental Quality Standards for Soils of China; Ministry of Ecology and Environment of the People’s Republic of China: Beijing, China, 2009.
  18. GB 3838-2002. Environmental Quality Standards for Surface Water of China; Ministry of Ecology and Environment of the People’s Republic of China: Beijing, China, 2002.
  19. Sun, Z.; Li, Q.; Li, P.; Jiang, S. Effects of grazing exclosure years on soil microorganism and enzyme activities in Seriphidium transiliense Desert. Bull. Soil Water Cons. 2018, 38, 14–18. [Google Scholar]
  20. Lu, R.K. Soil Science Society of China. In Analysis Methods of Soil Agricultural Chemicals; Science and Technology of China Press: Beijing, China, 1999. [Google Scholar]
  21. Wu, Q.; Leung, J.Y.S.; Geng, X.; Chen, S.; Huang, X.; Li, H.; Huang, Z.Y.; Zhu, L.B.; Chen, J.H.; Lu, Y.Y. Heavy metal contamination of soil and water in the vicinity of an abandoned e-waste recycling site: Implications for dissemination of heavy metals. Sci. Total Environ. 2015, 506, 217–225. [Google Scholar] [CrossRef]
  22. Islam, M.S.; Ahmed, M.K.; Habibullah-Al-Mamun, M.; Masunaga, S. Trace metals in soil and vegetables and associated health risk assessment. Environ. Monit. Assess. 2014, 186, 8727–8739. [Google Scholar] [CrossRef]
  23. Reddy, M.; Moodley, R.; Jonnalagadda, S.B. Elemental uptake and distribution of nutrients in avocado mesocarp and the impact of soil quality. Environ. Monitor. Assess. 2014, 18, 4519–4529. [Google Scholar] [CrossRef]
  24. Xu, G.R.; Qu, J.G.; Chang, Y.; Tang, A.L. Accurate Determination of Sulfur Content in Sediments by Double Focusing Inductively Coupled Plasma Mass Spectrometry Combined with Microwave Digestion and Studies on Related Matrix Effect. Chin. J. Anal. Chem. 2016, 44, 273–280. [Google Scholar] [CrossRef]
  25. Raue, B.; Brauch, H.J.; Frimmel, F.H. Determination of sulphate in natural waters by ICP/OES—comparative studies with ion chromatography. Fresenius J. Anal. Chem. 1991, 340, 395–398. [Google Scholar] [CrossRef]
  26. Gao, G.; Zhang, Q.L.; Yang, Y.; Liang, P.F. Determination of 10 heavy metal elements in water and food by inductively coupled plasma mass spectrometry. Chin. J. Health Lab. Technol. 2013, 23, 2429–2432. [Google Scholar]
  27. Broekaert, J.A.C. Calculation of detection limits in spectrographic analysis. Bull. Des. Sociétés Chim. Belg. 2015, 82, 561–567. [Google Scholar] [CrossRef]
  28. Hakanson, L. An ecological risk index for aquatic pollution control: A sedimentological approach. Water Res. 1980, 14, 975–1001. [Google Scholar] [CrossRef]
  29. Deng, H.G.; Gu, T.F.; Li, M.H.; Deng, X. Comprehensive assessment model on heavy metal pollution in soil. Int. J. Electrochem. Sci. 2012, 7, 5286–5296. [Google Scholar]
  30. He, M.; Wang, Z.; Tang, H. The chemical, toxicological and ecological studies in assessing the heavy metal pollution in Le An River, China. Water Res. 1998, 32, 510–518. [Google Scholar] [CrossRef]
  31. USEPA. Risk Assessment Guidance for Superfund. EPA/540/1-89/002. 1989. Available online: http://www.epa.gov (accessed on 12 December 2019).
  32. Li, P.; Lin, C.; Cheng, H.; Duan, X.; Lei, K. Contamination and health risks of soil heavy metals around a lead/zinc smelter in southwestern China. Ecotoxicol. Environ. Saf. 2015, 113, 391–399. [Google Scholar] [CrossRef]
  33. Leung, A.O.W.; Duzgoren-Aydin, N.S.; Cheung, K.C.; Wong, M.H. Heavy metals concentrations of surface dust from e-waste recycling and its human health implications in Southeast China. Environ. Sci. Technol. 2008, 42, 2674–2680. [Google Scholar] [CrossRef]
  34. USEPA. Integrated Risk Information System (IRIS). 2014. Available online: http://www.epa.gov/iris/ (accessed on 12 December 2019).
  35. USEPA. Exposure Factors Handbook: 2011 Edition. EPA/600/R-090/052F. 2011. Available online: http://www.epa.gov (accessed on 12 December 2019).
  36. Kulkarni, S.G.; Chaudhary, A.K.; Nandi, S.; Tambe, S.S.; Kulkarni, B.D. Modeling and monitoring of batch processes using principal component analysis (PCA) assisted generalized regression neural networks (GRNN). Biochem. Eng. J. 2004, 18, 193–210. [Google Scholar] [CrossRef]
  37. Mao, W.; Li, W.X.; Gao, H.; Jiang, Y.; Hang, T.W.; Gong, X.X.; Chen, M.; Zhang, Y.P. pH variation and the driving factors of farmlands in Yangzhou for 30 years. J. Plant Fertil. 2017, 23, 883–893. [Google Scholar]
  38. Zhang, X.B.; Du, Y.P.; Wang, L.H.; Zhou, Q.; Huang, X.H.; Sun, Z.G. Combined effects of lanthanum (III) and acid rain on antioxidant enzyme system in soybean roots. PLoS ONE 2015, 10, e0134546. [Google Scholar] [CrossRef] [PubMed]
  39. Nguyen, B.T.; Do, T.K.; Tran, T.V.; Dang, M.K.; Vo, Q.T.K. High soil Mn and Al, as well as low leaf p concentration, may explain for low natural rubber productivity on a tropical acid soil in Vietnam. J Plant Nutr. 2018, 41, 903–914. [Google Scholar] [CrossRef]
  40. Zhu, Y.M.; Feng, R.W.; Wei, C.Y. Availability of arsenic in paddy and vegetable soils in Shuikoushan mining area of Hunan Province, South-central China. Chin. J. Ecol. 2012, 31, 2657–2661. [Google Scholar]
  41. Luo, W.; Lu, Y.; Wang, G.; Shi, Y.; Wang, T.; Giesy, J.P. Distribution and availability of arsenic in soils from the industrialized urban area of Beijing, China. Chemosphere 2008, 72, 797–802. [Google Scholar] [CrossRef] [PubMed]
  42. Spurgeon, D.J.; Rowland, P.; Ainsworth, G.; Rothery, P.; Long, S.; Black, H.I.J. Geographical and pedological drivers of distribution and risks to soil fauna of seven metals (Cd, Cu, Cr, Ni, Pb, V and Zn) in British soils. Environ. Pollut. 2008, 153, 273–283. [Google Scholar] [CrossRef] [PubMed]
  43. Hu, C.; Deng, Z.M.; Xie, Y.H.; Chen, X.S.; Li, F. The risk assessment of sediment heavy metal pollution in the east Dongting Lake wetland. J. Chem. 2015, 1–8. [Google Scholar] [CrossRef] [Green Version]
  44. Andry, H.; Yamamoto, T.; Rasiah, V.; Inoue, M. Influence of sedum plant on sediment yield from an acid soil under simulated rainfall. Trans. ASABE 2008, 51, 977–985. [Google Scholar] [CrossRef]
  45. Xu, Z.; Huo, F. Study on vegetation absorbing toxic elements in coal wasting lands-Take Xinmm, Yanzhou and Tongchuan as example. In Proceedings of the International Conference on Electric Technology and Civil Engineering (ICETCE), Lushan, China, 22–24 April 2011. [Google Scholar] [CrossRef]
  46. Campbell, L.C. Managing soil fertility decline. J. Crop. Prod. 1998, 1, 29–52. [Google Scholar] [CrossRef]
  47. Sun, Z.J.; Zhao, S.T.; Lin, X.L.; Zhao, L.; Ma, J.; Wei, Y.; Hou, H. Deriving soils environmental criteria of antimony in China by species sensitivity distributions. Res. Environ. Sci. 2018, 31, 774–781. [Google Scholar]
  48. Tiberg, C.; Bendz, D.; Theorin, G.; Kleja, D.B. Evaluating solubility of Zn, Pb, Cu and Cd in pyrite cinder using leaching tests and geochemical modelling. Appl. Geochem. 2017, 85, 106–117. [Google Scholar] [CrossRef]
  49. Zhang, X.; Liu, W.; Zhang, G.; Jiang, L.; Han, X. Mechanisms of soil acidification reducing bacterial diversity. Soil Biol. Biochem. 2015, 81, 275–281. [Google Scholar] [CrossRef]
  50. Fujii, K. Soil acidification and adaptations of plants and microorganisms in bornean tropical forests. Ecol. Res. 2014, 29, 371–381. [Google Scholar] [CrossRef] [Green Version]
  51. Chen, W.; Li, Z.W.; Shen, X. Influence of soil acidification on soil microorganisms in pear orchards. Commun. Soil Sci. Plant Anal. 2012, 43, 1833–1846. [Google Scholar] [CrossRef]
  52. Fierer, N.; Jackson, R.B. The diversity and biogeography of soil bacterial communities. Proc. Nat. Acad. Sci. USA 2006, 103, 626–631. [Google Scholar] [CrossRef] [Green Version]
  53. Shi, H.; Shi, X.; Ke, J.L. Oxidative mechanism of arsenic toxicity and carcinogenesis. Mol. Cell Biochem. 2004, 255, 67–78. [Google Scholar] [CrossRef]
  54. Thomas, D.J.; Styblo, M.; Lin, S. The cellular metabolism and systemic toxicity of arsenic. Toxicol. Appl. Pharmacol. 2001, 176, 127–144. [Google Scholar] [CrossRef]
  55. Waqar, A.; Atta, R.; Muhammad, J.; Hua, Z. A comprehensive review on current status, mechanism, and possible sources of arsenic contamination in groundwater: A global perspective with prominence of Pakistan scenario. Environ. Geochem. Heal. 2019, 41, 737–760. [Google Scholar]
  56. Mandal, B.K.; Suzuki, K.T. Arsenic round the world: A review. Talanta 2002, 58, 201–235. [Google Scholar] [CrossRef]
  57. Kalia, K.; Flora, S.J. Strategies for safe and effective therapeutic measures for chronic arsenic and lead poisoning. J. Occup. Health 2005, 47, 1–21. [Google Scholar] [CrossRef] [Green Version]
  58. Flora, G.; Gupta, D.; Tiwari, A. Toxicity of lead: A review with recent updates. Interdiscip. Toxicol. 2012, 5, 47–58. [Google Scholar] [CrossRef]
  59. Liu, C.P.; Luo, C.L.; Gao, Y.; Li, F.B.; Lin, L.W.; Wu, C.A.; Li, X.D. Arsenic contamination and potential health risk implications at an abandoned tungsten mine, southern china. Environ. Pollut. 2010, 158, 820–826. [Google Scholar] [CrossRef] [PubMed]
  60. Brady, J.P.; Ayoko, G.A.; Martens, W.N.; Goonetilleke, A. Enrichment, distribution and sources of heavy metals in the sediments of Deception Bay, Queensland, Australia. Mar. Pollut. Bull. 2014, 81, 248–255. [Google Scholar] [CrossRef] [PubMed] [Green Version]
  61. Liu, Y.; Mcdermott, S.; Lawson, A.; Aelion, C.M. The relationship between mental retardation and developmental delays in children and the levels of arsenic, mercury and lead in soil samples taken near their mother’s residence during pregnancy. Int. J. Hyg. Environ. Health 2010, 213, 116–123. [Google Scholar] [CrossRef] [PubMed] [Green Version]
  62. Ryan, P.B.; Macintosh, H.D.L. Longitudinal investigation of exposure to arsenic, cadmium, and lead in drinking water. Environ. Health Perspect. 2000, 108, 731–735. [Google Scholar] [CrossRef] [PubMed]
  63. Presser, T.S. Selenium Pollution. Environmental Geology; Springer: Dordrecht, The Netherlands, 1999. [Google Scholar]
  64. Yan, J.L.; Yang, J.; Ding, X.Y.; Xu, C.Y.; Zhao, M.; Zhang, Y.Y.; Wang, H.; Yang, L.Z. Investigation on background concentration of Se in Hubei Province. Mod. Agric. Sci. Technol. 2016, 21, 157–161. [Google Scholar]
  65. Guo, Q.; Wang, Y.; Guo, Q. Hydrogeochemical genesis of groundwaters with abnormal fluoride concentrations from Zhongxiang city, Hubei province, central China. Environ. Earth Sci. 2010, 60, 633–642. [Google Scholar] [CrossRef]
  66. Xiang, J.Q.; Hu, R.C.; Zhang, Y.P.; Song, C.H. Distribution Characteristics and Utilization Prospect of Selenium Resources of Soil in Jianghan Basin Economic Zone. Resour. Environ. Eng. 2015, 29, 431–435. [Google Scholar]
  67. Zhu, J.; Zheng, B. Distribution of selenium in a mini-landscape of Yutangba, Enshi, Hubei province, China. Appl. Geochem. 2001, 16, 1333–1344. [Google Scholar] [CrossRef]
  68. Sun, H.J.; Rathinasabapathi, B.; Wu, B.; Luo, J.; Pu, L.P.; Ma, L.Q. Arsenic and selenium toxicity and their interactive effects in humans. Environ. Int. 2014, 69, 148–158. [Google Scholar] [CrossRef]
  69. Spallholz, J.E. On the nature of selenium toxicity and carcinostatic activity. Free Radical Biol. Med. 1994, 17, 45–64. [Google Scholar] [CrossRef]
  70. Vellaisamy, S.; Mindy, Y.A.; Elizabeth, M. Protective and antioxidant role of selenium on arsenic trioxide-induced oxidative stress and genotoxicity in the fish hepatoma cell line PLHC-1. Environ. Toxicol. Chem. 2012, 31, 2861–2869. [Google Scholar]
  71. Selvaraj, V.; Tomblin, J.; Armistead, M.Y.; Murray, E. Selenium (sodium selenite) causes cytotoxicity and apoptotic mediated cell death in PLHC-1 fish cell line through DNA and mitochondrial membrane potential damage. Ecotoxicol. Environ. Saf. 2013, 87, 80–88. [Google Scholar] [CrossRef]
  72. Xiang, J.Y.; Wang, J.P.; Chen, L.; Ling, Z.Y.; Han, J.J.; Li, Q.K.; Qiugui Wang, Q.G. Distribution, Source Identification, and Assessment of Potentially Toxic Elements in the Sediment Core from the Estuarine Region of the Golmud River to the Qarhan Salt Lake, Qinghai, China. Minerals 2019, 9, 506. [Google Scholar] [CrossRef] [Green Version]
  73. Li, F.; Wang, T.; Xiao, M.S.; Cai, Y.; Zhuang, Z.Y. Ecological risk assessment and carcinogen health risk assessment of arsenic in soils from part area of the Daye city, China. IOP Conf. Ser. Earth Environ. Sci. 2018, 108, 042048–042053. [Google Scholar] [CrossRef]
  74. Udovic, M.; Lestan, D. Redistribution of residual Pb, Zn, and Cd in soil remediated with EDTA leaching and exposed to earthworms (Eisenia fetida). Environ. Technol. 2010, 31, 655–669. [Google Scholar] [CrossRef] [PubMed]
  75. Wu, L.H.; Luo, Y.M.; Xing, X.R.; Christie, P. EDTA-enhanced phytoremediation of heavy metal contaminated soil with Indian mustard and associated potential leaching risk. Agric. Ecosys. Environ. 2004, 102, 307–318. [Google Scholar] [CrossRef] [Green Version]
  76. Kidd, P.S.; Proctor, J. Why plants grow poorly on very acid soils: Are ecologists missing the obvious? J. Exp. Bot. 2001, 52, 791–799. [Google Scholar] [CrossRef] [Green Version]
  77. Winterhaider, K. The use of manual surface seeding, liming & fertilization in the reclamation of acid metal-contaminated land in the Sudbury, Ontario mining and smelting region of Canada. Environ. Technol. Lett. 1983, 4, 209–216. [Google Scholar]
  78. Yun, S.W.; Yu, C. Changes in phytoavailability of heavy metals by application of limestone in the farmland soil nearby abandoned metal mine and the accumulation of heavy metals in crops. J. Korean Soc. Agric. Eng. 2012, 54, 1–9. [Google Scholar]
  79. Georgiev, P.S.; Groudev, S.N.; Spasova, I.I.; Nicolova, M.V. Microbial reduction of ferric iron oxyhydroxides as a way for remediation of grey forest soils heavily polluted with toxic metals by infiltration of acid mine drainage. In Proceedings of the EGU General Assembly, Vienna, Austria, 12–17 April 2015. [Google Scholar]
  80. Mi, W.; Wu, L.; Ma, Q.; Zhang, X.; Liu, Y. Combined application of organic materials and inorganic fertilizers improving rice yield and soil fertility of yellow clayey paddy soil. Trans. Chin. Soc. Agric. Eng. 2016, 32, 103–108. [Google Scholar]
  81. Ma, L. Acid-tolerant plant species screened for rehabilitating acid mine drainage sites. J. Soils Sediments Prot. Risk Assess. Rem. 2015, 5, 1104–1112. [Google Scholar] [CrossRef]
  82. Maleci, L.; Tani, C.; Bini, C.; Wahsha, M. On the metal tolerance and resilience capacity of Helichrysum italicum G. Don growing on mine soils. In Proceedings of the European Geosciences Union General Assembly, Vienna, Austria, 17–22 April 2016. [Google Scholar]
  83. Chen, Z.F.; Cheng, W.; Chen, Z.X.; Pan, R.S.; Hu, T.S.; Sun, K.L.; Li, D.Q. Study on the plant furnishing of vegetation recovery of the mine rock slope. Environ. Protect. Technol. 2015, 21, 15–20. [Google Scholar]
  84. Yuri, S.; Masayuki, S.; Koichiro, S. Heavy metal behavior in lichen-mine waste interactions at, an abandoned mine site in Southwest Japan. Metals 2015, 5, 1591–1608. [Google Scholar]
  85. Chen, S.Y.; Wang, S.Y. Effects of Solid Content and Substrate Concentration on Bioleaching of Heavy Metals from Sewage Sludge Using Aspergillus niger. Metals 2019, 9, 994. [Google Scholar] [CrossRef] [Green Version]
Figure 1. Orthophoto of soils and drainage sampling sites adjacent to the pyrite mine area. Soils 1–10, contaminated soil samples; 11 and 12, soils from replenished agricultural fields.
Minerals 09 00783 g001
Figure 2. Concentrations of potentially toxic metals and pH values in the profiles of 12 soil sampling sites. (a) Concentrations of As at different depths in the profile; (b) concentrations of Pb at different depths in the profile; (c) concentrations of Zn at different depths in the profile; and (d) pH values of soil samples at different depths in the profile at 12 sampling sites in the study area. Each value is the mean of three replicates ± SEM.
Minerals 09 00783 g002aMinerals 09 00783 g002b
Figure 3. Principal component analysis of seven target elements (a) in soil (n = 36) and (b) in leachate (n = 15). A and B in (a) are the two main groups of the determined samples.
Minerals 09 00783 g003
Table 1. Main sample values of pH, and As, Pb, and Zn concentrations. Each value is the mean of three replicates ± the standard error of the mean (SEM). Numbers are the different sampling sites. Detailed positions of the sampling sites are shown in Figure 1. Different superscript letters indicate significant differences according to one-way ANOVA, followed by Tukey’s test (p < 0.05). The units for As, Pb, and Zn are mg·kg−1 for soils and mg·L−1 for water samples; the Chinese standard for soils is the Grade II standard for soil environmental quality published by the Chinese National Environmental Protection Agency (GB 15618-2009) [17]; the Chinese standard for water is the Grade III standard for surface water environmental quality published by the Chinese National Environmental Protection Agency (GB 3838-2002) [18]; “-”, not listed; Netherlands target value [21,22].
SamplepHAsPbZn
Soil
(0–15 cm)
13.83 ± 0.24 cln36.4 ± 3.8 bceg38.2 ± 1.1 ad56.3 ± 4.2 a
23.19 ± 0.10 jmo55.9 ± 11.2 aceg43.4 ± 6.0 ad35.4 ± 9.1 a
33.12 ± 0.04 kmo69.6 ± 11.3 ace46.6 ± 7.0 ad30.8 ± 6.0 a
43.43 ± 0.08 gmn50.7 ± 5.5 aceg39.3 ± 4.8 ad48.1 ± 9.6 a
53.53 ± 0.04 emn34.5 ± 8.8 aceg33.0 ± 4.8 ad31.6 ± 2.7 a
64.19 ± 0.29 bl33.6 ± 7.7 bdfh36.3 ± 13.8 ad31.6 ± 11.4 a
73.44 ± 0.09 fmn52.9 ± 3.7 bceg47.2 ± 4.7 ac38.4 ± 3.4 a
83.36 ± 0.03 imn70.0 ± 3.4 aceg60.4 ± 5.9 a52.0 ± 4.0 a
93.59 ± 0.04 dln66.6 ± 8.7 ac60.7 ± 5.8 a37.8 ± 7.4 a
103.41 ± 0.03 hmn78.2 ± 3.3 a57.1 ± 4.2 a28.3 ± 7.2 a
116.80 ± 0.08 a22.7 ± 0.8 bceh25.4 ± 2.3 bc31.2 ± 2.0 a
126.18 ± 0.02 a25.1 ± 0.6 bceh26.7 ± 1.1 bc28.0 ± 1.2 a
Netherlands target value-2985140
Chinese standard for soils<6.530280200
6.5–7.525600250
Leachate12.97 ± 0.01 beg0.21 ± 0.01 beg0.080 ± 0.002 bf1.92 ± 0.03 ac
22.49 ± 0.03 cfh0.32 ± 0.02 adf0.075 ± 0.001 cg1.93 ± 0.02 a
33.23 ± 0.07 a0.28 ± 0.01 cdf0.093 ± 0.002 a1.78 ± 0.03 bdf
43.10 ± 0.04 adg0.39 ± 0.02 a0.083 ± 0.003 de1.85 ± 0.02 ace
53.19 ± 0.05 ad0.35 ± 0.02 ad0.092 ± 0.002 ae1.90 ± 0.01 ace
Netherlands target value--0.0150.065
Chinese standard for water-0.10.12.0
Table 2. Correlation coefficients of soil elements (n = 36). * correlation significant at the 0.05 level, ** correlation significant at the 0.01 level, and *** correlation significant at the 0.001 level.
FactorpHCECOMAsCaFePbSSeZn
pH1−0.806 ***0.957 ***−0.649 ***−0.398 *−0.834 ***−0.593 ***−0.955 ***−0.623 ***−0.255
CEC 1−0.837 ***0.660 ***0.2700.810 ***0.647 ***0.837 ***0.634 ***0.305
OM 1−0.543 ***−0.389 *−0.781 ***−0.531 ***−0.999 ***−0.599 ***−0.269
As 10.3200.819 ***0.806 ***0.535 ***0.810 ***0.049
Ca 10.428 **0.2070.377 *0.1550.474 **
Fe 10.832 ***0.776 ***0.748 ***0.347 *
Pb 10.525 **0.851 ***0.361 *
S 10.597 ***0.259
Se 10.073
Zn 1
Table 3. Correlation coefficients of elements in leachates (n = 15). * correlation significant at the 0.05 level, ** correlation significant at the 0.01 level, and *** correlation significant at the 0.001 level.
FactorpHAsCaFePbSSeZn
pH10.0690.270−0.1220.831 ***0.2800.602 *−0.597 *
As 10.733 **−0.0750.131−0.589 *−0.099−0.103
Ca 10.2880.300−0.221−0.3480.133
Fe 1−0.2730.600 *−0.553 *0.766 ***
Pb 10.0070.389−0.467
S 10.0950.230
Se 1−0.814 ***
Zn 1
Table 4. Potential ecological risk factors and risk index (RI) of target potentially toxic metals in soil samples. Values <0.1 are recorded as 0.
Sampling SiteDepth (cm)Potential Ecological Risk FactorsRIDegree of Pollution
AsPbZn
10−1512.1 ± 0.30.7 ± 00.3 ± 013.1 ± 0.3low
15−305.4 ± 0.40.4 ± 00.1 ± 05.9 ± 0.4low
30−451.6 ± 0.30.2 ± 001.8 ± 0.3low
45−600.4 ± 0.20.1 ± 000.5 ± 0.2low
60−750.3 ± 0.1000.3 ± 0.1low
75−900.3 ± 0000.3 ± 0low
20−1518.6 ± 0.3 0.8 ± 00.2 ± 019.6 ± 0.3low
15−308.4 ± 0.40.5 ± 00.1 ± 09.0 ± 0.4low
30−452.1 ± 0.1 0.2 ± 002.3 ± 0.1low
45−600.6 ± 0.20.1 ± 000.7 ± 0.2low
60−750.4 ± 0.10.1 ± 000.5 ± 0.1low
75−900.3 ± 0000.3 ± 0low
30−1523.2 ± 0.40.8 ± 0.10.2 ± 024.2 ± 0.5low
15−3010.7 ± 0.60.4 ± 00.1 ± 011.2 ± 0.6low
30−452.4 ± 0.3 0.2 ± 002.6 ± 0.3low
45−600.7 ± 0.2 0.1 ± 000.8 ± 0.2low
60−750.4 ± 0.1000.4 ± 0.1low
75−900.3 ± 0000.3 ± 0low
40−1516.9 ± 0.30.7 ± 0.10.2 ± 017.8 ± 0.4low
15−307.9 ± 0.30.4 ± 00.1 ± 08.4 ± 0.3low
30−452.1 ± 0.20.2 ± 002.3 ± 0.2low
45−600.6 ± 0.10.1 ± 000.7 ± 0.1low
60−750.4 ± 0.1000.4 ± 0.1low
75−900.3 ± 0000.3 ± 0low
50−1515.8 ± 0.20.6 ± 00.2 ± 016.6 ± 0.2low
15−307.0 ± 0.50.4 ± 00.1 ± 07.5 ± 0.5low
30−452.0 ± 0.20.2 ± 002.2 ± 0.2low
45−600.6 ± 0.10.1 ± 000.7 ± 0.1low
60−750.4 ± 0.1000.4 ± 0.1low
75−900.3 ± 0000.3 ± 0low
60−157.6 ± 0.30.6 ± 0.10.2 ± 08.4 ± 0.4low
15−304.4 ± 0.40.5 ± 00.1 ± 05.0 ± 0.4low
30−451.7 ± 0.20.2 ± 001.9 ± 0.2low
45−600.6 ± 0.20.1 ± 000.7 ± 0.2low
60−750.4 ± 0.10.1 ± 000.5 ± 0.1low
75−900.2 ± 0000.2 ± 0low
70−1514.9 ± 0.30.8 ± 00.2 ± 015.9 ± 0.3low
15−306.9 ± 0.40.5 ± 00.1 ± 07.5 ± 0.4low
30−451.9 ± 0.20.2 ± 002.1 ± 0.2low
45−600.6 ± 0.20.1 ± 000.7 ± 0.2low
60−750.4 ± 0.1000.4 ± 0.1low
75−900.3 ± 0000.3 ± 0low
80−1520.8 ± 0.41.1 ± 0.10.3 ± 022.2 ± 0.5low
15−309.2 ± 0.40.6 ± 00.1 ± 09.9 ± 0.4low
30−451.8 ± 0.20.2 ± 002.0 ± 0.2low
45−600.6 ± 0.3 0.1 ± 000.7 ± 0.3low
60−750.4 ± 0.1000.4 ± 0.1low
75−900.3 ± 0000.3 ± 0low
90−1523.3 ± 0.41.1 ± 0.10.2 ± 024.6 ± 0.5low
15−3010.0 ± 0.60.5 ± 00.1 ± 010.6 ± 0.6low
30−452.0 ± 0.20.1 ± 002.1 ± 0.2low
45−600.6 ± 0.20.1 ± 000.7 ± 0.2low
60−750.4 ± 0.1 000.4 ± 0.1 low
75−900.2 ±0000.2 ±0low
100−1527.0 ± 0.4 1.0 ± 0.10.1 ± 028.1 ± 0.5low
15−3011.1 ± 0.30.5 ± 00.1 ± 011.7 ± 0.3low
30−451.8 ± 0.20.2 ± 002.0 ± 0.2low
45−600.7 ± 0.20.1 ± 000.8 ± 0.2low
60−750.4 ± 0.1000.4 ± 0.1low
75−900.3 ± 0000.3 ± 0low
110−159.1 ± 0.40.2 ± 00.1 ± 09.4 ± 0.4low
15−303.9 ± 0.30.1 ± 00.1 ± 04.1 ± 0.3low
30−451.5 ± 0.30.1 ± 001.6 ± 0.3low
45−600.4 ± 0.2000.4 ± 0.2low
60−750.3 ± 0.1000.3 ± 0.1low
75−900.3 ± 0000.3 ± 0low
120−158.4 ± 0.30.4 ± 00.1 ± 08.9 ± 0.3low
15−303.3 ± 0.40.2 ± 003.5 ± 0.4low
30−451.2 ± 0.30.1 ± 001.3 ± 0.3low
45−600.3 ± 0.1000.3 ± 0.1low
60−750.3 ± 0000.3 ± 0low
75−900.2 ± 0000.2 ± 0low
Table 5. Nemerow index and degree of pollution by As, Pb, and Zn in leachates.
Sampling SitePiDegree of Pollution
AsPbZnAsPbZn
12.270.810.97moderatelowlow
23.410.760.98stronglowlow
32.890.940.90moderatelowlow
44.070.860.93stronglowlow
53.650.940.95stronglowlow
Table 6. Hazard quotient (HQ) or hazard index (HI) values in 12 soil sampling sites. “-”, value <0.01. Black italic numbers indicate that a health risk exists.
SoilAs HQPb HQZn HQHI
ChildrenFemalesMalesChildrenFemalesMalesChildrenFemalesMalesChildrenFemalesMales
10.69−0.860.17−0.210.15−0.180.070.020.01−0.02---0.76−0.930.19−0.230.16−0.20
20.95−1.430.24−0.360.20−0.310.07−0.090.020.01−0.02---1.02−1.520.26−0.380.22−0.33
31.24−1.720.31−0.430.27−0.370.07−0.100.020.02---1.32−1.820.33−0.460.28−0.39
40.96−1.200.24−0.300.21−0.260.06−0.080.020.01−0.02---1.03−1.280.26−0.320.22−0.27
50.55−0.920.14−0.230.12−0.200.05−0.070.01−0.020.01---0.60−0.990.15−0.250.13−0.21
60.55−0.880.14−0.220.12−0.190.04−0.090.01−0.020.01−0.02---0.60−0.970.15−0.240.13−0.21
71.05−1.210.26−0.300.22−0.260.09−0.110.02−0.030.02---1.14−1.320.29−0.330.24−0.28
81.42−1.560.35−0.390.30−0.340.10−0.120.02−0.030.02−0.03---1.52−1.680.38−0.420.33−0.36
91.23−1.600.31−0.400.26−0.340.10−0.120.02−0.030.02−0.03---1.33−1.730.33−0.430.29−0.37
101.60−1.740.40−0.430.34−0.370.09−0.100.02−0.030.02---1.69−1.840.42−0.460.36−0.39
110.47−0.500.12−0.130.10−0.110.04−0.050.010.01---0.50−0.550.13−0.140.11−0.12
120.52−0.550.13−0.140.11−0.120.03−0.040.010.01---0.56−0.590.14−0.150.12−0.13

