Abstract
Multiphase materials are widely applied in engineering due to desirable mechanical properties and are of interest to geoscience as rocks are multiphase. High-pressure mechanical behavior is important for understanding the deep Earth where rocks deform at extreme pressure and temperature. In order to systematically study the underlying physics of multiphase deformation at high pressure, we perform diamond anvil cell deformation experiments on MgO + NaCl aggregates with varying phase proportions. Lattice strain and texture evolution are recorded using in-situ synchrotron x-ray diffraction and are modeled using two-phase elasto-viscoplastic self-consistent (EVPSC) simulations to deduce stress, strain, and deformation mechanisms in individual phases and the aggregate. Texture development of MgO and NaCl are affected by phase proportions. In NaCl, a (100) compression texture is observed when small amounts of MgO are present. In contrast, when deformed as a single phase or when large amounts of MgO are present, NaCl develops a (110) texture. Stress and strain evolution in MgO and NaCl also show different trends with varying phase proportions. Based on the results from this study, we construct a general scheme of stress evolution as a function of phase proportion for individual phases and the aggregate.
1. Introduction
Multiphase materials are ubiquitous in nature and are widely used in engineering due to their desirable mechanical properties. Recently, there has been a growing interest in high-pressure mechanical behavior in many fields such as materials science of super hard materials and minerals physics of the Earth’s interior. Materials in the Earth’s interior are composed of multiphase materials deformed under high-pressure and -temperature conditions. Thus, it is of great importance to geoscience to understand the deformation behavior of multiphase materials under extreme pressure conditions.
The deformation behavior of individual phases in multiphase aggregates can be quite different compared with a single phase. In multiphase deformation experiments at high pressure, one can utilize synchrotron X-ray diffraction to directly measure lattice strains and estimate the flow stress in each phase. Kaercher et al. (2016) [1] performed in-situ deformation experiments on NaCl + NaMgF3 two-phase aggregates with a series of phase proportions and reported the flow stress in each phase. The flow stress in the strong NaMgF3 phase decreases nonlinearly with increasing weak NaCl phase proportion. Stress measurements on bridgmanite and bridgmanite + ferropericlase aggregates by Miyagi and Wenk (2016) [2] also show a large decrease of deviatoric stress in bridgmanite when deformed with 30% volume proportion of ferropericlase. These differences are primarily due to the strain and stress partitioning between each phase component under imposed macro-strain/stress and this has a prominent effect on the aggregate’s flow stress. The strain and stress partitioning between phases are not only affected by the intrinsic properties of each phase component, but also the interactions between phases, the phase proportions, and microstructure. Based on observations, numerical modeling, and lab experiments on multiphase materials, Handy (1990,1994) [3,4] provided an estimation of aggregate yield strength as a function of strength contrast between each component and phase proportion. The aggregate’s yield strength depends strongly on the phase proportion and related microstructure. When the strong phase is interconnected and the weak phase is isolated within the strong phase, this forms a basic structure termed a load-bearing framework (LBF). Both strong and weak phases are rheologically active and most of the stress is born by the strong framework, resulting in a high aggregate yield strength. The strain-rate is close in each phase and stress contrast measured between each phase is large [4]. In Girard et al. (2016) [5], a scanning electron microscopy (SEM) image of a recovered sample of 30% ferropericlase + 70% bridgmanite aggregates after shear deformation shows an LBF microstructure. Stress measured in strong bridgmanite is much larger than weak ferropericlase, consistent with LBF behavior. When the weak phase is interconnected and the strong phase is isolated as strong inclusions in a weak matrix, this forms another basic structure termed interconnected weak layers (IWL). The strong phase is rheologically passive compared with the weak phase. Most of the strain is partitioned into the weak phase, resulting in a large decrease in aggregate yield strength. The stress measured in each phase is similar, approaching an iso-stress state. If the stress exponent of the strong phase is similar or smaller than that of the weak phase, the stress level in the former will slightly exceed that of the latter [4]. As shown in Kaercher et al. (2016) [1], the stress difference between NaMgF3 and NaCl decrease from a high value of ~1.7 GPa to a low value of ~0.5 GPa with increasing NaCl proportion from 15% to 70%, consistent with a transition from LBF to IWL. When strong and weak phases have comparable phase proportions, both phases could be interconnected and ‘percolate’ each other, leading to mechanical behavior that is intermediate to LBF and IWL end members.
Multiphase interactions also play an important role in crystallographic preferred orientation (texture) development. Generally, dislocation glide leads to grain rotation, which results in texture development. Texture development and crystal lattice strains provide clues to slip system activity during deformation of a material. Like strain and stress, texture development in multiphase aggregates shows complex interactions. Adding small amounts of strong particles in a weak matrix greatly modifies the texture strength, particularly in cases where strong particles do not deform plastically, and strain is accommodated entirely by the weak phase. In Al + SiC metal matrix composites, texture strength in the weaker Al matrix decreases with addition of strong SiC particles [6]. Likewise, Garcés et al. (2006) [7] reported that 5% addition of yittria (Y2O3) particles lowers texture strength of the Mg matrix dramatically. In these extreme cases where the strong phase does not deform, heterogeneous flow occurs in the weaker matrix since it must flow around the strong particles. This is sometimes termed turbulence of flow [8] and this may be a mechanism for reduced texture strength in the matrix. More often, the strength contrast between phases is not so large and the proportion of the strong phase is not as small. Both weak and strong phases deform plastically and are able to develop a texture. Still, texture development can be quite different. For example, in the case of Al + Pb composites, the texture strength of Pb decreases greatly with the addition of Al, and the texture is also reduced in Al with the addition of Pb [8]. For Al, the texture reduction is due to decreased strain accommodated by strong Al as strain is partitioned into the weak Pb phase. For Pb, the texture reduction is attributed to “turbulence” of the flow around the hard Al, similar to the Al + SiC composites and Mg + Y2O3 composites. In some cases, one phase in a multiphase aggregate may not develop texture. This usually happens when the aggregate contains a low symmetry phase. Deformation experiments on bridgmanite + ferropericlase aggregates [2,9] show that bridgmanite develops a fiber texture while ferropericlase remains nearly random. This is surprising because weaker ferropericlase is expected to accommodate most of the strain [5]. Texture development in NaMgF3 + NaCl aggregates shows similar behavior [1]. Strong NaMgF3 develops significant texture while soft NaCl does not, even when the phase proportion of NaCl is more than 50%. In contrast, experiments on 72% CaGeO3 + 28% MgO aggregates [10] show that both CaGeO3 and MgO develop texture. This discrepancy may be due to the plastic anisotropy of the strong phase. SEM images of 75% NaMgF3 + 25% NaCl ([1], Figure 5) and 72% CaGeO3 + 28% MgO ([10], Figure 1) show the same LBF microstructure with the weak phase in pockets surrounded by a strong matrix. Weak NaCl and MgO deform separately in each pocket in response to stress imposed by the hard matrix. Bridgmanite and NaMgF3 are low-symmetry orthorhombic structures. The dominant slip plane of bridgmanite/NaMgF3 is (001)/(100) (e.g., [1,2,11,12]). Both of these have no symmetric variants, and this leads to high plastic anisotropy. In contrast, CaGeO3 has a (pseudo-)cubic structure and texture analysis indicates dominant slip [10]. This slip system has six symmetric variants, which makes CaGeO3 relatively plastically isotropic. Thus, it is likely that high plastic anisotropy in a strong matrix (such as in bridgmanite and NaMgF3) causes local heterogeneity in the stress and strain field in the weak phase, disrupting coherent texture development in the weak phase. Instead of reduced texture intensity or texture randomization, occasionally phases in multiphase aggregates develop completely different texture patterns compared to single phases. When comparing deformation of pure Ag and Ag + Fe composites, Ag develops very different textures when deformed as a single phase as compared to when it is deformed in an Ag + Fe composite [13]. This may be due to changes in slip system activities resulting from stress and strain heterogeneity.
With the aim to systematically study the deformation behavior of multiphase aggregates at high pressure with different phase proportions, we perform in-situ compression experiments on MgO + NaCl aggregates with phase proportions ranging from pure MgO to pure NaCl using the diamond anvil cell (DAC). Lattice strains and texture evolution of each phase are recorded using synchrotron X-ray diffraction in radial geometry. MgO and NaCl are good candidates for several reasons. First, both of them have the same B1 structure (fcc with Fm-3m space group) and similar available slip systems. This can potentially exclude complication due to high plastic anisotropy. Second, the yield strength contrast between MgO and NaCl is large (~14), which makes differences in deformation behavior between the two phases more apparent. Lattice strains and texture development of two phases are modeled together using the elasto-viscoplastic self-consistent method (EVPSC) [14] to deduce deformation mechanisms of each phase and importantly, to deduce individual phase and aggregate stress, since direct stress measurements on the bulk aggregate is not feasible in high pressure experiments.
2. Experiments and Methods
2.1. Experiment Details
High-purity MgO and NaCl powders (MgO: Alfa Aesar, 99.95% purity, stock# 14684, lot# J03Q037; NaCl: Macron Fine Chemicals, 99.0% purity, product# 7581-12, lot# 0000006355) were mixed in varying phase proportions and were ground together in an agate mortar. The samples were then heated in a vacuum oven at −0.08 MPa and 120 °C for 2 weeks to eliminate moisture. Samples were loaded in a boron-kapton gasket [15] with a 50 μm diameter sample chamber. Samples were compressed using a panoramic type DAC with 200 μm culet diamond anvils. Pressure was calibrated with the equation of state of NaCl from Brown (1999) [16]. In order to avoid the NaCl phase transition to the B2 structure, which occurs at ~30 GPa (e.g., [17,18,19,20]), samples were compressed to just under 30 GPa. Synchrotron X-ray diffraction in radial geometry was performed at beamline 12.2.2 of the advanced light source (ALS), Lawrence Berkeley National Lab, Berkeley, CA, USA and HPCAT (sector 16), advanced photon source (APS), Argonne National Lab, Lemont, IL, USA. Sample-detector distance and detector non-orthogonality were calibrated using a CeO2 standard. An X-ray wavelength of 0.49592 Å at ALS and 0.4066 Å at APS was used. Diffraction images were recorded using a MAR345 detector at ALS and MARCCD detector at APS.
2.2. Experiment Data Analysis
Due to axial geometry in DAC experiments, the stress state in the sample can be decomposed into hydrostatic and deviatoric components as:
where is the mean stress and is the differential stress, which can be used to infer flow stress of the sample. Due to the deviatoric stress on the sample, the measured d-spacings of crystallites are not uniform but vary as a function of the angle between diffraction plane normal and compression axis,, as described in [21,22] where:
is the measured d-spacing from diffraction, is the d-spacing under hydrostatic stress, and describes the deviation of the measured d-spacing from the hydrostatic d-spacing and can be used to represent the average lattice strain of a plane (Figure 1). Differential stress can be used to infer the flow stress of the sample using the following estimation from [22]:
where and are shear moduli calculated under the Reuss (iso-stress) and Voigt (iso-strain) approximation. The factor , which lies between 0 and 1, describe the relative weights of Reuss and Voigt conditions. However, an estimation of by plasticity modeling of lattice strain and texture evolution is more reliable [23,24,25]. For multiphase deformation, from Equation (3) can only provide estimation of the stress in each individual phase. In DAC deformation experiments, samples are subjected to both strain and pressure increase simultaneously. Thus, the effects of strain hardening and pressure strengthening are convoluted. However, since strain hardening is small compared to pressure strengthening and strains are relatively low in the DAC, the measured flow strength should be close to the yield stress at the corresponding pressure. Systematic intensity variations along diffraction rings indicate the existence of texture (Figure 1). Diffraction images are analyzed using the Rietveld method, implemented in the materials analysis using diffraction (MAUD) software [26], to extract phase proportion, lattice strain, and texture information. Q-factors are obtained by fitting d-spacing variation with azimuth. The orientation distribution function (ODF) is computed using the E-WIMV algorithm, which is similar to the WIMV method [27]. The calculated ODF is then exported to the program BEARTEX [28] for smoothing. Refinement of DAC data in MAUD follows the procedure outlined in [29].
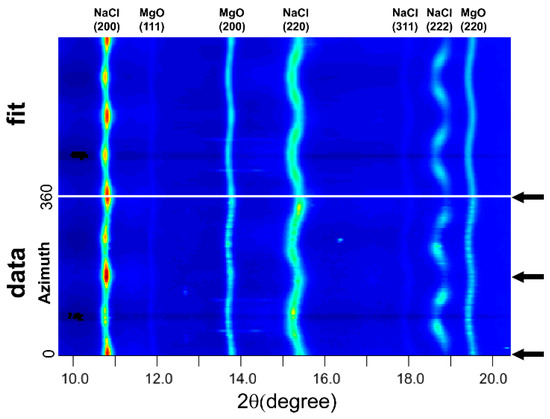
Figure 1.
An unrolled diffraction image and materials analysis using diffraction (MAUD) fit of the 20% MgO + 80% NaCl sample. Black arrow indicates the compression direction. Sinusoidal distortion of diffraction line indicates lattice strain. Systematic intensity variation along azimuth indicates texture.
2.3. Plasticity Modeling
Lattice strain and texture development are modeled using the elasto-viscoplastic self-consistent method (EVPSC) [14] to deduce the deformation mechanisms of each individual phase and to calculate the aggregate yield stress. EVPSC is an effective medium method. This does not explicitly account for microstructural interactions but rather treats single grains as an inclusion in an anisotropic homogenous effective medium (HEM). The properties of the HEM are determined by the average of all inclusions. The plastic behavior of the inclusion at the local level is described by a non-linear rate-sensitive constitutive law of varying slip systems:
where is the reference shear strain rate, is the resolved shear stress of a slip system s at the reference strain rate, is the symmetric Schmid factor for the slip system s, n is an empirical stress exponent, and
is the local stress tensor. The Schmid factor describes how stress is resolved onto a slip system. When the stress resolved onto a given slip system is close to the threshold value , deformation will occur on the slip system. This critical resolved shear stress (CRSS) describes the strength of the individual slip systems and to a large extent controls slip systems activity. Due to grain–grain interactions and microstructural effects, CRSS in EVPSC will not be equivalent to single crystal CRSS, but are rather an effective polycrystal CRSS. In the self-consistent scheme, the constitutive equation needs to be linearized. There are several possible schemes, namely tangent, affine, and secant [30]. Affine is used in this study since it allows the choice of different stress exponents for the various phases. At each deformation step, each inclusion interacts with the HEM and macroscopic properties get updated iteratively until the average stress and strain of all inclusions equals the macroscopic stress and strain. Compared with elastoplastic self-consistent (EPSC) [31] and viscoplastic self-consistent (VPSC) [32], both elastic and viscoplastic behavior are considered in EVPSC. Lattice strains (Q-factors) and grain rotation (texture) are modeled together, giving more constraints on slip system activities. The details of EVPSC modeling for high-pressure deformation experiment can be found in [25]. Since strain and pressure increase simultaneously in DAC experiments, it is not possible to separate the pressure and strain hardening effects on CRSS. Both are included in the pressure dependence of the CRSS. In this study, , where is the initial CRSS and is the pressure dependence of CRSS. Sample strains in DAC experiments are typically not measured, but a reasonable axial strain value (~24%), which is based on the texture intensity of the pure NaCl sample, is assumed in the EVPSC models of the multiphase samples. Single crystal MgO/NaCl elastic constants and their pressure dependence from Zha et al. (2000) and Whitfield et al. (1976) [33,34] are used for the simulations.
3. Experiment and Modeling Results
3.1. Pure MgO and NaCl
Experiment and modeling results of MgO and NaCl single-phase deformation are shown first in order to demonstrate the intrinsic properties contrast between these two phases. MgO and NaCl share the same f.c.c structure and slip system sets, which are , , and , but with different easiest slip systems. Deformation experiments on single-crystal NaCl at low-pressure and -temperature conditions found that is the easiest slip system followed by and [35]. Likewise, deformation experiments on single-crystal MgO find to be the easiest slip system at ambient conditions but activity of slip increases with elevated temperature (e.g., [36,37,38,39,40,41]). Theoretical calculations indicate that is unlikely to be activated at room temperature (e.g., [42]). Usually, in single-crystal deformation, strain is accommodated by a single slip mode. In polycrystal deformation, back stresses induced at the grain boundary will force multiple slip systems to be activated. Auxiliary systems are also geometrically necessary to accommodate deformation of neighboring grains. Thus, CRSS values used in EVPSC can be much higher than single crystal CRSS due to grain interactions and boundary effects. Single crystal CRSS values will not be directly transferrable to EVPSC to predict polycrystal behaviors. As a result, the CRSS values used in these models are chosen such that simulated lattice strain and texture evolution matches that of the experiment.
The sample composed of pure NaCl powder was compressed up to 29 GPa. Lattice strain of the diffracted planes are in an order of Q(111) > Q(220) > Q(200) (Figure 2a). NaCl gradually develops a (110) compression texture (Figure 3), similar to that observed in compression experiments at 400 °C [43] and consistent with the complementary (111) and (100) texture observed in room temperature extension experiment [44,45]. Based on previous self-consistent modeling results, a high activity of slip will give a (100) compression texture [46] while and give an intense (110) texture [25]. A linear CRSS increase with pressure is given to each slip system in order to fit the Q-factors increase, which is caused mainly by pressure hardening (Table 1). Based on the modeling results, a high activity of slip combined with minor and give the best fit for both texture and Q-factors (Figure 2b). Although the initial CRSS for used in modeling is almost half of (Table 1), most of the plastic strain is still accommodated by the system, similar to VPSC simulation results for shear deformation of halite [47]. In cubic crystals, there are only six equivalent slip modes for system while there are 12 for . Thus, slip on {110} planes is more likely to be suppressed due to an unfavorable Schmid factor, than slip on {111} planes.
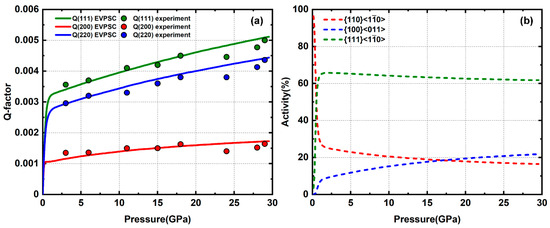
Figure 2.
(a) Experimental and modeled Q-factors of pure NaCl; (b) slip system activity.
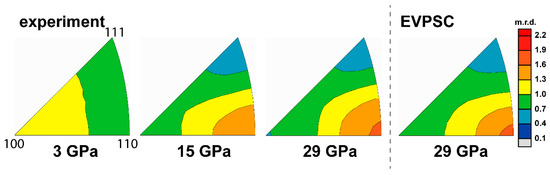
Figure 3.
Inverse pole figures (IPF) of experimental and modeled textures of pure NaCl. Scale bar is given in multiples of random distribution (m.r.d.)

Table 1.
Critical resolved shear stress (CRSS) values used in elasto-viscoplastic self-consistent (EVPSC) modeling.
The sample composed of pure MgO powder was compressed up to 47 GPa and modeled using EVPSC in a separate study [48]. Lattice strains are in an order of Q(220) > Q(111) > Q(200) at relative low pressures (<20 GPa). Above 20 GPa, Q(111) increases faster than Q(220) with pressure and gradually surpasses Q(220) (Figure 4). A reordering of Q-factors usually indicates a change of slip system activity. MgO gradually develops an intense (100) texture with increasing pressure (Figure 5). Based on modeling results, both and are activated with a ratio of ~60:40 below 20 GPa. Above 20 GPa, the reordering of Q-factors is caused by increasing activity of the slip system due to pressure hardening of the system. This is fulfilled by giving a steep increase of CRSS with pressure (Table 1). Accompanying this slip system activity change at high pressure is a rapid increase in the measured differential stress value. Based on our modeling results on pure MgO and NaCl, the rheology contrast between these two materials is ~14.
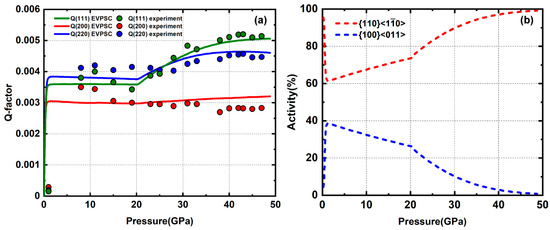
Figure 4.
(a) Experiment and modeled Q-factors of pure MgO; (b) slip system activity; replotted from [48].
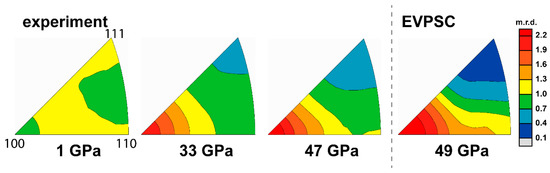
Figure 5.
IPFs of experimental and modeled textures of pure MgO; replotted from [48]. Scale bar is given in multiples of random distribution (m.r.d.)
3.2. 20% MgO + 80% NaCl
The sample of approximately 20% MgO plus 80% NaCl is compressed up to 24 GPa. The lattice strains of NaCl do not change significantly with addition of MgO. Q-factors are still in an order of Q(111) > Q(220) > Q(200) with values that resemble the pure NaCl sample (Figure 6a). However, NaCl gradually develops a (100) texture (Figure 7) in contrast with the (110) texture observed for pure NaCl. Among the available NaCl slip systems, a (100) compression texture is generated by a high activity of the slip system. Thus, it is likely that there is a dominant slip system transition from to caused by the addition of strong MgO. For MgO, the lattice strains are much lower than in the pure MgO sample. All Q-factors generally increase with pressure (Figure 6a), which is not observed in the same pressure range in pure MgO (Figure 4a). There is no observable texture development of MgO during compression (Figure 7). Since dislocation glide leads to grain rotation, a lack of texture development likely indicates that there is little to no plastic deformation in MgO. Given the low Q-factors, the stress in MgO is also likely below the yield stress. Low values of experimental lattice strains and lack of texture development indicate that MgO deforms elastically. For dominant slip on in NaCl/MgO, the spin of symmetric variants (e.g., (110)[–110] and (-110)[110]) cancel each other’s rotation, resulting in slow (100) compression texture evolution until strain is large enough to significantly flatten the grains [49]. In our EVPSC simulation, the grain shape is initially flattened in order to yield a faster (100) texture evolution within the ~24% axial strain imposed. Based on modeling results, dominant slip combined with auxiliary slip for NaCl and almost no slip for MgO give a good fit to the experiment lattice strain and texture (Figure 6b).
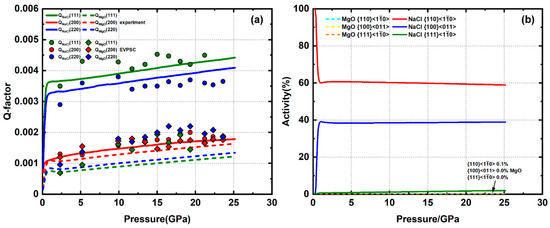
Figure 6.
(a) Experimental and modeled Q-factors of 20% MgO + 80% NaCl. (b) slip system activity of MgO and NaCl.
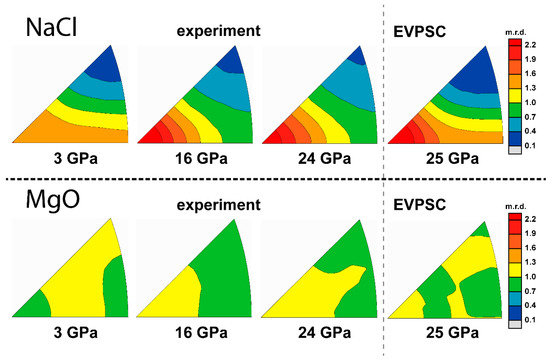
Figure 7.
IPFs of experimental and modeled textures of 20% MgO + 80% NaCl. Scale bar is given in multiples of random distribution (m.r.d.).
3.3. 30% MgO + 70% NaCl
The sample composed of approximately 30% MgO plus 70% NaCl is compressed up to 27 GPa. The Q-factors of NaCl are still in an order of Q(111) > Q(220) > Q(200) (Figure 8a) and slightly higher than the pure NaCl sample. At 4 GPa, where the first diffraction image is taken, NaCl has already developed a (100) texture, corresponding to a dominant slip. As deformation continues, the texture gradually weakens then shifts to (110) (Figure 9), due to activation of the slip system. The Q-factors of MgO are still relatively low compared with pure MgO. However, MgO gradually develops a weak (100) texture (Figure 9). This indicates that MgO starts to deform plastically in the 30% phase proportion sample. This is near the percolation threshold; thus, MgO–MgO grain contacts are likely to occur in this sample. Experiment textures of MgO/NaCl at 4 GPa are used as starting textures in these models. CRSS values used for NaCl are similar to the pure NaCl simulation, resulting in a dominant slip with minor auxiliary and . For MgO, is the only active system with only minor 2% activity, resulting in slight (100) texture development (Figure 8b).
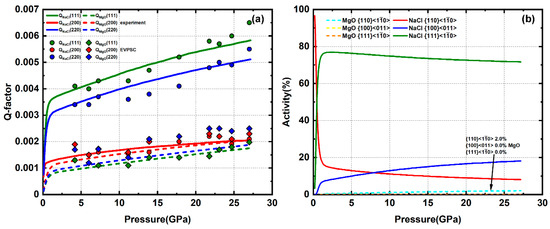
Figure 8.
(a) Experimental and modeled Q-factors of 30% MgO + 70% NaCl. (b) slip system activity of MgO and NaCl.
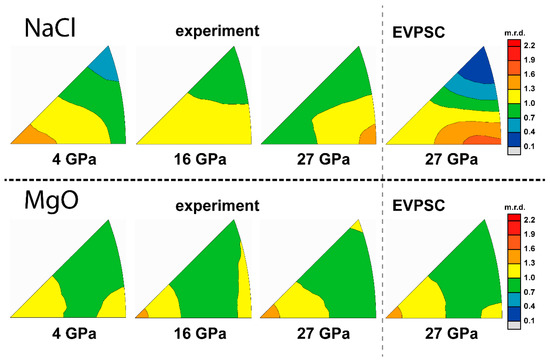
Figure 9.
IPFs of experimental and modeled textures of 30% MgO + 70% NaCl. Scale bar is given in multiples of random distribution (m.r.d.).
3.4. 50% MgO + 50% NaCl
The sample composed of approximately 50% MgO + 50% NaCl is compressed to 27 GPa. Q-factors of NaCl below 10 GPa are in an order of Q(111) > Q(220) > Q(200) (Figure 10a). Above 10 GPa, the NaCl (222) peak is weak and overlaps with the MgO (220) peak. Thus, we do not report values for Q(111) of NaCl. The Q-factor values are higher than in the 70% NaCl sample. NaCl gradually develops a (110) texture, similar to pure NaCl (Figure 11). In MgO, the Q-factors are higher than in the 20% and 30% MgO samples but are still lower than pure MgO. MgO gradually develops an obvious (100) texture (Figure 11), indicating a significant amount of plastic strain. Based on modeling results, NaCl has a dominant slip with minor auxiliary and . MgO accommodates ~25% strain via slip with minor slip (Figure 10b).
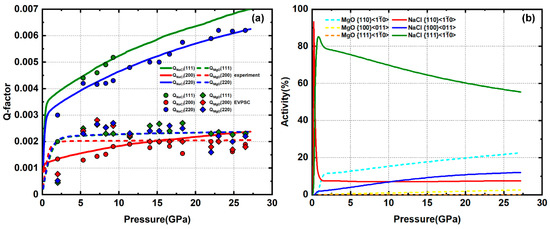
Figure 10.
(a) Experimental and modeled Q-factors of 50% MgO + 50% NaCl. (b) slip system activity of MgO and NaCl.
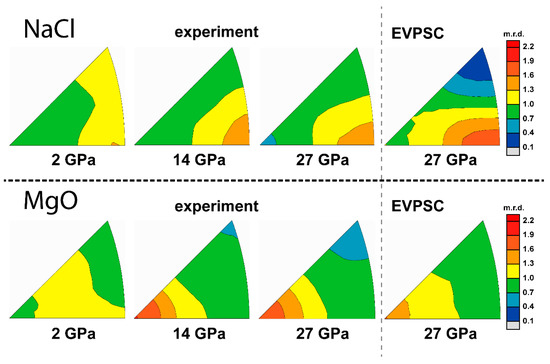
Figure 11.
IPFs of experimental and modeled textures of 50% MgO + 50% NaCl. Scale bar is given in multiples of random distribution (m.r.d.).
3.5. 80% MgO + 20% NaCl
The sample of approximately 80% MgO + 20% NaCl is compressed up to 27 GPa. The Q-factors of NaCl are still in an order of Q(111) > Q(220) > Q(200) (Figure 12a). Q(111) is not available above 12 GPa due to weak peak intensity and overlap with the MgO (220) peak, similar to the 50% NaCl sample. The Q-factor values are lower than in the 50% NaCl sample, indicating a decreasing stress in the NaCl phase. This does not follow the trend of higher Q-factor values with increasing MgO phase proportion in samples with NaCl > 20%. NaCl gradually develops a (110) texture (Figure 13). For MgO, Q(111), Q(220), and Q(200) are of similar magnitude with a value around 0.002 to 0.0025 below 13 GPa. Starting at 13 GPa, there is a rapid increase of Q(111) and Q(220), reaching high values of ~ 0.0035 at ~18 GPa. Above 18 GPa, the Q-factors stay approximately constant and are in an order of Q(111) > Q(220) > Q(200) (Figure 12a). A rapid increase and reordering of Q-factors is also observed in pure MgO deformation, which can be explained by “pressure hardening” of slip system of MgO [48]. MgO gradually develops a (100) texture (Figure 13). Based on modeling results, NaCl has a dominant slip with a total activity of ~35%. MgO has a dominant slip with a total activity of ~65% (Figure 12b).
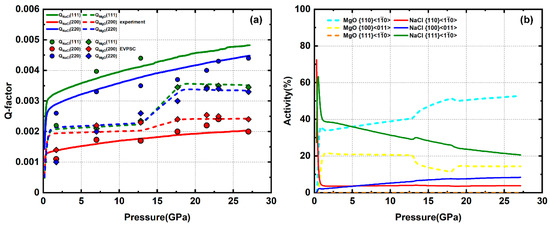
Figure 12.
(a) Experimental and modeled Q-factors of 80% MgO + 20% NaCl. (b) slip system activity of MgO and NaCl.
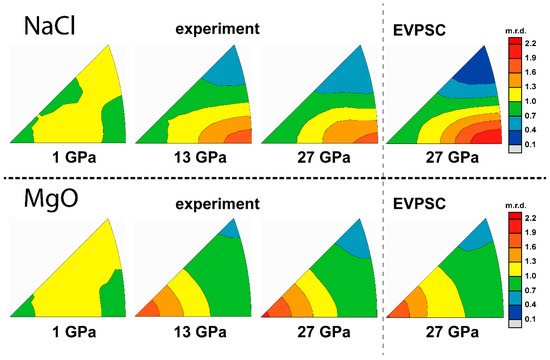
Figure 13.
IPFs of experiment and modeling texture of 80% MgO + 20% NaCl. Scale bar is given in multiples of random distribution (m.r.d.).
4. Discussion
4.1. Determination of Stress and Strain
Stress and strain behavior in the individual NaCl/MgO phases is quite different under varying phase proportions. Knowing stress and strain of the individual phases can provide insight into the deformation behavior of multiphase aggregates under varying microstructures. For single-phase aggregates, the measured average strain is equal to the macroscopic strain imposed on the sample. For multiphase deformation, the average strain of each phase and its contribution to bulk strain can be derived from activity results obtained from modeling. Direct stress measurements on the bulk multiphase aggregate are not feasible in high-pressure experiments. Usually, stress is evaluated based on lattice strain attained from diffraction using Equation (3) or from sample thickness and pressure gradient measured from ruby fluorescence [50]. However, measurements of differential stress from different studies show inconsistencies. Previous studies on NaCl polycrystals report different differential stresses in a wide pressure range (Figure 14) [51,52,53,54,55,56,57]. Much of this inconsistency comes from different assumptions of mechanical behavior of polycrystals (iso-stress, iso-strain, etc.), and the choice of Q-factor to represent the average lattice strain of the sample can also bias the results. The differential stress of NaCl based on measured lattice strains in this study for different mechanical assumptions is calculated using Equation (3) (Figure 14). Given the uncertainty of differential stress measurements, it is important to adopt a unified method in order to compare different experiments in this study. The results from EVPSC are consistent and avoid issues due to lattice plane sampling bias. The self-consistent scheme accounts for strain/stress heterogeneity, which is closer to the real deformation state of aggregates. In order to study the stress relationship between aggregates and individual phases, we use EVPSC results for stresses in the individual phases and for the stresses in the multiphase.
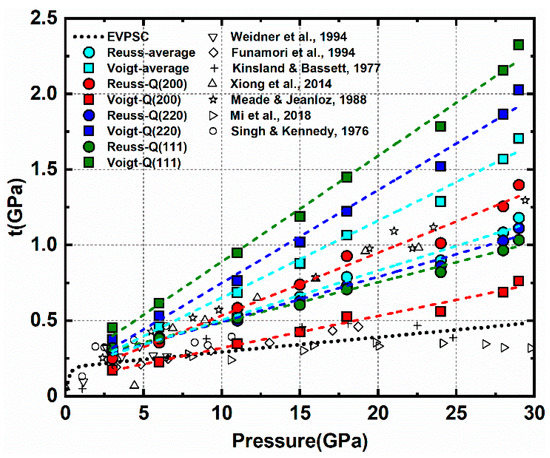
Figure 14.
Differential stress of pure NaCl. Black symbols are the results from several previous studies. The dotted line is the EVPSC result from this study. Colored dash lines with filled circles and squares are the results from Equation (3) using different assumptions and lattice strains.
4.2. Stress and Strain of Individual Phase
In EVPSC, the aggregates plastic strain is the sum of the volume-averaged plastic strain of each phase. Total activity indicates the contribution from corresponding phases to the aggregate. The ratio of activity to phase proportion indicates the average strain of the corresponding phase relative to the aggregate. Generally, activity of MgO and NaCl both decrease with increasing volume fraction of the counterpart phase (Figure 15). This trend is not obvious when the volume fraction of NaCl is above 70% (MgO below 30%). In this range, NaCl likely forms an IWL microstructure and most of the plastic strain is accommodated by the weak NaCl matrix, leaving hard MgO undeformed. When the volume fraction of MgO is above 30%, passing the percolation threshold, MgO starts to deform plastically. Partial plastic strain is accommodated by MgO, resulting in decreasing activity in NaCl. However, average strain of MgO and NaCl show different trends with decreasing phase proportion (Figure 15). Average strain of NaCl is larger than the average strain of the aggregate and it increases with decreasing phase proportions. NaCl strain increases from 100% in pure NaCl to 165% in the 20% NaCl sample. NaCl grains tend to deform more with a lower phase proportion. In contrast, average strain of MgO decreases with decreasing phase proportion and is always lower than the aggregate strain. MgO strain decreases from 100% in pure MgO to nearly 0 in the 20% MgO sample.
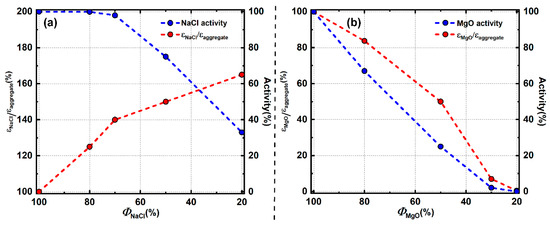
Figure 15.
Activity and average strain evolution with phase proportion; (a) NaCl; (b) MgO.
To better show the stress relationship between individual phases and the aggregate, the average differential stress of MgO, NaCl, and the aggregate under different volume fractions is plotted in Figure 16a–d. When NaCl is the dominant phase and an IWL microstructure is expected (Figure 16a,b), aggregate stress is low and close to the stress of NaCl since most stress is concentrated in the weak NaCl matrix. MgO is below its yield point and the stress increase of MgO with pressure is an elastic response to small strain imposed by the NaCl matrix. When NaCl and MgO have comparable phase proportions (Figure 16c), both NaCl and MgO percolate the other phase and both deform plastically. Stress in MgO reaches ~2 GPa early in deformation and does not change much with continued compression. Aggregate stress is intermediate to stresses in NaCl and MgO. When MgO is the dominant phase and an LBF microstructure is expected, aggregate stress is much higher than NaCl and close to MgO since most of the stress is concentrated in the strong MgO framework (Figure 16d). Aggregates stress increases abruptly starting at ~13 GPa due to pressure hardening of MgO while stress in NaCl is not affected. Similar behavior is also observed in the pure MgO sample but not in the 50% MgO sample where MgO also deforms plastically. The activity of MgO is only 25% in the 50% MgO sample, among which only 2–3% is from the system (Figure 10b). If high pressure makes harder to activate, the activity change will be too small to have an effect on stress in the 50% MgO sample. ‘Pressure hardening’ of the system of MgO will not necessarily activate the harder system of MgO. In the presence of the weak NaCl phase, strain can be accommodated by slip in NaCl rather than the harder system of MgO. However, for pure MgO or the 80% MgO sample, which likely has an LBF microstructure, large amounts of strain must be accommodated by the MgO framework. An increased activation of slip in MgO is required when is hard to activate in order to accommodate geometrically required strain.
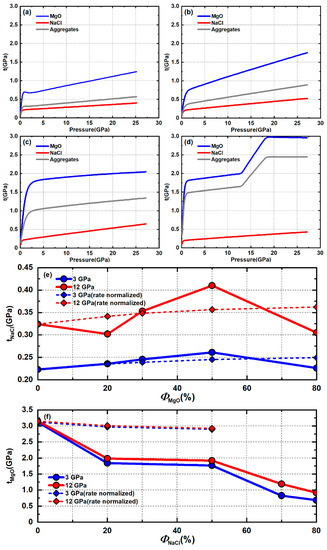
Figure 16.
Stress of the aggregates, NaCl, and MgO under varying phase proportions: (a) 20% MgO + 80% NaCl; (b) 30% MgO + 70% NaCl; (c) 50% MgO + 50% NaCl; (d) 80% MgO + 20% NaCl; stress of individual phase under varying phase proportions: (e) NaCl; (f) MgO.
Stress of NaCl initially increases with increasing fractions of MgO but reaches a peak value around 50% MgO and then decreases with increasing MgO (Figure 16e). Stress in MgO generally decreases with increasing amounts of NaCl but not in a linear fashion (Figure 16f). This difference is caused by two things. First, due to a high yield strength contrast between NaCl and MgO, MgO does not deform plastically when its phase proportion is low but NaCl always deforms plastically. Second, MgO can obstruct plastic flow of NaCl at phase boundaries while NaCl cannot since MgO is much stronger than NaCl. When both MgO and NaCl percolate and deform plastically, NaCl cannot impinge into MgO grains and instead must flow around harder MgO. On the other hand, MgO is hard enough to impose deformation on NaCl. Thus, stress in NaCl is related to obstruction of flow of the NaCl interconnected network by MgO. Stress of MgO is more affected by the local environment surrounding each MgO grain. Deviatoric strain (and strain rate) of NaCl and MgO under varying volume fractions is different (Figure 15). To clarify the effect of phase proportions on stress, the stresses of pure NaCl and MgO are normalized to the strain rate of each phase proportion using the rate-sensitive power law equation (dashed line in Figure 16e,f). This can then be compared with ‘true’ experiment stress. For stress of NaCl, when phase proportions of MgO are below 30%, the rate normalized and experimental stresses of NaCl show little variance except for 20% MgO at high pressure. This might be due to changing deformation mechanisms or large uncertainty from fluctuation (experimental error) of Q-factors (Figure 6a). Within this range, almost all the strain is accommodated by plastic flow of the weak NaCl matrix around MgO inclusions. MgO does not obstruct NaCl flow due to wide dispersion of MgO grains in the weak matrix and because most grain to grain interactions are NaCl–NaCl. The effective polycrystal CRSS of NaCl does not change significantly compared to pure NaCl. When the phase proportion of MgO is 50%, experimental stress is higher than the rate normalized stress. At 50% MgO, NaCl flow is obstructed at MgO–NaCl boundaries and NaCl must flow through the MgO matrix, resulting in high stress concentration in the NaCl phase. When the phase proportion of MgO is 80%, experimental stress drops and is lower than the rate normalized stress. At this phase proportion, an LBF microstructure is expected and NaCl grains are isolated from each other. NaCl grains form weak pockets protected by a hard MgO framework. Most of the strain and stress are accommodated by the MgO framework. Stress in NaCl is far lower than is required to displace the MgO framework. NaCl thus deforms passively in response to the evolution of the MgO framework to maintain compatibility at phase boundaries. Thus, there is no flow of NaCl through the MgO matrix and NaCl inclusions are passive and deform in response to the LBF, resulting in lower stresses compared to pure NaCl.
When studying stress concentration in the weak matrix as a function of the strong phase proportion, it is helpful to define an factor to describe the average spacing between inclusions [3]:
where d is the average diameter of the inclusions and z is the average center distance between two inclusions. At a given inclusion size, a higher phase proportion of the weak phase results in a larger value of . A value of corresponds to 100% weak phase and approaches 0 when inclusions touch to form an LBF microstructure. Handy (1990) [3] examined the flow stress in quartz feldspar mylonites as a function of . For quartz, dynamic recrystallization grain size is inversely related with flow stress. By examining quartz grain size between several feldspar inclusion pairs in natural rocks, grain size distribution can be plotted as a function of ([3], Figure 7b). Quartz grain size is constant with an value in the range of 0.4–1.0, indicating stress of the quartz matrix is not sensitive to the feldspar phase proportion in this range. Quartz grain size decreases with lower values in the range of 0.15 to 0.4, indicating stress in the quartz matrix increases with increased feldspar phase proportion. This is consistent with results in this study that show that the stress of NaCl does not increase until MgO phase proportions reach values between 30% and 50%. When MgO reaches the percolation threshold (~30–40%), LBF type behavior is observed, similar to that observed in stress percolation model shown in [58].
For MgO, when the NaCl is 20%, stress decreases significantly compared with pure MgO and is also much lower than the rate normalized stress. Since NaCl is much weaker than MgO, NaCl–MgO boundaries have little effect on obstruction to MgO flow compared with MgO–MgO boundaries. When parts of the MgO–MgO boundaries are replaced by MgO–NaCl boundaries, the overall obstruction to MgO flow decreases, resulting in lower stress compared with pure MgO. When the phase proportion of NaCl is 50%, stress does not change significantly compared to 20% NaCl. When NaCl reaches the percolation threshold, the percentage of MgO–NaCl boundaries in a local grain environment does not change significantly with added NaCl. Thus, stress of MgO is not sensitive to phase proportions of NaCl within this range. However, when the phase proportion of NaCl is above 70%, MgO no longer percolates. Most of the strain and stress are accommodated by NaCl. NaCl controls the aggregate stress and stress levels are too low to induce yielding in MgO. Stresses in MgO remain below its yield point and, thus, are lower compared to samples where MgO is interconnected and must deform plastically.
Based on these experimental results and discussion, simple schemes for stress evolution in NaCl and MgO with respect to phase proportions can be constructed (Figure 17). Stresses in NaCl do not increase until MgO reaches the percolation threshold and begins to deform plastically. Within the phase proportion range where both MgO and NaCl percolate, stress in NaCl increases with increased MgO due to obstruction of NaCl flow by the MgO. When NaCl is below the percolation threshold and an MgO LBF framework is expected, stress in NaCl decreases with increased MgO due to shielding of NaCl grains by the MgO framework and the passive nature of the isolated weak pockets. In MgO, stress initially decreases with increased NaCl due to more freedom for MgO to flow by increasing MgO–NaCl boundaries. Once NaCl starts to percolate MgO, the local environment of MgO grains does not change with added NaCl. Thus, stress of MgO does not decrease until the volume of MgO falls below the percolation threshold. When MgO is no longer interconnected and is surrounded by NaCl, the stress in MgO decreases due to a transition from plastic to elastic deformation.
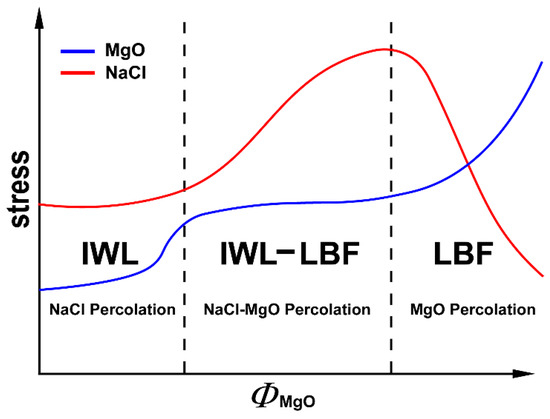
Figure 17.
Stress evolution of individual phases with the MgO phase proportion. Blue line is for MgO and the red line is for NaCl.
4.3. Aggregates Stress
Aggregate stress generally decreases nonlinearly as the weak NaCl phase proportion increases (Figure 18). The addition of only 20% NaCl lowers the aggregate stress by 50% compared to pure MgO. With additional NaCl, aggregates stress decreases but with a more gradual slope. When NaCl dominates the aggregate’s composition, aggregate stress is not sensitive to added NaCl. Aggregate stress under the IWL and LBF microstructures are also estimated using equations from [4], which can be treated as upper and lower bounds for true aggregate stress (solid and dotted lines in Figure 18). For materials like MgO and NaCl, which have a high yield strength contrast, LBF stress is reasonable only in a very narrow range of phase proportions that lie close to pure MgO. IWL stress is close to the aggregate stress when the NaCl phase proportion is over 70%, which is where MgO no longer percolates through the NaCl matrix. At intermediate compositions, aggregate stress lies between LBF and IWL bounds. At low NaCl phase proportions, the value is closer to the LBF end member and at high NaCl phase proportions it is closer to the IWL bound. Aggregate stress for low and high NaCl phase proportions in this study is in good agreement with predicted values under similar yield contrast, as given in [3]. At intermediate phase proportions, the aggregate stress of Handy is lower than that of this study. This may be due to foliation of the weak phase in the highly strained geologic samples studied by Handy (1990) [3].
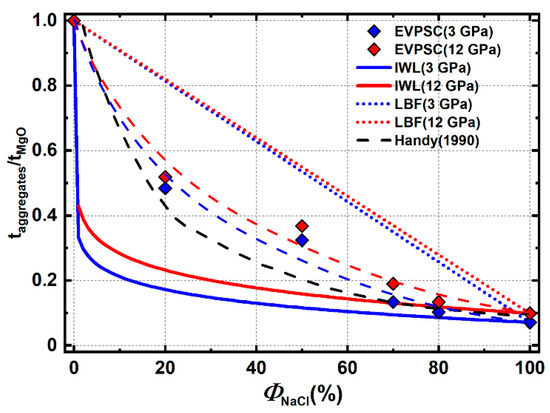
Figure 18.
Normalized aggregate stress under varying phase proportions. Colored diamonds are modeling results from this study. Colored dash lines are guides for the eye based on these points. Solid and dotted lines are estimated stress under LBF and IWL microstructure. The black dash line are results from [3] with a yield contrast ~10.
4.4. Texture Evolution with Varying Phase Proportions
For MgO, when the phase proportion of MgO is below 30%, most of the strain is accommodated by the weak NaCl matrix. Stresses in the aggregate are too low for MgO to deform plastically, resulting in little to no texture development. When the phase proportion of MgO is above 30%, MgO starts to percolate the NaCl matrix and stress in MgO become high enough for plastic deformation. This results in a (100) texture development due to slip similar to pure MgO. Texture strength of MgO increases with increased MgO phase proportions due to an increase in plastic strain in the MgO phase.
In these samples, NaCl always develops a texture regardless of the phase proportion since it is weak and aggregate stresses are always high enough to induce plastic deformation. However, deformation experiments on NaMgF3 + NaCl aggregates [1], which have a similar yield strength contrast as MgO + NaCl, shows that the weak NaCl does not develop obvious texture even if the phase proportion of NaCl is as high as 50%. Deformation experiments on CaGeO3 + MgO aggregates [10], where MgO is the weak phase, shows that MgO develops a (100) texture even if the MgO phase proportion is as low as 28% with an LBF microstructure. In contrast, deformation experiments on bridgmanite + ferropericlase ((Fe, Mg)O) aggregates [2] under similar phase proportion show that weak ferropericlase does not develop texture. Given these results and the observation in this study, plastic anisotropy may play an important role on texture development in multiphase aggregates. NaMgF3/bridgmanite have low-symmetry orthorhombic structures and have higher plastic anisotropy than MgO/CaGeO3, which have high-symmetry cubic or pseudo-cubic structures. A high plastic anisotropy in the strong matrix is likely to induce local heterogeneity of strain and stress in the weak phase, causing a disruption of coherent texture development.
The texture pattern of NaCl can also vary depending of the phase proportion of MgO. When the MgO phase proportion is 20%, NaCl develops a (100) texture in contrast to the (110) texture observed in the pure NaCl sample. When dealing with multiphase deformation, whether individual phases ‘percolate’ (are continuous throughout the sample) or are isolated as inclusions in a matrix greatly affects the material behavior. When the strong phase is isolated as inclusions in the weak matrix, it will cause large local heterogeneity of stress and strain, which in turn affects the flow pattern of the weak phase [59]. In this case, the volume fraction of MgO is under the percolation threshold (~30–40%) and little to no flow occurs in MgO. Thus, MgO behaves like strong inclusions in a flowing weak NaCl matrix. In pure NaCl, slip is geometrically favored since this slip system has most symmetric variants, even though is the so-called ‘easiest’ slip system. With the presence of hard MgO inclusions, plastic flow by is geometrically hampered, forcing activation of the softer but geometrically less favored slip system. This results in development of a (100) NaCl texture in the 20% MgO sample (Figure 19). It is worth noting that a dominant slip transition from to is fulfilled only by increasing the CRSS value of slip to suppress its activation without greatly modifying the CRSS of other slip systems from those of pure NaCl CRSS (Table 1). A similar phenomenon is also observed in Ag and Ag + Fe composite, where it is assumed that the texture of weak Ag is affected by the strong Fe [13].
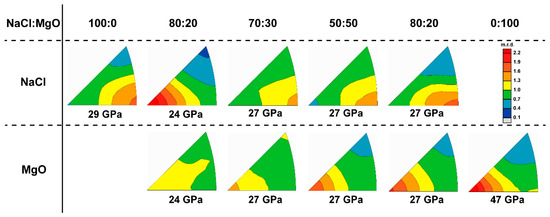
Figure 19.
Summary of experiment texture with various phase proportion.
When the MgO phase proportion is 30%, close to the percolation threshold, a texture transition from (100) to (110) of NaCl can be observed. NaCl initially develops a (100) texture maximum, resembling the case were MgO does not percolate, but gradually transitions to a (110) maximum as deformation proceeds, similar to when MgO percolates NaCl (Figure 19). This likely corresponds to a microstructure evolution in the sample from isolated MgO inclusions towards percolation of MgO as relatively undeformed MgO grains are brought into contact with each other when the sample flattens. Local heterogeneity of strain and stress decrease in NaCl as an LBF develops and begins to impose homogeneous strain in the aggregate. When the MgO phase proportion exceeds 50%, MgO is interconnected and fully percolates the sample. The LBF framework of MgO deforms plastically and controls deformation and imposes a more homogeneous strain in the sample. This causes the dominant slip system of NaCl to switch back to , resulting in a (110) texture maximum (Figure 19).
5. Conclusions
We performed several DAC deformation experiments on NaCl + MgO aggregates with a series of phase proportions from pure NaCl to MgO with the purpose of systematically studying texture and mechanical behavior of multiphase materials with high yield strength contrast components at high pressure. NaCl always deforms plastically regardless of the MgO phase proportion while MgO only deforms plastically when it percolates through the NaCl matrix. When deformed plastically, MgO develops a consistent (100) compression texture similar to pure MgO. NaCl develops a surprisingly different (100) compression texture in the presence of 20% MgO compared with a typical (110) texture. This may be due to changing deformation mechanisms introduced by MgO inclusions and resultant strain and stress heterogeneity. Based on experiments and modeling results in this study, we obtain a scheme for stress evolution of the aggregate and individual phases as a function of phase proportions. As shown in this study, the EVPSC approach is a valuable tool for predicting texture development and also extracting strain and stress partitioning in individual phases and in the aggregate. The latter is currently not feasible to measure directly in high-pressure multiphase deformation experiments. DAC deformation experiments have the disadvantages that phase proportion and microstructure are not controlled precisely, and samples are not easy to recover for microstructural analysis. In the future, with the help of large volume deformation (e.g., the deformation-DIA), additional deformation experiments on varying yield strength contrast aggregates with controllable phase proportions and microstructures should be done to fully constrain the mechanical behavior and texture development in multiphase materials over a range of pressures and temperature conditions.
Author Contributions
Experiment, F.L., L.M., M.J., M.G., and S.C.; data analysis, F.L., M.G., and B.D.; writing—original draft preparation, F.L.; writing—review and editing, L.M.; supervision, L.M.
Funding
L.M. acknowledges support from the National Science Foundation through EAR-1654687. This work has been supported by the US Department of Energy, National Nuclear Security Administration, through the Capital-DOE Alliance Center (DE-NA0003858) which provided graduate student financial support for M.J. and S.C. as well as support for beamtime.
Acknowledgments
This work was performed at beamline 12.2.2 of the Advanced Light Source. Beamline 12.2.2 at the Advanced Light Source is a DOE Office of Science User Facility under contract No. DE-AC02-05CH11231. This research was partially supported by COMPRES, the Consortium for Materials Properties Research in Earth Sciences under NSF Cooperative Agreement EAR 1606856. Portions of this work were performed at HPCAT (Sector 16), Advanced Photon Source (APS), Argonne National Laboratory. HPCAT operations are supported by DOE-NNSA’s Office of Experimental Sciences. The Advanced Photon Source is a U.S. Department of Energy (DOE) Office of Science User Facility operated for the DOE Office of Science by Argonne National Laboratory under Contract No. DE-AC02-06CH11357. We acknowledge Martin Kunz at ALS and Jessie Smith at APS for technical support. The EVPSC code of reference [14] was used for performing simulations. We would also like to thanks Carlos Tomé for comments on the manuscript.
Conflicts of Interest
The authors declare no conflict of interest.
References
- Kaercher, P.; Miyagi, L.; Kanitpanyacharoen, W.; Zepeda-Alarcon, E.; Wang, Y.; Parkinson, D.; Lebensohn, R.A.; De Carlo, F.; Wenk, H.R. Two-phase deformation of lower mantle mineral analogs. Earth Planet. Sci. Lett. 2016, 456, 134–145. [Google Scholar] [CrossRef]
- Miyagi, L.; Wenk, H.R. Texture development and slip systems in bridgmanite and bridgmanite+ ferropericlase aggregates. Phys. Chem. Miner. 2016, 43, 597–613. [Google Scholar] [CrossRef]
- Handy, M.R. The solid-state flow of polymineralic rocks. J. Geophys. Res. Solid Earth 1990, 95, 8647–8661. [Google Scholar] [CrossRef]
- Handy, M.R. Flow laws for rocks containing two non-linear viscous phases: A phenomenological approach. J. Struct. Geol. 1994, 16, 287–301. [Google Scholar] [CrossRef]
- Girard, J.; Amulele, G.; Farla, R.; Mohiuddin, A.; Karato, S.I. Shear deformation of bridgmanite and magnesiowüstite aggregates at lower mantle conditions. Science 2016, 351, 144–147. [Google Scholar] [CrossRef]
- Poudens, A.; Bacroix, B.; Bretheau, T. Influence of microstructures and particle concentrations on the development of extrusion textures in metal matrix composites. Mater. Sci. Eng. A 1995, 196, 219–228. [Google Scholar] [CrossRef]
- Garcés, G.; Rodríguez, M.; Perez, P.; Adeva, P. Effect of volume fraction and particle size on the microstructure and plastic deformation of Mg–Y2O3 composites. Mater. Sci. Eng. A 2006, 419, 357–364. [Google Scholar] [CrossRef]
- Brokmeier, H.G.; Böcker, W.; Bunge, H.J. Neutron diffraction texture analysis in extruded Al-Pb composites. Texture Stress Microstruct. 1988, 8, 429–441. [Google Scholar] [CrossRef]
- Wenk, H.R.; Lonardeli, I.; Pehl, J.; Devine, J.; Prakapenka, V.; Shen, G.; Mao, H.K. In situ observation of texture development in olivine, ringwoodite, magnesiowüstite and silicate perovskite at high pressure. Earth Planet. Sci. Lett. 2004, 226, 507–519. [Google Scholar] [CrossRef]
- Wang, Y.; Hilairet, N.; Nishiyama, N.; Yahata, N.; Tsuchiya, T.; Morard, G.; Fiquet, G. High-pressure, high-temperature deformation of CaGeO3 (perovskite)±MgO aggregates: Implications for multiphase rheology of the lower mantle. Geochem. Geophys. Geosyst. 2013, 14, 3389–3408. [Google Scholar] [CrossRef]
- Miyajima, N.; Walte, N. Burgers vector determination in deformed perovskite and post-perovskite of CaIrO3 using thickness fringes in weak-beam dark-field images. Ultramicroscopy 2009, 109, 683–692. [Google Scholar] [CrossRef] [PubMed]
- Cordier, P.; Ungár, T.; Zsoldos, L.; Tichy, G. Dislocation creep in MgSiO3 perovskite at conditions of the Earth’s uppermost lower mantle. Nature 2004, 428, 837. [Google Scholar] [CrossRef] [PubMed]
- Lazik, S.; Esling, C. Textures in Multiphase Materials: A Review. Texture Stress Microstruct. 1993, 22, 1–15. [Google Scholar] [CrossRef]
- Wang, H.; Wu, P.D.; Tomé, C.N.; Huang, Y. A finite strain elastic–viscoplastic self-consistent model for polycrystalline materials. J. Mech. Phys. Solids 2010, 58, 594–612. [Google Scholar] [CrossRef]
- Merkel, S.; Yagi, T. X-ray transparent gasket for diamond anvil cell high pressure experiments. Rev. Sci. Instrum. 2005, 76, 046109. [Google Scholar] [CrossRef]
- Brown, J.M. The NaCl pressure standard. J. Appl. Phys. 1999, 86, 5801–5808. [Google Scholar] [CrossRef]
- Bassett, W.A.; Takahashi, T.; Mao, H.K.; Weaver, J.S. Pressure-induced phase transformation in NaCl. J. Appl. Phys. 1968, 39, 319–325. [Google Scholar] [CrossRef]
- Heinz, D.L.; Jeanloz, R. Compression of the B2 high-pressure phase of NaCl. Phys. Rev. B 1984, 30, 6045. [Google Scholar] [CrossRef]
- Nishiyama, N.; Katsura, T.; Funakoshi, K.I.; Kubo, A.; Kubo, T.; Tange, Y.; Sueda, Y.; Yokoshi, S. Determination of the phase boundary between the B1 and B2 phases in NaCl by in situ x-ray diffraction. Phys. Rev. B 2003, 68, 134109. [Google Scholar] [CrossRef]
- Sato-Sorensen, Y. Phase transitions and equations of state for the sodium halides: NaF NaCl, NaBr, and NaI. J. Geophys. Res. Solid Earth 1983, 88, 3543–3548. [Google Scholar] [CrossRef]
- Singh, A.K. The lattice strains in a specimen (cubic system) compressed nonhydrostatically in an opposed anvil device. J. Appl. Phys. 1993, 73, 4278–4286. [Google Scholar] [CrossRef]
- Singh, A.K.; Balasingh, C.; Mao, H.K.; Hemley, R.J.; Shu, J. Analysis of lattice strains measured under nonhydrostatic pressure. J. Appl. Phys. 1998, 83, 7567–7575. [Google Scholar] [CrossRef]
- Burnley, P.C.; Zhang, D. Interpreting in situ x-ray diffraction data from high pressure deformation experiments using elastic–plastic self-consistent models: An example using quartz. J. Phys. Condens. Matter 2008, 20, 285201. [Google Scholar] [CrossRef]
- Merkel, S.; Tomé, C.; Wenk, H.R. Modeling analysis of the influence of plasticity on high pressure deformation of hcp-Co. Phys. Rev. B 2009, 79, 064110. [Google Scholar] [CrossRef]
- Lin, F.; Hilairet, N.; Raterron, P.; Addad, A.; Immoor, J.; Marquardt, H.; Tomé, C.N.; Miyagi, L.; Merkel, S. Elasto-viscoplastic self consistent modeling of the ambient temperature plastic behavior of periclase deformed up to 5.4 GPa. J. Appl. Phys. 2017, 122, 205902. [Google Scholar] [CrossRef]
- Lutterotti, L.; Matthies, S.; Wenk, H.R.; Schultz, A.S.; Richardson, J.W., Jr. Combined texture and structure analysis of deformed limestone from time-of-flight neutron diffraction spectra. J. Appl. Phys. 1997, 81, 594–600. [Google Scholar] [CrossRef]
- Matthies, S.; Vinel, G.W. On the reproduction of the orientation distribution function of texturized samples from reduced pole figures using the conception of a conditional ghost correction. Phys. Status Solidi 1982, 112, K111–K114. [Google Scholar] [CrossRef]
- Wenk, H.R.; Matthies, S.; Donovan, J.; Chateigner, D. BEARTEX: A Windows-based program system for quantitative texture analysis. J. Appl. Crystallogr. 1998, 31, 262–269. [Google Scholar] [CrossRef]
- Wenk, H.R.; Lutterotti, L.; Kaercher, P.; Kanitpanyacharoen, W.; Miyagi, L.; Vasin, R. Rietveld texture analysis from synchrotron diffraction images. II. Complex multiphase materials and diamond anvil cell experiments. Powder Diffr. 2014, 29, 220–232. [Google Scholar] [CrossRef]
- Castelnau, O.; Blackman, D.K.; Lebensohn, R.A.; Ponte Castañeda, P. Micromechanical modeling of the viscoplastic behavior of olivine. J. Geophys. Res. Solid Earth 2008, 113. [Google Scholar] [CrossRef]
- Turner, P.A.; Tomé, C.N. A study of residual stresses in Zircaloy-2 with rod texture. Acta Metall. Et Mater. 1994, 42, 4143–4153. [Google Scholar] [CrossRef]
- Lebensohn, R.; Tomé, C.N. A self-consistent viscoplastic model: Prediction of rolling textures of anisotropic polycrystals. Mater. Sci. Eng. A 1994, 175, 71–82. [Google Scholar] [CrossRef]
- Zha, C.S.; Mao, H.K.; Hemley, R.J. Elasticity of MgO and a primary pressure scale to 55 GPa. Proc. Natl. Acad. Sci. USA 2000, 97, 13494–13499. [Google Scholar] [CrossRef] [PubMed]
- Whitfield, C.H.; Brody, E.M.; Bassett, W.A. Elastic moduli of NaCl by Brillouin scattering at high pressure in a diamond anvil cell. Rev. Sci. Instrum. 1976, 47, 942–947. [Google Scholar] [CrossRef]
- Carter, N.L.; Heard, H.C. Temperature and rate dependent deformation of halite. Am. J. Sci. 1970, 269, 193–249. [Google Scholar] [CrossRef]
- Copley, S.M.; Pask, J.A. Plastic deformation of MgO single crystals up to 1600 C. J. Am. Ceram. Soc. 1965, 48, 139–146. [Google Scholar] [CrossRef]
- Hulse, C.O.; Copley, S.M.; Pask, J.A. Effect of crystal orientation on plastic deformation of magnesium oxide. J. Am. Ceram. Soc. 1963, 46, 317–323. [Google Scholar] [CrossRef]
- Paterson, M.S.; Weaver, C.W. Deformation of polycrystalline MgO under pressure. J. Am. Ceram. Soc. 1970, 53, 463–471. [Google Scholar] [CrossRef]
- Sato, F.; Sumino, K. The yield strength and dynamic behaviour of dislocations in MgO crystals at high temperatures. J. Mater. Sci. 1980, 15, 1625–1634. [Google Scholar] [CrossRef]
- Barthel, C. Plastiche Anisotropie von Bleisulfid und Magnesiumoxid; University of Gottingen: Gottingen, Germany, 1984. [Google Scholar]
- Appel, F.; Wielke, B. Low temperature deformation of impure MgO single crystals. Mater. Sci. Eng. 1985, 73, 97–103. [Google Scholar] [CrossRef]
- Amodeo, J.; Carrez, P.; Cordier, P. Modelling the effect of pressure on the critical shear stress of MgO single crystals. Philos. Mag. 2012, 92, 1523–1541. [Google Scholar] [CrossRef]
- Franssen, R.C. The rheology of synthetic rocksalt in uniaxial compression. Tectonophysics 1994, 233, 1–40. [Google Scholar] [CrossRef]
- Lebensohn, R.A.; Dawson, P.R.; Kern, H.M.; Wenk, H.R. Heterogeneous deformation and texture development in halite polycrystals: Comparison of different modeling approaches and experimental data. Tectonophysics 2003, 370, 287–311. [Google Scholar] [CrossRef]
- Skrotzki, W.; Welch, P. Development of texture and microstructure in extruded ionic polycrystalline aggregates. Tectonophysics 1983, 99, 47–61. [Google Scholar] [CrossRef]
- Merkel, S.; Wenk, H.R.; Shu, J.; Shen, G.; Gillet, P.; Mao, H.K.; Hemley, R.J. Deformation of polycrystalline MgO at pressures of the lower mantle. J. Geophys. Res. Solid Earth 2002, 107, ECV-3. [Google Scholar] [CrossRef]
- Wenk, H.R.; Armann, M.; Burlini, L.; Kunze, K.; Bortolotti, M. Large strain shearing of halite: Experimental and theoretical evidence for dynamic texture changes. Earth Planet. Sci. Lett. 2009, 280, 205–210. [Google Scholar] [CrossRef]
- Lin, F.; Couper, S.; Jugle, M.; Miyagi, L. Competing deformation mechanism in periclase: Implications for lower mantle anisotropy. Minerals 2019, 9, 650. [Google Scholar] [CrossRef]
- Wenk, H.R.; Canova, G.; Molinari, A.; Mecking, H. Texture development in halite: Comparison of Taylor model and self-consistent theory. Acta Metall. 1989, 37, 2017–2029. [Google Scholar] [CrossRef]
- Meade, C.; Jeanloz, R. Yield strength of MgO to 40 GPa. J. Geophys. Res. Solid Earth 1988, 93, 3261–3269. [Google Scholar] [CrossRef]
- Weidner, D.J.; Wang, Y.; Vaughan, M.T. Yield strength at high pressure and temperature. Geophys. Res. Lett. 1994, 21, 753–756. [Google Scholar] [CrossRef]
- Funamori, N.; Yagi, T.; Uchida, T. Deviatoric stress measurement under uniaxial compression by a powder x-ray diffraction method. J. Appl. Phys. 1994, 75, 4327–4331. [Google Scholar] [CrossRef]
- Kinsland, G.L.; Bassett, W.A. Strength of MgO and NaCl polycrystals to confining pressures of 250 kbar at 25 °C. J. Appl. Phys. 1977, 48, 978–985. [Google Scholar] [CrossRef]
- Meade, C.; Jeanloz, R. Yield strength of the B1 and B2 phases of NaCl. J. Geophys. Res. Solid Earth 1988, 93, 3270–3274. [Google Scholar] [CrossRef]
- Singh, A.K.; Kennedy, G.C. Estimation of uniaxial stress component in NaCl samples compressed in a tungsten carbide anvil high-pressure x-ray apparatus. J. Appl. Phys. 1976, 47, 3337–3340. [Google Scholar] [CrossRef]
- Xiong, L.; Bai, L.; Liu, J. Strength and equation of state of NaCl from radial x-ray diffraction. J. Appl. Phys. 2014, 115, 033509. [Google Scholar] [CrossRef]
- Mi, Z.; Shieh, S.R.; Kavner, A.; Kiefer, B.; Wenk, H.R.; Duffy, T.S. Strength and texture of sodium chloride to 56 GPa. J. Appl. Phys. 2018, 123, 135901. [Google Scholar] [CrossRef]
- Burnley, P.C. The importance of stress percolation patterns in rocks and other polycrystalline materials. Nat. Commun. 2013, 4, 2117. [Google Scholar] [CrossRef]
- Bolmaro, R.E.; Guerra, F.M.; Kocks, U.F.; Browning, R.V.; Dawson, P.R.; Embury, J.D.; Poole, W.J. On plastic strain distribution and texture development in fiber composites. Acta Metall. Mater. 1993, 41, 1893–1905. [Google Scholar] [CrossRef]
© 2019 by the authors. Licensee MDPI, Basel, Switzerland. This article is an open access article distributed under the terms and conditions of the Creative Commons Attribution (CC BY) license (http://creativecommons.org/licenses/by/4.0/).