Article

Distribution of “Invisible” Noble Metals between Pyrite and Arsenopyrite Exemplified by Minerals Coexisting in Orogenic Au Deposits of North-Eastern Russia

A.P.Vinogradov Institute of Geochemistry, Siberian Branch of Russian Academy of Sciences, Irkutsk 664033, Russia
*
Author to whom correspondence should be addressed.
Minerals 2019, 9(11), 660; https://doi.org/10.3390/min9110660
Submission received: 4 October 2019 / Revised: 22 October 2019 / Accepted: 24 October 2019 / Published: 27 October 2019

Abstract

:
The study focused on the forms of occurrence and distribution of hidden (“invisible”) noble metals (NMs = Au, Ag, Pt, Pd, Ru) in the coexisting pyrites and arsenopyrites of four samples of mineral associations from three Au deposits in the north-east of Russia. The unique nature of our approach was the combination of methods of local analysis and statistics of the compositions of individual single crystals of different sizes. This allowed us to take into account the contribution of the surface component to the total NM content and to distinguish the structurally bound form of the elements. The following estimates of the distribution coefficients of the structural (str) and surficial (sur) forms of elements were obtained: D ¯ P y / A s p s t r   = 2.7 (Au), 2.5 (Pd), 1.6 (Pt), 1.7 (Ru) and D ¯ P y / A s p s u r   = 1.6 (Au), 1.1 (Pd), 1.5 (Pt and Ru). The data on Ag in most cases indicated its fractionation into pyrite ( D ¯ P y / A s p s t r   = 17). Surface enrichment was considered as a universal factor in “invisible” NM distribution. A number of elements (i.e., Pt, Ru, Ag) tended to increase their content with a decrease in the crystallite size in pyrite and arsenopyrite. This may be due to both the phase size effect and the intracrystalline adsorption of these elements at the interblock boundaries of a dislocation nature. The excess of metal (or the presence of S vacancies) in pyrite increased Ag and Pt content in its structure and, to a lesser extent, the content of Ru, Pd and Au. Arsenopyrite exhibited a clear tendency to increase the content of Pt, Ru and Pd in samples with excess As over S. Sulphur deficiency was a favourable factor for the incorporation of Ag and platinoids into the structures of the mineral associations studied. Perhaps this was due to the lower sulphur fugacity. Pyrite with excess Fe was associated with higher contents of some NMs. The presence of other impurity elements was not an independent factor in NM concentration.

1. Introduction

The distribution of noble metals (NMs) between sulphide and arsenide minerals, particularly, pyrite and arsenopyrite, is of interest from several aspects. These minerals play an important role as concentrators of platinum group elements (PGEs) and Au in magmatic and high-temperature hydrothermal systems [1,2]. Although pyrite is unstable above 742 °C and arsenopyrite above 702 °C, these minerals are, in principle, capable of forming at the magmatic stage from sulphide melts containing low-melting-point chalcophile elements. It has been experimentally proven that pyrite can crystallise as a primary magmatic phase resulting from subsolidus reactions with the participation of monosulphide solid solution (mss) and intermediate solid solution (iss), and its formation does not require obligatory participation of hydrothermal processes [3]. However, pyrite and As-containing sulphides in Ni–Cu–PGE deposits are mainly considered as substitution products that inherit the rare-element composition of primary ores [4]. In Au deposits of different types, pyrite and arsenopyrite are common ore components, but, as a rule, of NMs, only Au is usually considered and analysed in their associations. Elevated PGE contents are associated with sulphides of metal-bearing black shales [5]; however, we were unable to find data for them concerning the platinoids contents in the coexisting pyrite and arsenopyrite.
The distribution of NMs between pyrite and arsenopyrite is directly related to the issues of the forms and limits of NM incorporation into these minerals. For example, if we consider Au, then according to Reich et al. [6], the maximum Au content in pyrite is related to its As content by linear dependence. It is assumed that this dependence satisfies the low-temperature conditions of pyrite crystallisation, Au solubility in pyrite being of retrograde nature and increasing with decreasing temperature [7]. If this is true, then the low-temperature pyrite–arsenopyrite associations are of great interest for assessment of the limit of Au incorporation into pyrite. In pyrite coexisting with arsenopyrite, the chemical potential of As and its content must be extremely high for the given combination of temperature and sulphur fugacity (fS2) in which this paragenesis is stable. Arsenopyrite is a mineral of variable composition, and its As content depends on these parameters. In addition, it is believed that the PGE–As bond in pyrite, which is characterised by the presence of As, is energetically more advantageous as compared to the PGE–S bond in monosulphide–pyrrhotite and pentlandite [8]. Consequently, the highest concentrations of PGE can be observed in As–pyrite, which is in association with arsenopyrite. Most recently, experimental data on the unexpectedly high isomorphic capacity of pyrite with respect to platinum have appeared: pyrite crystals synthesised at 580 and 590 °C contained up to 4 wt % Pt [9]. X-ray absorption spectroscopy demonstrated that it replaces Fe in the form of Pt2+ in the structure of pyrite. In this regard, there arises the question of why these opportunities are not realised in the natural environment, and what parameters and conditions determine the occurrence of NMs in these minerals.
PGEs exhibit bimodal distribution, forming discrete inclusions of the metal and its compounds with chalcogenides and pnictides, as well as solid solutions in sulphides, arsenides and sulpharsenides [10,11]. The form of PGE dissolved in the crystal lattices of these minerals is called the hidden form of the element [11]. This is one of the forms of occurrence of the element that is considered “invisible”, i.e., beyond the possibility of diagnosis by optical microscopy. Such forms also include submicron inclusions of inherent phases of microelements (including nanoparticles), as well as elements present in the surface layers of minerals in the composition of surface non-autonomous phases or on the surface itself in the adsorbed state [12,13,14]. Invisible forms are related by mutual transformations. Thus, nanoparticles of Ag2S arise during quenching from 500 °C of pyrite crystals containing a structural admixture of Ag [14]; nanoparticles of PtS2 are released upon cooling pyrite crystals that contain an isomorphic admixture of Pt [9]. The same processes are likely to lead to the formation of NM nanoparticles (<100 nm) in minerals from deposits of magmatic genesis [15]. Gold nanoparticles can be formed under conditions of pyrite undersaturation with Au due to the intracrystalline reduction reactions associated with changes in the chemical state of other elements (for example, As [16]). Similarly, elements chemically bonded in surface nanoscale phases can transform into nanoparticles when external physical and chemical conditions change, which also results in bimodal distribution of the element, but only on the mineral surface. In this case, Au nanoparticles (~5 nm) on the surface of sulphide minerals (e.g., arsenopyrite and chalcopyrite) are prone to aggregation by the self-assembly mechanism with the formation of microparticles smaller than 10 µm [17].
It is easy to understand that the distribution of invisible NM forms is influenced by many factors, including various types of crystal imperfections in mineral phase-point defects, boundaries of blocks and grains in crystals and their surfaces. For example, elevated levels of Au and other NMs in arsenopyrite are associated with its non-stoichiometry, or excessive S or As [18], and in pyrite, with the formation of a block submicroscopic structure at relatively low temperatures (≤300 °C) [19]. These factors might be responsible for the appearance of invisible PGE forms even under low-temperature conditions, for example, in ores formed at temperatures around 100 °C and associated with sedimentary-diagenetic processes [11].

2. Previous Studies and Problem Statement
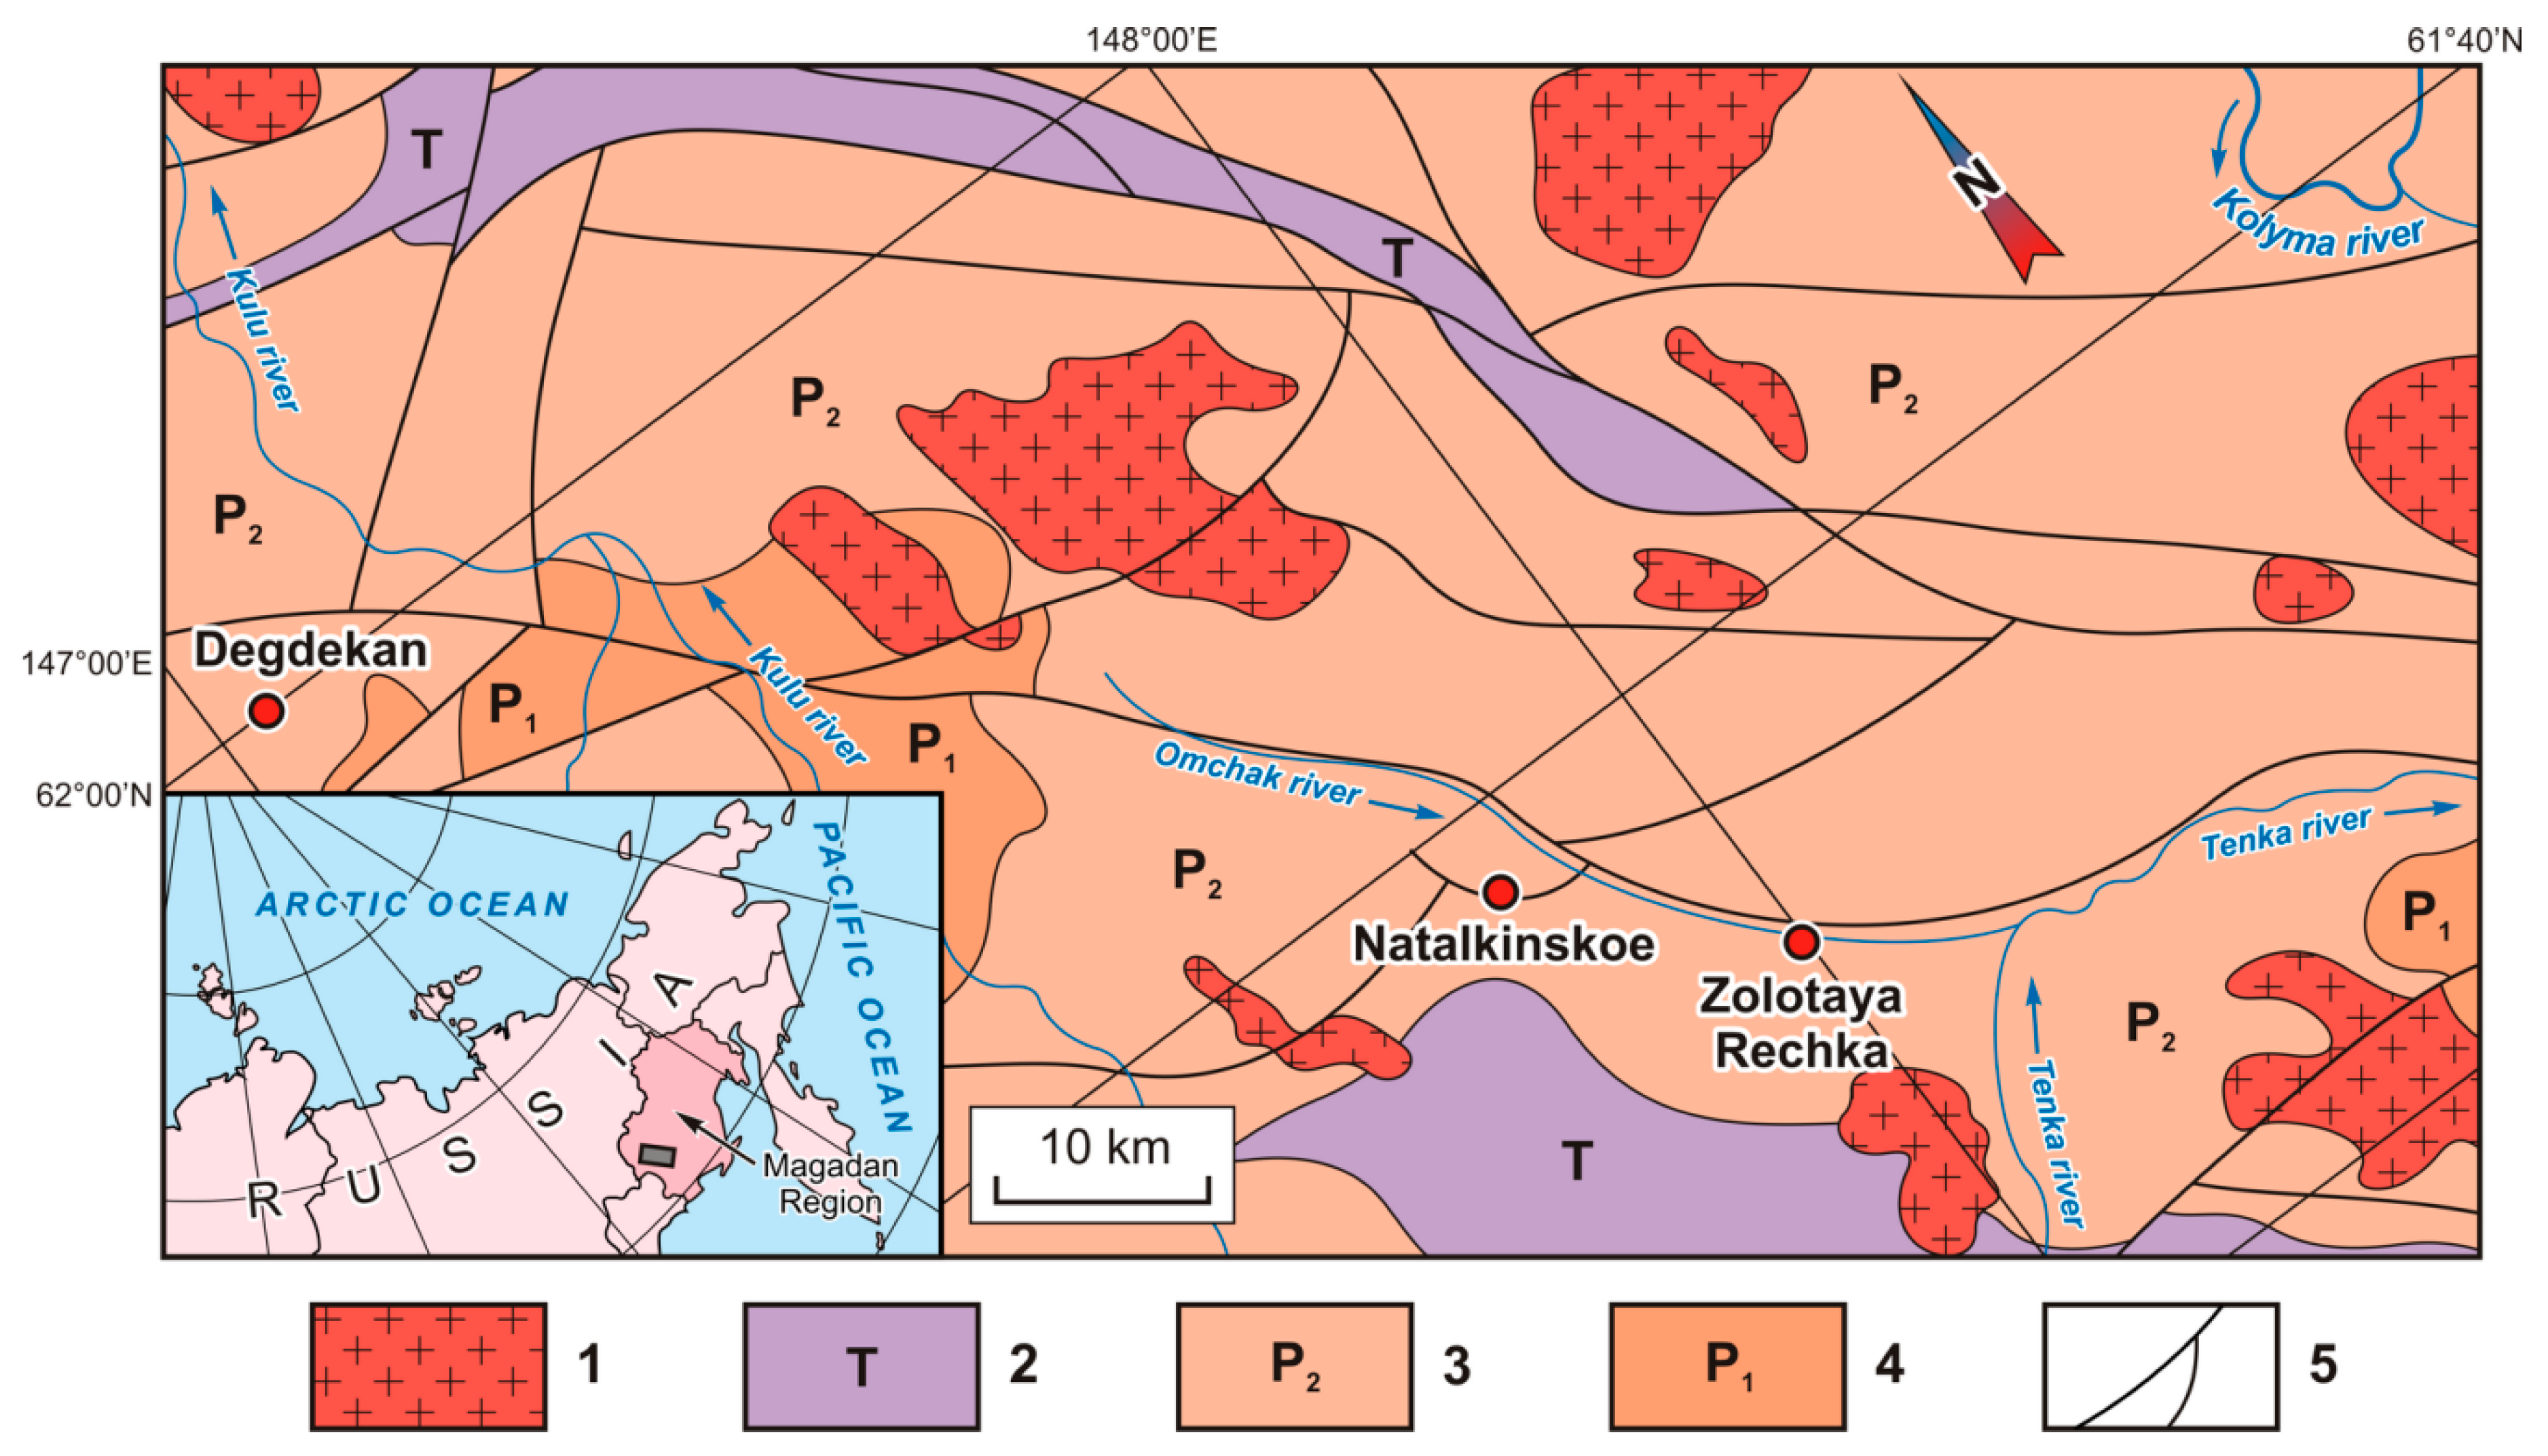
It is commonly believed that arsenide minerals are the best collectors of platinoids and Au compared to sulphides. However, this applies mainly to ores of magmatic genesis [20] or ore assemblages formed as a result of remobilisation of primary late magmatic arsenide-rich ores [1]. In these cases, the distribution coefficients of platinoids and Au between arsenides and sulphides are large enough, although they vary greatly for different elements. For example, calculations performed by Pina et al. [20] for the assumed equilibrium of maucherite (Ni11As8) with sulphides–pyrrhotite, pentlandite and chalcopyrite yielded the following values of the D i A s / s u l f distribution coefficient: 330 (Pt), 250 (Pd), 50 (Ru), 310 (Au), 4 (Ag). Here As denotes arsenide, sulf-sulphide phases. However, if we consider other mineral occurrences that do not have a direct connection with magmatism, the picture will be somewhat different. For example, for the mineralisation of Mo–Ni–PGE in black shales [5], the distribution coefficients of invisible forms of Pt and Pd between pyrite and gersdorffite (NiAsS), which is the Ni-analogue of arsenopyrite, on average amount to ~0.9; that is, no significant fractionation of these elements in the sulpharsenide phase is detected. On the other hand, Kravtsova et al. [21] suggested that the increased content of PGEs and Au are typical of arsenopyrites formed at the hydrothermal stage, at the deposit of metamorphogenic–hydrothermal genesis, as confirmed by the rather high content of the structural forms of Pt and Pd in arsenopyrite. However, no data on the composition of pyrite coexisting with arsenopyrite were presented in this work.
A significant number of studies are devoted to Au in pyrite and arsenopyrite. We have undertaken generalisation of the selected data on the invisible Au in the coexisting pyrite and arsenopyrite [22,23,24,25,26,27,28,29,30,31,32,33,34,35]. The data we collected are presented in Table 1. It is believed that arsenopyrite contains more chemically bound Au than the pyrite formed together with it [36]. However, there is an opinion that “...there may be an as-yet undefined partitioning of Au between the two minerals when at equilibrium” ([22], p. 1279). As we mentioned in the Introduction, some authors believe that the solubility of Au and As in pyrite is retrograde: Au and As contents increasing with decreasing temperature [7]. The same effect is assumed for Au in arsenopyrite, based on the fact that Au is released from the arsenopyrite matrix when heated to form native Au [37]. As the experiment shows, at temperatures of 450–500 °C, the solubility of Au in pyrite with low As content (30–120 ppm) is 1–3 ppm, and only at high Mn content (~3000 ppm) does it increase to 7.3 ppm, possibly due to the heterovalent substitution 2Fe2+ = Mn3+ + Au+ [38,39].
This temperature range is close to the conditions of mineral formation in a number of orogenic and volcanogenic-hosted massive sulphide (VHMS) deposits. But, if in most of these relatively high-temperature deposits the content of invisible Au in pyrite is fully consistent with the above experimental data (Nos. 2, 3, 4, 6, 7, 10, 11 in Table 1), in several others they completely contradict them (Nos. 5, 8). Unrealistically high in comparison with experimental data, Au contents in pyrite are observed for the Carlin-type deposits and even for massive sulphide, non-Au ore deposits (Nos. 1, 12–14). The occurrence of Au in pyrite is unequivocally associated with the presence of As [6,7], but the data in Table 1 do not detect such an unambiguous relationship. Very high contents of invisible Au in pyrite are registered both at ordinary contents of As (No. 8) and at elevated ones (Nos. 1, 5). On the other hand, low Au contents can also be observed with rather high As contents (Nos. 4, 9, 11). As for arsenopyrite, it does show in most cases higher levels of invisible Au compared to the coexisting pyrite. Nevertheless, there are exceptions. At high Au contents in both minerals, the coefficient of its distribution between arsenopyrite and pyrite may be close to unity (Nos. 1, 5, 8), this being the case for significantly different types of deposits (Carlin and orogenic) and the conditions of their formation. At lower Au contents, this coefficient sometimes becomes even less than unity (No. 12: Rocky Turn, Murray Brook). In other cases, we have to state very large variations of its values—from one to three and even four orders of magnitude in favour of arsenopyrite (Nos. 10, 11).
The review of published data presented above shows that NM distribution between pyrite and arsenopyrite and the factors affecting it are poorly understood. More or less certain data are presented for Au only, although they are quite contradictory. As for PGEs, the available information suffices for qualitative analysis only, at the level of trends, and is not directly related to a specific mineral assemblage. The goal of this work is to study the NM speciation and distribution in coexisting pyrite and arsenopyrite from several orogenic Au deposits. The specific feature of our approach is the combination of methods of local analysis and statistics of the compositions of individual single crystals of different sizes. This allows us to take into account the contribution of the surface component to the total NM content and to distinguish the structurally bound form of the element according to the previously proposed analytical data selections for single crystals (ADSSC) technology [13].

3. Objects

Pyrite and arsenopyrite crystals for the study were collected from three Au objects: the Natalkinskoe, Degdekan and Zolotaya Rechka deposits. The deposits are located in the north-east of Russia (Magadan region, Tenkin ore district), are part of the Au-bearing Yano–Kolyma fold belt and are confined to its orogenic zones of collision origin. In terms of metallogenic properties, all of them are of the same type and belong to the Au–quartz low-sulphide formation of ores deposited in the upper Permian age carbonised strata. Figure 1 shows the location of the deposits within the territory of the Magadan region together with a simplified scheme of geologic aspects of the area of investigations.
Pyrite and arsenopyrite are the most common sulphide minerals in these deposits. We studied crystals from the widely distributed gold-bearing ores relatively rich in sulphides and belonging to the streaky-vein and veinlet-disseminated types (Figure 2). The mineral composition of ores was relatively constant (see below).
The study here of PGEs, in addition to Au and Ag, the determination of their contents and forms of occurrence in ores and minerals, holds a special place in the research and is important not only theoretically but also practically. The presence in the ores of these NMs and the possibility of their extraction can supplement significantly the range of already known platinum-bearing ore formations and essentially increase the value of the extracted Au ore raw materials in the deposits where platinoids accompany Au mineralisation. The geological setting and mineralogical features of these objects are given in detail elsewhere [13,40,41,42,43,44,45]. Their brief characteristics are presented below.

3.1. The Natalkinskoe Deposit

The Natalkinskoe Au deposit is one of the largest in Russia by Au reserves. The deposit is embedded in stratified upper Permian sediments composed mainly of aleuropelitic shales with fragments of different composition rocks, carbono-argillaceous shales, siltstones, sandstones and gravelites. The ores belong to the Au-sulphide-impregnated type and is characterised by a complex metamorphogenic–hydrothermal genesis [40]. They make up a uniform in the internal structure load, consisting of a framework of extended linear zones of quartz, carbonate–quartz and sulphide–quartz veins and veinlets surrounded by a wide halo of sulphidized rocks. In general, the deposit is traced along the strike at a distance of 5 km, with a width of 1 km. According to K/Ar dating, the age of Au mineralisation is estimated to be from 135–130 m.y. up to 110–100 m.y., i.e., as early Cretaceous [40]. However, according to Ar–Ar sericite dating, the age of Au ores of the Natalkinskoe deposit is 135.2 m.y. [41].
Arsenopyrite and pyrite are the most common sulphide minerals in the deposit. In the ore samples Nat-10 and UV-3/13 from which they were selected, non-metallic minerals such as quartz, carbonates, feldspars, sericite and chlorite were identified. Of the ore minerals, along with arsenopyrite and pyrite, the amount of which was about 4–7%, galena, sphalerite, chalcopyrite, native Au and rutile (less than 1%) were detected. The difference between these two samples lies in the proportion of arsenopyrite and pyrite: domination of arsenopyrite over pyrite in Nat-10 and vice versa in UV-3/13. Native gold with a fineness of 750–900‰, less often low-grade (electrum), mainly coarse-grained, occurs in vein quartz and in agglomerates with sulphide minerals. Silver in its own mineral form is very rare. The most productive are pyrite–arsenopyrite mineral assemblage with Au and galena [40]. Commercial ores emerged in the interaction of host rocks with low- and moderate-salinity water–bicarbonate fluids in the salinity range of 3–12 wt % NaCl-eq., at temperatures of 360–280 °C and pressures of approximately 2.4–1.1 kbar [42]. Two samples of coexisting pyrite and arsenopyrite are considered below. The first (Nat-10) was collected in the “altarnativnyi” area of the deposit, the second (UV-3/13) in the “south-east” area. Both originated from veinlet-impregnated ores and contained from 0.5 up to 22.0 ppm of Au.

3.2. The Degdekan Deposit

The Degdekan Au deposit is an example of the localisation of zones of vein and veinlet-impregnated sulphide ores in stratified upper Permian sediments, composed mainly of carbonaceous siltstones and shales with a large number of interlayers of graphitised host rocks. Ore mineralisation is formed in two stages: hydrothermal–metamorphogenic and hydrothermal [43]. The absolute age of Au mineralisation by U-Pb-SHRIMP is estimated at 133–137 m.y., and by the Ar–Ar method at 137 m.y., i.e., the formation of ore refers to the beginning of the early Cretaceous [44,45]. The main vein mineral is quartz. In the host rocks, besides silification, albitisation and sericitisation are observed, carbonates (ankerite, calcite) and chlorite are found. The main ore minerals are pyrite and arsenopyrite subordinate to it, forming a small (1–2 mm) impregnation in the altered sedimentary rocks. The content of these sulphides amounts on average to about 3%. In addition to these minerals, sphalerite, galena, pyrrhotite and chalcopyrite are found, gersdorffite is rare. Native gold forms the grains varying in size from 0.1 to 0.5 mm. Its fineness varies within the range 740–800‰. Electrum and kustelite are extremely rare [43,44]. The Au–arsenopyrite–polymetallic (with pyrite) mineral assemblage stands out as a productive one [43]. The temperature interval of its formation (according to the study of fluid inclusions) is estimated at 200–230 °C, the pressure is about 1 kbar. The solutions were weakly mineralised (25 g/L) and were mostly of sodium hydrocarbonate composition, which indicates their amagmatogenic (metamorphogenic–hydrothermal) origin. The sample containing pyrite and arsenopyrite in the Degdekan deposit was collected from the veinlet-impregnated ores with an Au content from 1.4 to 15.2 ppm.

3.3. The Zolotaya Rechka Deposit

The Zolotaya Rechka deposit is insufficiently explored. There are no data in the published sources. The geological description and mineralogy of the deposit are presented here on the basis of the materials of unpublished geological foundations; the material collection is supplemented with data obtained by the authors of this article. The Zolotaya Rechka deposit is located in the arch of the anticline composed of weakly metamorphosed and intensely dislocated terrigenous sediments of the upper Permian age. They are dark-grey to black, aleuropelite, carbonaceous–argillaceous shales with interbeds and lenses of sandstone and sand tuffs. This deposit, similar to Natalkinskoe, is confined to the central zone of the Tenkin deep fault but is situated somewhat to the south. By the structural and morphological characteristics, the deposit belongs to the type of veinlet-mineralised zones; by genesis, as are Natalkinskoe and Degdekan, it is classed as metamorphogenic–hydrothermal. Veinlet and disseminated sulphide mineralisation (no more than 3%) are represented by pyrite and arsenopyrite; sometimes, there are occurrences of chalcopyrite. Native gold with a fineness of 750‰–800‰, mainly fine (0.1–0.8 mm), is mostly in vein quartz and in joints with sulphide minerals. Silver in its own mineral form is very rare. It is present mainly in the form of micro-inclusions of argentite (acanthite) and native silver in arsenopyrite and pyrite. The pyrite–arsenopyrite mineral assemblage with Au stands out as productive. The sample with coexisting pyrite and arsenopyrite (ZR-10/13) was selected from veinlet-mineralised zones with Au content of 1.5–13.1 ppm.

4. Methods

4.1. Electron Probe Microanalysis (EPMA)

Pyrite and arsenopyrite crystals (in well-polished epoxy pellets) were studied by EPMA using a Superprobe JXA-8200 (JEOL Ltd., Tokyo, Japan) microprobe supplied with energy-dispersive (EDS) (JEOL Ltd., Tokyo, Japan) and wavelength-dispersive spectrometers (WDS) (JEOL Ltd., Tokyo, Japan). Analysis by EDS showed qualitatively the presence of Cu, Ag, Au and Pt traces in addition to the major elements (Fe, S and As). Quantitative analyses by WDS were conducted at an accelerating voltage of 20 kV, beam current 20 nA, probe diameter 1 µm, and a counting time of 10 s for major and 30 s for trace elements. Matrix corrections (atomic number, absorption, and fluorescence) and analysed element contents were calculated using the ZAF (atomic number, absorption, and fluorescence) approach applying the software of quantitative analysis for Superprobe JXA-8200 (V01.42 Copyright (C) 2000-2007, JEOL Ltd., Tokyo, Japan). Bulk polished samples of Au–Ag alloys (fineness 700 and 750), metal Pt and minerals of known stoichiometric composition (FeS2, FeAs1.00S0.99, CuFeS2) were used as reference samples for WDS quantitative analysis.
Pyrite crystals were studied for homogeneity in back scattered electrons (BSE) using the scanning electron microscope of a Superprobe JXA-8200 device. The pyrite crystals displayed distinct inhomogeneity. They consisted of alternating zones of more or less bright grey colour in BSE images, corresponding to slightly higher and lower average Z.
Measurements were made at 10–20 points of each grain, depending on its homogeneity. Trace elements identified by EDS were found to be below minimum detection limits (MDLs, 0.1–0.12 wt %) and only several points showed their valuable contents. These elements were not taken into account in the final stage of data processing. Only the analyses with sums within the limits of 99.5–100.5 wt % were used. The data obtained are presented in Table 2 and analysed in detail in Section 5.1.

4.2. X-Ray Diffraction (XRD)

Unit cell edges and mean coherent scattering domain sizes (crystallite sizes) of powdered pyrite and arsenopyrite crystals were measured on a D8 ADVANCE diffractometer (Bruker, Karlsruhe, Germany) using CuKα radiation. Crystallite sizes were determined by the Scherrer method using EVA software (DIFFRAC Plus Evaluation package EVA; user’s Manual, Bruker AXS, 2007, Karlsruhe, Germany). The results are presented in Table 3. Uncertainties in unit cell edges are at the level of ±1–2 × 10⁻⁵ nm, crystallite sizes ±1–2 nm. These values were verified in parallel measurements.

4.3. Atomic Absorption Spectrometry with ADSSC Data Processing (AAS-ADSSC)

The ADSSC procedure is described in detail in our recent publications [13,46]. Following this procedure, we picked up from the ore samples euhedral crystals of different sizes with clean, faultless faces. Pyrite crystals were predominantly cubes, whereas the arsenopyrite crystals used in this work were mainly of rhombic form. The crystal habit control is an important property of the ADSSC approach because the calculation of the specific surface area of an average crystal ( S ¯ s p ) in every size fraction requires information on the form coefficient k (see Equation (3) in Reference [13]). The crystal shape is approximated by a true polyhedron. Each crystal was weighed on an analytical microbalance and transferred into beakers for subsequent dissolution. We used only crystals with mass exceeding 0.1 mg.
Noble metal concentrations were determined by AAS with electrothermal element atomisation in graphite furnace (AAS-GF). The AAS measurements were performed on PerkinElmer devices (Model 503 and Analyst 800, PerkinElmer Corp., Branford, CT, USA). Gold and Ag were determined directly from the solution after acid crystal decomposition in aqua regia and creation of the required chemical medium. Measurements were accurate to ±12 and ±10% with MDLs of 0.3 µg/L (0.3 ppb) and 0.5 µg/L (0.5 ppb) for Au and Ag, respectively. Platinum, Pd and Ru were determined after preliminary extraction by concentration and separation from the matrix [13]. Tristyrylphosphine (C6H5CH–CH)3P was used as extracting agent. The organic phase was used to measure element concentrations. Measurements were accurate to ±10% with MDLs of 5 µg/L (5 ppb) for Pd and 50 µg/L (50 ppb) for Pt and Ru.
The data obtained were processed statistically according to the regulations of the distribution of different NM binding forms [13,46]. We divided the dataset (usually 40–60 crystals with evenly distributed NMs) into the intervals of crystal masses (sizes), chosen to be as narrow as possible although statistically representative, and determined average crystal mass in every size fraction ( m ¯ ), average size ( r ¯ ), specific surface area ( S ¯ s p ) and NM concentration ( C ¯ N M ) (see Table S1 in the Supplementary Materials). The more size fractions and number of crystals in the final samples, the more reliable the results obtained, unless at the expense of selection quality. When constructing the dependences C ¯ N M = f ( S ¯ s p ) , we usually obtained a number of points best approximated with an exponent (Figures 5–9). The extrapolation of these curves to a zero-specific surface, i.e., to a virtual infinite crystal, gave the bulk NM content. In our model, this was equal to structurally bound NM content ( C s t r ), because all other possible bulk modes were eliminated at the stage of initial dataset processing. The superficially bound NM content ( C s u r ) characterises an average crystal among all size samples, that is, the surface-related excess concentration of the element, and can be calculated with the equation given in Reference [13]. It is important to note that in that formula, the amount of the material is hereby normalised to the whole crystal, and this allows comparison of the contribution of each binding form of the element to its total concentration. The results of C s t r and C ¯ s u r determination and corresponding NM distribution coefficients between coexisting pyrite and arsenopyrite are shown in Table 4 and are considered in detail throughout the present article.

4.4. Laser Ablation Inductively Coupled Plasma Mass Spectrometry (LA-ICP-MS)

For this type of analysis, we took the same polished crystals in epoxy pellets used for the EPMA study. Measurements were performed on an Agilent 7500ce unit manufactured by Agilent Technologies with quadrupole mass analyser (Agilent Tech., Santa Clara, CA, USA) in the Center of Collective Use “Ul’tramikroanaliz” of the Limnological Institute, SB RAS (Irkutsk, Russia). The laser ablation platform of a New Wave Research UP-213 was used. Parameters of the LA-ICP-MS experiment: plasma power 1400 W, carrier gas flow rate 1 L/min, plasma forming gas flow rate 15 L/min, cooling gas 1 L/min, laser energy 0.63 mJ, frequency 20 Hz, and laser spot diameter 55 μm. Accumulation time per channel was 0.3 s and acquisition time 25 s. Measurements were made at 15 points in several (3–5) grains of each sample. Calculations of concentrations were based on the standard sample NIST 612 conformed for a number of elements with the in-house sulphide standard sample—highly homogeneous ferrous greenockite (α-CdS) crystals with many incorporated elements synthesised hydrothermally at 500 °C and 1 kbar and carefully analysed by different methods. Standard deviations are consistent with counting statistic uncertainties at around 30%. Error analysis is rated as 30%. The data obtained were processed in the manner of the ADSSC approach [38,46] to evaluate evenly distributed element concentrations identified with structurally bound impurities. The results are presented in Table 5 and Table 6 for pyrite and arsenopyrite, respectively. They are considered in detail in Section 5.4 and Section 6.5.

5. Results

5.1. EPMA

The data obtained are presented in Table 2. The pyrite crystals demonstrated regions enriched with As (As–Py) and areas not containing As at the level of EPMA sensitivity, which herewith will be referred to as conventionally “pure” pyrite (Py). These areas stand out as darker sectors in the BSE images (Figure 3), but there were also cases when differences between Py and As–Py were established only by quantitative analysis. As a rule, areas of Py predominance are characterised by higher porosity (Figure 3).
In the mono-mineral grains of arsenopyrite of the Nat-10 sample from the Natalkinskoe deposit, the As/S ratio equalled 1.14 ± 0.01 (Table 2).
In the poly-mineral grains consisting of arsenopyrite, pyrite and As–pyrite (Asp + Py + As − Py), it was slightly higher (1.16 ± 0.02); coexisting with arsenopyrite, As–pyrite and “pure” pyrite are practically stoichiometric: Fe/(S + As) and Fe/S were 0.499 ± 0.001 and 0.496 ± 0.004 respectively. Arsenic content in As–pyrite was 0.60 ± 0.2 at.%. For arsenopyrite of the UV-3/13 sample from the south-eastern section of the Natalkinskoe deposit, As/S ratio indicated a greater deviation from stoichiometry (1.20 ± 0.02). This is most likely to indicate lower S activity during its formation, since the As content in the As–Py coexisting with arsenopyrite was practically the same as in the Nat-10 sample, equal to 0.53 ± 0.2 at. %, and Fe content in As–Py increased from 0.998 to 1.018 atoms per formula unit or from 33.28 to 33.93 at. % Fe. Consequently, As–pyrite associated with Asp is characterised by a higher ratio of Fe/(S + As) − 0.513 ± 0.001. “Pure” pyrite was not identified in this sample. The sample from the Zolotaya Rechka deposit, ZR-10/13, was similar to UV-3/13—it did not contain polyphase grains containing Asp either—and As–Py and “pure” Py were iron-redundant (0.513 ± 0.001 and 0.515 ± 0.001, respectively); As content in As–Py was 0.57 ± 0.3 at. %. This sample differed from the one mentioned above only by a more stoichiometric composition of arsenopyrite, i.e., the ratio As/S being closer to unity, at 1.14 ± 0.02. The minerals of the DG-10/14 sample of the Degdekan deposit were closest to stoichiometry: As/S in Asp was 1.08 ± 0.01, Fe/(S + As) in As–Py 0.496 ± 0.004, and Fe/S in Py 0.501. Arsenic content in As–Py was at the same level as in all studied samples at 0.47 ± 0.3 at. %. The above uncertainties were calculated for 1σ with a confidence probability of 90% for small samples and 95% for more representative datasets (arsenopyrites Nat-10, DG-10/14, Table 2).
Thus, according to the EPMA, there were two types of As–pyrite as well as “pure” (no As) pyrite: stoichiometric pyrite with an Fe/(S + As) ratio approximately 0.5 and metal-surplus pyrite with a ratio of 0.513–0.515. It is interesting to note that coexisting minerals obeyed the principle of phase composition correlation: if As–Py was iron-excessive, “pure” pyrite was also non-stoichiometric; for their part, the stoichiometric As–Py coexisted with stoichiometric “pure” pyrite. Besides, the As distribution coefficient between arsenopyrite and As–pyrite ( D A s A s p / P y ) was relatively constant and, on average, amounted to 66 ± 7 (in atomic concentration units) for the four associations studied.
Figure 4 exhibits two types of S-As dependence in pyrites of different samples. Negative correlation of formula units S and As (Figure 4) indicates a predominantly isomorphic substitution of S for As in the structure of As–pyrite. The dependence S (As) was approximated by a straight line: S = akAs. For stoichiometric pyrite of the Natalkinskoe and Degdekan deposits k = 1.21 and the line crossed the x-axis at a = 2.006. In the case of non-stoichiometric, S-deficient pyrite of the Zolotaya Rechka and the south-eastern sector of the Natalkinskoe deposit, the line crossed the x-axis at 1.98, which does not correspond to the stoichiometry of “pure” pyrite (Figure 4). The reason for this discrepancy is not quite clear. However, our preliminary X-ray photoelectron spectroscopic data (unpublished) show that ~10–15% of As can be incorporated in pyrite as As(II) (see also Reference [47]), and this corresponds to a “stoichiometric trend” with k = 1.21. The “nonstoichiometric trend” corresponded to As1– only and was realized under lower sulphur fugacity. It might be that in the first case (DG-10/14, Nat-10), the formation of arsenic and “pure” pyrite occurred under the same conditions, whereas, in the second (ZR-10/13, UV-3/13), their formation occurred not only at lower sulphur fugacity in the system than in the first case but also at levels different from those for “pure” and “As–pyrite”. It is interesting to note that different conditions and corresponding S–As trends are the characteristics of the sections of one and the same deposit (Natalkinskoe, samples Nat-10 and UV-3/13).

5.2. XRD

Table 3 presents X-ray data on the unit cell edges of arsenopyrite and pyrite and the average crystallite sizes or block sizes of the real mosaic structure of crystals of these minerals. The unit cell parameters differ only in the third (a, c) and fourth (b) decimal places for arsenopyrite (±0.0018 and ±0.0008 nm, respectively) and in the fourth decimal place for pyrite (±0.0004 nm). The average sizes of the crystallites, in contrast, differ less in arsenopyrite (within 9 nm) compared to pyrite (within 16 nm).

5.3. AAS-ADSSC

The AAS data of the analysis of individual crystals processed using the ADSSC method are presented in Table S1 in the Supplementary Materials and shown graphically in Figure 5, Figure 6, Figure 7, Figure 8 and Figure 9 in the form of dependences of the average uniformly distributed NM concentration (Au, Pd, Pt, Ru and Ag) on the specific surface of the average crystal in the size sample. In each case, the analytical form of this dependence was demonstrated: the concentration of structurally bound NM admixture was obtained as an extrapolation of the dependence on the zero-specific surface area, i.e., on a conditionally infinite crystal, and the superficially bound mode was calculated as shown above (Section 4.3, see also Reference [13]). These data, as well as NM distribution coefficients of both forms (i.e., structural and superficial), are presented in Table 4, which also shows the average compositions of Asp and As–Py for the key elements (Fe, As and S).
The vast majority of dependencies for all NMs (87%) were characterised by determination coefficients R2 ≥ 0.9 (Figure 5, Figure 6, Figure 7, Figure 8 and Figure 9). Less reliable are the data for Ag in Py (Figure 9): two of the four samples showed R2 ≤ 0.7. This may be due to the instability of the Ag solid solution in pyrite and its decomposition in the post-crystallisation period [14]. In contrast to Py, the dependencies for Ag in Asp were distinct (R2 ≥ 0.95) and may indicate its isomorphic incorporation into arsenopyrite at least up to 120 ppm Ag. However, in most cases (except the Nat-10 sample) the structural form of Ag was fractionated into pyrite: D A g s t r = 17 ± 3.
It should be noted that the ADSSC method failed to separate structural and surficial forms for Au in the ZR-10/13 sample, as its content size dependence was weakly determined (Table S1). For the other three samples, the Au distribution coefficients between Py and Asp were 2.7 ± 2.4 and 1.6 ± 1.0 for structural and superficial forms, respectively, i.e., both forms were distributed in favour of pyrite, although they were slightly fractionated. Here and henceforth, confidence intervals are defined for 1σ at α = 0.9. Perhaps D A u s t r was lower for ZR-10/13 (0.5), but this sample contained very high levels of Ag, which could affect Au distribution. The behaviour of Pd in the arsenopyrite–pyrite system was similar to that of Au. Palladium by the level of content in pyrite and arsenopyrite was close to Au and fractionated into pyrite: D P d s t r = 2.5 ± 2.4. Palladium was concentrated in the surface layer much more than Au: C P d s u r   = 4.9–30 ppm in Py (compared with C A u s u r = 1.1–2.7 ppm), and the distribution coefficient between Py and Asp of its surficial form was close to unity (1.1 ± 1.0). Other platinoids have noticeably higher contents in both minerals, mainly due to the superficial forms which, in most cases, are an order of magnitude and higher than the concentration in structural forms. For Pt with structural form contents of 3.6–37 ppm in Py and 4.2–37 ppm in Asp, the Py/Asp distribution coefficient averaged 1.6 ± 1.4; for Ru with structural form contents of 4.9–25 and 3.9–19 ppm in Py and Asp, respectively, D R u s t r = 1.7 ± 1.5. That is, in both cases, as for the previously considered Au and Pd, there was a weak tendency towards NM fractionation in pyrite. This conclusion extends to superficial forms as well: the distribution coefficients D s u r of Pt and Ru were on average the same and equal to 1.5 ± 1.4.

5.4. LA-ICP-MS

The results are presented in Table 5 and Table 6 for pyrite and arsenopyrite, respectively. It should be remembered that, according to the ADSSC method, the results that meet the distribution criteria adopted for the structurally bound form of the element are distinguished from the entire dataset for each sample (usually at least 20 points of analysis) by applying the procedure discussed in detail earlier [38,39,46]. Since grain sections were analysed, that is, only the inner regions of crystals, there is no question of the separation of structural and superficial forms. The AAS-ADSSC and LA-ICP-MS data on the Au structural forms can be compared for the Nat-10 sample (Table 4, Table 5 and Table 6): in Asp, 1.2 and 1.6 and in Py 1.8 and 1.2 ppm, respectively, i.e., the convergence of the 25 rel. % and 33 rel. %. For the sample Asp ZR-10/13, the relevant contents of Austr were 13.7 and 8.9 ppm (∆ = 35 rel. %). This confirms the conclusion that the AAS-ADSSC method enables determination of the structural component of NM impurity with an error of ±30% [13,39]. For the UV-3/13 and DG-10/14 samples, the differences proved more significant, apparently due to the proximity to the Au detection limit (0.2 ppm) in the configuration of the LA-ICP-MS method used.
According to Table 5 and Table 6, the main impurities in pyrite were Ni, Cu, Pb and Sb and in arsenopyrite Co, Ni, Cu, Pb, Sb and Se. We consider further the sum of the contents of these elements for each of the minerals and call it the Sum of Main Impurities (SMI); these values are given in the footnotes of Table 5 and Table 6. It is notable that the samples of both Zolotaya Rechka minerals with the highest Ag grade contained the lowest amounts of other impurities.

6. Discussion

The results obtained allow us to consider the effect of various factors on the binding forms and ratios of NMs in the coexisting pyrite and arsenopyrite.

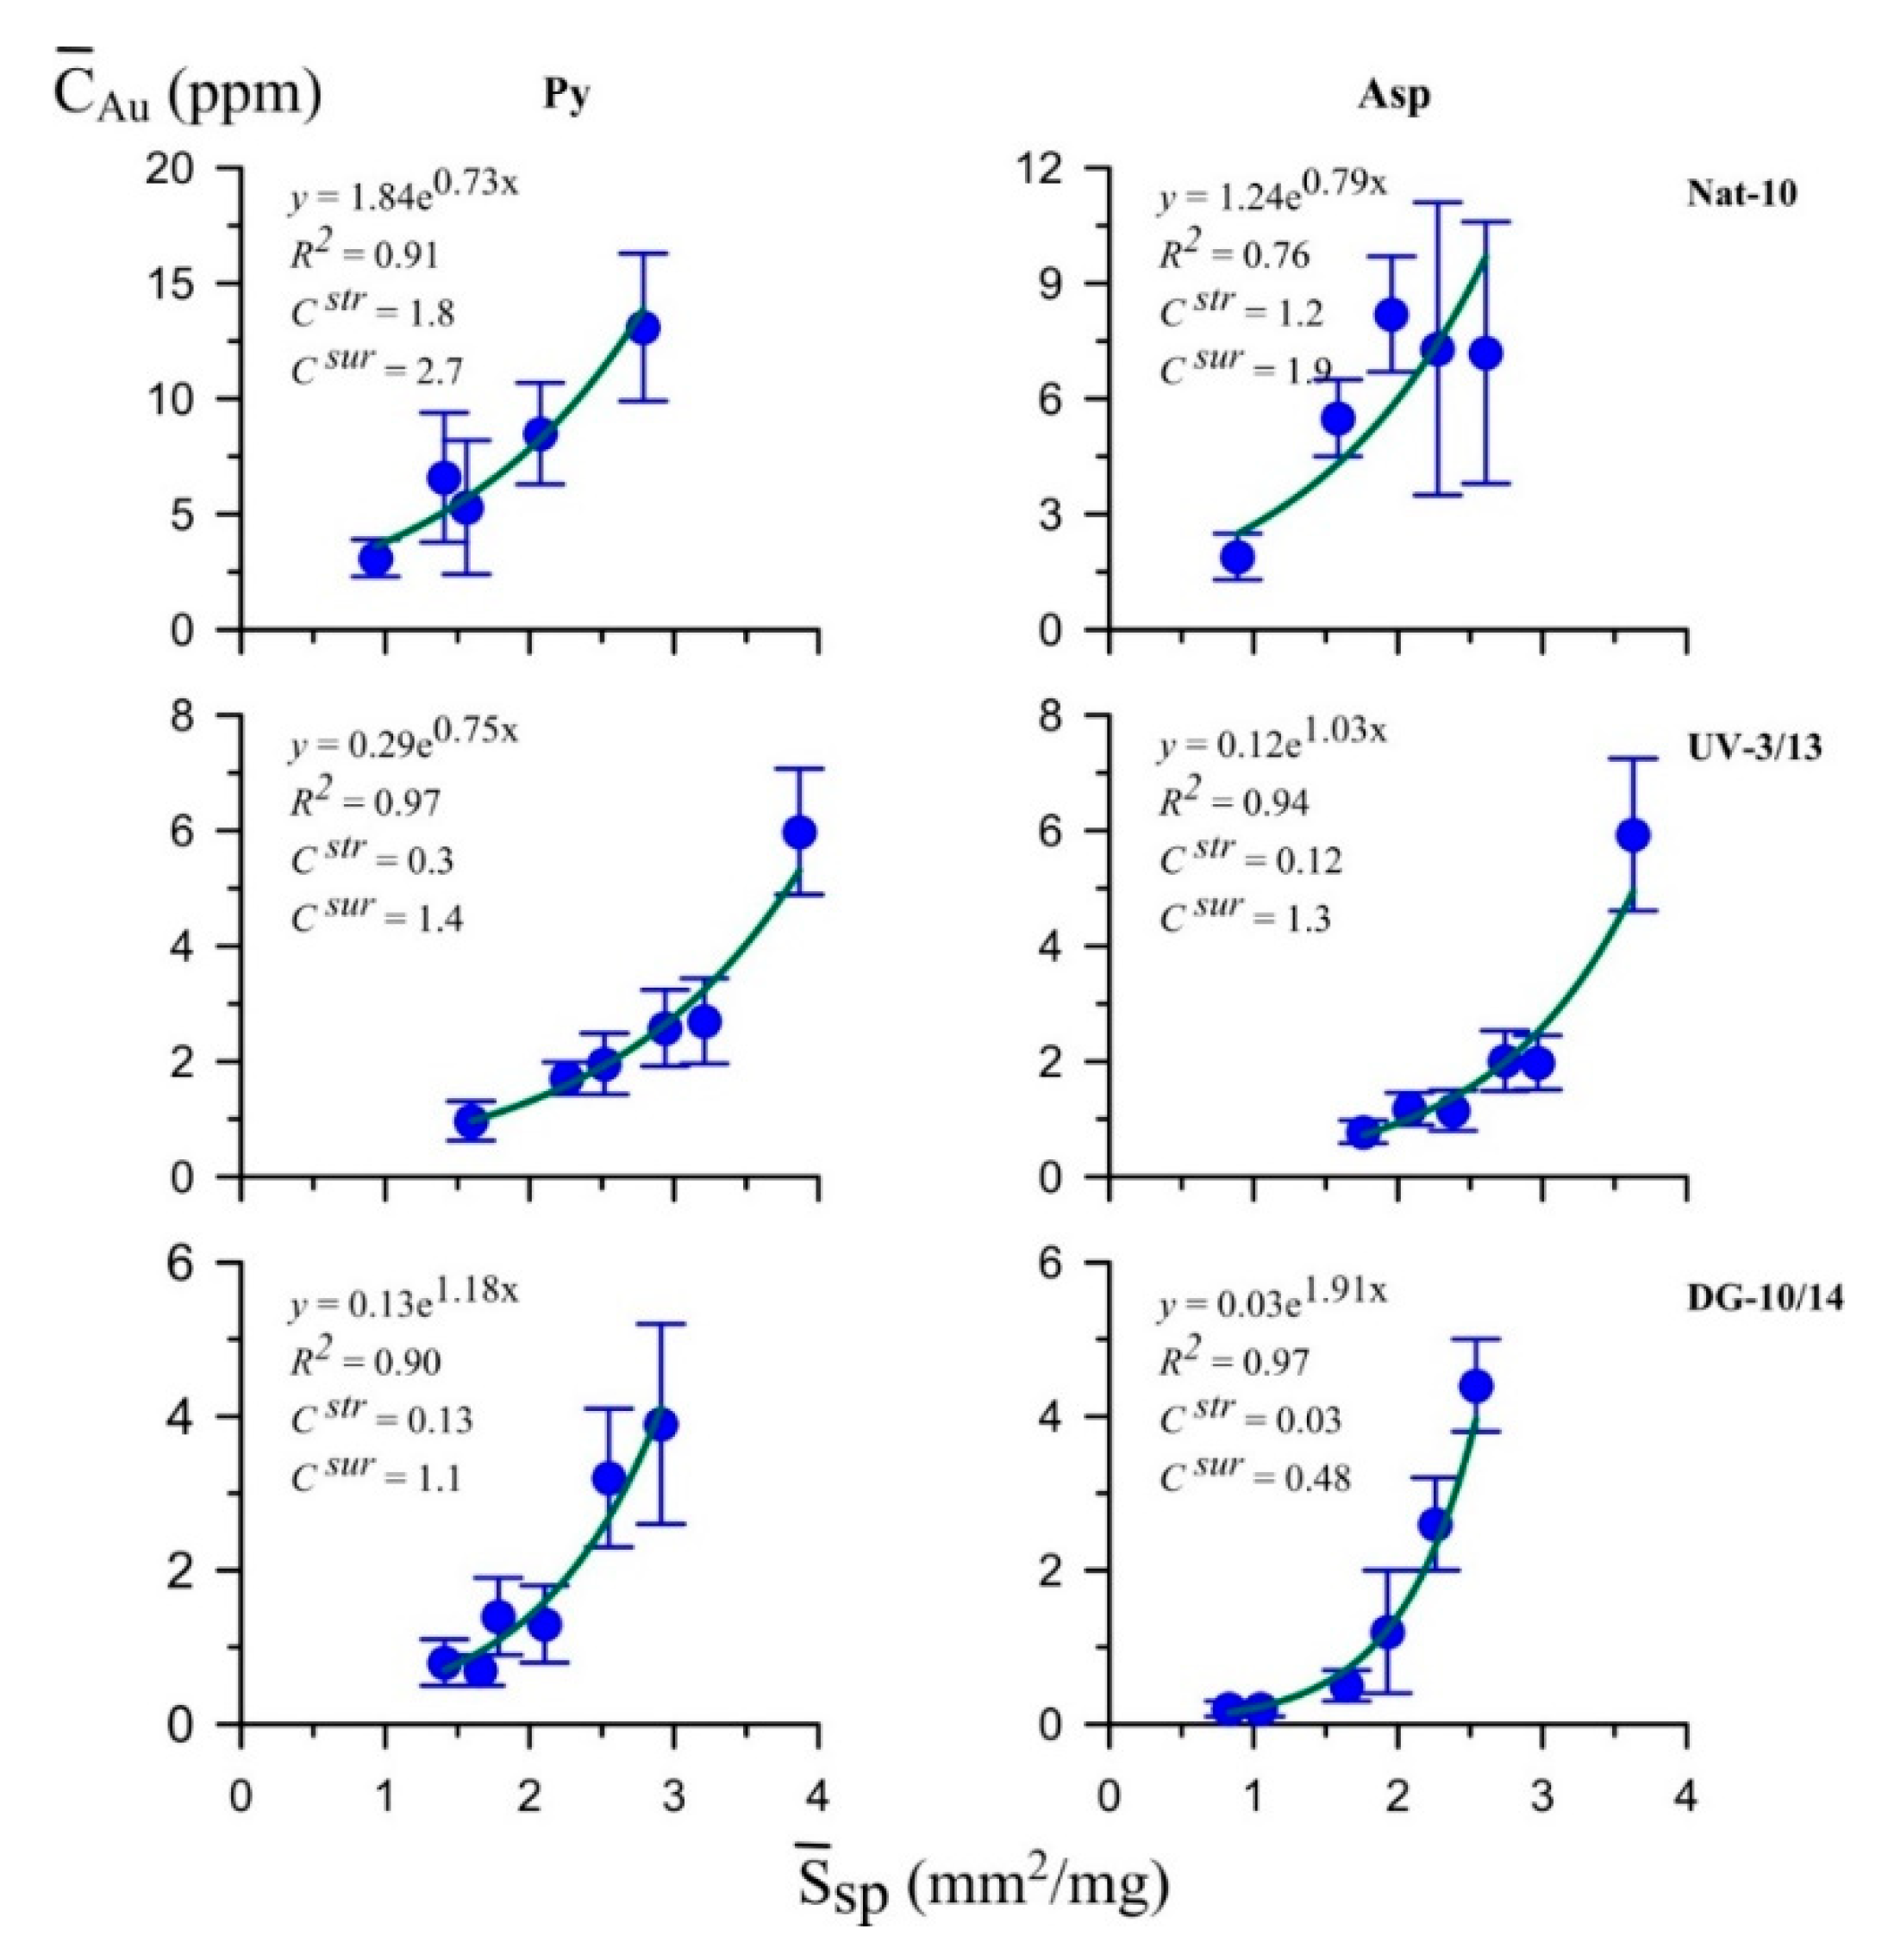
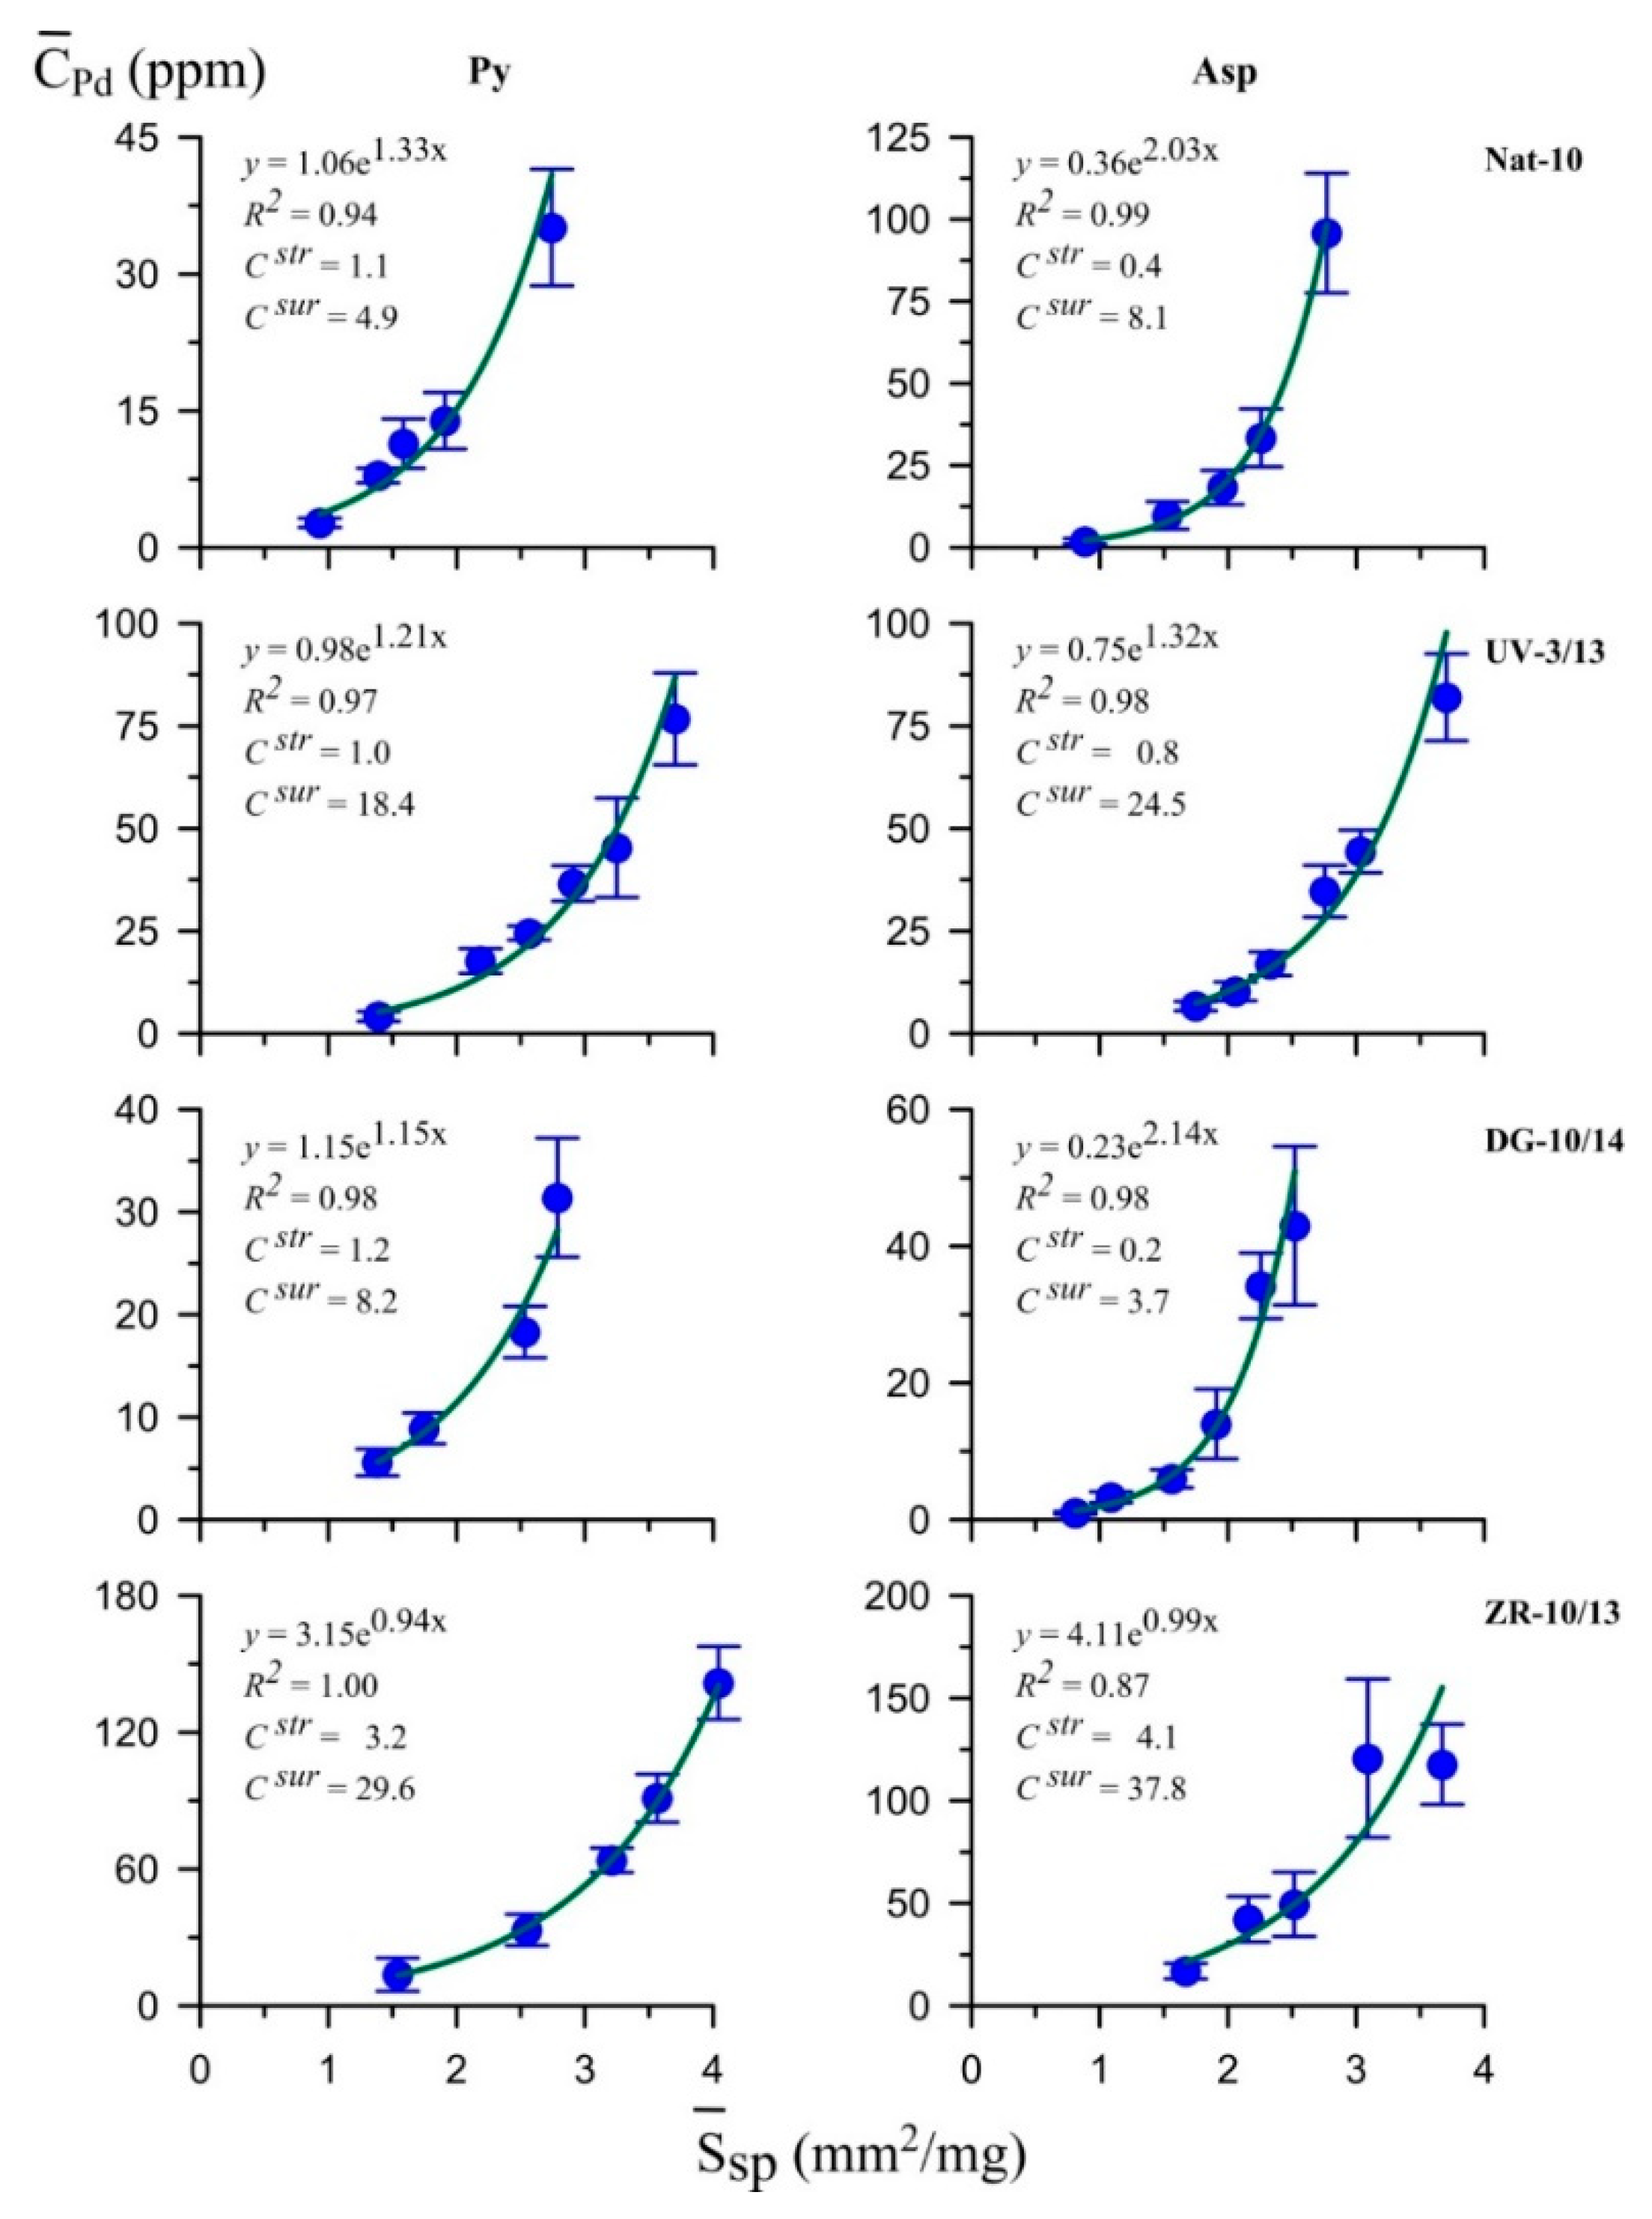
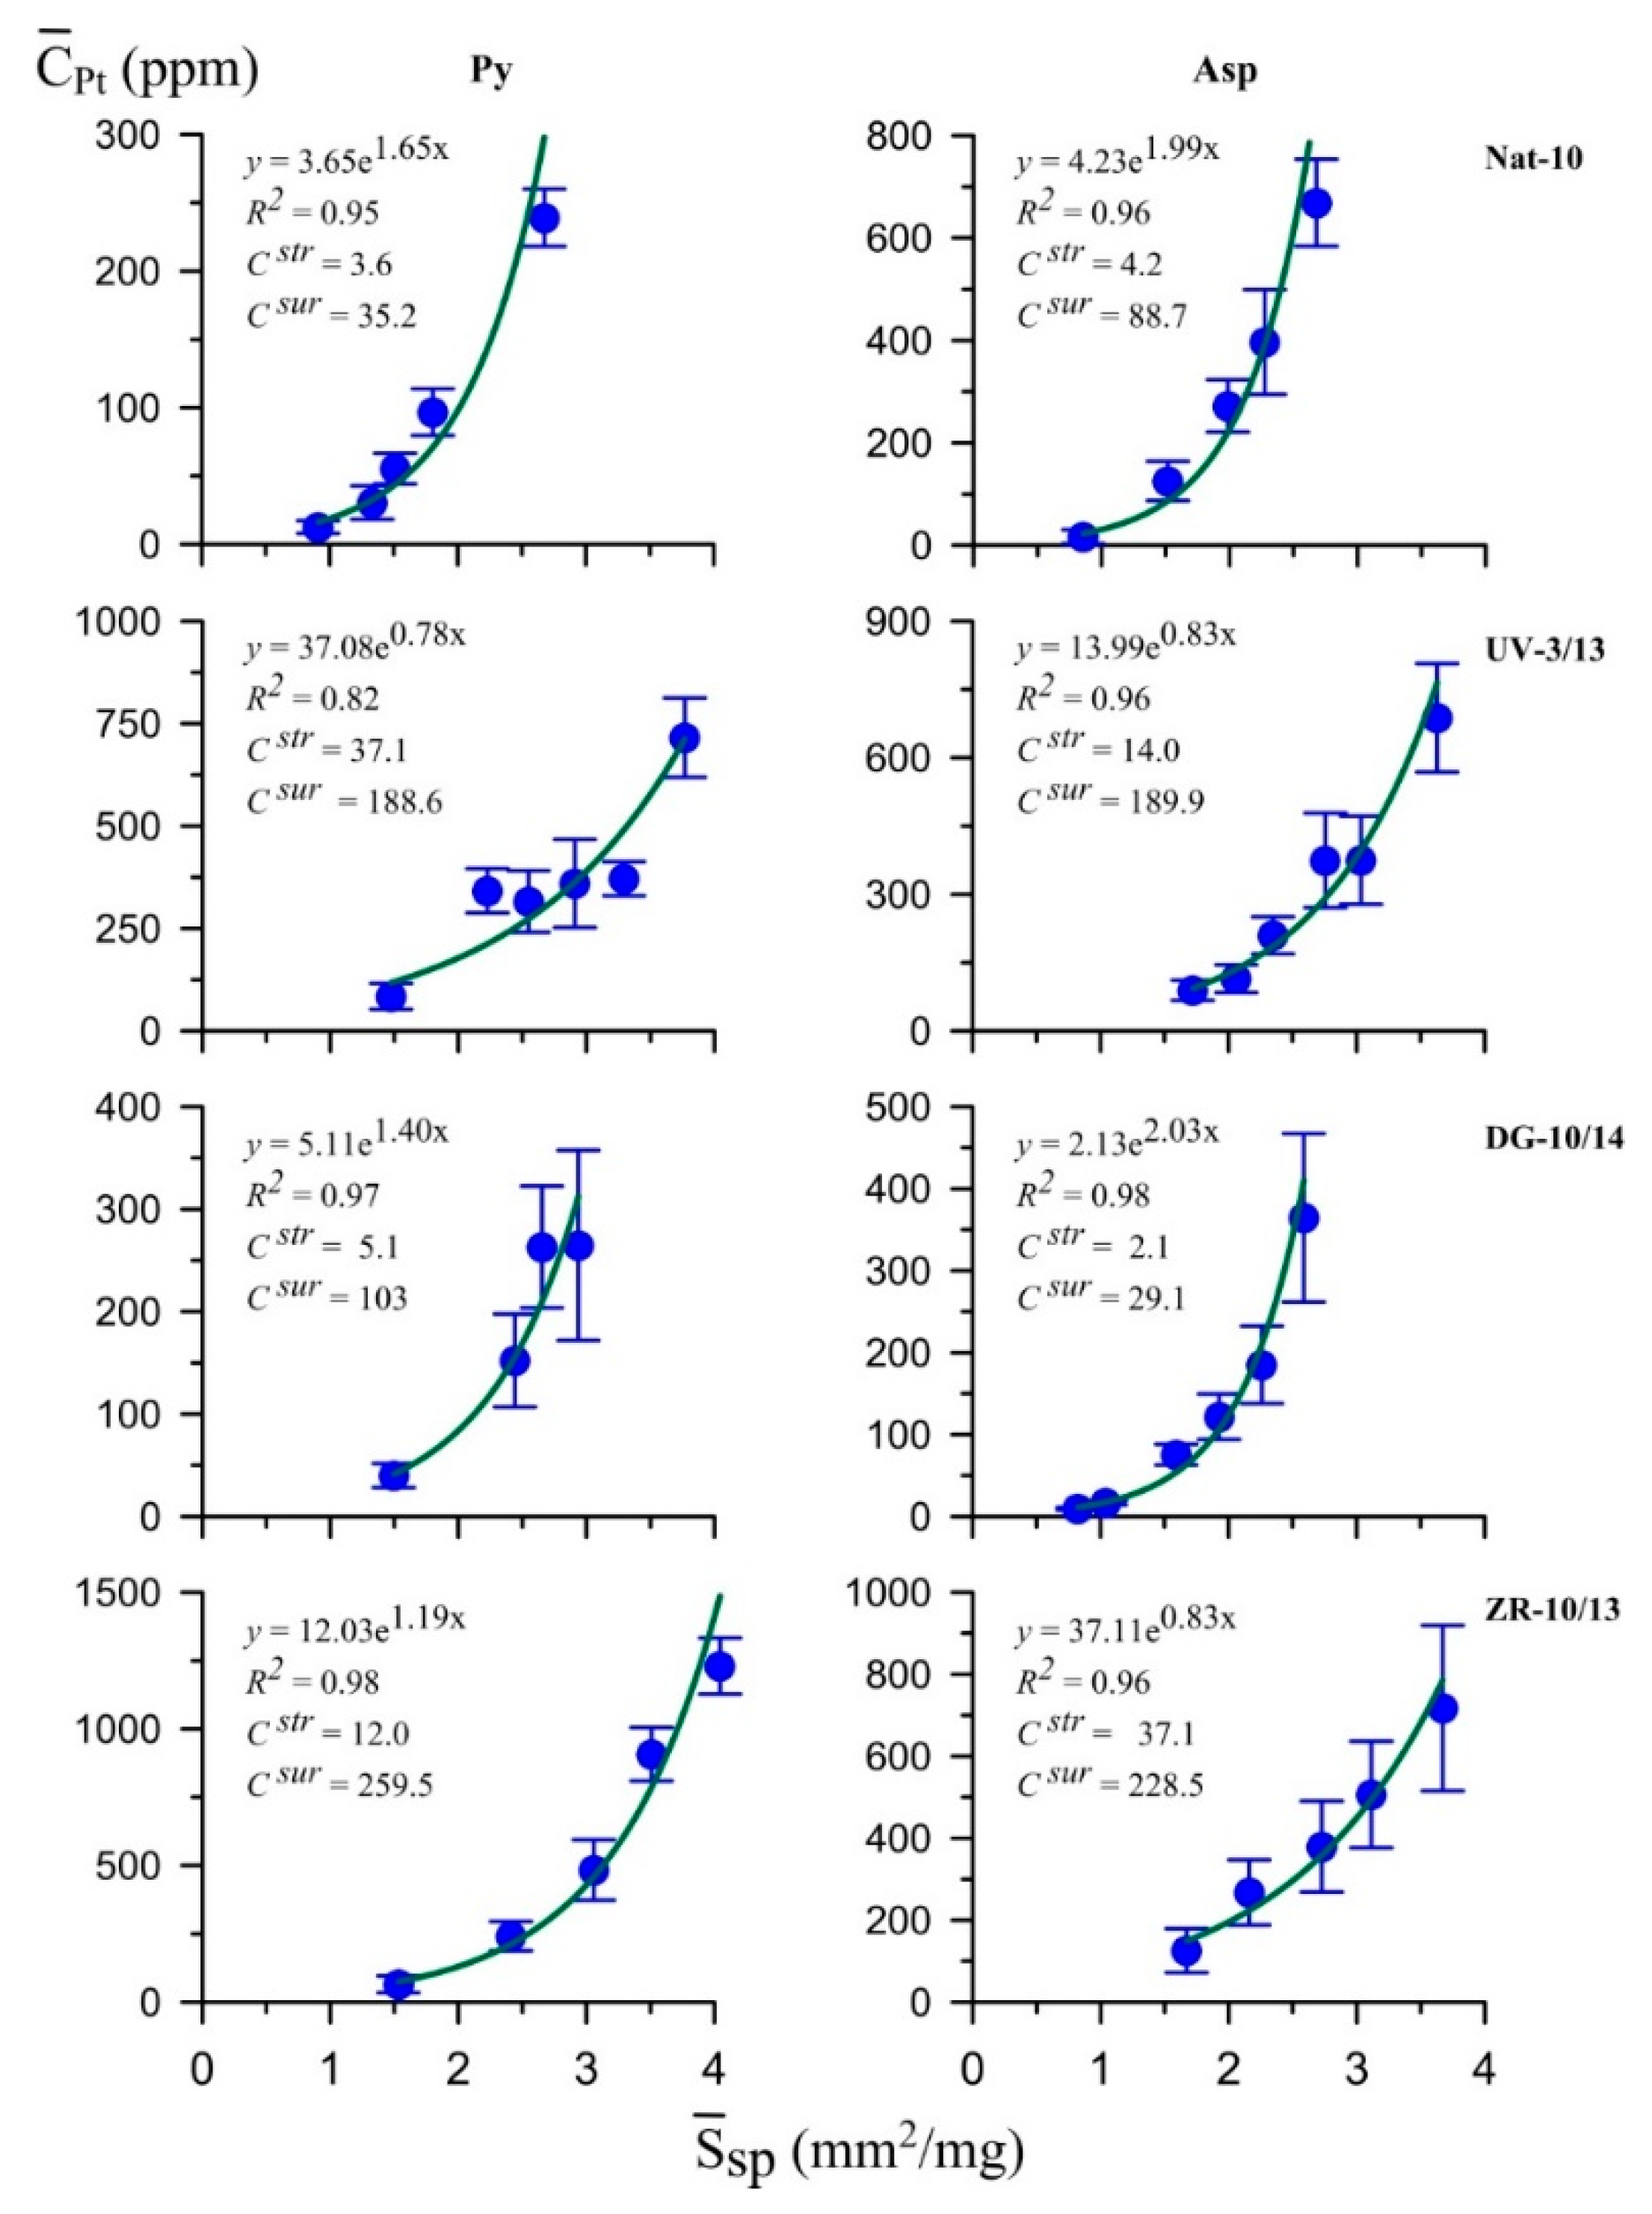
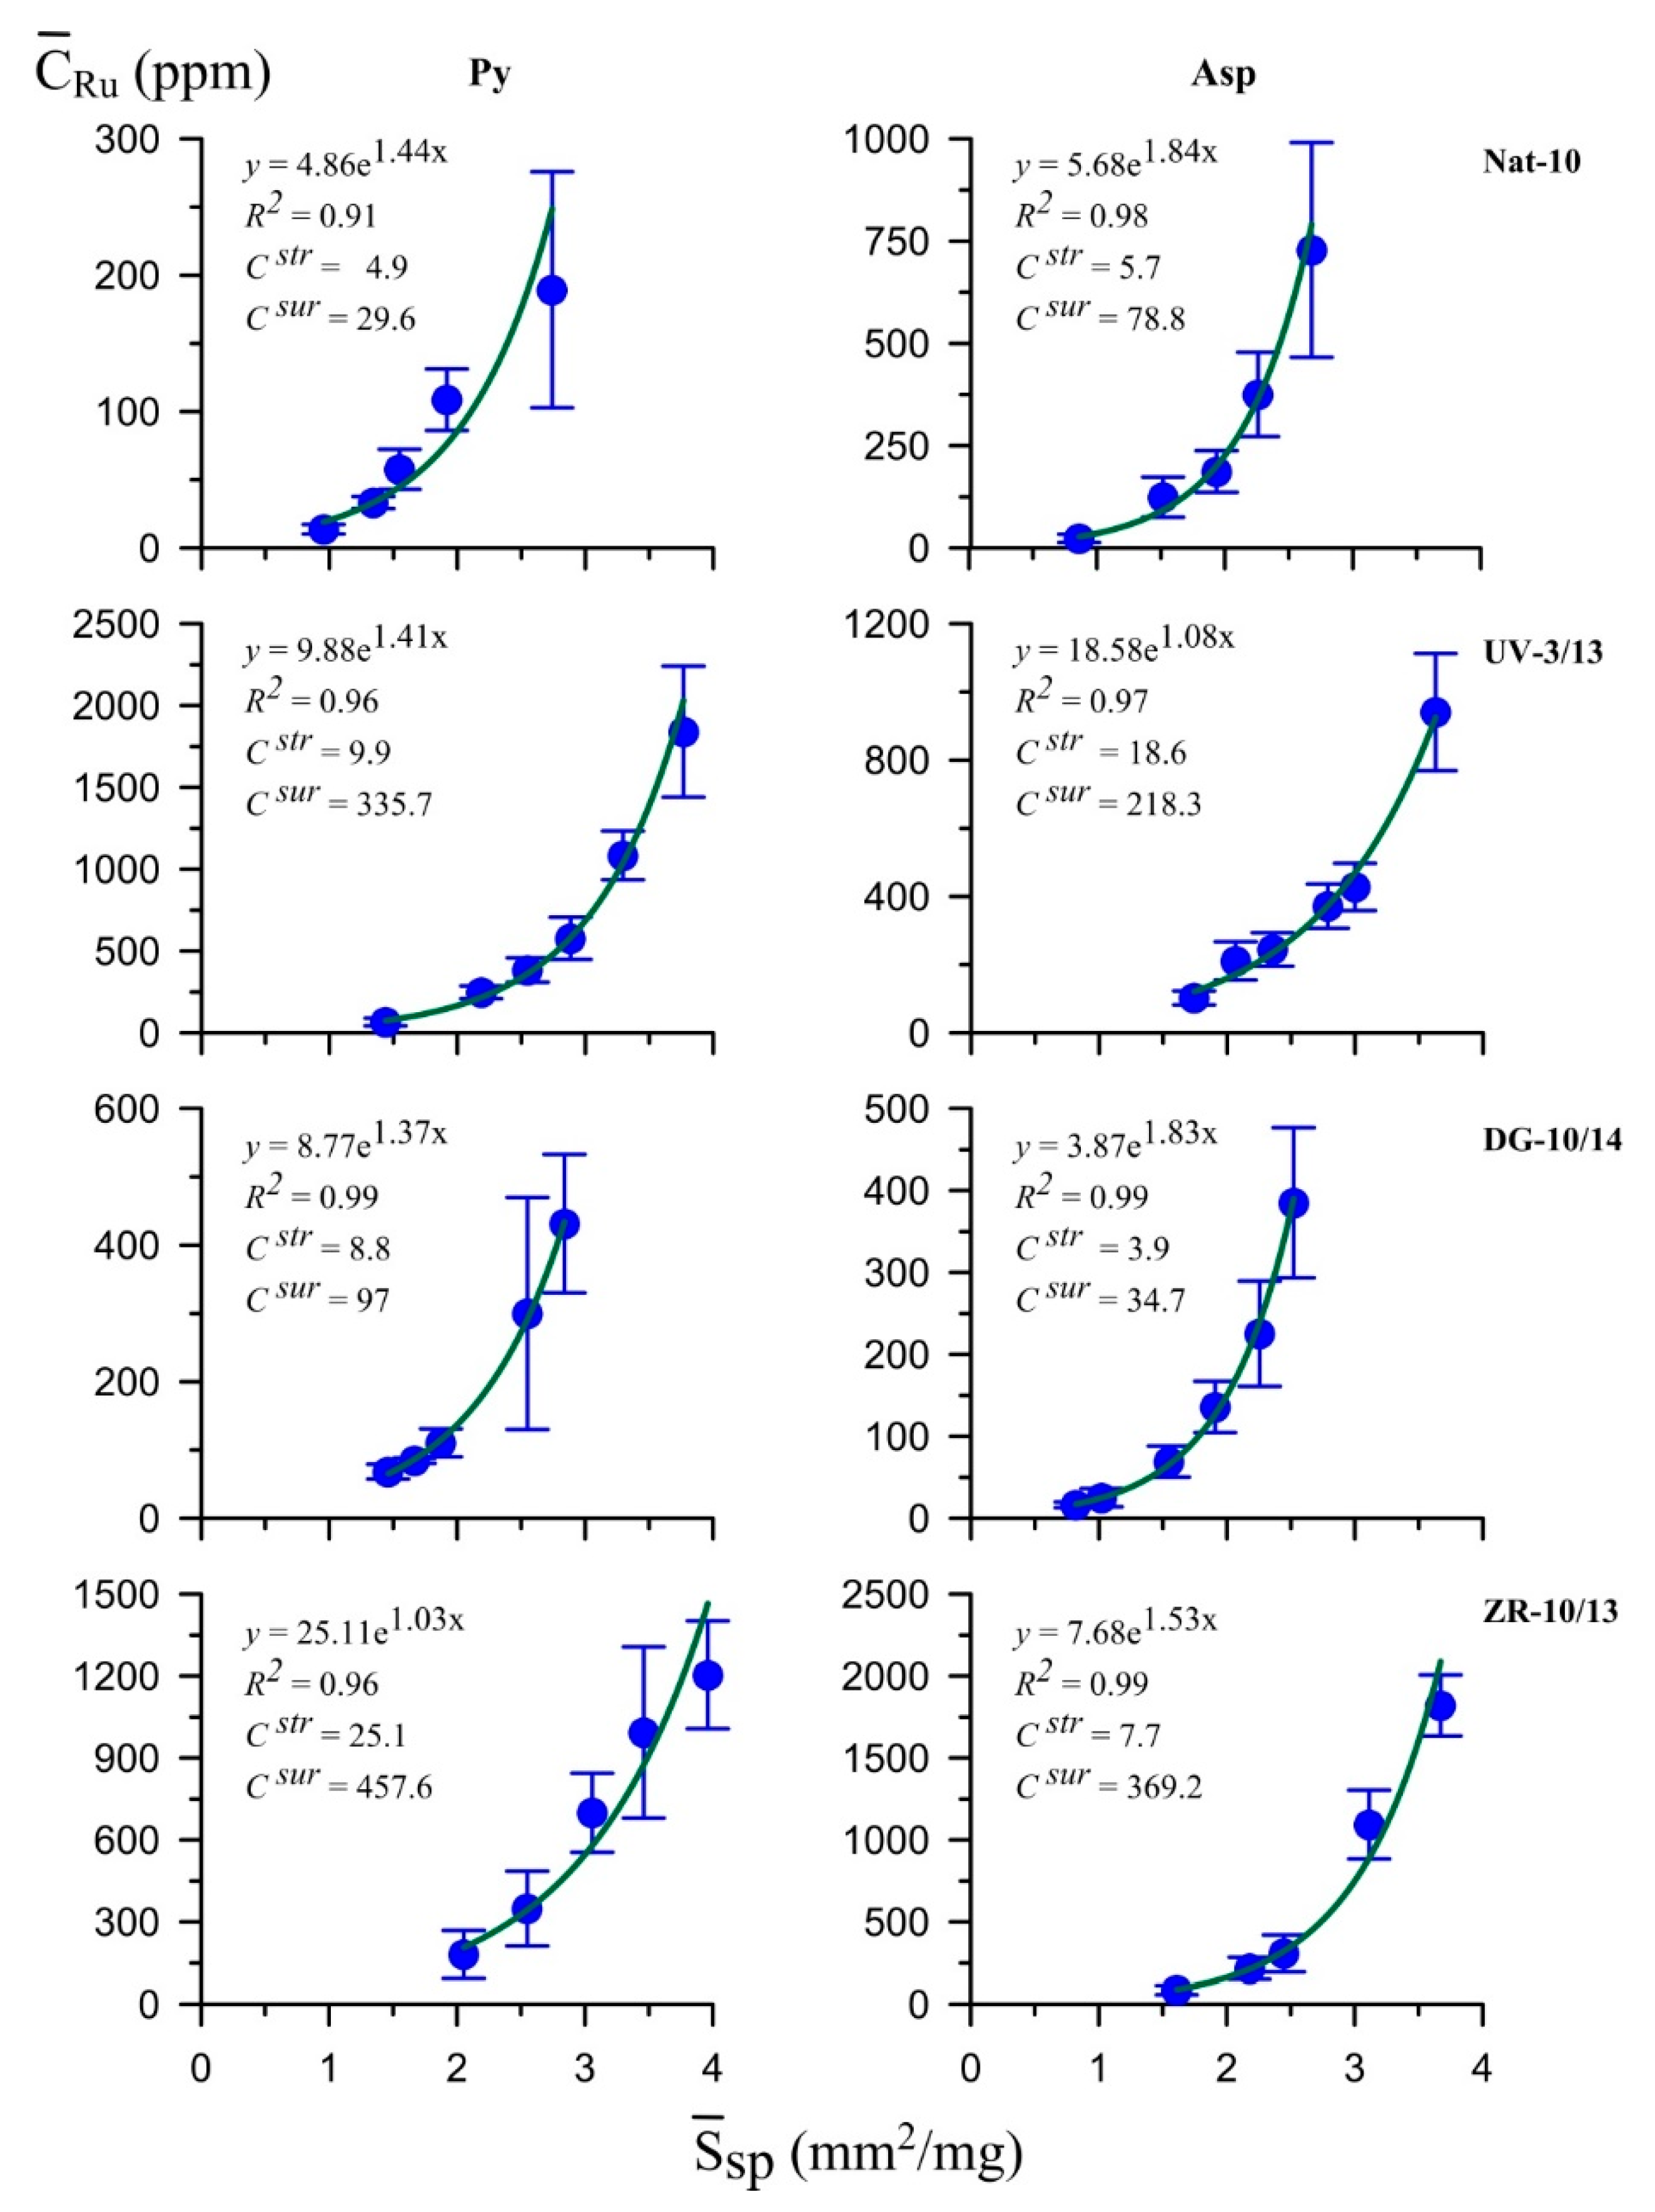
6.1. Surficial NM Accumulation

Figure 5, Figure 6, Figure 7, Figure 8 and Figure 9 show all the NM accumulation in the surface, with the surficial forms, as a rule, exceeding by an order of magnitude the content of the element in the structurally bound forms. For Asp, in most cases, there were steeper dependences of NM content on the specific surface area than was the case for Py, except for Pt and Ag in ZR-10/13, Ru in UV-3/13 and Ag in Nat-10. This indicates somewhat greater activity of the Asp surface in the uptake of NMs. The same shape of the graphs confirms the universality of the surface enrichment factor, which is supported by the high coefficients of determination of these dependences in the vast majority of cases.
We believe that the reason for this effect is the presence of surface nanoscale formations on the surface of mineral crystals during their growth, for which, as experiments have shown [13,48,49], the distribution coefficients of elements are much higher than for the volume of the crystal. These formations are called surface non-autonomous phases (NAPs) and can be considered as primary NM concentrators [13]. The phenomenon of “latent” metal content, which was mentioned in the Introduction, is to some extent due to the presence of metals in the NAPs or in surface nano- and micro-inclusions formed as a result of their evolution. Non-autonomous phases are considered as substances regulating single-crystal growth and distribution of elements in complex multicomponent natural and experimental systems [48,49].
It should be noted that the effect of surface enrichment is often not obvious when considered in relation to the distribution of elements among coexisting minerals. The reason for this is easy to understand by referring to the data in Table 4. We see that D s u r in some cases differs little from D s t r , although C s u r exceeds C s t r . However, the excess is approximately the same for both minerals. Thus, an illusion of constancy in the distribution coefficient is created which can easily disappear with the change in the composition of the NAP, its thickness or degree of surface coverage. As can be seen from Table 4, D s u r Py/Asp in some cases turns out slightly lower than D s t r , and since C s u r > C s t r , this will result in some decrease in the total D P y / A s p . This factor, associated with a slightly higher activity of the Asp surface with respect to NMs, which is revealed when considering the graphs in Figure 5, Figure 6, Figure 7, Figure 8 and Figure 9, should be taken into account (especially for small crystals). However, in general, its effect on the total distribution coefficients of invisible NM forms between pyrite and arsenopyrite is small.

6.2. Arsenic in Pyrite: Assistance in NM Incorporation

The geochemical relation of invisible Au to As in pyrite is now generally recognised and is established at different levels of ore systems organisation—from individual crystals and micro-sized zones therein to deposits and ore provinces [7,47,50,51,52]. However, the nature of this relationship remains unclear as confirmed by Section 2 of this paper (Table 1). In the pyrite samples analysed, As content on average does not change much (Table 4); therefore, no direct relationships between As and NM were detected. At the same time, the state of As in pyrite may indicate indirectly the mechanism and conditions of mineral formation that lead to its enrichment with NMs. Thus, the data in Figure 4 indicate the replacement of S with As in the dumbbell anions of the pyrite structure which is typical of the reduction conditions of mineralisation in carbonaceous rocks. The content of As structural forms is 0.9–1.1 wt %. Substitution of Fe2+ in pyrite for As2+ or As3+ is typical of oxidative hydrothermal and diagenetic conditions, including high-sulfidation epithermal deposits and shallow groundwater systems [47].
It is known from experimental studies that the solubility of As in pyrite, even at high temperatures, is limited to tenths of a percent. Clark ([53], p. 1363) shows that there is “evidence that very little arsenic is soluble in pyrite” in the range 300–700 °C. At 600 °C, pyrite solid solution may contain less than 0.53 wt % As. The hypothesis of As retrograde solubility in pyrite [7] has no ground in experiment; therefore, the formation of high-As pyrites containing more than 5 wt. % As at relatively low temperatures [7,54] remains a mineralogical mystery. However, mixed crystals (Fe, As)S2 do form at low temperatures under conditions simulating deposition of authigenic pyrite in subsurface sediments [55]. Nanosized pyrite particles were synthesised at 25 and 110 °C in the presence of As(III) in solution. Research by X-ray absorption spectroscopy fine structure and modelling within density functional theory led to the establishment of the mixed nature of the As–pyrite formed, in which As, in the form of As2+ and/or As3+, occupies octahedral positions Fe2+ (53–71%), and in the form of As-tetrahedral positions S (19–47%) [55].
The supersaturated solid solutions, which are metastable in the bulk phases, often become stable in small particles due to the crystallite size effect which is the dependence of phase relationships (partially, phase boundary position) upon the crystallite size [56]. This effect was studied in detail in the FeS2–CoS2 system. The solubility of CoS2 in the pyrite phase was shown to be 4–10 times higher for small particles (~0.1–0.2 µm) as compared to more coarse ones (1–2 µm) in the temperature interval 620–680 °C [57]. Such a mechanism can explain the formation of As-rich pyrite in small particles. Thermodynamic calculation of the change of limits of miscibility in the FeS2–FeAs2 system requires knowledge of the equilibrium boundaries of solid solutions in the phase diagram of the bulk phases or the dependence of miscibility limits on particle size. The mean coherent domain size along (001) for mixed crystals with 0.5 at. % As was 23 nm at 25 °C and 40 nm at 110 °C and for the composition with 1.0 at.% As, 15 and 22 nm, respectively [55]. Thus, with a decrease in crystallite size, As incorporation in pyrite increases, which is characteristic of the crystallite (phase) size effect in isomorphic mixtures [56,57]. Although a more detailed analysis is beyond the scope of the present paper, the above phenomenon may be relevant to the interpretation of our results (see the next section).

6.3. Crystallite Sizes

The influence of crystallite size on trace element uptake can be manifested not only in the form of a phase size effect, but also in the form of intracrystalline adsorption of these elements at the interblock boundaries of a dislocation nature. Figure 10 and Figure 11 show the change in NM content in structural and surficial forms depending on the average size of crystallites in pyrite and arsenopyrite samples, respectively.
Figure 12 shows the same data for Ag in pyrite. Most elements tend to increase their content with a decrease in the size of crystallites.
For structural impurities, this trend is most pronounced for Pt, Ru and Ag (Figure 10a, Figure 11a and Figure 12). It is interesting to note that this dependence is even more clearly manifested for these elements (and Pd) in the case of the surface-bound form of NMs (Figure 10b, Figure 11b and Figure 12). The reason for this phenomenon is not quite clear because the block size parameter refers to the entire crystal and not to its surface. It can be assumed that with a certain mechanism of crystal growth, namely, growth through the medium of a non-autonomous phase [13,48,49], the release of incompatible elements to the surface is more effective in the case of small blocks forming a nano-block transition zone between the substrate surface and the NAPs [48].
Intracrystalline interblock boundaries are a common defect of mineral crystals. They contain dislocation pile-ups that create a non-homogeneous elastic field around themselves. This field is able to interact with the elastic fields of point defects, such as impurity atoms. The impurities, which are larger than the matrix atoms, are concentrated in the areas of lattice extension, and smaller impurities, in the areas of compression. Regardless of the size of impurity atoms, there are always such parts of the lattice in which the interaction with the impurity is positive (impurity atoms are “attracted” to them, trying to settle in them). This effect of impurity capture by dislocations is potentially possible for any crystalline phases and impurity elements; its value depends on the density of dislocations and the nature of their distribution in the crystal volume. The effect of concentration of micro-impurities is that if there is an external source of a trace element of a sufficiently large capacity (for example, the bulk fluid phase) that is able to restore the equilibrium concentration of Co in the undistorted part of the crystal block, the total content Ctot of trace element in the crystal will increase. The effect calculations for the case of Au in pyrite [19] have been carried out in the approximation of a simple (symmetric) tilt boundary within the formalism presented in References [58,59]. In the model considered, the block sizes were 50 and 100 nm, the distances between the dislocations in the wall were 10 and 50 nm, and Co = 1.6 ppm. The values of Ctot/Co at 300 °C were 49 and 2, respectively. This effect, apparently, can explain the increased content of structural Au in pyrite of the sample ZR-10/13 (Table 4), which had the smallest block size of all studied pyrites, at 60 nm (Table 3). However, due to the complexity of the analysis of multicomponent systems with a large number of dilation centres, we can only talk about the theoretical possibility of the effect on the distribution of Au and other NMs. It should be noted that for Au-REE-PGE ores of black-shale deposits, the confining of increased platinoid content to twin planes and other intracrystalline boundaries in pyrite has been previously mentioned [60].

6.4. Non-Stoichiometry

Figure 13 shows that the excess metal (or the presence of S vacancies) in pyrite contributes to the increase in the content of the structural forms of Ag and Pt, and to a lesser extent of Ru, Pd and possibly Au (in the latter case, the conclusion is ambiguous because of the “bounce” of point for the sample UV-3/13).
The interaction of vacancies with impurity atoms causes the effect of impurity “trapping”—the increase of its distribution coefficient in the crystal-solution (melt) system [61] or the increase of its solubility in the solid phase [62].
The published sources seem to lack quantitative data on the effect on NM content of non-stoichiometry and point defects in natural pyrite. With regard to synthetic crystals, the following can be stated. For the pyrite crystals doped with Co, Ni and As grown by chemical vapour transport (CVT) at 700–600 °C under Fe1-xS–FeS2 buffer conditions, the S/Fe atomic ratio was found to vary from 1.95 to 2.04 [63]. The CVT-grown pyrite crystals contain (S-Cl)2− and (S-Br)2− radicals in the crystal structure [64] which substitute for the (S2)2− dumbbells and act as electron donors [65]. These radical ions may be responsible for the incorporation of some impurity atoms into the crystal. Tomm et al. [66] determined Br and Au concentrations of approximately 0.2 at. % each (1094 ppm Au) in Au-doped crystals synthesised at 580–630 °C. Although the authors determined a uniform Au distribution of ~0.2 at. % in the bulk, a surface layer of about 150 Å was enhanced with Br and Au to about 1% each.
Figure 14 shows the dependence of the content of NM structural forms on the As/S ratio in arsenopyrite. An obvious trend existed expressing the elevation of Pt, Ru and Pd content for the samples with excess As (As/S ≥ ~1.14). At the same time, iron deficiency was insignificant (Table 2), and the possible concentration of vacancies in the metal position (on average ~0.3 at. %) was at the level of error of the EPMA analysis. We can assume that, for both coexisting minerals of pyrite and arsenopyrite, the sulphur deficiency is favourable for the incorporation of Ag and platinoids in their structures. Most likely, this is due to the lower sulphur fugacity under the formation of this association, which reflects two trends in the relationship between S and As in pyrite—“normal” for stoichiometric pyrite and “defective” for pyrite with excess Fe (Figure 4).
The data for Au were not certain, as the increased content of its structural form fell to As/S = ~1.14 (samples ZR-10/13 and Nat-10, Table 4); it was not the highest of those presented in Table 2. However, for Au, there was evidence that invisible Au correlated with excess As in the most natural and synthetic arsenopyrites [54]. The authors attribute this to the uptake of Au from ore fluids by chemisorption on the surface centres containing excessive As and deficient Fe and incorporation of Au in the metastable solid solution. However, this model fails to explain why this surface structure is preserved with the continuing crystal growth and how it transfers into the crystal volume, causing zonation in the distribution of As and Au.

6.5. Non-Precise Metal Impurities

Figure 15 and Figure 16 show the dependence of NM content on the sum of major non-NM impurities in the structures of pyrite and arsenopyrite, respectively. In pyrite, the highest Ag was observed for both the most “pure” (relatively non-NM impurities) sample, ZR-10/13, and the most “contaminated” with these impurities, UV-3/13. Platinum behaves in a similar way, although not in such a contrasting fashion. Gold, Pd and Ru were reduced from ZR-10/13 (40 ppm SMI) to Nat-10 (127 ppm) and then changed little, with the SMI contents being 182 and 235 ppm for DG-10/14 and UV-3/13, respectively. We believe that this dependence reflects the influence of the two above considered factors of NM concentration—fine-block substructure and non-stoichiometry defects. Both of these are better pronounced in the samples ZR-10/13 and UV-3/13 which were maximally contrasted by SMI content.
Among arsenopyrites, sample ZR-10/13 also stood out sharply with a high content of Ag (excluding Nat-10, the point of which does not fit into the scale of the graph; see Table 4), Au, Pt and Pd. It was followed by UV-3/13 with elevated Ag, Ru and Pt content. Sample DG-10/14, despite containing the highest amount of impurities (405 ppm SMI), contained less Au, Pt and Ag compared to more “pure” arsenopyrites.
All this suggests that non-NM impurities themselves are not a factor in NM concentration in structural forms, either in pyrite or in arsenopyrite. In any case, the fine-block substructure and non-stoichiometry defects associated with the mechanism and conditions of crystallisation of minerals of this association affect NM distribution much more strongly than do these impurities.

6.6. Effect of Crystal Inhomogeneity

We believe that the situation reflected in Figure 3 and Table 2 could arise only as a result of the formation of the pyrite crystals by growth through the medium of a non-autonomous phase [13,48,49]. First, “pure” and As–pyrite could not be different pyrite generations because they are present in the form of a close association of irregularly located areas within one single crystal. Secondly, the situation in Figure 3 can hardly be considered characteristic of pseudomorphic pyrite substitution by its As variety [50], due to the fact that the zones of occurrence of these varieties are distributed in a complex way. Matching of compositions (non-stoichiometric indices) of coexisting Py and As–Py does not fit into this model either. The driving force of pseudomorphic substitution is the difference in chemical potentials of easily mobile components (EMCs), and the same stoichiometry of Py and As–Py indicates that there were no significant differences in the activity of EMCs (primarily S2) during their formation.
It remains to be assumed that the formation of heterogeneous single crystals of pyrite (Py + As − Py) is a consequence of a special mechanism of crystal growth involving the participation of NAPs. The crystal is growing by feat of nanoscale NAPs enriched with As and NMs due to the phase size effect. Because of rather low temperatures and the relative stability of the solid solution in the process of growth, no complete transformation of As–Py into Py takes place. In fact, the solid-phase transformation of the internal NAP layer, losing the local equilibrium with a supersaturated solution [13,48], is inhibited under continuous medium conditions, since there is no free volume for the discharge of As (with the formation of the Asp phase) and other impurities. It can occur only in areas providing free space due to the presence of structural defects, such as point defects and their associates (vacancies, divacancies), dislocations, pores, etc. This leads to the observed patchy distribution of Py and As–Py sectors and the attraction of “pure” pyrite to areas with increased porosity.

7. Conclusions

A number of factors, the nature of which were different, influenced the distribution of hidden (invisible) forms of NMs between coexisting pyrite and arsenopyrite. The total NM content was affected by the surface accumulation effect caused by the uptake of impurities by NAPs. The surface activity of arsenopyrite was slightly higher than that of pyrite, but this had little effect on the distribution of NMs among them. The total contents increased at the expense of surficial-bound forms approximately equally for both minerals, which created the illusion of D Py/Asp constancy. The distribution coefficients of structural (str) and surficial (sur) forms did not differ significantly from each other and indicated a weak tendency towards NM fractionation in pyrite in this mineral pair:   D ¯ P y / A s p s t r   = 2.7 (Au), 2.5 (Pd), 1.6 (Pt), 1.7 (Ru); D ¯ P y / A s p s u r   = 1.6 (Au), 1.1 (Pd), 1.5 (Pt), 1.5 (Ru). Data on Ag, in most cases, indicated strong fractionation in pyrite ( D ¯ P y / A s p s t r   = 17), but they were not sufficiently reliable, probably due to the instability of the solid solution of Ag in pyrite and its decomposition in the post-crystallisation period. Surface enrichment was considered as a universal factor in “invisible” NM distribution, which was confirmed by the same shape and high coefficients of determination of the dependences of uniformly distributed concentrations of NMs on the specific surface area of the average crystal in the size fractions.
A number of NMs (Pt, Ru, Ag) tended to increase the content of structural impurities with a decrease in the size of crystallites in pyrite and arsenopyrite. This may be due to both the phase size effect and the intracrystalline adsorption of these elements at the interblock boundaries of a dislocation nature. Such dependences appear for superficially bound NM forms as well (with Pd added). Perhaps this is due to the peculiarities of the mechanism of crystal growth by means of NAPs, since the release of incompatible elements to the surface is more effective in the case of small blocks forming a nano-block transition zone between the substrate surface and the NAPs.
Excess metal (or the presence of S vacancies) in pyrite increases the content of structural forms of Ag and Pt and, to a lesser extent, those of Ru, Pd and Au. The interaction of vacancies with impurity atoms causes the effect of “trapping” the impurity, increasing its distribution coefficient in the crystal–growth medium system or increasing its solubility in the solid phase. For arsenopyrite, there was a clear trend of increasing content of Pt, Ru and Pd for the samples with an excess of As. We can assume that, for both coexisting minerals of pyrite and arsenopyrite, the deficiency in S was favourable for the incorporation of Ag and platinoids in their structures. Most likely, this was due to the fact of a lower sulphur fugacity under the formation of this association, which reflects two trends in the relationship between S and As in pyrite—“normal” for stoichiometric pyrite and “defective” for pyrite with excess Fe. The latter was associated with higher contents of some NMs.
The main non-precise metal impurities in the studied pyrite were Ni, Cu, Pb and Sb and, in arsenopyrites, Co, Ni, Cu, Pb, Sb and Se. The levels of their total contents varied quite widely—from 40 to 235 ppm in pyrite and from 193 to 405 ppm in arsenopyrite. These impurities did not seem to be a significant factor in NM concentration in structural forms; their influence was mediated by other factors, such as block substructure and non-stoichiometry defects associated with the mechanism and conditions of crystallisation of minerals of this association. These factors give rise to variations of NM accumulation and distribution characteristics even for minerals of ore deposits of the same type studied here.
The formation of heterogeneous single crystals of pyrite consisting of As-free and As-enriched areas may be a consequence of a special mechanism of crystal growth specified by the agency of NAPs.
Variations in NM distribution coefficients in the Py/Asp pair for the four samples considered from three orogenic Au deposits reached almost 100% rel. With varying degrees of influence of the abovementioned factors on the minerals of the association, we should expect significant variations of D P y / A s p of “invisible” NM forms which confirms a wide range of D P y / A s p values for “invisible” Au at various deposits.

Supplementary Materials

The following are available online at https://www.mdpi.com/2075-163X/9/11/660/s1, Table S1: Analysis of single-crystal size selections of coexisting pyrite and arsenopyrite of mineral samples of Natalkinskoe (Nat, UV), Degdekan (DG) and Zolotaya Rechka (ZR) deposits, north-eastern Russia.

Author Contributions

V.T. formulated the problem, organized the research team, and guided the study and interpretation of results. S.L. provided data handling and imaging, and organized LA-ICP-MS analysis, R.K. provided samples and contributed to interpretation, N.S. processed and rendered ADSSC data, O.B. performed EPMA data acquisition and interpretation, I.V. realized a vast amount of AAS analyses.

Funding

The research was performed within the frame of the state order project IX.124.3, No. 0350-2016-0025 and was partially funded by the Russian Foundation for Basic Research, grants Nos. 18-05-00077 and 17-05-00095, and integration project No.1.2 of the Irkutsk Scientific Center SB RAS.

Acknowledgments

We thank Ekaterina V. Kaneva for X-ray measurements and Taisa M. Pastushkova for assistance in chemical analyses. We thank the authorities of the Common Use Centers “Isotope and Geochemical Studies” of the Vinogradov Institute of Geochemistry SB RAS and “Ultra-microanalysis” of the Limnological Institute SB RAS. The authors would like to thank five anonymous reviewers for their deep insight into the problem, constructive criticism and useful comments.

Conflicts of Interest

The authors declare no conflicts of interest.

References

  1. Gervilla, F.; Papunen, H.; Kojonen, K.; Johanson, B. Platinum-, palladium- and gold-rich arsenide ores from the Kylmäkoski Ni-Cu deposit (Vammala Nickel Belt, SW Finland). Mineral. Petrol. 1998, 64, 163–185. [Google Scholar] [CrossRef]
  2. Dare, S.A.S.; Barnes, S.-J.; Prichard, H.M. The distribution of platinum group elements and other chalcophile elements among sulfides from the Creighton Ni-Cu-PGE sulfide deposit, Sudbury, Canada, and the origin of Pd in pentlandite. Miner. Depos. 2010, 45, 765–793. [Google Scholar] [CrossRef]
  3. Cafagna, F.; Jugo, P.J. An experimental study on the geochemical behavior of highly siderophile elements (HSE) and metalloids (As, Se, Sb, Te, Bi) in a mss-iss-pyrite system at 650 °C: A possible magmatic origin for Co-HSE-bearing pyrite and the role of metalloid-rich phases in the fractionation of HSE. Geochim. Cosmochim. Acta 2016, 178, 233–258. [Google Scholar] [CrossRef]
  4. Duran, C.J.; Barnes, S.-J.; Corkery, J.T. Chalcophile and platinum-group element distribution in pyrites from the sulfide-rich pods of the Lac des Iles Pd deposit, Western Ontario, Canada: Implications for post-cumulus re-equilibration of the ore and the use of pyrite composition in exploration. J. Geochem. Explor. 2015, 158, 223–242. [Google Scholar] [CrossRef]
  5. Pašava, J.; Zaccarini, F.; Aiglsperger, T.; Vymazalová, A. Platinum-group elements (PGE) and their principal carriers in metal-rich black shales: An overview with a new data from Mo-Ni-PGE black shales (Zunyi region, Guizhou Province, south China). J. Geosci. 2013, 58, 209–216. [Google Scholar] [CrossRef]
  6. Reich, M.; Kesler, S.E.; Utsunomiya, S.; Palenik, C.S.; Chryssoulis, S.L.; Ewing, R.C. Solubility of gold in arsenian pyrite. Geochim. Cosmochim. Acta 2005, 69, 2781–2796. [Google Scholar] [CrossRef]
  7. Deditius, A.P.; Reich, M.; Kesler, S.E.; Utsunomiya, S.; Chryssoulis, S.L.; Walshe, J.; Ewing, R.C. The coupled geochemistry of Au and As in pyrite from hydrothermal ore deposit. Geochim. Cosmochim. Acta 2014, 140, 644–670. [Google Scholar] [CrossRef]
  8. Dare, S.A.S.; Barnes, S.-J.; Prichard, H.M.; Fisher, P.C. Chalcophile and platinum-group element (PGE) concentrations in the sulfide minerals from the McCreedy East deposit, Sudbury, Canada, and the origin of PGE in pyrite. Miner. Depos. 2011, 46, 381–407. [Google Scholar] [CrossRef]
  9. Filimonova, O.N.; Nickolsky, M.S.; Trigub, A.L.; Chareev, D.A.; Kvashnina, K.O.; Kovalchuk, E.V.; Vikentyev, I.V.; Tagirov, B.R. The state of platinum in pyrite studied by X-ray absorption spectroscopy of synthetic crystals. Econ. Geol. in press.
  10. Gervilla, F.; Cabri, L.J.; Kojonen, K.; Oberthür, T.; Weiser, T.W.; Johanson, B.; Sie, S.H.; Campbell, J.L.; Teesdale, W.J.; Laflamme, J.H.G. Platinum-group element distribution in some ore deposits: Results of EPMA and Micro-PIXE analyses. Microchim. Acta 2004, 147, 167–173. [Google Scholar] [CrossRef]
  11. Parviainen, A.; Gervilla, F.; Melgarejo, J.-C.; Johanson, B. Low-temperature, platinum-group elements-bearing Ni arsenide assemblage from the Atrevida mine (Catalonian Coastal Ranges, NE Spain). Neues Jahrb. Mineral. Abh. 2008, 185, 33–49. [Google Scholar] [CrossRef]
  12. Tauson, V.L.; Parkhomenko, I.Y.; Babkin, D.N.; Men’shikov, V.I.; Lustenberg, E.E. Cadmium and mercury uptake by galena crystals under hydrothermal growth: A spectroscopic and element thermo-release atomic absorption study. Eur. J. Mineral. 2005, 17, 599–610. [Google Scholar] [CrossRef]
  13. Tauson, V.L.; Lipko, S.V.; Smagunov, N.V.; Kravtsova, R.G. Trace element partitioning dualism under mineral-fluid interaction: Origin and geochemical significance. Minerals 2018, 8, 282. [Google Scholar] [CrossRef]
  14. Tauson, V.L.; Lipko, S.V.; Arsent’ev, K.Y.; Mikhlin, Y.L.; Babkin, D.N.; Smagunov, N.V.; Pastushkova, T.M.; Voronova, I.Y.; Belozerova, O.Y. Dualistic distribution coefficients of trace elements in the system mineral-hydrothermal solution. IV. Platinum and silver in pyrite. Geochem. Int. 2017, 55, 753–774. [Google Scholar] [CrossRef]
  15. Ballhaus, C.; Sylvester, P. Noble metal enrichment processes in the Merensky Reef, Bushveld Complex. J. Petrol. 2000, 41, 545–561. [Google Scholar] [CrossRef]
  16. Morishita, Y.; Shimada, N.; Shimada, K. Invisible gold in arsenian pyrite from high-grade Hishikari gold deposit, Japan: Significance of variation and distribution of Au/As ratio in pyrite. Ore Geol. Rev. 2018, 95, 79–93. [Google Scholar] [CrossRef]
  17. Akimov, V.V.; Gerasimov, I.N.; Rigin, A.V. Behavior of gold nanoparticles in formation of surficial sulfide micro- and nanophases on substrates of single crystals of arsenopyrite and chalcopyrite. AIP Conf. Proc. 2019, 2064, 030001. [Google Scholar] [CrossRef]
  18. Sazonov, A.M.; Kirik, S.D.; Silyanov, S.A.; Bayukov, O.A.; Tishin, P.A. Typomorphism of arsenopyrite from the Blagodatnoe and Olimpiada gold deposits (Yenisei Ridge). Mineralogiya 2016, 3, 53–70. (In Russian) [Google Scholar]
  19. Tauson, V.L.; Mironov, A.G.; Smagunov, N.V.; Bugaeva, N.G.; Akimov, V.V. Gold in sulfides: State of art of occurrence and perspectives for experimental studies. Geol. Geofiz. 1996, 37, 3–14. (In Russian) [Google Scholar]
  20. Pina, R.; Gervilla, F.; Barnes, S.-J.; Ortega, L.; Lunar, R. Partition coefficients of platinum group and chalcophile elements between arsenide and sulfide phases as determined in the Beni Bousera Cr-Ni mineralization. Econ. Geol. 2013, 108, 935–951. [Google Scholar] [CrossRef]
  21. Kravtsova, R.G.; Tauson, V.L.; Nikitenko, E.M. Modes of Au, Pt, and Pd occurrence in arsenopyrite from the Natalkinskoe deposit, NE Russia. Geochem. Int. 2015, 53, 964–972. [Google Scholar] [CrossRef]
  22. Cook, N.J.; Ciobanu, C.L.; Meria, D.; Silcock, D.; Wade, B. Arsenopyrite-pyrite association in an orogenic gold ore: Tracing mineralization history from textures and trace elements. Econ. Geol. 2013, 108, 1273–1283. [Google Scholar] [CrossRef]
  23. Su, W.; Zhang, H.; Hu, R.; Ge, X.; Xia, B.; Chen, Y.; Zhu, C. Mineralogy and geochemistry of gold-bearing arsenian pyrite from the Shuiyindong Carlin-type gold deposit, Guizhou, China: Implications for gold depositional processes. Mineral. Depos. 2012, 47, 653–662. [Google Scholar] [CrossRef]
  24. Deol, S.; Deb, M.; Large, R.R.; Gilbert, S. LA-ICPMS and EPMA studies of pyrite, arsenopyrite and loellingite from the Bhukia-Jagpura gold prospect, southern Rajasthan, India: Implications for ore genesis and gold remobilization. Chem. Geol. 2012, 326–327, 72–87. [Google Scholar] [CrossRef]
  25. Benzaazoua, M.; Marion, P.; Robaut, F.; Pinto, A. Gold-bearing arsenopyrite and pyrite in refractory ores: Analytical refinements and new understanding of gold mineralogy. Mineral. Mag. 2007, 71, 123–142. [Google Scholar] [CrossRef]
  26. Hazarika, P.; Mishra, B.; Pruseth, K.L. Trace-element geochemistry of pyrite and arsenopyrite: Ore genetic implications for late Archean orogenic gold deposits in southern India. Mineral. Mag. 2017, 81, 661–678. [Google Scholar] [CrossRef]
  27. Kojonen, K.; Johanson, B. Determination of refractory gold distribution by microanalysis, diagnostic leaching and image analysis. Mineral. Petrol. 1999, 67, 1–19. [Google Scholar] [CrossRef]
  28. Hinchey, J.G.; Wilton, D.H.C.; Tubrett, M.N. A LAM-ICP-MS study of the distribution of gold in arsenopyrite from the Lodestar prospect, Newfoundland, Canada. Can. Mineral. 2003, 41, 353–364. [Google Scholar] [CrossRef]
  29. Wagner, T.; Klemd, R.; Wenzel, T.; Mattsson, B. Gold upgrading in metamorphosed massive sulfide ore deposits: Direct evidence from laser-ablation-inductively coupled plasma-mass spectrometry analysis of invisible gold. Geology 2007, 35, 775–778. [Google Scholar] [CrossRef]
  30. Sahoo, P.R.; Venkatesh, A.S. Constrains of mineralogical characterization of gold ore: Implication for genesis, controls and evolution of gold from Kundarkocha gold deposit, eastern India. J. Asian Earth Sci. 2015, 96, 136–149. [Google Scholar] [CrossRef]
  31. Zachariáš, J.; Frýda, J.; Paterová, B.; Mihaljevič, M. Arsenopyrite and As-pyrite from the Roudný deposit, Bohemian Massif. Mineral. Mag. 2004, 68, 31–46. [Google Scholar] [CrossRef]
  32. Tarnocai, C.A.; Hattori, K.; Cabri, L.J. “Invisible” gold in sulfides from Campbell mine, Red Lake greenstone belt, Ontario: Evidence for mineralization during the peak of metamorphism. Can. Mineral. 1997, 35, 805–815. [Google Scholar]
  33. McClenaghan, S.H.; Lentz, D.R.; Cabri, L.J. Abundance and speciation of gold in massive sulfides of the Bathurst Mining Camp, New Brunswick, Canada. Can. Mineral. 2004, 42, 851–871. [Google Scholar] [CrossRef]
  34. Liang, J.; Sun, W.; Zhu, S.; Li, H.; Liu, Y.; Zhai, W. Mineralogical study of sediment-hosted gold deposit in the Yangshan ore field, Western Qinling Orogen, Central China. J. Asian Earth Sci. 2014, 85, 40–52. [Google Scholar] [CrossRef]
  35. Zhang, J.; Li, L.; Gilbert, S.; Liu, J.-J.; Shi, W.-S. LA-ICP-MS and EPMA studies on the Fe-S-As minerals from the Jinlongshan gold deposit, Qinling Orogen, China: Implications for ore-forming processes. Geol. J. 2014, 49, 482–500. [Google Scholar] [CrossRef]
  36. Yang, S.; Blum, N.; Rahders, E.; Zhang, Z. The nature of invisible gold in sulfides from the Xiangxi Au-Sb-W ore deposit in northwestern Hunan, People’s Republic of China. Can. Mineral. 1998, 36, 1361–1372. [Google Scholar]
  37. Morey, A.A.; Tomkins, A.G.; Bierlein, F.P.; Weinberg, R.F.; Davidson, G.J. Bimodal distribution of gold in pyrite and arsenopyrite: Examples from the Archean Boorara and Bardoc shear systems, Yilgarn Craton, Western Australia. Econ. Geol. 2008, 103, 599–614. [Google Scholar] [CrossRef]
  38. Tauson, V.L. Gold solubility in the common gold-bearing minerals: Experimental evaluation and application to pyrite. Eur. J. Mineral. 1999, 11, 937–947. [Google Scholar] [CrossRef]
  39. Tauson, V.L.; Babkin, D.N.; Akimov, V.V.; Lipko, S.V.; Smagunov, N.V.; Parkhomenko, I.Y. Trace elements as indicators of the physicochemical conditions of mineral formation in hydrothermal sulfide systems. Rus. Geol. Geophys. 2013, 54, 526–543. [Google Scholar] [CrossRef]
  40. Goncharov, V.I.; Voroshin, S.V.; Sidorov, V.A. Natalkinskoe Gold-Ore Deposit; North-East Complex Research Institute, Far-East Branch of RAS: Magadan, Russia, 2002. (In Russian) [Google Scholar]
  41. Goryachev, N.A.; Pirajno, F. Gold deposits and gold metallogeny of Far East Russia. Ore Geol. Rev. 2014, 59, 123–151. [Google Scholar] [CrossRef]
  42. Goryachev, N.A.; Vikent’eva, O.V.; Bortnikov, N.S.; Prokof’ev, V.Y.; Alpatov, V.A.; Golub, V.V. The world-class Natalka gold deposit, Northeast Russia: REE patterns, fluid inclusions, stable oxygen isotopes, and formation conditions of ore. Geol. Ore Depos. 2008, 50, 362–390. [Google Scholar] [CrossRef]
  43. Mikhailov, B.K.; Struzhkov, S.F.; Natalenko, M.V.; Cimbalyuk, N.V. Multifactor model of large-volume gold-ore deposit Degdekan (Magadan region). Otechestvennaya Geol. 2010, 2, 20–31. [Google Scholar]
  44. Khanchuk, A.I.; Plyusnina, L.P.; Nikitenko, E.M.; Kuzmina, T.V.; Barinov, N.N. The noble metal distribution in the black shales of the Degdekan gold deposit in Northeast Russia. Russ. J. Pac. Geol. 2011, 5, 89–96. [Google Scholar] [CrossRef]
  45. Akinin, V.V.; Voroshin, S.V.; Gelman, M.L.; Leonova, V.V.; Miller, E.L. Shrimp-dating of metamorphic xenolyths of lamprophyre at gold deposit Degdekan: To the history of continental earth crust transformations at Ayan-Uriakh anticlinorium (Yano-Kolyma fold system). In Geodynamics, Magmatism and Minerageny of Continental Margins of North Pacific; North-East Complex Research Institute, Far-East Branch of RAS: Magadan, Russia, 2003; Volume 2, pp. 142–146. (In Russian) [Google Scholar]
  46. Tauson, V.L.; Lustenberg, E.E. Quantitative determination of modes of gold occurrence in minerals by the statistical analysis of analytical data sampling. Geochem. Int. 2008, 46, 423–428. [Google Scholar] [CrossRef]
  47. Deditius, A.P.; Utsunomiya, S.; Renock, D.; Ewing, R.C.; Ramana, C.V.; Becker, U.; Kesler, S.E. A proposed new type of arsenian pyrite: Composition, nanostructure and geological significance. Geochim. Cosmochim. Acta 2008, 72, 2919–2933. [Google Scholar] [CrossRef]
  48. Tauson, V.L.; Lipko, S.V.; Smagunov, N.V.; Kravtsova, R.G.; Arsent’ev, K.Y. Distribution and segregation of trace elements during the growth of ore mineral crystals in hydrothermal systems: Geochemical and mineralogical implications. Rus. Geol. Geophys. 2018, 59, 1718–1732. [Google Scholar] [CrossRef]
  49. Tauson, V.L.; Lipko, S.V.; Arsent’ev, K.Y.; Smagunov, N.V. Crystal growth through the medium of nonautonomous phase: Implications for element partitioning in ore systems. Cryst. Rep. 2019, 64, 496–507. [Google Scholar] [CrossRef]
  50. Xing, Y.; Brugger, J.; Tomkins, A.; Shvarov, Y. Arsenic evolution as a tool for understanding formation of pyritic gold ores. Geology 2019, 47, 335–338. [Google Scholar] [CrossRef]
  51. Kusebauch, C.; Gleeson, S.A.; Oelze, M. Coupled partitioning of Au and As into pyrite controls formation of giant Au deposits. Sci. Adv. 2019, 5, eaav5891. [Google Scholar] [CrossRef] [Green Version]
  52. Morishita, Y.; Hammond, N.Q.; Momii, K.; Konagaya, R.; Sano, Y.; Takahata, N.; Ueno, H. Invisible gold in pyrite from epithermal, banded-iron-formation-hosted, and sedimentary gold deposits: Evidence of hydrothermal influence. Minerals 2019, 9, 447. [Google Scholar] [CrossRef]
  53. Clark, L.A. The Fe-As-S system: Phase relations and applications. Part 1. Econ. Geol. 1960, 55, 1345–1381. [Google Scholar] [CrossRef]
  54. Fleet, M.E.; Mumin, A.H. Gold-bearing arsenian pyrite and marcasite and arsenopyrite from Carlin Trend gold deposits and laboratory synthesis. Am. Mineral. 1997, 82, 182–193. [Google Scholar] [CrossRef]
  55. Le Pape, P.; Blanchard, M.; Brest, J.; Boulliard, J.-C.; Ikogou, M.; Stetten, L.; Wang, S.; Landrot, G.; Morin, G. Arsenic incorporation in pyrite at ambient temperature at both tetrahedral S−1 and octahedral FeII sites: Evidence from EXAFS-DFT analysis. Environ. Sci. Technol. 2017, 51, 150–158. [Google Scholar] [CrossRef] [PubMed]
  56. Tauson, V.L.; Akimov, V.V. Effect of crystallite size on solid state miscibility: Applications to the pyrite-cattierite system. Geochim. Cosmochim. Acta 1991, 55, 2851–2859. [Google Scholar] [CrossRef]
  57. Tauson, V.L.; Akimov, V.V. Further experimental evidence for a crystallite size effect in the FeS2-CoS2 system. Chem. Geol. 1993, 109, 113–118. [Google Scholar] [CrossRef]
  58. Abramovich, M.G.; Shmakin, B.M.; Tauson, V.L.; Akimov, V.V. Mineral typochemistry: Anomalous trace-element concentrations in solid solutions with defect structures. Int. Geol. Rev. 1990, 32, 608–615. [Google Scholar] [CrossRef]
  59. Urusov, V.S.; Tauson, V.L.; Akimov, V.V. Geochemistry of Solids; GEOS: Moscow, Russia, 1997. (In Russian) [Google Scholar]
  60. Ermolaev, N.P.; Sozinov, N.A.; Fliciyan, E.S.; Chinenov, V.A.; Khoroshilov, V.L. New Types of Ores of Noble and Rare Elements in Carbonaceous Shales; Beus, A.A., Ed.; Nauka: Moscow, Russia, 1992. (In Russian) [Google Scholar]
  61. Urusov, V.S.; Dudnikova, V.B. The trace-component trapping effect: Experimental evidence, theoretical interpretation, and geochemical applications. Geochim. Cosmochim. Acta 1998, 62, 1233–1240. [Google Scholar] [CrossRef]
  62. Tauson, V.L.; Akimov, V.V.; Parkhomenko, I.Y.; Nepomnyashchikh, K.V.; Men’shikov, V.I. A study of cadmium incorporation into pyrrhotites of different stoichiometry. Geochem. Int. 2004, 42, 115–121. [Google Scholar]
  63. Lehner, S.W.; Savage, K.S.; Ayers, J.C. Vapor growth and characterization of pyrite (FeS2) doped with Co, Ni, and As: Variations in semiconducting properties. J. Cryst. Growth 2006, 286, 306–317. [Google Scholar] [CrossRef]
  64. Fiechter, S.; Mai, J.; Ennaoui, A.; Szacki, W. Chemical vapor transport of pyrite (FeS2) with halogen (Cl, Br, I). J. Cryst. Growth 1986, 78, 438–444. [Google Scholar] [CrossRef]
  65. Schieck, R.; Hartmann, A.; Fiechter, S. Electrical properties of natural and synthetic pyrite (FeS2) crystals. J. Mater. Res. 1990, 5, 1567–1572. [Google Scholar] [CrossRef]
  66. Tomm, Y.; Schieck, R.; Ellmer, K.; Fiechter, S. Growth mechanism and electronic properties of doped pyrite (FeS2) crystals. J. Cryst. Growth 1995, 146, 271–276. [Google Scholar] [CrossRef]
Figure 1. The Natalkinskoe, Degdekan and Zolotaya Rechka deposits on a simplified scheme of geologic aspects of the area of investigations. Compiled by the authors of the present paper using the data by Goncharov et al. [40]. The inset map shows the location of the deposits within the territory of the Magadan region. 1—granitoid massifs; 2—Triassic siltstones and mudstones; 3—upper Permian aleuropelitic shales with fragments of different composition rocks, aleuropelitic and carbono-argillaceous shales, carbonaceous siltstones, siltstones, sandstones, tuff sandstones and gravelites; 4—lower Permian mudstones, siltstones and sandstones; 5—faults.
Minerals 09 00660 g001
Figure 2. Gold-bearing streaky-vein and veinlet-disseminated ores. (a) Sample Nat-10 of the Natalkinskoe deposit, central area, quarry (level 787.5 m). Intensively sulphidized and carbonized aleuropelitic shales with the inclusions of grey tufogenic material dissected with a dense network of quartz and quartz–carbonate veinlets of different widths, from hair like to 5 mm. Sulphide minerals are represented by disseminated pyrite and arsenopyrite. Pyrite crystals are cubes, pentagon dodecahedrons and cuboctahedrons, mainly up to 2 mm along an edge. Arsenopyrite crystals are represented by rhombic prisms and bipyramids, usually up to 0.5 mm along an edge. The combinations of simple forms are typical for both minerals. (b) Sample UV-3/13 of the Natalkinskoe deposit, south-eastern area, well DH70/5n, depth 160.1–163.1 m, level 590 m. Heavily sulphidized and carbonized siltstones and aleuropelitic shales with interlayered sandstones dissected with a network of quartz and quartz–carbonate veinlets of different width. The characteristics of ore minerals are the same as for Nat-10 except that pyrite predominates over arsenopyrite and the crystals of the later are coarser (up to 3 mm). (c) Sample DG-10/14 of the Degdekan deposit, Vernyi area, well DH221n, depth 231.9–233.9 m (level 470 m). Quartz veins and veinlets occur in heavily carbonized and sulphidized siltstones and characterized by a few centimetres and a few millimetres (up to 8 mm) width, accordingly. The sulphides are represented by impregnations, patches and fine stringers of pyrite. The coarse cubic crystals prevail (more than 2 mm in size). Arsenopyrite, mostly confined to veins and veinlets, is less common and represented by small rhombic-prismatic crystals (up to 0.5 mm). (d) Sample ZR-10/13 of the Zolotaya Rechka deposit, well DH444n, depth 307.4–310.3 m (level 310 m). Heavily fractured aleuropelitic shales dissected with a dense network of quartz veinlets of different widths, from hair like to 8–10 mm. Sulphides are represented by impregnations and patches of pyrite and arsenopyrite. Pyrite crystals are cubes and cuboctahedrons, mainly up to 2 mm along an edge. The combined forms are often observed. Arsenopyrite crystals are usually smaller (up to 0.5 mm) and have the habits of rhombic prisms and bipyramids.
Minerals 09 00660 g002
Figure 3. The scanning image in back scattered electrons (BSEs) of pyrite crystal with coexisting “pure” (As-free) and As–pyrite (sample ZR-10/13). Note that more dark areas corresponding to “pure” pyrite display elevated porosity.
Minerals 09 00660 g003
Figure 4. Two types of S–As correlation in As–pyrite. The “stoichiometric trend” gives Fe/S = 2.006 when extrapolated to “pure” (As-free) pyrite, whereas the “nonstoichiometric trend” gives Fe/S = 1.98 and, moreover, does not correlate with “pure” pyrite which is still more nonstoichiometric.
Minerals 09 00660 g004
Figure 5. Dependence of the average concentration of evenly distributed Au in pyrite (Py) and arsenopyrite (Asp) on the specific surface area of an average crystal in size fraction. The expressions for approximate curves and concentrations of structurally and superficially bound modes are shown (see Table S1 in the Supplementary Materials for details).
Minerals 09 00660 g005
Figure 6. Dependence of the average concentration of evenly distributed Pd in pyrite and arsenopyrite on the specific surface area of an average crystal in size fraction. See Figure 5 for explanations.
Minerals 09 00660 g006
Figure 7. Dependence of the average concentration of evenly distributed Pt in pyrite and arsenopyrite on the specific surface area of an average crystal in size fraction. See Figure 5 for explanations.
Minerals 09 00660 g007
Figure 8. Dependence of the average concentration of evenly distributed Ru in pyrite and arsenopyrite on the specific surface area of an average crystal in size fraction. See Figure 5 for explanations.
Minerals 09 00660 g008
Figure 9. Dependence of the average concentration of evenly distributed Ag in pyrite and arsenopyrite on the specific surface area of an average crystal in size fraction. See Figure 5 for explanations.
Minerals 09 00660 g009
Figure 10. Dependences of noble metal (NM) contents in structurally (a) and superficially (b) bound modes on crystallite sizes in pyrite crystals. See Table 3 and Table 4 for numerical data.
Minerals 09 00660 g010
Figure 11. Dependences of NM contents in structurally (a) and superficially (b) bound modes on crystallite sizes in arsenopyrite crystals. See Table 3 and Table 4 for numerical data.
Minerals 09 00660 g011
Figure 12. Dependences of Ag content in structurally (a) and superficially (b) bound modes on crystallite sizes in pyrite crystals. See Table 3 and Table 4 for numerical data.
Minerals 09 00660 g012
Figure 13. Structurally bound NMs as a function of the stoichiometric ratio in As–pyrite crystals. Note the ten-fold reduced concentration scale for Ag. See Table 2 and Table 4 for numerical data.
Minerals 09 00660 g013
Figure 14. Structurally bound NM as a function of the As/S ratio in arsenopyrite crystals. See Table 2 and Table 4 for numerical data.
Minerals 09 00660 g014
Figure 15. Structurally bound NM versus the SMI in pyrite crystals. Note the ten-fold reduced concentration scale for Ag. See Table 4 and Table 5 for numerical data on NM and SMI, accordingly.
Minerals 09 00660 g015
Figure 16. Structurally bound NM versus the SIM in arsenopyrite crystals. See Table 4 and Table 6 for numerical data on NM and SMI, accordingly.
Minerals 09 00660 g016
Table 1. Literary data on “invisible” gold in coexisting pyrite and arsenopyrite.
NoDeposit, LocationType *Formation ConditionsOre Mineral Association **Au Content (ppm)As in Py (ppm)
PyAsp
1Shuiyindong, Guizhou, ChinaCarlin220 ± 20 °C,
2–4 mol.% CO2,
low salinity
Py, Asp, Au300–600300–15007000–12,400
2Bhukia-Jagpura Rajasthan, IndiaMagmatic-hydrothermal460–474 °C,
−logfS2 = 4.6–5.8 bar,
24–26 wt % NaCl-eq.
Py, Asp, Po0.3–1.60.28–10143–215
3Neves Norte, Alentejo,
Portugal
VHMSn/aPy, Asp, Cpy,
Gn, St, Tet
1.716–35<2000
4Hutti, Dharwar Craton, IndiaOrogenic377–450 °C, ~2 kbarPy, Asp, Po,
Sph, Cpy, Au
0.05–0.450.43–14.18400–7500
5Suurikuusikko, Kittilä, FinlandVHMSn/aPy, Asp, Tet,
Bour, Gn,
Cpy, Sph,
Rut, Au
<22–585<22–964~200–40,000
6Lodestar,
Newfoundland, Canada
Magmatic-hydrothermal~425 °CPy, Asp, Cpy0.03–0.73
0.03–1.33
0.12–154
1.31–152
n/a
7Boliden,
Skellefte,
Sweden
VHMSMetamorphosed~400–450 °C, 5 kbarPy, Asp, Po,
Cpy, Gn, Au
≤0.22
≤0.19
3.8–108
≤2.7
n/a
8Kundarkocha,
Singhbhum,
India
Orogenic375–390 °C,
−logfS2 = 7.5–9.7
Py, Asp, Po,
Cpy, Sph, Pn,
Gsd, Gn, Lö, Au
2100–2700
1300–1500
700–900
1600–3600
1200–1300
900–1200
1000–2000
9Roudný,
Bohemia, Czech Republic
Mesothermal320–330 °CPy, Asp, Mrc,
Au
3–1839–1524000–25,000
10Campbell,
Ontario,
Canada
Metamorphic-hydrothermal450–500 °C, 2–3 kbarPy, Asp, Gh, Po,
Mt, Sph, Auo
0.1–0.3
0.2–8.5
103–5610
118–4522
n/a
11Oberon,
Tanami,
Australia
Orogenic200–430 °C, low-to moderate salinityAsp, Py, Po,
Cpy, Sph, Gn,
Au, Cb, Gsd
<1–4.62–45002000–4000
12Orvan Brook,
Rocky Turn,
Murray Brook,
Bathurst Mining Camp, New Brunswick, Canada
Massive sulphide Zn–Pb–Cu–Ag325–425 °C, 4–6 kbarPy, Sph, Gn,
Cpy, Po, Asp,
Mrc, Tet
<0.53–5.6
16.22–31.95
0.56–32.04
2.24–9.42
0.11–0.26
1.4–10.91
bdl EPMA-
9800
13Anba, Qinling Orogen, ChinaCarlin or Orogenicn/aPy, Asp, Ant,
Mrc, Sph
9.7–135.917.4–461.811,962–101,332
14Jinlongshan, Shaanxi, ChinaCarlinn/aPy, Asp1.9–9.4
21.1–113
4.2–429
64.6–576
bdl EPMA-
62,100
* As indicated in the original source. ** Py—pyrite, Asp—arsenopyrite, Po—pyrrhotite, Au—native gold, Cpy—chalcopyrite, Gn—galena, St—stannite, Tet—tetrahedrite, Sph—sphalerite, Bour—bournonite, Rut—rutile, Pn—pentlandite, Gsd—gersdorffite, Lö—loellingite, Mrc—marcasite, Gh—gahnite, Mt—magnetite, Cb—cobaltite, Ant—antimonite, VHMS—volcanogenic-hosted massive sulphide, EPMA—electron probe microanalysis. Note: n/a—not available, bdl—below detection limit. References: No.1—[23]; 2—[24]; 3—[25]; 4—[26]; 5—[27]; 6—[28]; 7—[29]; 8—[30]; 9—[31]; 10—[32]; 11—[22]; 12—[33]; 13—[34]; 14—[35].
Table 2. EPMA data for arsenopyrite and pyrite crystals.
SampleGrain No.Average Grain Composition (Atomic Content)
ArsenopyriteAs–PyritePyrite
n *FormulaAs/Sn *FormulaFe/
(S + As)
As/Sn *FormulaFe/S
Nat-
10
13Fe0.999As1.079S0.9221.17---- --
24Fe0.993As1.077S0.9301.16---- --
34Fe0.987As1.069S0.9441.13---- --
44Fe0.989As1.065S0.9461.13---- --
58Fe0.993As1.066S0.9411.13---- --
67Fe0.997As1.069S0.9341.14---- --
75Fe0.987As1.059S0.9541.11---- --
83Fe0.994As1.060S0.9461.12---- --
95Fe0.987As1.077S0.9361.15---- --
105Fe0.994As1.069S0.9371.14---- --
114Fe0.992As1.088S0.9201.18---- --
122Fe0.981As1.098S0.9211.194Fe0.998S1.994As0.0080.4990.0042FeS2.0060.499
132Fe0.973As1.085S0.9421.156Fe0.998S1.988As0.0140.4990.0071FeS2.040.490
141n/d-3Fe0.997S1.975As0.0280.4980.0143FeS2.0210.495
152Fe0.991As1.084S0.9251.175Fe0.999S1.984As0.0170.4990.009---
161Fe0.979As1.076S0.9451.143Fe0.998S1.983As0.0190.4990.013FeS2.0090.498
174Fe0.976As1.076S0.9481.145Fe1.000S1.976As0.0240.5000.0123FeS2.0060.499
UV-
3/13
18Fe0.982As1.101S0.9171.20-------
28Fe0.985As1.093S0.9221.19-------
38Fe0.986As1.110S0.9041.23-------
47Fe0.987As1.087S0.9261.17-------
55Fe0.991As1.094S0.9151.20-------
67Fe0.990As1.097S0.9131.20-------
7---9Fe1.019S1.961As0.0200.5140.01---
8---13Fe1.015S1.964As0.0210.5110.01---
9---12Fe1.019S1.973As0.0070.5150.004---
10---16Fe1.018S1.970As0.0120.5140.006---
11---9Fe1.017S1.963As0.0200.5130.01---
DG-
10/14
17Fe0.992As1.054S0.9541.10-------
25Fe0.999As1.016S0.9851.03-------
35Fe0.989As1.056S0.9551.11-------
45Fe0.989As1.037S0.9741.06-------
54Fe0.999As1.044S0.9571.09-------
63Fe0.988As1.050S0.9621.09-------
74Fe0.988As1.054S0.9581.10-------
87Fe0.992As1.034S0.9741.06-------
97Fe0.991As1.043S0.9661.08-------
106Fe0.991As1.041S0.9681.08-------
115Fe0.988As1.046S0.9661.08-------
126Fe0.998As1.049S0.9531.10-------
136Fe0.997As1.027S0.9761.05-------
142Fe0.980As1.050S0.9701.086Fe0.992S1.996As0.0110.4940.0065FeS2.0030.499
15---6Fe0.999S1.984As0.0180.4990.009---
16---5Fe0.995S1.993As0.0120.4960.0062FeS1.9880.503
ZR-
10/13
17Fe0.997As1.061S0.9421.13-------
28Fe0.990As1.067S0.9431.13-------
315Fe0.994As1.083S0.9231.17-------
414Fe0.996As1.075S0.9291.16-------
515Fe0.992As1.075S0.9331.15-------
614Fe0.987As1.064S0.9491.12-------
7---11Fe1.016S1.968As0.0160.5120.0084FeS1.9440.514
8---11Fe1.018S1.972As0.0100.5140.0055FeS1.9440.514
9---11Fe1.017S1.971As0.0120.5130.006---
10---8Fe1.019S1.968As0.0130.5140.0078FeS1.9440.514
11---7Fe1.019S1.969As0.0110.5150.0066FeS1.9350.517
12---6Fe1.015S1.944As0.0400.5120.0214FeS1.9410.515
* Number of analysis points. Only the results of analyses with sums from 99.5 to 100.5 wt % were taken into consideration. n/d—not determined.
Table 3. Results of the X-ray diffraction study of arsenopyrite and pyrite crystals.
Sample NumberArsenopyrite (Monoclinic, P21/c)Pyrite (Cubic, Pa3)
abcßoDaD
Nat-100.576930.567660.57395112.087610.5420876
UV-3/130.574250.566690.57591111.898560.5422765
DG-10/140.575920.566360.57327111.881580.5419271
ZR-10/130.573570.567530.57648111.979540.5414160
Note: lattice parameters (a, b, c) and crystallite size (D) are in nanometres.
Table 4. Noble metals contents as structurally and surficially bound modes, their distribution coefficients between pyrite and arsenopyrite, and average matrix composition of minerals.
Sample NumberElementElement Content (ppm)DPy/AspMatrix Composition (at. %) Asp/As–Py *
PyriteArsenopyriteStr.Sur.AsSFe
Str.Sur.Str.Sur.
Nat-10Au1.82.71.21.91.51.435.83/0.6031.23/66.1232.94/33.28
Ag122201202500.10.9
Pt3.6354.2890.90.4
Pd1.14.90.48.12.80.6
Ru4.9305.7790.90.4
UV-3/13Au0.291.40.121.32.41.136.57/0.5330.53/65.5432.90/33.93
Ag45080030450151.8
Pt37189141902.61.0
Pd1.018.40.824.51.20.8
Ru10330192180.51.5
DG-10/14Au0.131.10.030.484.32.334.75/0.4732.19/66.3633.06/33.17
Ag120200760173.3
Pt5.11032.1292.43.6
Pd1.28.20.233.75.22.2
Ru8.8973.9352.32.8
ZR-10/13Au6.8 **n/d13.7470.5n/d35.70/0.5731.20/65.5233.10/33.91
Ag11007000594001917.5
Pt12259372280.31.1
Pd3.2304.1380.80.8
Ru254587.73693.21.2
* Average data from the EPMA (Table 2). ** LA-ICP-MS data (Table 5). n/d—not determined.
Table 5. Refined LA-ICP-MS data (in ppm) for pyrite coexisting with arsenopyrite at the orogenic gold deposits located in north-eastern Russia (Magadan Region).
Sample No.TiVMnCoNiCuPbBiSbSeMoWYNbLaCeNdYbAu
Nat-108.45.36.28.056.136.423.41.111.5bdlbdl9.72.34.21.21.64.13.61.2
1.82.60.81.537.115.49.80.47.4--9.11.72.81.01.00.92.50.9
UV-3/1373.93.86.77.126.057.784.52.867.2bdlbdl5.414.41.61.52.96.24.1bdl
23.82.21.82.210.320.619.51.018.1--2.87.40.71.02.82.51.7-
DG-10/1423.64.37.99.272.318.243.64.547.568.82.85.40.77.20.40.6bdl3.30.6
10.33.32.72.651.59.529.32.717.012.42.73.40.52.60.20.1-0.20.2
ZR-10/1325.81.76.11.315.75.610.70.87.7bdlbdl14.70.41.71.83.62.21.56.8
3.10.42.70.67.21.84.30.22.2--3.10.21.41.02.51.00.92.1
Note: the average concentration of structurally bound elements estimated with the ADSSC approach [38,46] (first line) and root mean square deviation (second line); bdl—below detection limit; sum of main impurities (SMI) = Ni + Cu + Pb + Sb: Nat-10, 127 ppm; UV-3/13, 235 ppm; DG-10/14, 182 ppm; ZR-10/13, 40 ppm.
Table 6. Refined LA-ICP-MS data (in ppm) for arsenopyrite coexisting with pyrite at the orogenic gold deposits located in north-eastern Russia (Magadan Region).
Sample No.TiVCoNiCuPbBiSbSeMoWYNbYbAu
Nat-103.80.710.710.710.57.71.113381.21.8bdl0.6bdlbdl1.6
0.60.22.43.61.84.10.54526.90.8-0.6--0.9
UV-3/136.10.64.26.13.88.50.789.71052.7bdl0.3bdlbdl0.9
0.40.13.31.51.31.40.212.0170.5-0.1--0.2
DG-10/14711.018.824.412.416.43.51461872.62.50.47.21.50.6
500.49.68.56.56.91.527260.90.80.11.20.40.2
ZR-10/137.20.75.65.14.47.51.311553.72.3bdl0.5bdlbdl8.9
0.60.14.91.80.81.30.42010.80.6-0.3--1.8
Note: the average concentration of structurally bound elements estimated with the ADSSC approach [38,46] (first line) and root mean square deviation (second line); bdl—below detection limit; SMI = Co + Ni + Cu + Pb + Sb + Se: Nat-10, 254 ppm; UV-3/13, 217 ppm; DG-10/14, 405 ppm; ZR-10/13, 193 ppm.

