Experimental Modeling of Noble and Chalcophile Elements Fractionation during Solidification of Cu-Fe-Ni-S Melt


Abstract
1. Introduction
2. Experimental
2.1. Sample Preparation
2.2. Investigation of Crystallized Samples
3. Results
3.1. Behavior of Base Components
3.2. Behavior of Microcomponents
3.2.1. Solid Solutions of Impurities in BMS
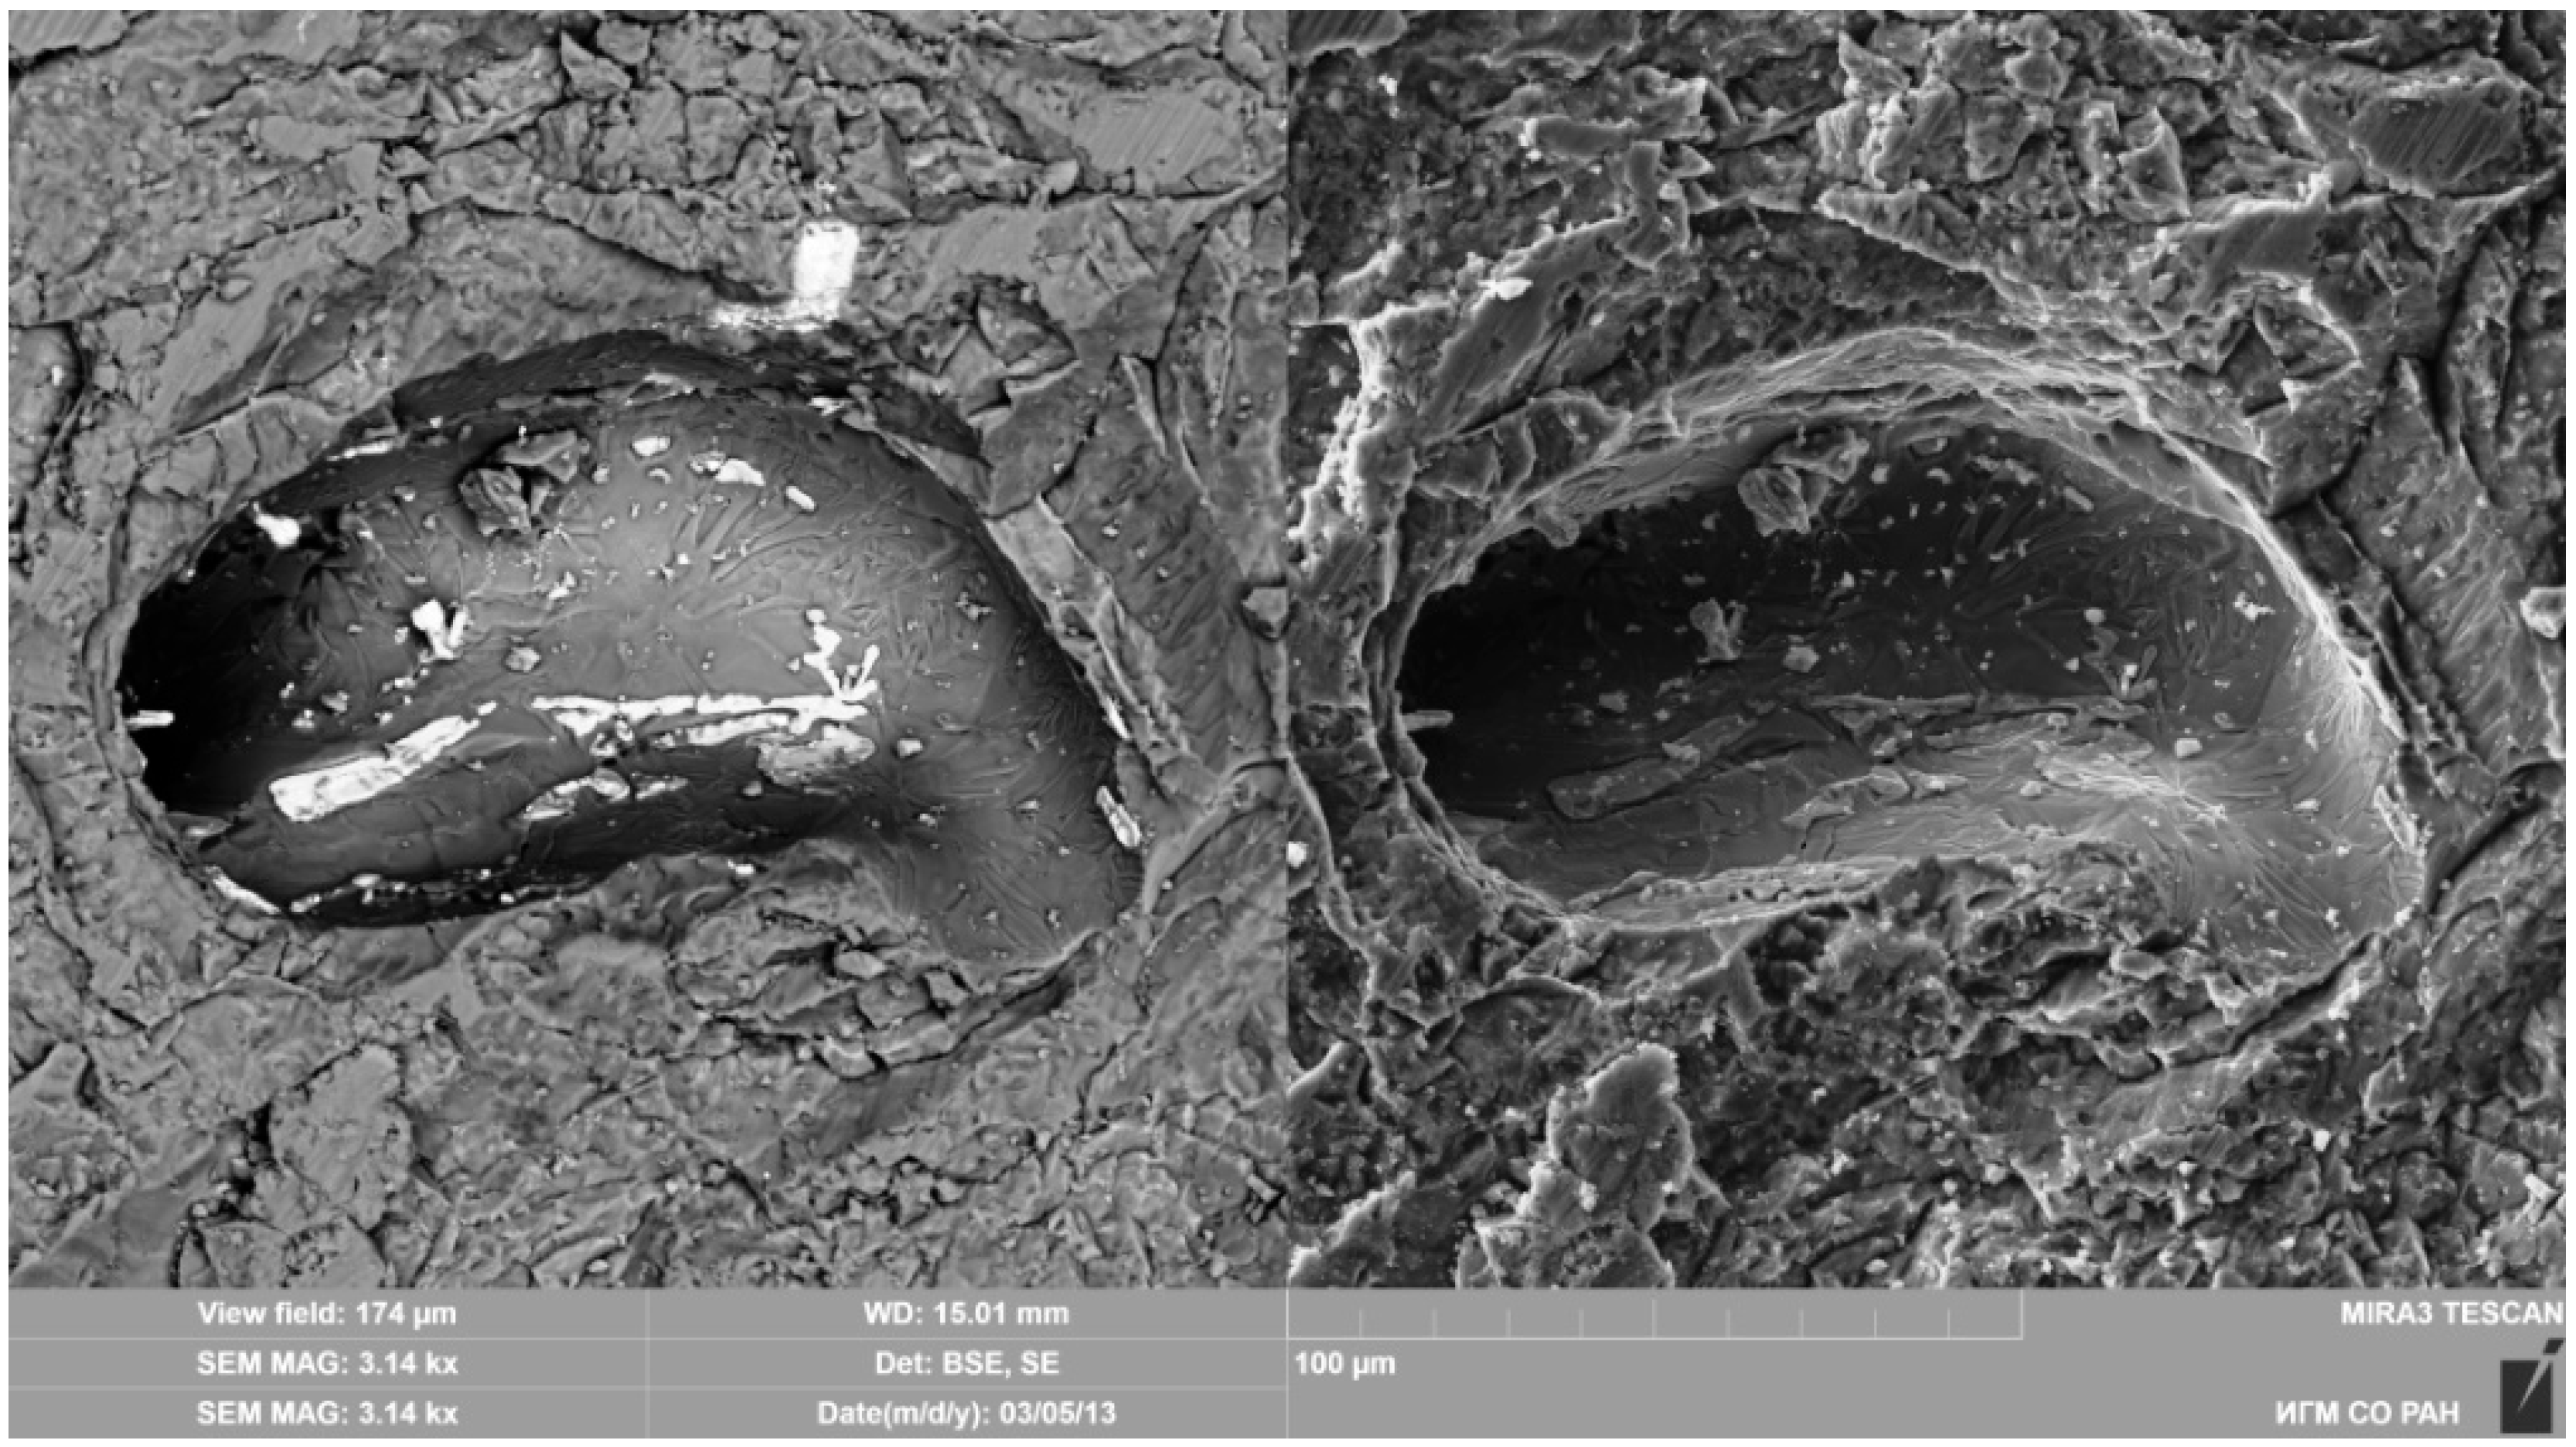
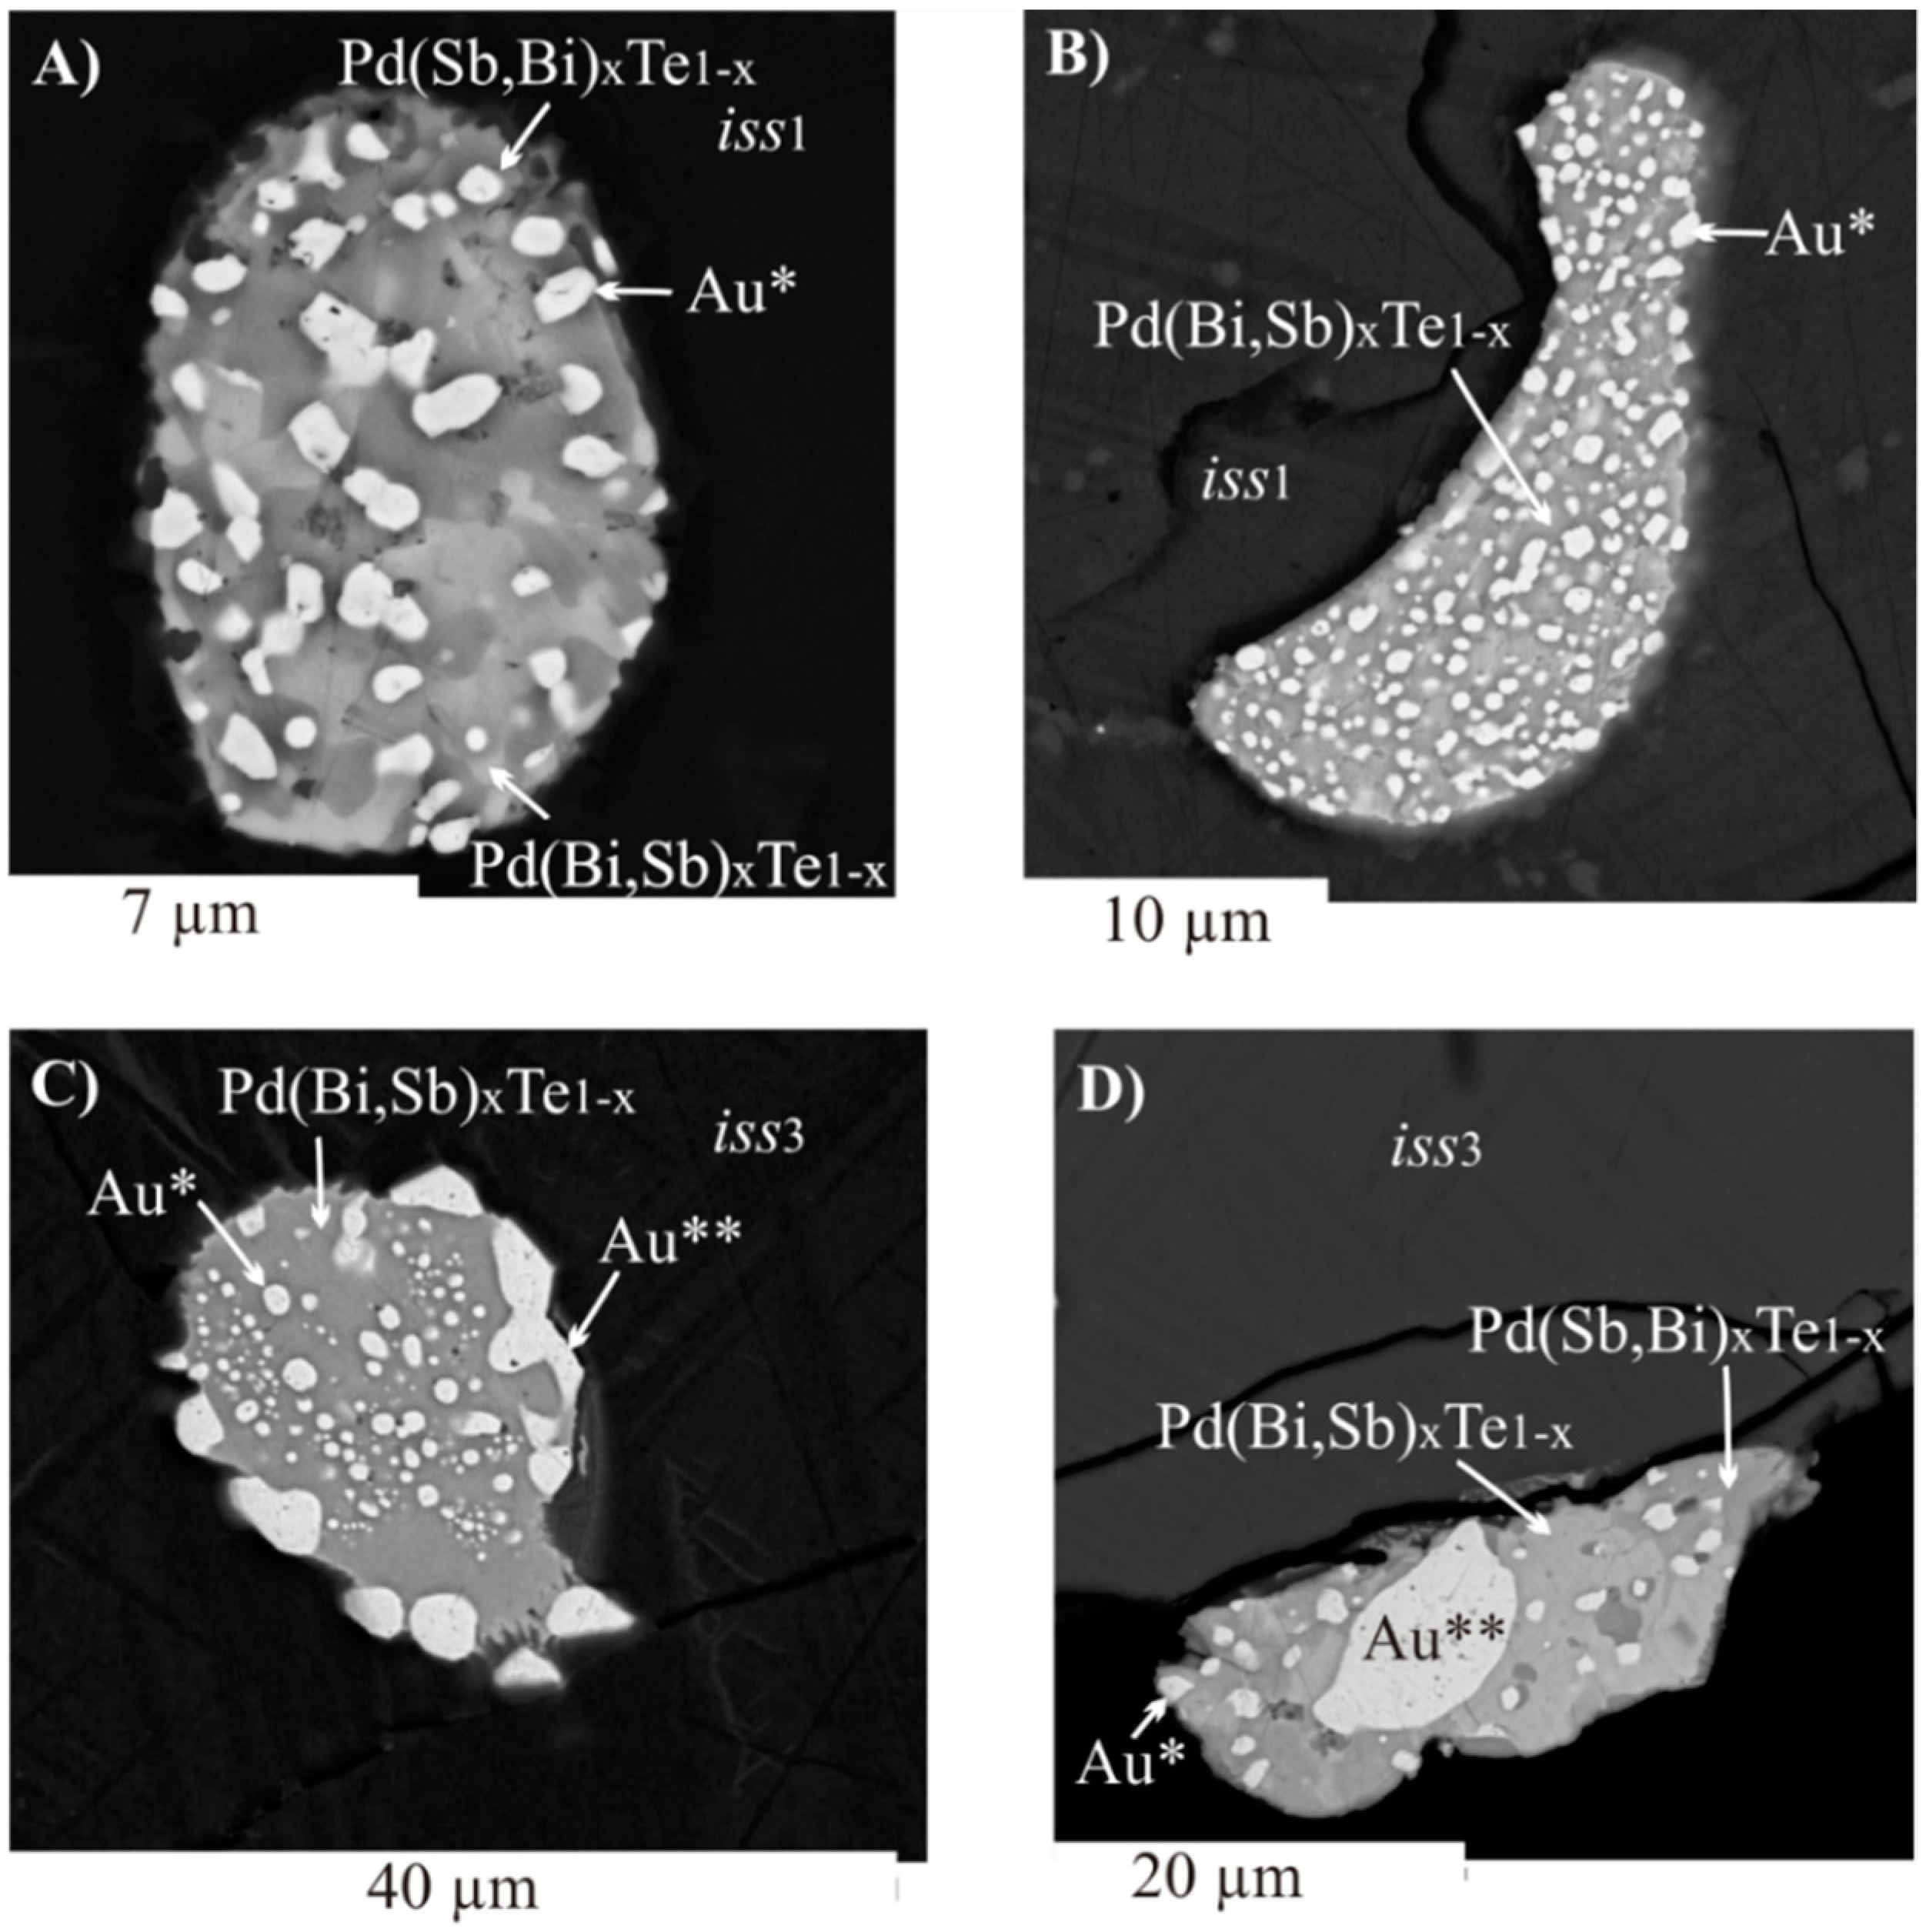
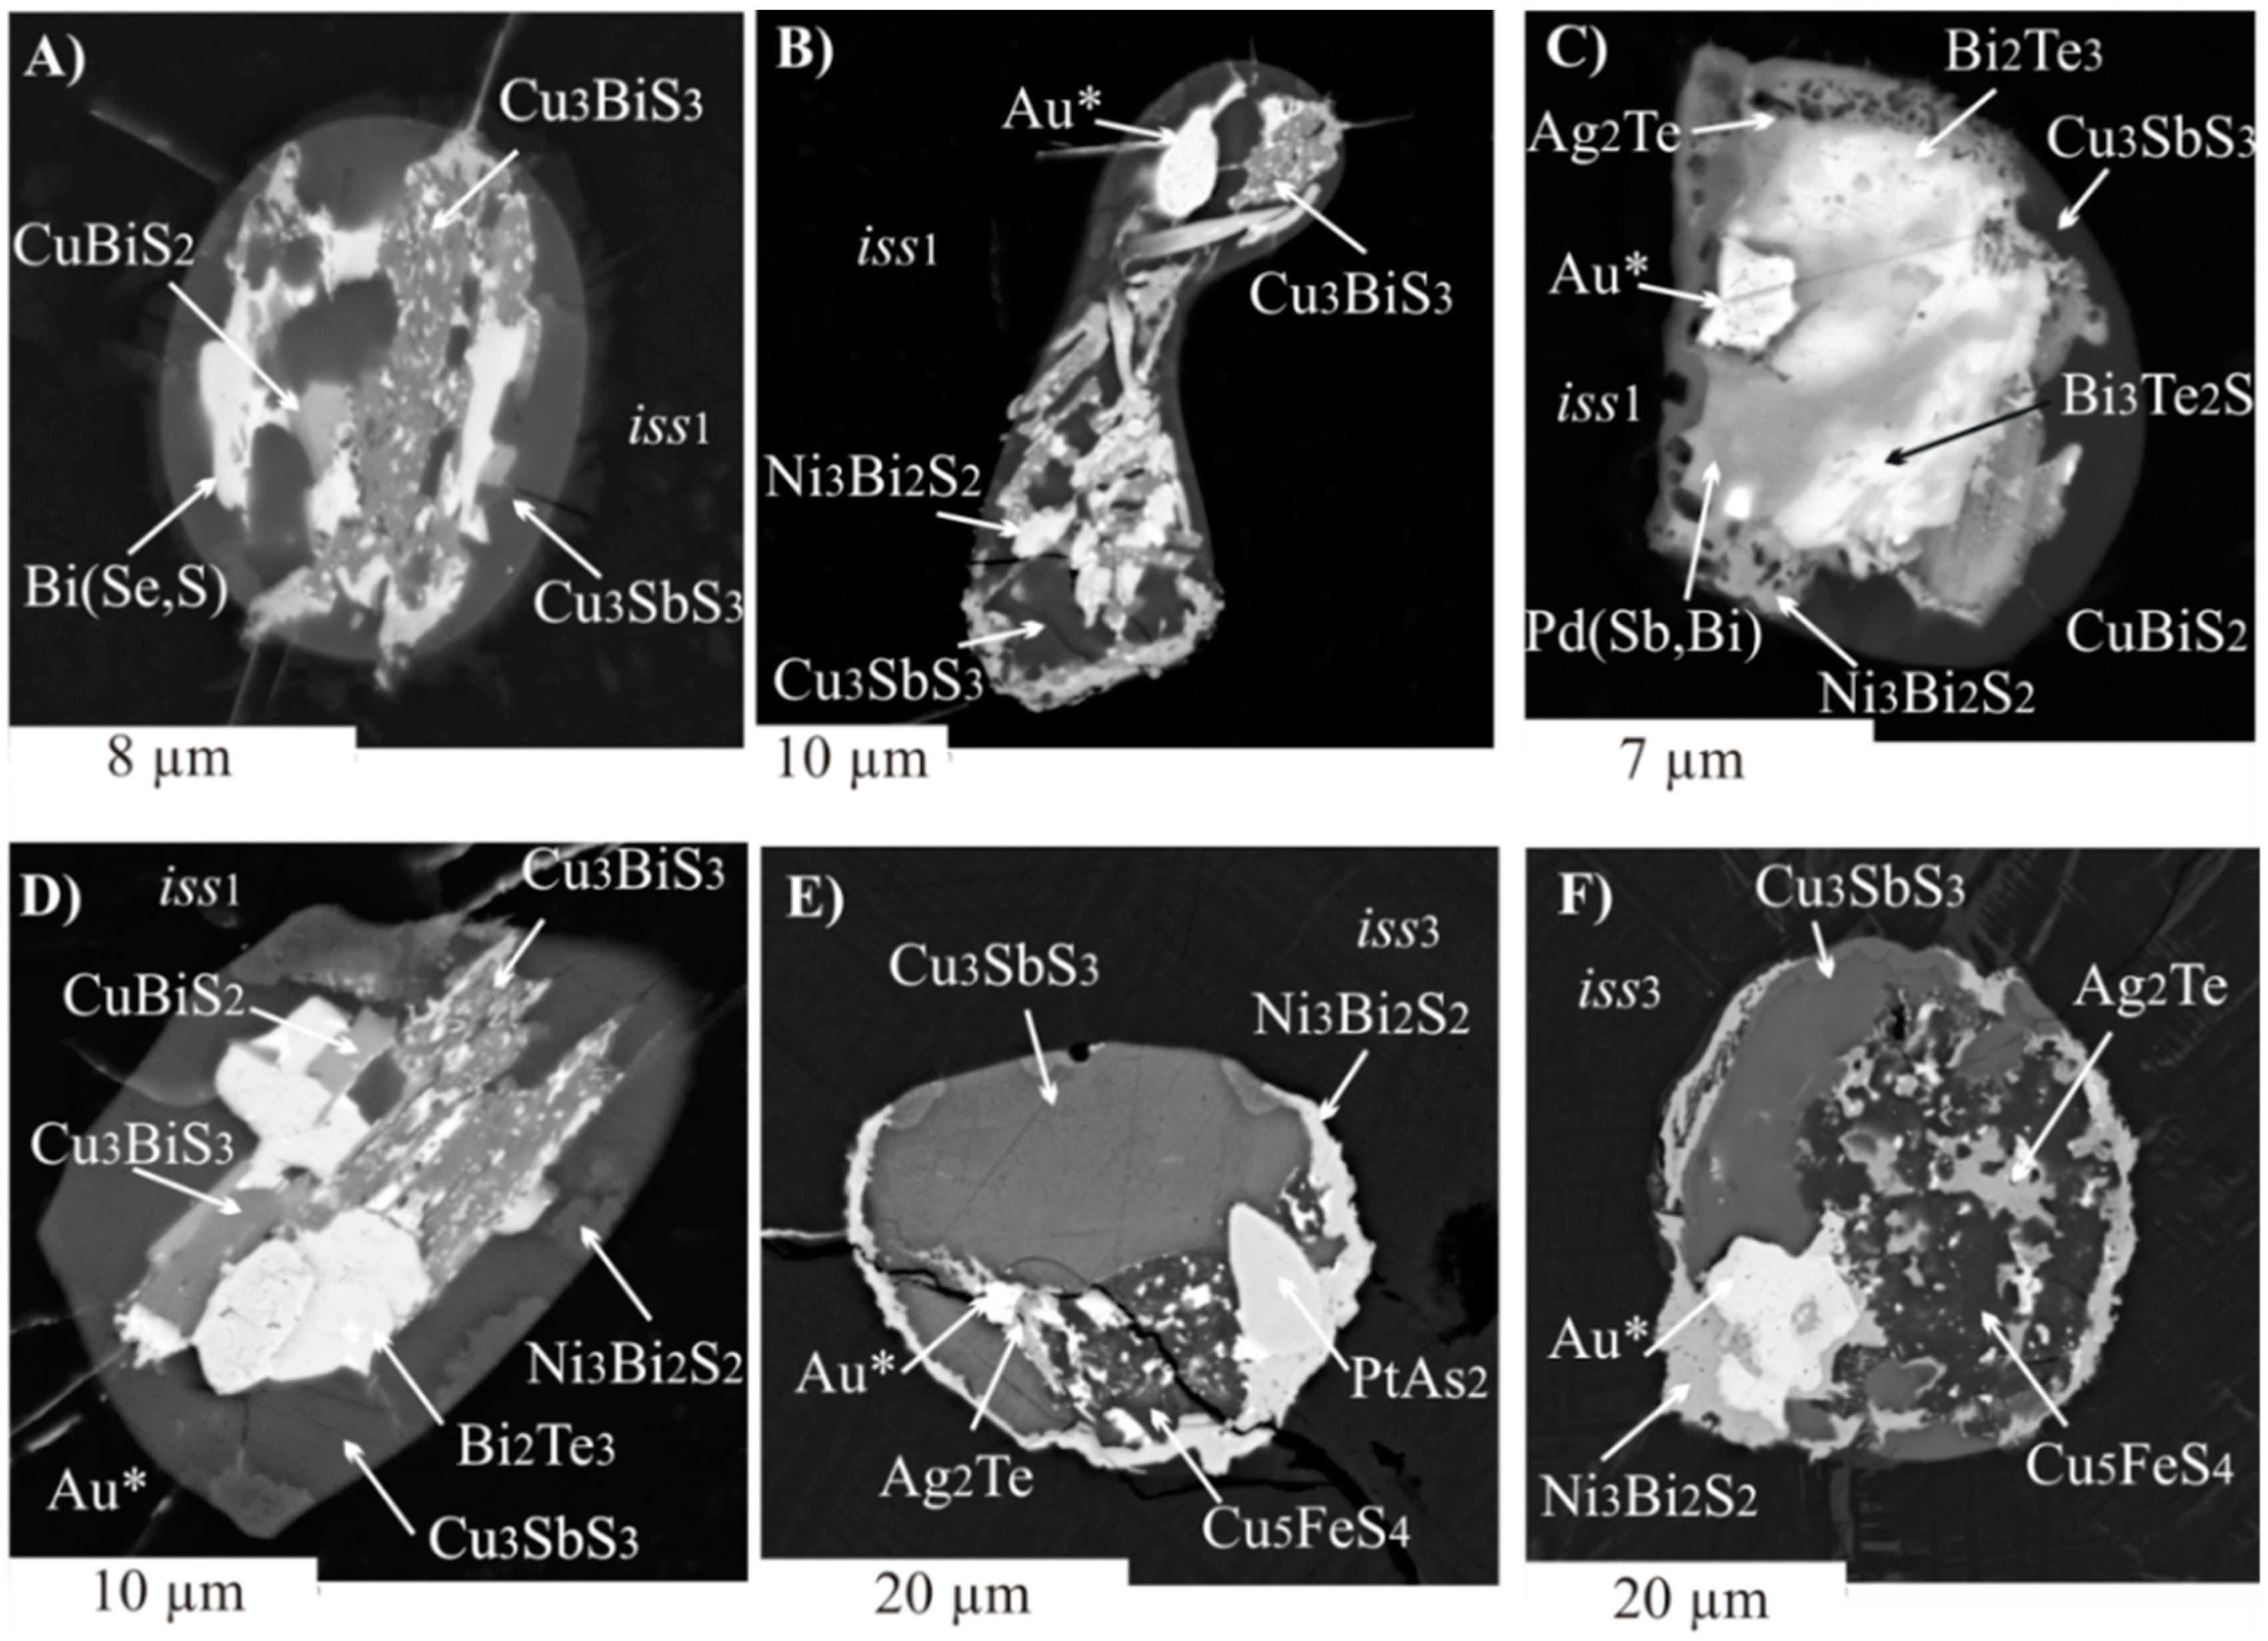
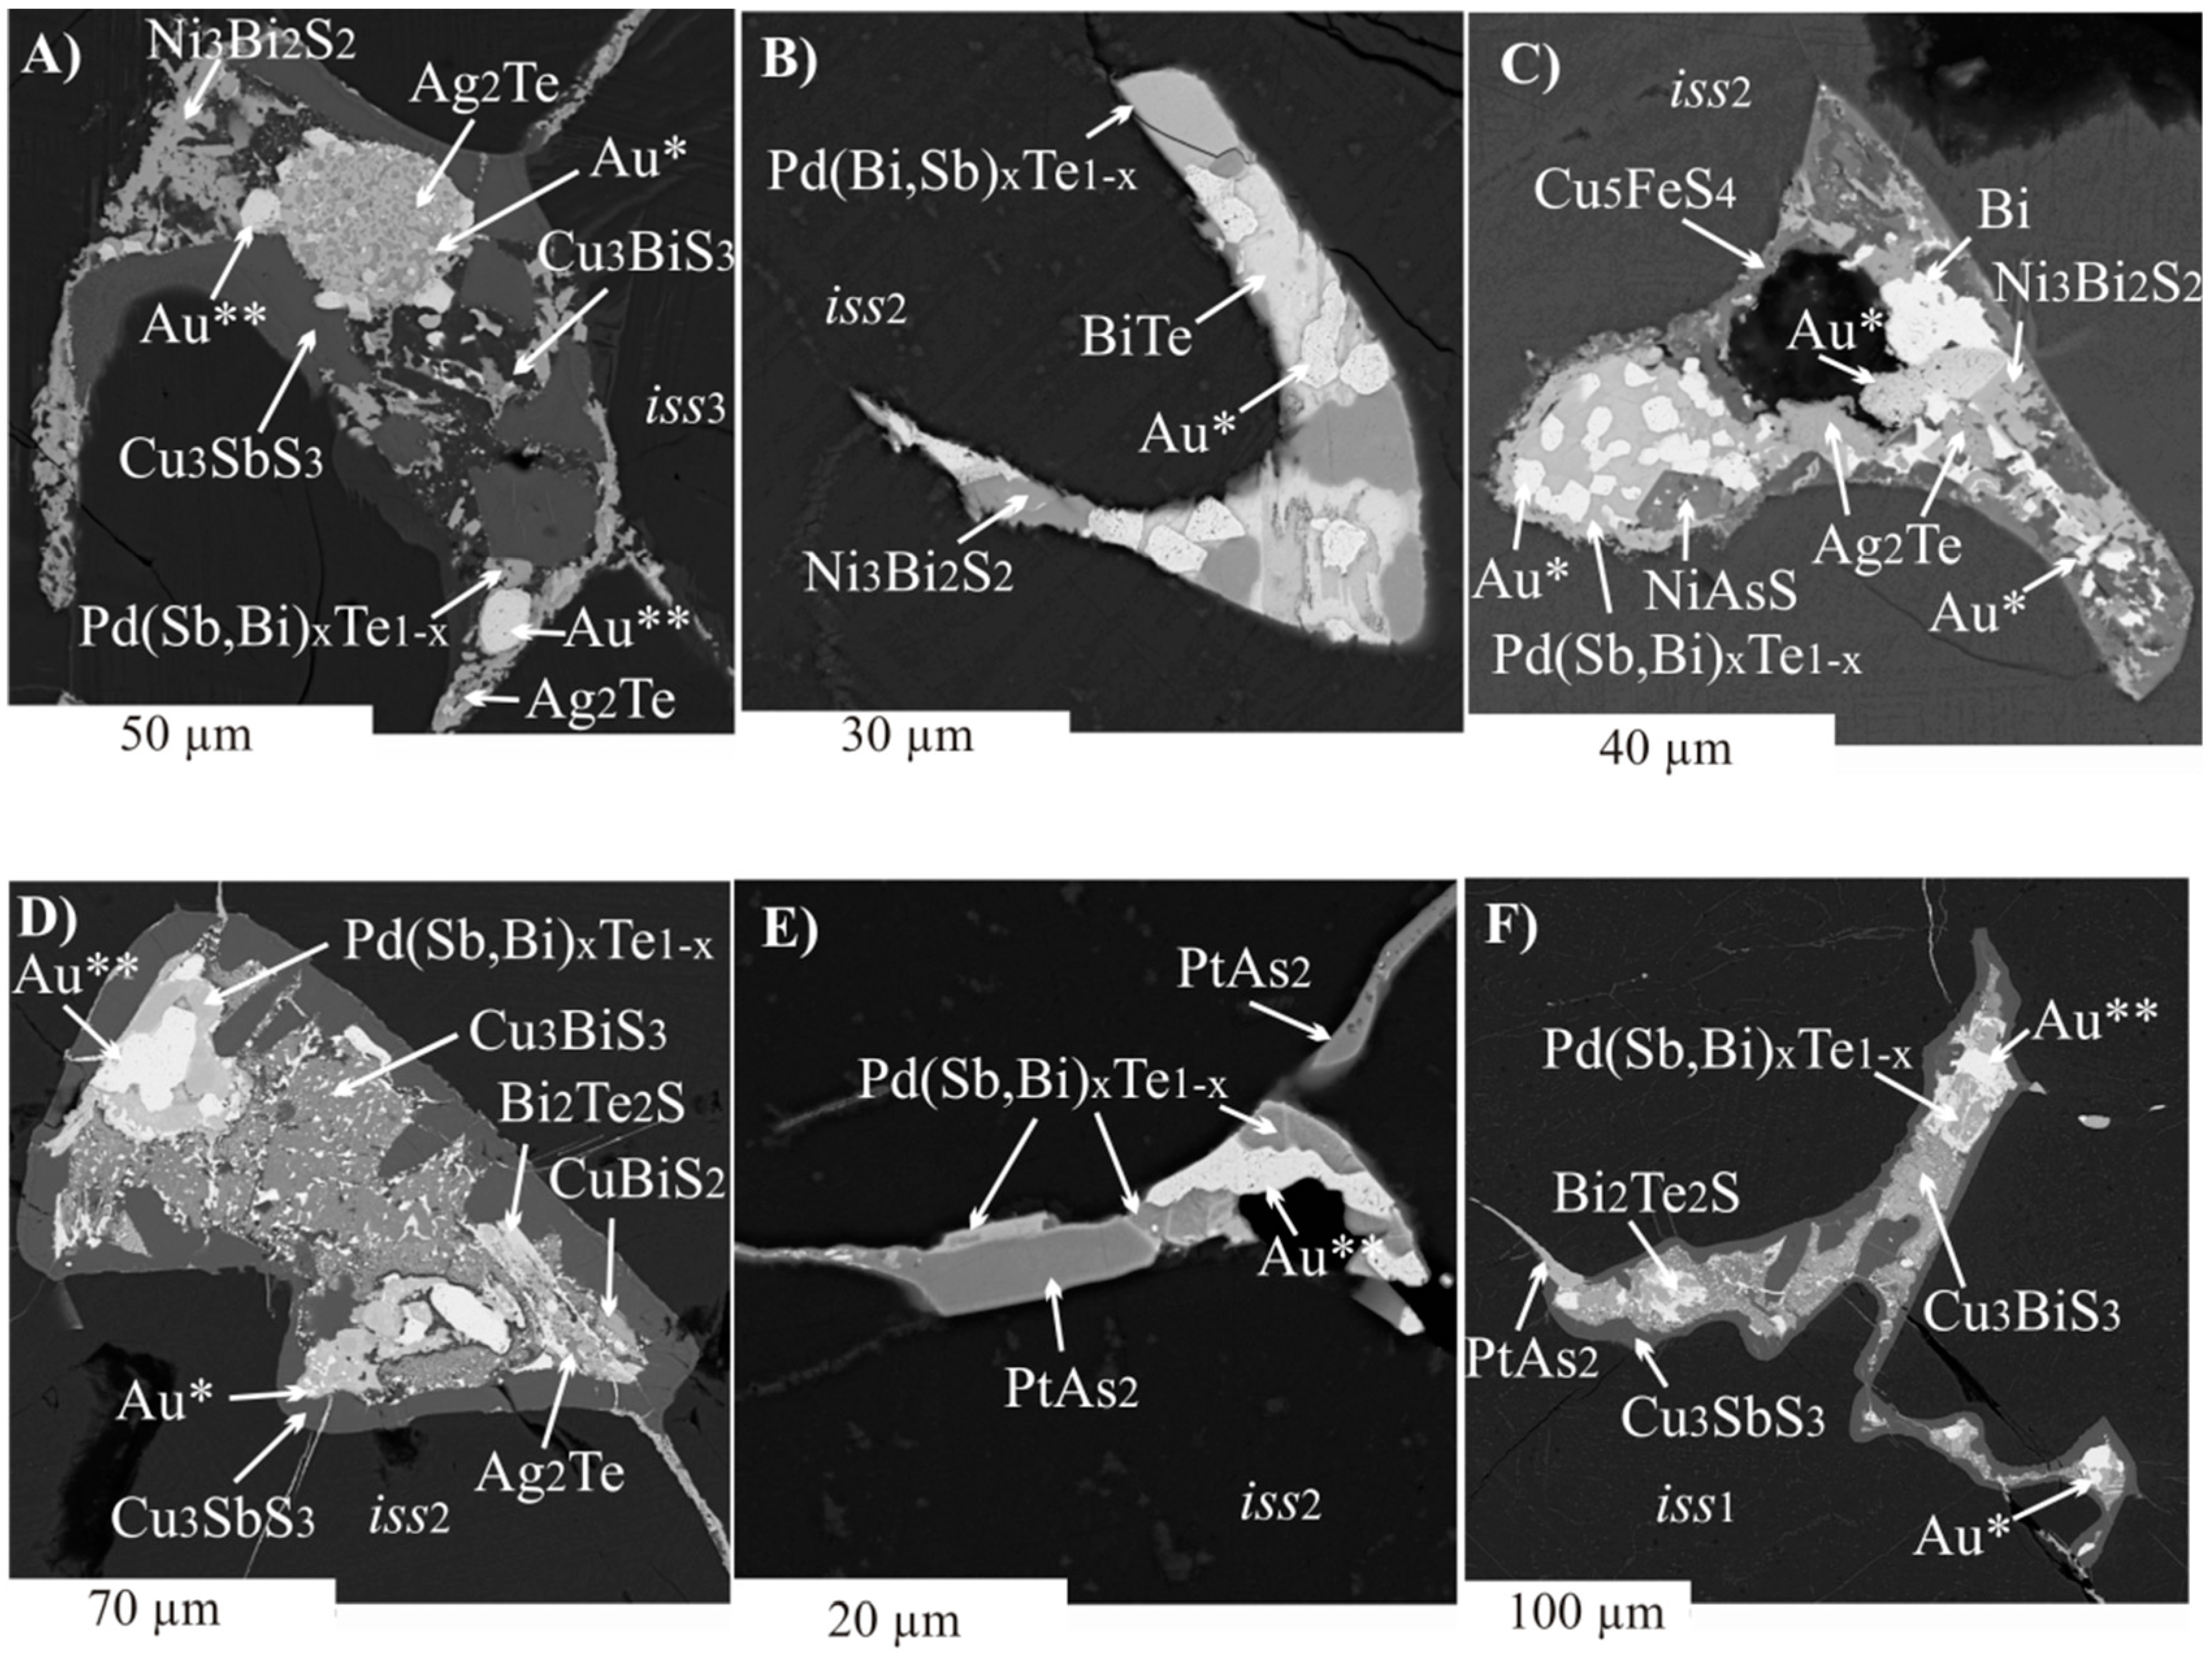
3.2.2. Inclusions of Minor Phases in BMS
4. Discussion
5. Conclusions
- It was shown that, in directed crystallization of melt, inclusions formed, which are similar to those observed in isothermal experiments and in sulfide ores. This is additional evidence that the minor contents of noble minerals and metalloids were present in the initial sulfide melt after its separation from the silicate melt. There is a probability of low-temperature platinum mineralization of sulfide ores as a result of hydrothermal processes but, most likely, it is realized in the aureoles of disseminated ores surrounding the massive ore bodies.
- For the first time, simultaneous formation of two types of liquids separated during cooling of the parent sulfide melt was revealed. In the first, noble metals associated with Bi, Sb, and Te are concentrated. The second is related to Cu and contains a large amount of S in addition to Bi and Sb.
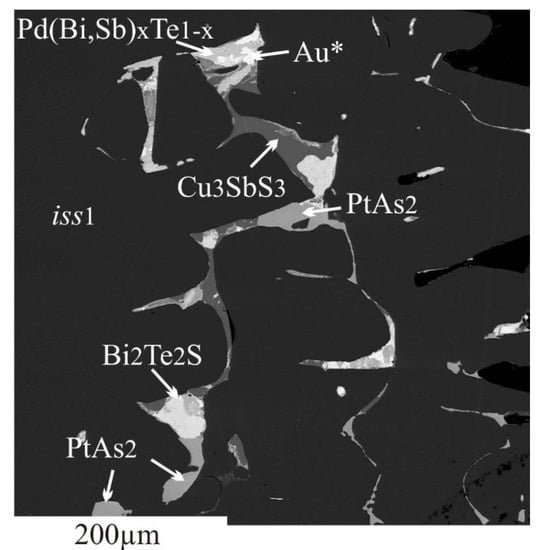
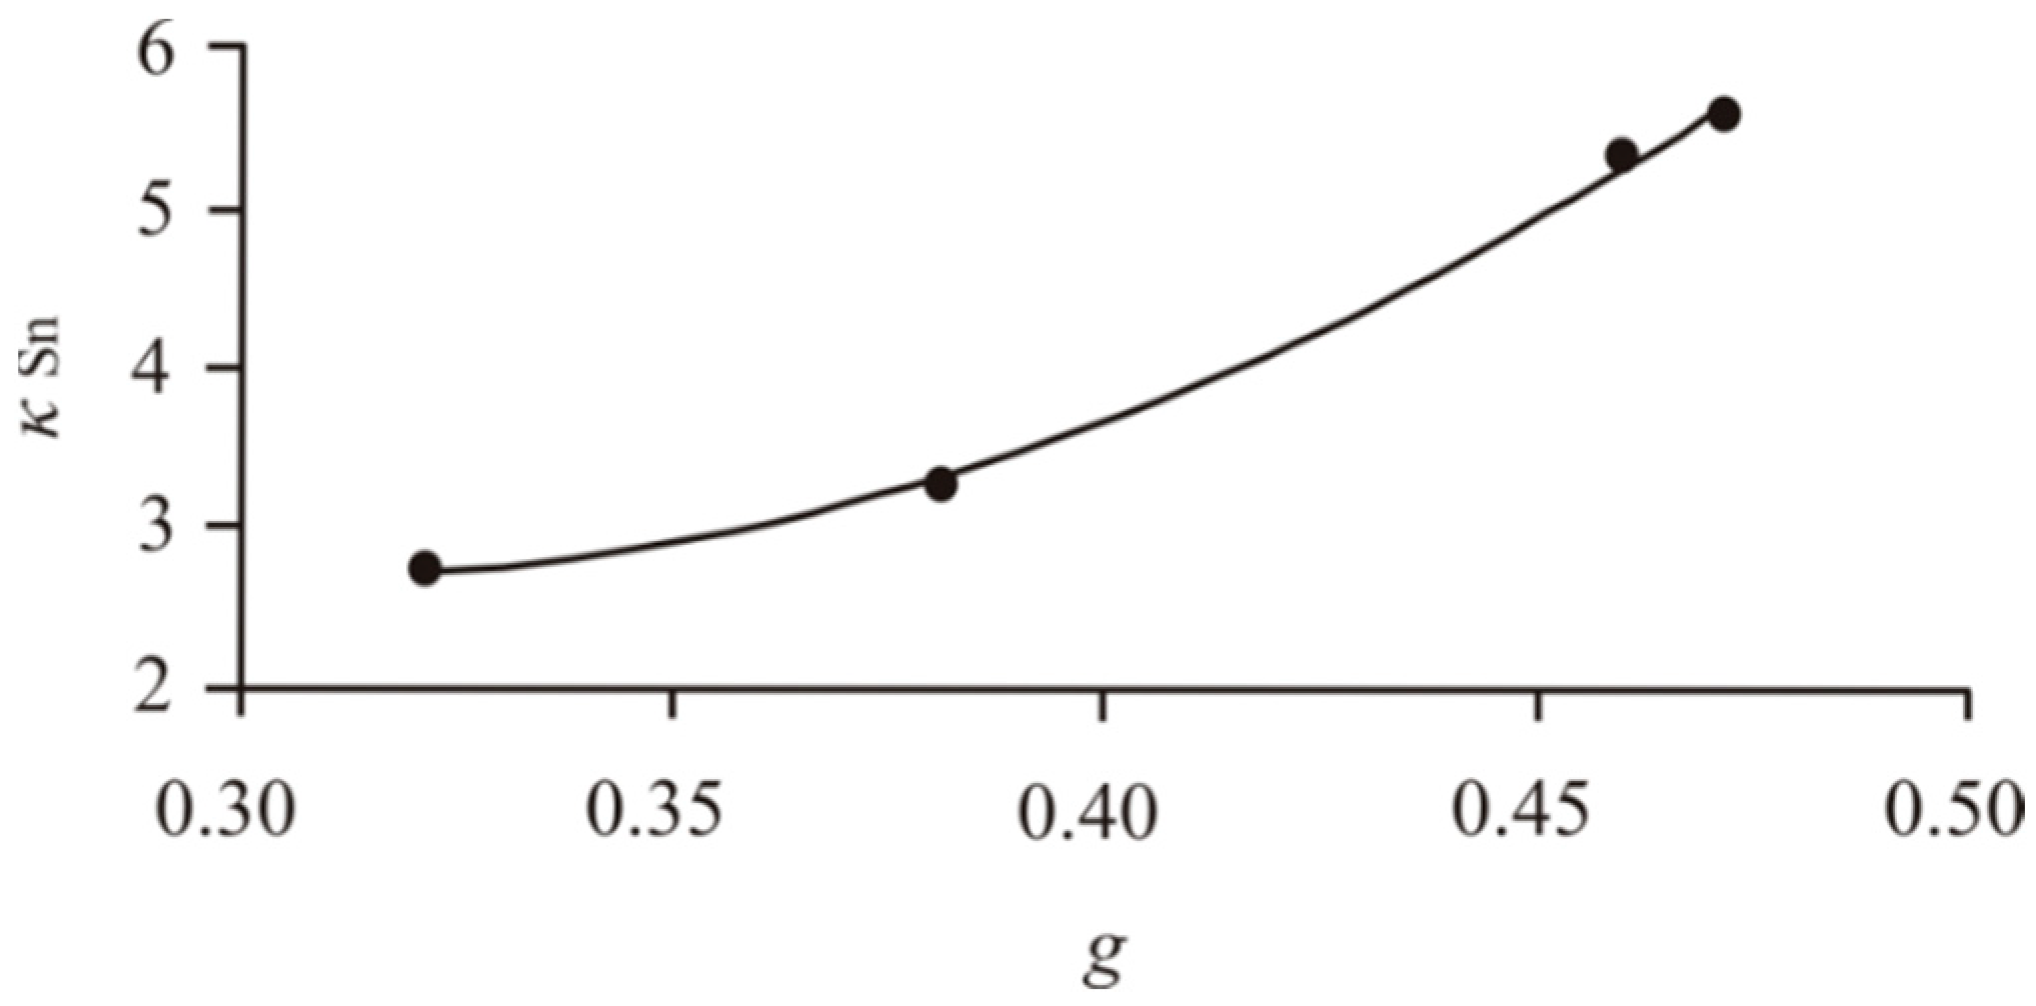
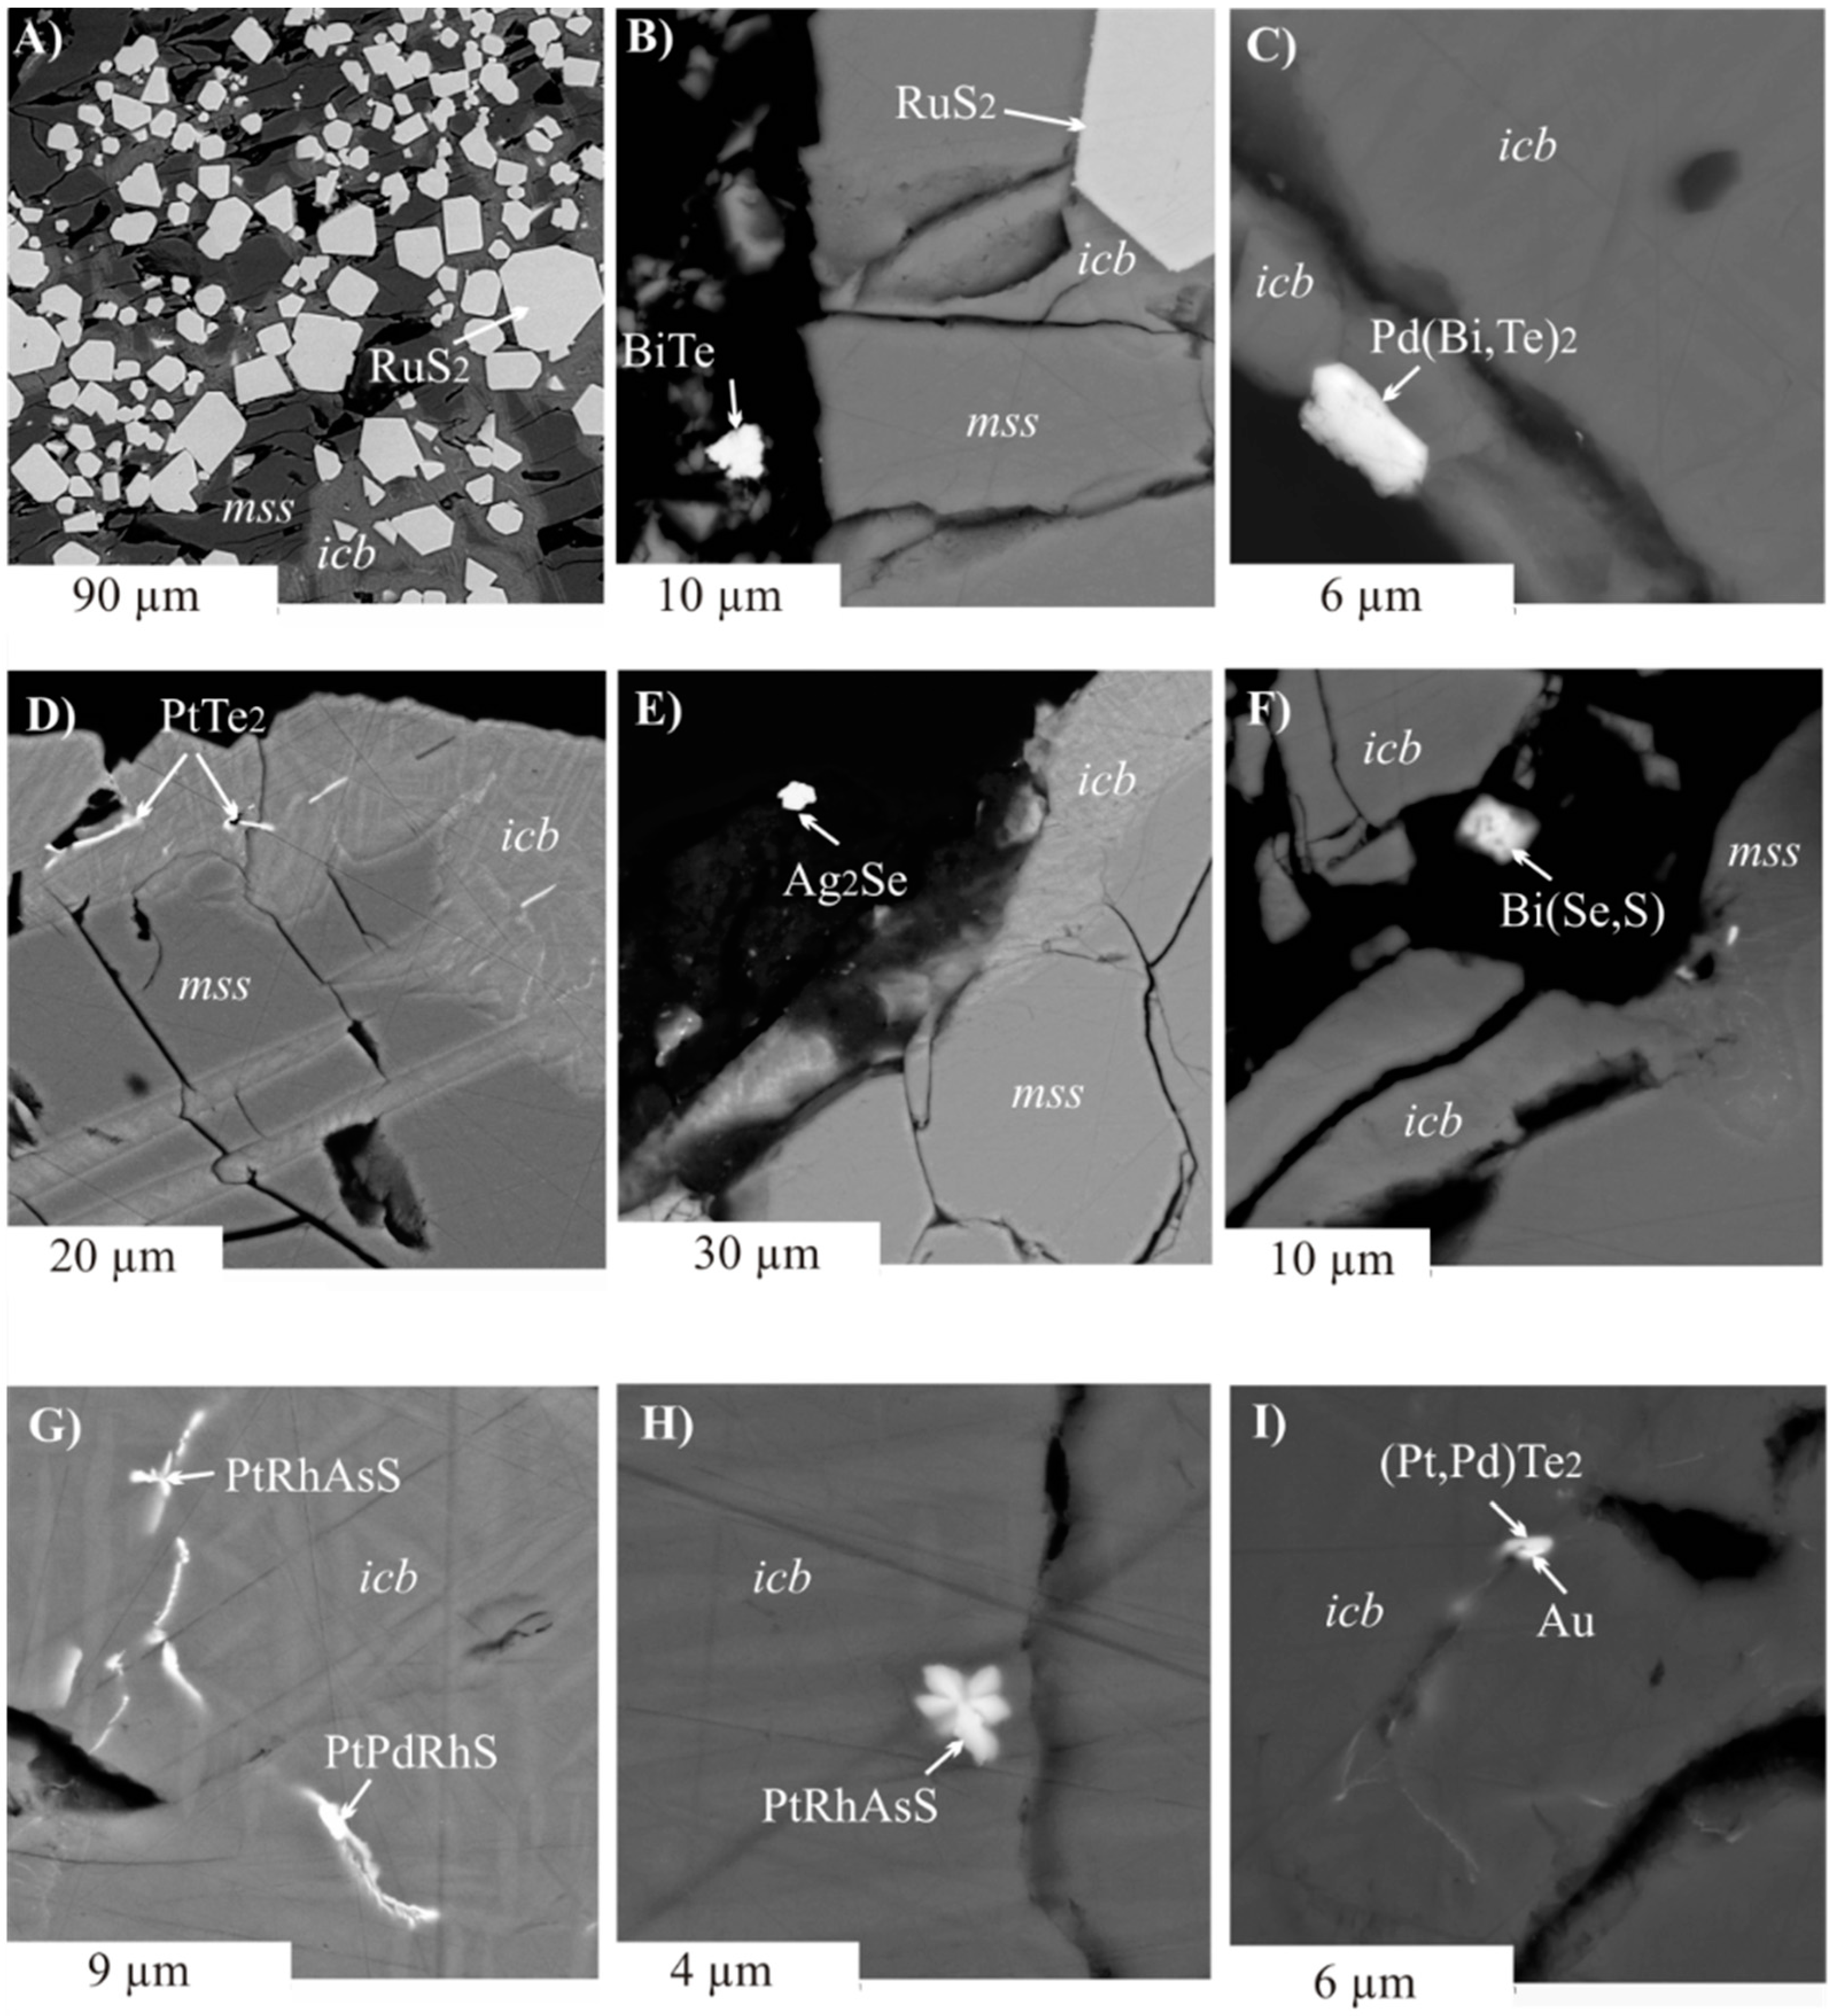
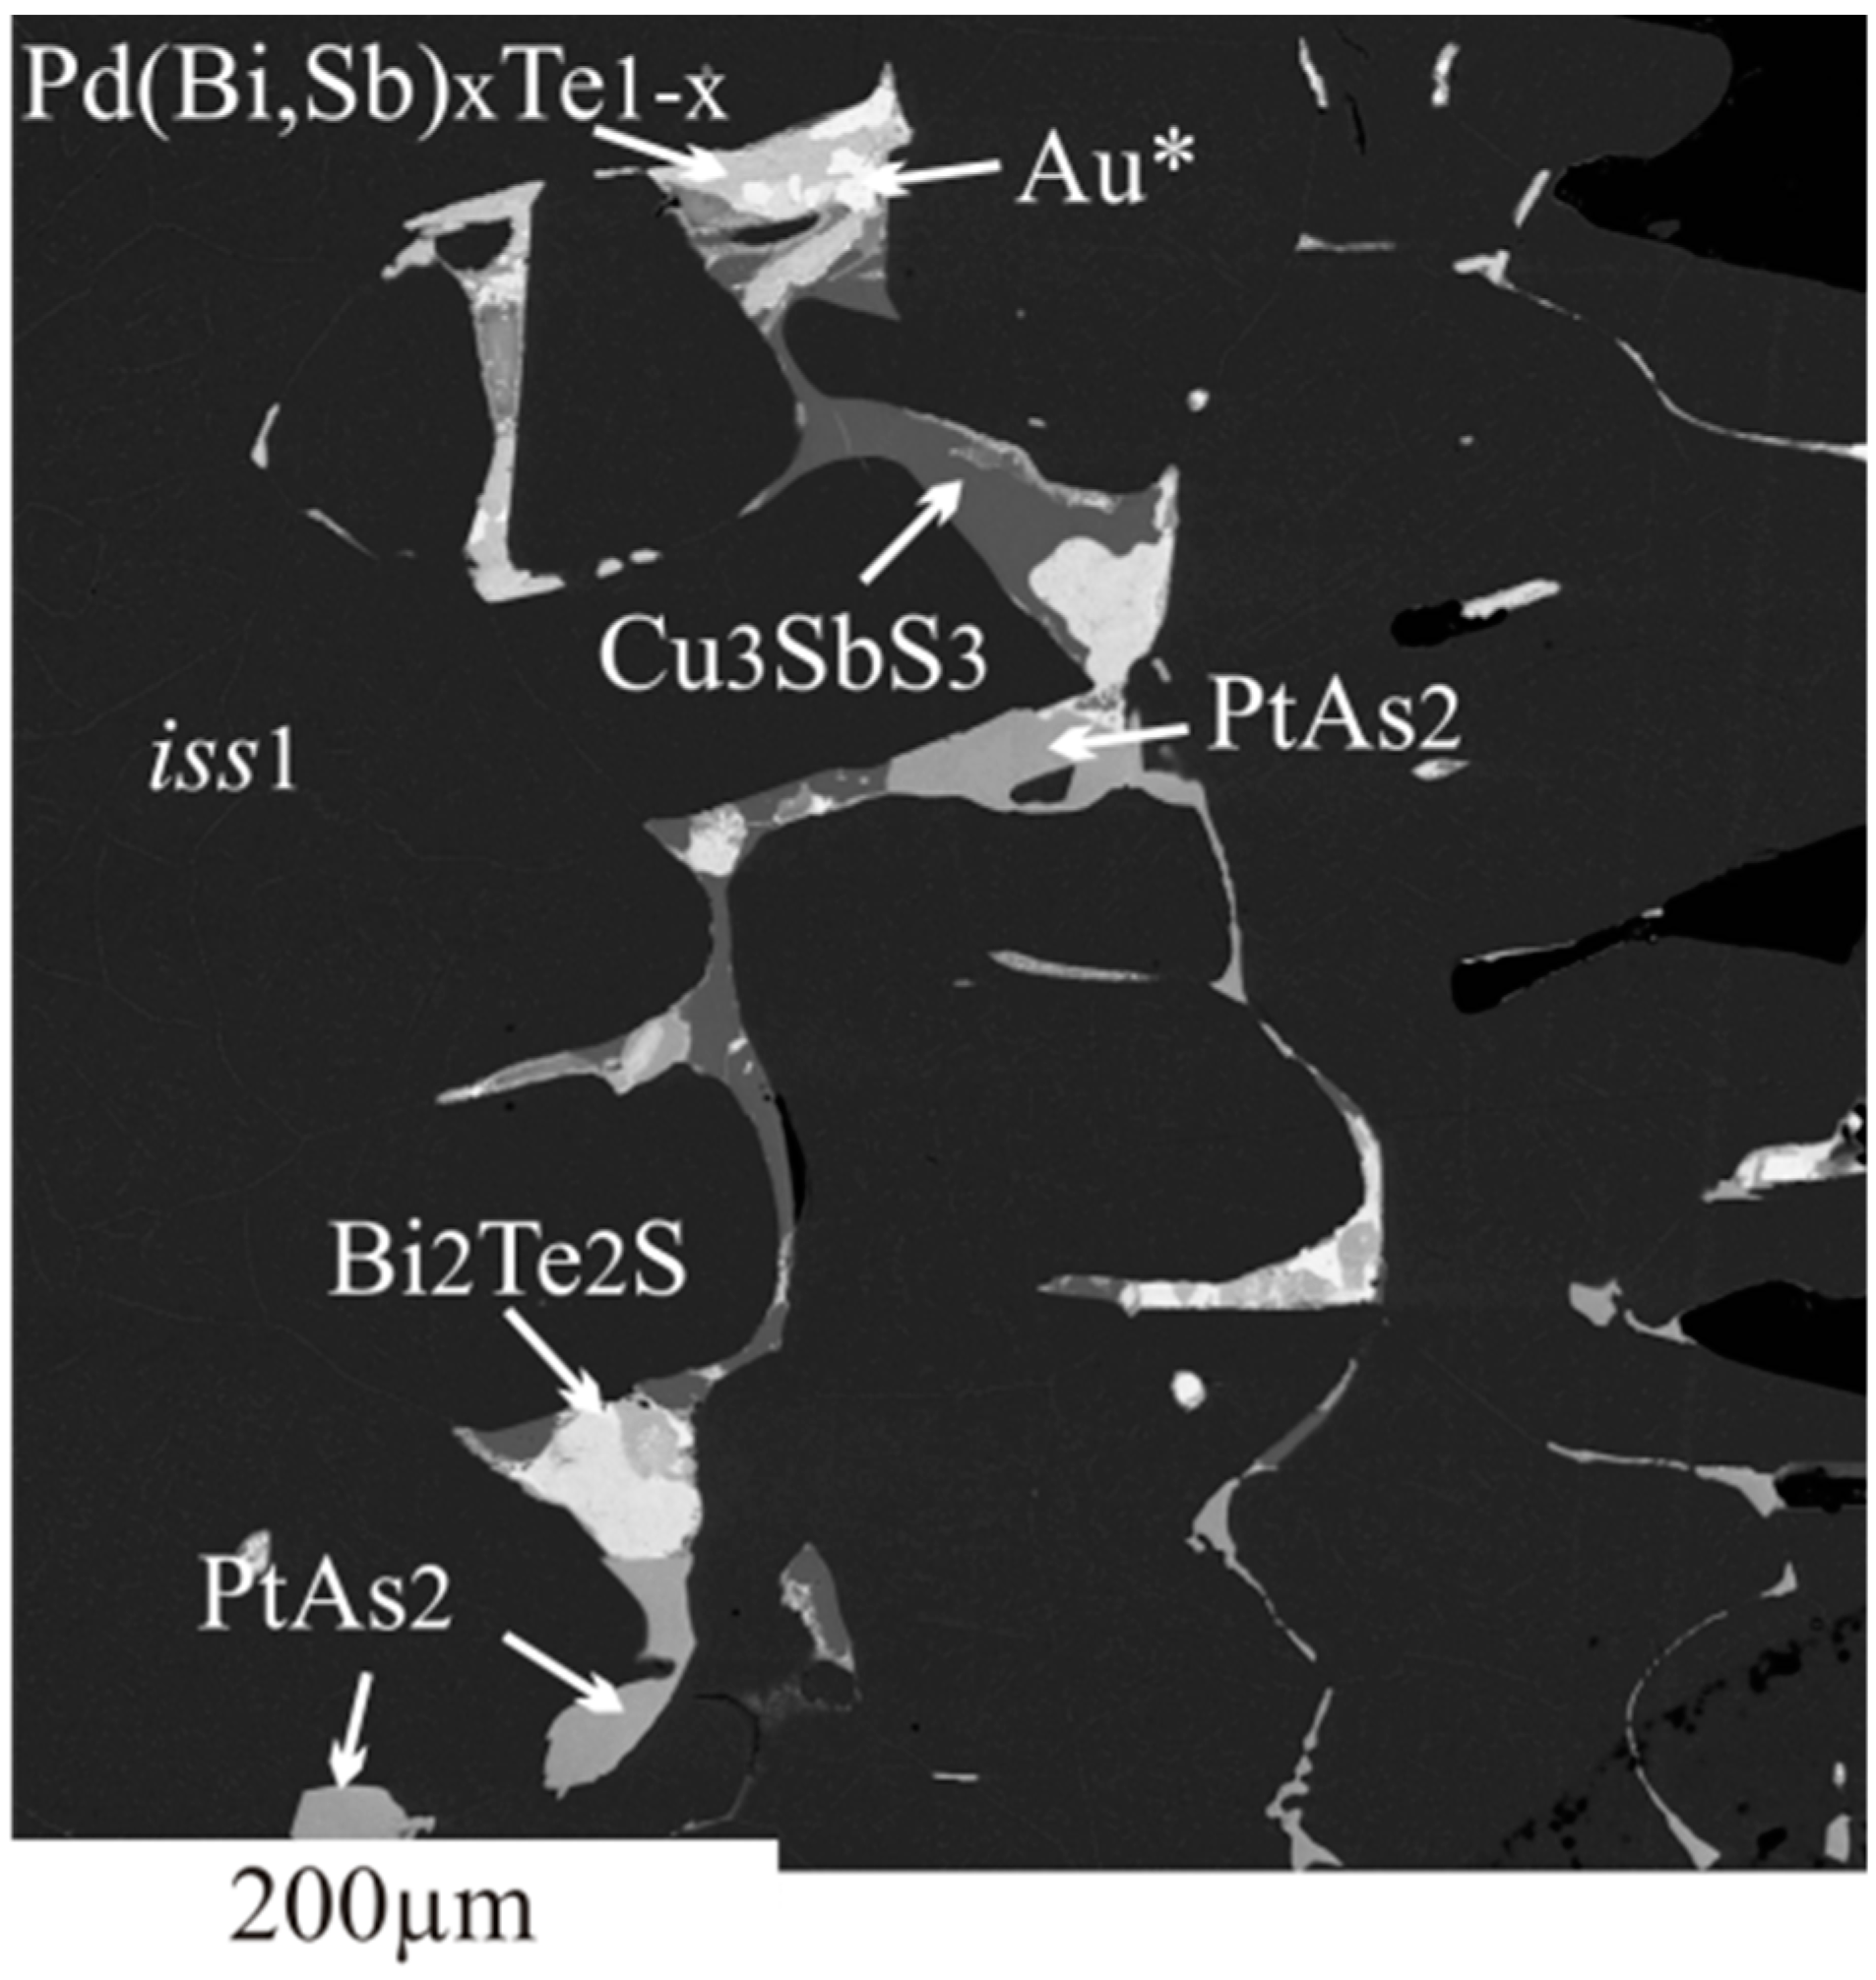
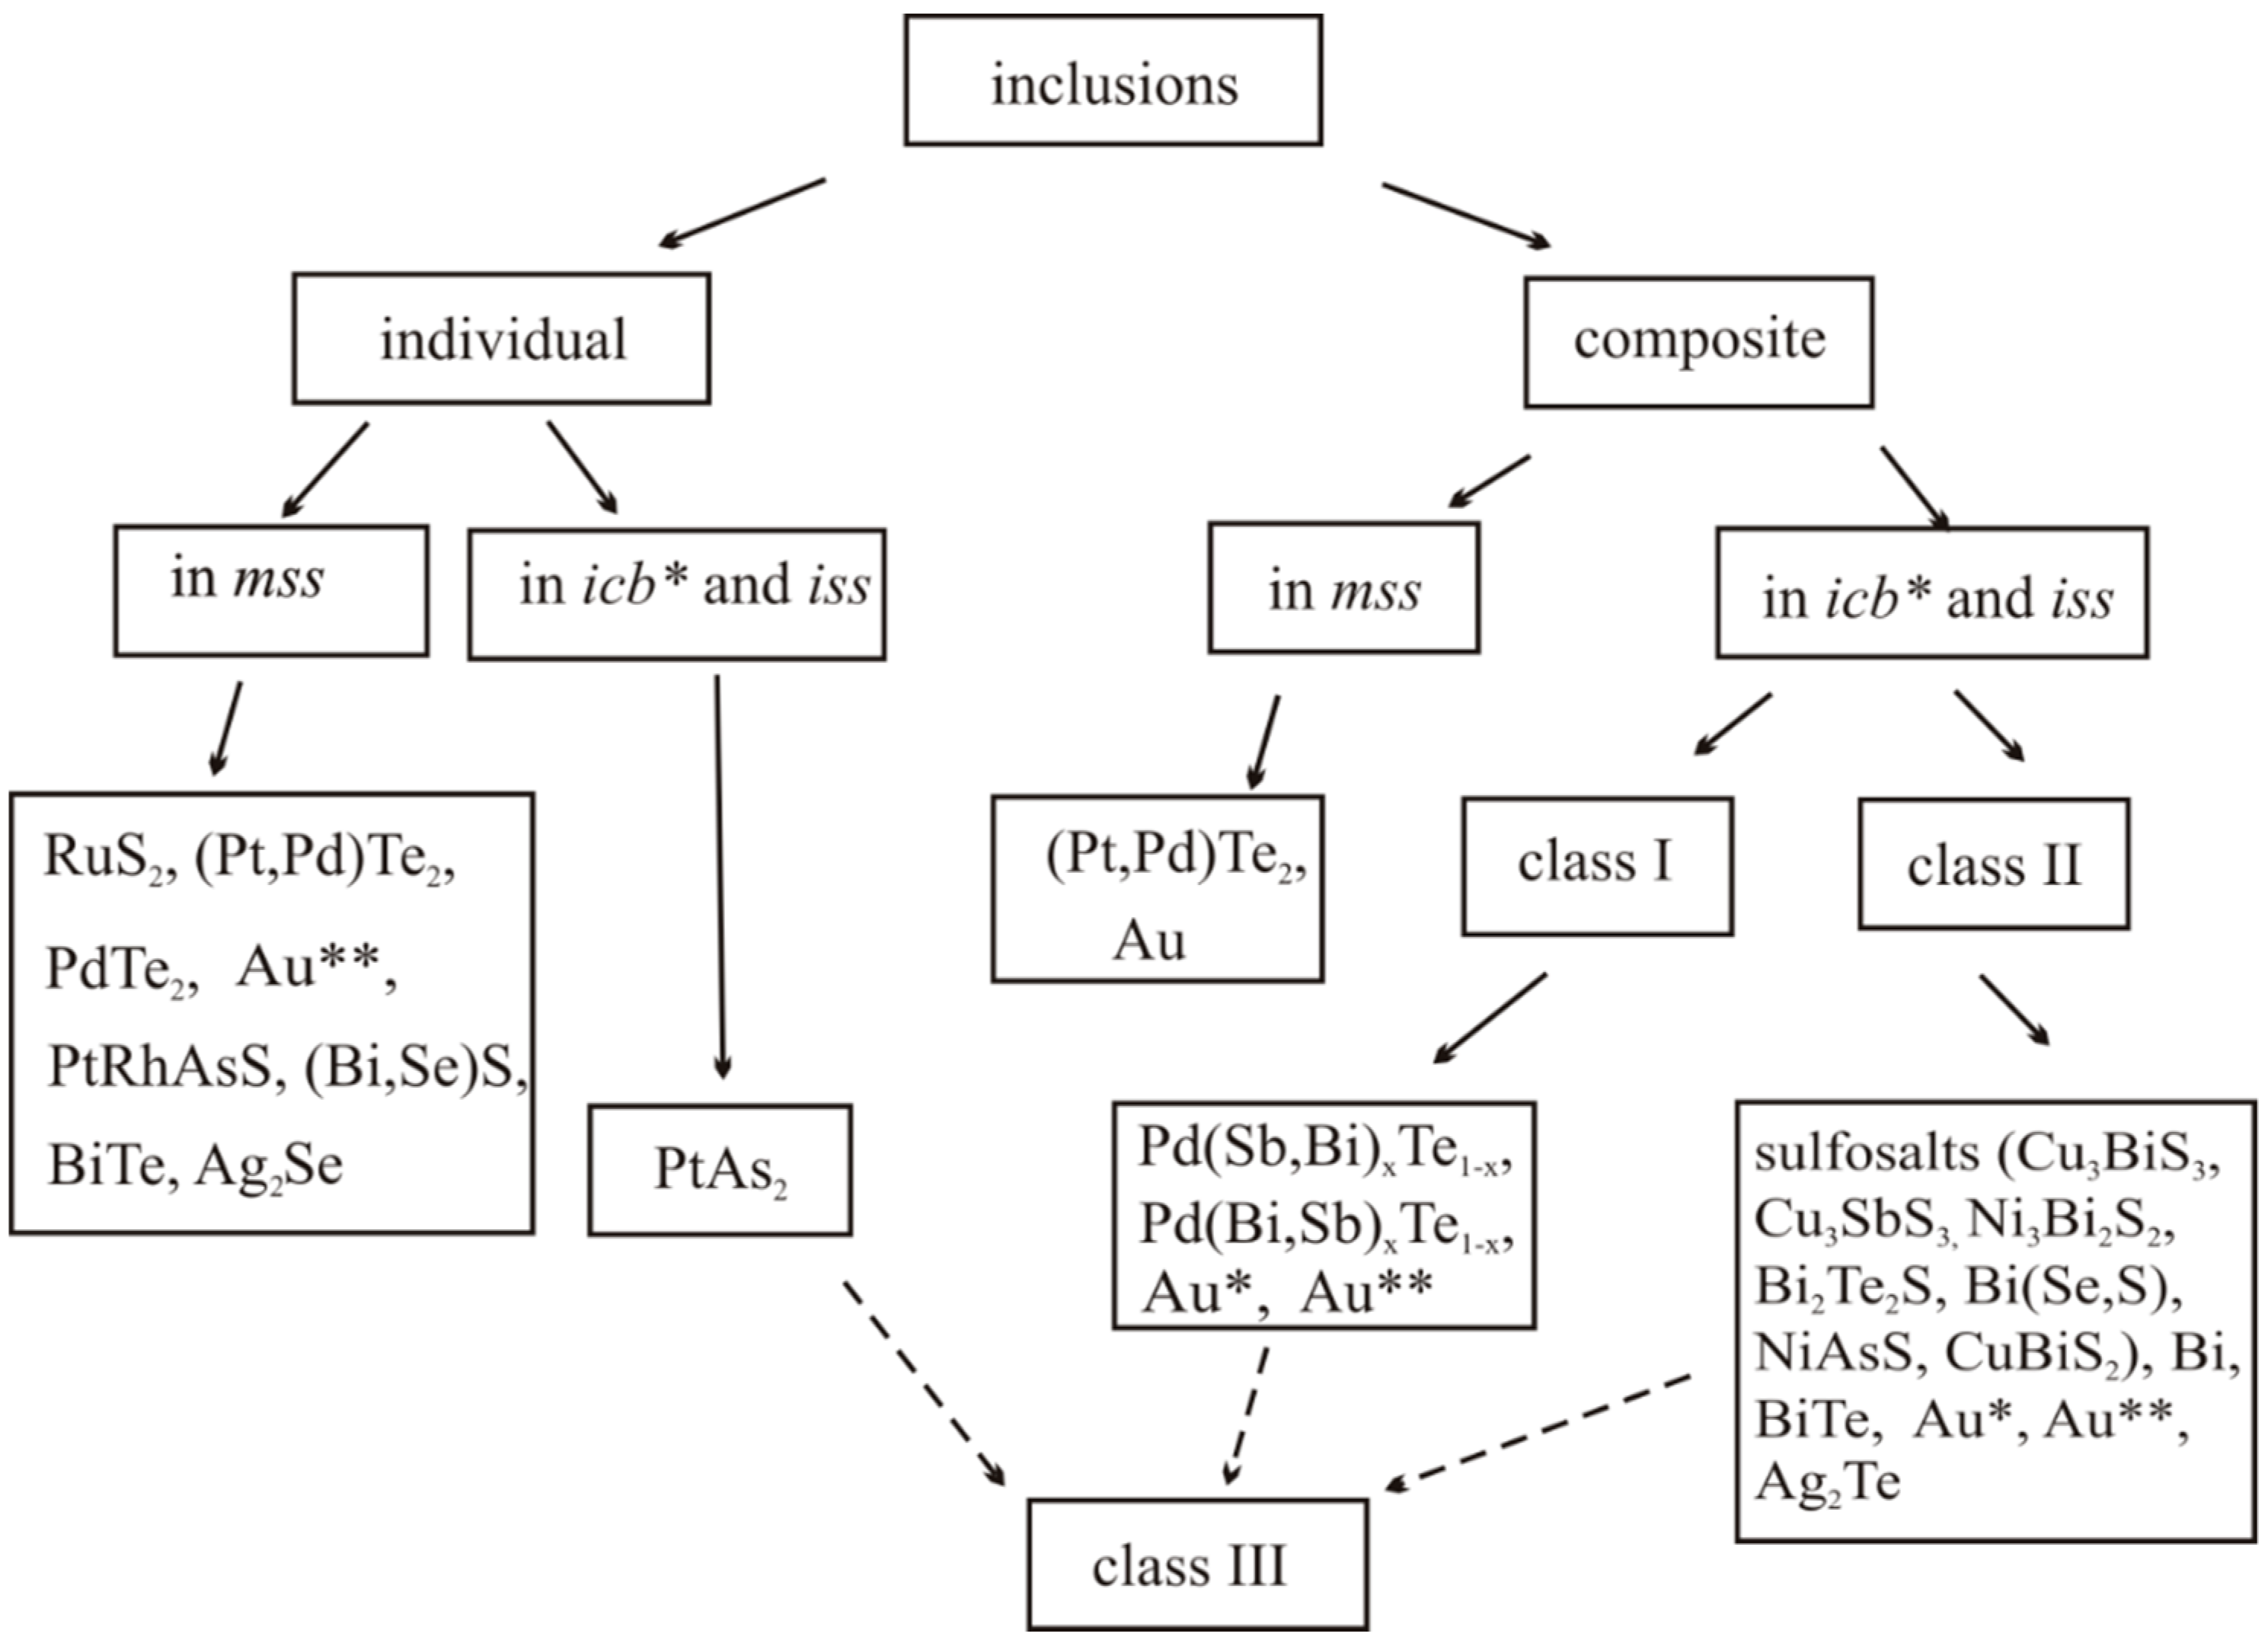
- We established the main types of inclusions formed during fractional crystallization of Pt-bearing sulfide melt. It was shown that noble metals are concentrated in inclusions in the form of RuS2, PdTe2, (Pt,Pd)Te2, PtRhAsS, and Ag2Se, Au** in mss and in the form of PtAs2, Au*, Au**, and Ag2Te, Pd(Bi,Sb)xTe1−x in icb* and iss. As solid solutions in the BMS sulfides, Rh is present in mss and Sn in iss.
Supplementary Materials
Author Contributions
Funding
Acknowledgments
Conflicts of Interest
References
- Genkin, A.D.; Distler, V.V.; Gladyshev, G.D.; Filimonova, A.A.; Evstigneeva, T.L.; Kovalenker, V.A.; Laputina, I.P.; Smirnov, A.V.; Grokhovskaya, T.L. Copper-Nickel Sulfide Ores of the Noril’sk Deposits; Nauka: Moscow, Russia, 1981; p. 234. (In Russian) [Google Scholar]
- Distler, V.V.; Grokhovskaia, T.L.; Evstigneyeva, T.L.; Sluzhenikin, S.F.; Filimonova, A.A.; Dyuzhikov, O.A.; Laputina, I.P. Petrology of the Sulphide Magmatic Ore-Formation; Nauka: Moscow, Russia, 1988; p. 230. (In Russian) [Google Scholar]
- Naldrett, A.J. Magmatic Sulfide Deposits: Geology, Geochemistry and Exploration; Springer: Berlin, Germany, 2004; p. 727. [Google Scholar]
- Duran, C.J.; Barnes, S.-J.; Pleše, P.; Prašek, M.K.; Zientek, M.L.; Pagé, P. Fractional crystallization-induced variations in sulfides from the Noril’sk-Talnakh mining district (polar Siberia, Russia). Ore Geol. Rev. 2017, 90, 326–351. [Google Scholar] [CrossRef]
- Vogt, I.H.L. Nickel in igneous rocks. Econ. Geol. 1923, 18, 307–353. [Google Scholar] [CrossRef]
- Craig, J.R.; Kullerud, G. Phase relations in the Cu-Fe-Ni-S system and their application to magmatic ore deposits. Econ. Geol. Monogr. 1969, 4, 344–358. [Google Scholar]
- Naldrett, A.J. Nickel sulfide deposits: Their classification, composition and genesis. Econ. Geol. 1981, 75th Anniversary, 628–685. [Google Scholar]
- Barnes, S.-J.; Makovicky, E.; Makovicky, M.; Rose-Hansen, J.; Karup-Moller, S. Partition coefficients for Ni, Cu, Pd, Pt, Rh, and Ir between monosulfide solid solution and sulfide liquid and the formation of compositionally zoned Ni-Cu sulfide bodies by fractional crystallization of sulfide liquid. Can. J. Earth Sci. 1997, 34, 366–374. [Google Scholar] [CrossRef]
- Mungall, J.E.; Andrews, D.R.A.; Cabri, L.J.; Sylvester, P.J.; Tubrett, M. Partitioning of Cu, Ni, Au, and platinum-group elements between monosulfide solid solution and sulfide melt under controlled oxygen and sulfur fugacities. Geochim. Cosmochim. Acta 2005, 69, 4349–4360. [Google Scholar] [CrossRef]
- Distler, V.V. Platinum mineralization of the Noril’sk deposits. In Geology and Genesis of Platinoid Deposits; Nauka: Moscow, Russia, 1994; pp. 7–35. (In Russian) [Google Scholar]
- Kosyakov, V.I.; Sinyakova, E.F.; Distler, V.V. Experimental simulation of phase relationships and zoning of magmatic nickel-copper sulfide ores, Russia. Geol. Ore Depos. 2012, 54, 179–208. [Google Scholar] [CrossRef]
- Kosyakov, V.I.; Sinyakova, E.F. Melt crystallization of CuFe2S3 in the Cu-Fe-S system. J. Therm. Anal. Calorim. 2014, 115, 511–516. [Google Scholar] [CrossRef]
- Kosyakov, V.I.; Sinyakova, E.F. Study of crystallization of nonstoichiometric isocubanite Cu1.1Fe2.0S3.0 from melt in the system Cu-Fe-S. J. Therm. Anal. Calorim. 2017, 129, 623–628. [Google Scholar] [CrossRef]
- Kosyakov, V.I.; Sinyakova, E.F. Experimental modeling of pentlandite-bornite ore formation. Russ. Geol. Geophys. 2017, 58, 1211–1221. [Google Scholar] [CrossRef]
- Sinyakova, E.F.; Kosyakov, V.I. Experimental modeling of zoning in copper-nickel sulfide ores. Dokl. Earth Sci. 2007, 417A, 1380–1385. [Google Scholar] [CrossRef]
- Sinyakova, E.F.; Kosyakov, V.I. Experimental modeling of zonality of copper-rich sulfide ores in copper-nickel deposits. Dokl. Earth Sci. 2009, 427, 787–792. [Google Scholar] [CrossRef]
- Sinyakova, E.F.; Kosyakov, V.I. The behavior of noble-metal admixtures during fractional crystallization of As- and Co-containing Cu-Fe-Ni sulfide melts. Russ. Geol. Geophys. 2012, 53, 1055–1076. [Google Scholar] [CrossRef]
- Sinyakova, E.; Kosyakov, V.; Distler, V.; Karmanov, N. Behavior of Pt, Pd, and Au during crystallization of Cu-rich magmatic sulfides. Can. Mineral. 2016, 54, 491–509. [Google Scholar] [CrossRef]
- Sinyakova, E.F.; Kosyakov, V.I.; Borisenko, A.S.; Karmanov, N.S. Behavior of noble metals during fractional crystallization of Cu-Fe-Ni-(Pt, Pd, Rh, Ir, Ru, Ag, Au, Te) sulfide melts. Russ. Geol. Geophys. 2019, 60, 642–651. [Google Scholar]
- Vaulin, L.L.; Sukhanova, E.N. Oktyabr’skoe copper-nickel deposit. Razved. i Okhrana Nedr 1970, 4, 48–51. (In Russian) [Google Scholar]
- Genkin, A.D.; Evstigneyeva, T.L. Associations of platinum-group minerals of the Noril’sk cooper-nickel sulfide ores. Econ. Geol. 1986, 81, 1203–1212. [Google Scholar] [CrossRef]
- Distler, V.V.; Sluzhenikin, S.F.; Cabri, L.J.; Krivolutskaya, N.A.; Turovtsev, D.M.; Golovanova, T.A.; Mokhov, A.V.; Knauf, V.V.; Oleshkevich, O.I. Platinum ores of the Noril’sk layered intrusions: Magmatic and fluid concentration of noble metals. Geol. Ore Depos. 1999, 41, 241–265. [Google Scholar]
- Barnes, S.-J.; Cox, R.A.; Zientek, M.L. Platinum-group element, gold, silver and base metal distribution in compositionally zoned sulfide droplets from the Medvezky Creek mine, Noril’sk, Russia. Contrib. Mineral. Petrol. 2006, 152, 187–200. [Google Scholar] [CrossRef]
- Spiridonov, E.M.; Gritsenko, Y.D. Epigenetic Low-Grade Metamorphism and Co-Ni-Sb-As Mineralization in the Noril’sk Ore Field; Nauchnyi Mir: Moscow, Russia, 2009; p. 218. (In Russian) [Google Scholar]
- Holwell, D.A.; McDonald, I. A review of the behavior of platinum group elements within natural magmatic sulfide ore systems. Platin. Met. Rev. 2010, 54, 26–36. [Google Scholar] [CrossRef]
- Czamanske, G.K.; Kunilov, V.E.; Zientek, M.L.; Cabri, L.J.; Likchachev, A.P.; Calk, L.C.; Oscarson, R. A proton-microprobe study of magmatic sulfide ores from the Noril’sk-Talnakh district, Siberia. Can. Mineral. 1992, 30, 249–287. [Google Scholar]
- Cabri, L.J. The Geology, Geochemistry, Mineralogy and Mineral Beneficiation of Platinum-Group Elements; Canadian Institute of Mining, Metallurgy and Petroleum: Montreal, QC, Canada, 2002; Volume 54, pp. 13–129. [Google Scholar]
- Kozyrev, S.M.; Komarova, M.Z.; Emelina, L.N.; Oleshkevich, O.I.; Yakovleva, O.A.; Lyalinov, D.V.; Maximov, V.I. The mineralogy and behavoiur of PGM during processing of the Noril’sk-Talnakh PGE-Cu-Ni-ores. In The Geology, Geochemistry, Mineralogy and Mineral Beneficiation of Platinum-Group Elements; Canadian Institute of Mining, Metallurgy and Petroleum: Montreal, QC, Canada, 2002; Volume 54, pp. 757–775. [Google Scholar]
- Sluzhenikin, S.; Mokhov, A. Gold and silver in PGE-Cu-Ni and PGE ores of the Noril’sk deposits, Russia. Miner. Depos. 2015, 50, 465–492. [Google Scholar] [CrossRef]
- Peregoedova, A.; Ohnenstetter, M. Collectors of Pt, Pd and Rh in a S-poor Fe-Ni-Cu sulfide system at 760 °C: Experimental data and application to ore deposits. Can. Mineral. 2002, 40, 527–561. [Google Scholar] [CrossRef]
- Peregoedova, A.; Barnes, S.-J.; Baker, D.R. The formation of Pt-Ir alloys and Cu-Pd-rich sulfide melts by partial desulfurization of Fe-Ni-Cu sulfides: Results of experiments and implications for natural systems. Chem. Geol. 2004, 208, 247–264. [Google Scholar] [CrossRef]
- Peregoedova, A.; Barnes, S.-J.; Baker, D.R. An experimental study of mass transfer of platinum-group elements, gold, nickel and copper in sulfur-dominated vapor at magmatic temperatures. Chem. Geol. 2006, 235, 59–75. [Google Scholar] [CrossRef]
- Distler, V.V.; Sinyakova, E.F.; Kosyakov, V.I. Behavior of noble metals upon fractional crystallization of copper-rich sulfide melts. Dokl. Earth Sci. 2016, 469, 811–814. [Google Scholar] [CrossRef]
- Cafagna, F.; Jugo, P.J. An experimental study on the geochemical behavior of highly siderophile elements (HSE) and metalloids (As, Se, Sb, Te, Bi) in a mss-iss-pyrite system at 650 °C: A possible magmatic origin for Co-HSE-bearing pyrite and the role of metalloid-rich phases in the fractionation of HSE. Geochim. Cosmochim. Acta 2016, 178, 233–258. [Google Scholar]
- Bai, L.; Barnes, S.-J.; Baker, D.R. Sperrylite saturation in magmatic sulfide melts: Implications for formation of PGE-bearing arsenides and sulfarsenides. Am. Mineral. 2017, 102, 966–974. [Google Scholar] [CrossRef]
- Makovicky, E. Ternary and quaternary phase systems with PGE. In The Geology, Geochemistry, Mineralogy and Mineral Beneficiation of Platinum-Group Elements; Canadian Institute of Mining, Metallurgy and Petroleum: Montreal, QC, Canada, 2002; Volume 54, pp. 131–175. [Google Scholar]
- Ballhaus, C.; Tredoux, M.; Spath, A. Phase relations in the Fe-Ni-Cu-PGE-S system at magmatic temperature and application to massive sulphide ores of the sudbury igneous complex. J. Petrol. 2001, 42, 1911–1926. [Google Scholar] [CrossRef]
- Helmy, H.M.; Ballhaus, C.; Berndt, J.; Bockrath, C.; Wohlgemuth-Ueberwasser, C. Formation of Pt, Pd and Ni tellurides: Experiments in sulfide-telluride systems. Contrib. Mineral. Petrol. 2007, 153, 557–591. [Google Scholar] [CrossRef]
- Helmy, H.M.; Ballhaus, C.; Fonseca, R.O.C.; Wirth, R.; Nagel, T.J.; Tredoux, M. Noble metal nanoclusters and nanoparticles precede mineral formation in magmatic sulfide melts. Nat. Commun. 2013, 4. [Google Scholar] [CrossRef] [PubMed]
- Karup-Moller, S.; Makovicky, E.; Barnes, S.-J. The metal-rich portions of the phase system Cu-Fe-Pd-S at 1000 °C, 900 °C and 725 °C: Implications for mineralization in the Skaergaard intrusion. Mineral. Mag. 2008, 72, 941–951. [Google Scholar] [CrossRef]
- Vymazalova, A.; Laufek, F.; Kristavchuk, A.V.; Drabek, M. The system Ag-Pd-Te phase relation and mineral assemblages. Mineral. Mag. 2015, 79, 1813–1832. [Google Scholar] [CrossRef]
- Sinyakova, E.F.; Kosyakov, V.I.; Borisenko, A.S. Effect of the presence of As, Bi, and Te on the behavior of Pt metals during fractionation crystallization of sulfide magma. Dokl. Earth Sci. 2017, 477, 1422–1425. [Google Scholar] [CrossRef]
- Fleet, M.E.; Pan, Y. Fractional crystallization of anhydrous sulfide liquid in the system Fe-Ni-Cu-S, with application to magmatic sulfide deposits. Geochim. Cosmochim. Acta 1994, 58, 3369–3377. [Google Scholar] [CrossRef]
- Ebel, D.S.; Naldrett, A.J. Crystallization of sulfide liquids and interpretation of ore composition. Can. J. Earth Sci. 1997, 34, 352–365. [Google Scholar] [CrossRef]
- Helmy, H.M.; Ballhaus, C.; Wohlgemuth-Ueberwasser, C.; Fonseca, R.O.C.; Laurenz, V. Partitioning of Se, As, Sb, Te and Bi between monosulfide solid solution and sulfide melt—Application to magmatic sulfide deposits. Geochim. Cosmochim. Acta 2010, 74, 6174–6179. [Google Scholar] [CrossRef]
- Liu, Y.; Brenan, J. Partitioning of platinum-group elements (PGE) and chalcogens (Se, Te, As, Sb, Bi) between monosulfide-solid solution (MSS), intermediate solid solution (ISS) and sulfide liquid at controlled fO2–fS2 conditions. Geochim. Cosmochim. Acta 2015, 159, 139–161. [Google Scholar] [CrossRef]
- Sinyakova, E.F.; Kosyakov, V.I.; Nenashev, B.G. Coefficients of rhodium partition between melt and monosulfide solid solution during directional crystallization of melt in the Fe-FeS-NiS-Ni system. Dokl. Earth Sci. 2004, 397, 649–653. [Google Scholar]
- Cook, N.J.; Ciobanu, L.; Merkle, R.K.W.; Bernhardt, H.-J. New data on sobolevskite, taimyrite and Pt2CuFe (tulameenite?) in complex massive talnakhite ore, Noril’sk orefield, Russia. Can. Mineral. 2002, 40, 329–340. [Google Scholar] [CrossRef][Green Version]
- Massalski, T.B.; Okamoto, H.; Subramanian, P.R.; Kacprzak, L. Binary Alloy Phase Diagrams, 2nd ed.; ASM International, Materials Park: Novelty, OH, USA, 1990; p. 3242. [Google Scholar]
- Effenberg, G.; Ilyenko, S. Ternary alloy systems. Noble metal systems. Selected systems from Ag-Al-Zn to Rh-Ru-Sc, Landolf-Börnstein—Group IV. Phys. Chem. 2006, 11B. [Google Scholar] [CrossRef]
- Barnes, S.-J.; Ripley, E.M. Highly siderophile and strongly chalcophile elements in magmatic ore deposits. Rev. Mineral. Geochem. 2016, 81, 725–774. [Google Scholar] [CrossRef]
- Okamoto, H. Pd-Te (Palladium-Tellurium). J. Phase Equilibria Diffus. 2013, 34, 72–73. [Google Scholar] [CrossRef]
- Ilyasheva, N.A. Study of the Cu2S-Sb2S3 system at 320–400 °C. Neorg. Mater. 1973, 9, 677–679. [Google Scholar]
- Malevskii, A.Y. Study of the system Cu-Bi-S. In Proceedings of the Meeting on Experimental and Technical Mineralogy and Petrography; Nauka: Moscow, Russia, 1971; pp. 302–308. (In Russian) [Google Scholar]
- Ilyasheva, N.A. Specific features of crystallization of tetrahedrite in the Cu-Sb-S system. Neorg. Mater. 1984, 20, 563–568. (In Russian) [Google Scholar]
- Krachek, F.C.; Ksanda, C.J.; Cabri, L.J. Phase relations in the silver-tellurium system. Am. Mineral. 1966, 51, 14–28. [Google Scholar]
- Evstigneeva, T.L.; Genkin, A.D.; Kovalenker, V.A. A new bismuthide of palladium, sobolevskite, and the nomenclature of minerals of the system PdBi-PdTe-PdSb. Zapiski Vses. Mineralog. Obshch. 1975, 104, 568–579. (In Russian) [Google Scholar] [CrossRef]
- Dare, S.A.S.; Barnes, S.-J.; Prichard, H.M.; Fisher, P.C. The timing and formation of platinum-group minerals from the Creigton Ni-Cu-Platinum-group elements sulfide deposit, Sudbury, Canada: Early crystallization of PGE-rich sulfarsenides. Econ. Geol. 2010, 105, 1071–1096. [Google Scholar] [CrossRef]
- Dare, S.A.S.; Barnes, S.-J.; Prichard, H.M.; Fisher, P.C. Chalcophile and platinum-group element (PGE) concentrations in the sulfide minerals from the McCreedy East deposit, Sudbury, Canada, and the origin of PGE in pyrite. Miner. Depos. 2011, 46, 381–407. [Google Scholar] [CrossRef]
- Dare, S.A.S.; Barnes, S.-J.; Prichard, H.M.; Fisher, P.C. Mineralogy and geochemistry of Cu-Rich ores from the McCreedy East Ni-Cu-PGE deposit (Sudbury, Canada): Implications for the behavior of platinum group and chalcophile elements at the end of crystallization of a sulfide liquid. Econ. Geol. 2014, 109, 343–366. [Google Scholar] [CrossRef]


© 2019 by the authors. Licensee MDPI, Basel, Switzerland. This article is an open access article distributed under the terms and conditions of the Creative Commons Attribution (CC BY) license (http://creativecommons.org/licenses/by/4.0/).
Share and Cite
Sinyakova, E.; Kosyakov, V.; Palyanova, G.; Karmanov, N. Experimental Modeling of Noble and Chalcophile Elements Fractionation during Solidification of Cu-Fe-Ni-S Melt. Minerals 2019, 9, 531. https://doi.org/10.3390/min9090531
Sinyakova E, Kosyakov V, Palyanova G, Karmanov N. Experimental Modeling of Noble and Chalcophile Elements Fractionation during Solidification of Cu-Fe-Ni-S Melt. Minerals. 2019; 9(9):531. https://doi.org/10.3390/min9090531
Chicago/Turabian StyleSinyakova, Elena, Victor Kosyakov, Galina Palyanova, and Nikolay Karmanov. 2019. "Experimental Modeling of Noble and Chalcophile Elements Fractionation during Solidification of Cu-Fe-Ni-S Melt" Minerals 9, no. 9: 531. https://doi.org/10.3390/min9090531
APA StyleSinyakova, E., Kosyakov, V., Palyanova, G., & Karmanov, N. (2019). Experimental Modeling of Noble and Chalcophile Elements Fractionation during Solidification of Cu-Fe-Ni-S Melt. Minerals, 9(9), 531. https://doi.org/10.3390/min9090531