Impact of Heavy Metals on Community Farming Activities in the Central Peruvian Andes


Abstract
1. Introduction
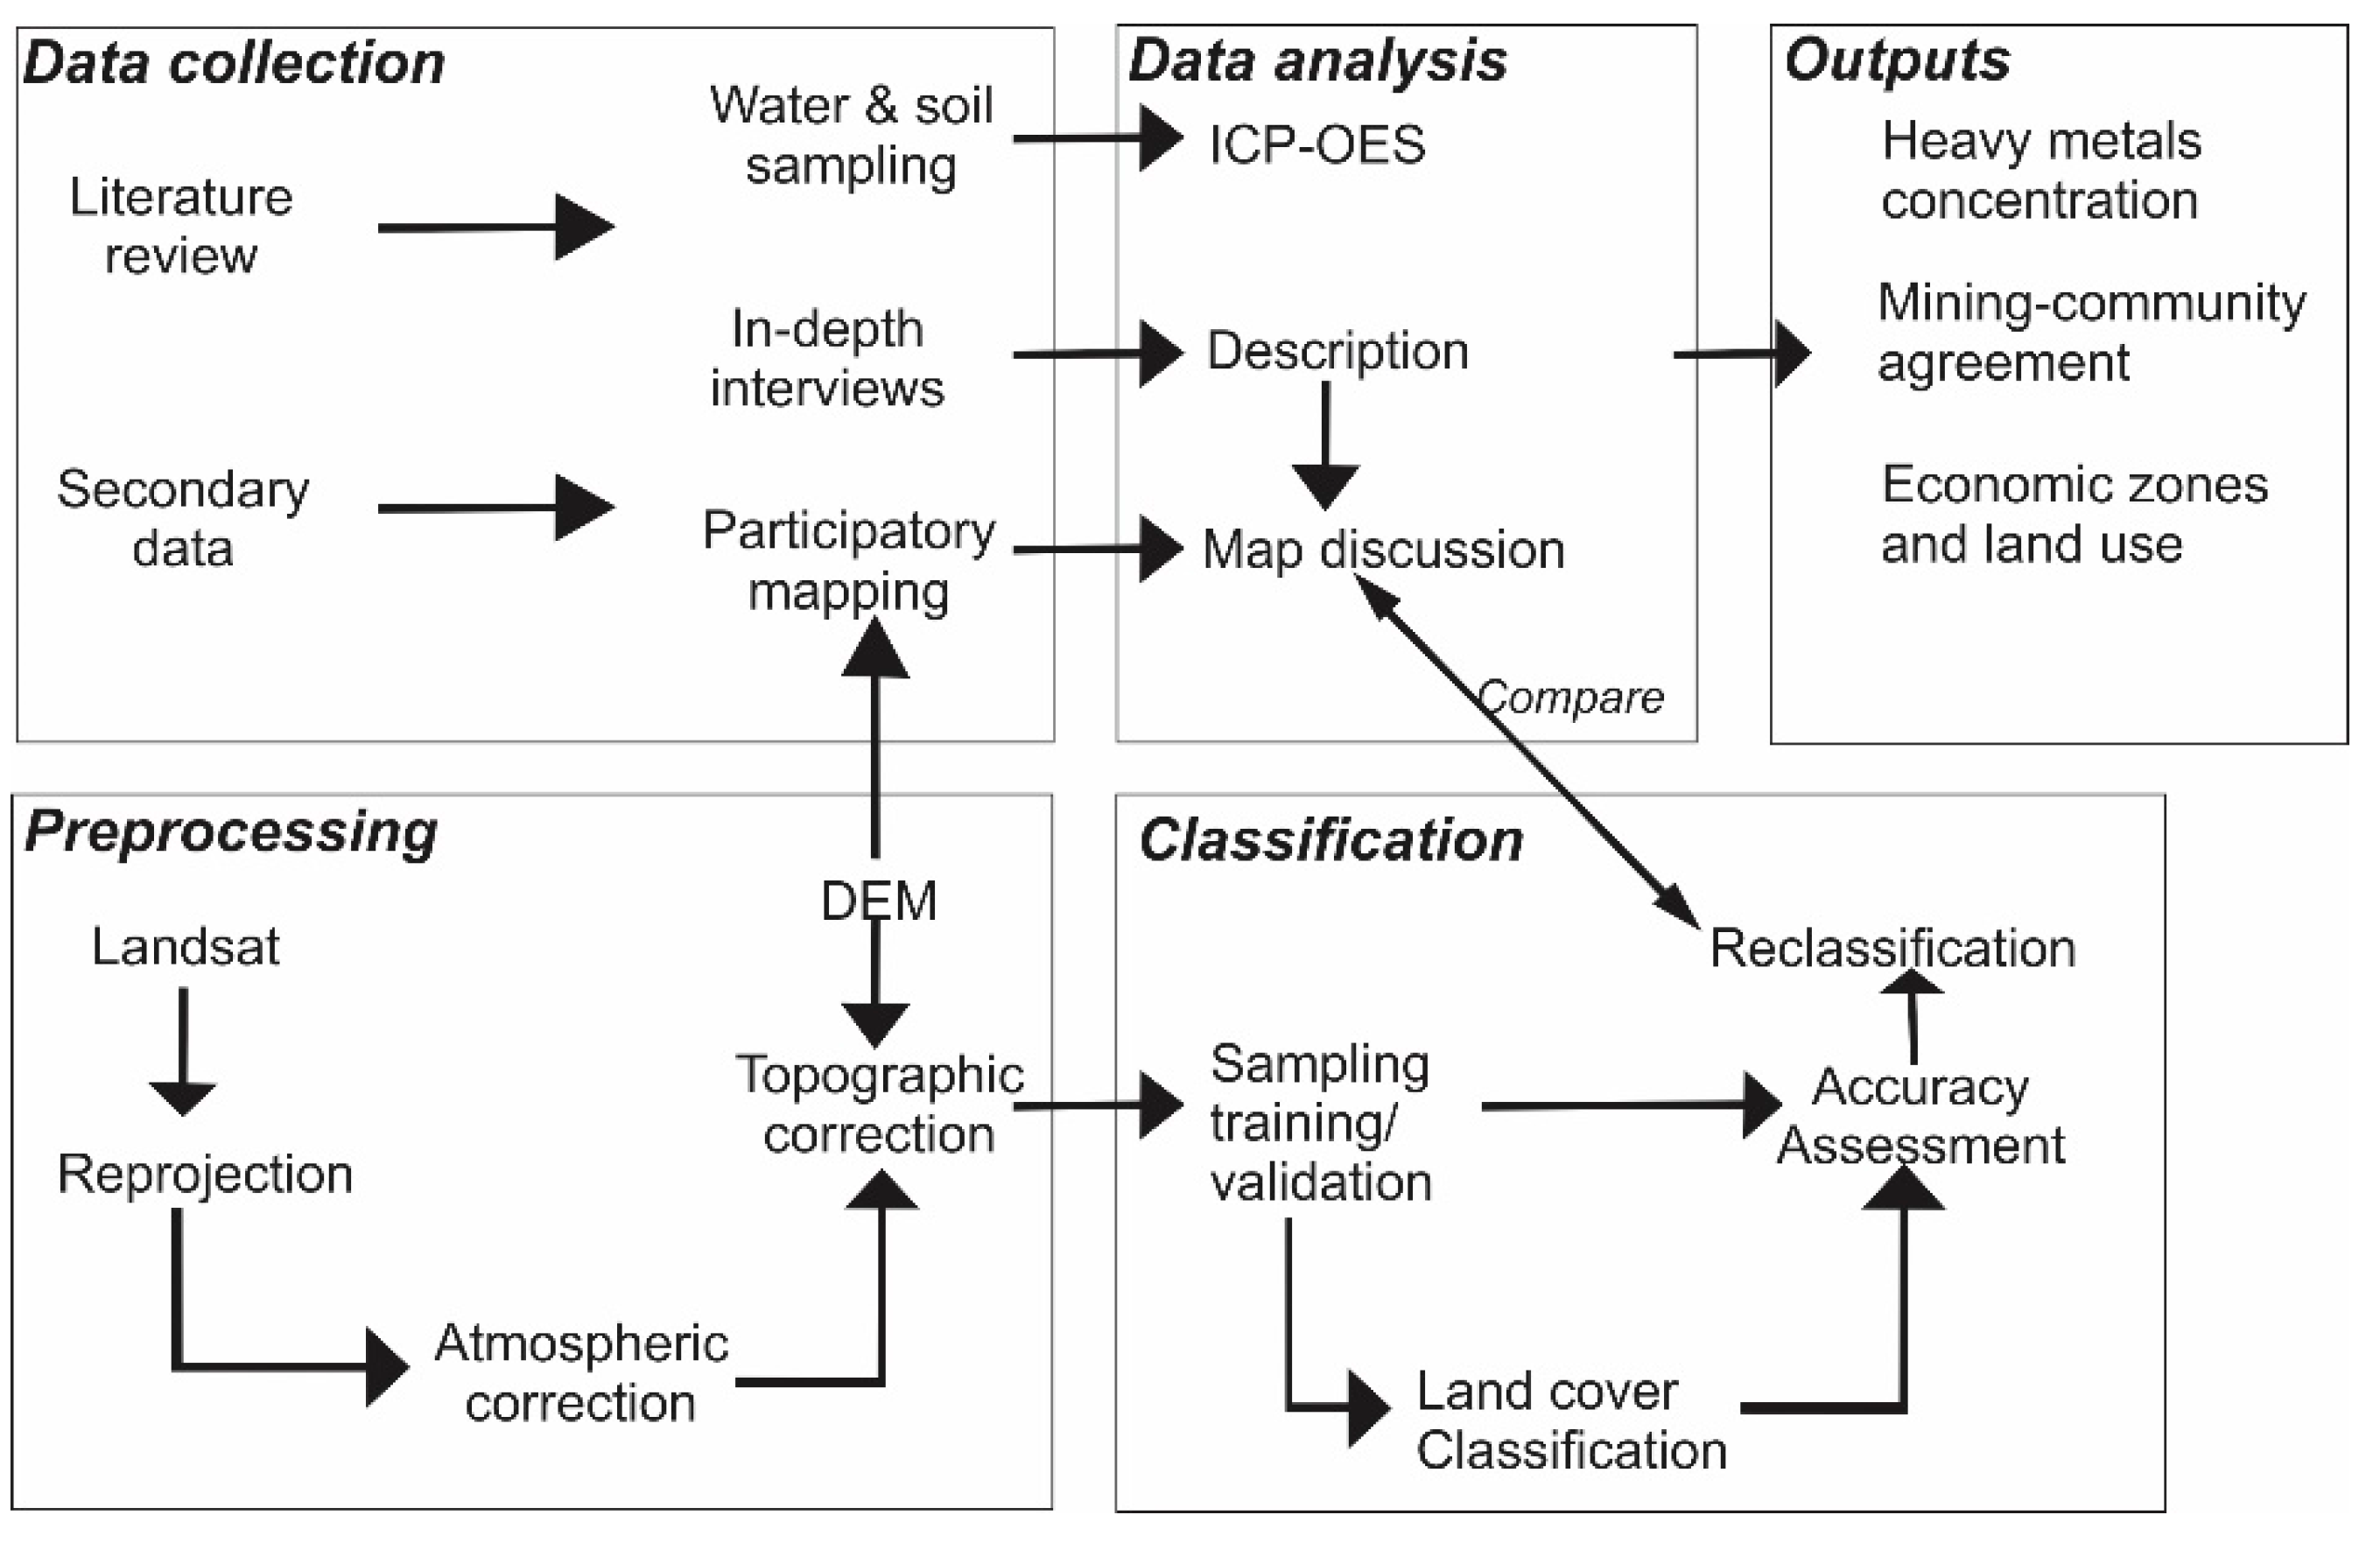
2. Materials and Methods
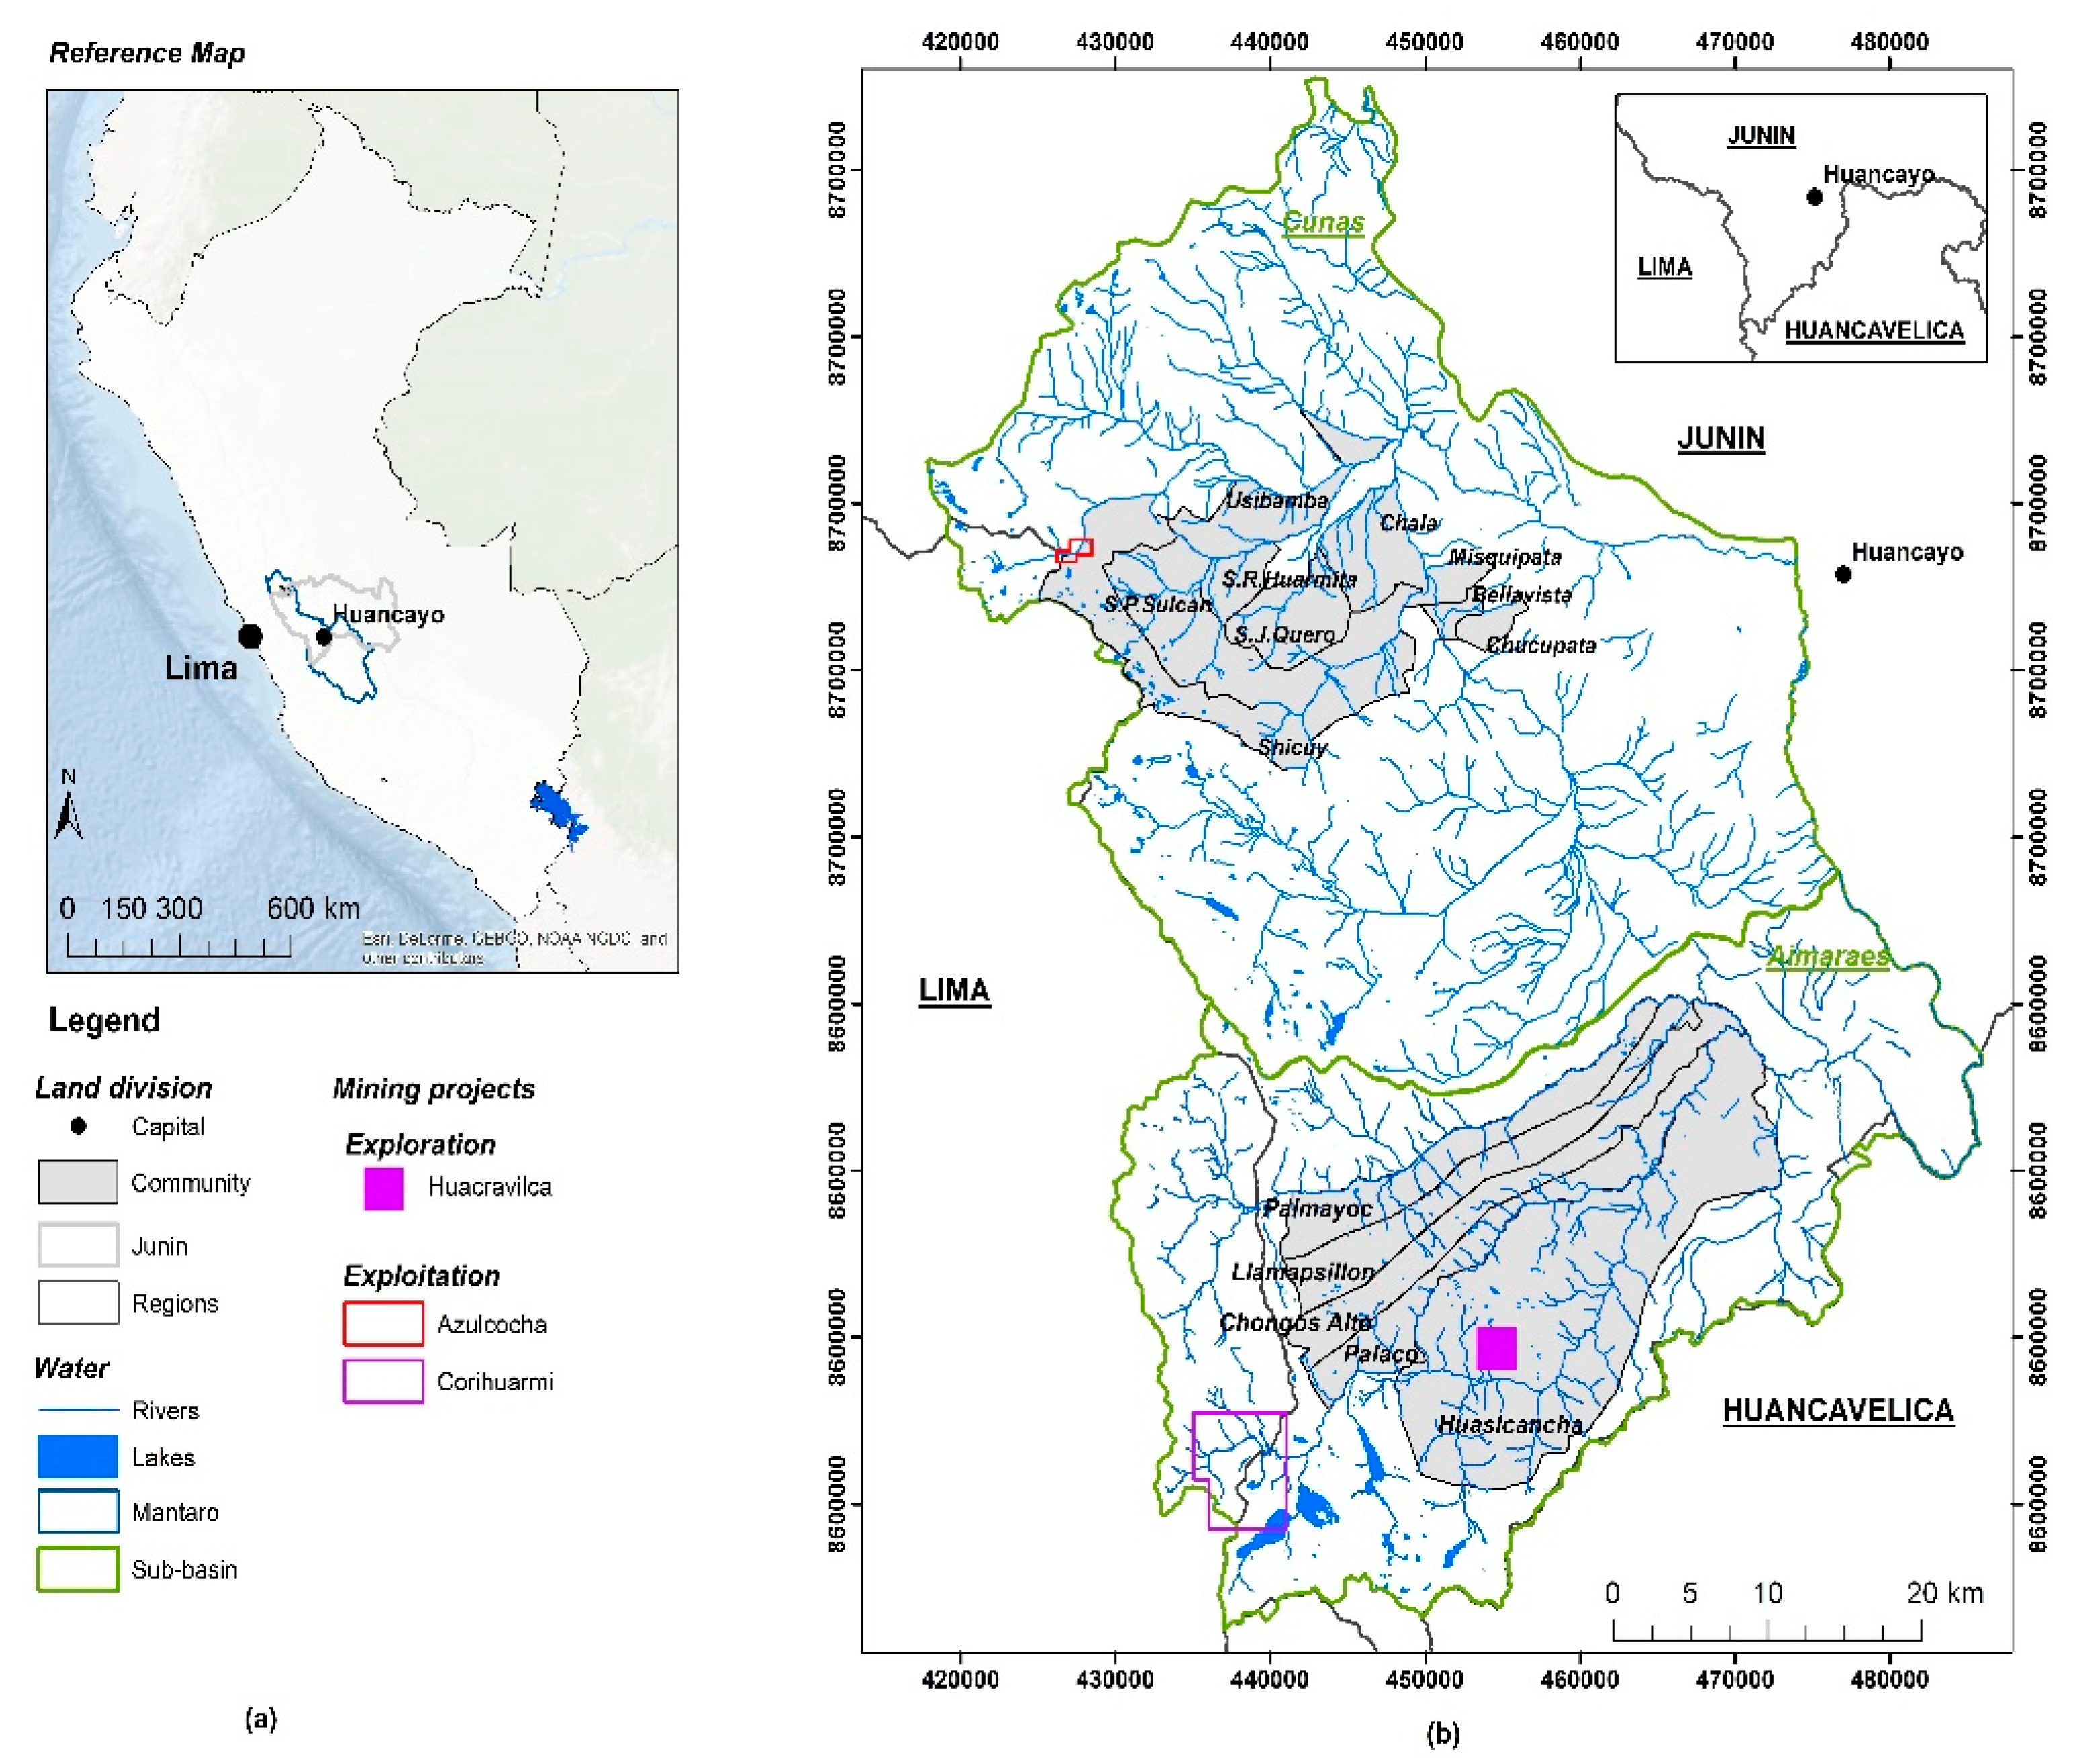
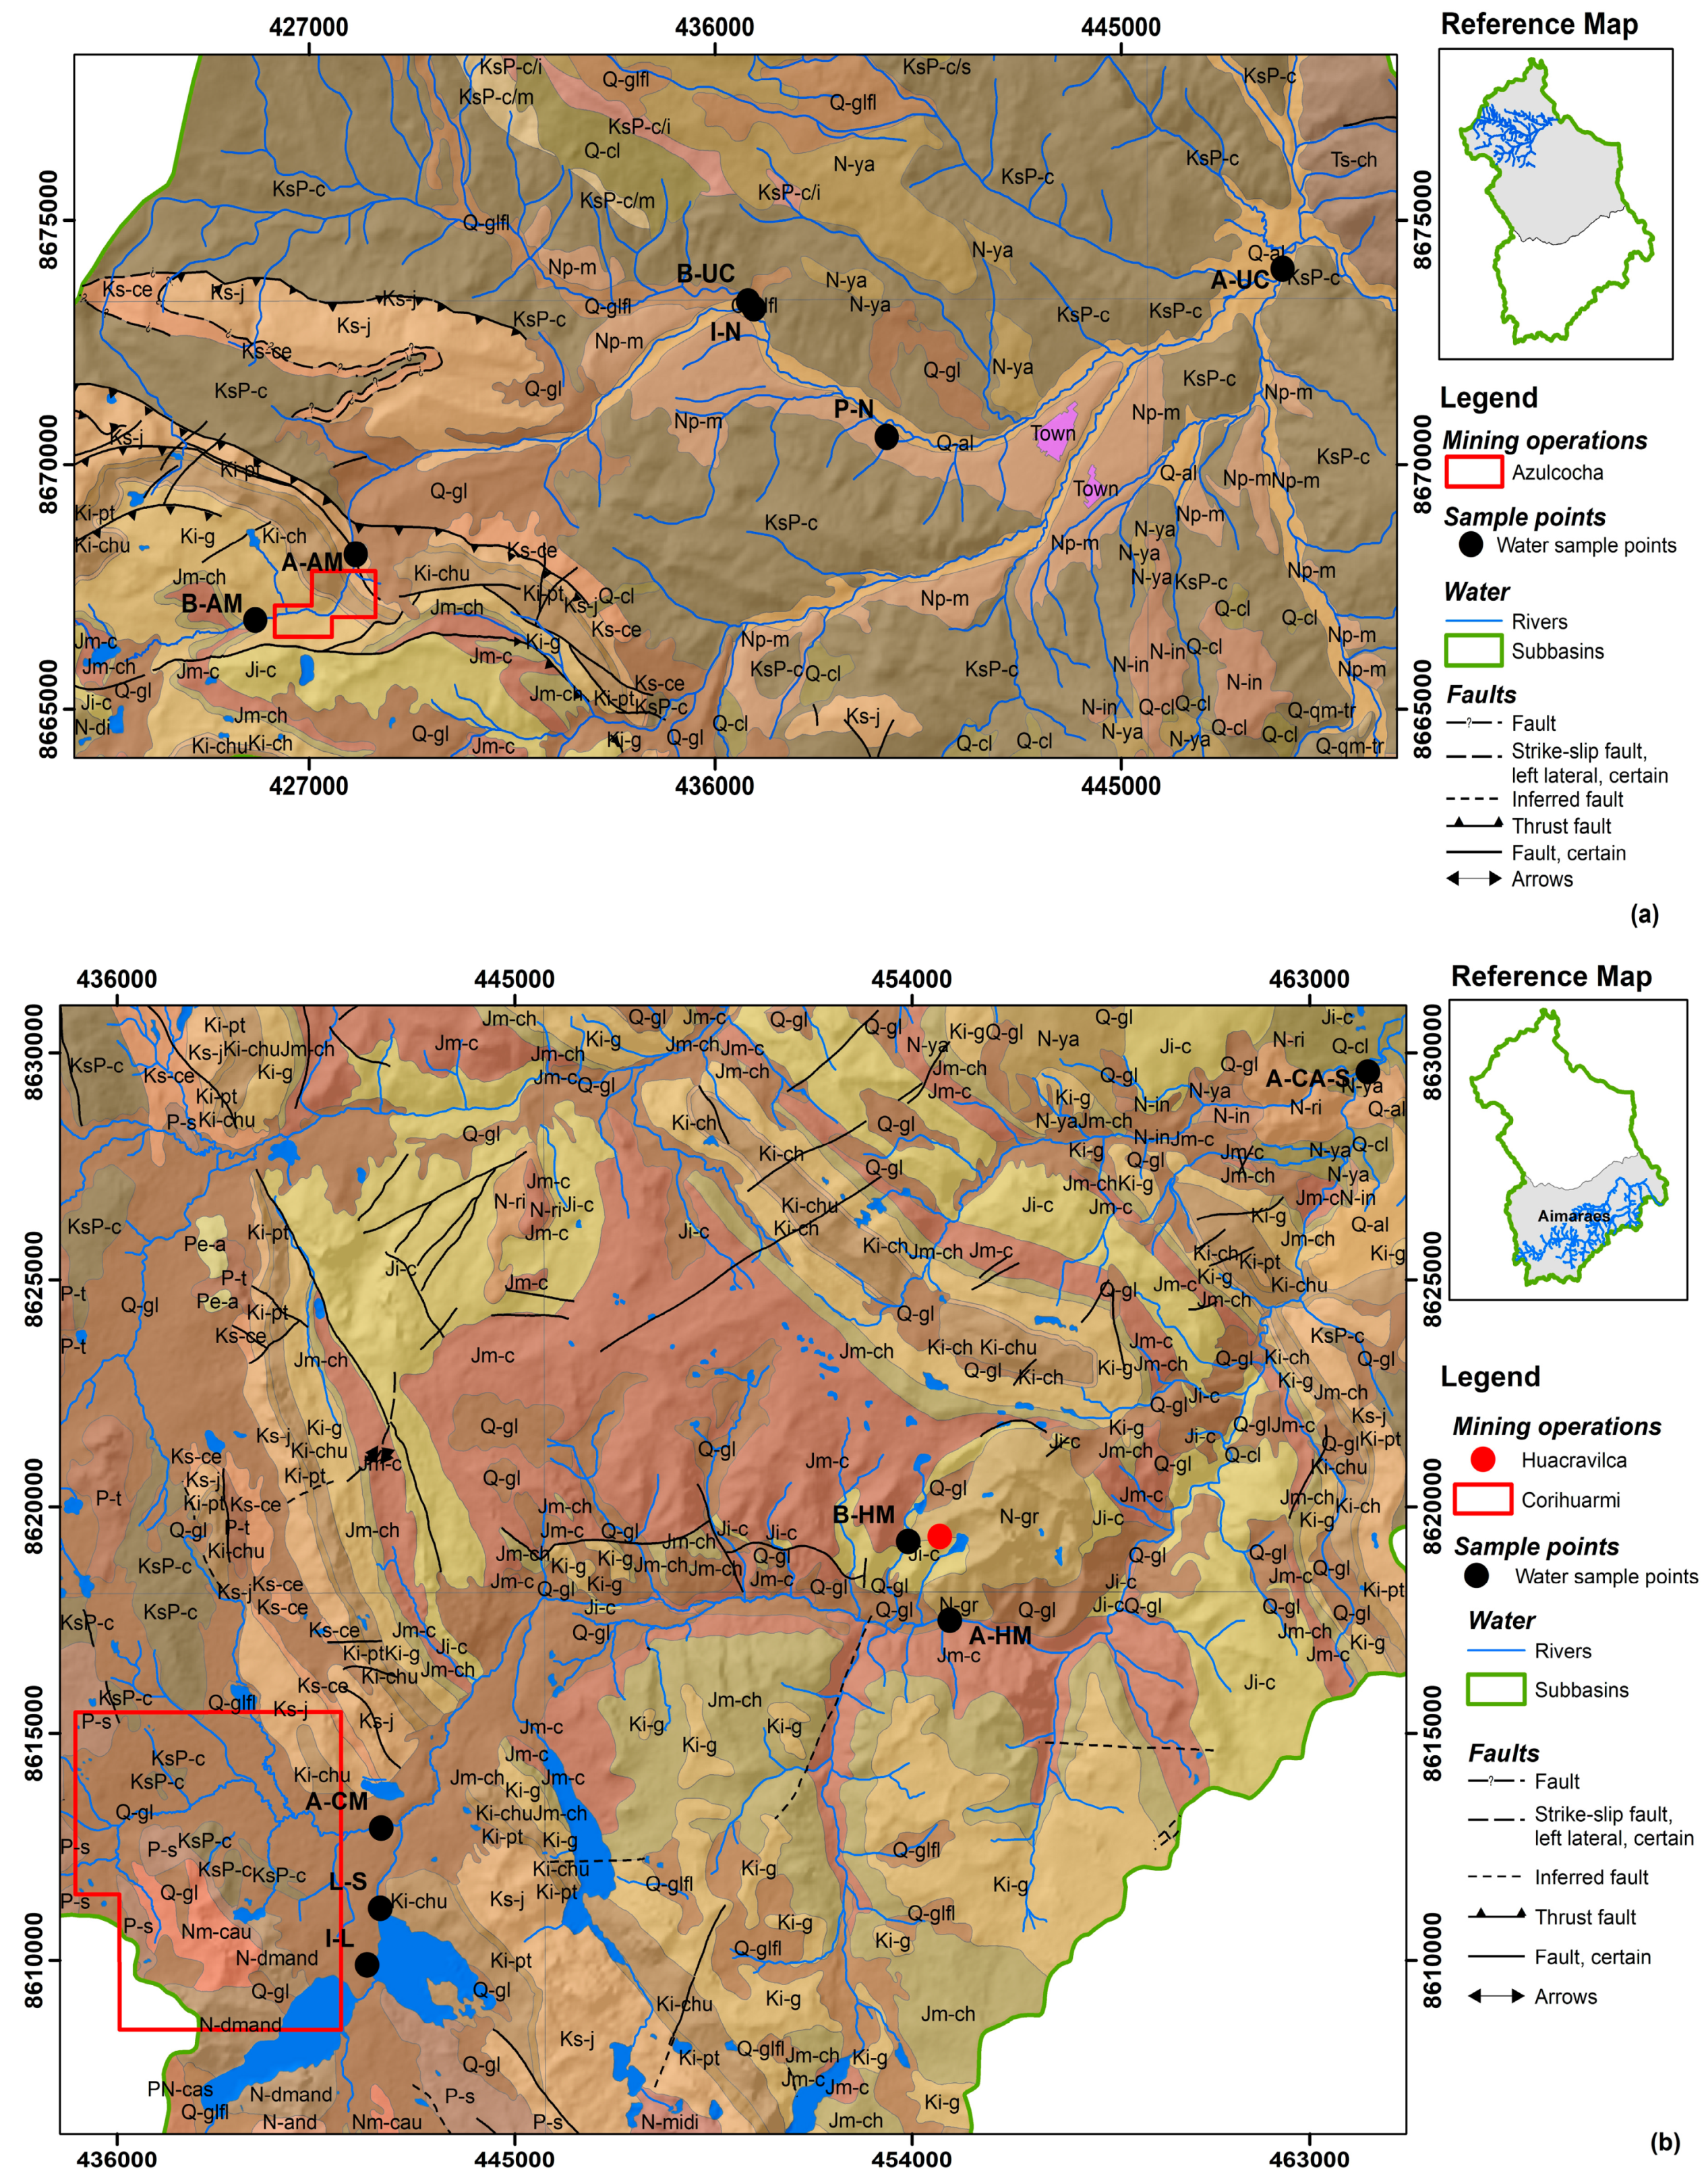
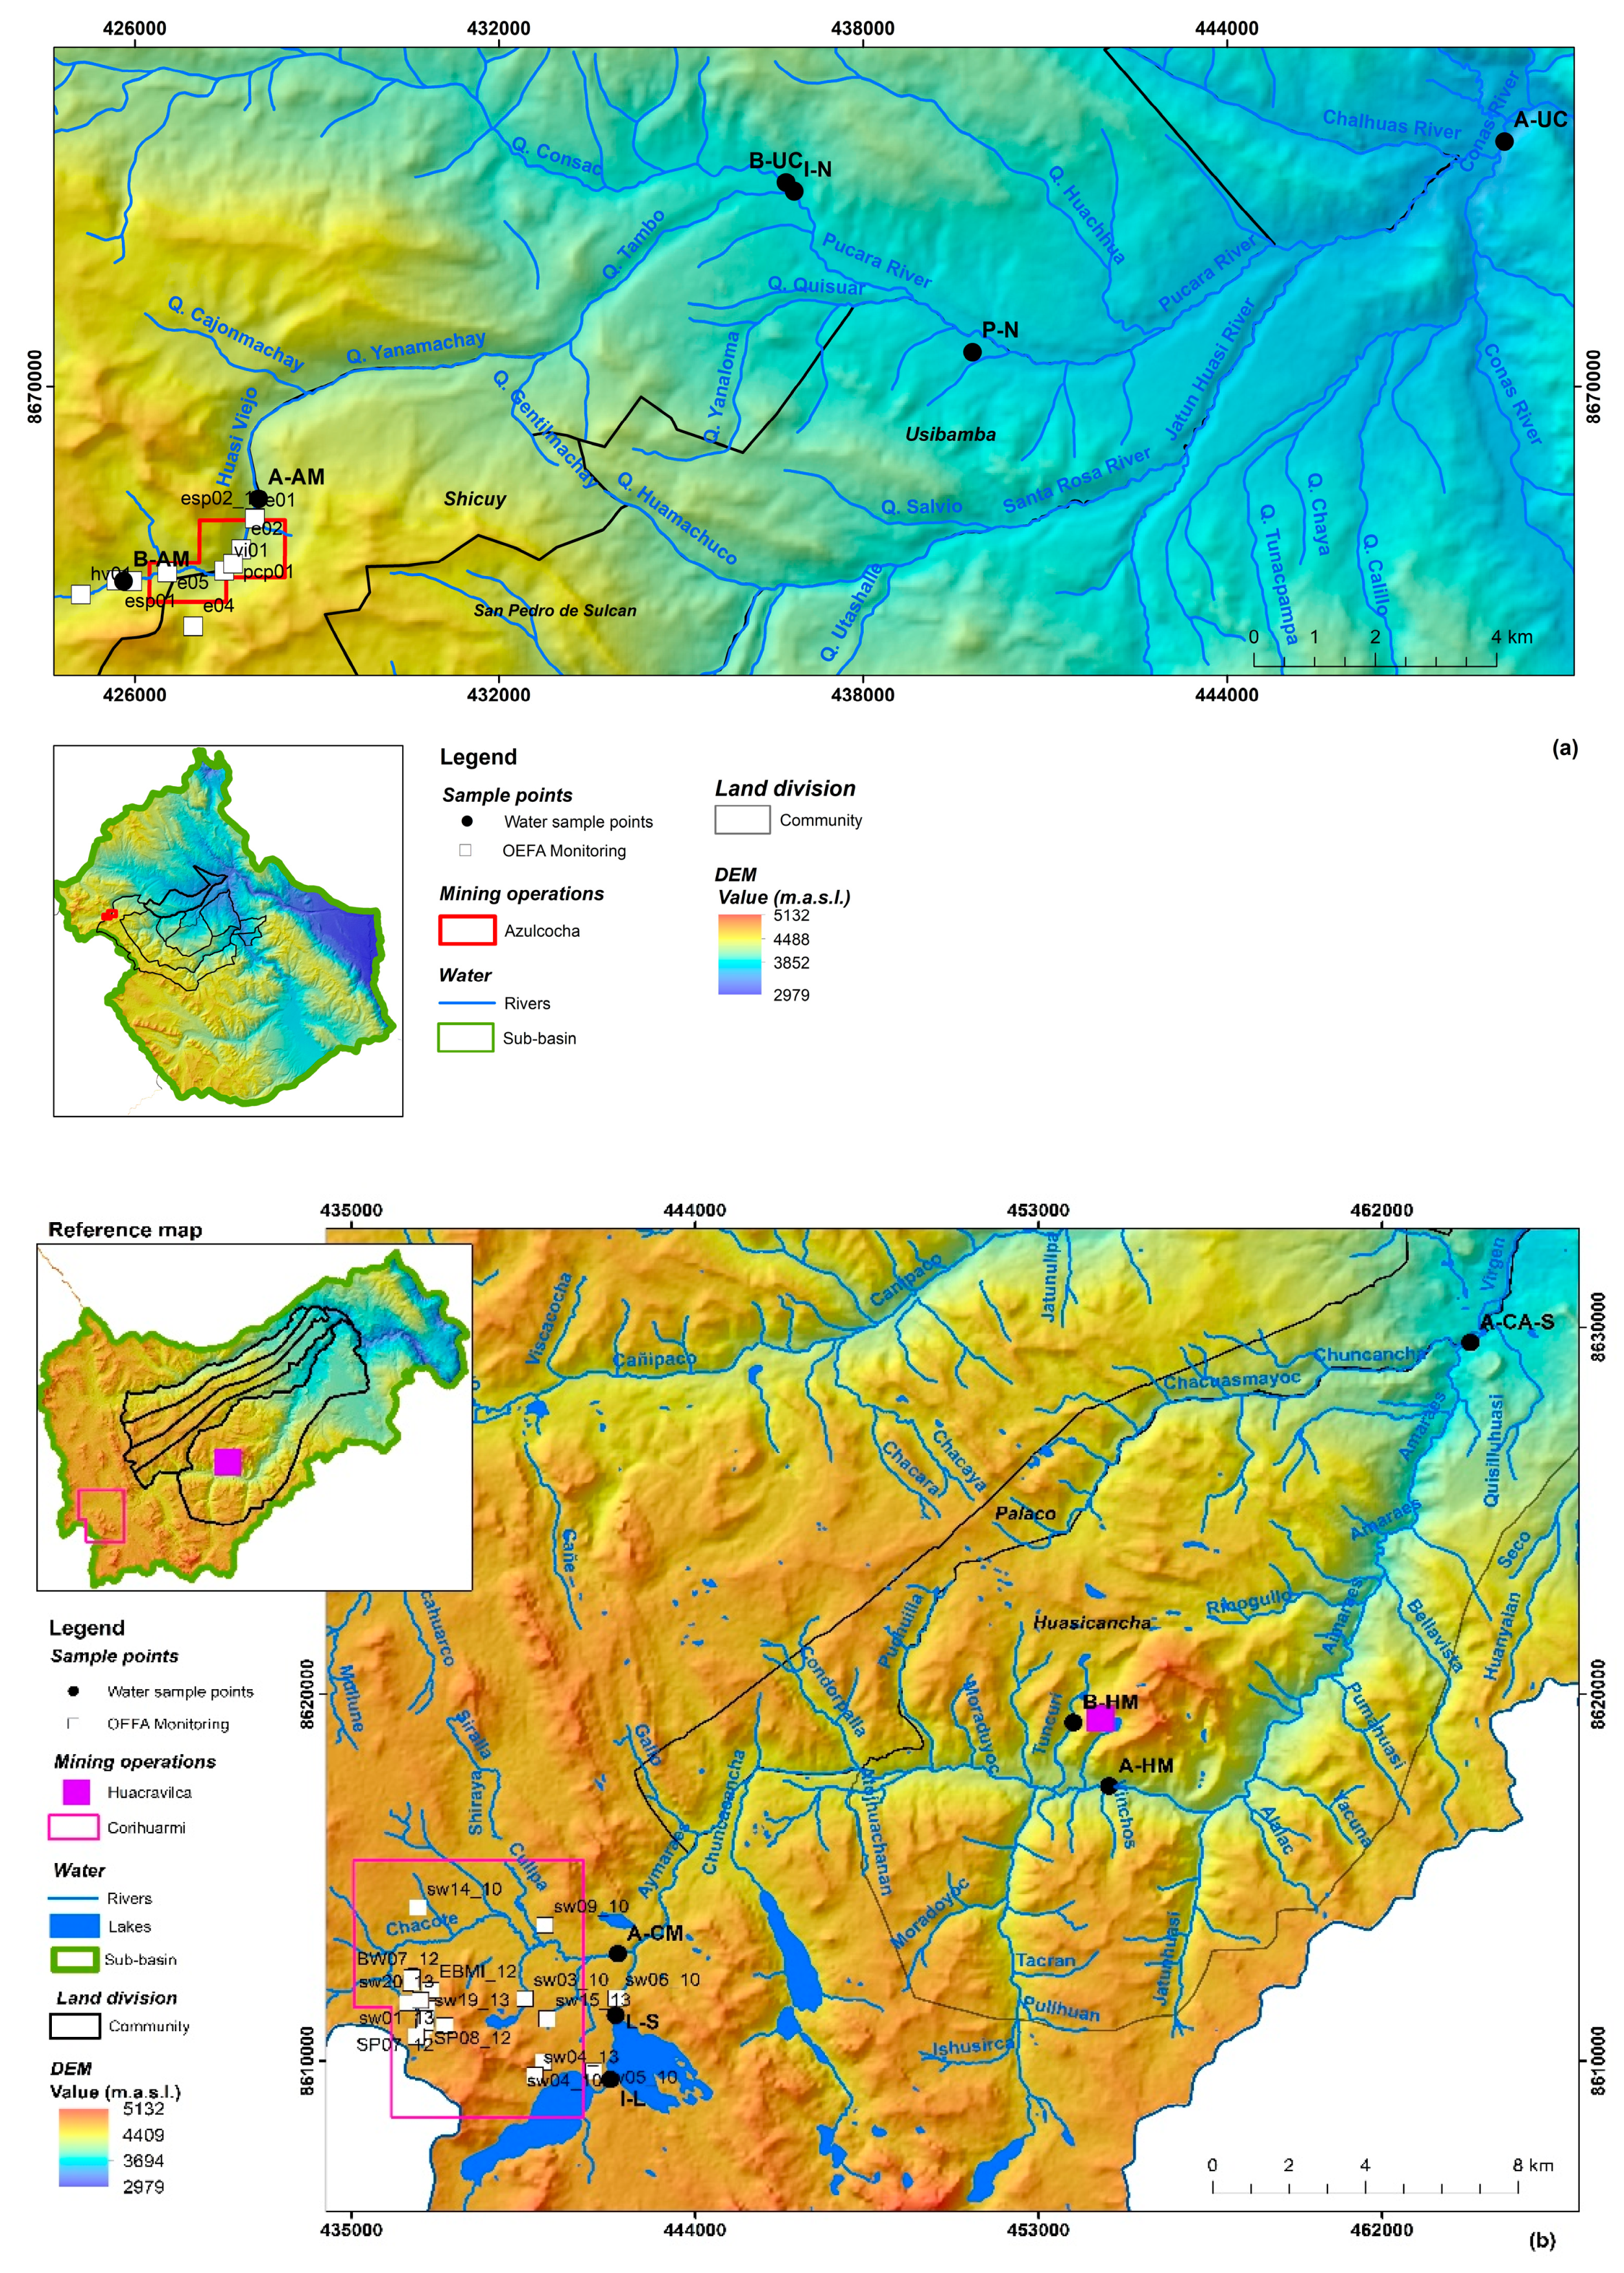
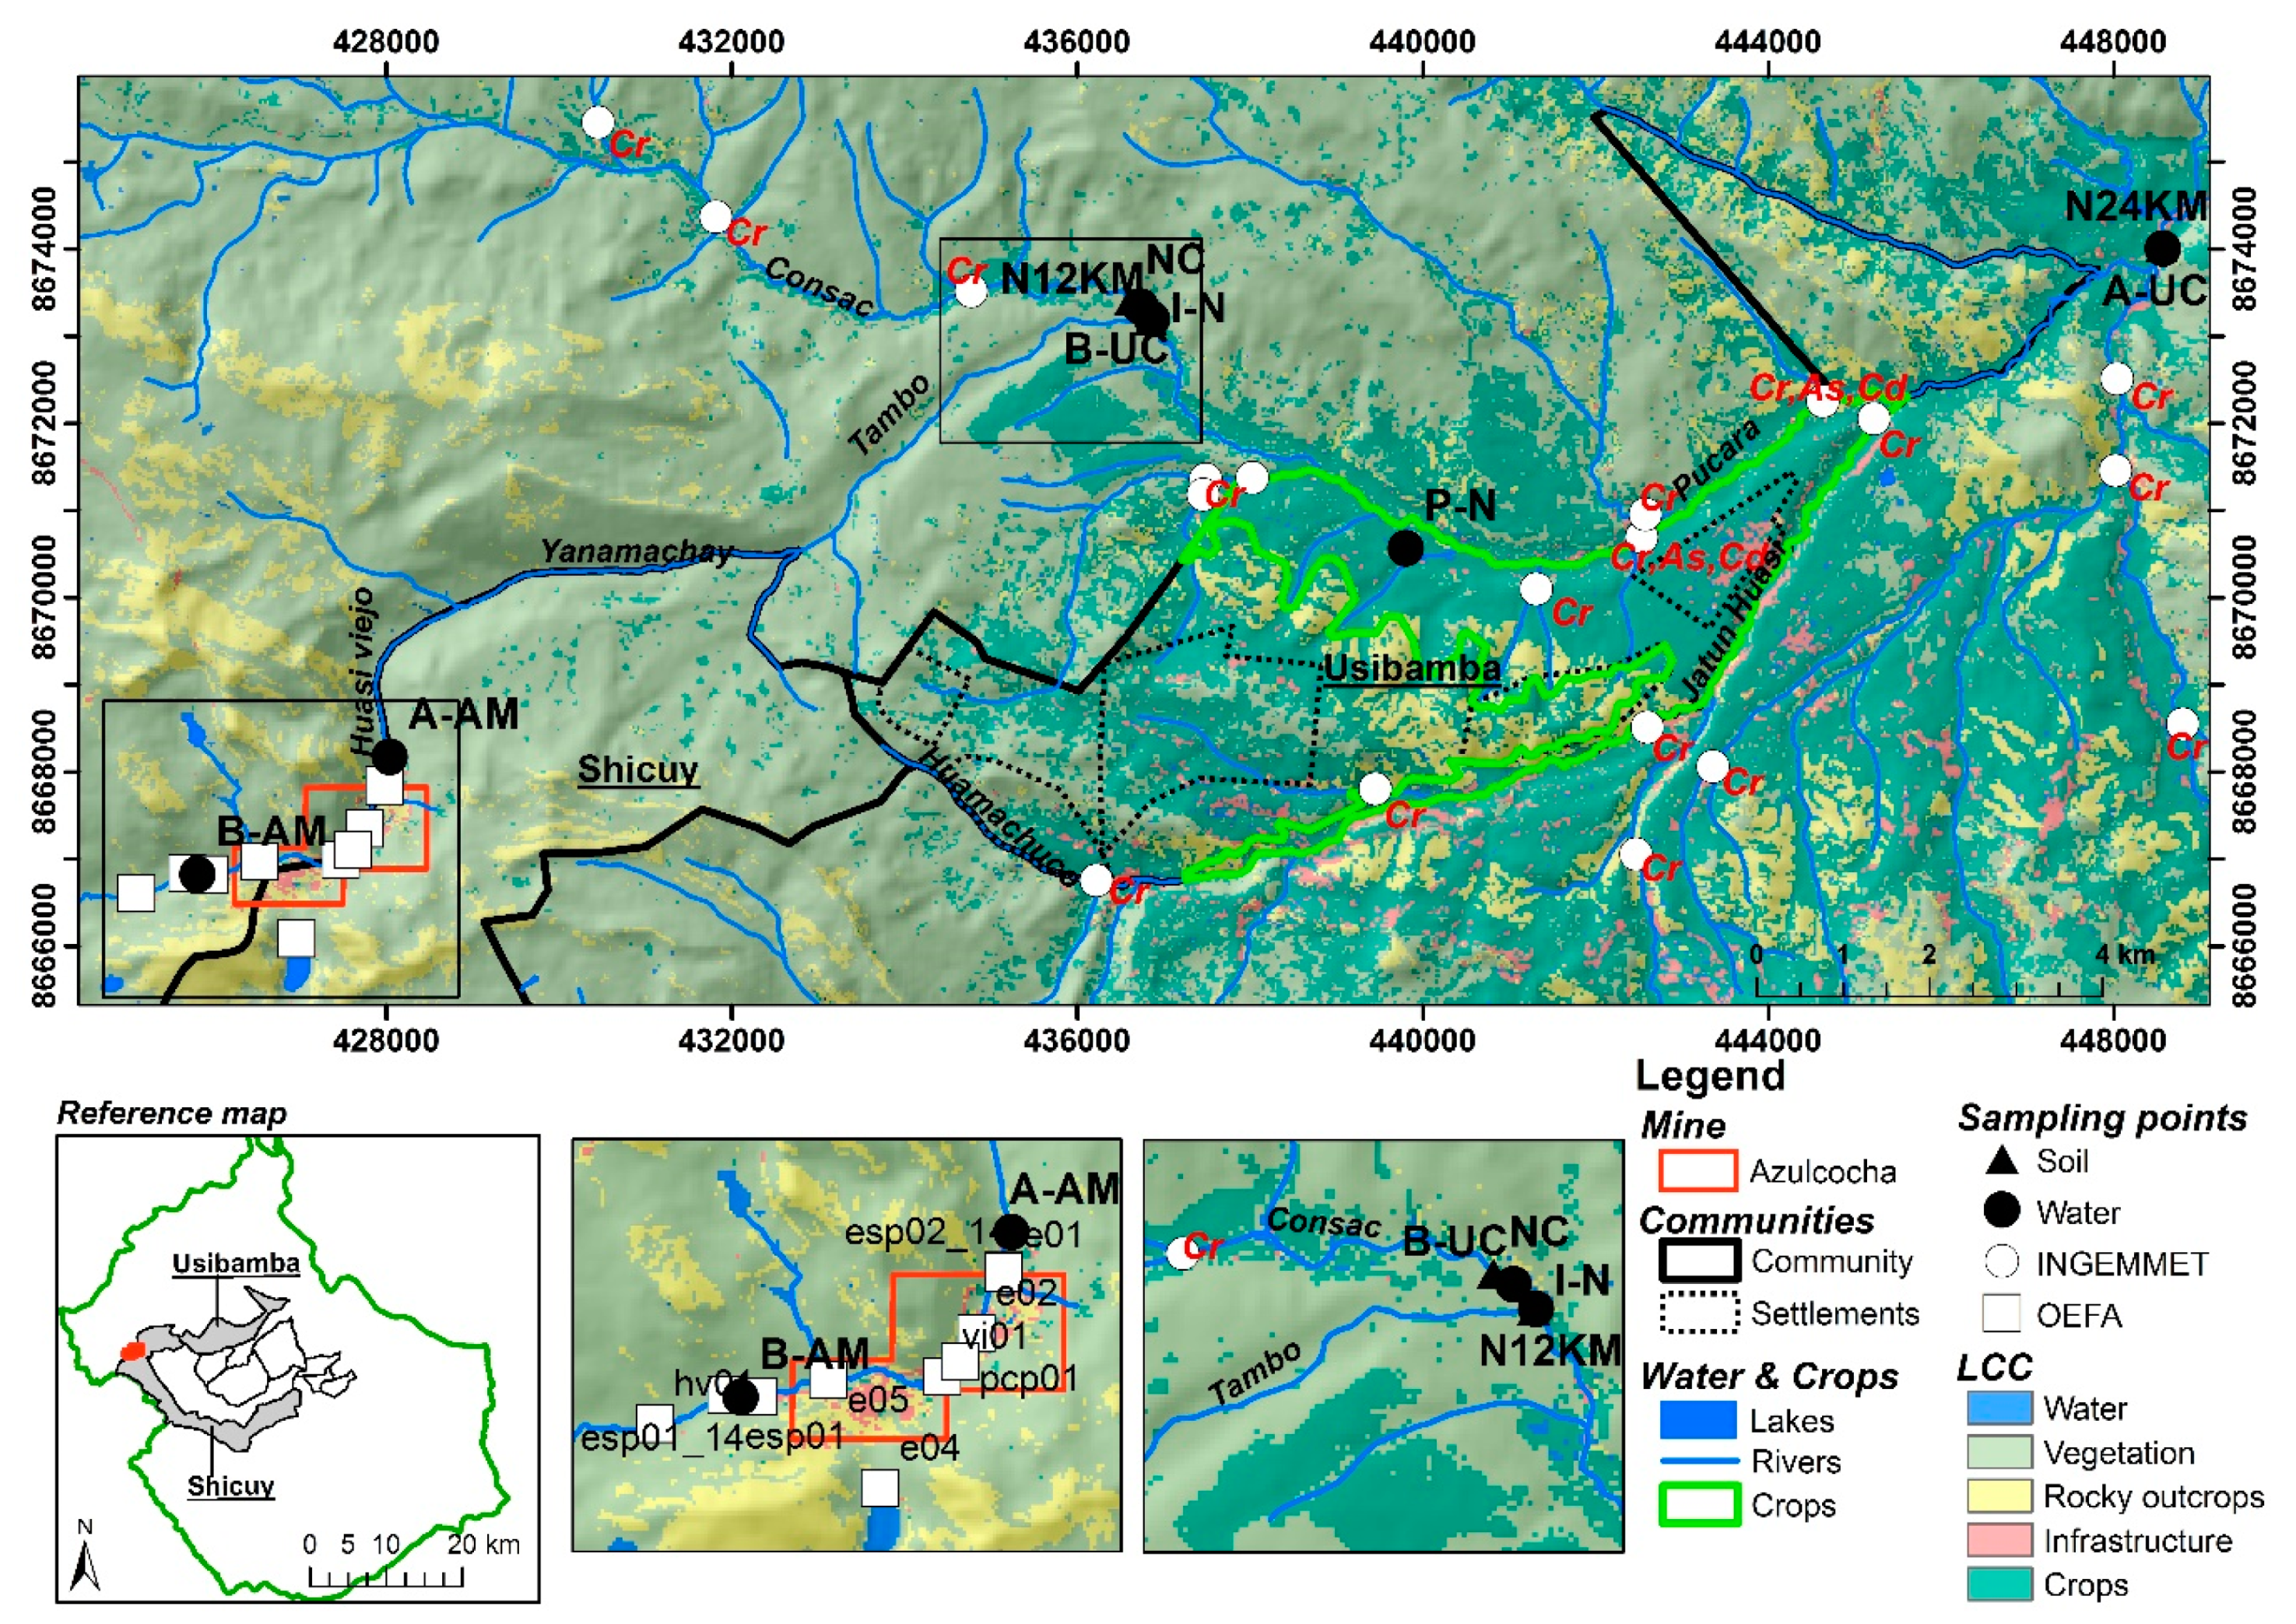
2.1. Research Site
2.2. Interviews with Stakeholders
2.3. Water and Soil Sampling
2.4. Participatory Mapping
3. Results
3.1. Agreements between Mining Companies and Communities
“In the first meeting with (the mine) Azulcocha, Shicuy (community) authorities requested balls for the children, food supplies and 10 000 PEN/year in return for the rent of 700 ha of land. Shortly after, Shicuy realized the real price of land rent and tried to change the agreement (…) The situation escalated into a conflict as Azulcocha refused initially (…) Finally, better clauses were negotiated and the agreement changed, now the payment is 300 000 PEN/year.”(LQ, representative of Cunas sub-basin, Tambo, 2016)
“Community members who visited upstream zones reported that they saw signs of pollution due to mining activities”.(PH, representative of Chongos Alto, Huancayo, 2016)
“Llamapsillon (neighboring community of Chongos Alto) does not have any agreement with Huacravilca mine…There should be a prior consultation including all neighboring communities, as they did with the directly affected community, so we can have the possibility to accept or not their activities”.(BC, representative of Llamapsillon, Llamapsillon, 2016)
3.2. Mining Impact on Water Streams
3.3. Mining Impact on Soil
3.4. Community Livelihoods and Mining Impact
4. Discussion
4.1. Effects on the Environment
4.2. Effects on the Community Livelihoods
5. Conclusions
Author Contributions
Funding
Acknowledgments
Conflicts of Interest
Appendix A
- Which are the campesino communities directly and indirectly affected by the mining operations?
- Which campesino communities have or had a mining-community agreement with the mining operation?
- Which are the disagreements or conflicts within the community and with the mining operation?
- Could you explain the process (negotiation) from the first contact to the signing of the agreement?
- Which are the main difficulties in establishing dialogues that lead to the negotiation of the agreement?
- How was the frequency of meetings with the mining company before and after signing the agreement?
- How is the renewal of the mining-community agreement?
- How has the relationship evolved between the mining operation and the campesino community from the first contact up to now?
- Which are the main reasons for triggering a land-use conflict?
- What are the main reasons for breaching the mining-community agreement?
- Has your community had any contact with the mining project? If so, when and how was the first contact with the mining operation?
- Has your community ever been contacted by another mining project? If so, how was this experienced?
- How was the negotiation that lead to signing of the agreement?
- How and why did your community accept signing a mining-community agreement?
- Which are the clauses of the agreement?
- Has your community changed after signing the agreement? If so, which are these changes?
- Is your community satisfied with the accomplishment of the agreement?
- Has the mining-community agreement been completely accomplished?
- What are the main reasons for breaching the mining-community agreement?
- Which are the main reasons for triggering a land-use conflict?
Appendix B

| Year | Code | pH | Pb | Cu | Zn | As | Hg | Cr | Cd | Ni | Fe | Mn |
|---|---|---|---|---|---|---|---|---|---|---|---|---|
| 2010 | sw02_10 | 4.59 | <0.005 | 0.219 | 0.279 | 0.529 | <0.0001 | 0.007 | 0.009 | 0.036 | 36.12 | 0.4 |
| sw04_10 | 5.34 | <0.005 | 0.036 | 0.07 | 0.019 | <0.0001 | 0.002 | 0.0008 | 0.009 | 4.309 | 0.072 | |
| sw05_10 | 8.27 | <0.005 | <0.001 | <0.001 | 0.008 | <0.0001 | <0.001 | <0.0007 | <0.002 | 0.148 | 0.033 | |
| sw06_10 | 9.37 | 0.022 | 0.002 | 0.007 | 0.009 | <0.0001 | <0.001 | <0.0007 | <0.002 | 0.079 | 0.006 | |
| sw09_10 | 8.14 | <0.005 | 0.002 | <0.001 | 0.007 | <0.0001 | <0.001 | <0.0007 | <0.002 | 0.044 | 0.045 | |
| sw10_10 | 4.36 | <0.005 | 0.034 | 0.154 | <0.005 | <0.0001 | 0.002 | 0.0016 | 0.022 | 4.096 | 0.4 | |
| sw14_10 | 4.96 | <0.005 | 0.038 | 0.184 | 0.006 | <0.0001 | <0.001 | 0.0013 | 0.018 | 0.44 | 1.148 | |
| 2012 | BW07_12 | 7 | 0.0008 | 0.0004 | 0.009 | 0.0009 | <0.0001 | <0.0005 | - | <0.0004 | - | 0.0093 |
| sw10_12 | 4.3 | 0.0124 | 0.0534 | 0.0974 | 0.0356 | <0.0001 | 0.0018 | - | 0.0117 | - | 0.378 | |
| MA08_12 | 3 | 0.0209 | 0.0874 | 0.1494 | 0.0503 | <0.0001 | 0.0037 | - | 0.0205 | - | 0.1072 | |
| MA02_12 | 8.4 | <0.0002 | 0.0002 | 0.0042 | 0.0007 | <0.0001 | <0.0005 | - | <0.0004 | - | 0.0056 | |
| EBMI_12 | 4.2 | 0.0022 | 0.3256 | 1.0173 | 0.0068 | - | - | - | - | |||
| 2013 | sw04_13 | 3.16 | <0.010 | 0.0085 | <0.14 | 0.0222 | <0.0003 | - | <0.0024 | - | 4.377 | 0.0911 |
| sw10_13 | 3.16 | <0.010 | 0.0968 | 0.24 | 0.0949 | <0.0003 | - | 0.003 | - | 16.5 | 0.896 | |
| sw20_13 | 3.32 | <0.010 | 0.1046 | 0.26 | 0.0936 | <0.0003 | - | 0.0038 | - | 16.6 | 0.8772 | |
| Sw01_13 | 3.09 | <0.010 | 0.1137 | 0.23 | 0.0492 | <0.0003 | - | <0.0024 | - | 25.851 | 1.3723 | |
| sw19_13 | 3.11 | <0.010 | 0.131 | 0.21 | 0.0206 | <0.0003 | - | <0.0024 | - | 18.5 | 1.3533 |
| Code | pH | Pb | Cu | Zn | As | Hg | Cr | Cd | Fe | Mn |
|---|---|---|---|---|---|---|---|---|---|---|
| vi01 | 8.18 | <0.001 | 0.0135 | 0.779 | 0.23 | <1 | <0.010 | 0.01 | - | - |
| e02 | 8.07 | 0.009 | <0.0083 | 0.196 | 13.43 | <1 | <0.010 | <0.0004 | - | - |
| e01 | 8.24 | <0.001 | 0.0092 | 0.197 | 2.977 | <0.00003 | - | <0.0004 | 0.1232 | 18.11 |
| e05 | 8.22 | <0.001 | 0.0117 | 0.082 | 0.050 | <0.00003 | - | <0.0004 | 0.3218 | 0.0479 |
| pcp01 | 7.96 | <0.001 | 0.0111 | 1.057 | 0.333 | <0.00003 | - | 0.0016 | 0.5555 | 2.288 |
| esp01 | 8.00 | <0.001 | 0.0101 | 0.077 | 0.088 | <0.00003 | - | <0.0004 | 0.1744 | 0.0307 |
| e04 | 8.31 | <0.001 | 0.0078 | 0.044 | <0.008 | <0.00003 | - | <0.0004 | 0.0989 | 0.1464 |
| hv01 | 8.27 | 0.009 | 0.0106 | 0.088 | 0.139 | 0.0007 | - | <0.0004 | 0.3655 | 0.0897 |
| esp01_14 | 8.02 | <0.001 | 0.0105 | 0.088 | 0.102 | 0.0008 | - | 0.0012 | 0.5415 | 0.0504 |
| esp02_14 | 7.92 | <0.001 | 0.0108 | 0.279 | 2.970 | 0.001 | - | 0.0016 | 0.1175 | 19.82 |
| Code | pH | As | Cd | Ni | Hg | Pb | Cu | Fe | Mn | Zn | |
|---|---|---|---|---|---|---|---|---|---|---|---|
| Control | 1 I-N | 9.68 | 0.017 | N.D. | N.D. | <0.010 | N.D. | <0.004 | 0.033 | 0.0055 | 0.004 |
| 2 I-N | 0.015 | N.D. | N.D. | <0.010 | N.D. | <0.004 | 0.031 | 0.0055 | 0.004 | ||
| 1 P-N | 8.07 | <0.010 | N.D. | N.D. | <0.010 | N.D. | 0.005 | 0.006 | <0.0003 | <0.003 | |
| 2 P-N | <0.010 | N.D. | N.D. | <0.010 | N.D. | 0.005 | 0.012 | <0.0003 | 0.004 | ||
| Cases | 1 B-AM | 8.31 | 0.089 | N.D. | N.D. | <0.010 | N.D. | 0.005 | 0.111 | 0.025 | 0.007 |
| 2 B-AM | 0.094 | N.D. | N.D. | <0.010 | N.D. | 0.006 | 0.112 | 0.026 | 0.009 | ||
| 1 A-AM | 7.78 | 0.56 | 0.023 | 0.019 | <0.010 | <0.028 | 0.008 | 0.926 | 18.505 | 12.34 | |
| 2 A-AM | 0.562 | 0.022 | 0.019 | <0.010 | <0.028 | 0.007 | 0.913 | 18.735 | 12.47 | ||
| 1 B-UC | 9.7 | 0.016 | N.D. | N.D. | <0.010 | N.D. | <0.004 | 0.032 | 0.0103 | 0.007 | |
| 2 B-UC | 0.017 | N.D. | N.D. | <0.010 | N.D. | <0.004 | 0.031 | 0.0065 | <0.003 | ||
| 1 A-UC | 9.37 | 0.011 | N.D. | N.D. | <0.010 | N.D. | <0.004 | 0.022 | 0.0065 | <0.003 | |
| 2 A-UC | 0.016 | N.D. | N.D. | <0.010 | N.D. | <0.004 | 0.025 | 0.006 | 0.009 |
| Code | pH | As | Cd | Ni | Hg | Cu | Fe | Mn | Zn | |
|---|---|---|---|---|---|---|---|---|---|---|
| Control | 1 L-S | 10.9 | <0.010 | N.D. | N.D. | <0.01 | <0.004 | 0.029 | 0.006 | 0.004 |
| 2 L-S | 0.011 | N.D. | N.D. | <0.01 | <0.004 | 0.056 | 0.006 | <0.003 | ||
| 1 I-L | 9.5 | <0.010 | N.D. | N.D. | <0.01 | 0.007 | 0.260 | 0.015 | 0.006 | |
| 2 I-L | <0.010 | N.D. | N.D. | <0.01 | 0.017 | 0.273 | 0.016 | 0.008 | ||
| Cases | 1 A-CM | 9.18 | <0.010 | N.D. | N.D. | <0.01 | <0.004 | 0.017 | <0.0003 | 0.004 |
| 2 A-CM | <0.010 | N.D. | N.D. | <0.01 | 0.005 | 0.018 | 0.0035 | 0.007 | ||
| 1 B-HM | 5.4 | <0.010 | 0.006 | <0.013 | <0.01 | 0.071 | 50.020 | 2.140 | 0.102 | |
| 2 B-HM | <0.010 | 0.006 | <0.013 | <0.01 | 0.072 | 52.000 | 2.134 | 0.097 | ||
| 1 A-HM | 9.9 | <0.010 | N.D. | N.D. | <0.01 | <0.004 | 0.032 | <0.0003 | <0.003 | |
| 2 A-HM | <0.010 | <0,005 | N.D. | <0.01 | <0.004 | 0.028 | <0.0003 | <0.003 | ||
| 1 A-CA-S | 9.83 | <0.010 | N.D. | N.D. | <0.01 | <0.004 | 0.023 | 0.005 | 0.004 | |
| 2 A-CA-S | <0.010 | N.D. | N.D. | <0.01 | <0.004 | 0.046 | 0.008 | 0.006 |
| Category (C) | Use | As | Cd | Hg | Cr | Pb | Cu | Fe | Mn | Zn |
|---|---|---|---|---|---|---|---|---|---|---|
| C3: Farming activities | Irrigation | 0.1 | 0.01 | 0.001 | 0.1 | 0.05 | 0.2 | 5 | 0.2 | 2 |
| Livestock drinking | 0.2 | 0.05 | 0.01 | 1 | 0.05 | 0.5 | n/a | 0.2 | 24 | |
| C4: Conservation of aquatic life | Andean rivers | 0.15 | 0.00025 | 0.0001 | 0.011 | 0.0025 | 0.1 | n/a | n/a | 0.12 |
Appendix C
####### libraries ########
library(raster)
library(RStoolbox)
####### inputs ########
input_image <- “S:/Data/inputs/Mosaic06686918S.tif”
input_dem <- “S:/Data/inputs/srtm_21_15_pro_clip.tif”
input_metadata <- “S:/Data/inputs/LC08_L1TP_006069_20170722_20170728_01_T1_MTL.txt”
output_folder <- “S:/Data/outputs”
####### reading data ########
sta.file <- stack(input_image)
elevation <- raster(input_dem)
extent(elevation) <- extent(sta.file)
meta.info <- readMeta(input_metadata)
####### processing ########
sta.output <- list()
for (i in 1:nlayers(sta.file)){
 x <- topCor(img=sta.file[[i]],
              dem=elevation,
              metaData=meta.info,
              method=“minnaert”,
              stratImg = “slope”)
 sta.output[[i]] <- x
}
sta.output <- stack(sta.output)
####### save ########
output.name <- paste0(output_folder,“/img_corrrected.tif”)
writeRaster(sta.output,output.name,overwrite=T)
Appendix D
############### libraries #############
library(raster)
library(gdalUtils)
library(rgdal)
############### inputs #############
classification_filename=“D:/Data/mel/class_20180621cat2.tif”
recoding_shapefile=“D:/Data/mel/recla_FIX.shp”
target_column=“tar”
recode_column=“rec”
overwrite=F
############### reading data #############
#start routines
if(!file.exists(recoding_shapefile)){
 stop(“‘recoding_shapefile’ do not exists”)
}
if(!file.exists(classification_filename)){
 stop(“‘classification_filename’ do not exists”)
}
#open shapefile
recod.shp <- shapefile(recoding_shapefile)
if(recod.shp@proj4string@projargs!=raster(classification_filename)@crs@projargs){
 stop(“shapefile do not have the same projection system as classification”)
}
recod.lyr <- unlist(strsplit(basename(recoding_shapefile),“[.]”))[1]
#open classification
class.ras <- raster(classification_filename)
#folders
temp.folder <- paste0(dirname(classification_filename),“/temp”);dir.create(temp.folder,showWarnings=F)
if(length(list.files(temp.folder))!=0){
 unlink(list.files(temp.folder,full.names=T),recursive=T,force=T)
}
############### processing ###############
#info needed
ras.res <- res(class.ras)
ras.ext <- extent(class.ras)
ras.ext <- c(ras.ext@xmin,ras.ext@ymin,ras.ext@xmax,ras.ext@ymax)
#prepare shapefiles
tar.ras <- paste0(temp.folder,“/temp_tar.tif”)
rec.ras <- paste0(temp.folder,“/temp_rec.tif”)
#target raster
gdal_rasterize(src_datasource=recoding_shapefile,
 dst_filename=tar.ras,
 te=ras.ext,
 tr=ras.res,
 a=target_column,
 l=recod.lyr,
 ot=“Byte”)
#recode raster
gdal_rasterize(src_datasource=recoding_shapefile,
 dst_filename=rec.ras,
 te=ras.ext,
 tr=ras.res,
 a=recode_column,
 l=recod.lyr,
 ot=“Byte”)
#input values
class.val <- values(class.ras)
class.val[is.na(class.val)] <- 0
#modifying values
tar.val <- values(raster(tar.ras))
rec.val <- values(raster(rec.ras))
#recode
class.val[class.val==tar.val] <- rec.val[class.val==tar.val]
class.val[class.val==0] <- NA
values(class.ras) <- class.val
############### save ###############
if(overwrite){
 output.name <- classification_filename
 writeRaster(class.ras,output.name,overwrite=T)
}else{
 output.name <- paste0(dirname(classification_filename),“/recoded_”,basename(classification_filename))
 writeRaster(class.ras,output.name,overwrite=T)
}
#clean
unlink(temp.folder,recursive=T,force=T)
References
- Bebbington, A.; Williams, M. Water and Mining Conflicts in Peru. Mt. Res. Dev. 2008, 28, 190–195. [Google Scholar] [CrossRef]
- Becker, A.; Bugmann, H. Global Change and Mountain Regions: The Mountain Research Initiative. IGBP Rep. 2001, 49, 86. [Google Scholar]
- Josse, C.; Cuesta, F.; Navarro, G.; Barrena, V.; Cabrera, E.; Chacón-Moreno, E.; Ferreira, W.; Peralvo, M.; Saito, J.; Tovar, A. Ecosistemas de Los Andes Del Norte y Centro. Bolivia, Colombia, Ecuador, Perú y Venezuela; Secretaría General de la Comunidad Andina, Programa Regional ECOBONA-Intercooperation, CONDESAN-Proyecto Páramo Andino, Programa BioAndes; EcoCiencia, NatureServe, IAvH, LTA-UNALM, ICAE-ULA, CDC-UNALM, RUMBOL SRL.: Lima, Peru, 2009. [Google Scholar]
- Congreso de la República del Perú—CRP. Law N° 24656—Ley General de Comunidades Campesinas; El peruano: Lima, Peru, 1987; p. 23. [Google Scholar]
- Castillo, M.; Castillo, L.; Monge, C.; Bustamante, M. Las Comunidades Campesinas En El Siglo XXI: Situación Actual y Cambios Normativos, 1st ed.; Laos, F.A., Ed.; Grupo ALLPA—Comunidades y Desarrollo: Lima, Peru, 2004. [Google Scholar]
- Comisión Técnica Regional Junín ZEE—CTRJ. Memoria Descriptiva Del Submodelo de Valor Histórico Cultural Del Departamento de Junín a Escala 1:100 000; Comisión Técnica Regional Junín ZEE—CTRJ: Huancayo, Peru, 2015. [Google Scholar]
- Valdivia, C.; Quiroz, R. Coping and Adapting to Increased Climate Variability in the Andes. In Proceedings of the American Agricultural Economics Association Annual Meeting, Montreal, QC, Canada, 27–30 July 2003; pp. 1–28. [Google Scholar]
- Kristjanson, P.; Krishna, A.; Radeny, M.; Kuan, J.; Quilca, G.; Sanchez-Urrelo, A.; Leon-Velarde, C. Poverty Dynamics and the Role of Livestock in the Peruvian Andes. Agric. Syst. 2007, 94, 294–308. [Google Scholar] [CrossRef]
- Postigo, J.C.; Young, K.R.; Crews, K.A. Change and Continuity in a Pastoralist Community in the High Peruvian Andes. Hum. Ecol. 2008, 36, 535–551. [Google Scholar] [CrossRef]
- Bartl, K.; Mayer, A.C.; Gómez, C.A.; Muñoz, E.; Hess, H.D.; Holmann, F. Economic Evaluation of Current and Alternative Dual-Purpose Cattle Systems for Smallholder Farms in the Central Peruvian Highlands. Agric. Syst. 2009, 101, 152–161. [Google Scholar] [CrossRef]
- Arellano-Yanguas, J. A Thoroughly Modern Resource Curse? The New Natural Resource Policy Agenda and the Mining Revival in Peru; IDS Working Paper; 300; IDS: Brighton, UK, 2008. [Google Scholar]
- Preciado Jerónimo, R. El Agua y Las Industrias Extractivas En El Perú: Un Análisis Desde La Gestión Integrada de Recursos Hídricos. In Agua e industrias extractivas Cambios y continuidades en los Andes; Urteaga, P., Ed.; Instituto de Estudios Peruanos: Lima, Peru, 2011; pp. 171–215. [Google Scholar]
- Robbins, P. Political Ecology: A Critical Introduction, 2nd ed.; Robbins, P., Ed.; J. Wiley & Sons: Oxford, UK, 2012. [Google Scholar]
- Food and Agriculture Organization—FAO. Fishery Harbour Manual on the Prevention of Pollution—Bay of Bengal Programme. Available online: http://www.fao.org/documents/card/en/c/ede95f62-dcfc-59c9-b598-20462a0488a3/ (accessed on 31 August 2017).
- Järup, L. Hazards of Heavy Metal Contamination. Br. Med. Bull. 2003, 68, 167–182. [Google Scholar] [CrossRef]
- Franks, D.M.; Davis, R.; Bebbington, A.; Ali, S.H.; Kemp, D.; Scurrah, M. Conflict Translates Environmental and Social Risk into Business Costs. Proc. Natl. Acad. Sci. USA 2014, 111, 7576–7581. [Google Scholar] [CrossRef]
- Jaskoski, M. Environmental Licensing and Conflict in Peru’s Mining Sector: A Path-Dependent Analysis. World Dev. 2014, 64, 873–883. [Google Scholar] [CrossRef]
- Ministerio de Energía y Minas—MEM. Decreto Supremo—DS N° 014-92-EM- Ley General de Minería; MEM: Lima, Peru, 1992; p. 68. [Google Scholar] [CrossRef]
- Arellano-Yanguas, J. ¿Minería Sin Fronteras? Conflicto y Desarrollo En Regiones Mineras Del Perú, 1st ed.; Arellano-Yanguas, J., Ed.; Instituto de Estudios Peruanos, Pontificia Universidad Católica del Perú, Universidad Antonio Ruiz de Montoya: Lima, Peru, 2011. [Google Scholar]
- Arellano-Yanguas, J. Local Politics, Conflict and Development in Peruvian Mining Regions. Ph.D. Thesis, University of Sussex, Brighton, UK, 2010. [Google Scholar]
- Congreso de la República del Perú—CRP. Law N° 27506—Ley Del Canon; Congreso de la República: Lima, Peru, 2001; p. 8. [Google Scholar]
- Sociedad Nacional de Minería Petróleo y Energía—SNMPE. El Canon, Sobrecanon y Las Regalías En El Perú (2008–2017), 1st ed.; Sociedad Nacional de Minería Petróleo y Energía—SNMPE, Ed.; Sociedad Nacional de Minería Petróleo y Energía—SNMPE: Lima, Peru, 2018. [Google Scholar]
- Congreso de la República del Perú—CRP. Law N° 28322—Ley Que Modifica Artículos de La Ley N° 27506; CRP: Lima, Peru, 2004; p. 3. [Google Scholar]
- Damonte, G.; Glave, M. Rent Distribution and Extractive Industry Conflicts: The Latin American Approach. Available online: https://assets.publishing.service.gov.uk/media/57a08a5ee5274a27b2000575/121019_ECO_ExtIndConMan_BRIEF3.pdf (accessed on 1 January 2012).
- Defensoría del Pueblo—Ombudsman of Peru. Noveno Informe de La Defensoría Del Pueblo; Defensoría del Pueblo: Lima, Peru, 2005. [Google Scholar]
- Defensoría del Pueblo—Ombudsman of Peru. Decimonoveno Informe Anual de La Defensoría Del Pueblo; Defensoría del Pueblo: Lima, Peru, 2014. [Google Scholar]
- Defensoría del Pueblo—Ombudsman of Peru. Decimonoveno Informe Anual de La Defensoría Del Pueblo; Defensoría del Pueblo: Lima, Peru, 2015. [Google Scholar]
- Defensoría del Pueblo—Ombudsman of Peru. Vigésimo Informe Anual de La Defensoría Del Pueblo; Defensoría del Pueblo: Lima, Peru, 2016. [Google Scholar]
- Defensoría del Pueblo—Ombudsman of Peru. Vigésimo Primer Informe Anual de La Defensoría Del Pueblo; Defensoría del Pueblo: Lima, Peru, 2017. [Google Scholar]
- Defensoría del Pueblo—Ombudsman of Peru. Décimo Informe Anual de La Defensoría Del Pueblo; Defensoría del Pueblo: Lima, Peru, 2006. [Google Scholar]
- Defensoría del Pueblo—Ombudsman of Peru. Undécimo Informe Anual de La Defensoría Del Pueblo; Defensoría del Pueblo: Lima, Peru, 2007. [Google Scholar]
- Defensoría del Pueblo—Ombudsman of Peru. Decimosegundo Informe Anual de La Defensoría Del Pueblo; Defensoría del Pueblo: Lima, Peru, 2008. [Google Scholar]
- Defensoría del Pueblo—Ombudsman of Peru. Decimotercer Informe Anual de La Defensoría Del Pueblo; Defensoría del Pueblo: Lima, Peru, 2009. [Google Scholar]
- Defensoría del Pueblo—Ombudsman of Peru. Decimocuarto Informe Anual de La Defensoría Del Pueblo; Defensoría del Pueblo: Lima, Peru, 2010. [Google Scholar]
- Defensoría del Pueblo—Ombudsman of Peru. Decimoquinto Informe Anual de La Defensoría Del Pueblo; Defensoría del Pueblo: Lima, Peru, 2011. [Google Scholar]
- Defensoría del Pueblo—Ombudsman of Peru. Decimosexto Informe Anual de La Defensoría Del Pueblo; Defensoría del Pueblo: Lima, Peru, 2012. [Google Scholar]
- Defensoría del Pueblo—Ombudsman of Peru. Decimoséptimo Informe Anual de La Defensoría Del Pueblo; Defensoría del Pueblo: Lima, Peru, 2013. [Google Scholar]
- Instituto Geológico Minero y Metalúrgico—INGEMMET. Atlas Catastral Minero y Geologico Del Peru; INGEMMET: Lima, Peru, 2017. [Google Scholar]
- América Economía. Perú Iniciará Este año Nueve Proyectos Mineros por más de US$11.500M|AméricaEconomía|AméricaEconomía. Available online: https://www.americaeconomia.com/negocios-industrias/peru-iniciara-este-ano-nueve-proyectos-mineros-por-mas-de-us11500m (accessed on 25 July 2018).
- Hartman, H.L.; Mutmansky, J.M. Introductory Mining Engineering, 2nd ed.; Hartman, H.L., Mutmansky, J.M., Eds.; John Wiley & Sons: Hoboken, NJ, USA, 2002. [Google Scholar]
- Martín-Duque, J.F.; Sanz, M.A.; Bodoque, J.M.; Lucía, A.; Martín-Moreno, C. Restoring Earth Surface Processes through Landform Design. A 13-Year Monitoring of a Geomorphic Reclamation Model for Quarries on Slopes. Earth Surf. Process. Landf. 2010, 35, 531–548. [Google Scholar] [CrossRef]
- King, B.; Goycoolea, M.; Newman, A. Optimizing the Open Pit-to-Underground Mining Transition. Eur. J. Oper. Res. 2017, 257, 297–309. [Google Scholar] [CrossRef]
- Bebbington, A.; Bury, J. Institutional Challenges for Mining and Sustainability in Peru. Proc. Natl. Acad. Sci. USA 2009, 106, 17296–17301. [Google Scholar] [CrossRef] [PubMed]
- Figueroa, E.; Orihuela, C.; Calfucura, E. Green Accounting and Sustainability of the Peruvian Metal Mining Sector. Resour. Policy 2010, 35, 156–167. [Google Scholar] [CrossRef]
- McDonell, E. The Co-Constitution of Neoliberalism, Extractive Industries, and Indigeneity: Anti-Mining Protests in Puno, Peru. Extr. Ind. Soc. 2015, 2, 112–123. [Google Scholar] [CrossRef]
- Bebbington, A.; Humphreys Bebbington, D.; Bury, J.; Lingan, J.; Muñoz, J.P.; Scurrah, M. Mining and Social Movements: Struggles Over Livelihood and Rural Territorial Development in the Andes. World Dev. 2008, 36, 2888–2905. [Google Scholar] [CrossRef]
- Cathain, A.O.; Murphy, E.; Nicholl, J. Multidisciplinary, Interdisciplinary, or Dysfunctional? Team Working in Mixed-Methods Research. Qual. Health Res. 2008, 18, 1574–1585. [Google Scholar] [CrossRef]
- Hesse-Biber, S. Mixed Methods Research: Merging Theory with Practice, 1st ed.; Hesse-Biber, S.N., Ed.; Guilford Press: London, UK, 2010. [Google Scholar]
- Hesse-Biber, S. Qualitative Approaches to Mixed Methods Practice. Qual. Inq. 2010, 16, 455–468. [Google Scholar] [CrossRef]
- United States Environmental Protection Agency—EPA. Method 200.7-Rev. 4.4., Determination of Metals and Trace Elements in Water and Wastes by Inductively Coupled Plasma-Atomic Emission Spectrometry; Revision 4; EPA: Twinsburg, OH, USA, 1994.
- Hagner, O.; Reese, H. A Method for Calibrated Maximum Likelihood Classification of Forest Types. Remote Sens. Environ. 2007, 110, 438–444. [Google Scholar] [CrossRef]
- R Core Team. R: A Language and Environment for Statistical Computing; GBIF: Copenhagen, Denmark, 2015; ISBN 3-900051-07-0. Available online: http://www.R-project.org/ (accessed on 30 July 2018).
- Hijmans, R.J.; van Etter, J.; Cheng, J.; Mattiuzzi, M.; Summer, M.; Greenberg, J.A.; Lamigueiro, O.P.; Bevan, A.; Racine, E.B.; Shortridge, A.; et al. Package “Raster”. Available online: https://CRAN.R-project.org/package=raster (accessed on 19 October 2019).
- Leutner, B.; Horning, N.; Schwalb-Willmann, J.; Hijmans, R.J. RStoolbox: Tools for Remote Sensing Data Analysis. Available online: https://rdrr.io/cran/RStoolbox/ (accessed on 19 October 2019).
- Gottlicher, D.; Obregón, A.; Homeier, J.; Rollenbeck, R.; Nauss, T.; Bendix, J. Land-Cover Classification in the Andes of Southern Ecuador Using Landsat ETM+ Data as a Basis for SVAT Modelling. Int. J. Remote Sens. 2009, 30, 1867–1886. [Google Scholar] [CrossRef]
- Ramirez-Gomez, S.O.I.; Brown, G.; Verweij, P.A.; Boot, R. Participatory Mapping to Identify Indigenous Community Use Zones: Implications for Conservation Planning in Southern Suriname. J. Nat. Conserv. 2016, 29, 69–78. [Google Scholar] [CrossRef]
- Allpa. Las Comunidades Campesinas En La Región Junín; Allpa: Lima, Peru, 2009. [Google Scholar]
- Comisión Técnica Regional Junín ZEE—CTRJ. Memoria Descriptiva Del Submodelo de Aptitud Urbano Industrial Del Departamento de Junín a Escala 1:100 000; CTRJ: Huancayo, Peru, 2015. [Google Scholar]
- Comisión Técnica Regional Junín ZEE—CTRJ. Memoria Descriptiva Del Estudio Cultural Del Departamento de Junín a Escala 1:100 000; CTRJ: Huancayo, Peru, 2015. [Google Scholar]
- Instituto Nacional de Estadística e Informática—INEI. Principales Indicadores. Available online: https://www.inei.gob.pe/ (accessed on 30 July 2018).
- Instituto Geofísico del Perú—IGP. Diagnóstico de La Cuenca Del Mantaro Bajo La Visión Del Cambio Climático, 1st ed.; Comisión Nacional del Ambiente—CONAM, Ed.; Fondo editorial del CONAM: Lima, Peru, 2005. [Google Scholar]
- Instituto Geofísico del Perú—IGP. Eventos Meteorológicos Extremos (Sequías, Heladas, Lluvias Intensas) En El Valle Del Mantaro-Tomo I, 1st ed.; Villaverde Calderón, M., Ed.; Instituto Geofísico del Perú: Lima, Peru, 2012. [Google Scholar] [CrossRef]
- Comisión Técnica Regional Junín ZEE—CTRJ. Memoria Descriptiva Del Estudio Geológico Del Departamento de Junín a Escala 1:100 000; CTRJ: Huancayo, Peru, 2015. [Google Scholar]
- Bloomberg. Azulcocha Mining, S.A.: Private Company Information—Bloomberg. Available online: https://www.bloomberg.com/research/stocks/private/snapshot.asp?privcapId=104768226 (accessed on 30 August 2017).
- Clean Technology. Estudio de Impacto Ambiental Unidad Económica Administrativa Azulcocha Tomo I; Clean Technology S.A.C.: Lima, Peru, 2007. [Google Scholar]
- Barradas, S. Corihuarmi mine, Peru. Available online: http://www.miningweekly.com/article/corihuarmi-mine-peru-2013-08-30 (accessed on 30 August 2017).
- Autoridad Nacional del Agua—ANA. Evaluación de Recursos Hídricos En La Cuenca de Mantaro; Autoridad Nacional del Agua: Lima, Peru, 2015. [Google Scholar]
- Autoridad Nacional del Agua—ANA. Evaluación de Recursos Hídricos de Doce Cuencas Hidrográficas Del Perú; ANA: Lima, Peru, 2016. [Google Scholar]
- Minera IRL. Corihuarmi Gold Mine. Available online: http://www.minera-irl.com/corihuarmi-3/ (accessed on 30 August 2017).
- Rumbo Minero. Entérate de las nuevas modificaciones al proyecto Huacravilca en Junín. Available online: http://www.rumbominero.com/noticias/mineria/enterate-de-las-nuevas-modificaciones-al-proyecto-huacravilca-en-junin/ (accessed on 30 August 2017).
- Fresnillo Perú S.A.C. Informe Técnico Sustentatorio: Reubicación de Plataformas, Redimensionamiento de Accesos y Ampliación Del Cronograma Del Proyecto Huacravilca; Fresnillo Perú S.A.C.: Lima, Peru, 2017. [Google Scholar]
- Blache Snow Consulting. Primera Modificación de La Declaración de Impacto Ambiental: Proyecto de Exploración Huacravilca; Blache Snow Consulting: Lima, Peru, 2012. [Google Scholar]
- Instituto Geológico Minero y Metalúrgico—INGEMMET. Geocatmin. Available online: http://geocatmin.ingemmet.gob.pe/geocatmin/ (accessed on 2 October 2018).
- Ministerio del Ambiente—MINAM. Decreto Supremo N° 015-2015-MINAM Modifican Los Estándares Nacionales de Calidad Ambiental Para Agua y Establecen Disposiciones Complementarias Para Su Aplicación; El Peruano; MINAM: Lima, Peru, 2015; p. 3. [Google Scholar]
- Ministerio del Ambiente—MINAM. Aprueban Estandares de Calidad Ambiental (ECA) Para Agua y Establecen Disposiciones Complementarias; El Peruano; MINAM: Lima, Peru, 2017; pp. 6–9. [Google Scholar]
- Ayers, R.S.; Westcot, D.W. Water Quality for Agriculture; Food and Agriculture Organization of the United Nations: Rome, Italy, 1985. [Google Scholar]
- Autoridad Nacional del Agua—ANA. Protocolo Nacional Para El Monitoreo de La Calidad de Los Recursos Hídricos Superficiales; ANA: Lima, Peru, 2016. [Google Scholar]
- Wise, J.M. Tectono-Stratigraphic Histoy of the Huancayo Intermontane Basin, Central Peru. Bol. Soc. Geol. Peru 2007, 102, 63–72. [Google Scholar]
- Mégard, F. Geología Del Cuadrángulo de Huancayo; Serv. Geol. y Minería: Lima, Peru, 1968. [Google Scholar]
- Bech, J.; Duran, P.; Roca, N.; Poma, W.; Sánchez, I.; Roca-Pérez, L.; Boluda, R.; Barceló, J.; Poschenrieder, C. Accumulation of Pb and Zn in Bidens Triplinervia and Senecio Sp. Spontaneous Species from Mine Spoils in Peru and Their Potential Use in Phytoremediation. J. Geochem. Explor. 2012, 123, 109–113. [Google Scholar] [CrossRef]
- Ministerio del Ambiente—MINAM. Guía Para El Muestreo de Suelos; MINAM: Lima, Peru, 2014. [Google Scholar]
- Instituto Geológico Minero y Metalúrgico—INGEMMET. Cuadrángulos de Mala, Lunahuaná, Tupe, Conayca, Chincha, Tantará y Castrovirreyna Abarcan Parte de Los Departamentos de Lima, Huancavelica y Junin (Huancayo); INGEMMET: Lima, Peru, 1983. [Google Scholar]
- Caballero Martín, V. Imperialismo y Campesinado, 1st ed.; Caballero Martín, V., Ed.; Instituto de Estudios Andinos: Lima, Peru, 1981. [Google Scholar]
- Organismo de Evaluación y Fiscalización Ambiental—OEFA. Reporte Público Del Informe de Supervisión Directa N° 165-2014-OEFA/DS-MIN; OEFA: Lima, Peru, 2014. [Google Scholar]
- Organismo de Evaluación y Fiscalización Ambiental—OEFA. Reporte Público Del Informe de Supervisión Directa N° 389-2013-OEFA/DS-MIN e Informe N° 166-2014-OEFA/DS-MIN; OEFA: Lima, Peru, 2013; p. 6. [Google Scholar]
- Jarvis, A.; Reuter, H.I.; Nelson, A.; Guevara, E. Hole-filled seamless SRTM data V4, International Centre for Tropical Agriculture (CIAT). Available online: http://srtm.csi.cgiar.org/ (accessed on 20 July 2018).
- U.S. Geological Survey—USGS. EarthExplorer—Home. Available online: https://earthexplorer.usgs.gov/ (accessed on 5 February 2018).
- Pimple, U.; Sitthi, A.; Simonetti, D.; Pungkul, S.; Leadprathom, K.; Chidthaisong, A. Topographic Correction of Landsat TM-5 and Landsat OLI-8 Imagery to Improve the Performance of Forest Classification in the Mountainous Terrain of Northeast Thailand. Sustainability 2017, 9, 258. [Google Scholar] [CrossRef]
- Esri. World Imagery. Available online: http://www.arcgis.com/home/item.html?id=10df2279f9684e4a9f6a7f08febac2a9 (accessed on 1 June 2018).
- McHugh, M.L. Interrater Reliability: The Kappa Statistic. Biochem. Med. 2012, 22, 276–282. [Google Scholar] [CrossRef]
- Organismo de Evaluación y Fiscalización Ambiental—OEFA. Reporte Público Del Informe N° 352-2011-OEFA/DS; OEFA: Lima, Peru, 2014; p. 6. [Google Scholar]
- Organismo de Evaluación y Fiscalización Ambiental—OEFA. Reporte Público Del Informe N° 889-2012-OEFA/DS; OEFA: Lima, Peru, 2012; p. 6. [Google Scholar]
- Organismo de Evaluación y Fiscalización Ambiental—OEFA. Reporte Público Del Informe N° 070-2014-OEFA/DS-MIN; OEFA: Lima, Peru, 2014; p. 8. [Google Scholar]
- Ministerio del Ambiente—MINAM. Decreto Supremo—DS N° 011-2017-MINAM; MINAM: Lima, Peru, 2017; p. 4. [Google Scholar]
- Organismo de Evaluación y Fiscalización Ambiental—OEFA. Resolución Directoral N° 491-2013-OEFA/DFSAI; OEFA: Lima, Peru, 2013; p. 24. [Google Scholar]
- Hoogesteger, J.; Urteaga, P. Agua e Inequidad: Discursos, Políticas y Medios de Vida En La Región Andina, 1st ed.; Hoogesteger, J., Urteaga, P., Eds.; Instituto de Estudios Peruanos: Lima, Peru, 2013. [Google Scholar]
- Rodbell, D.; Delman, E.; Abbott, M.; Besonen, M.; Tapia, P. The Heavy Metal Contamination of Lake Junín National Reserve, Peru: An Unintended Consequence of the Juxtaposition of Hydroelectricity and Mining. GSA Today 2014, 24, 4–10. [Google Scholar] [CrossRef]
- Martin, A.J.; McNee, J.J.; Pedersen, T.F. The Reactivity of Sediments Impacted Metal-Mining in Lago Junin, Peru. J. Geochem. Explor. 2001, 74, 175–187. [Google Scholar] [CrossRef]
- Blacksmith Institute. Peru—La Oroya Lead Pollution. Available online: https://www.pureearth.org/project/la-oroya-lead-pollution/ (accessed on 5 February 2019).
- Ng, J.C.; Wang, J.; Shraim, A. A Global Health Problem Caused by Arsenic from Natural Sources. Chemosphere 2003, 52, 1353–1359. [Google Scholar] [CrossRef]
- Flora, S.J.S. Arsenic: Chemistry, Occurrence, and Exposure. In Handbook of Arsenic Toxicology; Flora, S.J.S., Ed.; Elsevier Inc.: London, UK, 2015; pp. 1–49. [Google Scholar] [CrossRef]
- Levi Rendón, C. Estudio Del Yacimiento Minero de Cercapuquio; Universidad Nacional de Ingeniería: Lima, Peru, 1960. [Google Scholar]
- World Health Organisation—WHO. Health Risks of Heavy Metals from Long-Range Transboundary Air Poluution; WHO: Copenhagen, Denmark, 2007; ISBN 978 92 890 7179 6. [Google Scholar]
- Kabata-Pendias, A.; Pendias, H. Trace Elements in Soils and Plants, 3rd ed.; Kabata-Pendias, A., Pendias, H., Eds.; CRP Press LLC: London, UK, 2001. [Google Scholar]
- Shahid, M.; Shamshad, S.; Rafiq, M.; Khalid, S.; Bibi, I.; Niazi, N.K.; Dumat, C.; Rashid, M.I. Chromium Speciation, Bioavailability, Uptake, Toxicity and Detoxification in Soil-Plant System: A Review. Chemosphere 2017, 178, 513–533. [Google Scholar] [CrossRef]
- Peralta-Videa, J.R.; Lopez, M.L.; Narayan, M.; Saupe, G.; Gardea-Torresdey, J. The Biochemistry of Environmental Heavy Metal Uptake by Plants: Implications for the Food Chain. Int. J. Biochem. Cell Biol. 2009, 41, 1665–1677. [Google Scholar] [CrossRef]
- Razo, I.; Carrizales, L.; Castro, J.; Díaz-Barriga, F.; Monroy, M. Arsenic and Heavy Metal Pollution of Soil, Water and Sediments in a Semi-Arid Climate Mining Area in Mexico. Water Air Soil Pollut. 2004, 152, 129–152. [Google Scholar] [CrossRef]
- Cotler, J. Clases, Estado y Nación En El Perú, 3rd ed.; Cotler, J., Ed.; Instituto de Estudios Peruanos: Lima, Peru, 2016. [Google Scholar]
- Neumann, P. Toxic Talk and Collective (In)Action in a Company Town: The Case of La Oroya, Peru. Soc. Probl. 2016, 63, 431–446. [Google Scholar] [CrossRef]
- Martínez Alier, J.; Roca Jusmet, J. Economía Ecológica y Política Ambiental, 3rd ed.; Fondo de Cultura Económica—FCE: Mexico City, Mexico, 2015. [Google Scholar]
- Cooke, C.A.; Abbott, M.B. A Paleolimnological Perspective on Industrial-Era Metal Pollution in the Central Andes, Peru. Sci. Total Environ. 2008, 393, 262–272. [Google Scholar] [CrossRef] [PubMed]
- Abanto Kcomt, C. Segundo Informe Sobre Evolución de La Calidad de Aire En La Oroya; Asociación Civil Labor: Lima, Peru, 2007. [Google Scholar]
- Bury, J. Livelihoods, Mining and Peasant Protests in the Peruvian Andes. J. Lat. Am. Geogr. 2002, 1, 1–19. [Google Scholar] [CrossRef]
- Prado Fernández, J.M.; Manzanares Cáceres, D.; Velázquez Díaz, F.; Taya Acosta, E. Agua, Minería Y Comunidades Campesinas En La Región Tacna Water, Mining and Rural Communities in the Región Tacna. Cienc. Desarro. 2013, 13, 73–80. [Google Scholar]
- Conde, M. Resistance to Mining: A Review. Ecol. Econ. 2017, 132, 80–90. [Google Scholar] [CrossRef]
- Warnaars, X.S. Why Be Poor When We Can Be Rich? Constructing Responsible Mining in El Pangui, Ecuador. Resour. Policy 2012, 37, 223–232. [Google Scholar] [CrossRef]
- Ahlers, R. Fixing and Nixing: The Politics of Water Privatization. Rev. Radic. Political Econ. 2010, 42, 213–230. [Google Scholar] [CrossRef]


| Cunas Sub-Basin | Aimaraes Sub-Basin | |
|---|---|---|
| Mining Operation | Azulcocha (exploitation: Zn) | Huacravilca (exploration: Ag) Corihuarmi (exploitation: Au) |
| Mining-Affected Communities | San Pedro de Sulcan (25) Usibamba (238) Shicuy (75) | Huasicancha (251) Chongos Alto (108) Palmayoc (22) Palaco (23) Llamapsillon (55) |
| Not Mining-Affected Community | Chala (72) Santa Rosa de Huarmita (23) San José de Quero (30) Bellavista (50) Misquipata (30) Chucupata (20) | No control community |
| Sub-Basin | Sample | Lithology and Geochemistry | Surroundings of Sample Points | ||
|---|---|---|---|---|---|
| Geological unit | HM | Geological unit | HM | ||
| Cunas | B-AM (upstream Azulcocha) | Goyllarisquizga Group (Ki-g) | Chunumayo F. (Jm-ch) | ||
| Cercapuquio F. (Jm-c) | |||||
| A-AM (Downstream Azulcocha) | Jumasha F. (Ks-j) | Pariatambo F. (Ki-pt) | |||
| Glacial D. (Q-gl) | |||||
| B-UC (Control 1, upstream Usibamba) | Glacial, fluvial D. (Q-glfl) | Cr | Casapalca F. (KsP-c) | ||
| Alluvial D. (Q-al) | |||||
| A-UC (After Usibamba) | Alluvial D. (Q-al) | Cr, As, Cd | Casapalca F. (KsP-c) | Cr | |
| I-N (Confluence of rivers) | Glacial, fluvial D. (Q-glfl) | Alluvial D. (Q-al) | |||
| Casapalca F. (KsP-c) | |||||
| PN (Control 2) | Mataula F. (Np-m) | Cr | Alluvial D. (Q-al) | ||
| Casapalca F. (KsP-c) | |||||
| Aimaraes | I-L (Control 1) | Glacial D. (Q-gl) | Domo andesítico (N/dmand) | ||
| L-S (Control 2) | Glacial D. (Q-gl) | Chúlec F. (Ki-chu) | |||
| Casapalca F. (KsP-c) | |||||
| A-CM (Downstream Corihuarmi) | Glacial D. (Q-gl) | Hg, Cr, As | Jumasha F. (Ks-j) | ||
| Chúlec F. (Ki-chu) | |||||
| B-HM (upstream Huacravilca) | Condorsinga F. (Ji-c) | Cercapuquio F. (Jm-c) | |||
| Granite (N-gr) | |||||
| A-HM (Downstream Huacravilca) | Glacial D. (Q-gl) | Hg, Cr, As | Granite (N-gr) | ||
| Cercapuquio F. (Jm-c) | |||||
| A-CA-S (Downstream Huasicancha disputed area) | Colluvial D. (Q-cl) | Cr, As, Pb, Cd | Yanacancha F. (N-ya) | ||
| Rhyolite (Nri) | |||||
| Sub-Basin | Sample Point | Lithology and Geochemistry | Surroundings to Sample Points | ||
|---|---|---|---|---|---|
| Geological Unit | HM | Geological Unit | HM | ||
| Cunas | 12 km | Glacial, fluvial D. (Q-glfl) | Cr | Casapalca F. (KsP-c) | Cr |
| 24 km | Alluvial D. (Q-al) | As, Cr, Cd | Mataula F. (Np-m) | ||
| Casapalca F. (KsP-c) | |||||
| Control | Glacial, fluvial D. (Q-glfl) | Cr | Alluvial D. (Q-al) | ||
| Casapalca F. (KsP-c) | |||||
| Matula F. (Np-m) | |||||
| Aimaraes | 12 km | Glacial D. (Q-gl) | Cr, Hg, As, Pb | Condorsinga F. (Ji-c) | |
| Cercapuquio F. (Jm-c) | Cr | ||||
| 24 km | Colluvial D. (Q-cl) | Cr, As, Cd, Pb | Yanacancha F. (N-ya) | ||
| Riolita (Nri) | |||||
| Control | Alluvial D. (Q-al) | Cr | Condorsinga F. (Ji-c) | ||
| Yanacancha F. (N-ya) | |||||
| Land Cover Classes | Reference(Number of Samples) | Row Total | ||||||
|---|---|---|---|---|---|---|---|---|
| 1 | 2 | 3 | 4 | 5 | Total | Commission | ||
| Predicted | 1. Crops | 57 | 2 | 0 | 4 | 0 | 63 | 0.09 |
| 2. Infrastructure | 2 | 45 | 1 | 0 | 0 | 48 | 0.06 | |
| 3. Rocky outcrop | 3 | 0 | 59 | 0 | 1 | 63 | 0.06 | |
| 4. Vegetation | 6 | 0 | 10 | 65 | 0 | 81 | 0.19 | |
| 5. Water | 2 | 0 | 0 | 1 | 69 | 72 | 0.04 | |
| Column total | Total | 70 | 47 | 70 | 70 | 70 | ||
| Omission | 0.18 | 0.04 | 0.15 | 0.07 | 0.01 | |||
| Site | pH | Zn | As | Cd × 10−2 | Mn | |
|---|---|---|---|---|---|---|
| EQS | Irrigation | 6.5–9 | 2 | 0.1 | 1.0 | 0.2 |
| Livestock drinking | 6.5–9 | 24 | 0.2 | 5.0 | 0.2 | |
| This research * | 1 A-AM | 7.8 | 12.3 | 0.6 | 2.3 | 18.5 |
| 2 A-AM | 12.5 | 0.6 | 2.2 | 18.7 | ||
| OEFA report * | e01 | 8.2 | 0.2 | 3.0 | <0.0004 | 18.1 |
| e02 | 8.1 | 0.2 | 13.4 | <0.0004 | - | |
| pcp01 | 8.0 | 1.1 | 0.3 | 0.2 | 2.3 | |
| hv01 | 8.3 | 0.1 | 0.1 | <0.0004 | 0.1 | |
| esp01_14 | 8.0 | 0.1 | 0.1 | 0.1 | 0.1 | |
| esp02_14 | 7.9 | 0.3 | 3.0 | 0.2 | 19.8 | |
| vi01 | 8.2 | 0.8 | 0.2 | 1.0 | - |
| Site | pH | Cu | As | Cd × 10−1 | Fe | Mn | |
|---|---|---|---|---|---|---|---|
| EQS | Irrigation | 6.5–9 | 0.2 | 0.1 | 0.1 | 5 | 0.2 |
| Livestock drinking | 6.5–9 | 0.5 | 0.2 | 0.5 | - | 0.2 | |
| This research * | 1 B-HM | 5.4 | 0.071 | <0.010 | 0.1 | 50.0 | 2.1 |
| 2 B-HM | 0.072 | <0.010 | 0.1 | 52.0 | 2.1 | ||
| By OEFA * | sw02_10 | 4.6 | 0.2 | 0.5 | 0.1 | 36.1 | 0.4 |
| sw10_10 | 4.4 | 0.0 | <0.005 | 0.0 | 4.1 | 0.4 | |
| sw14_10 | 5.0 | 0.0 | 0.0 | 0.0 | 0.4 | 1.1 | |
| EBMI | 4.2 | 0.3 | 0.0 | - | - | - | |
| sw10_13 | 3.2 | 0.1 | 0.1 | 0.0 | 16.5 | 0.9 | |
| sw20_13 | 3.3 | 0.1 | 0.1 | 0.0 | 16.6 | 0.9 | |
| sw01_13 | 3.1 | 0.1 | 0.0 | <0.0024 | 25.9 | 1.4 | |
| sw19_13 | 3.1 | 0.1 | 0.0 | <0.0024 | 18.5 | 1.4 |
| Sample | As | Cd | Cr | Pb | |
|---|---|---|---|---|---|
| EQS | Farming soil | 50 | 1.4 | * | 70 |
| Control samples | Control-30 cm | 26.5 | 1.6 | 14.8 | 13.8 |
| Control-60 cm | 20.7 | 1.8 | 16.8 | 9.9 | |
| Case samples | 12 km-30 cm | 330.2 | 4.8 | 9.8 | 103.8 |
| 12 km-60 cm | 78.1 | 2.4 | 14.8 | 17.1 | |
| 24 km-30 cm | 77.5 | 2.7 | 19.4 | 26.2 | |
| 24 km-60 cm | 62.6 | 2.6 | 17.4 | 27.7 |
| Sample | As | Cd | Hg | Cr | |
|---|---|---|---|---|---|
| EQS | Farming soil | 50.0 | 1.4 | 6.6 | * |
| Control samples | Control-30 cm | 13.3 | 3.3 | <2.0 | 27.8 |
| Control-60 cm | 13.2 | 3.1 | <2.0 | 26.4 | |
| Cases samples | 12 km-30 cm | 84.6 | 4.4 | 9.4 | 22.4 |
| 12 km-60 cm | 99.9 | 4.0 | 5.4 | 20.8 | |
| 24 km-30 cm | 11.9 | 2.7 | <2.0 | 18.4 | |
| 24 km-60 cm | 6.9 | 2.8 | <2.0 | 17.4 |
© 2019 by the authors. Licensee MDPI, Basel, Switzerland. This article is an open access article distributed under the terms and conditions of the Creative Commons Attribution (CC BY) license (http://creativecommons.org/licenses/by/4.0/).
Share and Cite
Quispe-Zuniga, M.R.; Santos, F.; Callo-Concha, D.; Greve, K. Impact of Heavy Metals on Community Farming Activities in the Central Peruvian Andes. Minerals 2019, 9, 647. https://doi.org/10.3390/min9100647
Quispe-Zuniga MR, Santos F, Callo-Concha D, Greve K. Impact of Heavy Metals on Community Farming Activities in the Central Peruvian Andes. Minerals. 2019; 9(10):647. https://doi.org/10.3390/min9100647
Chicago/Turabian StyleQuispe-Zuniga, Melissa R., Fabián Santos, Daniel Callo-Concha, and Klaus Greve. 2019. "Impact of Heavy Metals on Community Farming Activities in the Central Peruvian Andes" Minerals 9, no. 10: 647. https://doi.org/10.3390/min9100647
APA StyleQuispe-Zuniga, M. R., Santos, F., Callo-Concha, D., & Greve, K. (2019). Impact of Heavy Metals on Community Farming Activities in the Central Peruvian Andes. Minerals, 9(10), 647. https://doi.org/10.3390/min9100647