Proposed Methodology to Evaluate CO2 Capture Using Construction and Demolition Waste


Abstract
:1. Introduction
2. Materials and Methods
2.1. Materials and Carbonation Test
2.2. Instrumental Techniques: Methodology
3. Results and Discussion
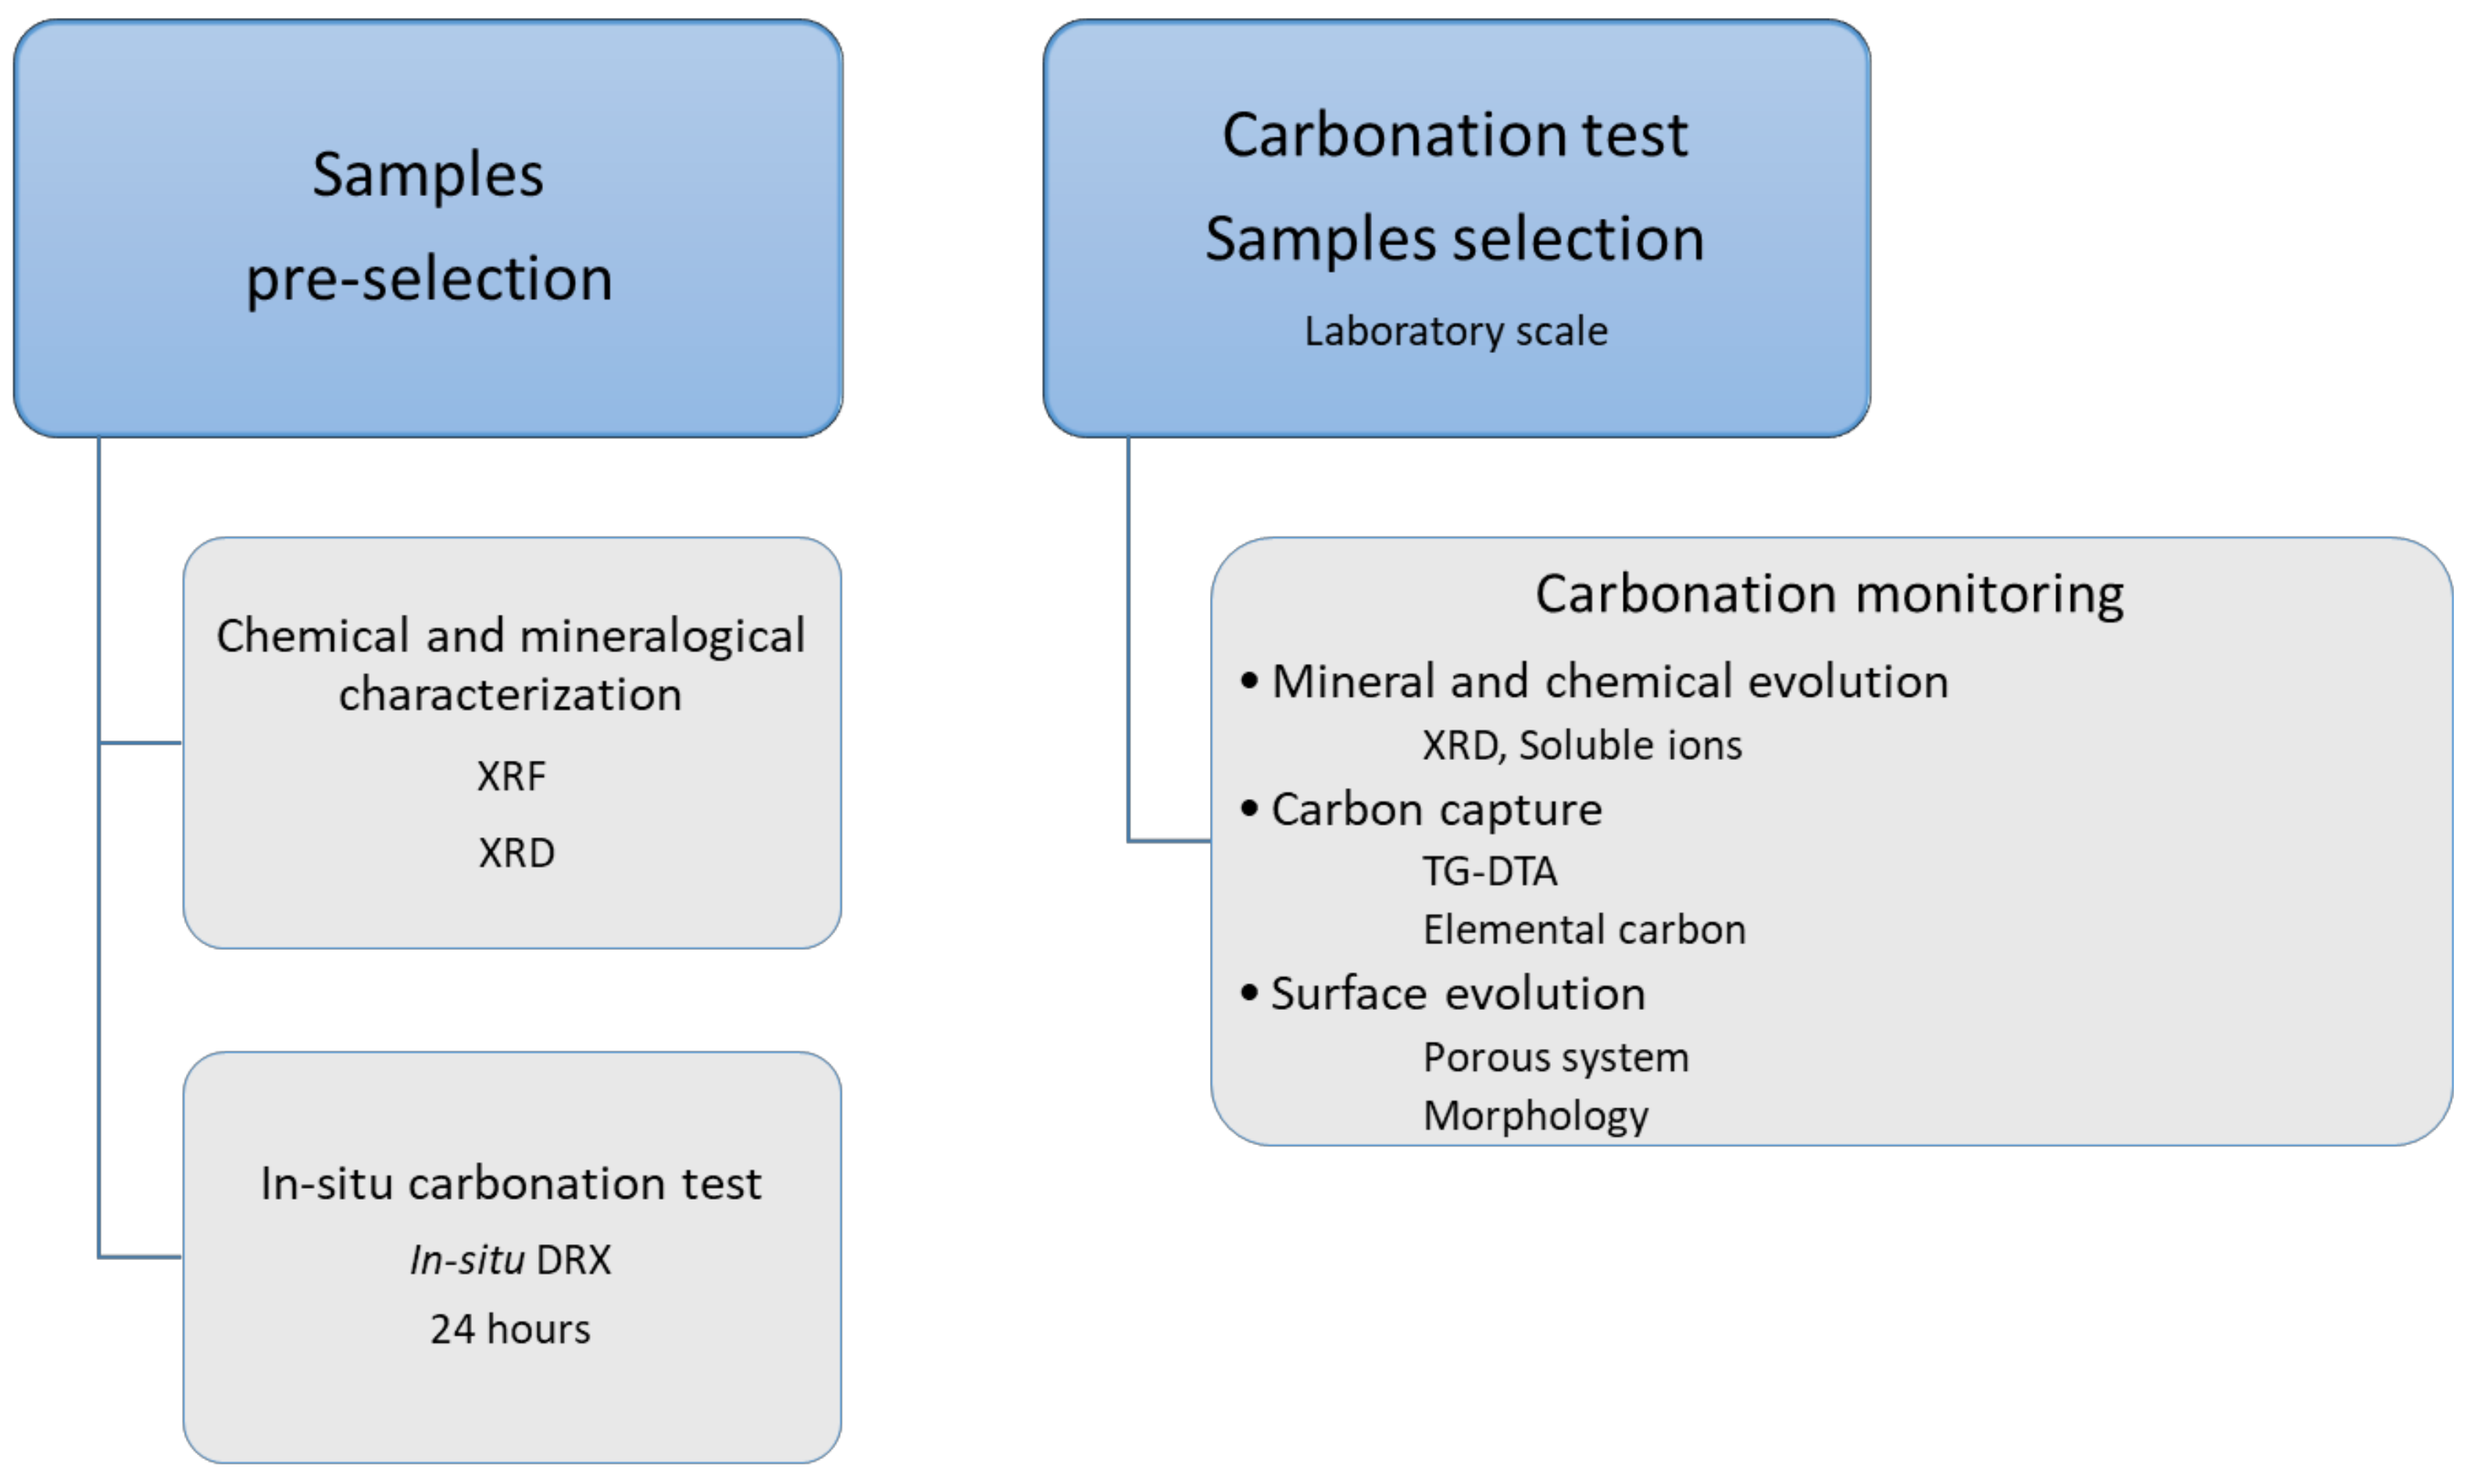
3.1. Proposed Methodological Sequence to Evaluate Effectiveness of Construction and Demolition Waste for CCS
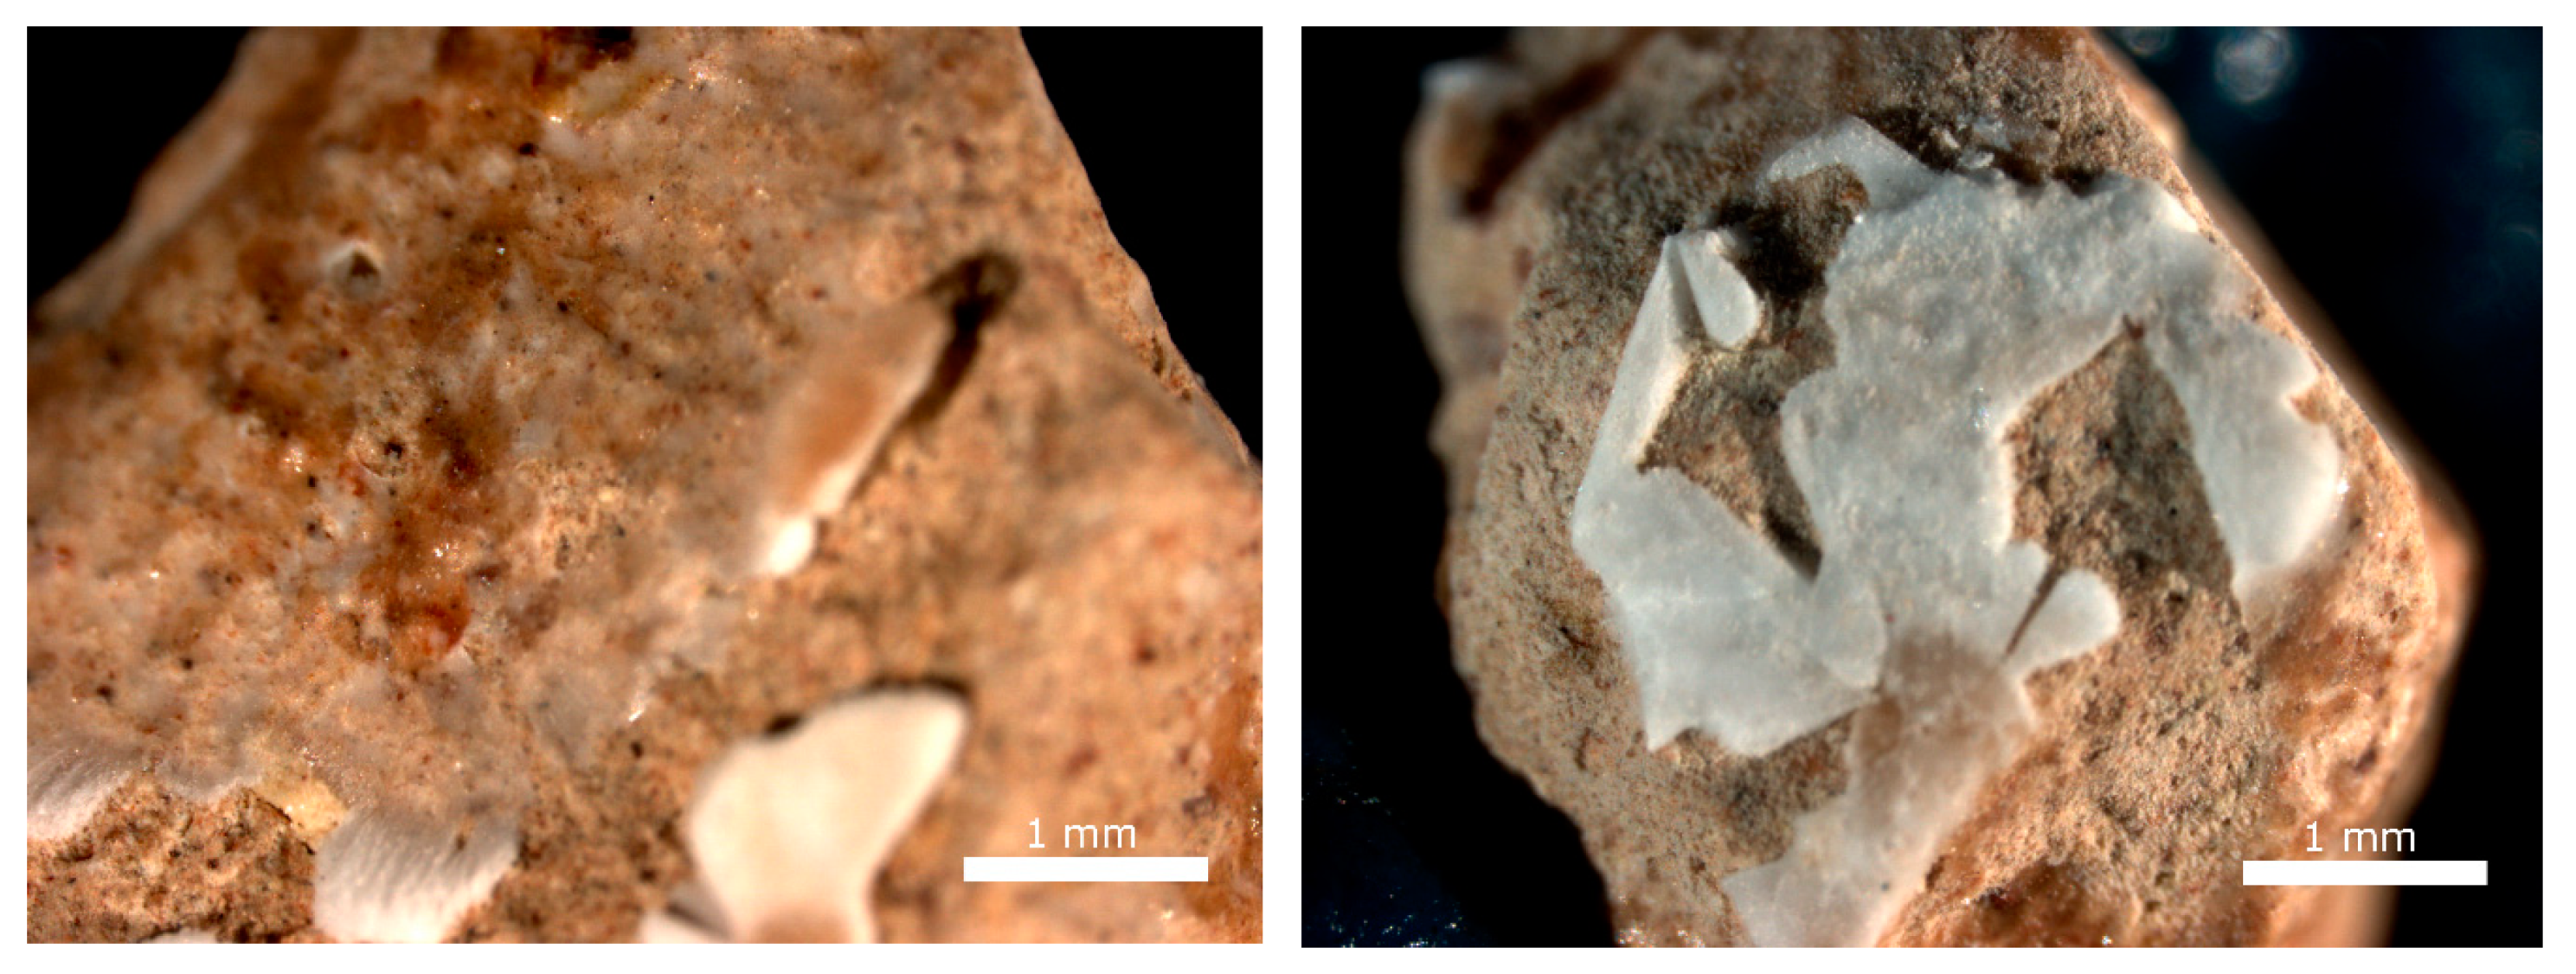
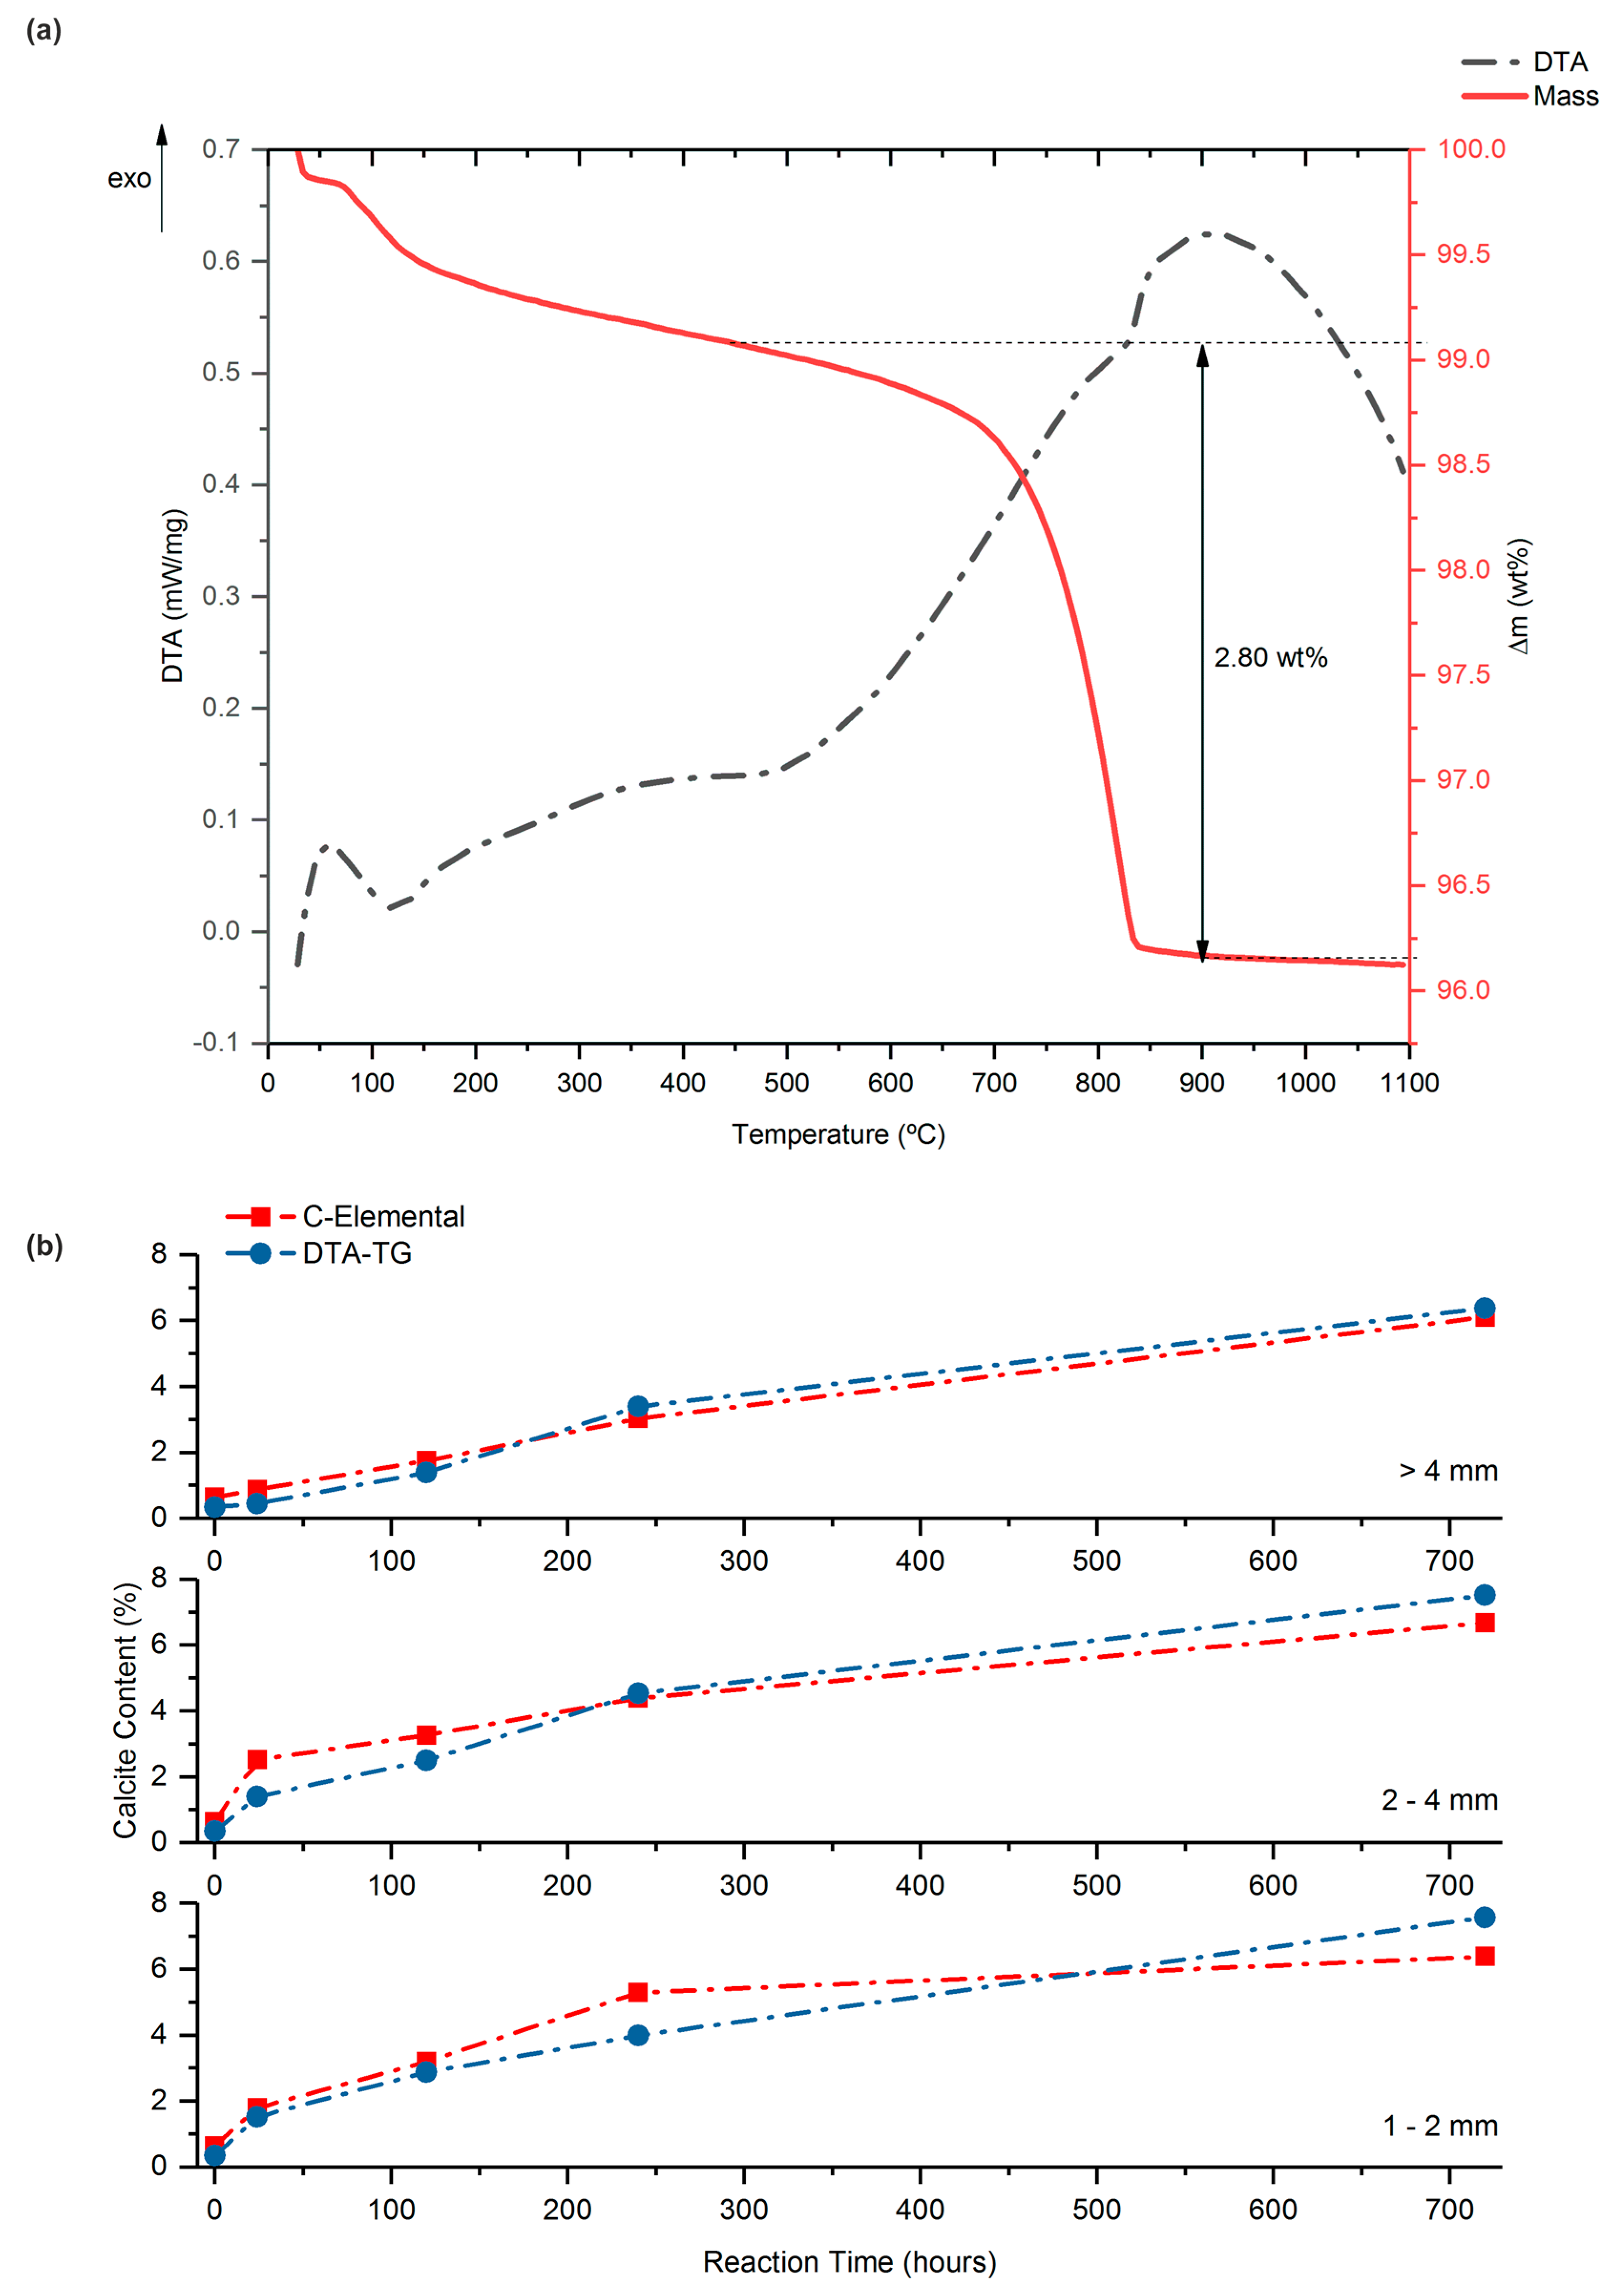
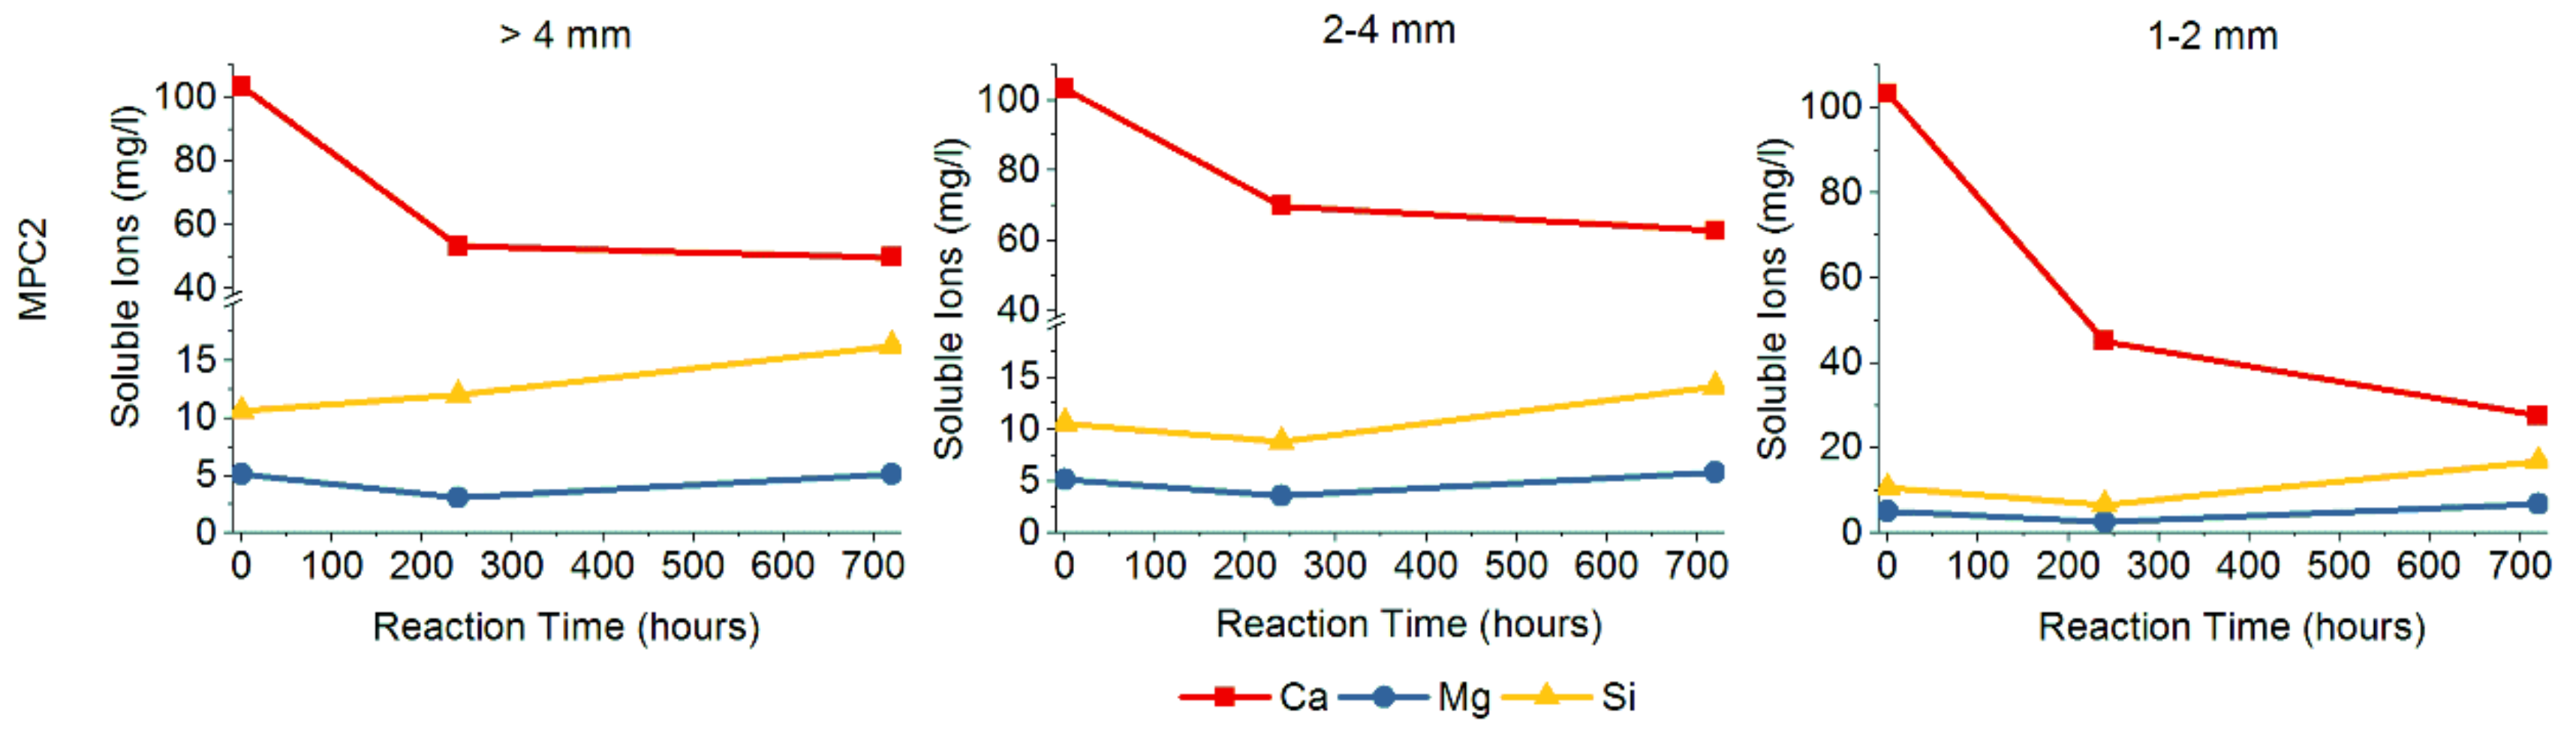
3.2. Validation of Proposed Methodology Using Ca-Silicate-Rich Brick
- Dissolution of CO2 in water for the production of a (bi-)carbonate:CO2 (g) + H2O (l) → H2CO3 (aq) → HCO3− (aq) + H+ (aq).
- Leaching Ca from wollastonite by acidic attack:CaSiO3 (s) + 2H+ (aq) → Ca2+ (aq) + H2O (l) + SiO2 (s).
- Nucleation and growth of calcium carbonate:Ca2+ (aq) + HCO3− (aq) → CaCO3 (s) + H+ (aq).
4. Conclusions
Supplementary Materials
Author Contributions
Funding
Acknowledgments
Conflicts of Interest
References
- Alberola, E.; Chevallier, J.; Chèze, B. The EU emissions trading scheme: The effects of industrial production and CO2 emissions on carbon prices. Econ. Int. 2008, 4, 93–125. [Google Scholar] [CrossRef]
- Caldeira, K.; Jain, A.K.; Hoffert, M.I. Climate sensitivity uncertainty and the need for energy without CO2 emission. Science 2003, 299, 2052–2054. [Google Scholar] [CrossRef] [PubMed]
- Pan, S.-Y.Y.; Chang, E.E.; Chiang, P.C. CO2 capture by accelerated carbonation of alkaline wastes: A review on its principles and applications. Aerosol Air Qual. Res. 2012, 12, 770–791. [Google Scholar] [CrossRef]
- Martín, D.; Aparicio, P.; Galán, E. Mineral carbonation of ceramic brick at low pressure and room temperature. A simulation study for a superficial CO2 store using a common clay as sealing material. Appl. Clay Sci. 2018, 161, 119–126. [Google Scholar] [CrossRef]
- Martín, D.; Aparicio, P.; Galán, E. Accelerated Carbonation of Ceramic Materials. Application to Bricks from Andalusian Factories (Spain). Constr. Build. Mater. 2018, 181, 598–608. [Google Scholar] [CrossRef]
- Martín, D.; Aparicio, P.; Galán, E. Time evolution of the mineral carbonation of ceramic bricks in a simulated pilot plant using a common clay as sealing material at superficial conditions. Appl. Clay Sci. 2019, 180, 105191. [Google Scholar] [CrossRef]
- Eighmy, T.; Gardner, K.; Seager, T. Method for Sequestering Carbon Dioxide. U.S. Patent US20050238563A1, 27 October 2005. Available online: https://patentimages.storage.googleapis.com/bb/49/8c/56d81ea0f8406a/US20050238563A1.pdf (accessed on 3 October 2019).
- Montes-Hernandez, G.; Pérez-López, R.; Renard, F.; Charlet, L.; Nieto, J.-M. Process for Sequestration of CO2 by Reaction with Alkaline Solid Waste. European Patent EP 07 1233005.5, 14 December 2007. Available online: https://patentimages.storage.googleapis.com/47/a0/49/787d3e0e245078/WO2007071633A1.pdf (accessed on 3 October 2019).
- Mayoral, M.C.; Andrés, J.M.; Gimeno, M.P. Optimization of mineral carbonation process for CO2 sequestration by lime-rich coal ashes. Fuel 2013, 106, 448–454. [Google Scholar] [CrossRef]
- Santos, R.M.; Van Bouwel, J.; Vandevelde, E.; Mertens, G.; Elsen, J.; Van Gerven, T. Accelerated mineral carbonation of stainless steel slags for CO2 storage and waste valorization: Effect of process parameters on geochemical properties. Int. J. Greenh. Gas Control 2013, 17, 32–45. [Google Scholar] [CrossRef]
- Sipilä, J.; Teir, S.; Zevenhoven, R. Carbon Dioxide Sequestration by Mineral Carbonation Literature Review Update 2005–2007. Report VT 2008-1. p. 52. Available online: http://innovationconcepts.nl/res/literatuurGPV/mineralcarbonationliteraturereview0507.pdf (accessed on 3 October 2019).
- Soong, Y.; Fauth, D.L.; Howard, B.H.; Jones, J.R.; Harrison, D.K.; Goodman, A.L.; Gray, M.L.; Frommell, E.A. CO2 sequestration with brine solution and fly ashes. Energy Convers. Manag. 2006, 47, 1676–1685. [Google Scholar] [CrossRef]
- Uibua, M.; Kuusik, R.; Andreas, L.; Kirsimäe, K. The CO2-binding by Ca-Mg-silicates in direct aqueous carbonation of oil shale ash and steel slag. Energy Procedia 2011, 4, 925–932. [Google Scholar] [CrossRef]
- Gunning, P.J.; Hills, C.D.; Carey, P.J. Accelerated carbonation treatment of industrial wastes. Waste Manag. 2010, 30, 1081–1090. [Google Scholar] [CrossRef] [PubMed]
- Geerlings, J.J.C.; Van Mossel, G.A.F.; Veen, B.C.M.I. Process for Sequestration of Carbon Dioxide by Mineral Carbonation. U.S. Patent US20100196235A1, 25 May 2010. Available online: https://patentimages.storage.googleapis.com/47/b3/78/16189676247184/US20100196235A1.pdf (accessed on 3 October 2019).
- Kawatra, S.K.; Eisele, T.C.; Simmons, J.J. Capture and Sequestration of Carbon Dioxide in Flue Gases. U.S. Patent 7.919.064B2, 5 April 2011. Available online: https://patentimages.storage.googleapis.com/3d/6c/86/beea6a2fc7f1ba/US7919064.pdf (accessed on 3 October 2019).
- Riman, R.E.; Atakan, V. Systems and Methods for Carbon Capture and Sequestration and Compositions Derived Therefrom. U.S. Patent US8114367B2, 14 February 2012. Available online: https://patentimages.storage.googleapis.com/72/67/38/c293969a42ecee/US8114367.pdf (accessed on 3 October 2019).
- Galán, E.; Aparicio, P. Captura y Secuestro de CO2 Mediante la Carbonatición de Residuos Cerámicos. WITO Patent WO2011089292A1, 28 July 2011. [Google Scholar]
- Costa, G.; Baciocchi, R.; Polettini, A.; Pomi, R.; Hills, C.D.; Carey, P.J. Current status and perspectives of accelerated carbonation processes on municipal waste combustion residues. Environ. Monit. Assess. 2007, 135, 55–75. [Google Scholar] [CrossRef] [PubMed]
- Dri, M.; Sanna, A.; Maroto-Valer, M.M. Mineral carbonation from metal wastes: Effect of solid to liquid ratio on the efficiency and characterization of carbonated products. Appl. Energy 2014. [Google Scholar] [CrossRef]
- Huntzinger, D.N.; Gierke, J.S.; Sutter, L.L.; Kawatra, S.K.; Eisele, T.C. Mineral carbonation for carbon sequestration in cement kiln dust from waste piles. J. Hazard. Mater. 2009, 168, 31–37. [Google Scholar] [CrossRef]
- Li, X.; Bertos, M.F.; Hills, C.D.; Carey, P.J.; Simon, S. Accelerated carbonation of municipal solid waste incineration fly ashes. Waste Manag. 2007, 27, 1200–1206. [Google Scholar] [CrossRef]
- Haselbach, L. Potential for carbon dioxide absorption in concrete. J. Environ. Eng. 2009, 135, 465–472. [Google Scholar] [CrossRef]
- Fernández Bertos, M.; Simons, S.J.R.; Hills, C.D.; Carey, P.J. A review of accelerated carbonation technology in the treatment of cement-based materials and sequestration of CO2. J. Hazard. Mater. 2004, 112, 193–205. [Google Scholar] [CrossRef]
- Seifritz, W. CO2 disposal by means of silicates. Nature 1990, 345, 486. [Google Scholar] [CrossRef]
- Lackner, K.S.; Wendt, C.H.; Butt, D.P.; Joyce, E.L.; Sharp, D.H. Carbon dioxide disposal in carbonate minerals. Energy 1995, 20, 1153–1170. [Google Scholar] [CrossRef]
- Huijgen, W.J.J.; Witkamp, G.J.; Comans, R.N.J. Mechanisms of aqueous wollastonite carbonation as a possible CO2 sequestration process. Chem. Eng. Sci. 2006, 61, 4242–4251. [Google Scholar] [CrossRef]
- Daval, D.; Martinez, I.; Corvisier, J.; Findling, N.; Goffé, B.; Guyot, F. Carbonation of Ca-bearing silicates, the case of wollastonite: Experimental investigations and kinetic modeling. Chem. Geol. 2009, 262, 262–277. [Google Scholar] [CrossRef]
- Huijgen, W.J.J.; Ruijg, G.J.; Comans, R.N.J.; Witkamp, G.J. Energy consumption and net CO2 sequestration of aqueous mineral carbonation. Ind. Eng. Chem. Res. 2006, 45, 9184–9194. [Google Scholar] [CrossRef]
- Tai, C.Y.; Chen, W.; Shih, S. Factors affecting wollastonite carbonation under CO2 supercritical conditions. AIChE J. 2006, 52, 292–299. [Google Scholar] [CrossRef]
- Huntzinger, D.N.; Gierke, J.S.; Kawatra, S.K.; Eisele, T.C.; Sutter, L.L. Carbon Dioxide Sequestration in Cement Kiln Dust through Mineral Carbonation. Environ. Sci. Technol. 2009, 43, 1986–1992. [Google Scholar] [CrossRef] [PubMed]
- Steinour, H.H. Some effects of carbon dioxide on mortars and concrete-discussion. J. Am. Concr. Inst 1959, 30, 905–907. [Google Scholar]
- Yixin, S.; Xudong, Z.; Monkman, S. A new CO2 sequestration process via concrete products production. In Proceedings of the 2006 IEEE EIC Climate Change Conference, Ottawa, ON, Canada, 10–12 May 2006. [Google Scholar]
- Wang, W.; Xiao, J.; Wei, X.; Ding, J.; Wang, X.; Song, C. Development of a new clay supported polyethylenimine composite for CO2 capture. Appl. Energy 2014, 113, 334–341. [Google Scholar] [CrossRef]
- Mun, M.; Cho, H. Mineral carbonation for carbon sequestration with industrial waste. Energy Procedia 2013, 37, 6999–7005. [Google Scholar] [CrossRef]
- Prigiobbe, V.; Hänchen, M.; Werner, M.; Baciocchi, R.; Mazzotti, M. Mineral carbonation process for CO2 sequestration. Energy Procedia 2009, 1, 4885–4890. [Google Scholar] [CrossRef]
- Lim, M.; Han, G.C.; Ahn, J.W.; You, K.S. Environmental remediation and conversion of carbon dioxide (CO2) into useful green products by accelerated carbonation technology. Int. J. Environ. Res. Public Health 2010, 7, 203–228. [Google Scholar] [CrossRef]
- Villagrán-Zaccardi, Y.A.; Egüez-Alava, H.; De Buysser, K.; Gruyaert, E.; De Belie, N. Calibrated quantitative thermogravimetric analysis for the determination of portlandite and calcite content in hydrated cementitious systems. Mater. Struct. 2017, 50, 179. [Google Scholar] [CrossRef]


| Sample | SiO2 | Al2O3 | Fe2O3 | MnO | MgO | CaO | Na2O | K2O | TiO2 | P2O5 | SO3 | LOI | TOTAL |
|---|---|---|---|---|---|---|---|---|---|---|---|---|---|
| MPC2 | 56.8 | 16.6 | 5.4 | 0.1 | 1.9 | 14.8 | 0.6 | 2.6 | 0.9 | 0.1 | 0.3 | 0.8 | 100.8 |
| Detection Limit (DL) | 0.01 | 0.01 | 0.01 | 0.02 | 0.01 | 0.04 | 0.01 | 0.02 | 0.03 | 0.01 | 0.22 | ||
| Quantification Limit (QL) | 0.02 | 0.02 | 0.02 | 0.03 | 0.02 | 0.05 | 0.03 | 0.03 | 0.10 | 0.02 | 0.23 | ||
| Relative Error | 0.012 | 0.020 | 0.058 | 0.184 | 0.007 | 0.047 | 0.038 | 0.028 | 0.061 | 0.025 | 0.063 |
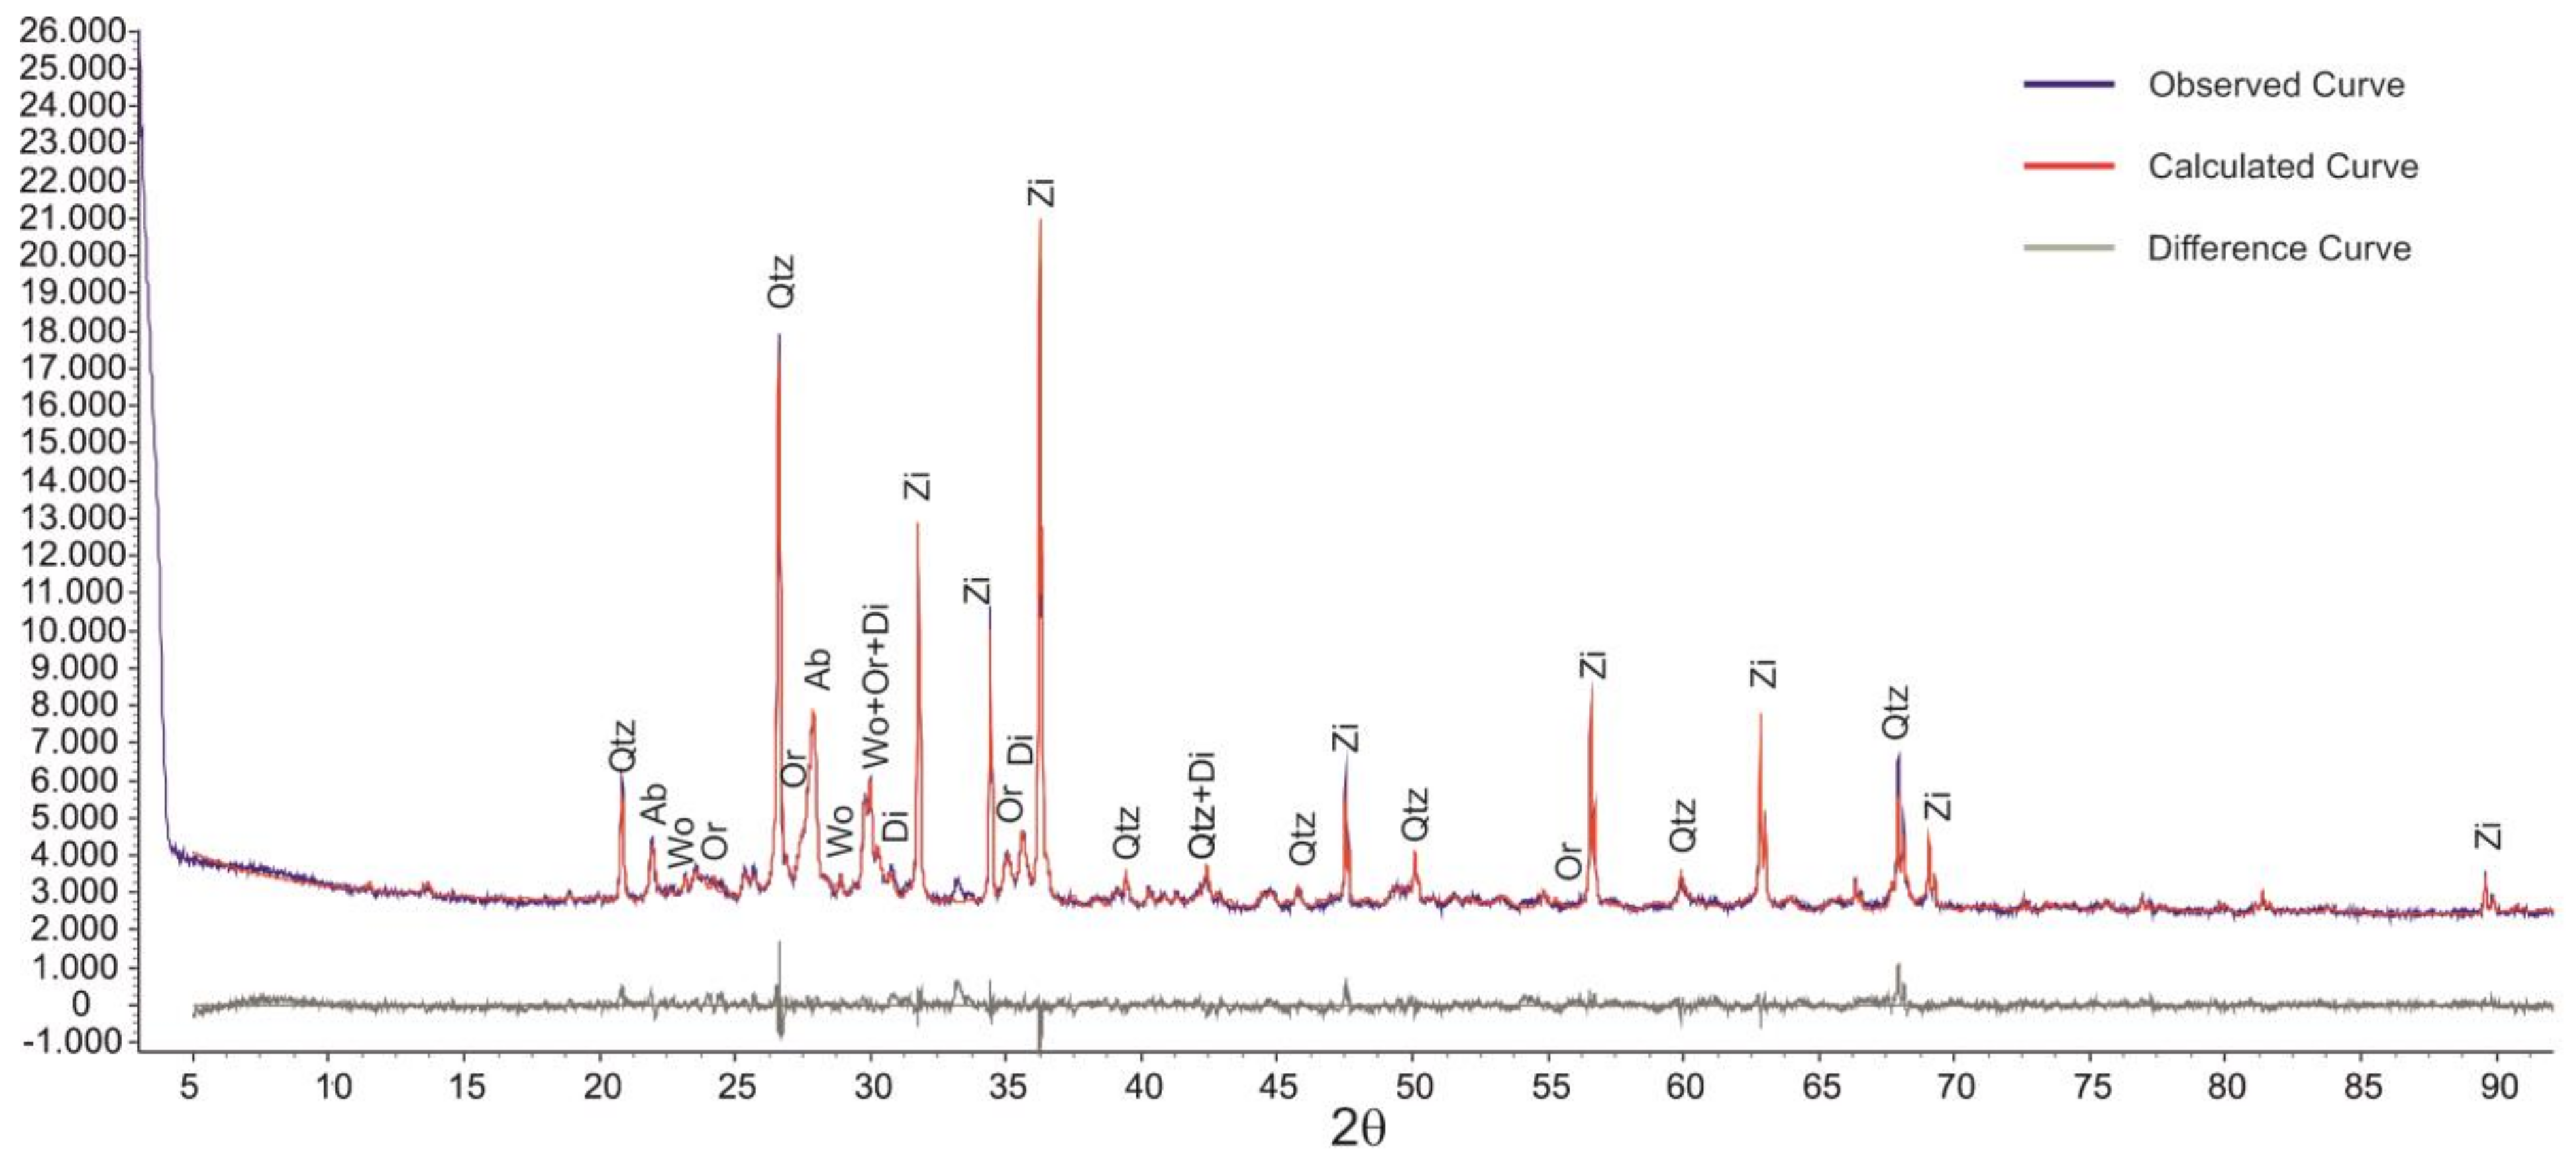
| Sample | Qtz | Wo | Or | Ab | Di | An | Amor |
|---|---|---|---|---|---|---|---|
| MPC2 | 20.5 | 6.2 | 3.7 | 11.8 | 4.7 | 29.5 | 23.6 |
| Rietveld Refinement | Rexp: | 1.86 | GOF: | 1.72 | Rwp: | 3.21 |
| Particle Size | Reaction Time | C-Elemental | Mass Loss | Calcite | Calcite |
|---|---|---|---|---|---|
| (mm) | (hours) | (wt %) | (wt %) | (wt %) | (wt %) |
| MPC2 | by C-Elemental | by DTA-TG | |||
| Original | 0 | 0.08 | 0.15 | 0.63 | 0.34 |
| >4 mm | 24 | 0.10 | 0.20 | 0.87 | 0.45 |
| >4 mm | 120 | 0.21 | 0.61 | 1.74 | 1.39 |
| >4 mm | 240 | 0.36 | 1.49 | 3.02 | 3.39 |
| >4 mm | 720 | 0.73 | 2.80 | 6.10 | 6.37 |
| 2–4 mm | 24 | 0.30 | 0.61 | 2.51 | 1.39 |
| 2–4 mm | 120 | 0.39 | 1.10 | 3.26 | 2.50 |
| 2–4 mm | 240 | 0.53 | 1.99 | 4.38 | 4.53 |
| 2–4 mm | 720 | 0.80 | 3.30 | 6.67 | 7.51 |
| 1–2 mm | 24 | 0.21 | 0.67 | 1.79 | 1.52 |
| 1–2 mm | 120 | 0.38 | 1.26 | 3.19 | 2.87 |
| 1–2 mm | 240 | 0.63 | 1.75 | 5.29 | 3.98 |
| 1–2 mm | 720 | 0.77 | 3.33 | 6.38 | 7.57 |
| Particle Size | Pressure | Reaction Time | CO2 Exp | Efficiency |
|---|---|---|---|---|
| (mm) | (bar) | (hours) | (wt %) | (%) |
| MPC2 | ||||
| Original | 10 | 0 | 0.15 | 1.00 |
| >4 mm | 10 | 24 | 0.20 | 1.32 |
| >4 mm | 10 | 120 | 0.61 | 4.08 |
| >4 mm | 10 | 240 | 1.49 | 9.94 |
| >4 mm | 10 | 720 | 2.80 | 18.67 |
| 2–4 mm | 10 | 24 | 0.61 | 4.08 |
| 2–4 mm | 10 | 120 | 1.10 | 7.33 |
| 2–4 mm | 10 | 240 | 1.99 | 13.28 |
| 2–4 mm | 10 | 720 | 3.30 | 22.02 |
| 1–2 mm | 10 | 24 | 0.67 | 4.46 |
| 1–2 mm | 10 | 120 | 1.26 | 8.41 |
| 1–2 mm | 10 | 240 | 1.75 | 11.67 |
| 1–2 mm | 10 | 720 | 3.33 | 22.19 |
| Total Fraction | 1 | 720 | 3.20 | 21.33 |
© 2019 by the authors. Licensee MDPI, Basel, Switzerland. This article is an open access article distributed under the terms and conditions of the Creative Commons Attribution (CC BY) license (http://creativecommons.org/licenses/by/4.0/).
Share and Cite
Martín, D.; Flores-Alés, V.; Aparicio, P. Proposed Methodology to Evaluate CO2 Capture Using Construction and Demolition Waste. Minerals 2019, 9, 612. https://doi.org/10.3390/min9100612
Martín D, Flores-Alés V, Aparicio P. Proposed Methodology to Evaluate CO2 Capture Using Construction and Demolition Waste. Minerals. 2019; 9(10):612. https://doi.org/10.3390/min9100612
Chicago/Turabian StyleMartín, Domingo, Vicente Flores-Alés, and Patricia Aparicio. 2019. "Proposed Methodology to Evaluate CO2 Capture Using Construction and Demolition Waste" Minerals 9, no. 10: 612. https://doi.org/10.3390/min9100612
APA StyleMartín, D., Flores-Alés, V., & Aparicio, P. (2019). Proposed Methodology to Evaluate CO2 Capture Using Construction and Demolition Waste. Minerals, 9(10), 612. https://doi.org/10.3390/min9100612