Article

Geochronology, Oxidization State and Source of the Daocheng Batholith, Yidun Arc: Implications for Regional Metallogenesis

State Key Laboratory of Geological Processes and Mineral Resources, China University of Geosciences, Beijing 100083, China
*
Author to whom correspondence should be addressed.
Minerals 2019, 9(10), 608; https://doi.org/10.3390/min9100608
Submission received: 14 August 2019 / Revised: 14 September 2019 / Accepted: 30 September 2019 / Published: 3 October 2019
(This article belongs to the Section Mineral Deposits)

Abstract

:
The Daocheng batholith consists of granite, granodiorite and K-feldspar megacrystic granite, which is located in the north Yidun Arc. It is a barren batholith in contrast to plutons of the same age that contain major copper deposits, such as Pulang to the south. In the Daocheng, abundant mafic microgranular enclaves (MMEs) mainly developed within granodiorite and K-feldspar megacrystic granite, which are characterized by quenched apatite, quartz eyes and plagioclase phenocrysts. LA-ICP-MS zircon U–Pb dating of host granodiorite yielded ages ranging from 223 Ma to 210 Ma, with a weighted mean of 215.3 ± 1.8 Ma. Zircons from MMEs yielded ages ranging from 218 Ma to 209 Ma, with a weighted mean of 214.2 ± 1.4 Ma. Geochemical analyses show that granodiorite is high-K, calc-alkaline and I-type, with SiO2 contents ranging from 67.90% to 70.54%. These rocks are metaluminous to marginally peraluminous (A/CNK = 0.98–1.00) and moderately rich in alkalis with K2O ranging from 3.28% to 4.59% and Na2O ranging from 3.18% to 3.20%, with low MgO (1.08%–1.29%), Cr (12.7 ppm–16.8 ppm), Ni (5.19 ppm–6.16 ppm) and Mg# (35–49). The MMEs have relatively low SiO2 contents (56.34%–60.91%), higher Al2O3 contents (16.06%–17.98%), higher MgO and FeO abundances and are metaluminous (A/CNK = 0.82–0.83). The MMEs and host granodiorite are enriched in light rare-earth elements (LREEs) relative to heavy rare-earth elements (HREEs), with slightly negative Eu anomalies, and enriched in Th, U and large ion lithophile elements (LILEs; e.g., K, Rb and Pb), and depleted in high field strength elements (HFSEs; e.g., Nb, Ta, P and Ti), showing affinities typical of arc magmas. The zircon εHf(t) values (−6.28 to −2.33) and ancient two-stage Hf model ages of 1.92 to 1.25 Ga, indicating that the magmas are generally melts that incorporated significant portions of Precambrian crust. The relatively low silica contents and high Mg# values of the MMEs, and the linear patterns of MgO, Al2O3 and Fe2O3 with SiO2 between the MMEs and host granodiorite, showing the formation of MMEs are genetically related to magma mixing. The Daocheng granodiorite is characterized by much lower zircon Ce4+/Ce3+ (average of 3.53) and low fO2 value (average of ∆FMQ = –10.84), whereas the ore-bearing quartz monzonite porphyries in the Pulang copper deposit are characterized by much higher zircon Ce4+/Ce3+ (average of 52.10) and high fO2 value (average of ∆FMQ = 2.8), indicating the ore-bearing porphyry intrusions had much higher fO2 of magma than the ore-barren intrusions considering that the high oxygen fugacity of the magma is conducive to mineralization.

1. Introduction

The nearly north–south trending Yidun Arc (YA) is a vital tectonic magmatic belt and copper-polymetallic metallogenic belt in the northern Sanjiang Tethys [1,2], which is located in the eastern part of the Tibet plateau [1,3,4,5,6] (Figure 1). It was formed by the westward subduction of the Late Triassic Garze–Litang ocean slab [2,7,8]. The YA mainly developed volcano-sedimentary rocks and granitic intrusions, recording the tectono-magmatic evolution of the Sanjiang Orogenic Belt during the Triassic [9]. Voluminous granite, granodiorite and monzogranite were intruded the deformed Paleozoic and Middle to Late Triassic volcano-sedimentary sequences along the YA. The North Yidun Arc (NYA) intrusions are dominated by granite batholith, while the rock types in the South Yidun Arc (SYA) are mainly quartz diorite porphyry, quartz monzonite porphyry and granite porphyry [6,10]. Based on the tectonic settings, granitoid affinities and mineralization styles, Hou et al. [11] summarized the mineralization diversity of YA. The NYA is characterized by an intra-arc rift and a back-arc basin, with the development of volcanic massive sulfide Zn–Pb–Ag–Cu deposits and epithermal Ag–Hg deposits, however, the large-scale granitic batholiths of the NYA like that being studied here do not host any known economic deposits. The SYA (known as the “Zhongdian” arc) lacks a back-arc basin, but it developed extensive calc-alkaline arc volcanic rocks and porphyry–skarn Cu-polymetallic deposits [9,12]. Among these porphyry deposits, the Pulang copper deposit is the largest formed in the Late Triassic [12,13,14]. Although there is an overlap of emplacement ages between SYA Pulang ore-bearing porphyry and NYA Daocheng granitoid, the Daocheng granitoid has no mineralization and if we can understand why, we can guide regional metallogenic exploration strategies.
The Daocheng batholith is a large (2800 km2) Late Triassic complex in western Sichuan Province [1,6,15,16]. The pluton is composed of a coarse- to medium-grained biotite monzogranite in the center, medium- to fine-grained granodiorite and quartz diorite along its margin and a small amount of diorite [17,18]. The characteristic and abundant MMEs (Figure 2a) mainly lie within granodiorite (Figure 2b,e) and K-feldspar megacrystic granite (Figure 2c,f), are rare in granite. The emplacement ages, geochemical characteristics and tectonic setting of the Daocheng batholith are relevant to the subduction of the Garze–Litang ocean slab. These granites have been interpreted to have formed at ca. 215 Ma in a magmatic arc setting and were generated from the partial melting of a common Mesoproterozoic-dominated source [19,20]. He et al. [17] and Wang et al. [21] have suggested the Daocheng batholith was a syn-collisional following the westward subduction of the Garze–Litang paleo-tethys oceanic slab, and the Daocheng batholith was derived from the partial melting of a Late Paleoproterozoic to Early Mesoproterozoic lower crust with minor addition of mantle-derived magma. Wu et al. [22] concluded that the magma source was a mixture of the Proterozoic Kangding Complex, derived from the Yangtze Craton and metasedimentary rock from the NYA basement. Other researchers have suggested that these rocks formed at ca. 224 Ma in a syn-collisional to post-collisional tectonic setting and were derived from the partial melting of Precambrian upper crustal turbiditic succession [23,24,25]. Although previous studies focused on geochronology, geochemistry and isotopes, the petrogenesis, tectonic setting and magma source, the petrogenesis of the Daocheng batholith remains controversial. A part of that petrogenesis is abundant MMEs developed within the granodiorite and K-feldspar megacrystic granite. The MMEs are characterized by quenched apatite (Figure 2d), quartz eyes (Figure 2g) and plagioclases phenocrysts. The Late Triassic SYA Pulang complex and the NYA Cuojiaoma batholiths have been interpreted as having characteristics of magma mixing [26,27]. The potential for magma mixing, and the oxygen fugacity (fO2) signatures of the Daocheng batholith, on the other hand, have not previously been published.
In this contribution, we have produced four laser ablation–inductively coupled plasma–mass spectrometry (LA–ICP–MS) zircon U–Pb ages, zircon trace element and Lu–Hf isotope analysis and whole-rock geochemistry on granodiorite and MMEs from the Daocheng batholith. The integration of the U–Pb ages, εHf(t) and fO2 values, combined with previous investigation, allows us to (1) constrain the timing of magmatic activities of Daocheng batholith, (2) discuss the petrogenesis, magma source and tectonic setting of granodiorite and MMEs and (3) evaluate the possible reasons that led to the metallogenic differences from north to south of the Yidun island arc.

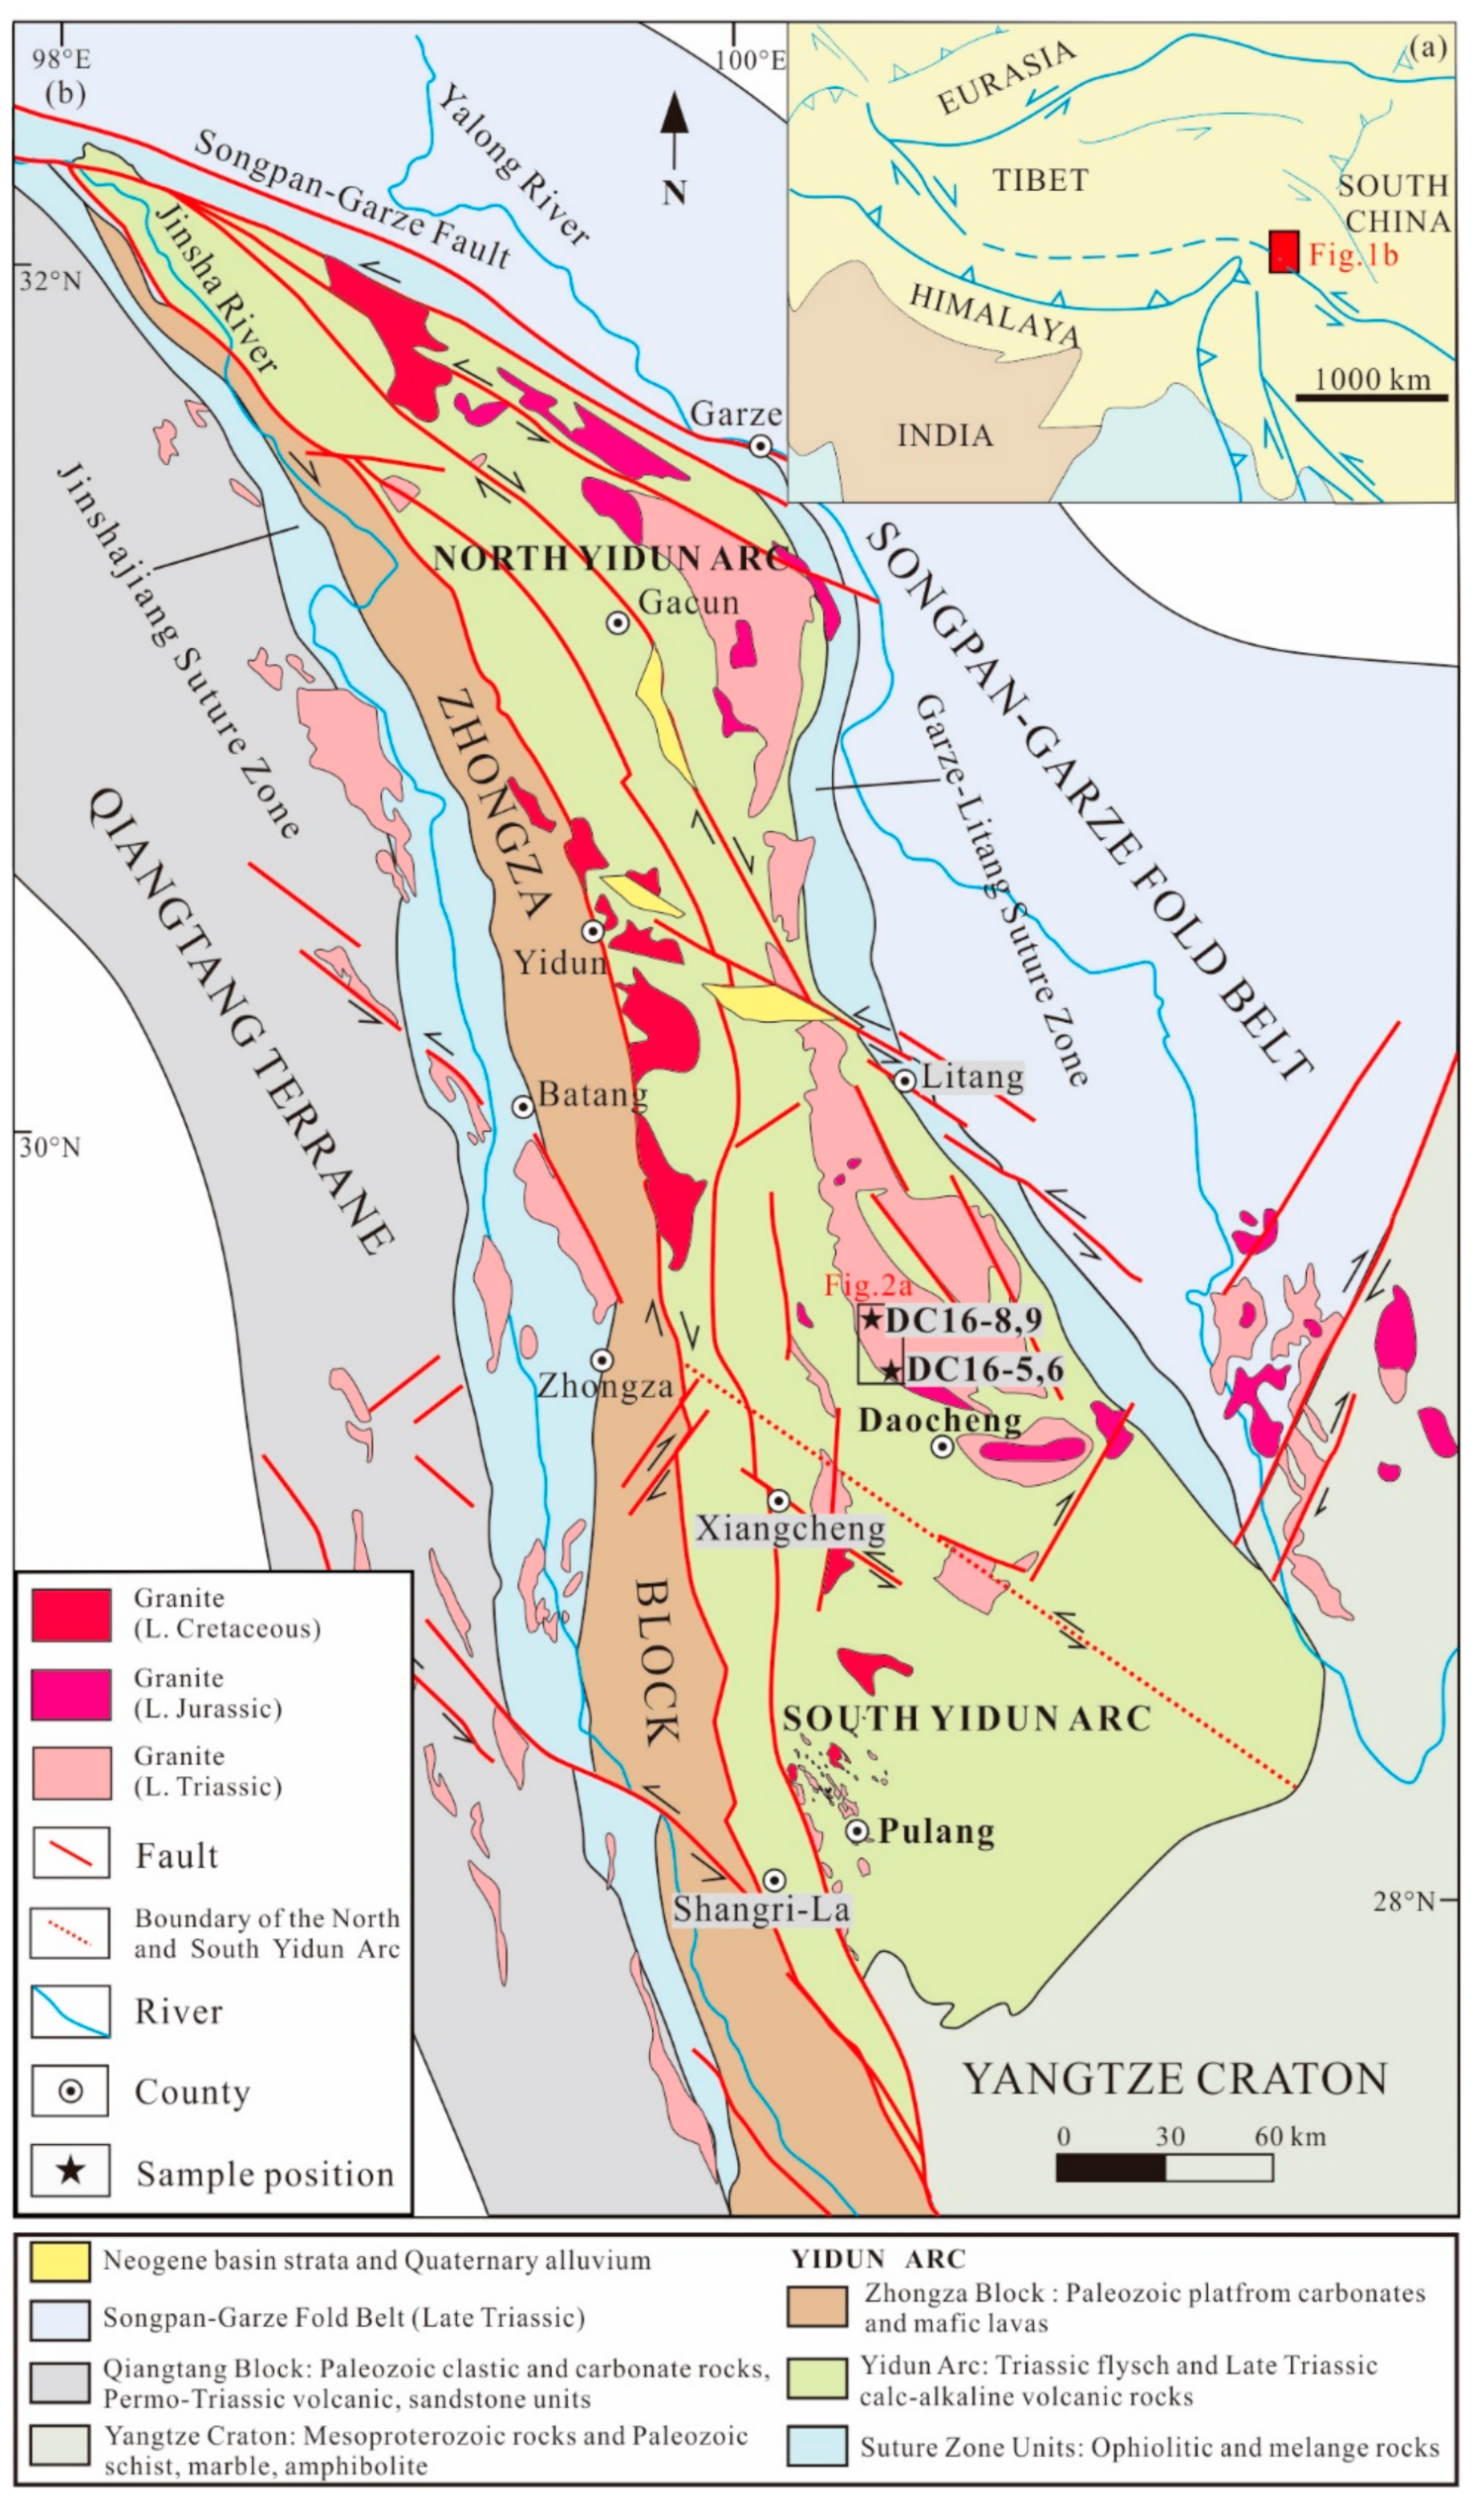
2. Geological Setting

The YA is located between the western Songpan–Garze Fold Belt and the eastern Qiangtang Terrane (QT), which was separated by the Garze–Litang Suture Zone to the west and the Jinshajiang Suture Zone to the east, and was bounded by the Yangtze Craton to the southeast [9,10,14]. The YA is exposed over a large area (25,000 km2) in SW China [6,28]. The YA has experienced subduction related orogenesis in the Late Triassic, collision orogenesis in the Jurassic, post-tectonic stretching in the Late Cretaceous and the complex evolution of the Cenozoic intracontinental tectonic deformation process [1,2,9].
The YA experienced two extensive magmatic periods, Late Triassic (230–215 Ma) and Late Cretaceous (105–77 Ma), in response to the subduction of the Paleo-Tethys oceanic slab and continent–continent collision, respectively. The former is dominated by volcanic eruptions, mafic to felsic plutonism. The latter is dominated by intrusive activity, mainly felsic granite [9,10,12,14]. During the Late Triassic, the YA developed multiphase magmatism, which produced several large granitic and granodioritic batholiths, such as Shengmu, Daocheng and Cuojiaoma in the NYA [17,25,27], and granitic to dioritic porphyry stocks such as the Pulang and Xuejiping in the SYA [29,30].
The Daocheng batholith is exposed between the Daocheng and Litang regions in the southern portion of NYA (Figure 1b). The country rocks consist predominantly of Late Triassic basalt, rhyolite, volcanic tuff and volcano-sedimentary rocks.
The Pulang copper deposit is the largest Cu-polymetallic porphyry deposit in the SYA, which is located approximately 65 km northeast of Shangri-La county (Figure 1b), and it contains proven reserves of ~4.31 Mt of Cu and 113 t of Au (0.34% Cu and 0.09 g/t Au) [13,14,20,31]. The host rocks are dominated by Late Triassic metasandstone and slate with interbedded andesite. The Pulang intrusive complex (16 km2) intruded the Late Triassic strata and extended along NW- and NE-trending faults [7,10,29]. These Late Triassic intrusions are comprised of three distinct phases based on LA–ICP–MS zircon U–Pb dating: The early quartz diorite porphyry of 225.9 ± 3.7 Ma [10,24], the middle quartz monzonite porphyry of 215.4 ± 1.8 Ma [10] and the latter granite porphyry of 206.3 ± 0.7 Ma [32]. The crystallization age of the quartz monzonite porphyry is consistent with a molybdenite Re–Os isochron age of 213.0 ± 3.8 Ma [33]. The youngest granite porphyry occurs as dikes with no significant mineralization [7,10]. Zircon, apatite and magnetite are common accessory minerals in the above-mentioned Pulang porphyries [10,29,31].

3. Samples and Analytical Methods

Two fresh granodiorite (DC16-6, DC16-9) and two fresh MME (DC16-5, DC16-8) samples were collected from the outcrops of the Daocheng batholith. Granodiorite has a granitic granular texture (Figure 2b,c,e), and contains 30 vol. % K-feldspar, 35 vol. % plagioclase, 20 vol. % quartz, 5 vol. % hornblende and 5–10 vol. % biotite; accessory minerals include apatite, magnetite and pyrite. The MMEs are composed of 40 vol. % plagioclase, 10–15 vol. % K-feldspar, 15 vol. % quartz, 15 vol. % hornblende and 10 vol. % biotite; accessory minerals include apatite, chalcopyrite, magnetite, galena and pyrite. The MMEs are elliptical and spindle in shape, with a diameter of 5–20 cm and gray–black in color, blocky quartz, quenched apatite (Figure 2d) and quartz eyes (Figure 2g) are developed in the MMEs.

3.1. Whole-Rock Major and Trace Elements

Samples for whole-rock analyses after the removal of weathered surfaces were crushed in an agate mill to nearly 200 mesh at the Geological Exploration Technology Co., Ltd., Langfang, China. For the analysis of the major elements, the sample was placed in a Li2B4O7 solution at a ratio of 1:5, melted at a temperature of 1050 °C to 1250 °C, and then the melted sample was made into a glass disk, and X-ray fluorescence (XRF) spectrometry was undertaken when the precision was better than 1% based on comparison to known reference materials. The trace-element analysis was undertaken by the solution analysis. Two mg of whole-rock powder was placed in a Teflon flask and was dissolved with HNO3 and HF and dissolution and dry-down, further dissolved by adding HClO4, again dried down and 5% HNO3 to dissolve the sample. Trace elements were measured using an ELEMENT XR ICP–MS at the Beijing Research Institute of Uranium Geology, with precision above 5%. The analytical procedure for the ICP–MS analysis is described by [34].

3.2. LA-ICP-MS Zircon U–Pb Dating and In Situ Trace Element Analysis of Zircon

Zircons were separated from the rock samples (DC16-8, DC16-9) by using conventional heavy-liquid and magnetic techniques, and were further concentrated by hand picking under a binocular microscope at the Geological Exploration Technology Co., Ltd., Langfang, Hebei Province, China. Zircon grains for U–Pb analysis were mounted in epoxy and then polished to section the crystals for analysis, and all zircons were documented using transmitted, reflected light photomicrographs and cathodoluminescence (CL) images to reveal their internal structures. Uranium–Th–Pb ratios determination was performed using LA–ICP–MS at the Sample Solution Analytical Technology Co., Ltd., Wuhan, China. The instrument used was an Agilent 7900 Quadrupole ICP-MS coupled to a Photon Machines Analyte HE 193-nm ArF Excimer laser ablation system, the laser ablation beam spot diameter was 25 μm, the laser ablation depth was 20 to 40 μm, and the single-point ablation method was employed. Helium was used as an ablation cell gas. Lasing was accomplished with a frequency of 10 Hz and an energy density of about 2.5 J/cm2. ICP–MS data collection was in “peak jumping”, among the masses collected. The reference standard zircon GJ-1 was undertaken surrounding groups of five measurements of unknowns along with zircon 91500 and NIST SRM61. GJ–1 was used as an external standard for age calibration, standard zircon 91500 and silicate glass (NIST SRM610) were applied as external standards for dating. Quantitative calibration for zircon U–Pb dating was performed by ICPMSDataCal (Version 10.8) [35,36]. Concordia diagrams, weighted mean age calculation and concordia diagrams were plotted using Isoplot 3.0 [37].
Trace element analysis of zircon was also conducted by LA–ICP–MS at the Wuhan Sample Solution Analytical Technology Co., Ltd., Wuhan, China. Laser sampling was performed using a GeolasPro laser ablation system that consists of a COMPexPro 102 ArF excimer laser (wavelength of 193 nm and maximum energy of 200 mJ) and a MicroLas optical system, and an Agilent 7700e ICP–MS instrument was used to acquire ion-signal intensities. Helium was applied as a carrier gas, argon was used as the make-up gas and mixed with the carrier gas via a T-connector before entering the ICP. A “wire” signal smoothing device is included in this laser ablation system [38]. The spot size and frequency of the laser were set to 32 µm and 5 Hz, respectively, in this study. Trace element compositions of zircon were calibrated against various reference materials (BHVO-2G, BCR-2G and BIR-1G) without using an internal standard [35]. Each analysis incorporated a background acquisition of approximately 20–30 s followed by 50 s of data acquisition from the sample. An Excel-based software ICPMSDataCal (Version 10.8) was used to perform off-line selection and integration of background and analyzed signals, time-drift correction and quantitative calibration for trace element analysis [35].

3.3. Zircon Lu–Hf Isotope Analysis

The zircon Lu–Hf isotopes were analyzed on a Neptune Plasma multi-collector inductively coupled plasma mass spectrometer (MC–ICP–MS) equipped with a Geolas HD excimerArF-excimer laser ablation system, at the Sample Solution Analytical Technology Co., Ltd., Wuhan, China. The laser beam diameter used was 44 µm, 10 Hz repetition rate and 7.0 J/cm2 energy density. Helium was used as carrier gas to transport laser eroded matter then mixed with Argon to the in Neptune. The detailed analytical methods were described by [37]. Reference materials including zircons 91500, GJ–1 and TEM were analyzed after every 10–15 zircon grains, yielding mean 176Hf/177Hf isotopic ratio of 0.282308 ± 6 (2σ) for 91500, 0.282018 ± 13 (2σ) for GJ-1, 0.282649 ± 27 (2σ) for TEM, which are in good agreement with the recommended values of 0.282308 ± 58 (2σ; 91500), 0.282013 ± 19 (2σ; GJ-1) and 0.282677 ± 8 (2σ). A decay constant for 176Lu of 1.865 × 10⁻¹¹ year−1 was adopted in this experiment. Initial 176Hf/177Hf, denoted as εHf(t), was calculated by using the measured U–Pb ages with the chondritic reservoir present-day ratios of 176Hf/177Hf = 0.282772 and 176Lu/177Hf = 0.0332. One-stage Hf model ages (TDM1) are calculated relative to the depleted mantle present-day value of 176Hf/177Hf = 0.283250 and 176Lu/177Hf = 0.0384 [7], two-stage Hf model ages (TDM2) are calculated by a mean 176Lu/177Hf value of 0.015 for the average continental crust [7].

4. Results

4.1. Major and Trace Elements Geochemistry

The whole-rock major and trace element data from the Daocheng batholith are listed in Table 1. Granodiorites were characterized by high SiO2 contents of 67.90%–70.54% (Figure 3a), and showing low MgO (1.08%–1.29%), Cr (12.7–16.8 ppm) and Ni (5.2–6.2 ppm) abundances; these rocks were metaluminous to just peraluminous, and the aluminum saturation index was A/CNK = 0.98–1.00 (Figure 3b). They were moderately rich in alkalis with K2O of 3.28%–4.59% and Na2O of 3.18%–3.20%, making them high-K calc-alkaline and shoshonite series rocks (Figure 3c,d). In the Harker diagrams, the contents of Al2O3, Fe2O3T, TiO2, CaO, MgO and P2O5 were negatively correlated with SiO2 content, whereas the Na2O was scattered between about 3 and 5 wt. % across all SiO2 contents (Figure 4). In contrast, the MMEs had low SiO2 (56.34%–60.91%) content with high CaO (6.09%–6.18%), MgO (2.89%–3.20%) and TiO2 (0.62%–0.72%) content (Table 1). The MMEs had variably high K2O (2.31%–3.93%), and plotted in the monzonite–diorite field in the total alkaline-silica diagram (Figure 3a). They belonged to the metaluminous and shoshonitic series (Figure 3c,d).
Both granodiorite and MMEs from the Daocheng batholith had similar rare-earth elements (REEs) and trace elements patterns, with a pronounced enrichment in LREEs relative to HREEs (Figure 5). Granodiorite and MMEs had total REEs contents of 162–220 ppm and 126–247 ppm, respectively. They had negative Eu anomalies indicating that granodiorite and MMEs might have undergone the separation and crystallization of plagioclase (Figure 5a). The rocks are depleted in high field strength elements (HFSEs; e.g., Nb, Ta, P and Ti), and enriched in LILEs (e.g., Rb and K), LREEs and Pb, with depletion in Ba (Figure 5b) relative to chondrite. Significantly granodiorites are characterized by much higher (La/Yb)N and Eu/Eu* values of 8.42–18.96 and 0.65–0.68 than those of the MMEs ((La/Yb)N = 1.99–2.46 and Eu/Eu* =0.30–0.50).

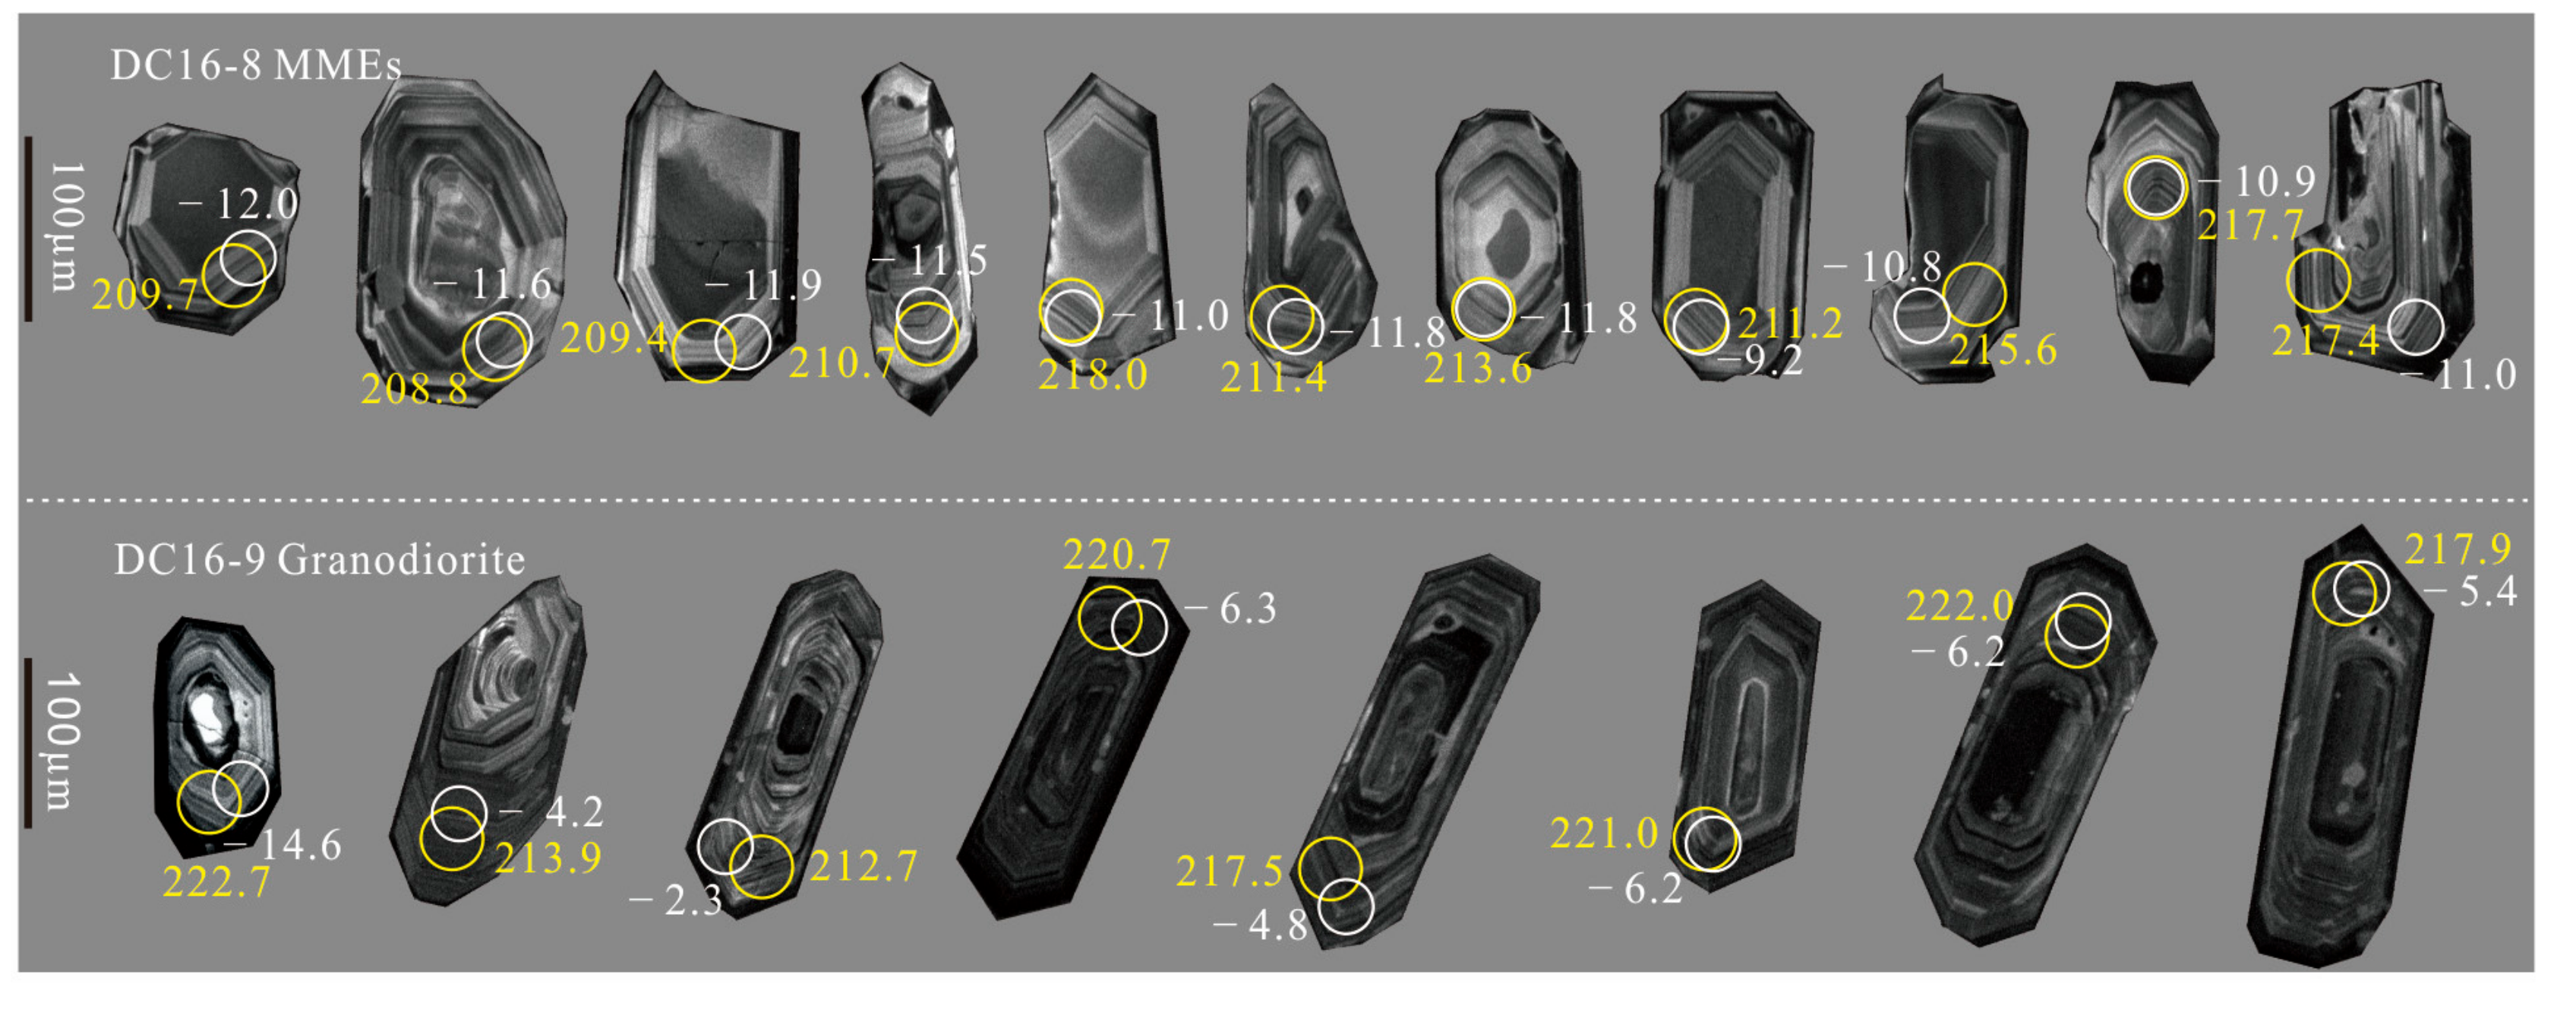
4.2. Zircon U–Pb Geochronology

MMEs and granodiorite from the Daocheng batholith were dated (DC16-8 and DC16-9, respectively), and the zircon U–Pb data are listed in Supplementary Table S1. Most of the zircon grains are euhedral to subhedral, light gray–gray black, individual zircon particles are etched at the edges, columnar with grain size ranging from 100 to 200 μm, and length/width ratios of 1:1–3:1. Some zircons retained the ancient inheritance nucleus (see bottom left in Figure 6), and we tried to choose a clear and transparent zone near the rim, and a typical oscillatory zone of magmatic crystallization is common in most of the zircon under CL images (Figure 6). The contents of Th and U in granodiorite (DC16-9) are 145–485 ppm and 361–1286 ppm, respectively, with Th/U of 0.38–0.54. The contents of Th and U in the MMEs (DC16-8) are 72–217 ppm and 181–403 ppm, respectively, with Th/U of 0.37–0.58. Inherited cores were not observed in these zircons from MMEs, and all the dated zircon grains display concordant to nearly ages.
15 zircon grains from the sample DC16-8 (29°22′35″ N,100°08′41″ E) yielded mostly concordant results, and 206Pb/238U ages of 218–209 Ma with a weighted mean of 214.2 ± 1.4 Ma (1σ, MSWD = 1.3; Figure 7a,b). Except for 3, the other 10 zircon grains from the sample DC16-9 (29°22′35″ N,100°08′41″ E) were marginally normally discordant. Ages were calculated for all data and yield 206Pb/238U ages of 223–210 Ma with a weighted mean age of 215.3 ± 1.8 Ma (1σ, MSWD = 2.1; Figure 7c,d).

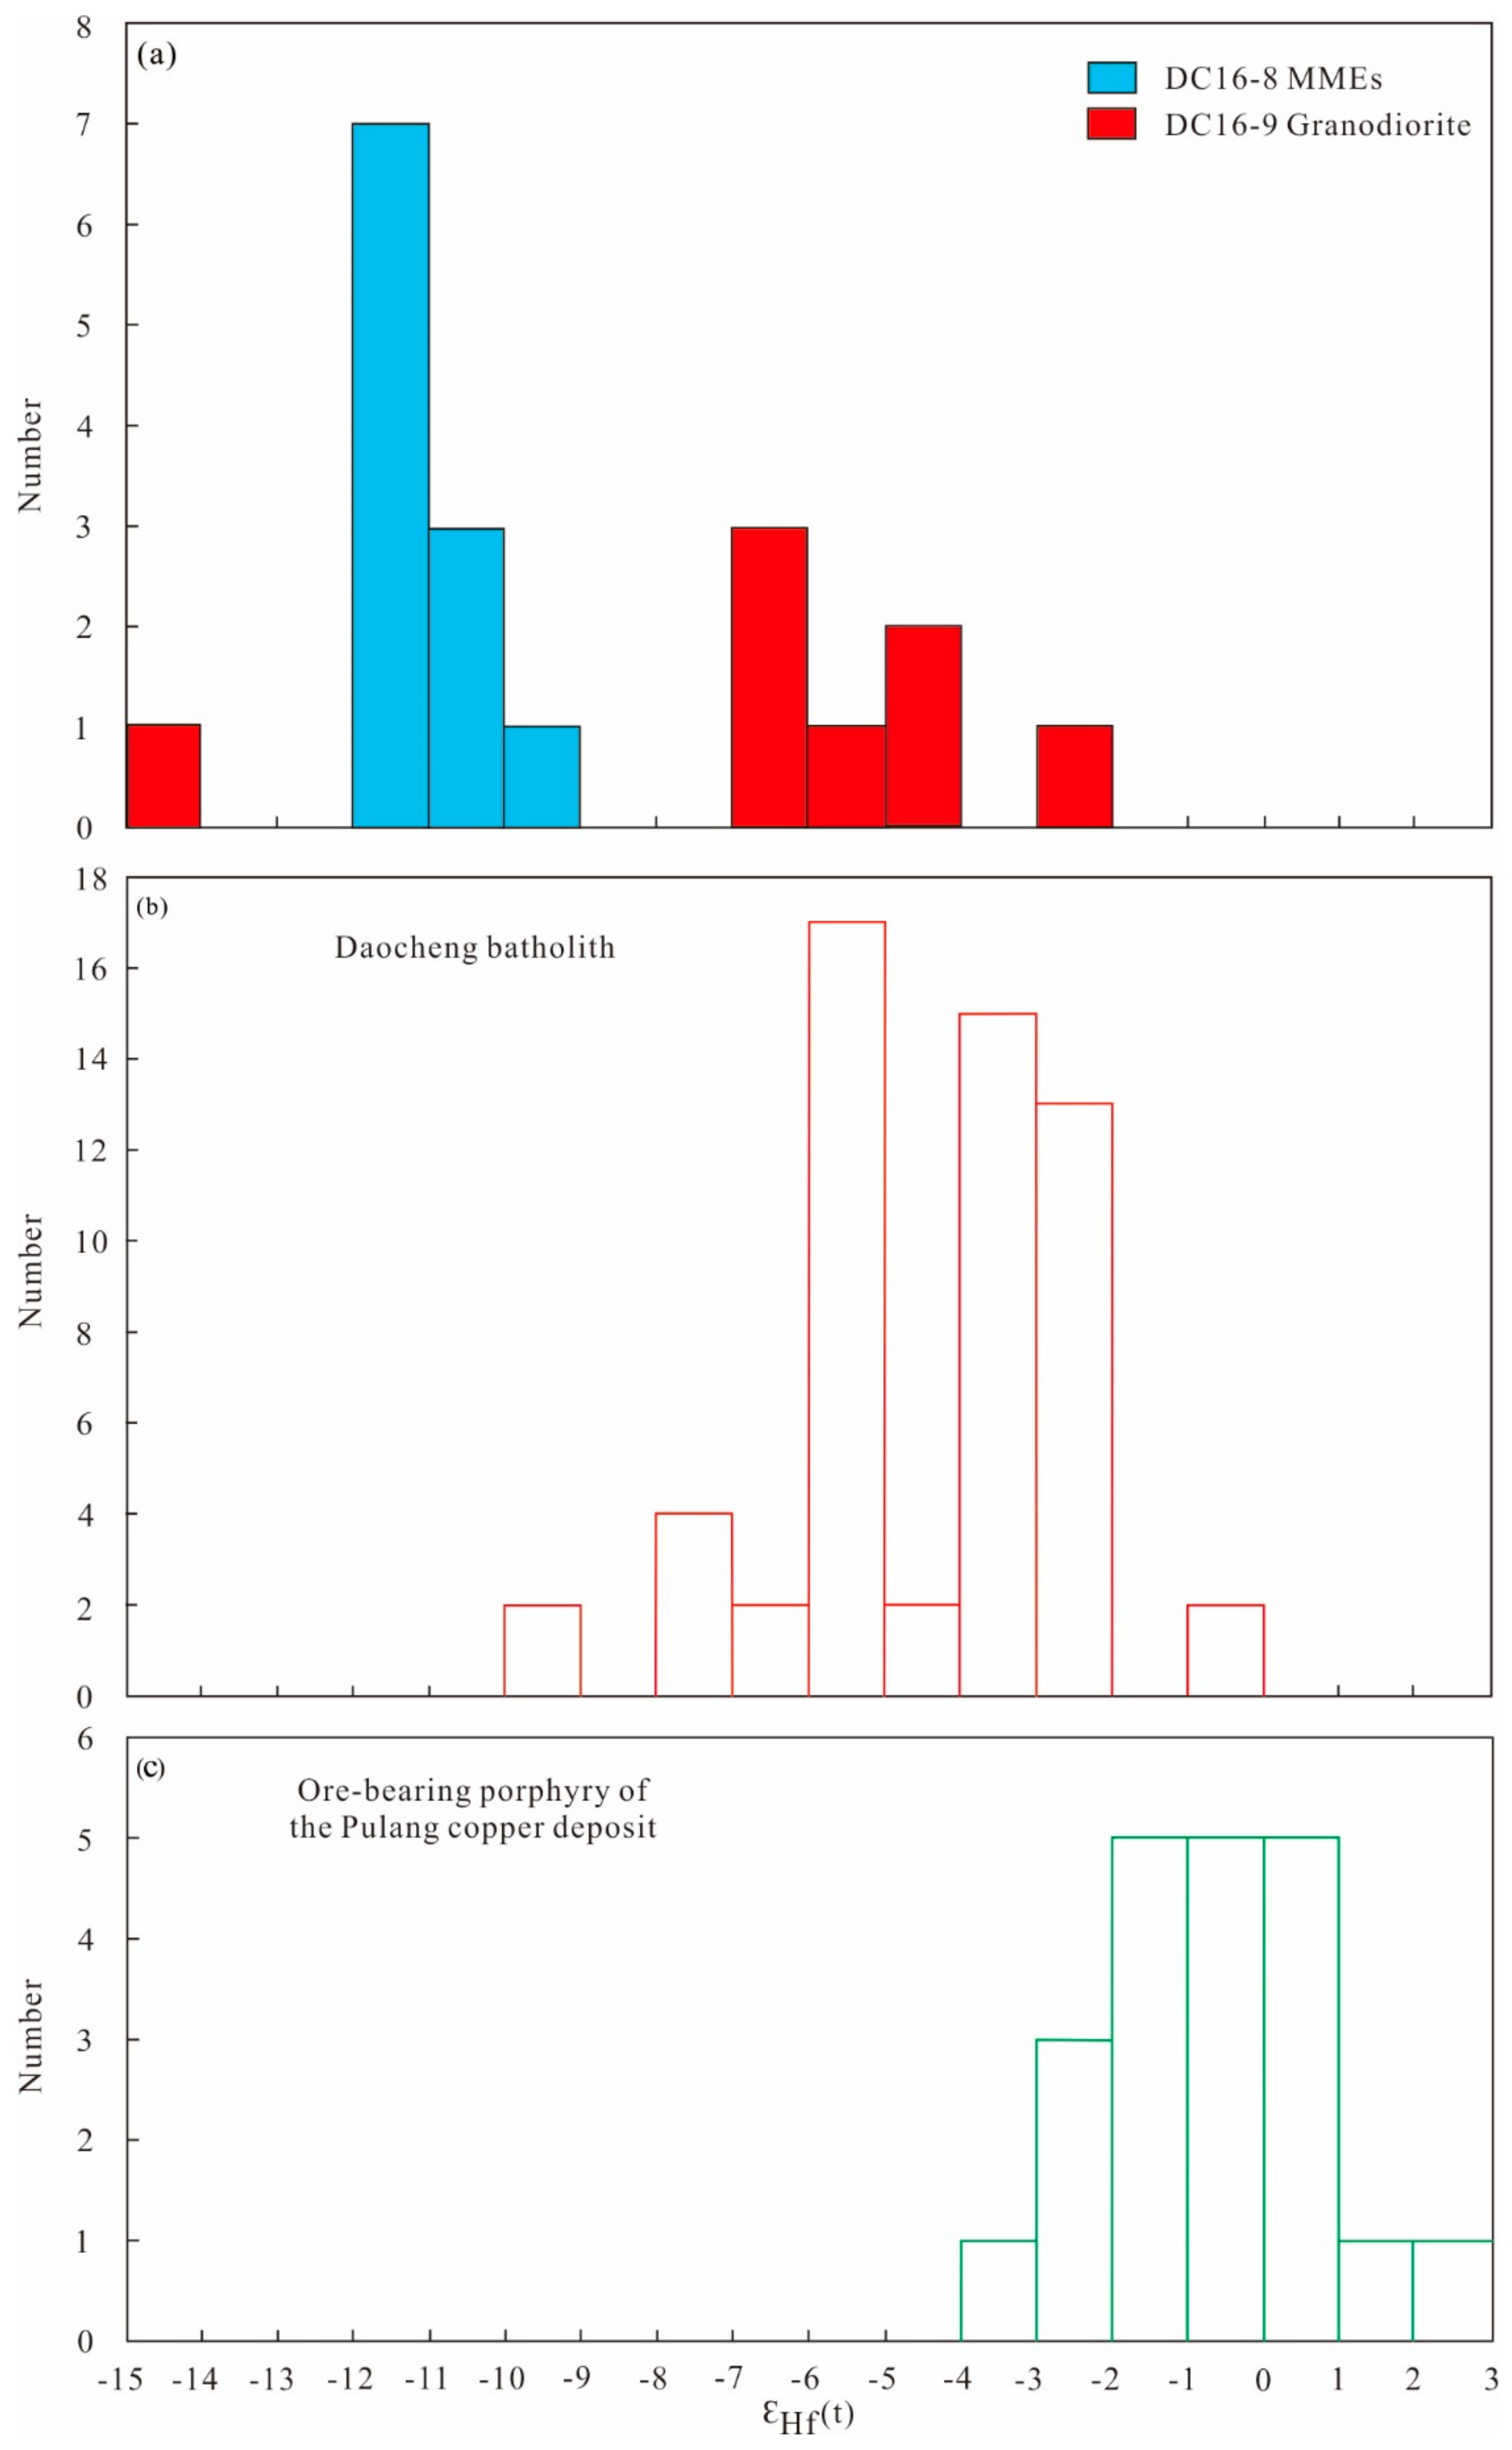
4.3. Zircon Lu–Hf Isotopes

In situ Lu–Hf isotope analyses of zircons from granodiorite and MMEs are listed in Supplementary Table S2 and illustrated on Figure 8. Zircons from granodiorite have initial 176Hf/177Hf ranging from 0.282229 to 0.282577, and εHf(t) values of −6.28 to −2.33 with an outlier of −14.61 (Figure 8a), corresponding to two-stage Hf model ages between 1.92 and 1.25 Ga. Results for the MMEs show variable 176Hf/177Hf ranging from 0.282305 to 0.282384, and εHf(t) values of ranging from −11.97 to −9.15 (Figure 8a), corresponding to two-stage Hf model ages varying between 1.78 to 1.62 Ga.

4.4. Zircon Trace Elements

Trace element compositions of zircons from granodiorite and MMEs are listed in Supplementary Table S3. Total REE contents of 13 zircons from granodiorite (DC16-9) ranged from 1622 to 2491 ppm, meanwhile, all zircons had wide variations of Y (944–1402 ppm), Nb (2.77–5.08 ppm), Ta (1.61–3.94 ppm) and Hf (10088–12213ppm) concentrations. These zircons show a pronounced enrichment of HREEs relative to LREEs, with positive Ce anomalies (Ce/Ce* = 1.32–6.92) and strong negative Eu anomalies (Eu/Eu* = 0.04–0.11).
Fourteen zircons from the MMEs (DC16-8) show total REEs contents of 1213–2070 ppm, with variations of Y (638–1215 ppm) variations, Nb (1.37–3.37 ppm), Ta (0.64–1.46 ppm) and Hf (8904–10541 ppm) concentrations. Chondrite normalized REEs patterns of zircons generally have strongly enriched Ce value relative to La and Pr (Ce/Ce* = 1.32–21.10), and depleted Eu value relative to Sm and Gd (Eu/Eu* = 0.04–0.17).

5. Discussion

5.1. Petrogenesis of the Dacocheng Batholith

The Late Triassic granodiorite and granite in the YA were metaluminous to just peraluminous, high-K calc-alkaline series (Figure 3b,c), with enrichments in Rb, Ba, Th and U and depletions in HFSEs (e.g., Nb, Ta, etc.) and HREEs (Figure 4). These geochemical features are consistent with arc magma in a subduction related setting [42,43]. The Triassic arc-related granitoids in the SYA, together with the coeval volcanic rocks, are thought to be related to the westward subduction of the Garze–Litang ocean slab [44]. The Daocheng granodiorites are characterized by low (Na2O + K2O)/CaO ratio (2.01–2.58), varying Zr + Nb + Ce + Y abundances (277.0 –347.3 ppm) and low Mg# value (39–45). Although several samples plotted in the field of A-type granite (Figure 9a), but the Daocheng granodiorites are not typical A-types [45]. The negative trend defined by granodiorite on the P2O5 vs. SiO2 diagram (Figure 9b), this is due to the P2O5 abundance that will decrease in fractionated I-type granites when apatite reaches saturation in metaluminous to just peraluminous magmas [46], with the uniform A/CNK ratio of 0.98–1.00, indicating the I-type granite affinity for the Daocheng granitoids. In the (La/Yb)N vs. YbN diagram, these samples plot as normal arc magmas (Figure 9c). Therefore, we concluded that the Daocheng granodiorite belong to the typical I-type granite family.
To explain the petrogenesis of I-type granite, several models have been proposed: (1) Assimilation and fractional crystallization (AFC) of mantle-derived basaltic magmas [47,48] (Figure 9d); (2) reworking of supracrustal material by juvenile magmas [49,50] and (3) partial melting of the mafic lower crust, with or without addition of mantle-derived magmas [46,51]. The first model is not applied to the Daocheng granodiorite because of the important compositional gap between contemporary mafic complexes and felsic porphyry, with the absence of intermediate magmas in the Daocheng batholith and YA. It is not in accord with the reworking of supracrustal material by juvenile magma that could account for the formation of the Daocheng granodiorite since this mechanism may yield a wide-ranging zircon εHf(t) values from the same rock suit and more positive values [49].
Collectively, the analyzed granodiorite has negative zircon εHf(t) values ranging from −6.28 to −2.33 with an outlier of –14.61 (TDM2 = 1.92−1.25 Ga) and that outlier analysis may have clipped a truly ancient zircon core. The whole rock had a negative whole-rock εNd(t) (–7.8 to –6.7) with TDM2 = 1.62–1.54 Ga [17], indicating a predominantly ancient (1.5–1.1 Ga; Mesoproterozoic) crustal source that was melted in the Jurassic. Fractionated REE patterns ((La/Yb)N = 8.4–19.0, low Y (19.3–25.1 ppm) and Yb (1.9–2.6 ppm) in granodiorite required partial melting of a mafic source region or felsic source contained garnet, with garnet as a residual phase [52,53,54,55] because HREEs have a high partition coefficient (mineral/melt) in garnet. The Zr/Hf (32.69–36.90) is close to the range of the crustal and mantle-derived material (Zr/Hf = 33.0–36.3), which is likely a sign of zircon fractionation from a source that developed a higher Zr/Hf, which was reduced by zircon removal [56]. Summing up, the genesis of the Daocheng granodiorite is derived from an ancient crust that was melted during Late Triassic subduction.

5.2. Magma Mixing

The abundant MMEs in granodiorite were ellipsoidal and spheroidal in shape, darker in color and had distinct contact with granodiorite (Figure 2a). Mafic minerals (amphibole and biotite) were distributed along the edges of feldspar grains (Figure 2g). The MMEs were characterized by quenched apatite, quartz eyes plagioclase phenocrysts that show obvious oscillatory zones. The MgO, Al2O3 and Fe2O3 concentrations were negatively correlated with SiO2 in the Harker diagram (Figure 4). Together these features indicate that the enclaves represent the vestages of a magma mixing process [58,59]. If so one might expect the enclaves to have a much more mantle-like isotope signature than its host. This was not observed.
Several different hypotheses could be proposed to explain the origin of MMEs: (1) They represent the residual material (“restite”), which were left from the source rock after giving rise to the granitic melts and in which case [54,60,61], the granodiorite and the enclaves should have matching isotope ratios since they are co-genetic; (2) cognate magma fragments of cumulate minerals or early formed crystals from the host magma [62,63,64]; (3) surrounding rock xenoliths so that the isotope relationship of the enclaves and host granodiorite are unconstrained but the enclaves do not give a brittle appearance in their shapes further disallowing this as a compelling possibility [65]; (4) that the enclaves are some sort of cumulate and representative of fractionation of MME like magmas to give rise to granodiorite but 22 straightforward observations deny this possibility—lack of cumulate textures in the enclave, differences in isotope composition, which should be the same and (5) the mixing of mafic and felsic magmas [66,67,68,69], a common assumption, and in which case the mafic enclave is assumed to have a derivation from a more mafic magma, i.e., to be more juvenile in isotope character. The following observations support this as the likely relationship: The U–Pb zircon ages of the MMEs are coincident with those of granodiorites. Compared to granodiorite, the MMEs have lower SiO2 content (56.34%–60.91%) and higher Mg# (46–48), which suggests that mafic magma has involved in its formation, and the MMEs display igneous microtextures (micro- to fine-grained hypidiomorphic to granular texture) instead of cumulate texture, with the development of zoned plagioclase and acicular apatite in the MMEs. On the other hand, basalt dykes or sills coeval with the Daocheng batholith have not been found, nor has clear evidence of the disaggregation of dykes in the Daocheng host magmas. Since this is the favored explanation, a crucial Hf isotope relationship must be explained: The enclave has a more negative, i.e., has a more crustal signature than the host granodiorite, the opposite of what one would expect.

5.3. Implications for Regional Metallogenic Distinctions Between NYA and SYA

The YA was formed on the east margin of the QT [57]. It originated from the westward subduction of the Garze–Litang oceanic slab beneath the Zhongza Block during the Late Triassic [11,19]. The closure of a Neotethyan seaway in southeast Tibet and Indochina resulted in the collision of the recently amalgamated QT with the Yangtze Carton during the Late Cretaceous [30,59]. The Daocheng granodiorite has a zircon 206Pb/238U age of 215 ± 1.8 Ma, which is consistent with the previous published age. In addition, our data and previously published work, plot in the Nb vs. Y and Nb vs. (Y + Nb) tectonic setting diagram, plot in the fields of volcanic arc granite (VAG) + syncollisional granite (Syn-COLG) (Figure 10a) and VAG granite (Figure 10b), which is consistent with granodiorite generation in a subduction setting [16,19,31].
Magmatic oxygen fugacity is the effective partial pressure of oxygen in magma. The value of fO2 is generally determined by using elements with multiple valences (e.g., Fe, S, Ce, etc.). Oxidation states of magmas may be evaluated using the whole-rock Fe2O3/FeO [70] and the presence of minerals indicative of high fO2, such as magnetite and hematite [71,72]. While, these indicators mentioned above can only be used on fresh igneous rocks that lacked hydrothermal alteration and surficial weathering [73]. As the accessory mineral, zircon is often found in intermediate to felsic igneous rocks, and is also resistant to physical destruction and hydrothermal alteration after magmatic crystallization [74] it provides a route by which to calculate fO2. Zircon contains its primary chemical and isotope compositions from the time of crystallization, and can provide chemical information related to the parental magma. The strong positive Ce anomaly in zircon is sensitive to the oxidation state in the magma but is temperature dependent as well. Ce4+ preferentially partitions into zircon compared with Ce3+ because of its identical charge and similar size in eight-fold coordination to Zr4+, thus, Ce4+/Ce3+ can reflect magmatic oxidation state relatively precisely [73,75]. The zircon Ce4+/Ce3+ can be calculated according to crystal chemistry principles, detail procedures of which are given in [73].
Trail et al. [76] provided a new empirical equation to determine the fO2 of a magmatic melt, the equation is as follows:
Ln(Ce/Ce*)D = (0.1156 ± 0.0050) × ln(fO2) + (13860 ± 708)/T(K) – (6.125 ± 0.484),
where the (Ce/Ce*)D is the Ce anomaly in zircon, and T is the zircon crystallization temperature in K, zircon Ti concentration is used to constrain crystallization temperatures and T is calculated by revised Ti-in-zircon thermometry [77]. Given that the concentration of the related LREEs is unknown at the time of zircon saturation is unknown in almost all cases, the Ce anomaly (Ce/Ce*)D is calculated from the equation:
( Ce / Ce ) D ( Ce / Ce ) CHUR = Ce N / ( L a N × P r N ) ,
where CeN, LaN and PrN are chondrite-normalized values for Ce, La and Pr.
We estimated the magmatic oxygen fugacity that was used from the equation above, with the calculated result are listed in Table 2 and described by [72,76]. Familiar fO2 curves, such as magnetite-hematite (MH), fayalite-magnetite quartz (FMQ) and iron-wustite (IW), are used to estimate the oxidation state of the magma, all were determined at 1 bar. The average ∆FMQ value for granodiorite was –10.84, with Ti in-zircon temperatures of 740–630 °C, strongly variable values of Ce4+/Ce3+ ratio were probably related to the analytical precision (Ce4+/Ce3+ = 0.80–8.95, average value was 3.53) and a log(fO2) value of –32.95 to –21.22, the data mainly fell in the field below IW on the Ti-in-zircon temperature vs. fO2 diagram (Figure 11a,b). The average ∆FMQ value for the MMEs was 0.80, with Ti in-zircon temperatures of 820–746 °C, Ce4+/Ce3+ ratio of 5.46–30.52 (average value is 16.01), and log(fO2) value of –17.52 to –10.36, the data mainly fell in the field between MH and IW (Figure 11a,b). Granodiorites and MMEs of the Daocheng batholith plot in the moderately reduced field in log (Fe2O3/FeO) vs. FeO*/(wt. %) diagram (Figure 11c).
In arc settings, where fertile magmas are typically derived from hydrous, high fO2 and metal-rich calc-alkaline magmas, and magmatic oxygen fugacity is a key factor that controls the formation of Cu–Mo mineralization [75,78,79]. Oxidized calc-alkaline magmas control porphyry mineralization by influencing the speciation and solubility of sulfur [73,80], high fO2 is more favorable for forming metal-rich magmas. Many researchers think that oxidized magmas can hold high metal content and are conducive to forming porphyry deposits [75,81]. Generally speaking, oxygen fugacity of >FMQ + 2 is necessary to form economic porphyry Cu (Au) deposits and FMQ + 1.5 is a threshold for any porphyry deposit [75,79,80,81,82]. As mentioned in this study of a barren granodiorite, it has very low fO2, with ∆FMQ ranging from −13.59 to −5.09. Under the low fO2, it would be difficult to release metals out of the melt and magmas, and would become sulfide-saturated during evolution in the deep magma chambers instead [75]. The fO2 of granodiorite (average of ∆FMQ= –10.84) is lower than that of the MMEs (average of ∆FMQ = 0.80), and is also much lower than ore-bearing quartz monzonite porphyry (average of ∆FMQ = 2.8) in the Pulang copper deposit.
The whole-rock log(Fe2O3/FeO) of granodiorite ranges from −0.43 to −0.08, and plot below moderately reduced in the log(Fe2O3/FeO) vs. FeO* diagram (Figure 11c). While, the whole-rock log(Fe2O3/FeO) values of the ore-bearing quartz monzonite porphyry from Pulang copper deposit in the SYA varies from −0.24 to 0.02 [10,79], and plot between the strongly oxidized and moderately oxidized ranges (Figure 11c). The calculated Ce4+/Ce3+ of granodiorite varied from 0.80 to 8.95 (average value was 3.53) (Figure 11d); however, the calculated Ce4+/Ce3+ of the ore-bearing quartz monzonite porphyry from the Pulang copper deposit ranged from 5.40 to 99.60 (average value was 52.10) [79] (Figure 11d). The fO2 of Pulang ore-bearing quartz monzonite porphyry in the SYA was much higher than that of the Daocheng granodiorite in the NYA. The Ce and Eu of zircon were very sensitive to the oxidation state of magma. Cerium generally had a positive anomaly in magma, and the intensity of anomalies could reflect the relative magnitude of oxygen fugacity [72,73]. Zircon itself was structurally stable and strongly resistant to hydrothermal alteration. Therefore, the trace element of zircon could effectively indicate the oxidation state of magma.
The Daocheng batholith granodiorite and Pulang ore-bearing quartz monzonite porphyry had several features in common: (1) They were emplaced during the same tectonic event along the YA (Figure 1a,b); (2) they were coeval and the time of their emplacement corresponded to the peak of the regional magmatic activity in the Late Triassic; (3) they had similar major elemental compositions (Figure 3a) and (4) they shared similar chondrite-normalized REE patterns. However, there were also some large differences in their oxygen fugacities and Ce4+/Ce3+ (Figure 11d). Ballard et al. [73] studied super large porphyry copper deposits in north Chile. These authors came to a conclusion that the fO2 of ore-bearing intrusions were higher than that of barren intrusions, high fO2 was beneficial to the migration or enrichment of metallogenic elements such as copper, gold and molybdenum, which plays an important role in the final mineralization of these metallogenic elements. Yang et al. [79] analyzed four mineral deposits with different scales in the Jinshajiang–Red River porphyry Cu (Mo–Au) metallogenic belt, and revealed the relation between the magmatic oxidation state and porphyry mineralization. There is a positive relationship between the Ce4+/Ce3+ and the deposit size (metal tonnage) for both the Cu–Mo deposits and the Au deposits. The magmatic oxygen fugacity is a key factor that controls the regional deposit size differences, indicating that oxidized magmas are associated with the formation of larger porphyry deposits. The oxygen fugacity could be used as an evaluation index for regional mineral exploration.

6. Conclusions

(1)
The host granodiorite and MMEs from the Daocheng batholith were formed at ca. 215 Ma and ca. 214 Ma, respectively; they were coeval within errors, indicating that they were the products of contemporaneous magmatic activity in the Late Triassic.
(2)
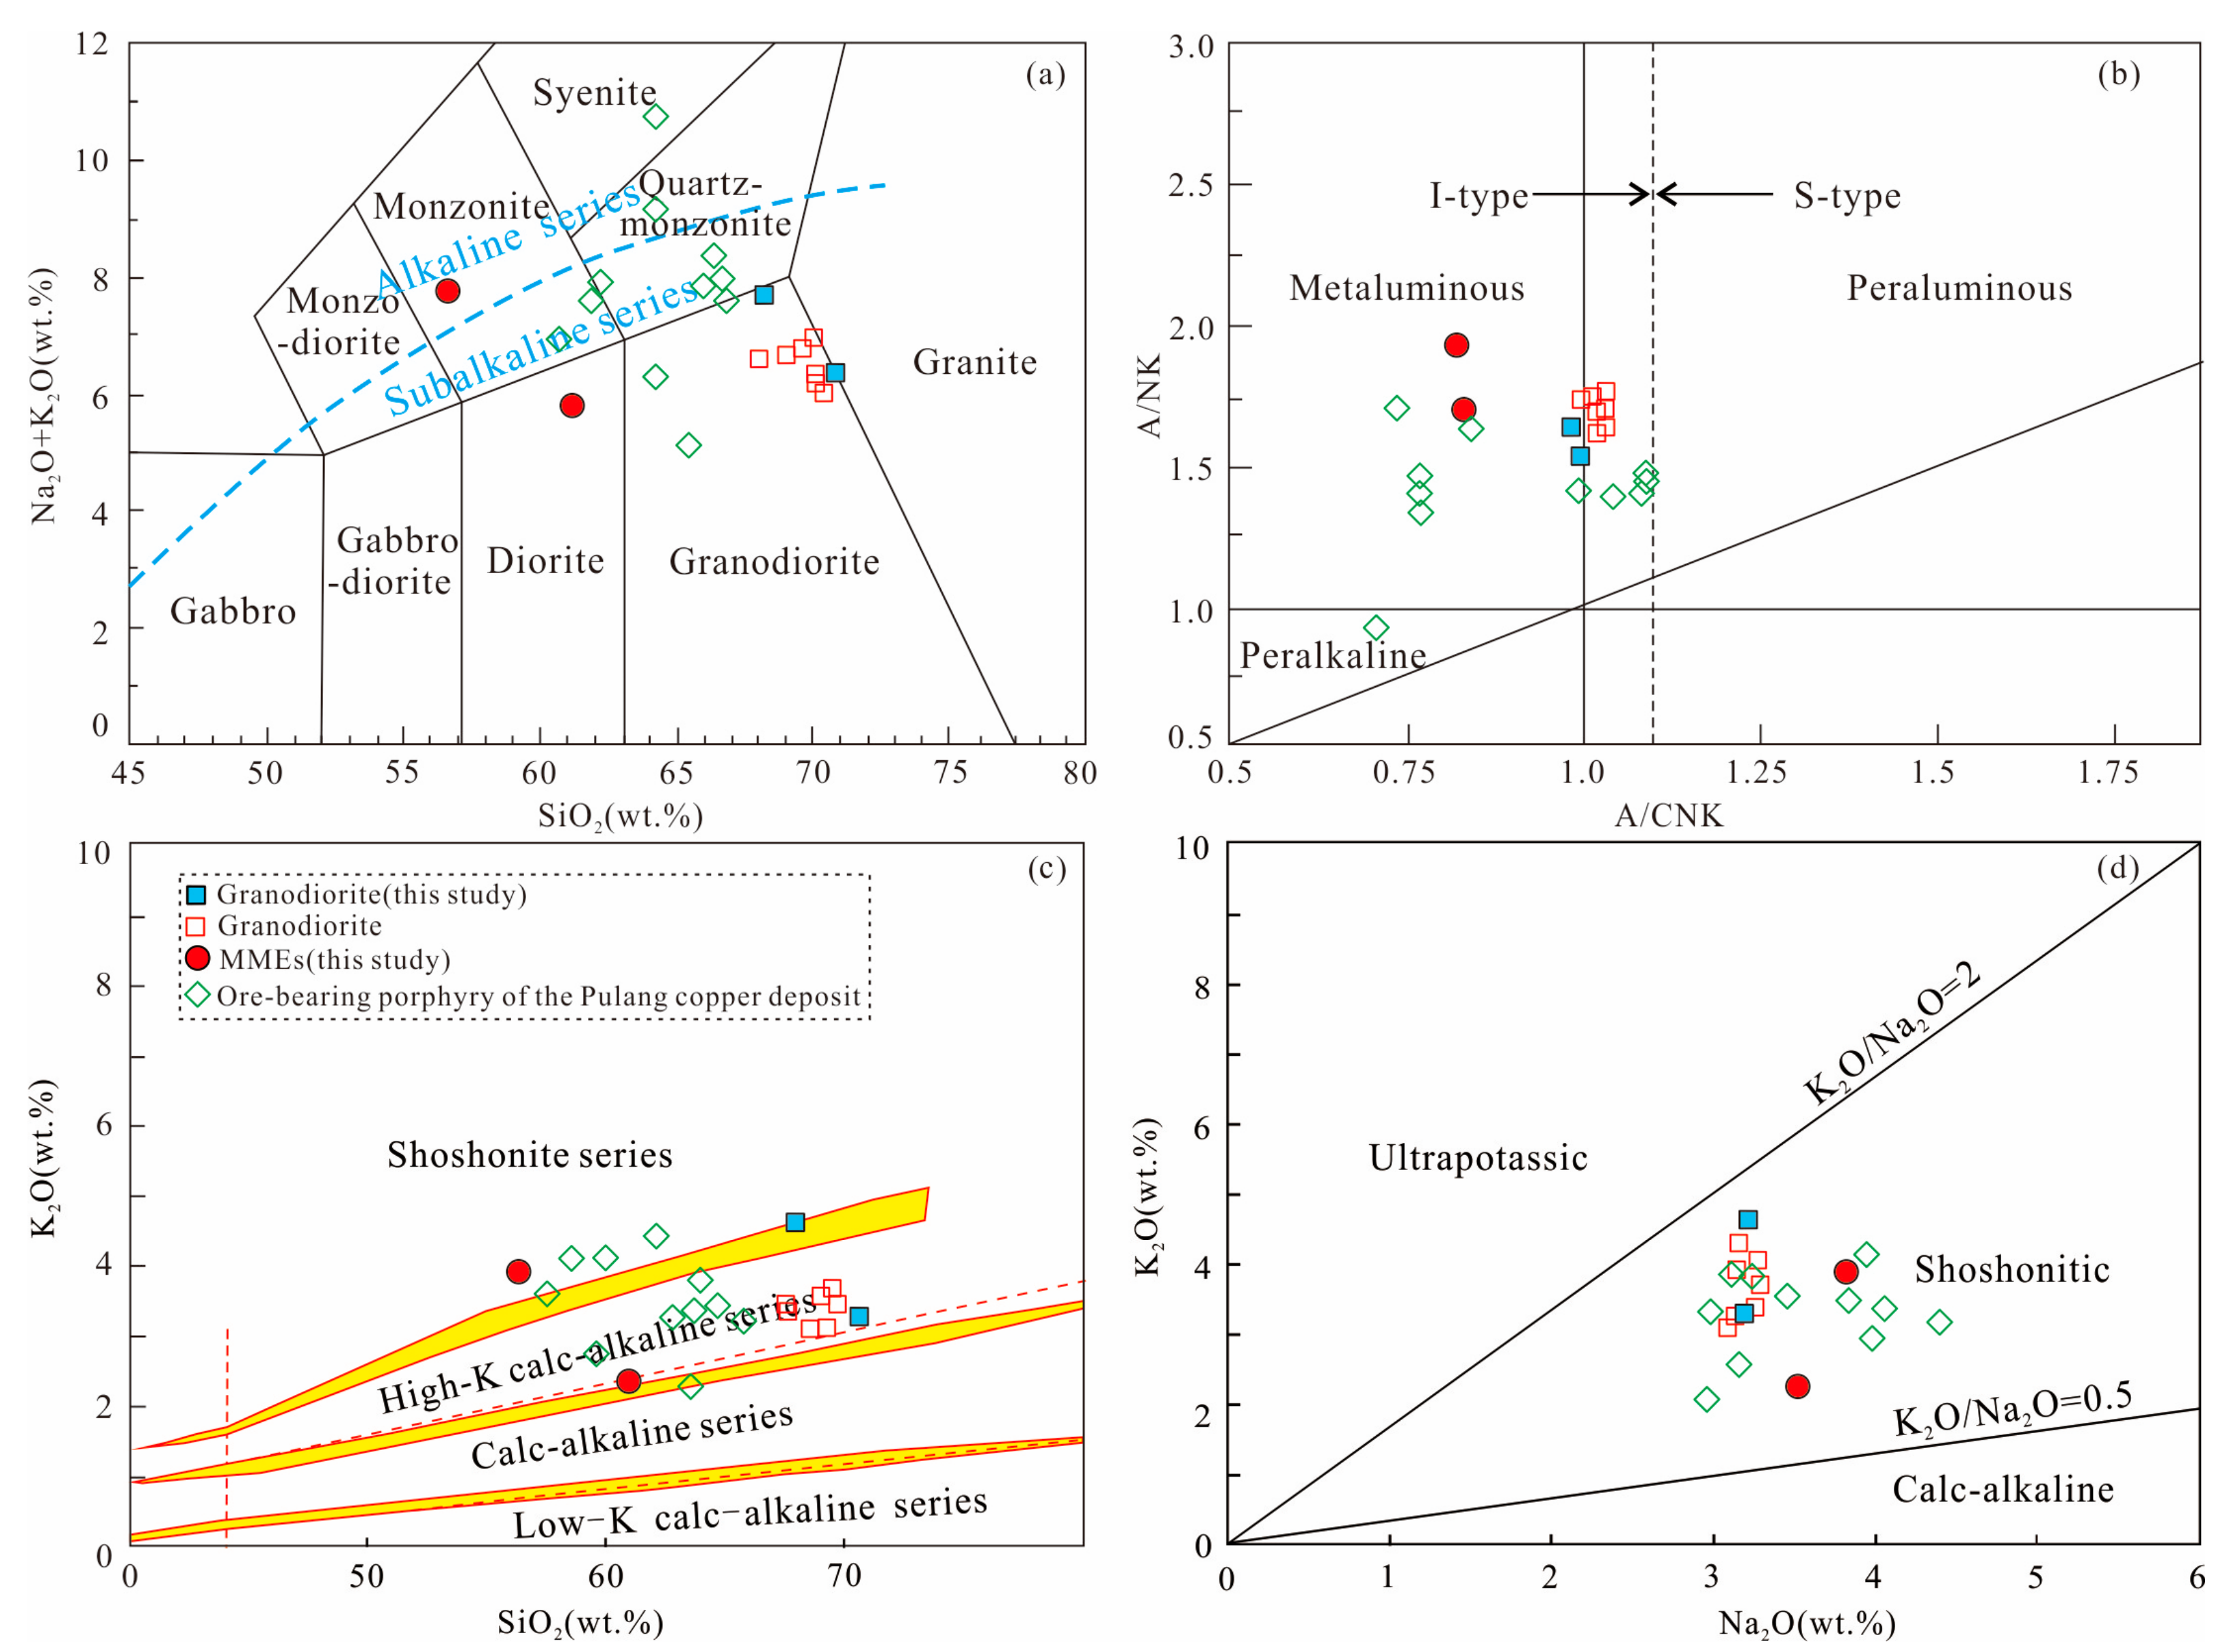
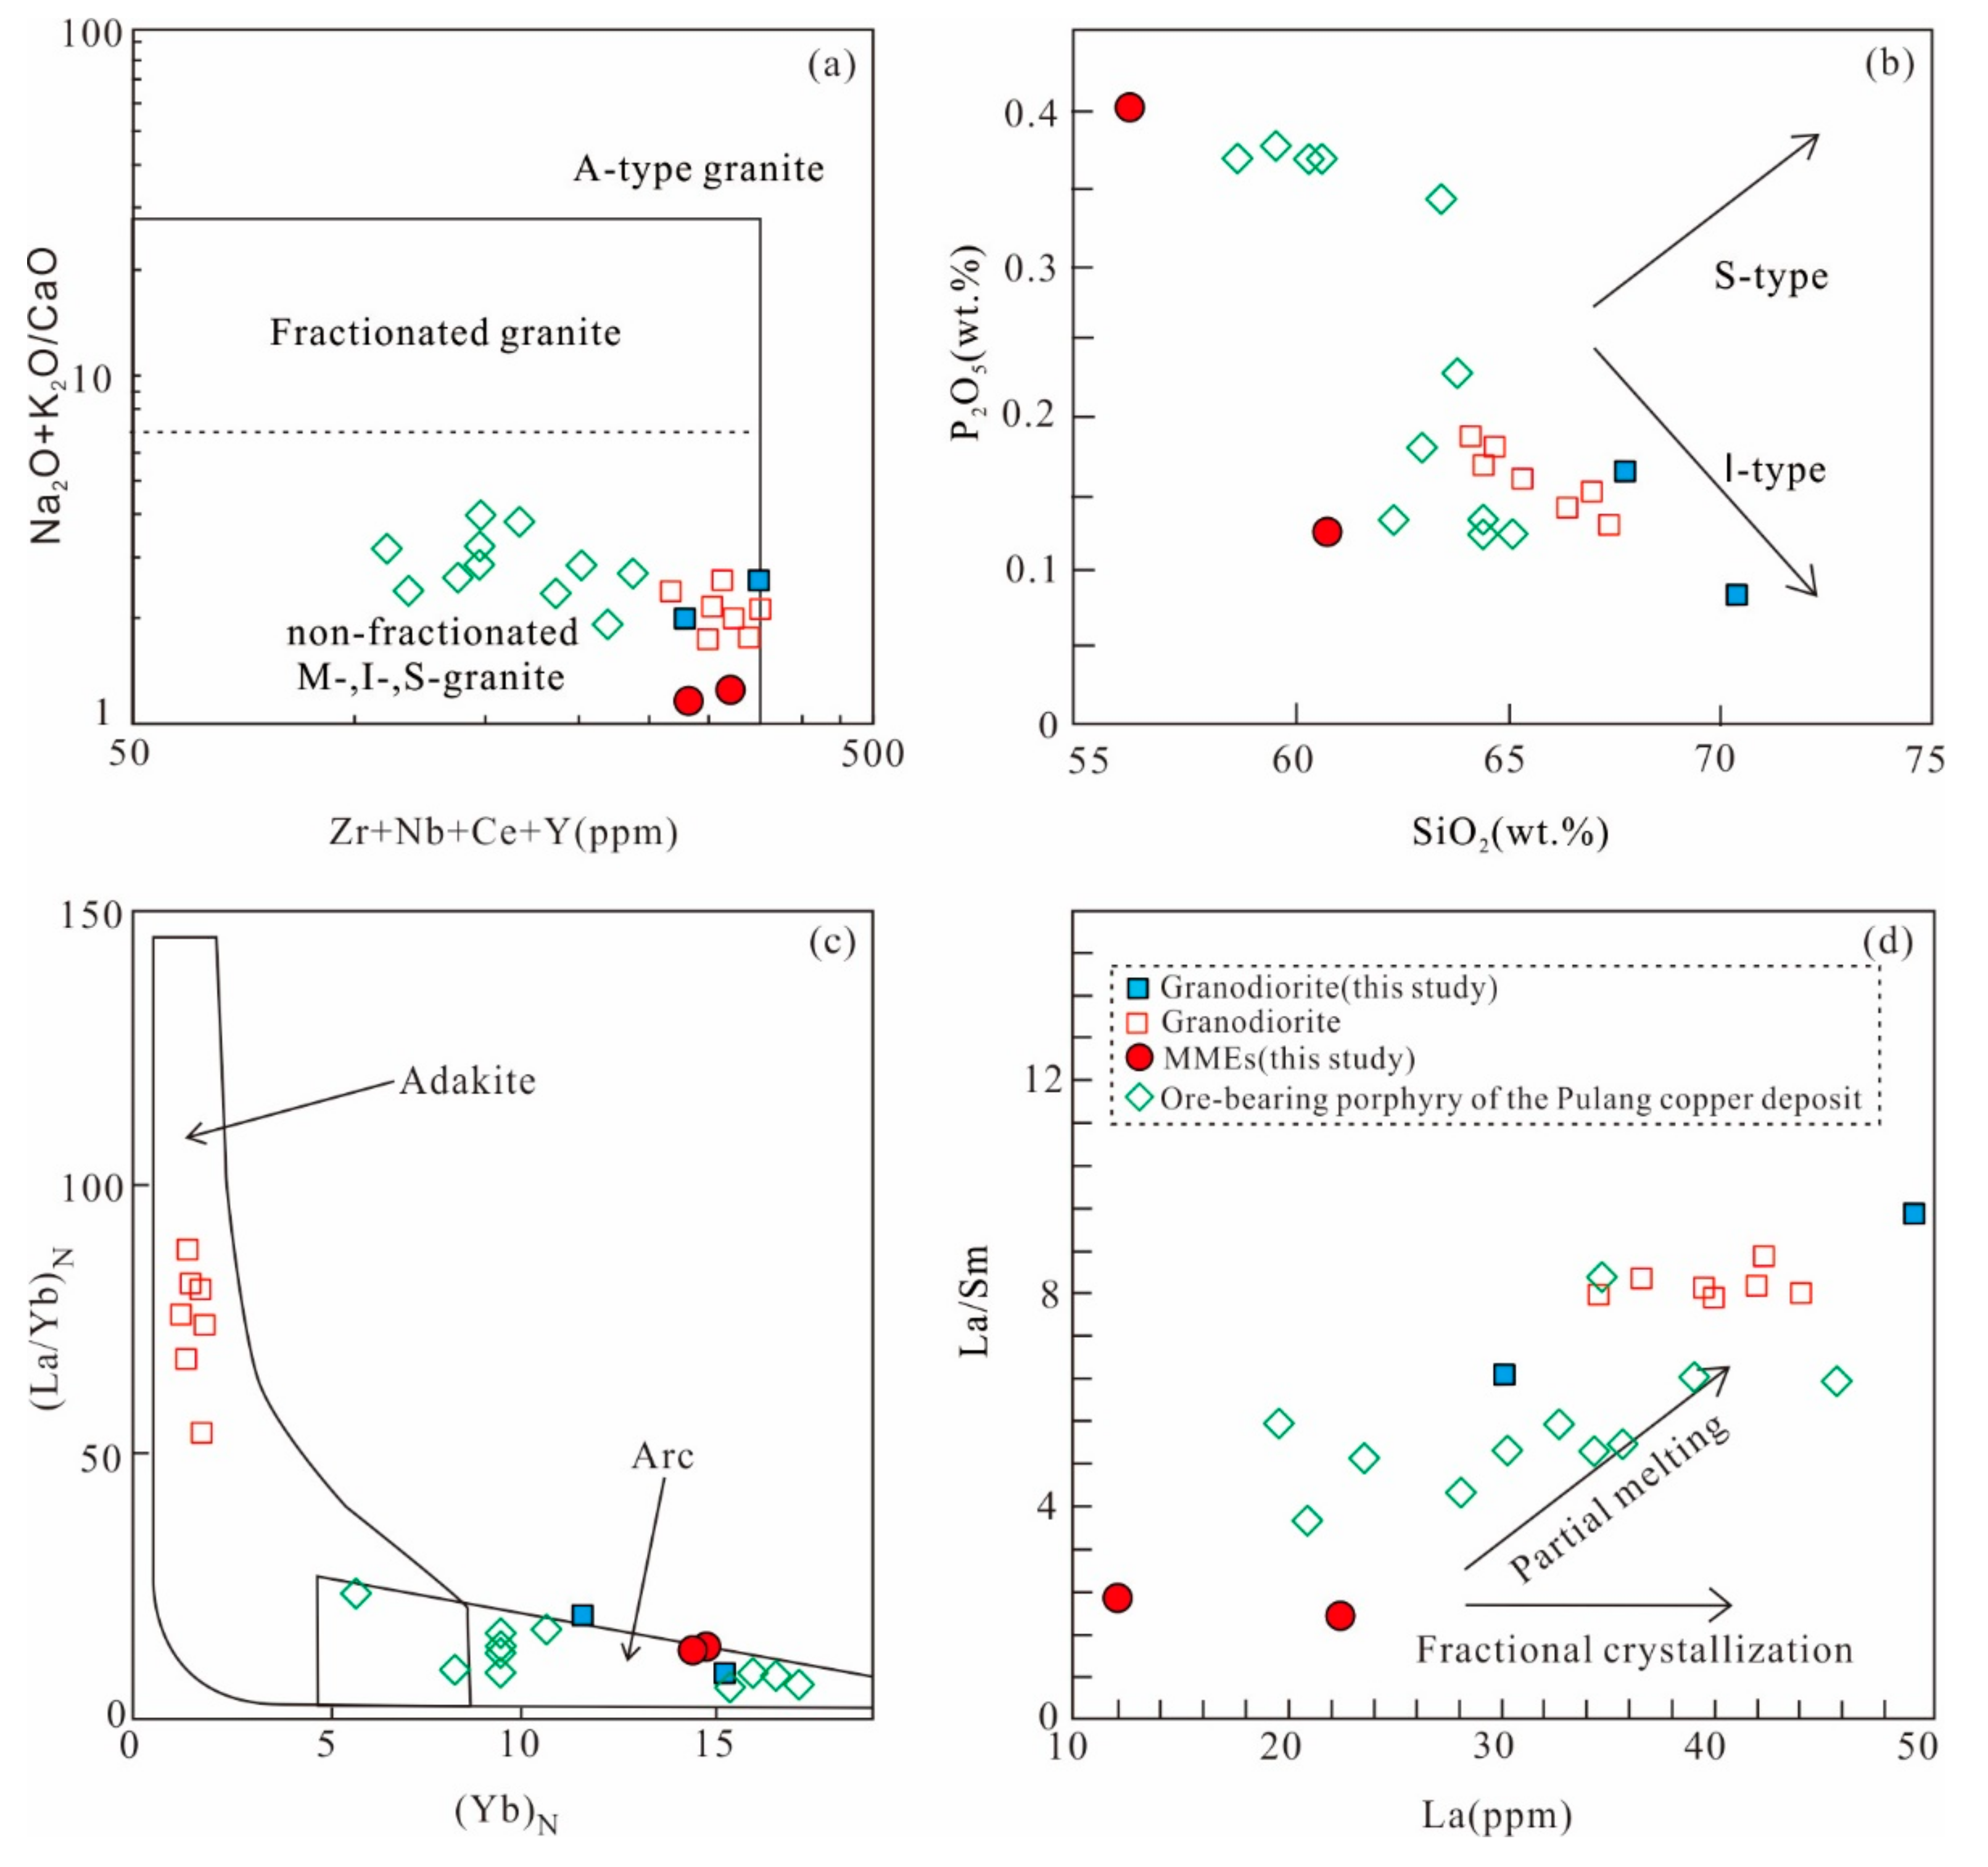
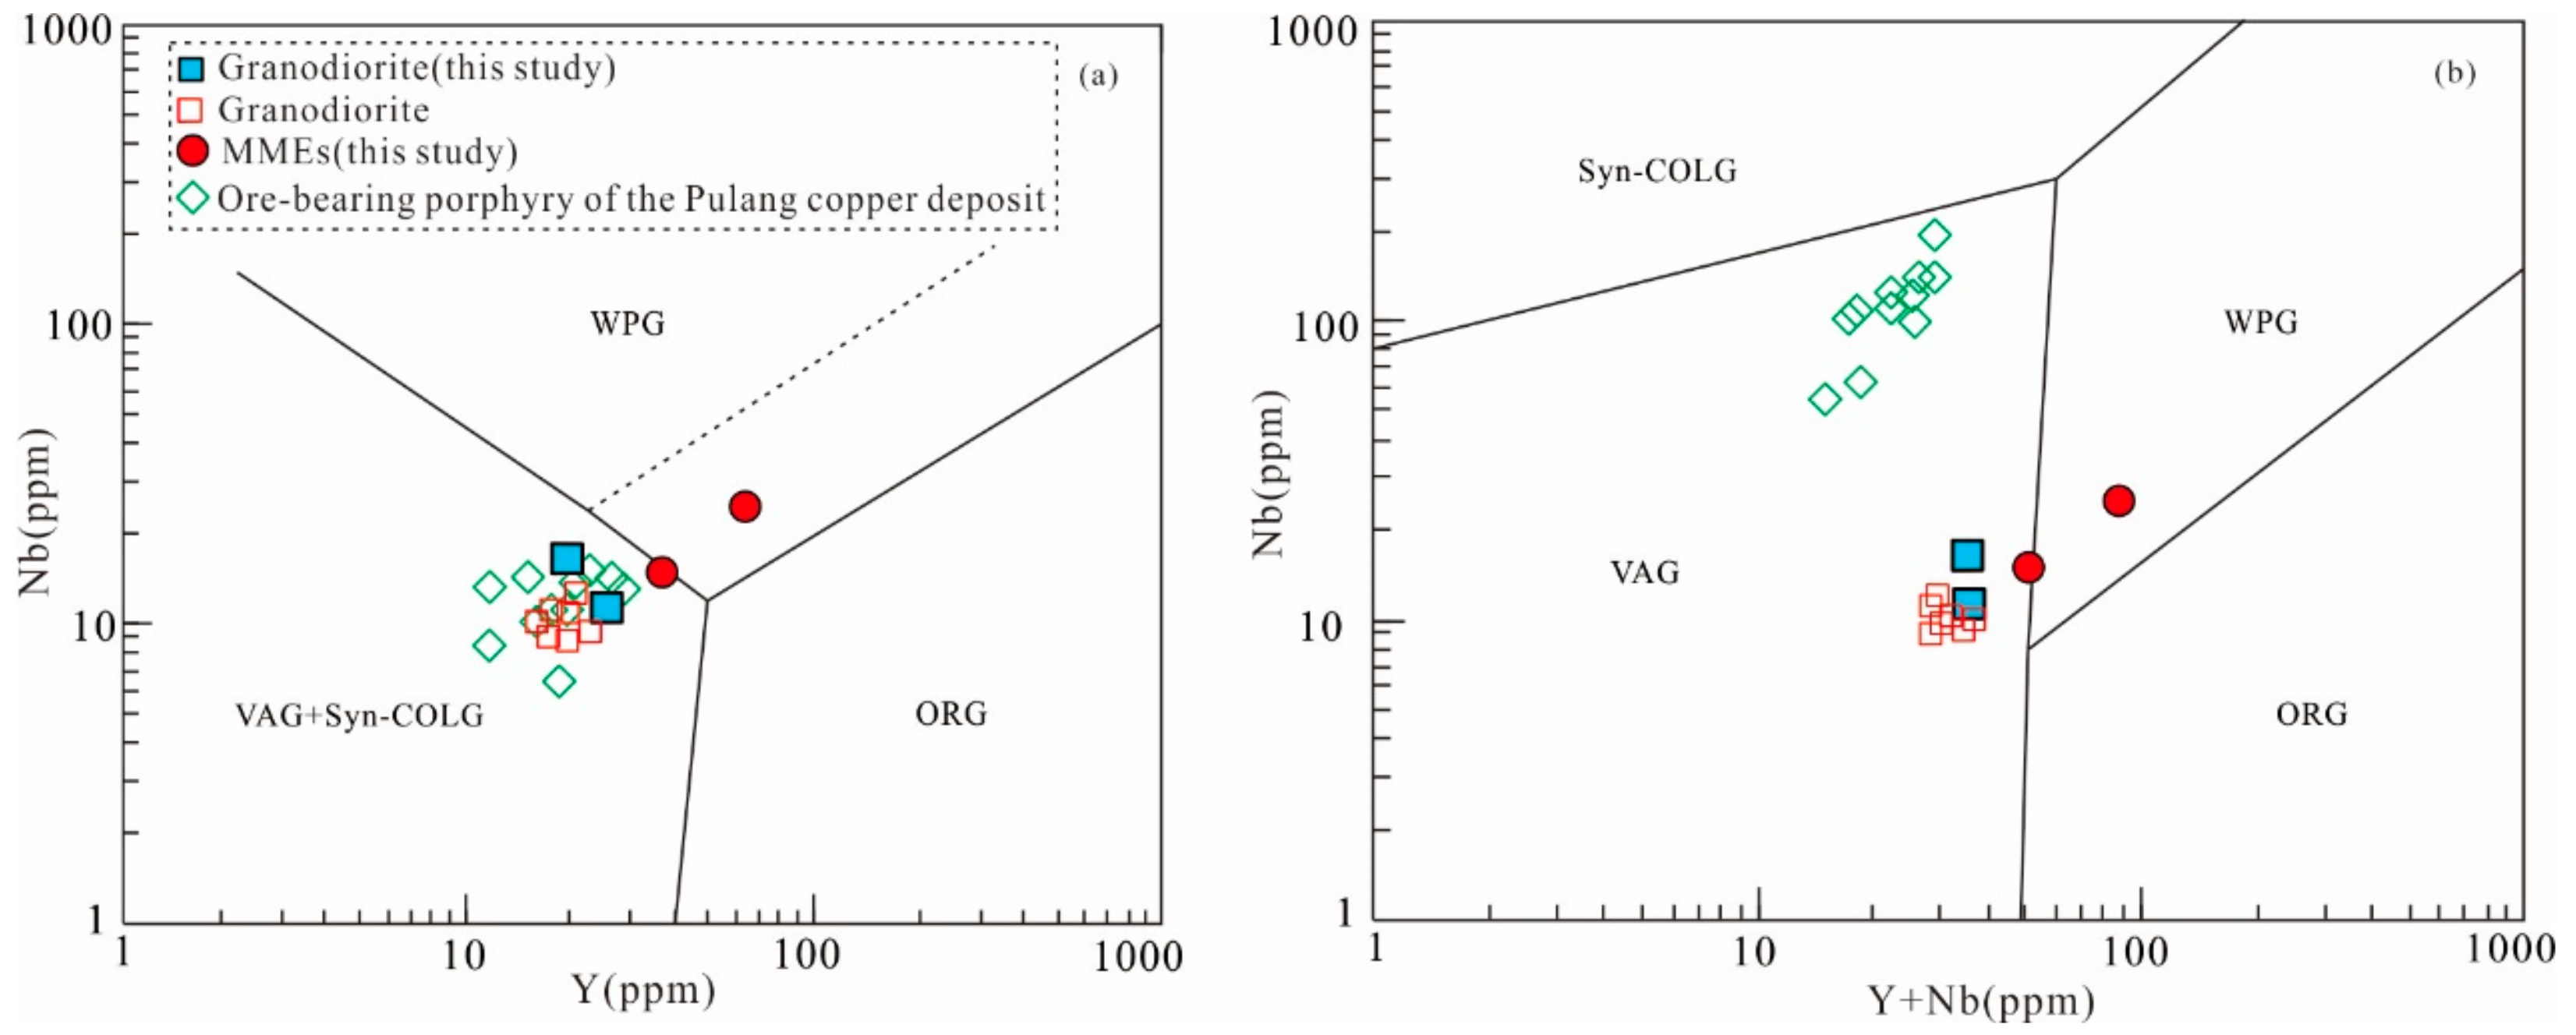
The Late Triassic Daocheng granodiorite is metaluminous to just peraluminous, high-K calc-alkaline I-type granite, and derived from the partial melting of Mesoproterozoic igneous arc lower crust.
(3)
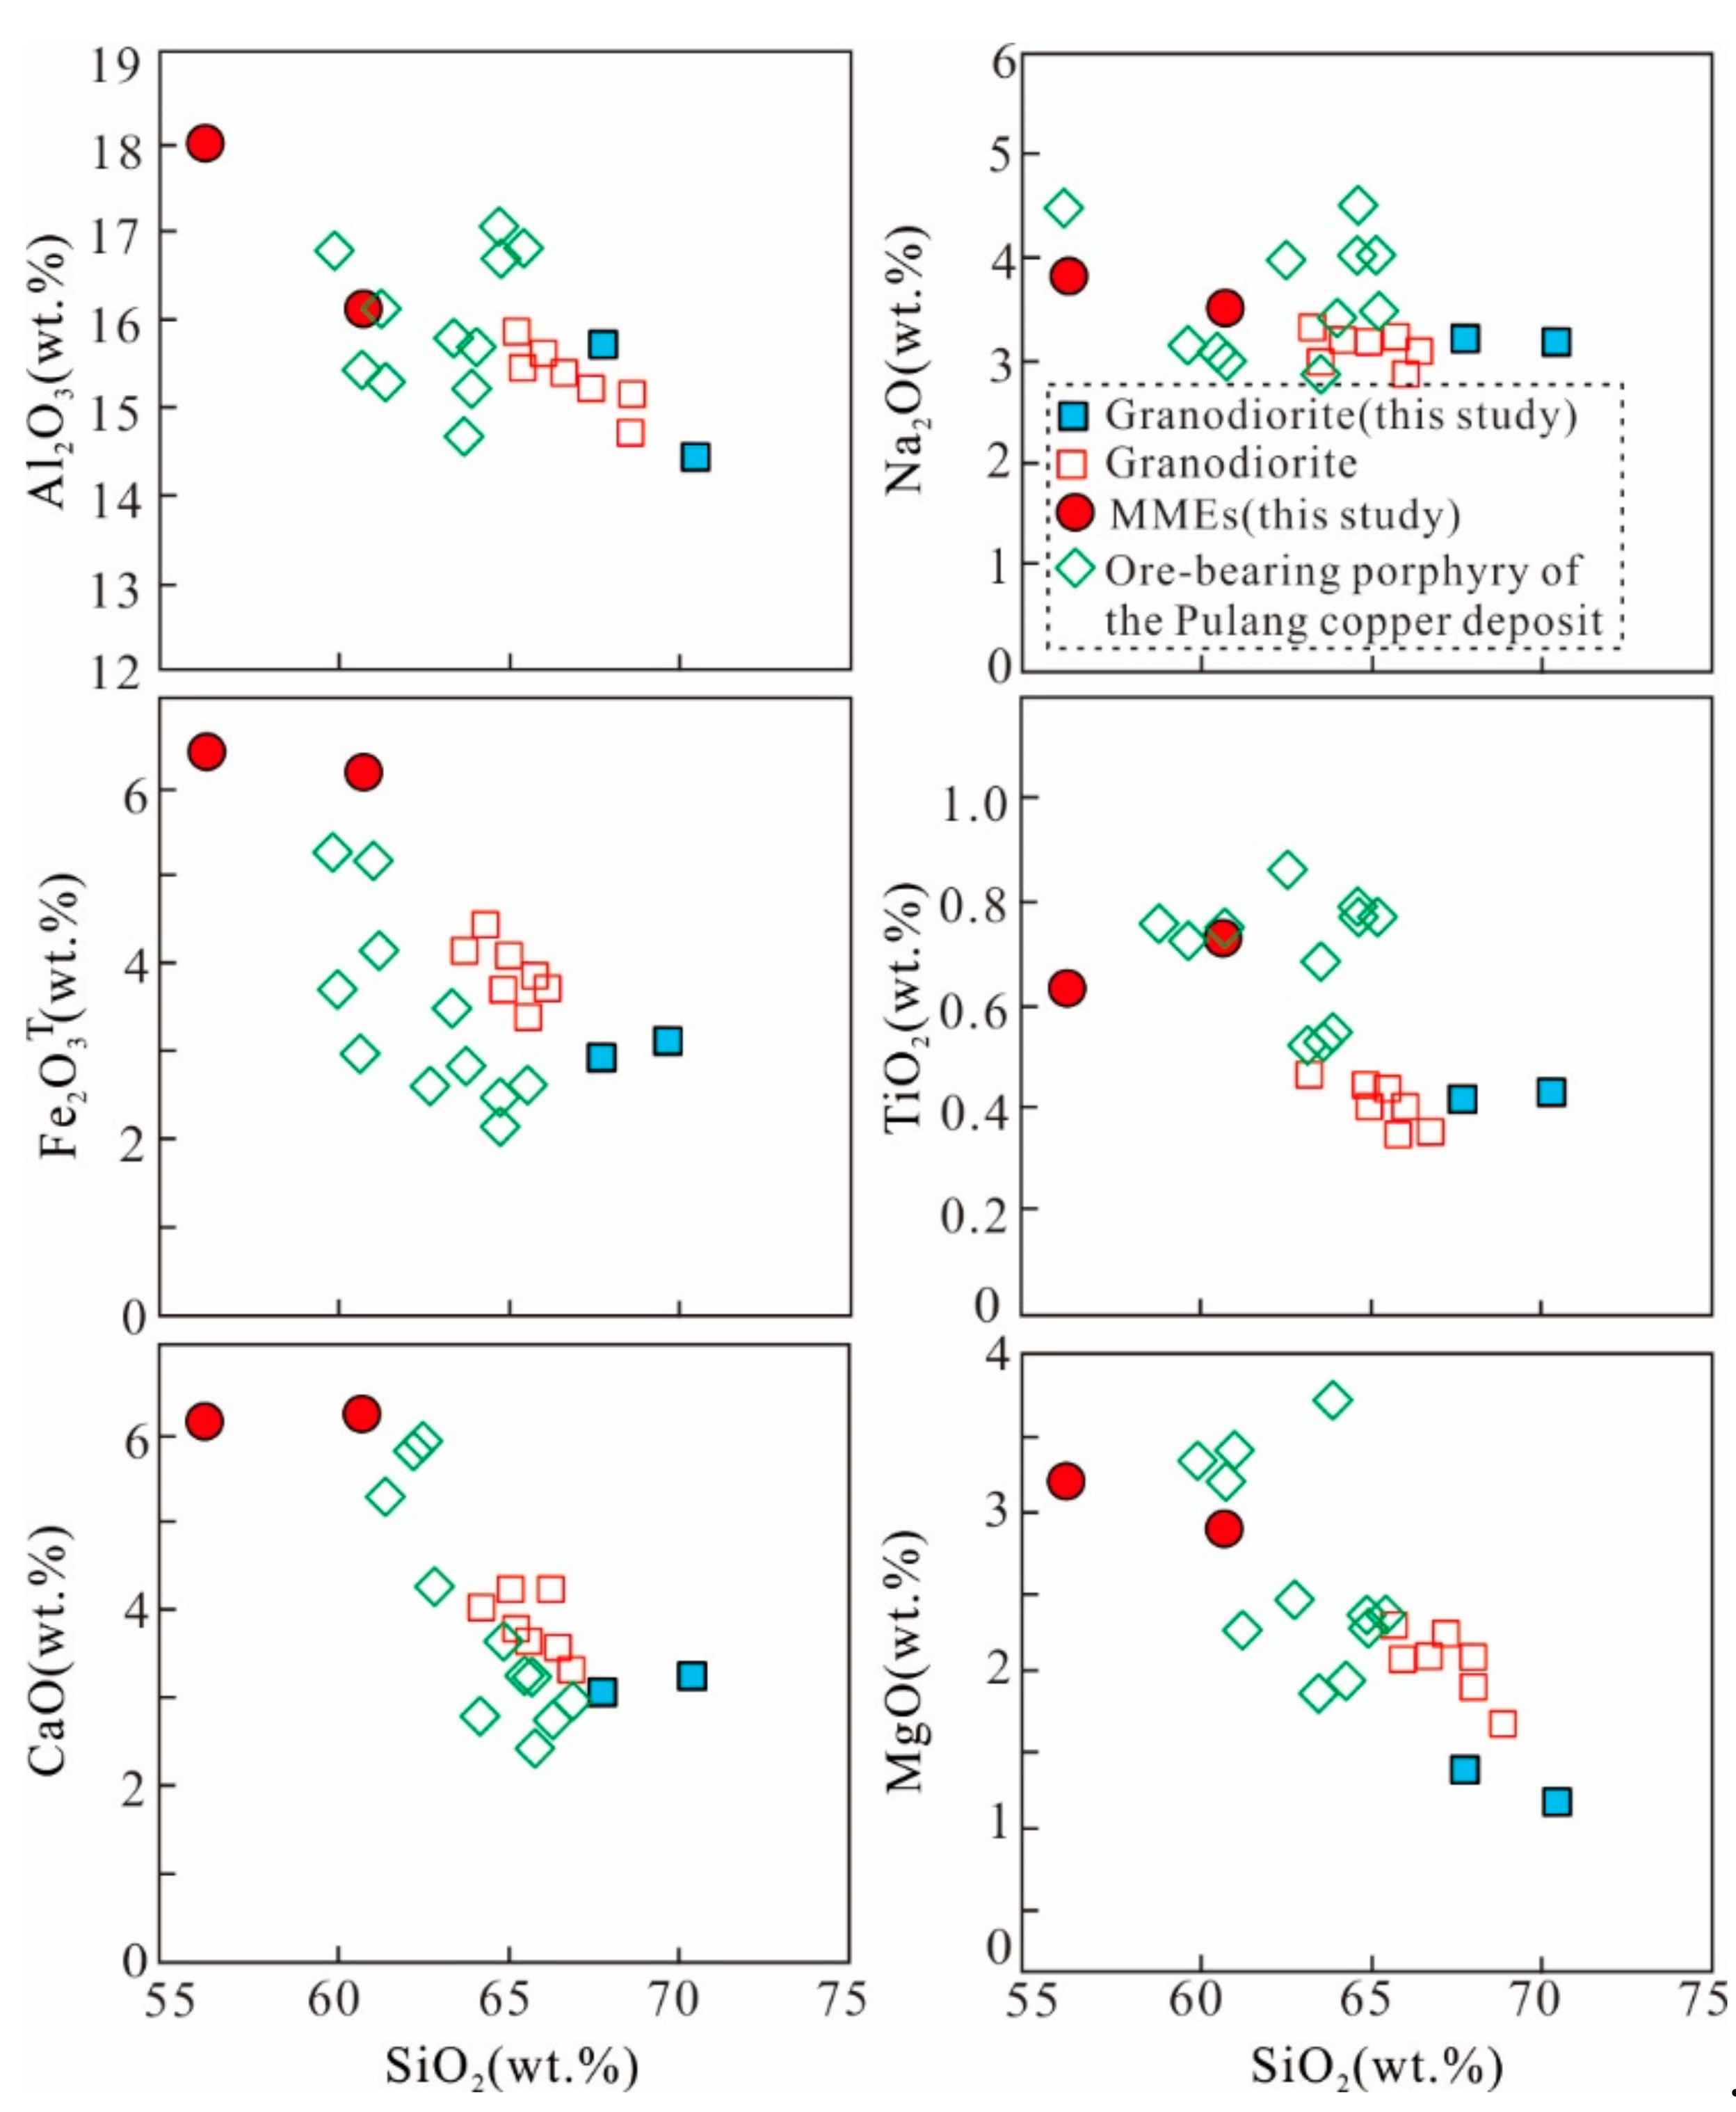
The abundant MMEs occurred mainly in granodiorite and K-feldspar megacrystic granite and had a typical granular texture. The MMEs were characterized by quenched apatite, quartz eyes and the contents of MgO, Al2O3 and Fe2O3 were negatively correlated with SiO2 content. The MMEs were generated by the incomplete mixing of the mafic magma with felsic magma.
(4)
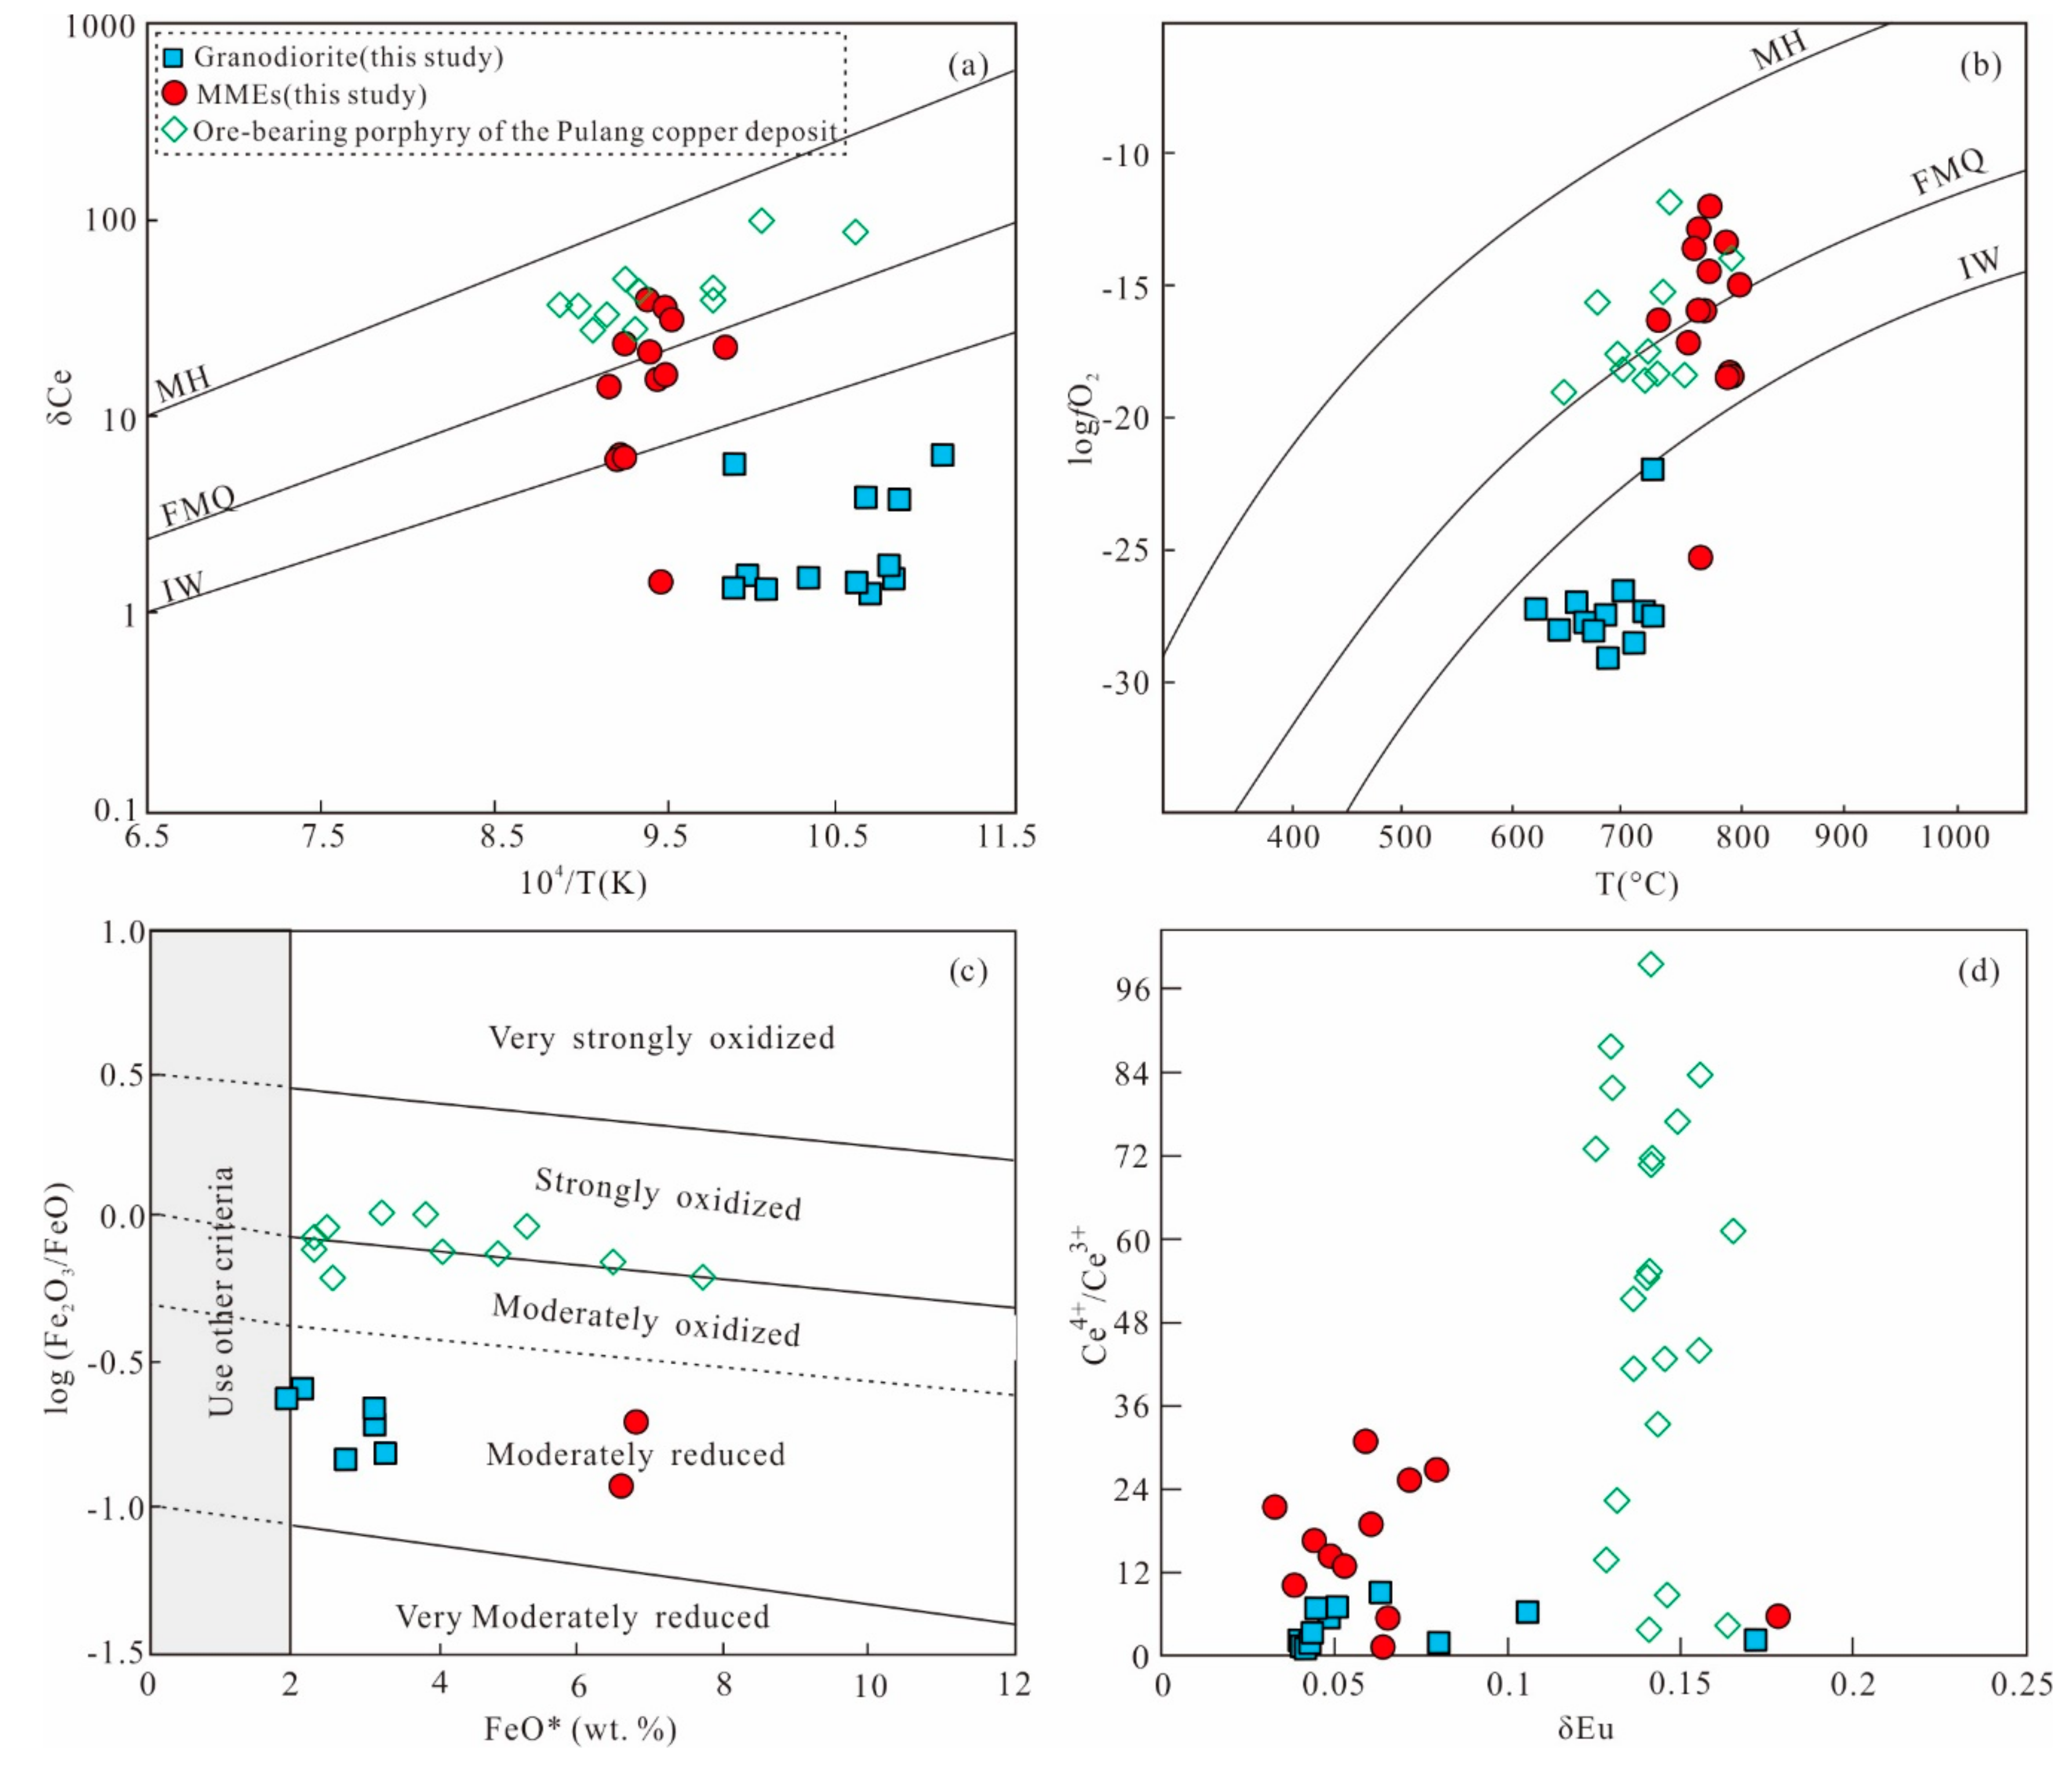
The Daocheng granodiorite had much lower zircon Ce4+/Ce3+ (average of 3.53) and fO2 values (average of ∆FMQ = −10.84) than those of ore-bearing quartz monzonite porphyry (average of Ce4+/Ce3+ = 52.10; ∆FMQ = 2.8) in the Pulang copper deposit. Thus in this comparative study it was clear that during the Late Triassic in the Yidun Arc, the high oxygen fugacity of the magma was conducive to mineralization.

Supplementary Materials

The following are available online at https://www.mdpi.com/2075-163X/9/10/608/s1, Table S1: LA-ICP-MS zircon U–Pb isotopic compositions of granodiorite and MMEs from the Daocheng batholith, Table S2: Zircon Lu–Hf isotopic compositions of granodiorite and MMEs from the Daocheng batholith, Table S3: LA-ICP-MS zircon trace element compositions (ppm) of granodiorite and MMEs from the Daocheng batholith.

Author Contributions

R.-G.Z. wrote the paper and performed data treatment; R.-G.Z. and X.G. formulated the problem and revised paper; X.G. and W.-Y.H. made a conceptualization and guided the study.

Funding

This study was financially supported by China Postdoctoral Science Foundation (Grant No. 2019T120121 and 2018M640161), the National Basic Research Program of China (Grant No. 2015CB452605 and 2015CB452606) and the 111 Project of the Ministry of Science and Technology, China (Grant No. BP0719021).

Acknowledgments

We would like to thank Liqiang Yang from the China University of Geoscience in Beijing for providing valuable comments on earlier versions of this manuscript. And thank Shouyin Rao, Chenguang Wang and Mengmeng Li providing helps in field investigation. Sincere thanks are extend to Hongfang Chen and Zheng Liu for their help with zircon U–Pb dating, Hf isotope testing and data analysis. Zhen Yang and Xuequan Gao on zircon oxygen isotopic data and three anonymous referees have helped us improve the paper significantly.

Conflicts of Interest

The authors declare no conflict of interest.

References

  1. Deng, J.; Wang, Q.F.; Li, G.J.; Santosh, M. Cenozoic tectono-magmatic and metallogenic processes in the Sanjiang region, southwestern China. Earth Sci. Rev. 2014, 138, 268–299. [Google Scholar] [CrossRef]
  2. Deng, J.; Wang, Q.F.; Li, G.J.; Li, C.S.; Wang, C.M. Tethys tectonic evolution and its bearing on the distribution of important mineral deposits in the Sanjiang region, SW China. Gondwana Res. 2014, 26, 419–437. [Google Scholar] [CrossRef]
  3. He, W.Y.; Mo, X.X.; He, Z.H.; White, N.C.; Chen, J.B.; Yang, K.H.; Wang, R.; Yu, X.H.; Dong, G.C.; Huang, X.F. The Geology and Mineralogy of the Beiya Skarn Gold Deposit in Yunnan, Southwest China. Econ. Geol. 2015, 110, 1625–1641. [Google Scholar] [CrossRef]
  4. He, W.Y.; Xie, S.X.; Liu, X.D.; Gao, X.; Xing, Y.L. Geochronology and geochemistry of the Donglufang porphyry-skarn Mo–Cu deposit in the southern Yidun Terrane and their geological Significances. Geosci. Front. 2018, 9, 1433–1450. [Google Scholar] [CrossRef]
  5. Yang, L.Q.; Deng, J.; Gao, X.; He, W.Y.; Meng, J.Y.; Santosh, M.; Yu, H.J.; Yang, Z.; Wang, D. Timing of formation and origin of the Tongchanggou porphyry-skarn deposit: Implications for Late Cretaceous Mo–Cu metallogenesis in the southern Yidun Terrane, SE Tibetan Plateau. Ore Geol. Rev. 2017, 81, 1015–1032. [Google Scholar] [CrossRef]
  6. Yang, L.Q.; Deng, J.; Dilek, Y.; Meng, J.Y.; Gao, X.; Santosh, M.; Wang, D.; Yan, H. Melt source and evolution of I-type granitoids in the SE Tibetan Plateau: Late Cretaceous magmatism and mineralization driven by collision-induced transtensional tectonics. Lithos 2016, 245, 258–273. [Google Scholar] [CrossRef]
  7. Yang, L.Q.; He, W.Y.; Gao, X.; Shu, Q.H. Multiple Mesozoic porphyry-skarn Cu (Mo–W) systems in Yidun Terrane, east Tethys: Constraints from zircon U–Pb and molybdenite Re-Os geochronology. Ore Geol. Rev. 2017, 90, 813–826. [Google Scholar] [CrossRef]
  8. Gao, X.; Yang, L.Q.; Meng, J.Y.; Zhang, L.J. Zircon U–Pb, molybdenite Re–Os geochronology and Sr–Nd–Pb–Hf–O–S isotopic constraints on the genesis of Relin Cu–Mo deposit in Zhongdian, Northwest Yunnan, China. Ore Geol. Rev. 2017, 91, 945–962. [Google Scholar] [CrossRef]
  9. Yang, L.Q.; Gao, X.; He, W.Y. Late Cretaceous porphyry metallogenic system of the Yidun arc, SW China. Acta Petrol. Sin. 2015, 31, 3155–3170, (In Chinese with English Abstract). [Google Scholar]
  10. Yang, L.Q.; He, W.Y.; Gao, X.; Xie, S.X.; Yang, Z. Mesozoic multiple magmatism and porphyry–skarn Cu–polymetallic systems of the Yidun Terrane, Eastern Tethys: Implications for subduction- and transtension-related metallogeny. Gondwana Res. 2018, 62, 144–162. [Google Scholar] [CrossRef]
  11. Hou, Z.Q.; Yang, Y.Q.; Qu, X.M.; Huang, D.H.; Lü, Q.T.; Wang, H.P.; Yu, J.J.; Tang, S.H. Tectonic evolution and mineralization systems of the Yidun Arc Orogen in Sanjiang Region, China. Acta Geol. Sin. 2004, 78, 109–120, (In Chinese with English Abstract). [Google Scholar]
  12. Deng, J.; Wang, C.M.; Zi, J.W.; Xia, R.; Li, Q. Constraining subduction-collision processes of the Paleo-Tethys along the Changning–Menglian Suture: New zircon U-Pb ages and Sr–Nd–Pb–Hf–O isotopes of the Lincang Batholith. Gondwana Res. 2017, 62, 75–92. [Google Scholar] [CrossRef]
  13. Li, W.C.; Pan, G.T.; Hou, Z.Q. Metallogenic and Exploration Techniques of Multi–islandearc Basin–Collision Orogenic Belt in Southwest of the “Three Rivers”; Geological Publishing House: Beijing, China, 2010; pp. 1–107. (In Chinese) [Google Scholar]
  14. Gao, X.; Yang, L.Q.; Orovan, E.A. The lithospheric architecture of two subterranes in the eastern Yidun Terrane, East Tethys: Insights from Hf–Nd isotopic mapping. Gondwana Res. 2018, 62, 127–143. [Google Scholar] [CrossRef]
  15. Deng, J.; Wang, Q.F.; Li, G.J. Tectonic evolution, superimposed orogeny, and composite metallogenic system in China. Gondwana Res. 2018, 50, 216–266. [Google Scholar] [CrossRef]
  16. Zhang, R.G.; Gao, X.; Yang, L.Q. Identification of magma mixing: A case study of the Daocheng batholith in the Yidun Arc. Adv. Earth Sci. 2018, 33, 1058–1074. [Google Scholar]
  17. He, D.F.; Zhu, W.G.; Zhong, H.; Ren, T.; Bai, Z.J.; Fan, H.P. Zircon U–Pb geochronology and elemental and Sr–Nd–Hf isotopic geochemistry of the Daocheng granitic pluton from the Yidun Arc, SW China. J. Asian Earth Sci. 2013, 67–68, 1–17. [Google Scholar] [CrossRef]
  18. Wang, N.; Wu, C.L.; Qin, H.P. Mineralogical, Geochemical Features of Typical Mesozoic Granites in the Yidun Arc, Western Sichuan and a Discussion on the Magma Origin. Geol. Rev. 2017, 63, 981–1000, (In Chinese with English Abstract). [Google Scholar]
  19. Hou, Z.Q.; Qu, X.M.; Zhou, J.R.; Yang, Y.Q.; Huang, D.H.; Lü, Q.T.; Tang, S.H.; Yu, J.J.; Wang, H.P.; Zhao, J.H. Collision–orogenic processes of the Yidun Arc in the Sanjiang region: Record of granites. Acta Geol. Sin. 2001, 75, 484–497, (In Chinese with English Abstract). [Google Scholar]
  20. Reid, A.; Wilson, C.; Liu, S.; Pearson, N.; Belousova, E. Mesozoic plutons of the Yidun Arc, SW China: U/Pb geochronology and Hf isotopic signature. Ore Geol. Rev. 2007, 31, 88–106. [Google Scholar] [CrossRef]
  21. Wang, N.; Wu, C.L.; Qin, H.P.; Lei, M.; Guo, W.F.; Zhang, X.; Chan, H.J. Zircon U–Pb geochronology and Hf isotopic characteristics of the Daocheng granite and Haizishan granite in the Yidun Arc, Western Sichuan, and their geological significance. Acta Geol. Sin. 2016, 90, 3227–3245, (In Chinese with English Abstract). [Google Scholar]
  22. Wu, T.; Xiao, L.; Wilde, S.A.; Ma, C.Q.; Zhou, J.X. A mixed source for the Late Triassic Garzê-Daocheng granitic belt and its implications for the tectonic evolution of the Yidun arc belt, eastern Tibetan Plateau. Lithos 2017, 288–289, 214–230. [Google Scholar] [CrossRef]
  23. Liu, S.W.; Wang, Z.Q.; Yan, Q.R.; Zhang, D.H.; Wang, J.G.; Yang, B.; Gu, L.B.; Zhao, F.S. Indosinian tectonic setting of the southern Yidun Arc: Constraints from SHRIMP zircon chronology and geochemistry of Dioritic porphyrites and granites. Acta Geol. Sin. 2006, 80, 387–399, (In Chinese with English Abstract). [Google Scholar]
  24. Wang, Q.W.; Wang, K.M.; Kan, Z.Z. Granite and Its Metallogenic Series of Western Sichuan Province; Geological Publishing House: Beijing, China, 2008. (In Chinese) [Google Scholar]
  25. Peng, T.P.; Zhao, G.C.; Fan, W.M.; Peng, B.X.; Mao, Y.S. Zircon geochronology and Hf isotopes of Mesozoic intrusive rocks from the Yidun terrane, eastern Tibetan Plateau: Petrogenesis and their bearings with Cu mineralization. J. Asian Earth Sci. 2014, 80, 18–33. [Google Scholar] [CrossRef]
  26. Cao, D.H.; Wang, A.J.; Li, W.C.; Wang, G.S.; Li, R.P.; Li, Y.K. Magma mixing in the Pulang Copper Deposit: Evidence from Petrology and Element Geochemistry. Acta Petrol. Sin. 2009, 83, 166–175, (In Chinese with English Abstract). [Google Scholar]
  27. Wang, P.; Dong, G.C.; Dong, M.L.; Li, Y.P.; Xu, Y.M.; Pan, Y.N.; Chen, W.; Wu, Z.C. Magma mixing of the Cuojiaoma Batholith in the Yindun Arc: Evidence from mafic microgranular enclaves. Acta Petrol. Sin. 2017, 33, 2535–2547, (In Chinese with English Abstract). [Google Scholar]
  28. Gao, X.; Yang, L.Q.; Zhang, R.G.; Meng, J.Y. Nature and origin of Mesozoic granitoids and associated mineralization in the Sanjiang Tethys Orogeny, SW China: The Xiuwacu complex example. Int. Geol. Rev. 2019, 61, 795–820. [Google Scholar] [CrossRef]
  29. Li, W.C.; Zeng, P.Z.; Hou, Z.Q.; Noel, C.W. The Pulang copper deposit and associated felsic intrusions in Yunnan province, Southeast China. Econ. Geol. 2011, 106, 79–92. [Google Scholar]
  30. Zhang, R.G.; He, W.Y.; Gao, X.; Li, M.M. Magma mixing of the Daocheng batholith of western Sichuan: Mineralogical evidences. Geosci. Front. 2018, 25, 226–239. [Google Scholar]
  31. Leng, C.B.; Huang, Q.Y.; Zhang, X.C.; Wang, S.C.; Zhong, H.; Hu, R.Z.; Bi, X.W.; Zhu, J.J.; Wang, X.S. Petrogenesis of the Late Triassic volcanic rocks in the Southern Yidun arc, SW China: Constraints from the geochronology, geochemistry and Sr-Nd-Pb-Hf isotopes. Lithos 2014, 190–191, 363–382. [Google Scholar] [CrossRef]
  32. Liu, X.L.; Li, W.C.; Yin, G.H.; Zhang, N. The geochronology, mineralogy and geochemistry study of the Pulang porphyry copper deposits in Geza arc of Yunnan Province. Acta Petrol. Sin. 2013, 29, 3049–3064, (In Chinese with English Abstract). [Google Scholar]
  33. Ren, J.B.; Xu, J.F.; Chen, J.L. Zircon geochronology and geological implications of ore–bearing porphyries from Zhongdian arc. Acta Petrol. Sin. 2011, 27, 2591–2599. [Google Scholar]
  34. Chen, J.L.; Zhao, W.X.; Xu, J.F.; Wang, B.D.; Kang, Z.Q. Geochemistry of Miocene trachytes in Bugasi, Lhasa block, Tibetan Plateau: Mixing products between mantleand crust-derived melts? Gondwana Res. 2012, 21, 112–122. [Google Scholar] [CrossRef]
  35. Liu, Y.; Hu, Z.; Gao, S.; Guenther, D.; Xu, J.; Gao, C.; Chen, H. In situ analysis of major and trace elements of anhydrous minerals by LA-ICP-MS without applying an internal standard. Chem. Geol. 2008, 257, 34–43. [Google Scholar] [CrossRef]
  36. Liu, Y.; Gao, S.; Hu, Z.; Gao, C.; Zong, K.; Wang, D. Continental and oceanic crust recycling-induced melt-peridotite interactions in the Trans-North China Orogen: U–Pb Dating, Hf Isotopes and Trace Elements in Zircons from Mantle Xenoliths. J. Petrol. 2010, 51, 537–571. [Google Scholar] [CrossRef]
  37. Ludwig, K.R. ISOPLOT 3.00: A Geochronological Toolkit for Microsoft Excel; Special Publication/Berkeley Geochronology Center: Berkeley, CA, USA, 2003; Volume 4, pp. 1–71. [Google Scholar]
  38. Hu, Z.C.; Zhang, W.; Liu, Y.S.; Gao, S.; Li, M.; Zong, K.Q.; Chen, H.H.; Hu, S.H. “Wave” signal smoothing and mercury removing device for laser ablation quadrupole and multiple collector ICP-MS analysis: Application to lead isotope analysis. Anal. Chem. 2015, 87, 1152–1157. [Google Scholar] [CrossRef] [PubMed]
  39. Middlemost, E. Naming materials in the magma/igneous rock system. Earth-Sci. Rev. 1994, 37, 215–224. [Google Scholar] [CrossRef]
  40. Maniar, P.D.; Piccoli, P.M. Tectonic discrimination of granitoids. Geol. Soc. Am. Bull. 1989, 101, 635–643. [Google Scholar] [CrossRef]
  41. Peccerillo, A.; Taylor, S. Geochemistry of eocene calc–alkaline volcanic rocks from the Kastamonu area, Northern Turkey. Contrib. Mineral. Petrol. 1976, 58, 63–81. [Google Scholar] [CrossRef]
  42. Richards, J.P. Tectono-magmatic precursors for porphyry Cu-(Mo–Au) deposit formation. Econ. Geol. 2003, 98, 1515–1533. [Google Scholar] [CrossRef]
  43. Sillitoe, R.H. Porphyry copper systems. Econ. Geol. 2010, 105, 3–41. [Google Scholar] [CrossRef]
  44. Hou, Z.Q.; Zhang, H.R.; Pan, X.F.; Yang, Z.M. Porphyry Cu (–Mo–Au) deposits related to melting of thickened mafic lower crust: Examples from the eastern Tethyan metallogenic domain. Ore Geol. Rev. 2011, 39, 21–45. [Google Scholar] [CrossRef]
  45. Whalen, J.B.; Currie, K.L.; Chappell, B.W. A–type granites: Geochemical characteristics, discrimination and petrogenesis. Contrib. Mineral. Petrol. 1987, 95, 407–419. [Google Scholar] [CrossRef]
  46. Chappell, B.W. Aluminium saturation in I- and S-type granites and the characterization of fractionated haplogranites. Lithos 1999, 46, 535–551. [Google Scholar] [CrossRef]
  47. Audetat, A. Source and evolution of molybdenum in the porphyry Mo (–Nb) deposit at Cave Peak, Texas. J. Petrol. 2010, 51, 1739–1760. [Google Scholar] [CrossRef]
  48. Soesoo, A. Fractional crystallization of mantle–derived melts as a mechanism for some I-type granite petrogenesis: An example from Lachlan Fold Belt, Australia. J. Geol. Soc. 2000, 157, 135–149. [Google Scholar] [CrossRef]
  49. Kemp, A.I.S.; Hawkesworth, C.J.; Foster, G.L.; Paterson, B.A.; Woodhead, J.D.; Hergt, J.M.; Gray, C.M.; Whitehouse, M.J. Magmatic and crustal differentiation history of granitic rocks from Hf–O isotopes in zircon. Science 2007, 315, 980–983. [Google Scholar] [CrossRef]
  50. Collins, W.J.; Richards, S.W. Geodynamic significance of S-type granites in circum-Pacific orogens. Geology 2008, 36, 559–562. [Google Scholar] [CrossRef]
  51. Griffin, W.L.; Wang, X.; Jackson, S.E.; Pearson, N.J.; O’Reilly, S.Y.; Xu, X.S.; Zhou, X.M. Zircon chemistry and magma mixing, SE China: In–situ analysis of Hf isotopes, Tonglu and Pingtan igneous complexes. Lithos 2002, 61, 237–269. [Google Scholar] [CrossRef]
  52. Rapp, R.P.; Watson, E.B.; Miller, C.F. Partial melting of amphibolite/eclogite and the origin of Archean trondhjemites and tonalites. Precambrian Res. 1991, 51, 1–25. [Google Scholar] [CrossRef]
  53. Zhu, J.J.; Hu, R.Z.; Bi, X.W.; Zhong, H.; Chen, H. Zircon U–Pb ages, Hf–O isotopes and whole-rock Sr–Nd–Pb isotopic geochemistry of granitoids in the Jinshajiang suture zone, SW China: Constraints on petrogenesis and tectonic evolution of the Paleo-Tethys Ocean. Lithos 2011, 126, 248–264. [Google Scholar] [CrossRef]
  54. Green, T.H. Significance of Nb/Ta as an indicator of geochemical processes in the crust–mantle system. Chem. Geol. 1995, 120, 347–359. [Google Scholar] [CrossRef]
  55. Sun, W.D.; McDonough, W.F. Chemical and isotopic systematics of oceanic basalts: Implications for mantle composition and processes. Geol. Soc. Lond Spec. Publ. 1989, 42, 313–345. [Google Scholar] [CrossRef]
  56. Taylor, S.R.; McLennan, S.M. The Continental Crust: Its Composition and Evolution; Blackwell Scientific Publications: Oxford, UK, 1985; pp. 1–328. [Google Scholar]
  57. Mo, X.X.; Deng, J.F.; Lu, F.X. Volcanism and the evolution of Tethys in Sanjiang area, southwestern China. J. Asian Earth Sci. 1994, 9, 325–333. [Google Scholar]
  58. He, W.Y.; Mo, X.X.; Yang, L.Q.; Xing, Y.L.; Dong, G.C.; Yang, Z.; Gao, X.; Bao, X.S. Origin of the Eocene porphyries and mafic microgranular enclaves from the Beiya porphyry Au polymetallic deposit, western Yunnan, China: Implications for magma mixing/mingling and mineralization. Gondwana Res. 2016, 40, 230–248. [Google Scholar] [CrossRef]
  59. Yang, L.Q.; Deng, J.; Dilek, Y.; Qiu, K.F.; Ji, X.Z.; Santosh, M.; Song, K.R.; Song, Y.H.; Geng, J.Z.; Zhang, C.; et al. Magma mixing and crust–mantle interaction in the Triassic monzogranites of Bikou Terrane, central China: Constraints from petrology, geochemistry, and zircon U–Pb–Hf isotopic systematics. J. Asian Earth Sci. 2015, 98, 320–341. [Google Scholar] [CrossRef]
  60. Barbarin, B.; Didier, J. Genesis and evolution of mafic microgranular enclaves through various types of interaction between coexisting felsic and mafic magmas: Transactions of the Royal. Earth Environ. Sci. Trans. R. Soc. Edinb. 1992, 83, 145–153. [Google Scholar]
  61. Collins, W.J.; Wiebe, R.A.; Healy, B.; Richards, S.W. Replenishment, crystal accumulation and floor aggradation in the megacrystic Kameruka Suite, Australia. J. Petrol. 2006, 47, 2073–2104. [Google Scholar] [CrossRef]
  62. Dahlquist, J.A. Mafic microgranular enclaves: Early segregation from metaluminous magma (Sierra de Chepes), Pampean Ranges, NW Argentina. J. S. Am. Earth Sci. 2002, 15, 643–655. [Google Scholar] [CrossRef]
  63. Donaire, T.; Pascual, E.; Pin, C.; Duthou, J.L. Microgranular enclaves as evidence of rapid cooling in granitoid rocks: The case of the Los Pedroches granodiorite, Iberian Massif, Spain. Contrib. Mineral. Petrol. 2005, 149, 247–265. [Google Scholar] [CrossRef]
  64. Ilbeyli, N.; Pearce, J.A. Petrogenesis of igneous enclaves in plutonic rocks of the Central Anatolian Massif, Turkey. Int. Geol. Rev. 2005, 47, 1011–1034. [Google Scholar] [CrossRef]
  65. Maas, R.; Nicholls, I.A.; Legg, C. Igneous and metamorphic enclaves in the S–type Deddick granodiorite, Lachlan Fold Belt, SE Australia: Petrographic, geochemical and Nd–Sr isotopic evidence for crustal melting and magma mixing. J. Petrol. 1997, 38, 815–841. [Google Scholar] [CrossRef]
  66. Barbarin, B. Mafic magmatic enclaves and mafic rocks associated with some granitoids of the central Sierra Nevada batholith, California: Nature, origin, and relations with the hosts. Lithos 2005, 80, 155–177. [Google Scholar] [CrossRef]
  67. Blundy, J.D.; Sparks, R.S.J. Petrogenesis of mafic inclusions in granitoids of the Adamello Massif, Italy. J. Petrol. 1992, 33, 1039–1104. [Google Scholar] [CrossRef]
  68. Vernon, R.H. Microgranitoid enclaves in granites: Globules of hybrid magma quenched in a plutonic environment. Nature 1984, 309, 438–439. [Google Scholar] [CrossRef]
  69. White, R.V.; Tarney, J.; Kerr, A.C.; Saunders, A.D.; Kempton, P.D.; Pringle, M.S.; Klaver, G.T. Modification of an oceanic plateau, Aruba, Dutch Caribbean: Implications for the generation of continental crust. Lithos 1999, 46, 43–68. [Google Scholar] [CrossRef]
  70. Blevin, P.L. Redox and compositional parameters for interpreting the granitoid metallogeny of eastern Australia: Implications for gold-rich ore system. Resour. Geol. 2004, 54, 241–252. [Google Scholar] [CrossRef]
  71. Liang, H.Y.; Sun, W.D.; Su, W.C.; Zartman, R.E. Porphyry copper-gold mineralization at Yulong, China, promoted by decreasing redox potential during magnetite alteration. Econ. Geol. 2009, 104, 587–596. [Google Scholar] [CrossRef]
  72. Trail, D.; Watson, E.B.; Tailby, N.D. Ce and Eu anomalies in zircon as proxies for the oxidation state of magmas. Geochim. Cosmochim. Acta 2012, 97, 70–87. [Google Scholar] [CrossRef]
  73. Ballard, J.R.; Palin, M.J.; Campbell, I.H. Relative oxidation states of magmas inferred from Ce(IV)/Ce(III) in zircon: Application to porphyry copper deposits of northern Chile. Contrib. Mineral. Petrol. 2002, 144, 347–364. [Google Scholar] [CrossRef]
  74. Cherniak, D.J.; Watson, E.B.; Hanchar, J.M. Rare-earth diffusion in zircon. Chem. Geol. 1997, 134, 289–301. [Google Scholar] [CrossRef]
  75. Shen, P.; Hattori, K.; Pan, H.; Jackson, S.; Seitmuratova, E. Oxidation condition and metal fertility of granitic magmas: Zircon trace–element data from porphyry Cu deposits in the central Asian orogenic belt. Econ. Geol. 2015, 110, 1861–1878. [Google Scholar] [CrossRef]
  76. Trail, D.; Watson, E.B.; Tailby, N.D. The oxidation state of Hadean magmas and implications for early Earth’s atmosphere. Nature 2011, 480, 79–82. [Google Scholar] [CrossRef] [PubMed]
  77. Ferry, J.M.; Watson, E.B. New thermodynamic models and revised calibrations for the Ti-in-zircon and Zr-in-rutile thermometers. Contrib. Mineral. Petrol. 2007, 154, 429–437. [Google Scholar] [CrossRef]
  78. Richards, J.P. Postsubduction porphyry Cu-Au and epithermal Au deposits: Products of remelting of subduction-modified lithosphere. Geology 2009, 37, 247–250. [Google Scholar] [CrossRef]
  79. Yang, Z.; Yang, L.Q.; He, W.Y.; Gao, X.; Liu, X.D.; Bao, X.S.; Lu, Y.G. Control of magmatic oxidation state in intracontinental porphyry mineralization: A case from Cu (Mo–Au) deposits in the Jinshajiang–Red River metallogenic belt, SW China. Ore Geol. Rev. 2017, 90, 827–846. [Google Scholar] [CrossRef]
  80. Mungall, J.E. Roasting the mantle: Slab melting and the genesis of major Au and Au-rich Cu deposits. Geology 2002, 30, 915–918. [Google Scholar] [CrossRef]
  81. Sun, W.D.; Huang, R.F.; Li, H.; Hu, Y.B.; Zhang, C.C.; Sun, S.J.; Zhang, L.P.; Ding, X.; Li, C.Y.; Robert, E.Z.; et al. Porphyry deposits and oxidized magmas. Ore Geol. Rev. 2015, 65, 97–131. [Google Scholar] [CrossRef]
  82. Hattori, K.H.; Keith, J.D. Contribution of mafic melt to porphyry copper mineralization: Evidence from Mount Pinatubo, Philippines, and Bingham Canyon, Utah, USA. Miner. Depos. 2001, 36, 799–806. [Google Scholar] [CrossRef]
  83. Gao, X.Q.; He, W.Y.; Gao, X.; Bao, X.S.; Yang, Z. Constraints of magmatic oxidation state on mineralization in the Beiya alkali-rich porphyry gold deposit, western Yunnan, China. Solid Earth Sci. 2017, 2, 65–82. [Google Scholar] [CrossRef]
  84. Chou, I.M. Calibration of oxygen bufrers at elevated P and T using the hydrogen fugacity sensor. Am. Mineral. 1978, 63, 690–703. [Google Scholar]
  85. Huebner, J.S.; Sato, M. The oxygen fugacity-temperature relationships of manganese oxide and nickel oxide buffers. Am. Mineral. 1970, 55, 934–952. [Google Scholar]
  86. Huebner, J.S. Buffering techniques for hydrostatic systems at elevated pressure. In Research Techniques for High Pressure and High Temperature; Ulmer, G.C., Ed.; Springer-Verlag: Berlin/Heidelberg, Germany, 1971. [Google Scholar]
Figure 1. (a) tectonic outline of the Yidun Arc, showing the study area, and (b) simplified geological map of the Yidun Arc (modified after [6]).
Minerals 09 00608 g001
Figure 2. Photographs of an outcrop and photomicrographs of the host granodiorite and mafic microgranular enclaves (MMEs) in the Daocheng batholith. (a) wild outcrop of MMEs, (b) single polarized photo of granodiorite, (c) single polarized photo of K-feldspar megacrystic granite, (d) single polarized photo of MMEs, (e) orthogonal polarized photo of granodiorite, (f) orthogonal polarized photo of K-feldspar megacrystic granite and (g) quartz eyes. Mineral abbreviations: Bt = biotite, Hbl = hornblende, Pl = plagioclase, Kfs = K-feldspar, Qtz = quartz, Ap = apatite.
Minerals 09 00608 g002
Figure 3. Geochemical classification diagrams for granodiorite and MMEs. (a) Total alkaline-silica diagram [39]; (b) A/NK vs. A/CNK diagram [40]; (c) K2O vs. SiO2 diagram [41] and (d) K2O vs. Na2O diagram. Note: Data for granodiorite is from [17,18] and data for ore-bearing porphyry of the Pulang copper deposit is from [10].
Minerals 09 00608 g003
Figure 4. Harker diagrams for granodiorite and MMEs. Note: The data for granodiorite from [17,18] and the data for ore-bearing porphyry of the Pulang copper deposit from [10].
Minerals 09 00608 g004
Figure 5. Chondrite-normalized rare-earth elements (REE) patterns and primary mantle-normalized trace element spidergrams for granodiorite and MMEs. (a) chondrite-normalized REE and (b) primary mantle-normalized trace element.
Minerals 09 00608 g005
Figure 6. Cathodoluminescence (CL) images of representative zircon grains from granodiorite and MMEs. Yellow circles show the sites of laser ablation–inductively coupled plasma–mass spectrometry (LA–ICP–MS) dating, white circles show the sites of measured Hf isotopic compositions.
Minerals 09 00608 g006
Figure 7. LA–ICP–MS zircon U−Pb concordia diagrams for granodiorite and MMEs. (a) concordia age for MMEs; (b) weighted age for MMEs; (c) concordia age for granodiorite and (d) weighted age for granodiorite.
Minerals 09 00608 g007
Figure 8. Histograms of zircon εHf(t) values for the Daocheng batholith. Note: The data for granodiorite from [17,18]; the data for ore-bearing porphyry of the Pulang copper deposit from [10]. (a) histograms of zircon εHf(t) values for granodiorite and MMEs; (b) histograms of zircon εHf(t) values for the Daocheng batholith and (c) histograms of zircon εHf(t) values for ore-bearing porphyry of the Pulang copper deposit.
Minerals 09 00608 g008
Figure 9. The chemical diagrams for granodiorite and MMEs. (a) (Na2O + K2O)/CaO vs. (Zr + Nb + Ce + Y) diagram [45]; (b) SiO2 vs. P2O5 (after [46]); (c) YbN vs. (La/Yb)N (after [57]) and (d) La vs. La/Sm (after [58]). Note: Data for granodiorite from [17,18] and data for ore-bearing porphyry of the Pulang copper deposit from [10].
Minerals 09 00608 g009
Figure 10. Discrimination diagrams for the tectonic setting of granodiorite and MMEs. (after [60]), Abbreviations: ORG, ocean ridge granite; WPG, within-plate granite; VAG, volcanic arc granite; Syn-COLG, syncollisional granite. Note: The data for granodiorite from [17,18]; the data for ore-bearing porphyry of the Pulang copper deposit from [10]. (a) Nb vs. Y diagram and (b) Nb vs. (Y + Nb) diagram.
Minerals 09 00608 g010
Figure 11. Magmatic oxidation states of the Daocheng batholith. (a) Ce anomalies vs. 104/T (K) diagram (after [83]); (b) log fO2 vs. T (°C) diagram (after [79]); (c) whole-rock log (Fe2O3/FeO) vs. FeO* (wt. %) diagram (after [71]) and (d) zircon Ce4+/Ce3+ vs. δEu (after [83]). Abbreviations: MH, magnetite–hematite buffer curve [84]; NNO, nickel–nickel oxide buffer curve [85]; FMQ, fayalite–magnetite–quartz buffer curve [86]. Note: The data of the granodiorite is from [17,18] and the data of the ore-bearing porphyry of the Pulang copper deposit is from [10].
Minerals 09 00608 g011
Table 1. Whole-rock major (wt. %), trace elements (ppm) data for granodiorite and MMEs of the Daocheng batholith in the Yidun Arc.
Sample no.DC16-6DC16-9DC16-5DC16-8
LithologyGranodioriteMMEs
SiO267.9070.5456.3460.91
TiO20.410.420.620.72
Al2O315.6614.4117.9816.06
FeO2.332.555.055.30
TFe2O33.113.276.766.55
MnO0.070.060.200.17
MgO1.291.083.202.89
CaO3.023.226.096.18
Na2O3.203.183.803.50
K2O4.593.283.932.31
P2O50.160.080.400.13
LOI0.570.430.640.57
total99.9899.9899.9699.98
K2O + Na2O7.796.467.735.81
K2O/Na2O1.431.031.030.66
A/CNK1.000.980.830.82
A/NK1.531.641.711.95
Mg#45394846
DI77765756
Li30.530.432.540.5
Be2.112.023.682.39
Sc8.659.8422.5024.20
V593715491.9
Cr12.716.813.246.1
Co6.106.3514.2014.90
Ni6.165.1912.9011.60
Cu8.224.3820.6016.00
Zn39.746.874.085.5
Rb168121177125
Sr457144379131
Y19.325.16336.7
Zr224186233240
Nb16.611.525.615.2
Cs4.024.485.236.13
Ba1516562834522
La51.830.322.512
Ce87.454.457.226.3
Pr9.246.139.083.92
Nd32.224.641.817.7
Sm5.474.7211.85.33
Eu1.120.971.140.88
Gd4.264.2910.905.27
Tb0.680.802.001.06
Dy3.544.43116.16
Ho0.630.852.031.23
Er1.902.566.123.77
Tm0.300.420.980.64
Yb1.962.586.564.33
Lu0.300.400.920.65
Hf6.075.696.66.82
Ta1.171.051.761.38
Pb20.920.122.617
Th44.312.614.810.9
U8.142.596.993.59
ΣREE220.11162.55247.02125.94
LREE/HREE5.702.921.391.11
(La/Yb)N18.968.422.461.99
Eu/Eu*0.680.650.300.50
Sr/Y23.685.746.023.57
Note: Mg# = 100 × Mg2+/(Mg2+ + Fe2+), DI (differentiation index) is sum of components of quartz, orthoclase, albite, nepheline, leucite and kalsilite.
Table 2. Oxygen fugacity data of the granodiorite and MMEs of the Daocheng batholith
SampleTi (ppm)T (°C)Ce4+/Ce3+104/T (K)δCeLog(fO2)△FMQ
DC16-8-0211.388105.709.247.49−17.52−2.98
DC16-8-048.4377924.989.5146.43−12.073.14
DC16-8-0711.888145.469.207.24−17.44−3.00
DC16-8-0811.3681018.729.2433.97−11.842.70
DC16-8-119.7079316.419.3830.14−13.041.86
DC16-8-138.7478314.279.4722.12−14.690.44
DC16-8-149.2278812.829.4320.75−14.680.33
DC16-8-168.8078326.549.4753.80−11.323.80
DC16-8-189.8079430.529.3760.57−10.364.51
DC16-8-1911.688135.609.217.70−17.29−2.81
DC16-8-2012.578209.969.1518.86−13.580.74
DC16-8-225.9974621.219.8232.17−15.060.92
DC16-9-025.637406.599.876.76−21.22−5.09
DC16-9-052.586721.8210.581.42−30.76−12.88
DC16-9-061.986516.1310.824.24−27.90−9.42
DC16-9-105.677410.809.871.31−27.34−11.24
DC16-9-120.595676.5711.914.99−32.95−11.74
DC16-9-151.506308.9511.077.61−27.02−7.90
DC16-9-174.597211.1510.061.29−28.41−11.83
DC16-9-182.126572.6010.761.80−30.79−12.47
DC16-9-193.516981.8010.301.50−29.09−11.91
DC16-9-205.197330.959.951.56−27.11−10.80
DC16-9-212.466685.3010.624.40−26.74−8.75
DC16-9-222.396661.3210.651.23−31.64−13.59
DC16-9-232.066551.8710.781.47−31.66−13.28

