Article

Numerical Simulation Based Targeting of the Magushan Skarn Cu–Mo Deposit, Middle-Lower Yangtze Metallogenic Belt, China

1
School of Resources and Environmental Engineering, Hefei University of Technology, Hefei 23009, China
2
Anhui Province Engineering Research Center for Mineral Resources and Mine Environments, Hefei University of Technology, Hefei 23009, China
3
School of Earth Science, the University of Western Australia, Perth 6009, Australia
4
Department of Geoscience, University of Nevada Las Vegas, 4505 S. Maryland Pkwy, NV 89154-4010, USA
*
Authors to whom correspondence should be addressed.
Minerals 2019, 9(10), 588; https://doi.org/10.3390/min9100588
Submission received: 31 July 2019 / Revised: 24 September 2019 / Accepted: 27 September 2019 / Published: 28 September 2019
(This article belongs to the Section Mineral Deposits)

Abstract

:
The Magushan Cu–Mo deposit is a skarn deposit within the Nanling–Xuancheng mining district of the Middle-Lower Yangtze River Metallogenic Belt (MLYRMB), China. This study presents the results of a new numerical simulation that models the ore-forming processes that generated the Magushan deposit and enables the identification of unexplored areas that have significant exploration potential under areas covered by thick sedimentary sequences that cannot be easily explored using traditional methods. This study outlines the practical value of numerical simulation in determining the processes that operate during mineral deposit formation and how this knowledge can be used to enhance exploration targeting in areas of known mineralization. Our simulation also links multiple subdisciplines such as heat transfer, pressure, fluid flow, chemical reactions, and material migration. Our simulation allows the modeling of the formation and distribution of garnet, a gangue mineral commonly found within skarn deposits (including within the Magushan deposit). The modeled distribution of garnet matches the distribution of known mineralization as well as delineating areas that may well contain high garnet abundances within and around a concealed intrusion, indicating this area should be considered a prospective target during future mineral exploration. Overall, our study indicates that this type of numerical simulation-based approach to prospectivity modeling is both effective and economical and should be considered an additional tool for future mineral exploration to reduce exploration risks when targeting mineralization in areas with thick and unprospective sedimentary cover sequences.

Graphical Abstract

1. Introduction

Skarn deposits are widely distributed in both space and time, and represent important sources of copper, lead, zinc, molybdenum, and other metals [1,2,3]. Skarns are dominated by calc-silicate minerals such as garnet and pyroxene, and the presences of these minerals are also key in terms of the definition and identification of skarns [4]. The Middle–Lower Yangtze River Metallogenic Belt (MLYRMB) is located in central–eastern China and contains numerous porphyry–skarn copper–gold and magnetite–apatite iron deposits that formed in an intracontinental setting [5,6,7,8]. The Magushan Cu–Mo deposit is a skarn deposit in the southeast of the Nanling–Xuancheng area, one of the eight mining camps within the MLYRMB [8,9,10,11]. This area is covered by a thick and barren sedimentary cover sequence with little exposure of prospective lithologies, making traditional (e.g., geochemical, geological mapping, some geophysics) exploration difficult.
Rapid recent advancements in computing hardware and theoretical and applied computational science have enabled the development of prospectivity modeling [12,13,14,15,16] and the complex coupled numerical simulation of geological processes [17,18,19,20,21]. However, typical three-dimensional prospectivity modeling workflows (e.g., weights-of-evidence approaches) frequently encounter issues of conditional dependence, where datasets are biased by relationships where given exploration criteria can generate responses in different datasets, particular mineralizing processes can generate more than one exploration criteria, or responses present within one dataset can be conditioned by responses in another dataset [12]. This can be overcome by using the simulation approaches utilized during this study, providing another method of identifying areas that are prospective for deep exploration in regions with barren cover sequences, providing a supplement to more traditional exploration approaches and potentially removing risks related to the verification of conditional independence. This study combines this approach with Comsol Multiphysics, a software package that allows researchers to customize distributed ordinary differential equations and formulas to calculate variables that allow the simulation of complex and coupled processes that occur within hydrothermal systems. This means that although this software is not specifically designed for geological research, it allows the coupling of multiple physical and chemical fields, allowing the easier formulation of coupled simulation models. This approach allows the numerical simulation of the hydrothermal and mineralizing processes that generated the Magushan Cu–Mo deposit (as well as other types of mineralization) in addition to highlighting unexplored areas where these processes are likely to have occurred, yielding targets for future exploration and additional data generation.
The Magushan skarn Cu–Mo deposit was discovered in the 1960s and mining of the deposit began in the 1990s before the mine shut shortly after as a result of a lack of exploration in this region and the somewhat poor understanding of the system. A review of resources and reserves in 2003 indicated that this deposit still contained a significant amount of copper and molybdenum, leading to the recommencement of mining in 2010 [22]. The deposit has current resources and reserves containing an estimated 78,000 t of contained Cu, 11,000 t of contained Mo, and 1800 t of contained Au, and the acquisition of new geophysical data in 2016 also suggested the presence of potentially mineralized intrusions beneath the thick sedimentary cover sequences that surround the Magushan ore deposit [23]. Here, we use these and other data for the Magushan deposit and the surrounding region to present a new conceptual model for the mineralization in this area. We also address the following questions using new numerical simulations combined with the results of previous geological and geophysical research, namely: (1) Can numerical simulations enable the identification or verification of existing geological data?; (2) Can numerical simulations be used to identify prospective areas for exploration targeting in areas with thick and unprospective sedimentary cover sequences, such as those around the known Magushan deposit, and provide a guide for future mineral exploration? Both of these points are assessed during this study, demonstrating that numerical simulation can be used in both fundamental geological and economic geology research as well as in exploration targeting in regions with thick and unprospective cover sequences.

2. Regional and Deposit Geology

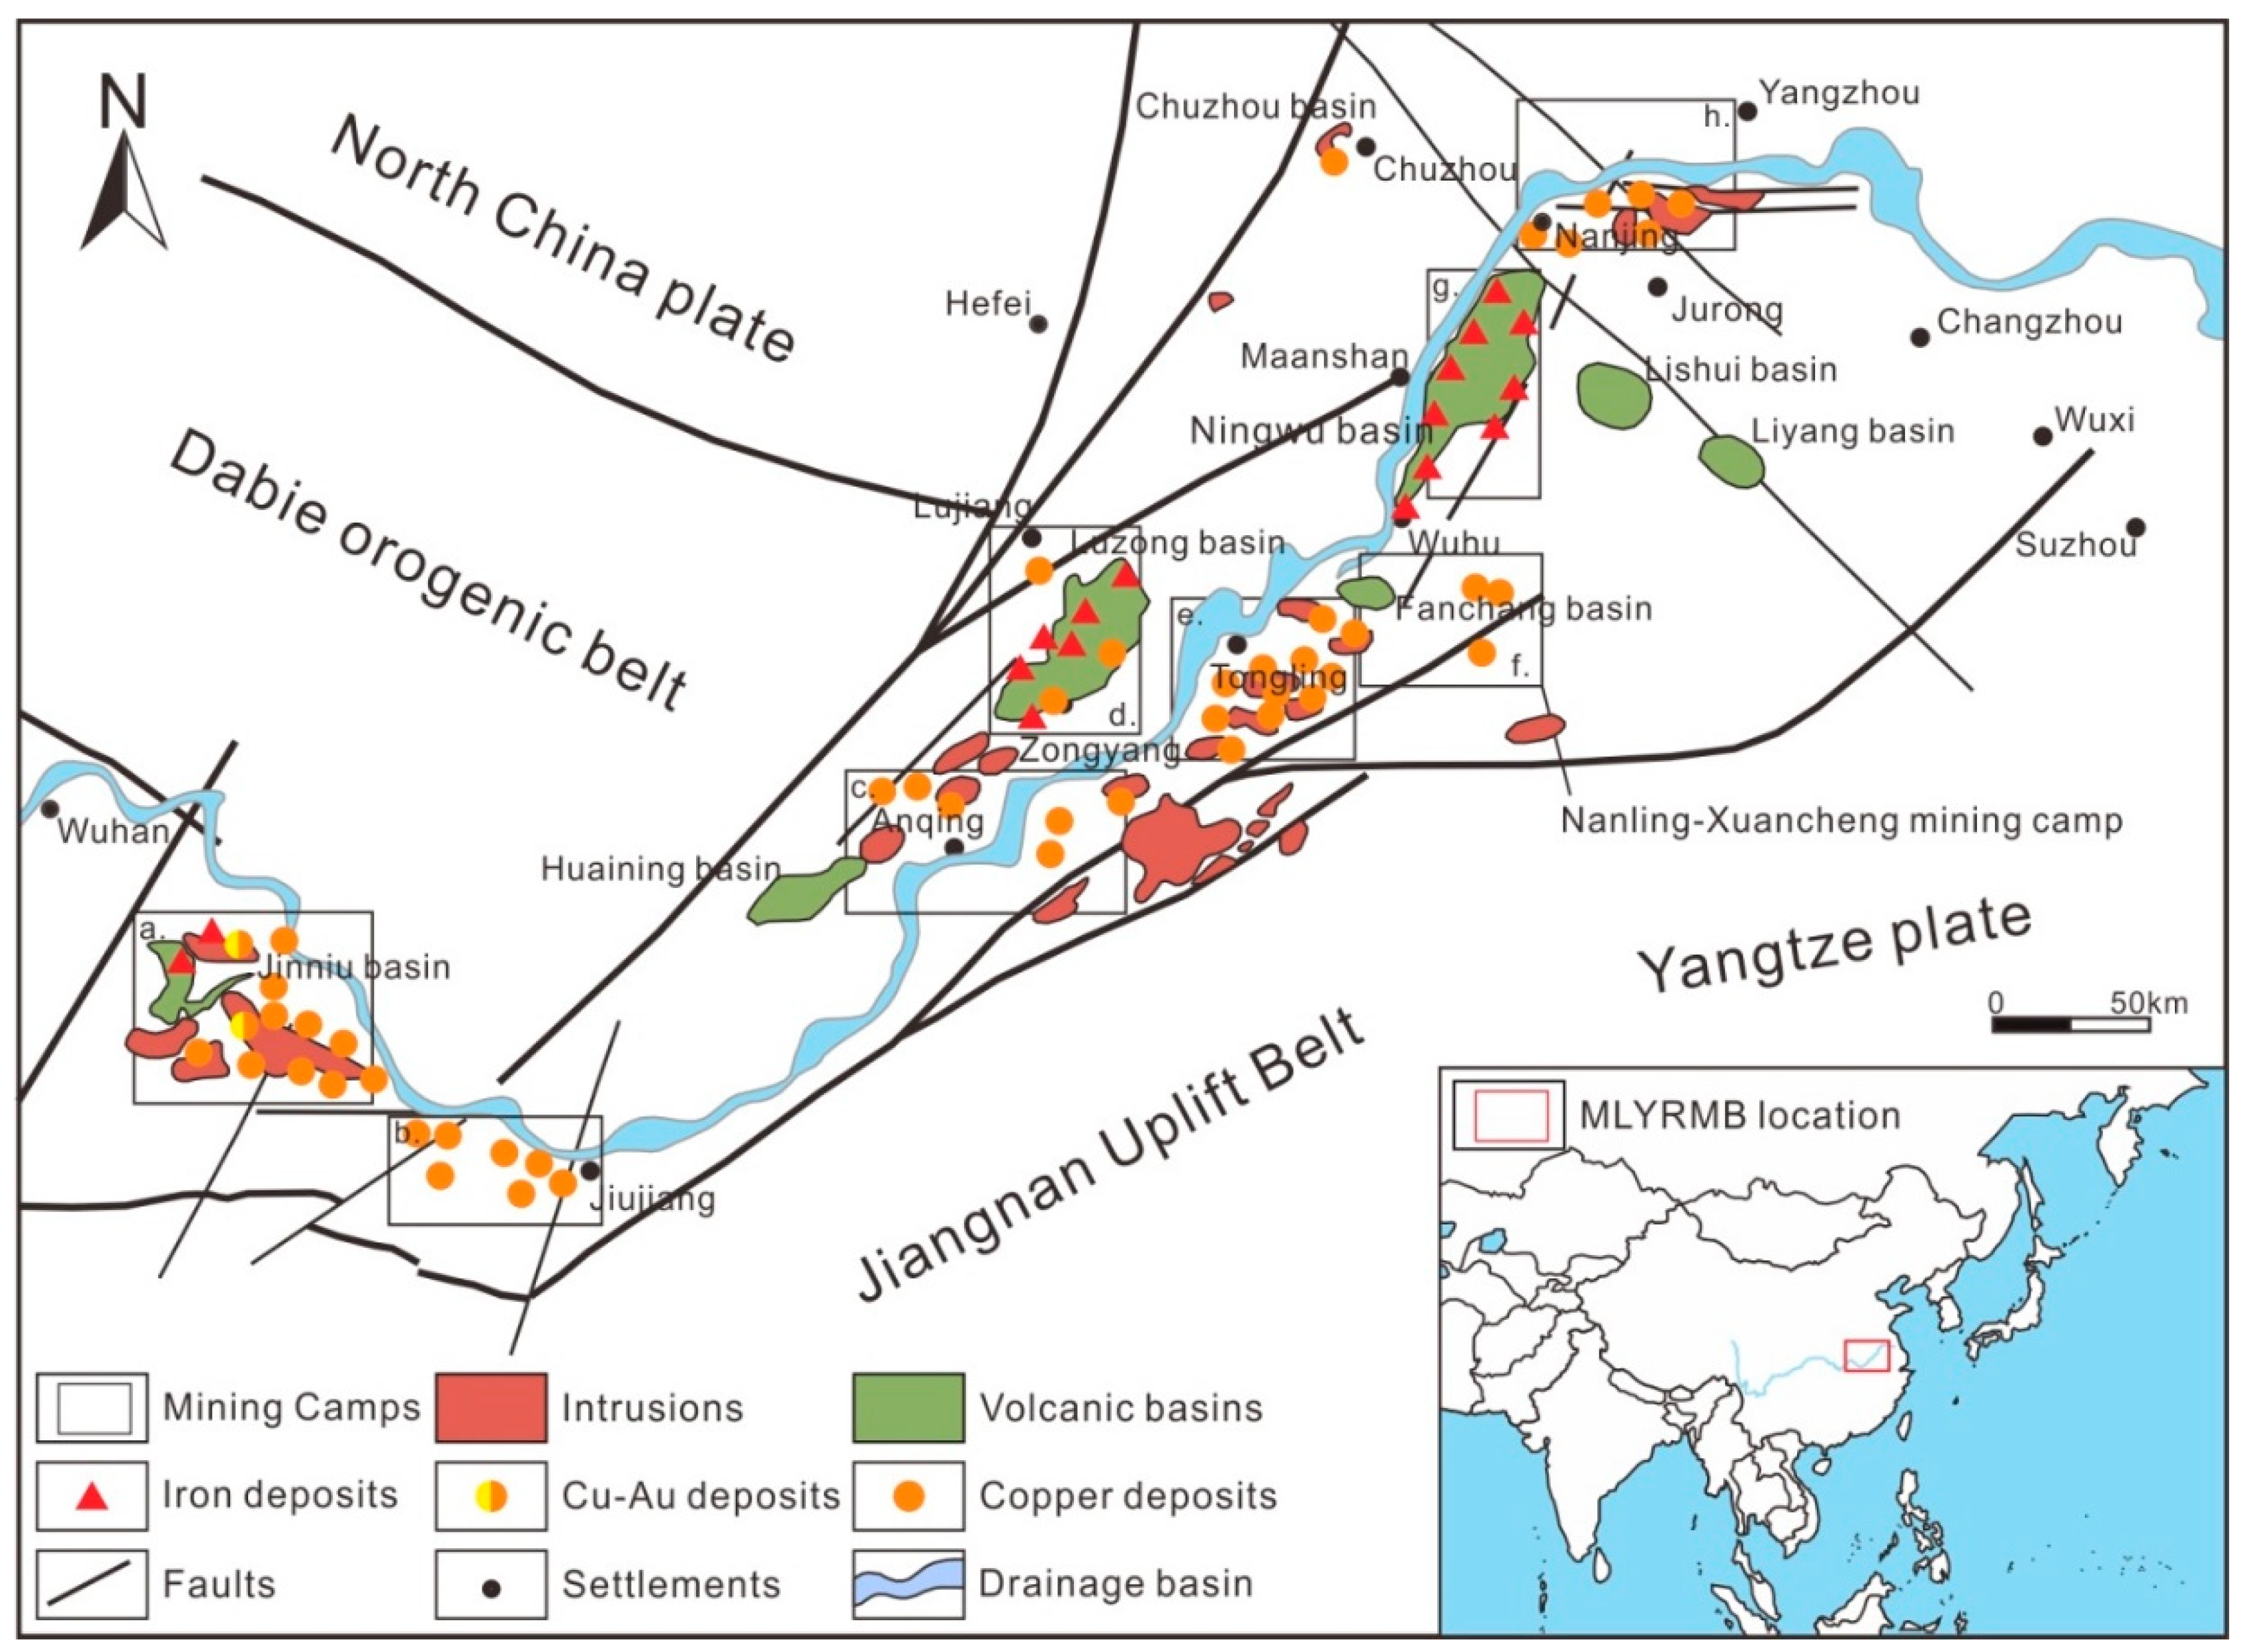
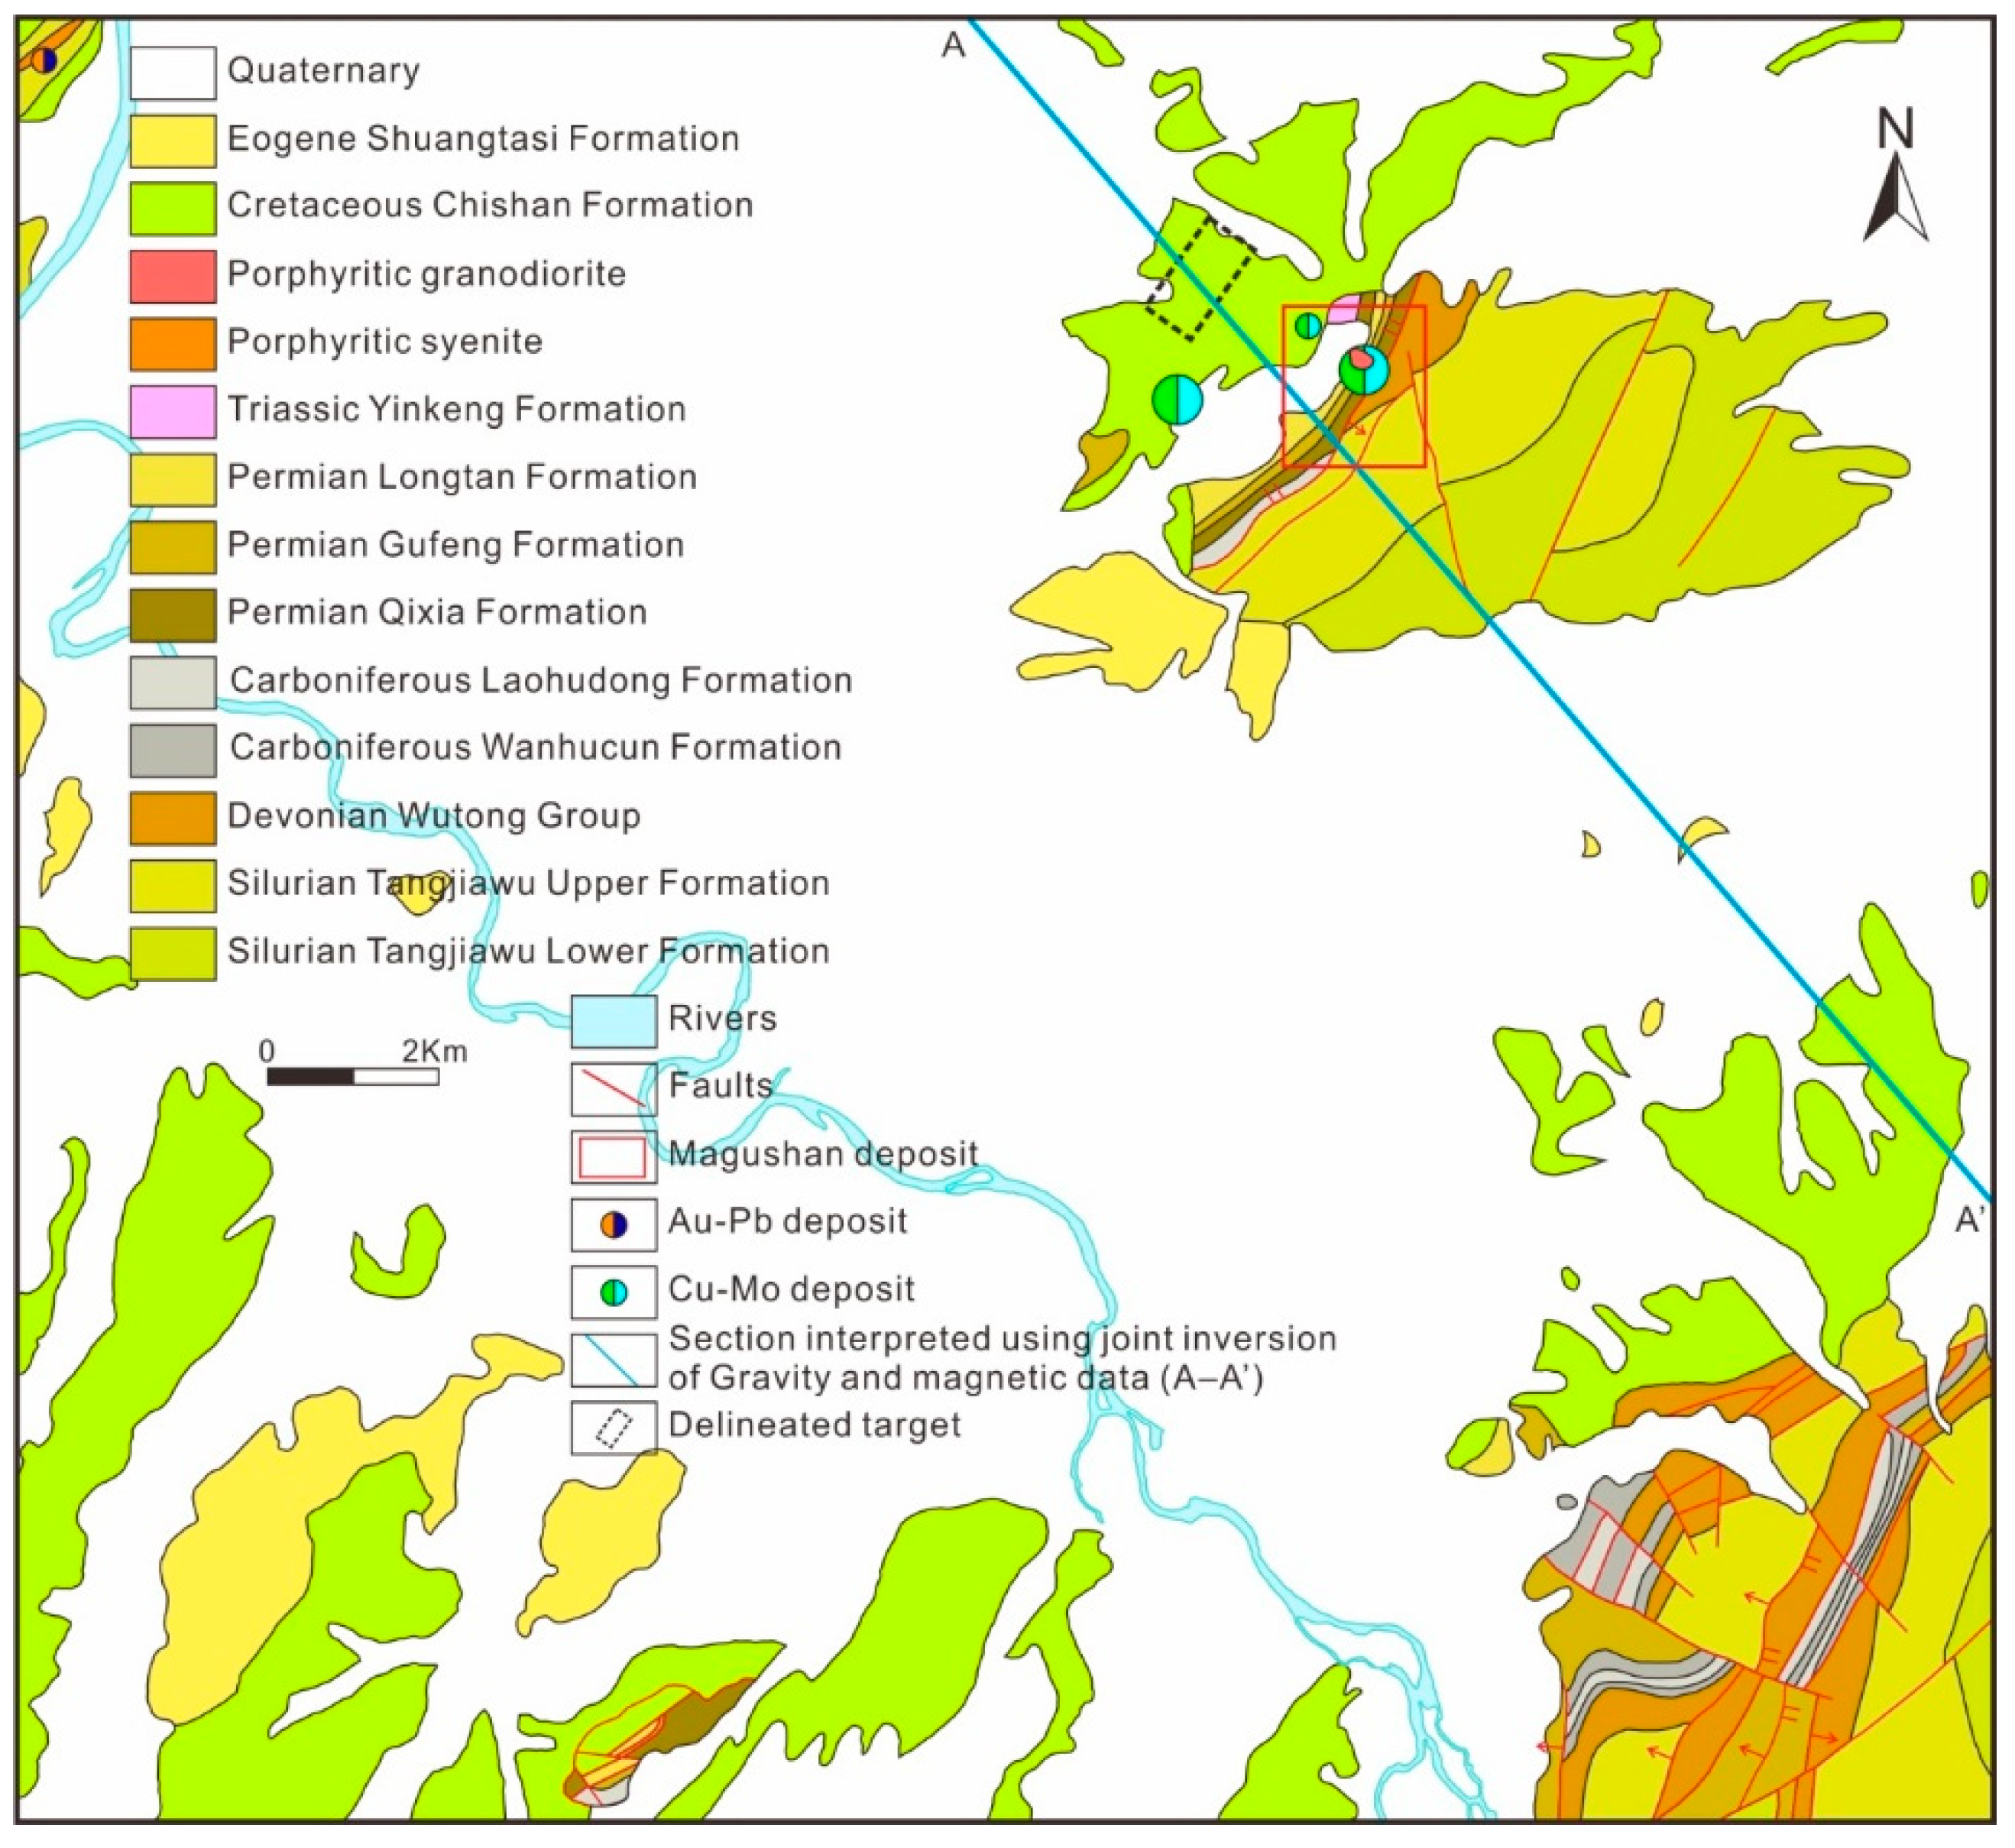
2.1. Regional Geology

The MLYRMB (Figure 1) hosts world-class Cu–Fe polymetallic mineralization and is one of the most important areas of mineralization in China [5,6,11,24,25,26]. The area is cross-cut by a series of major faults and hosts eight large mining camps, namely (from west to east) the southeast Hubei, Jiurui, Anqing–Guichi, Luzong, Tongling, Nanling–Xuancheng, Ningwu, and Ningzhen mining districts (Figure 1), [5,11,25,27,28,29]. The mineral deposits in this region host 13 Mt of contained Cu and 800 t of contained Ag, the majority of which are present in porphyry, skarn, and epithermal deposits. All of these deposits are genetically associated with Mesozoic magmatism spread over three separate stages at 149–135, 133–125, and 123–105 Ma [7] and the evolution of this area during the associated Yanshanian tectonic event [30].
The Nanling–Xuancheng basin is located within the eastern MLYRMB (Figure 1) and is divided into upper and deeper sections by an unconformity, changes in deformation and magmatic histories, and the sedimentary stratigraphy of the basin. The deeper part of the basin contains conformable or disconformable Silurian (O) to lower and middle Triassic (T1–2) sedimentary units. The Indosinian orogeny associated with the collision between India and Eurasia generated intense NE–SW oriented folding in these units, which are also cross-cut by NW–SE and NE–SW oriented faults. The upper part of the basin contains Jurassic (J) to Quaternary (Q4) units, including the Jurassic volcanic Zhongfencun Formation (J3z). The majority of these formations have unconformable contacts, are variably folded, contain interbedded volcanic units and have been intruded by magmatic units. The majority of the mining camp area is covered by thick Quaternary sediments although this has not prevented the discovery of a number of polymetallic Cu, Au, and Mo deposits. These include the Chating porphyry Cu–Au and the Shizishan Cu, Qiaomaishan Cu–S, and Magushan Cu–Mo skarn deposits, with the majority of the deposits in this area located within the Chating and Magushan orefields [31].

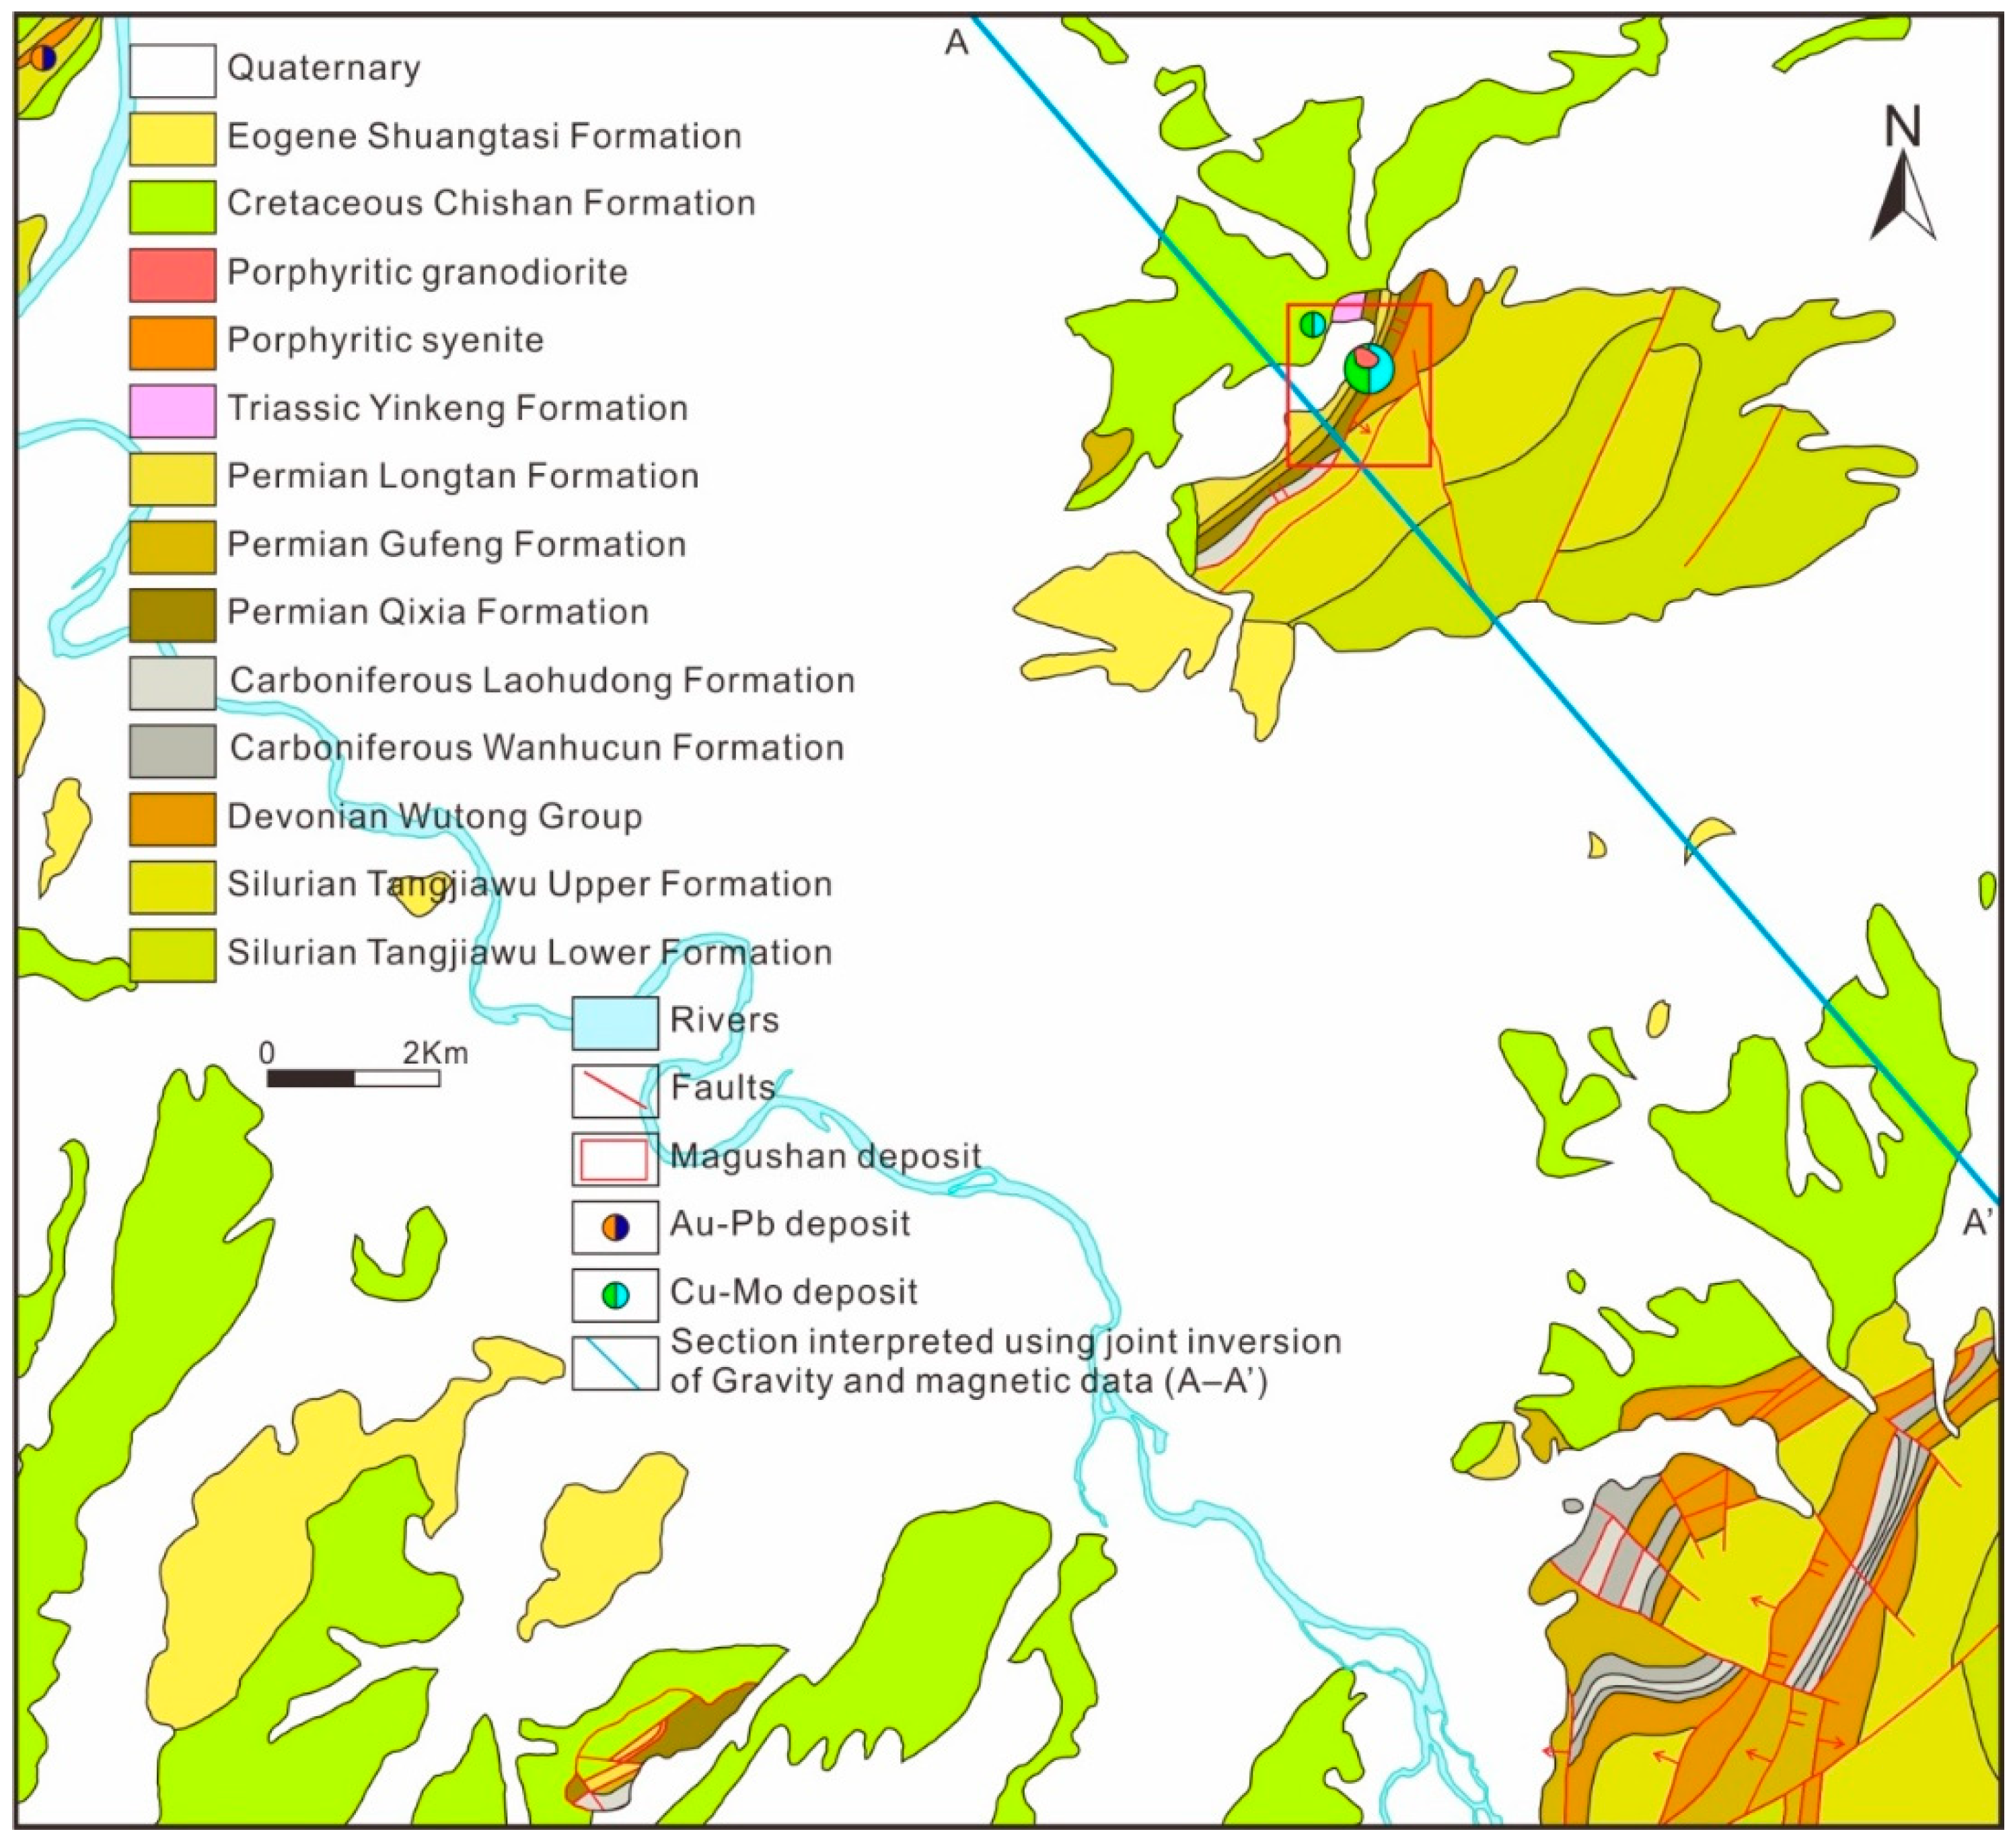
2.2. Orefield Geology

The Magushan orefield is located in the southeast part of the Nanling–Xuancheng basin (Figure 2) and contains NW–SE and NE–SW oriented groups of faults that form a tectonic framework when combined with the intense folding that is present across the northeast and southeast parts of the basin. The area is dominated by Triassic and Cretaceous units that are associated with the mineralization in this area (Figure 3 and Figure 4) and form the host rocks for the skarn-related intrusions that in turn host the orebodies that define the Magushan Cu–Mo deposit (Figure 5).

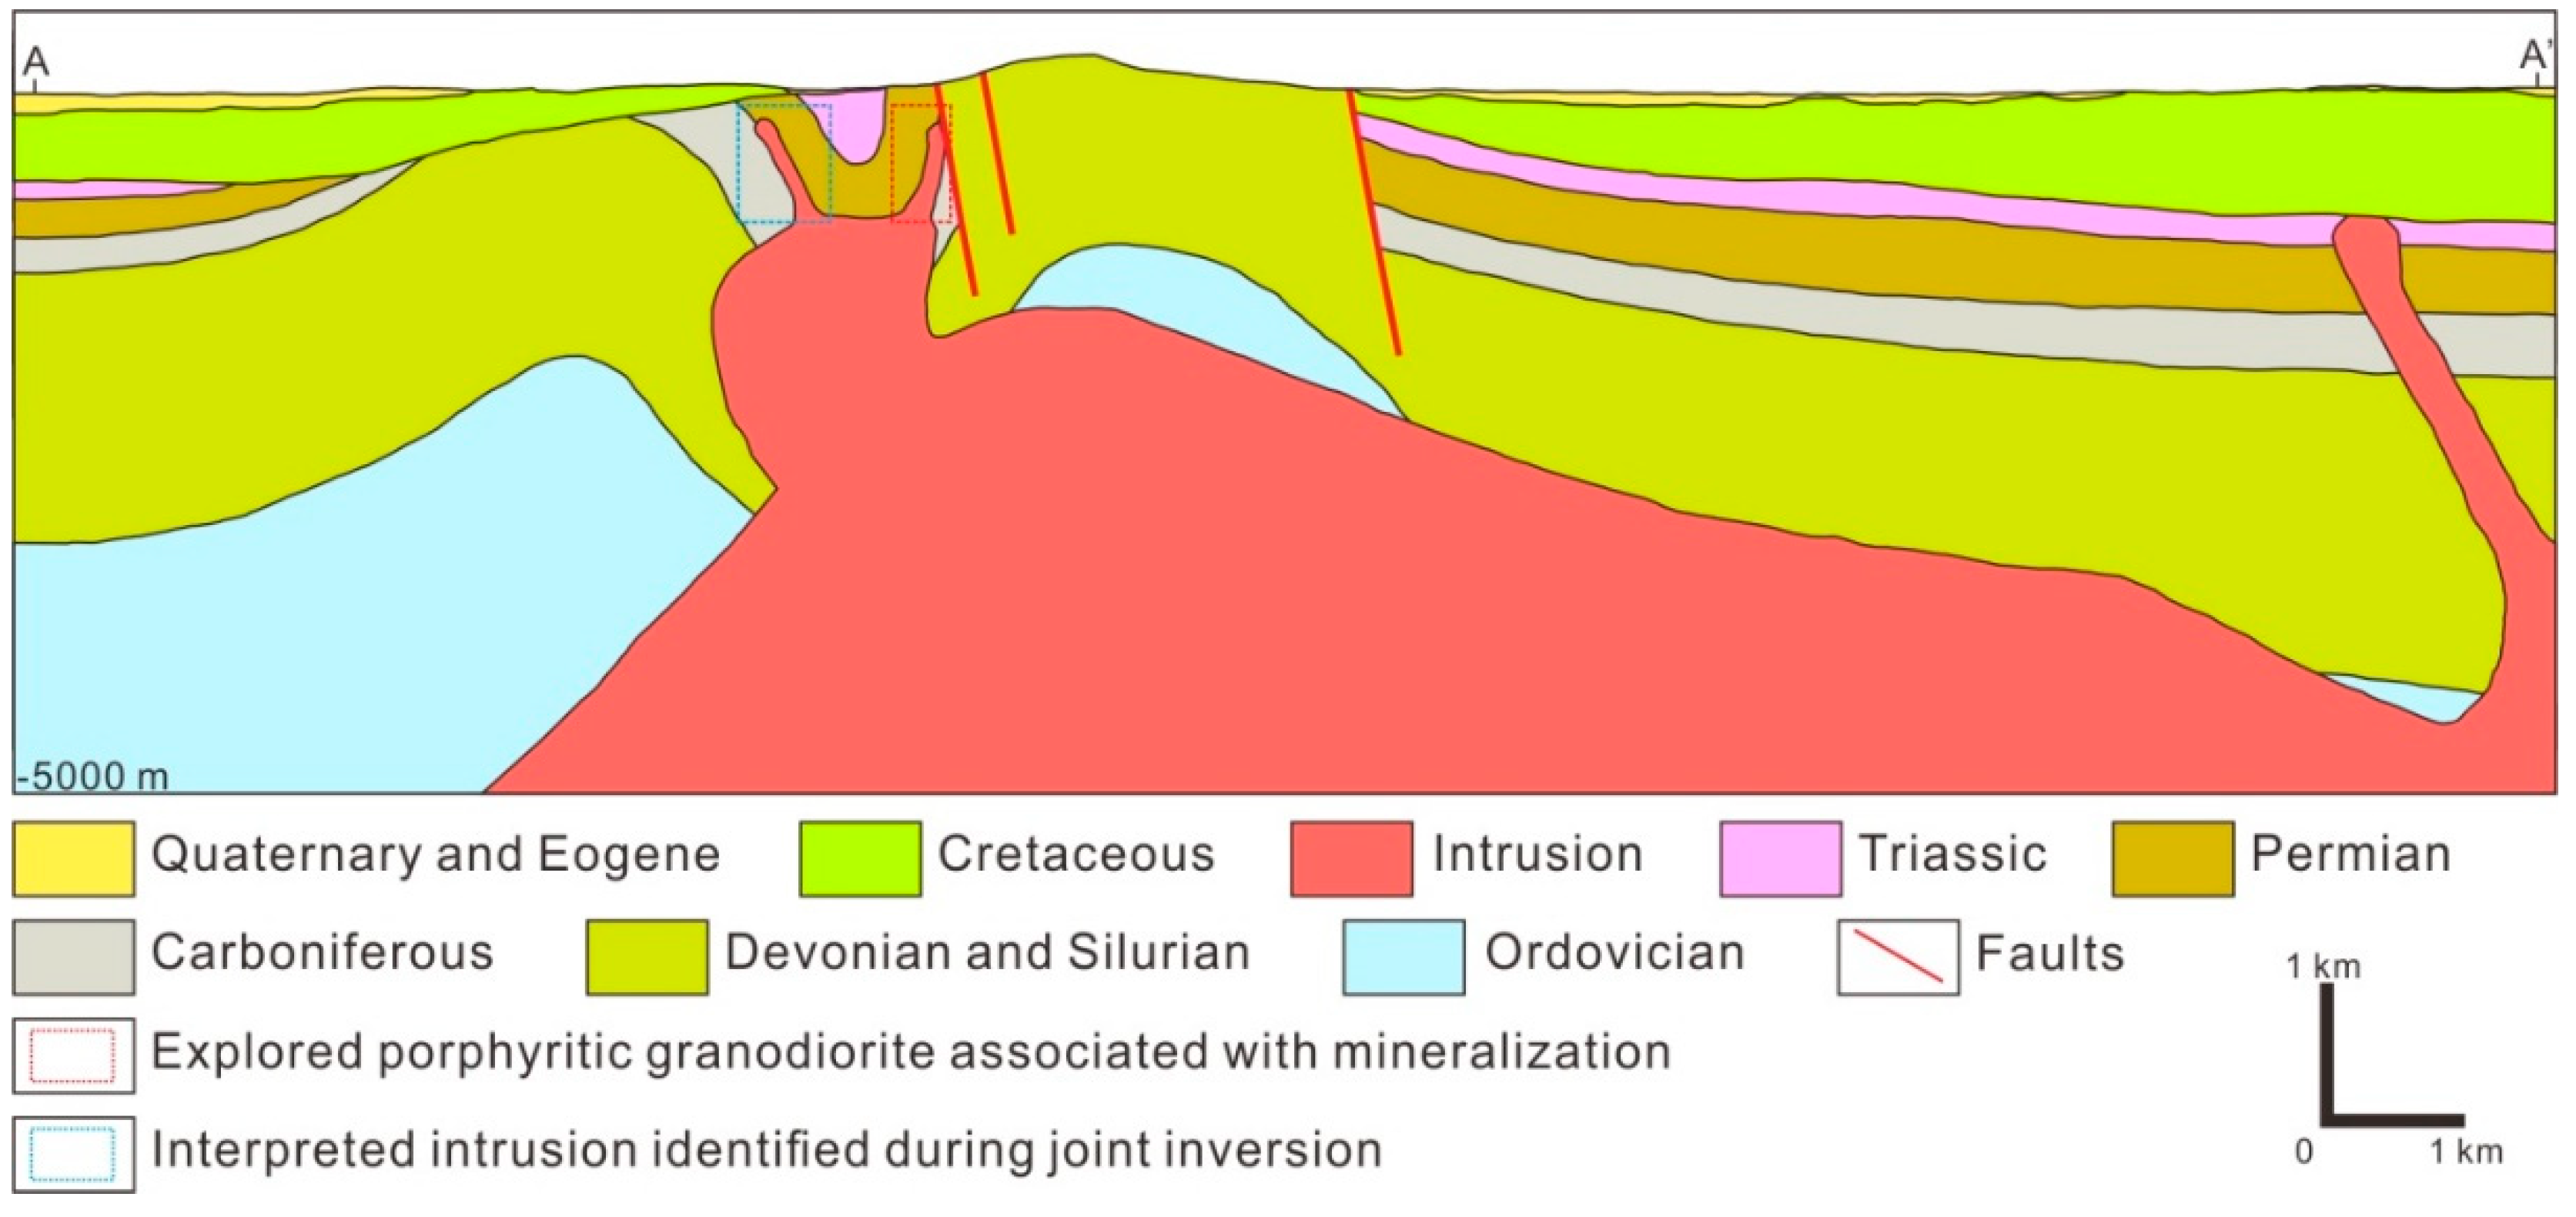
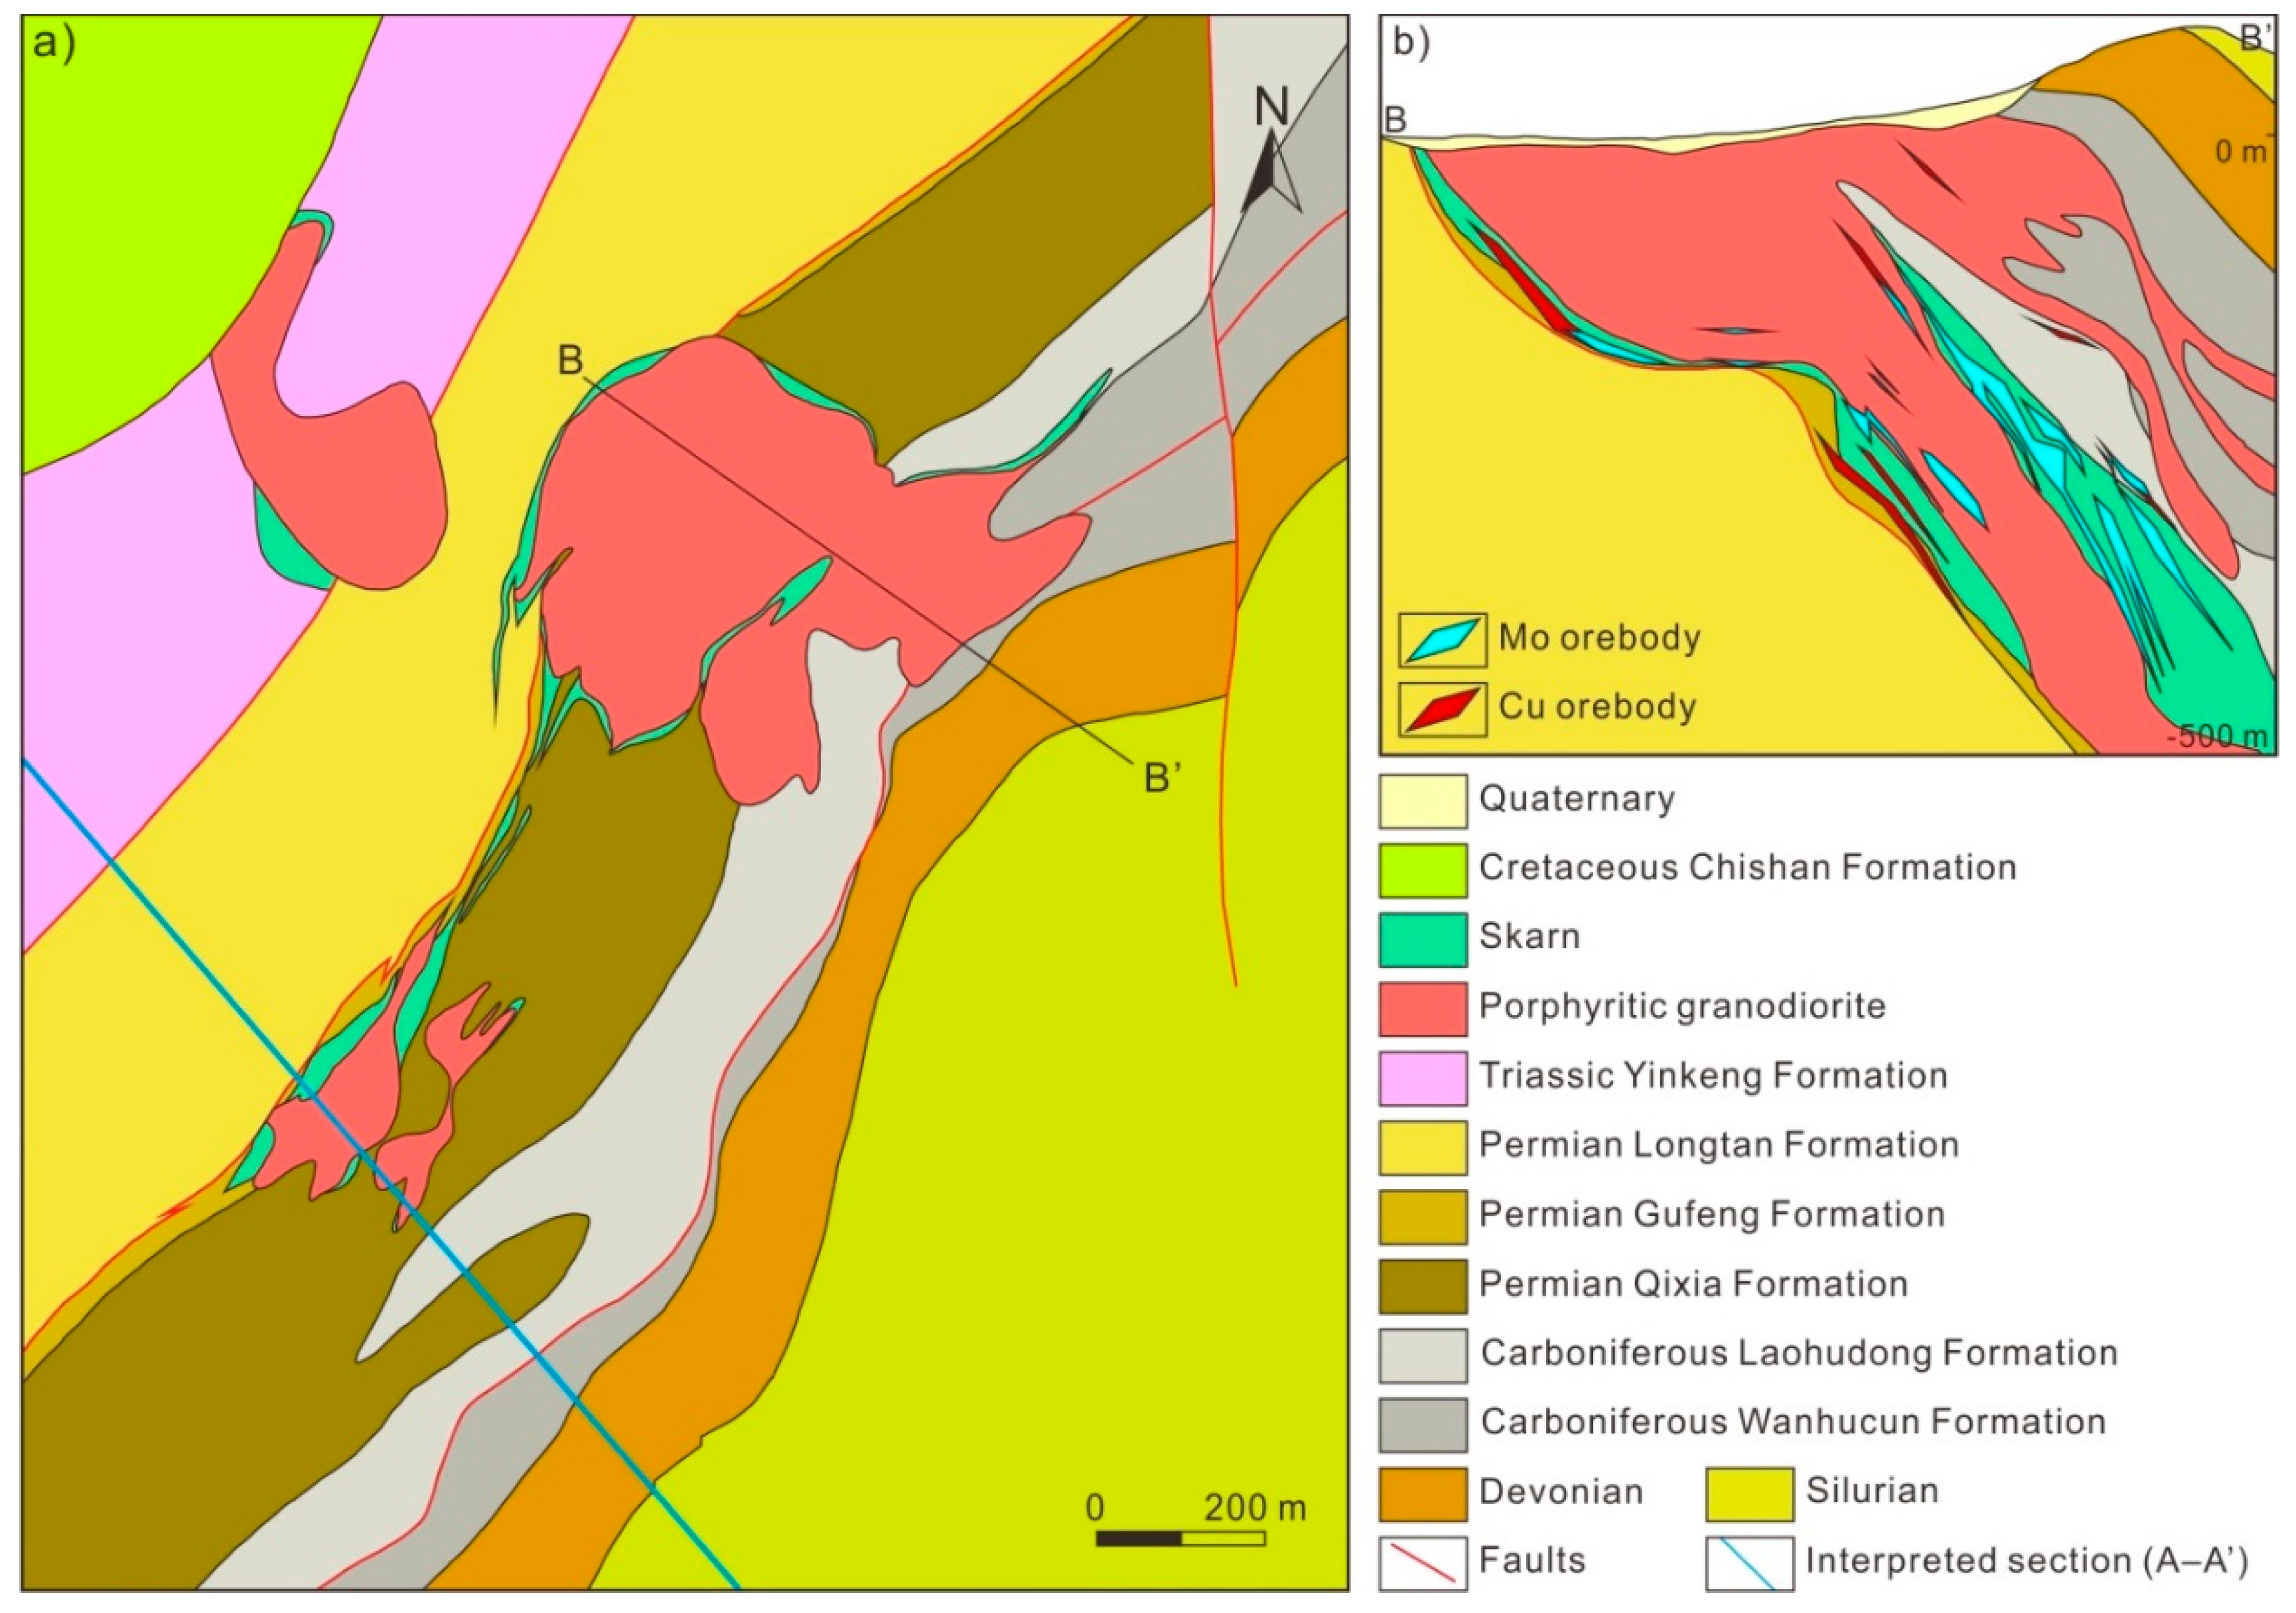
2.3. Deposit Geology

The Magushan Cu–Mo deposit is a skarn copper–molybdenum deposit located in the northeast part of the Magushan orefield (Figure 3 and Figure 5a) and hosts resources and reserves containing an estimated 78,000 t of contained Cu, 11,000 t of contained Mo, and 1800 t of contained Au [22]. This area contains Cretaceous to Quaternary sediments, with the latter cropping out over more than 75% of the region (Figure 3). Drillholes in this area indicate that the Quaternary sediments in this region cover Triassic, Jurassic, Carboniferous, and Silurian units that are hosted by two NE–SW synclines located within the northeastern and southwestern parts of this region (Table 1; Figure 4). The intrusions in this area appear to be spatially controlled by the presence of the Permian units within the southeast limb of the synclines as these units are structurally weak, meaning that the magmas that formed these intrusions exploited these weak points during their emplacement (Figure 5b). The majority of the Cu and Mo mineralization within the Magushan deposit is hosted at the contact between a porphyritic granodiorite intrusion with mixed mantle-crustal origins and the surrounding sedimentary units, especially the Permian and Carboniferous limestones in this area that reacted with exsolved magmatic fluids to form the skarn mineralization within the deposit [23]. The area also contains significant contact metamorphism associated with the intrusions present in this region. The Magushan deposit consists of one main orebody, one subsidiary orebody, and a number of smaller orebodies. Mineralization in this area is associated with a skarn containing concentric zones of diopside and garnet bearing assemblages. The majority of the orefield is covered by thick and unprospective Cretaceous, Eocene, and Quaternary sediments (Table 1) meaning that traditional geochemical and geological exploration techniques have limited use beyond e.g., drilling. This led to geophysical exploration using gravity and magnetic potential fields approaches [23] and the generation of a constrained joint inversion for this area that yielded a number of interpreted geological cross-sections (e.g., A–A’ in Figure 3). This section passes through the southwest part of the Magushan deposit zone as well as the NE–SW trending syncline, the southeastern limb of which hosts the Magushan skarn. This interpreted section also indicates that another intrusive apophyse is likely to be present within the northwest limb, with this intrusion also potentially being mineralized (Figure 4).

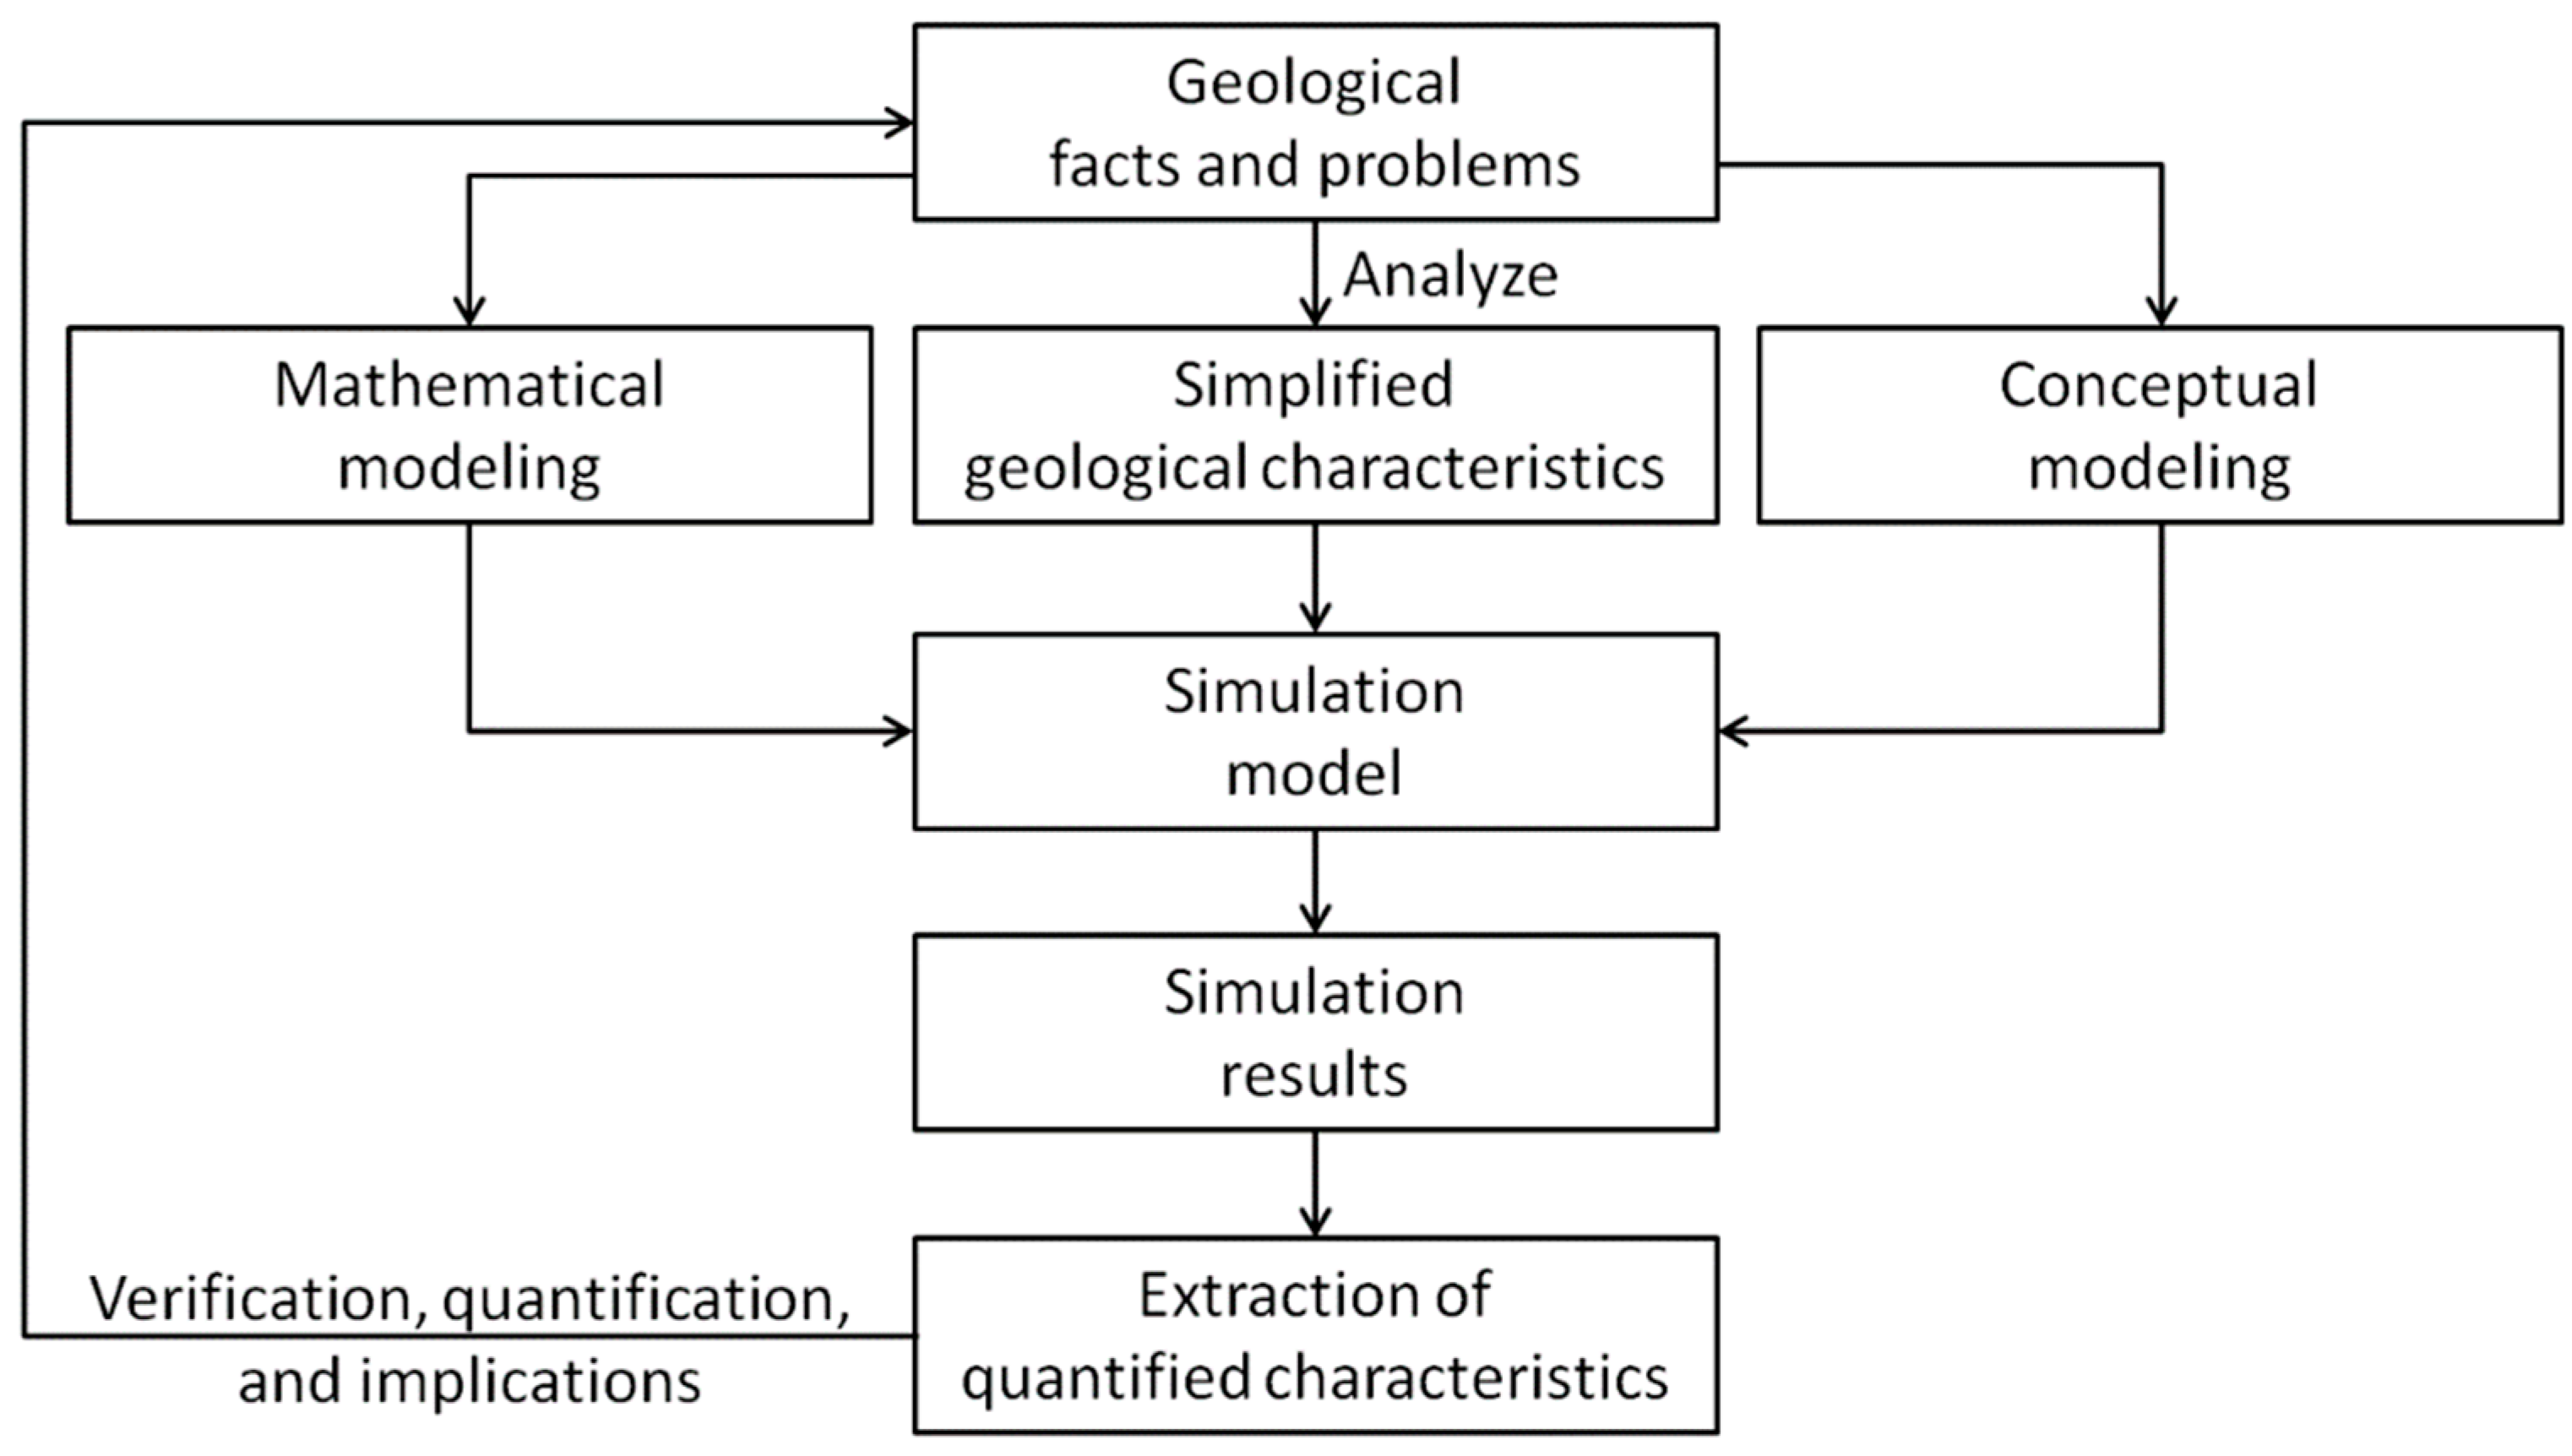
3. Modeling of the Magushan Skarn Deposit

There are three steps in the computation of geoscience workflows, namely geological conceptual, simulation, and mathematical modeling [32,33,34]. Here we construct conceptual geological, mathematical, and simulation models for the Magushan Cu–Mo deposit to both advance our knowledge of the processes that control the formation of skarn deposits as well to determine whether numerical simulations can be used to identify prospective areas in regions with thick and barren cover sequences (such as those around the known Magushan deposit) and as a guide for future exploration targeting. The workflow used in this paper to reflect the processes involved in ore formation is shown in Figure 6.

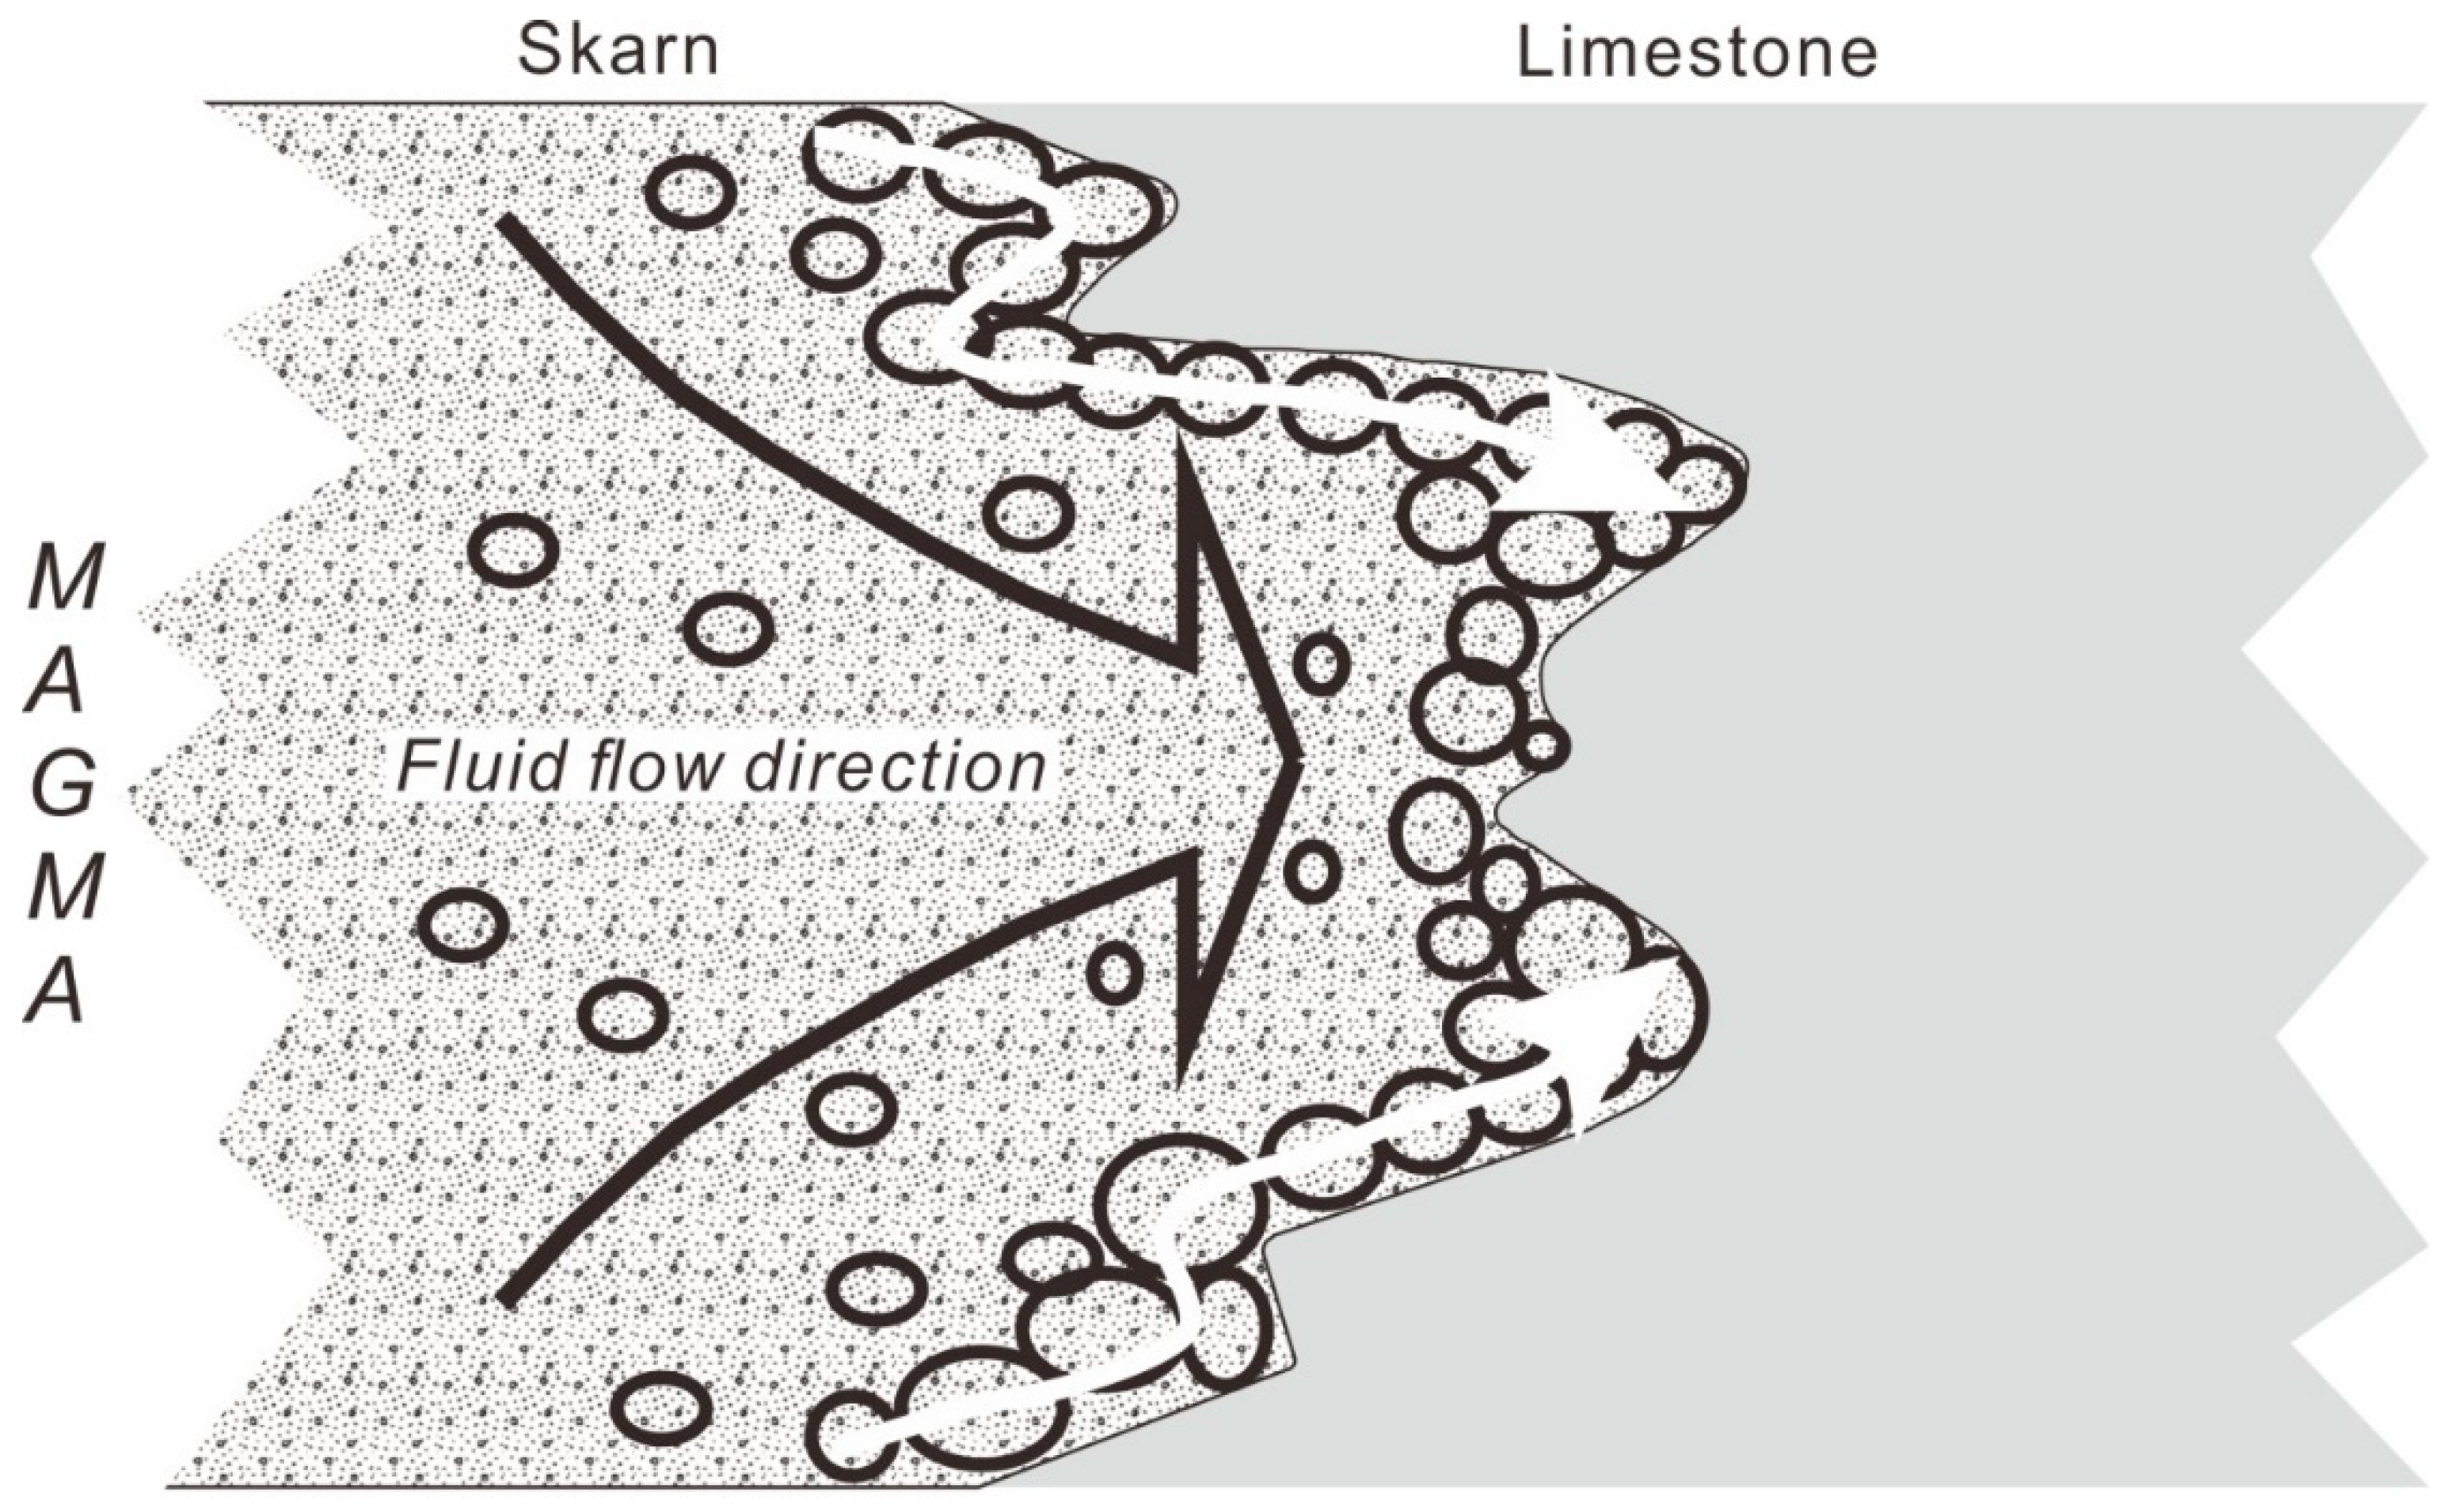
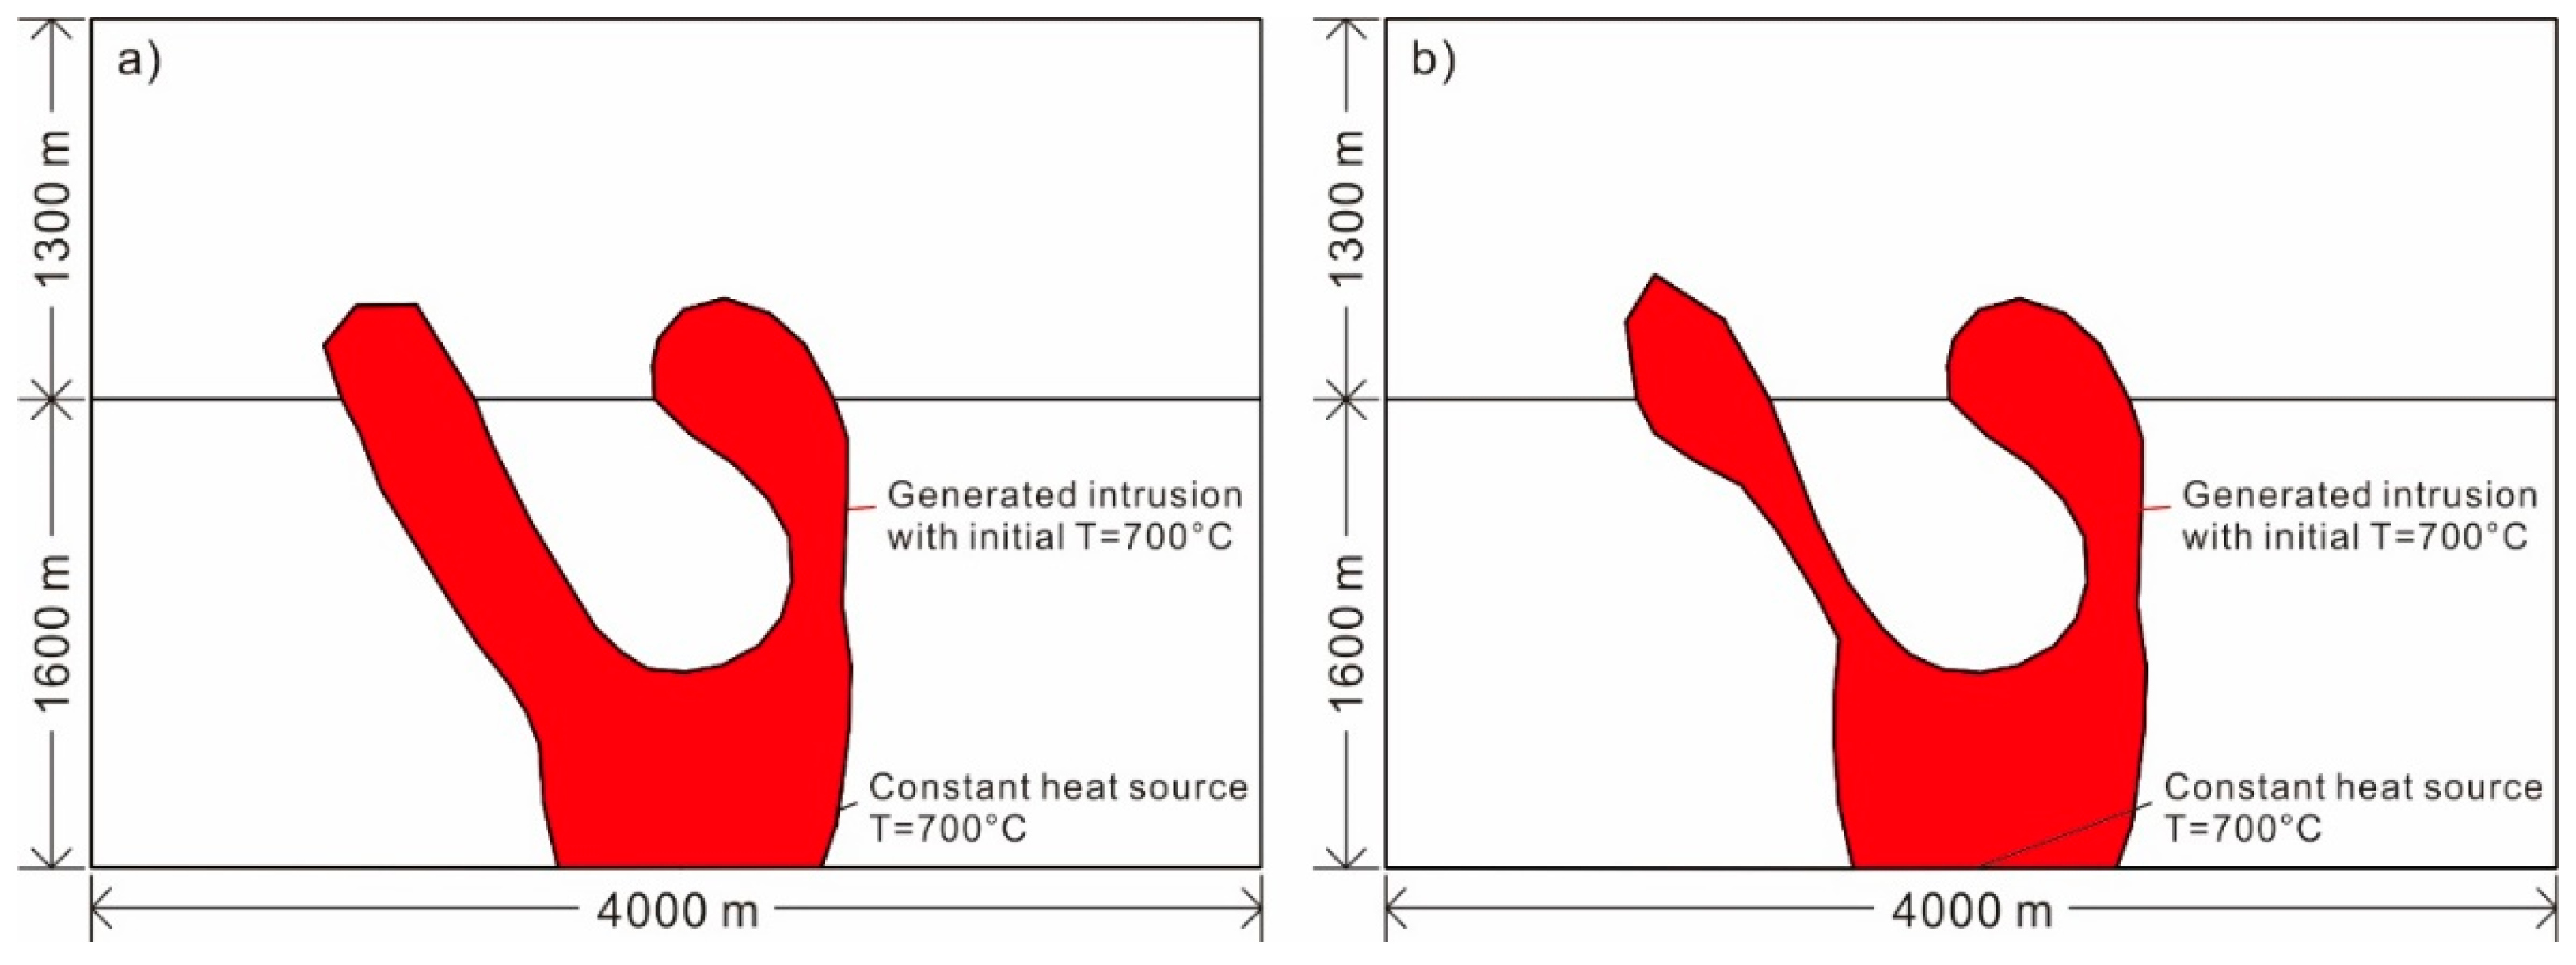
3.1. Conceptual Model and Conditions

Previous research on skarn deposits [4] and the energy release that occurs in the subvolcanic environment [35] provide the basis for our conceptual geological model, with a geological model for the formation of the Magushan skarn deposit and the associated generation of lobate skarn boundaries shown in Figure 7.
The conceptual model developed during this study for the Magushan deposit is based on previous research on skarn mineralizing environments [4] combined with the geological characteristics of the deposit (Figure 4 and Figure 5b). The entirety of the syncline is not shown in Figure 5b but the data in this figure was combined with the interpreted section shown in Figure 4, with the results shown in Figure 8. No research has been undertaken on the diagenetic processes that have affected these sediments, meaning there is a lack of constraints that would enable the entirely accurate restoration of denuded layers in our model; as an alternative, we have estimated values based on the stratigraphic column shown in Table 1. The emplacement of the Early Cretaceous intrusions in this area indicates that this syncline formed prior to this magmatic event. This in turn indicates that the Cretaceous Zhongfencun and Gecun formations have been denuded in this area and the pre-denudation restoration should include additional layers thicker than 1020 m (the minimum thickness of the Zhongfencun and Gecun formations). The mean thickness of the Cretaceous sediments in this area is 1300 m, indicating that a 1.3 km layer should be added onto the syncline model based on the interpreted geophysical data to account for denudation (Figure 8). Previous research indicated that early skarn-related metamorphism within the Nanling–Xuancheng mining district occurred at temperatures of 270–410 °C [36] and we used a temperature of 700 °C for the intrusion in our model with a constant source at 700 °C, reflecting the later stages of granodiorite magma crystallization and solidification. Other parts of the model have a temperature gradient of 25 °C/km that increases from a surface temperature of 20 °C. Our model also incorporates a pressure gradient of 26.5 MPa/km that reflects the average density of the rocks in this area and a surface pressure that is equal to atmospheric pressure. The model has open boundaries and boundary conditions that are the same as the geothermal and lithostatic gradients outlined above. Our model had a run time of 50,000 years with individual time steps of 25 years and yielded transient results. Our simulation model represents the timing of events after magma upwelling and intrusion but before skarn generation, reflecting the relative timing of mineralization within this area enabling the identification of areas that might contain hitherto unknown areas of mineralization that represent targets for future exploration.

3.2. Simulation Modeling

Our simulation model is based on geophysical interpretations and cross-sections for the study area (Figure 4 and Figure 5b). The intrusion associated with the Magushan deposit is located along the contact between Permian and Carboniferous sedimentary units with these contacts between the intrusion and the surrounding sediments also concentrating the formation of skarn mineralization in this area (Figure 8). This model involves fluid flow, heat transfer, chemical reaction, and material migration and the conditions and boundaries conditions are as stated above with the exception of the setting of the reactant concentrations within the hydrothermal fluids involved in this model. The characteristics of the different lithological units used in this model are outlined in Table 2.
Skarn-type ore-forming processes usually follow intrusive events, with this skarn-type metamorphism causing calcite within the limestone to metamorphose to garnet, increasing the density and decreasing the volume of the resulting skarn. These processes increase porosity and permeability, enabling the penetration of ore-forming fluids usually during retrograde skarn formation rather than prograde contact metamorphism [37]. Garnet is the main ore-bearing gangue mineral in the Magushan deposit and as such is the main focus of the chemical reaction component of our model. The main chemical reactions during the ore-forming processes that generated the Magushan deposit occurred at temperatures of 270 °C–410 °C [36] and can be simplified as shown in Equation [4]:
3 X + 2 Y + 3 ( SiO 4 ) X 3 Y 2 ( SiO 4 ) 3
where X is calcium within calcite in the limestone and Y and SiO4 are material derived from the magma. We used Y and SiO4 concentrations of 3 × 10⁻³ mol/m3 and a concentration of 3 × 10⁻² mol/m3 for X; no fluid inclusions microthermometry or analysis has been undertaken in the area so these represent estimates of the concentrations of these reactants within the ore-forming fluids. In addition, the equilibrium coefficient of this reaction is unknown, meaning that rather than actual concentration values our model provide relative results, meaning that these customized values are suitable for the identification of areas where this reaction (and therefore potentially mineralization) has been concentrated (in relative terms). The computed concentrations and the spatial distribution of garnet generation that resulted from this modeling indicates that the northwest limb of the syncline is most likely a prospective part of the Magushan area and should be the focus of future exploration (Figure 4 and Figure 5).

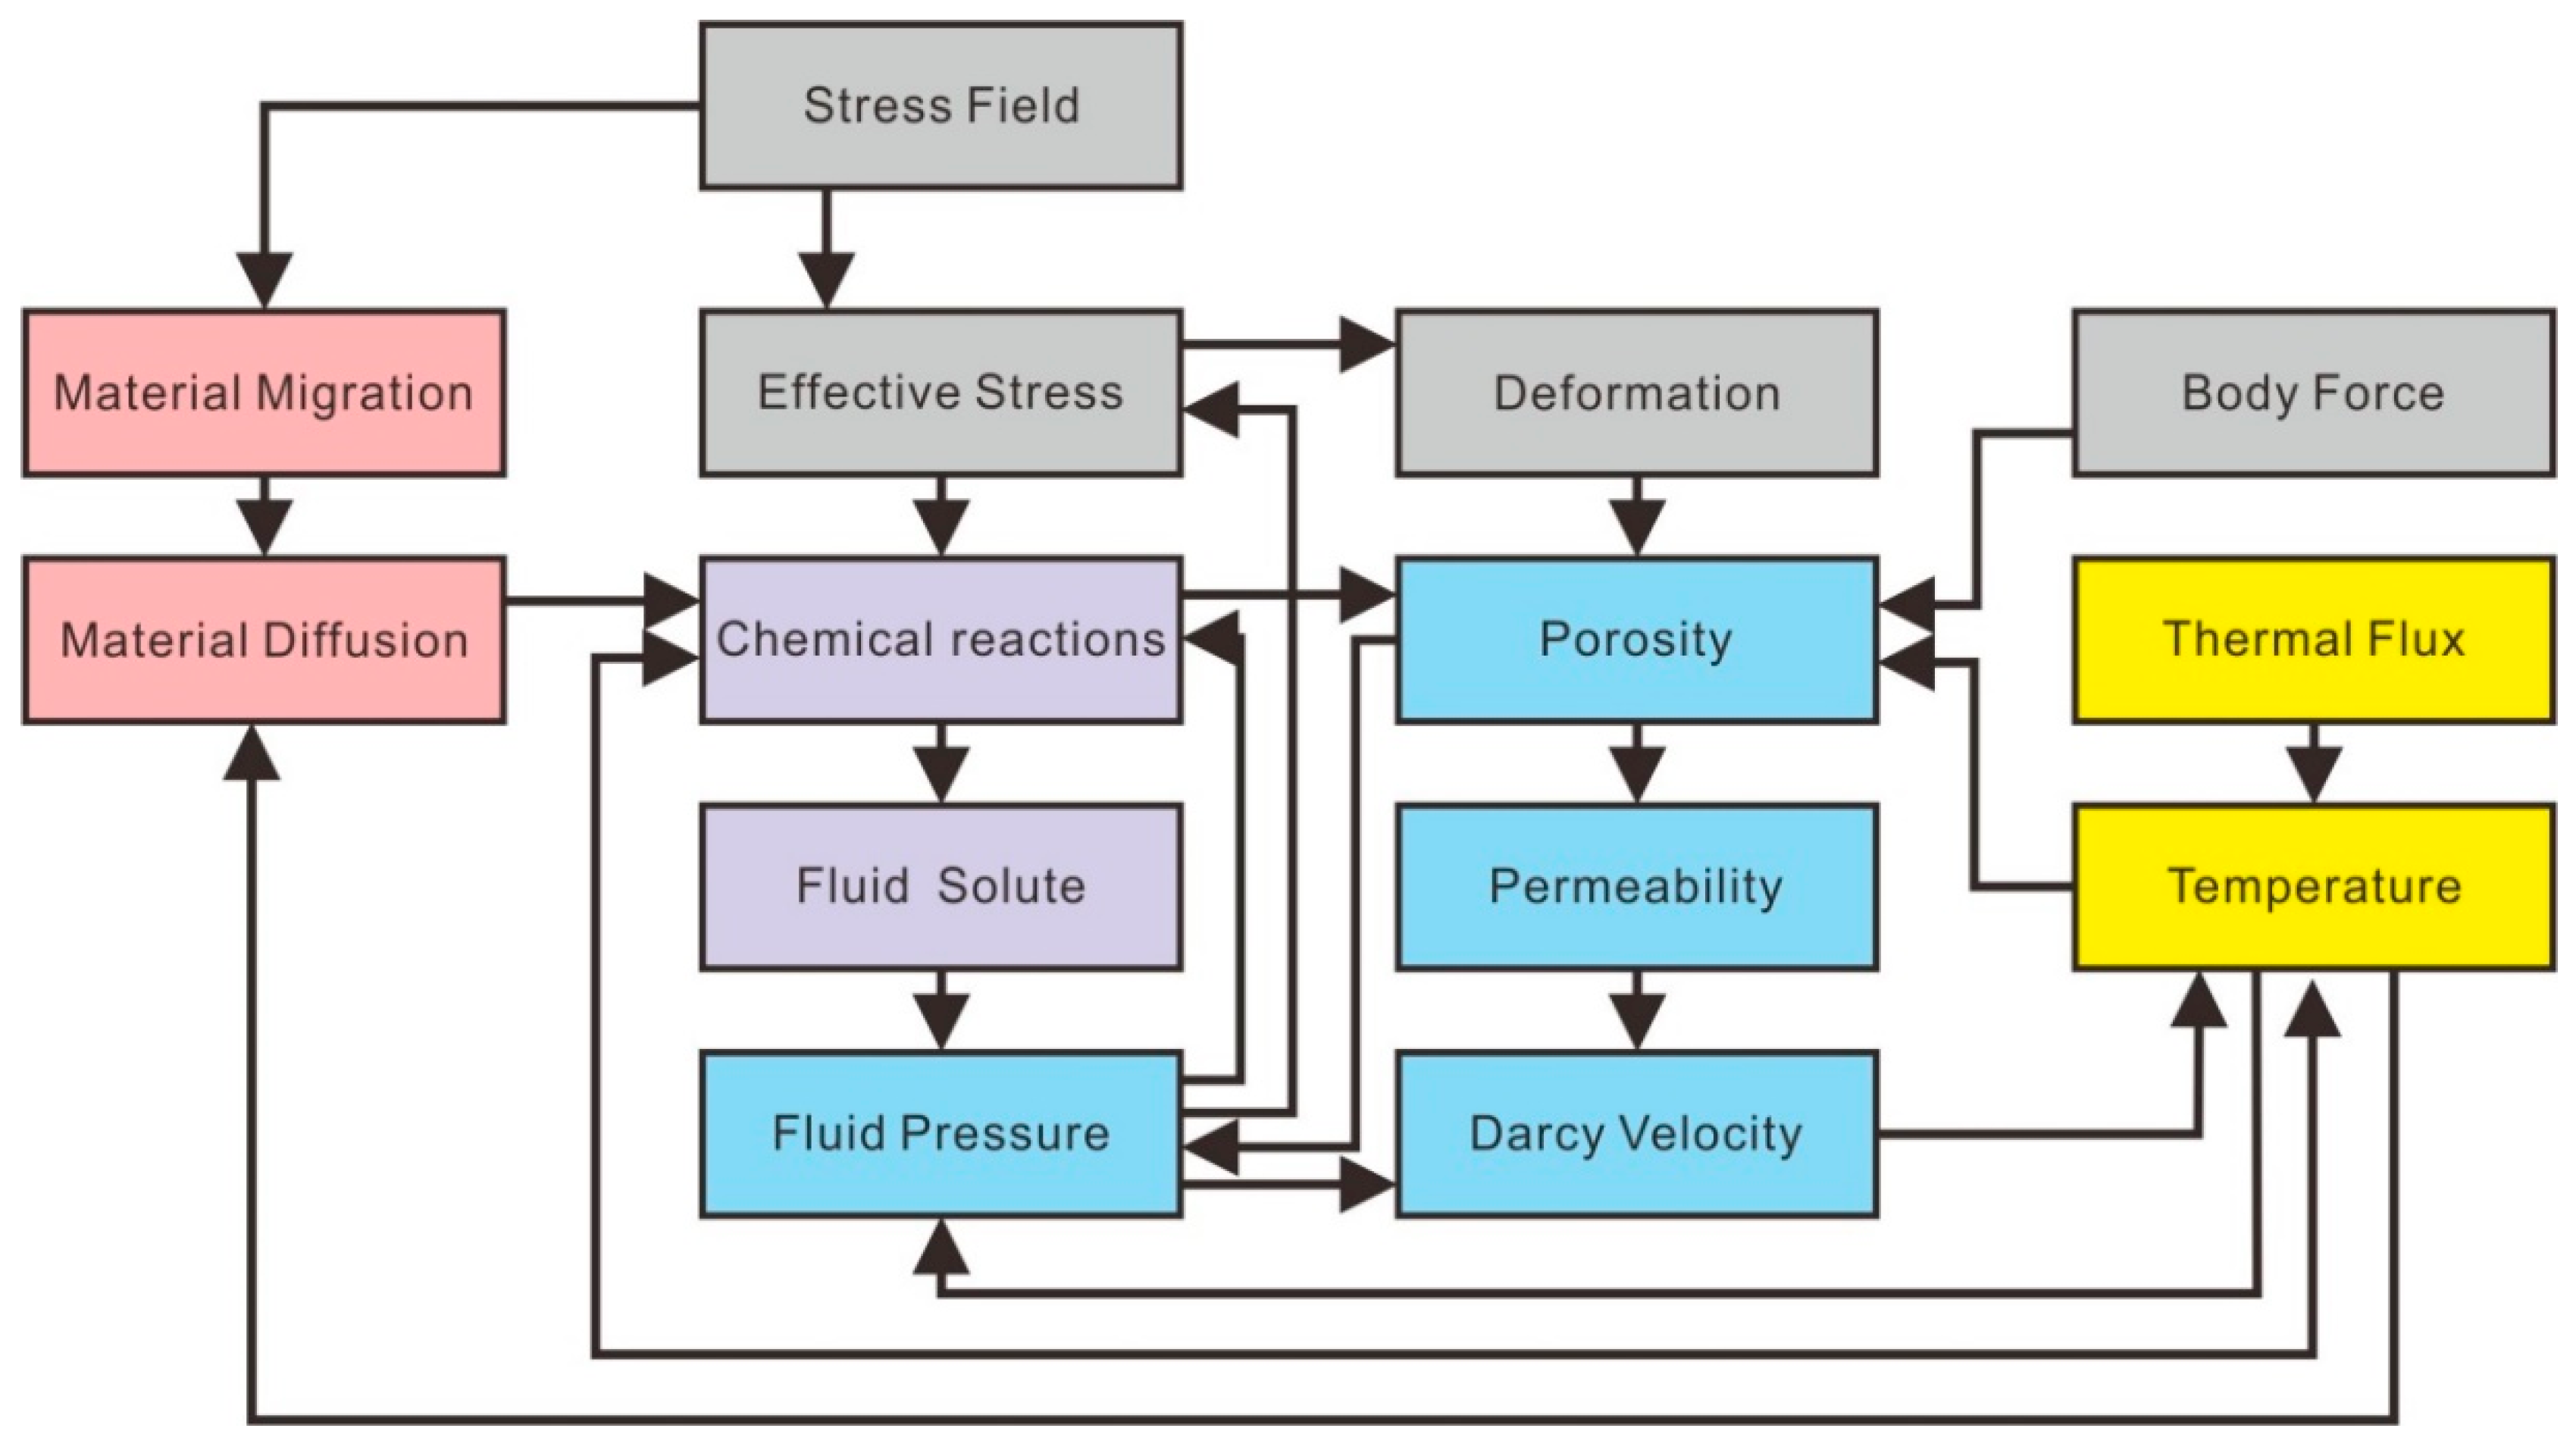
3.3. Mathematical Modeling

The main driving forces that enable the release and subsequent evolution of exsolved magmatic–hydrothermal fluids from a magma body are dynamic porosity and permeability, fluid-flow driven by temperature and pressure differences, and chemical reactions within pore spaces. The entire magmatic–hydrothermal system involves a number of physical and chemical processes that are controlled by fluid-flow, heat transfer, mechanics, chemical reactions, and material migration. These factors affect each other and combine in various ways in the overall process of ore formation (Figure 9; note that our research on the Magushan deposit does not involve either stress fields or deformation).
The main associated processes and their formulas and equations are given in the following sections and all of the key symbols used in these equations are outlined in Table S1.

3.3.1. Heat Transfer and the Body Force

Temperature and pressure gradients are calculated using:
T = T 0 y · G T
P = P 0 y · G P
where T is temperature in °C, T 0 is room temperature (normally 20 °C at 1 atmospheric pressure, i.e., 0.1013 MPa), y is depth in m, G T is the temperature gradient within the geological units in the model (25 °C/km) [38,39], P is pressure in MPa, P 0 is the atmospheric pressure, and G P is the pressure gradient within the geological units in the model, reflecting the average density of these units (26.5 MPa/km; Table 3) [40,41,42].
The equations that describe the conservation of energy are given below:
d z ( ρ C p ) e f f T t + d z ρ C p ν · T + · q = d z Q + q 0 + d z Q v d
q = d z k e f f T
( ρ C p ) e f f = θ p ρ p C p , p + ( 1 θ p ) ρ C p
k e f f = θ p C pr + ( 1 θ p ) C m + k d i s p
θ p = 1 ε
where d z is the thickness of the section (set as 1200 m), ρ is fluid density, C p is the heat capacity of the mixture of fluid and chemical reactants (for details see Section 3), T is temperature, t is time, ν is the speed of fluid flow, q is heat dissipation, q 0 is the generalized inward heat flux, Q is reaction heat, Q v d is the heat transferred from the surrounding environment, ρ p is the density of porous rock, θ p is the volume fraction of porous rock, C p , p is the specific heat capacity, k e f f is the effective heat conductivity, C pr is the heat conductivity of porous rock, C m is the heat conductivity of the mixture of fluid and chemical reactants (for details see Section 3), k d i s p is the coefficient of the initial heat dissipation to the surrounding environment, and ε is porosity.

3.3.2. Fluid-Flow Driven by Pressure Differentiation

Fluid-flow in our model is governed by Darcy’s law [43,44,45]:
ν = k μ P + g ρ l
Q m = t ( ε ρ l ) + · ( ρ l ν )
where ν is the speed of fluid flow, k is the permeability, μ is viscosity, ε is porosity, Q m is the fluid source term (fluids are modeled as vectors in the COMSOL software package, so they have a direction and a value but no entity), Q m is used to describe the total of the fluid flow in/through the model system (this term would be a sink term when fluids are flowing out of the model; [30]), t is time, P is the pressure gradient, and g ρ l is the body force (gravity and liquid density) where g is the gravitational constant and ρ l is the density of the liquid in question.

3.3.3. Chemical Reactions and Coupling Equations with Heat Transfer

The chemical reaction component of our modeling used a typical garnet formation equation to describe chemical reactions during ore-forming processes at temperatures of 270–410 °C [36] as follows:
3 X + 2 Y + 3 ( SiO 4 ) X 3 Y 2 ( SiO 4 ) 3   ( Reaction   Rate : R G a r n e t )
C p =   w i C p , i M i ,   w i = c i M i   c i M i
C m = 0.5 ( i x i C c , i + ( i x i C c , i ) 1 ) ,   x i = c i i c i
where R G a r n e t is the reaction rate during the simulated process, w i is the ratio fraction of material i , C p , i is the heat capacity of material i , M i is the molar weight of material i , c i is the concentration of material i ; x i is the concentration fraction of material i , and C c , i is the heat conductivity of material i , where i can be X, Y, or SiO4.

3.3.4. Transport of Dilute Minerals in Porous Rocks

The transportation of the fluids that precipitate minerals through rocks using Darcy’s law is implicitly related to the nature of the porous media, as reflected by the fluid-flow equation used for porous rocks:
c i t + · ( D i c i ) + ν · c i = R i
N i = D i c i + ν c i
where D i is the diffusion coefficient of reactant i in fluid, ν is the speed of fluid flow, R i is the reaction rate of reactant i, and Ni is the amount of reactant i that takes part in the chemical reaction.

4. Results

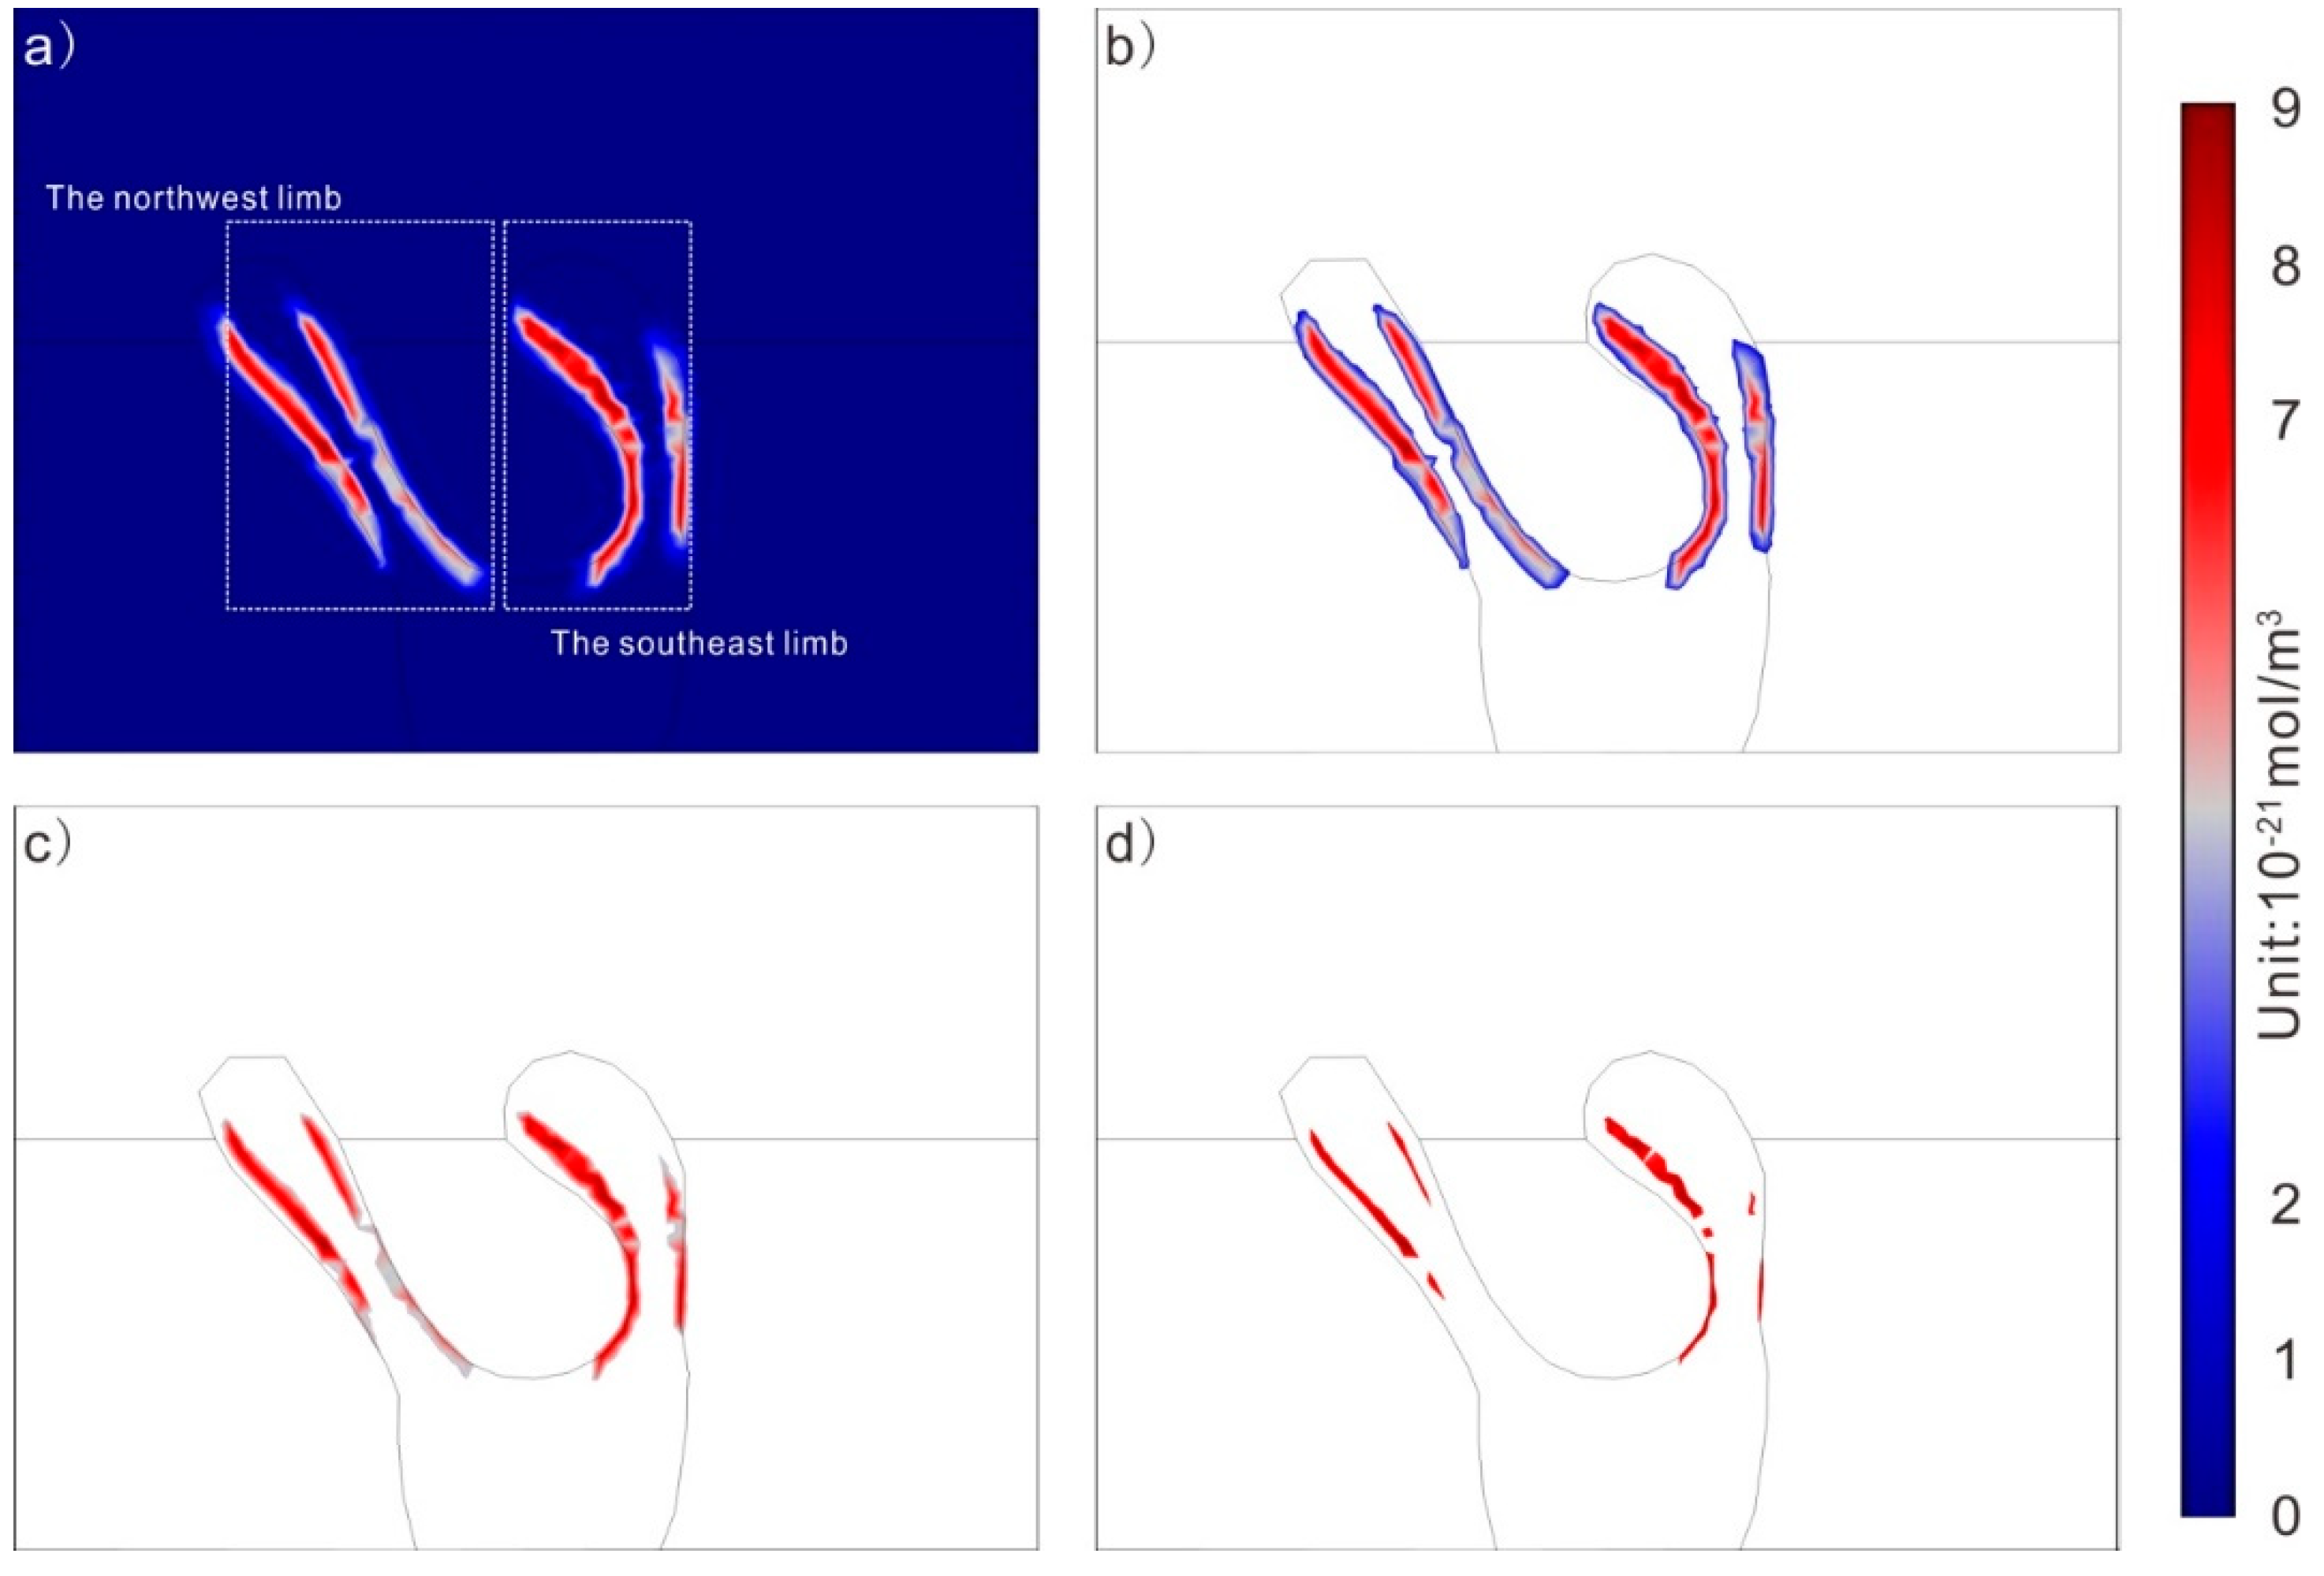
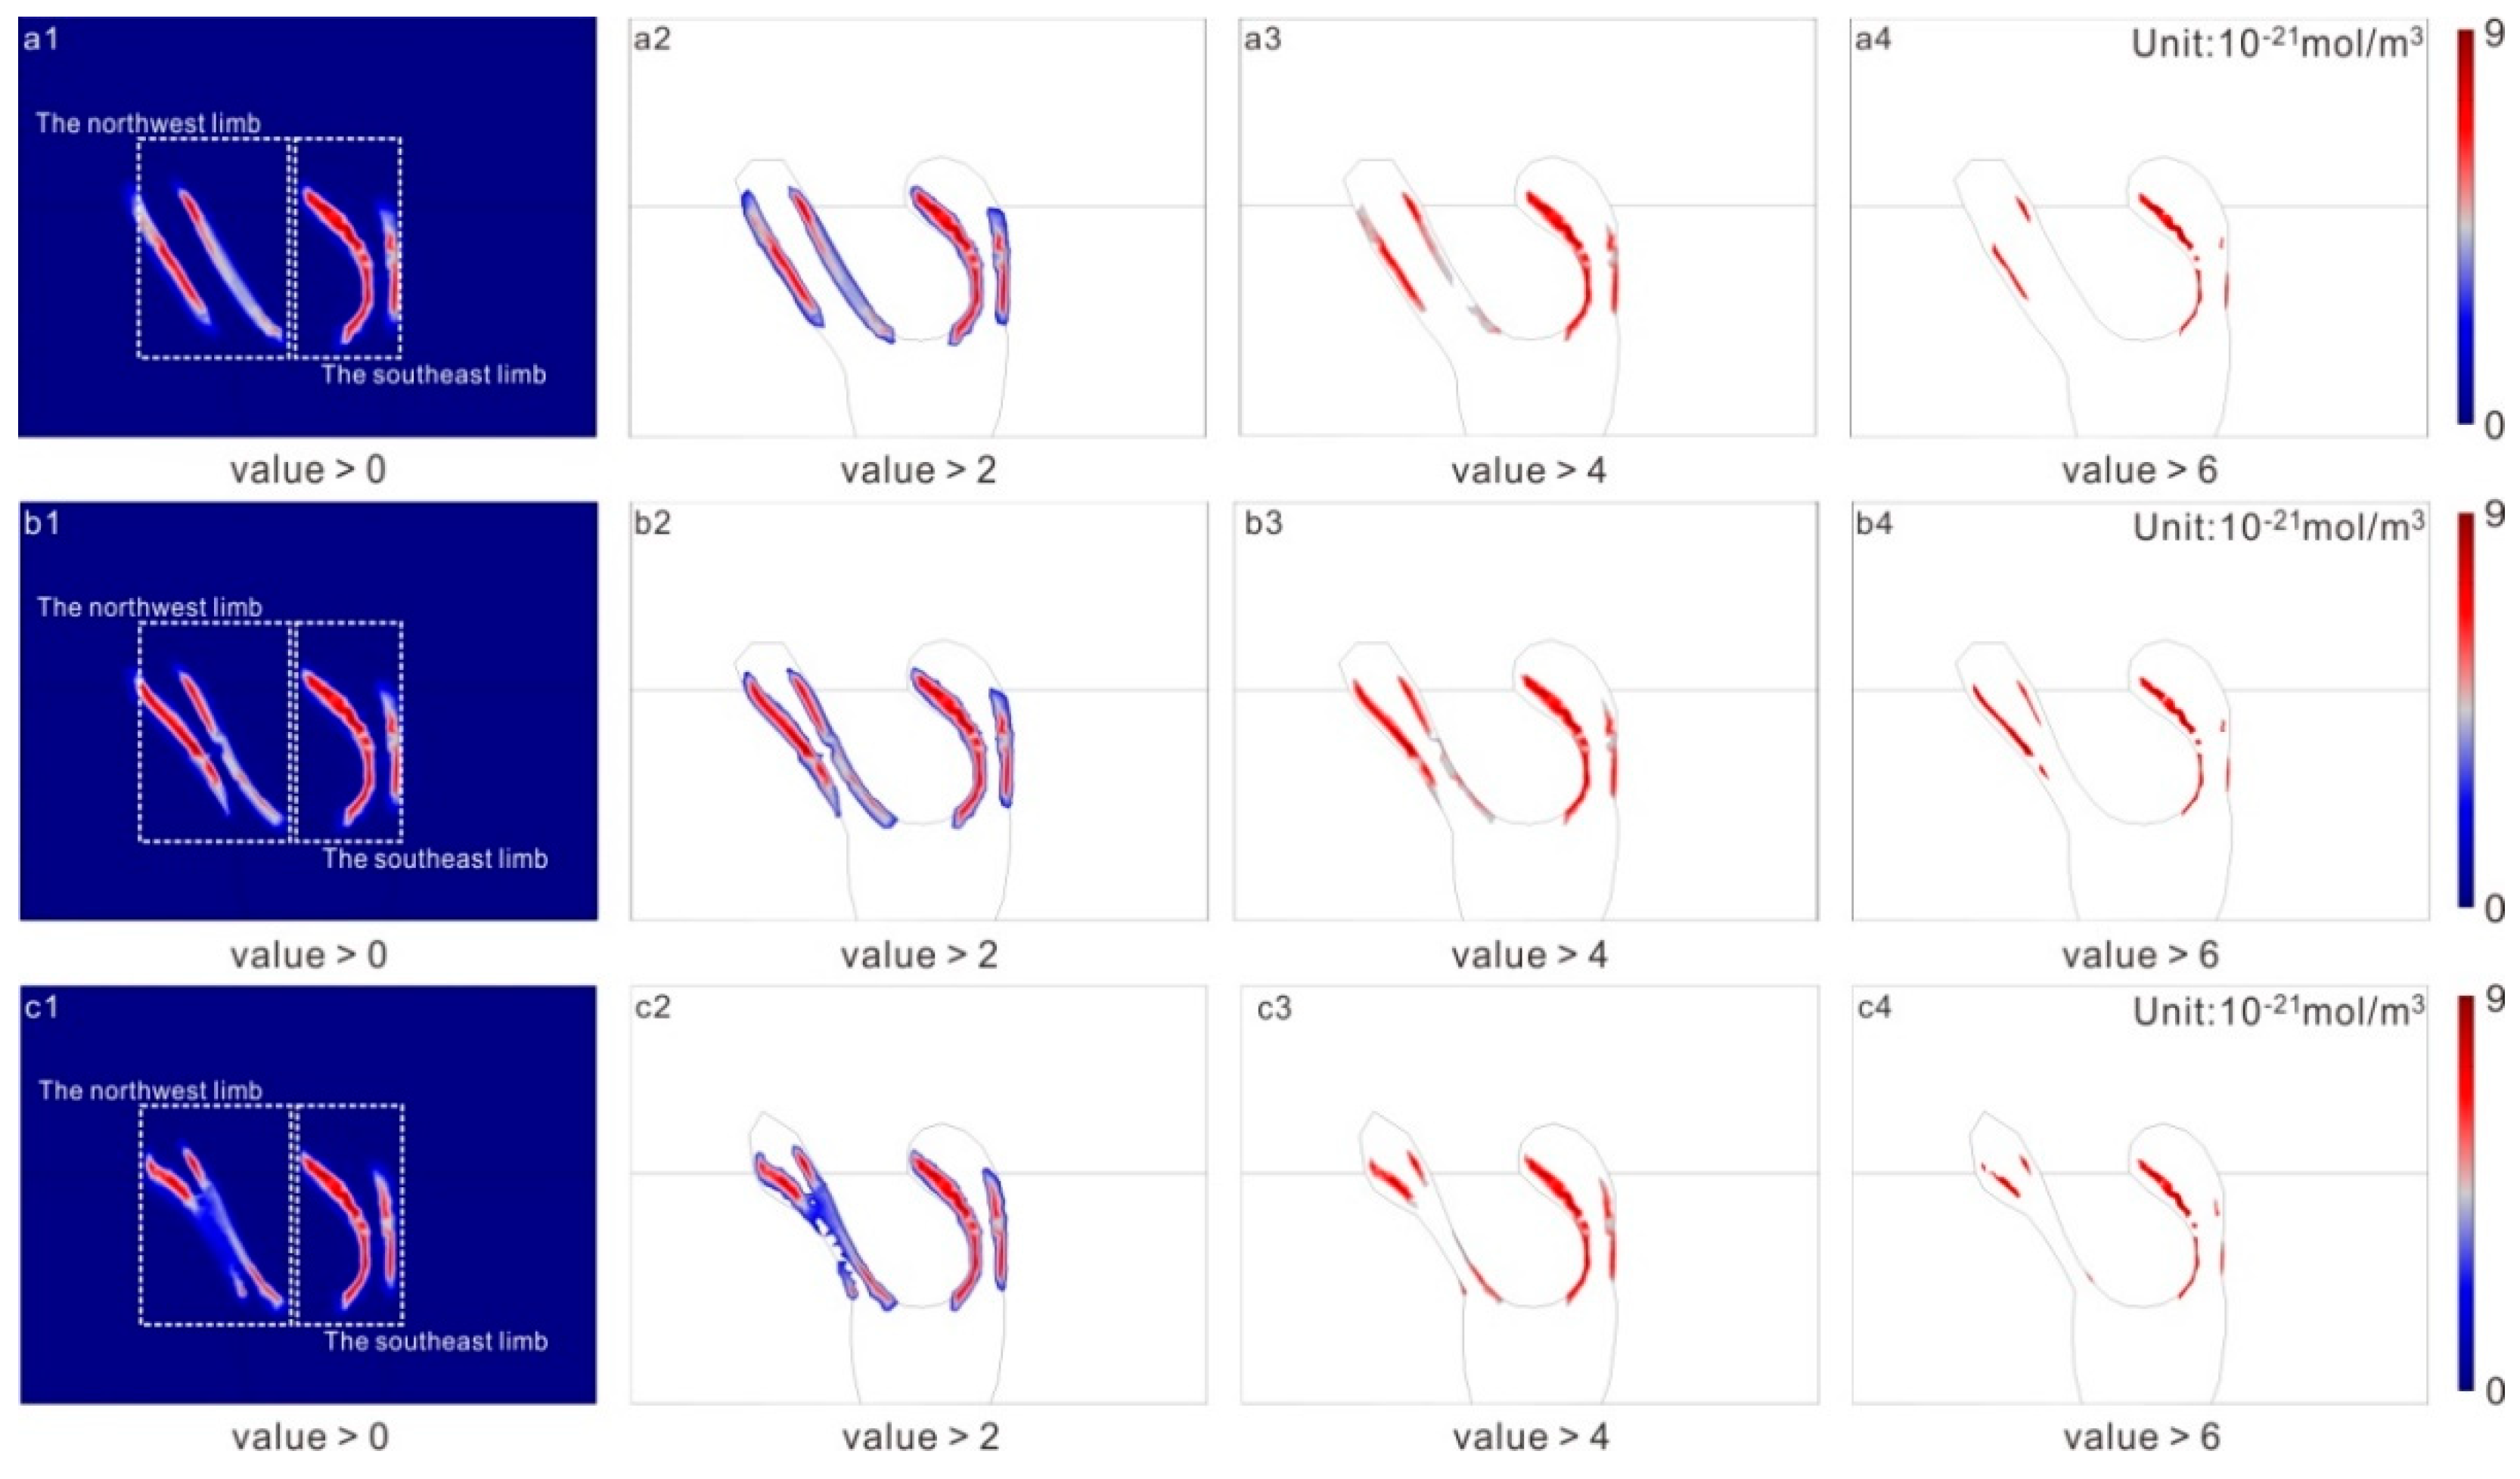
4.1. Simulated Ore-Forming Processes

Our modeling predicts the generation of garnet within the contact zone between the intrusion and the surrounding sedimentary units as well as the surrounding regions within both southeast and northwest limbs of the syncline (Figure 10a). This is consistent with the presence of known mineralization within the southeast limb of this fold (i.e., the Magushan deposit) but also suggests that the other limb of this syncline represents a target for mineral exploration. As mentioned above, the equilibrium coefficient of the reaction equation is unknown, meaning that the entire simulation has a low positive equilibrium status and yields garnet concentrations with values of 10−21, in practice, and as also mentioned above, this means that the concentration values obtained during this modeling are relative, and the actual values have no practical significance.
The mineralized potential of the northwest limb of the syncline was determined by calculating garnet area ratio values (i.e., the proportion of the area of the limb containing predicted garnet) for the data shown in Figure 10b–d, with the results of this calculation shown in Figure 11 and given in Table 4. The northwest limb has a higher garnet area ratio (2.2%) than the southeast limb (1.98%) but at a low concentration (>2 × 10⁻²¹ mol/m3). However, these area ratio values decrease rapidly in both limbs when considering areas of moderate or greater garnet concentration only (>4 × 10⁻²¹ mol/m3; 0.96% in the northwest limb and 0.69% in the southeast limb) before decreasing even further in both limbs (0.24% in the northwest limb and 0.31% in the southeast limb) for areas with only high concentrations of garnet (>6 × 10⁻²¹ mol/m3). It is also important to note that the distribution of predicted garnet formation matches the locations of known mineralization within the southeast limb despite the fact that this modeling had no inputs (e.g., training points) derived from the known mineralization within the Magushan deposit. This indicates that the northwest limb of the syncline is also likely to host mineralization, potentially over a larger area than that associated with the known Magushan deposit in the southeast limb, despite the fact that the former area contains little known mineralization (primarily as a result of a low level of exploration). We have taken this a step further and have identified a target within the northwest limb of the syncline based on the results of our simulation and the previously constructed geophysics-based cross-sections for this region (Figure 12), providing targets for future exploration in the region around the present Magushan deposit.
Variations in garnet area ratios reflect the proportion of these regions that contains garnet at different relative concentrations. Note that the concentration values obtained during this modeling are relative and the actual values have no practical significance beyond highlighting relative changes in predicted garnet abundance.

4.2. Sensitivity Testing

The shape of an intrusion can influence the results of numerical simulations like those undertaken during this study. Here, we present the results of a series of sensitivity tests to verify the influence of intrusion shape on the results of our simulations. This involved the construction of two additional models to verify the influence caused by the shape of the apophyses of the intrusion as shown in Figure 13a,b. Our original simulation model was based on interpreted geophysical data and the resulting geological cross-sections. However, the size of the northwestern apophyses is somewhat uncertain and was originally modeled to have the same dimensions as the southeastern apophyses (Figure 8; the interpreted section is too larger to show the relatively small differences in the sizes of the two limbs). We tested the influence of this uncertainty and any possible variation in the size of this part of the intrusion by constructing two additional models that contained northwestern intrusion apophyses that varied in size, with Figure 13a showing the model with the wider northwestern apophyses, and Figure 13b showing the model with the narrower apophyses.
The results of this sensitivity testing are shown in Figure 14, which shows the results of modeling with a wider northwestern apophysis (Figure 13a and Figure 14a1–a4), the original modeling (Figure 10 and Figure 14b1–b5), and with a narrower northwestern apophysis (Figure 13b and Figure 14c1–c4). The northwestern apophyses contain garnet independent of the size of this part of the intrusion, emphasizing that even with this uncertainty this region should be considered highly prospective for future exploration. This exploration potential was again quantified using garnet-bearing area ratios (Figure 15; Table 5). The sensitivity testing models essentially replicate the results of the original modeling, where more of the northwest limb contains garnet at low concentrations (>2 × 10⁻²¹ mol/m3), but the proportion of this area containing garnet drops rapidly to below the proportion of the southeast limb when considering areas with higher concentrations of garnet (>6 × 10⁻²¹ mol/m3), with these results consistent over all three models. Our sensitivity modeling therefore indicates that the broad conclusions from our original model are independent of variations in size of the northwestern apophysis, namely that a significant region of the northwest limb should contain mineralization (over a slightly larger area than the mineralization within the southeast limb), but this mineralization may be less well developed (lower grade?) than that within the southeast limb.
Variations in garnet area ratios reflect the proportion of these regions that contains garnet at different relative concentrations. Note that the concentration values obtained during this modeling are relative and the actual values have no practical significance beyond highlighting relative changes in predicted garnet abundance.

5. Discussion

Mineral exploration in regions containing thick and unprospective cover sequences requiring the targeting of deep-seated mineralization remains challenging, especially over time as near-surface targets are identified and brought into production, a process that requires exploration to target deeper levels over time. The deep nature of this exploration means that only certain types of exploration tools can be used, such as geophysics and drilling based on structural and geophysical targeting [46,47,48,49,50]. Recent advances in three dimensional prospectivity modeling for mineral exploration has highlighted the potential use of prospectivity modeling [12,13,14,15,16] and numerical modeling [21] in this type of exploration targeting. However, the simulation undertaken during this study provides another method of predicting the location of areas that are prospective for deep exploration, supplementing more traditional exploration approaches, and removing risks related to the conditional dependence associated with some other types of prospectivity modeling.
Our modeling has correctly predicted the location of areas of known mineralization despite being based on modeling rather than any training of our dataset using areas of previously known mineralization. This indicates that this simulation approach can provide an independent identification of highly prospective targets for future exploration as well as having potential use in exploration for deep-seated mineralization elsewhere. This is consistent with the results of [21], who used a numerical simulation within a three-dimensional prospectivity analysis of the skarn-dominated Yueshan orefield in China. This research indicated that the incorporation of numerical simulation enhanced the results of prospectivity modeling, indicating the usefulness of numerical simulation in exploration at depth.
This study used numerical simulation to identify areas for future exploration in areas surrounding regions of known skarn mineralization, but the effectiveness of this approach on larger scales (e.g., entire orefields) requires further assessment. The Magushan orefield is located within the southern part of the newly discovered Nanling–Xuancheng mining district, an area with high exploration potential after the discovery and exploration of the Chating porphyry [31] and Magushan skarn [22] deposits. However, the majority of the area is covered by Quaternary and thick Cretaceous sediments (Figure 3), meaning this region contains little exposure of older rocks that may host or be associated with mineralization. This presents a significant challenge to traditional mineral exploration approaches, meaning that the construction of a simplified orefield-scale numerical model and the associated numerical simulation of mineralized processes based on the Magushan deposit and existing geological and geophysical data for this area could potentially increase exploration success in this region. This approach is far more economical than the significant amount of drilling that is needed to test the entire area, which covers some 23 × 21 km. This situation emphasizes the increasing challenges facing exploration globally, not just within this region and reflects a gradual increase of exploration depth as the majority of outcropping and near-surface mineralization has been identified and exploited over time. This in turn suggests that mathematical/numerical approaches to mineral exploration will become more important over time, and this type of numerical simulation should be more widely applied during future mineral exploration.
However, there are still shortcomings in our research. The numerical model is in a 2D environment, and the influence from the surrounding environment (both sides of the section) is ignored. In addition, the 3D shape of the contact zone between geological units (i.e., sedimentary units and the intrusion) may influence the distribution of the concentration of garnet and associated mineralization in this region. A more precisely interpreted and better constrained geophysical section would also provide more insight into the geology and mineralization in this area, enabling the construction of an improved and more accurate model and related multi-field coupling simulations that in turn more accurately predicts the location of highly prospective areas to be targeted during future mineral exploration.

6. Conclusions

This study numerically modeled the processes that formed the skarn-type Magushan copper–molybdenum deposit and producing the following key findings:
(1) The simulated distribution of garnet matches areas of known mineralization identified during drilling and exploitation of the deposit to date, indicating that our modeling could potentially be used to predict areas of hitherto unknown mineralization as well as verifying the potential use of a coupled multi-field approach in economic geology research and mineral exploration.
(2) Our modeling also identified a prospective exploration target to the northwest of the present Magushan deposit that appears to be highly prospective when combining our modeling with the results of previous geological and geophysical research. This indicates that numerical simulation represents an effective approach to prospectivity modeling and exploration targeting in areas with thick and barren sedimentary (or other) cover sequences where traditional geological and geochemical techniques are less effective.

Supplementary Materials

The following are available online at https://www.mdpi.com/2075-163X/9/10/588/s1, Table S1: Description of symbols (listed in the order of appearance).

Author Contributions

Conceptualization, X.L., A.O., X.H., Y.L.; methodology, A.O., X.H., W.D.; software, X.H.; fieldwork, F.Y., Y.L., X.H.; interpretation, R.Y.; writing—original draft preparation, X.H. and S.M.J.; writing—review and editing, S.M.J., A.O., F.Y., X.L., X.H.; supervision, F.Y. and T.Z.; funding acquisition, F.Y. and X.L.

Funding

This research was financially supported by funds from the National Natural Science Foundation of China (Grant No. 41820104007, 41702353, 41672069, 41872247), the National Key R&D Program of China (Grant No. 2016YFC0600209, 2016YFC0600206), the Scientific and Technological Program of Land and Resources of Anhui province (Grant No. 2016-K-4), the Fundamental Research Funds for the Central Universities (Grant No. JZ2016HGTA0710), China Scholarship Council, and the Fundamental Research Funds for the Central Universities (Grant No. JZ2018HGTB0249, PA2019GDZC0093).

Acknowledgments

We thank Xuanxuan Li, the Anhui Quanxin mining company, the Anhui 812 Geological Team, and the Geological Exploration Technology Institute of Anhui Province, all of whom undertook fieldwork examining and exploring the Magushan Cu–Mo deposit, for their input into our modeling of this skarn deposit. We also thank two anonymous reviewers for constructive comments on an earlier version of this article.

Conflicts of Interest

The authors declare no conflict of interest.

References

  1. Mudd, G.M.; Weng, Z.; Jowitt, S.M. A detailed assessment of global Cu resource trends and endowments. Econ. Geol. 2013, 108, 1163–1183. [Google Scholar] [CrossRef]
  2. Mudd, G.M.; Jowitt, S.M. Growing global copper resources, reserves and production: Discovery is not the only control on supply. Econ. Geol. 2018, 113, 1235–1267. [Google Scholar] [CrossRef]
  3. Mudd, G.M.; Jowitt, S.M.; Werner, T.T. The world’s lead-zinc mineral resources: scarcity, data, issues and opportunities. Ore Geol. Rev. 2017, 80, 1160–1190. [Google Scholar] [CrossRef]
  4. Meinert, L.D.; Dipple, G.M.; Nicolescu, S. World skarn deposits. In Econ. Geol. 100th Aniv. Vol., 1st ed.; Hedenquist, J.M., Thompson, J.F.H., Goldfarb, R.J., Richards, J.P., Eds.; Society of Econmic Geologists: Littleton, CO, USA, 2005; Volume 11, pp. 299–336. [Google Scholar]
  5. Chang, Y.F.; Liu, X.P.; Wu, Y.C. The Copper-Iron Belt of the Lower and Middle reaches of the Changjiang River, 1st ed.; Geological Publishing House: Beijing, China, 1991; pp. 1–379. [Google Scholar]
  6. Pirajno, F.; Zhou, T.F. Intracontinental porphyry and porphyry skarn mineral systems in eastern China: Scrutiny of a special case “made-in-China”. Econ. Geol. 2015, 110, 603–629. [Google Scholar] [CrossRef]
  7. Zhou, T.F.; Wang, S.W.; Fan, Y.; Yuan, F.; Zhang, D.Y.; White, N.C. A review of the intracontinental porphyry deposits in the Middle-Lower Yangtze River Valley metallogenic belt, Eastern China. Ore Geol. Rev. 2015, 65, 433–456. [Google Scholar] [CrossRef]
  8. Xiao, Q.L.; Zhou, T.F.; Wang, S.W.; Yuan, F.; White, N.C.; Wang, F.Y.; Xie, Z.J.; Liu, J. Genesis of Chating Cu-Au deposit in the Middle-Lower Yangtze River Metallogenic Belt, Eastern China: Implications from magnetite and biotite geochemistry. Ore Geol. Rev. 2019, 106, 113–133. [Google Scholar] [CrossRef]
  9. Xu, X.C.; Ji, K.; Bai, R.Y.; Qian, S.L.; Yang, Q.G.; Xie, Z.J. Modes of Occurrence of Gold and Genetic Connection between Gold and Copper in the Ores from the Chating Porphyry Copper-Gold deposit, Xuancheng City, Anhui Province. Acta Petro. Mineral. 2018, 37, 575–589. [Google Scholar]
  10. Jiang, F.; Xu, X.C.; Qian, S.L.; Wang, M.; Yang, Q.G.; Li, K. Zircon U-Pb Age and Genesis of the Ore-bearing Quartz-diorite Porphyries in the Chating Cu-Au Ore Deposit, Xuancheng City, Anhui Province. Geol. J. China Univ. 2017, 23, 591–605. [Google Scholar]
  11. Zhou, T.F.; Fan, Y.; Wang, S.W.; White, N.C. Metallogenic regularity and Metallogenic model of the Middle-Lower Yangtze River Valley Metallogenic Belt. Acta Petrol. Sin. 2017, 33, 3353–3372. [Google Scholar]
  12. Porwal, A.; Gonzalez-Alvarez, I.; Markwitz, V.; McCuaig, T.; Mamuse, A. Weights of-evidence and logistic regression modeling of magmatic nickel sulfide prospectivity in the Yilgarn Craton, Western Australia. Ore Geol. Rev. 2010, 38, 184–196. [Google Scholar] [CrossRef]
  13. Porwal, A.; Carranza, E.J.M. Introduction to the Special Issue: GIS-based mineral potential modelling and geological data analyses for mineral exploration. Ore Geol. Rev. 2015, 71, 477–483. [Google Scholar] [CrossRef]
  14. Mao, X.C.; Jia, R.; Liu, Z.K.; Chen, J.; Tang, L.; Deng, H.; Bayless, R.C.; Yang, B.; Wang, M.J.; Liu, C.M. Three-dimensional prospectivity modeling of the Jiaojia-type gold deposit, Jiaodong Peninsula, Eastern China: A case study of the Dayingezhuang deposit. J. Geochem. Explor. 2019, 203, 27–44. [Google Scholar] [CrossRef]
  15. Li, X.H.; Yuan, F.; Zhang, M.M.; Jia, C.; Jowitt, S.M.; Ord, A.; Zheng, T.K.; Hu, X.Y.; Li, Y. Three-dimensional mineral prospectivity modeling for targeting of concealed mineralization within the Zhonggu iron orefield, Ningwu Basin, China. Ore Geol. Rev. 2015, 71, 633–654. [Google Scholar] [CrossRef]
  16. Hu, X.Y.; Yuan, F.; Li, X.H.; Jowitt, S.M.; Jia, C.; Zhang, M.M.; Zhou, T.F. 3D characteristic analysis-based targeting of concealed Kiruna-type Fe oxide-apatite mineralization within the Yangzhuang deposit of the Zhonggu orefield, southern Ningwu volcanic basin, middle-lower Yangtze River metallogenic Belt, China. Ore Geol. Rev. 2018, 92, 240–256. [Google Scholar] [CrossRef]
  17. Hobbs, B.; Regenauer-Lieb, K.; Ord, A. Thermodynamics of folding in the middle to lower crust. Geology 2007, 35, 175–178. [Google Scholar] [CrossRef]
  18. Oliver, N.H.; McLellan, J.G.; Hobbs, B.E.; Cleverley, J.S.; Ord, A.; Feltrin, L. Numerical models of extensional deformation, heat transfer, and fluid flows across basement-cover interfaces during basin-related mineralization. Econ. Geol. 2006, 101, 1–31. [Google Scholar] [CrossRef]
  19. Ord, A.; Hobbs, B.E.; Lester, D.R. The mechanics of hydrothermal systems: I. Ore systems as chemical reactors. Ore Geol. Rev. 2012, 49, 1–44. [Google Scholar] [CrossRef]
  20. Cooke, D.R.; McPhail, D.C. Epithermal Au–Ag–Te mineralization, Acupan, Baguio district, Philippines: Numerical simulations of mineral deposition. Econ. Geol. 2001, 96, 109–131. [Google Scholar]
  21. Li, X.H.; Yuan, F.; Zhang, M.M.; Jowitt, S.M.; Ord, A.; Zhou, T.F.; Dai, W.Q. 3D computational simulation-based mineral prospectivity modeling for exploration for concealed Fe–Cu skarn-type mineralization within the Yueshan orefield, Anqing district, Anhui Province, China. Ore Geol. Rev. 2019, 105, 1–17. [Google Scholar] [CrossRef]
  22. 812 Geological Team of Eastern China Bureau of Geological Exploration & Metallurgy. Report of Resources and Reserves of Magushan Cu–Mo Deposit; 812 Geological Team of Eastern China Bureau of Geological Exploration & Metallurgy: Xuancheng, China, 2010. [Google Scholar]
  23. Geological Exploration Technology Institute of Anhui Province. Geophysical Test Report of Nanling–Xuancheng Aera; Geological Exploration Technology Institute of Anhui Province: Hefei, China, 2016. [Google Scholar]
  24. Tang, Y. Geology of Copper-Gold Polymetallic Deposits in the Along-Changjiang Area of Anhui Province, 1st ed.; Geological Publishing House: Beijing, China, 1998; pp. 1–351. [Google Scholar]
  25. Zhai, Y. Metallogenic Regularity of Iron and Copper (Gold) Deposits in the Middle and Lower Valley of the Yangtze River, 1st ed.; Geological Publishing House: Beijing, China, 1992; pp. 1–235. [Google Scholar]
  26. Pan, Y.; Dong, P. The Lower Changjiang (Yangzi/Yangtze River) metallogenic belt, east central China: Intrusion-and wall rock-hosted Cu–Fe–Au, Mo, Zn, Pb, Ag deposits. Ore Geol. Rev. 1999, 15, 177–242. [Google Scholar] [CrossRef]
  27. Yuan, F.; Zhou, T.F.; Liu, J.; Fan, Y.; Cooke, D.R.; Jowitt, S.M. Petrogenesis of volcanic and intrusive rocks of the Zhuanqiao stage, Luzong Basin, Yangtze metallogenic belt, east China: Implications for ore deposition. Int. Geol. Rev. 2011, 53, 526–541. [Google Scholar] [CrossRef]
  28. Zhao, Z.; Tu, G. Super-Large Ore Deposits in China (II), 1st ed.; Science Press: Beijing, China, 2003; pp. 1–631. [Google Scholar]
  29. Zhou, T.F.; Fan, Y.; Yuan, F.; Zhang, L.; Ma, L.; Qian, B.; Xie, J. Petrogensis and metallogeny study of the volcanic basin in the Middle and Lower Yangtze Metallogenic Belt. Acta Geol. Sin. 2011, 85, 712–730. [Google Scholar]
  30. Ningwu Research Group. Ningwu Porphyry Iron Ores, 1st ed.; Geological Publishing House: Beijing, China, 1978; pp. 1–196. [Google Scholar]
  31. Anhui 322 Geological Team. Geological Report of Chating Cu Polymetallic Deposit; Anhui 322 Geological Team: Xuanzhou, China, 2016. [Google Scholar]
  32. Zhao, C.B.; Hobbs, B.E.; Ord, A. Investigating dynamic mechanisms of geological phenomena using methodology of computational geosciences: An example of equaldistant mineralization in a fault. Sci. China Ser. D 2008, 51, 947–954. [Google Scholar] [CrossRef]
  33. Zhao, C.B.; Hobbs, B.E.; Ord, A. Fundamentals of Computational Geoscience: Numerical Methods and Algorithms, 1st ed.; Springer: Berlin, Germany, 2009; pp. 1–241. [Google Scholar]
  34. Zou, Y.H.; Liu, Y.; Dai, T.G.; Mao, X.C.; Lei, Y.B.; Lai, J.Q.; Tian, H.L. Finite difference modeling of metallogenic processes in the Hutouya Pb-Zn deposit, Qinghai, China: Implications for hydrothermal mineralization. Ore Geol. Rev. 2017, 91, 463–476. [Google Scholar] [CrossRef]
  35. Burnham, C.W. Energy release in subvolcanic environments; implications for breccia formation. Econ. Geol. 1985, 80, 1515–1522. [Google Scholar] [CrossRef]
  36. Ji, K. Mineralogy and Fluid Inclusion Geochemistry of the Chating Cu-Au Deposit, Xuancheng City. Master’s Thesis, Hefei University of Technology, Hefei, China, 2018. [Google Scholar]
  37. Meinert, L.D. Skarns and skarn deposits. Geosci. Can. 1992, 19, 145–162. [Google Scholar]
  38. Bickle, M.J. Heat loss from the Earth: A constraint on Archaean tectonics from the relation between geothermal gradients and the rate of plate production. Earth Planet. Sci. Lett. 1978, 40, 301–315. [Google Scholar] [CrossRef]
  39. Lister, C.R.B. Geothermal gradient measurement using a deep sea corer. Geophys. J. Int. 1963, 7, 571–583. [Google Scholar] [CrossRef]
  40. Anderson, D.L. Theory of the Earth, 1st ed.; Blackwell Scientific Publications: Hoboken, NJ, USA, 1989; pp. 1–379. [Google Scholar]
  41. Hart, B.S.; Flemings, P.B.; Deshpande, A. Porosity and pressure: Role of compaction disequilibrium in the development of geopressures in a Gulf Coast Pleistocene basin. Geology 1995, 23, 45–48. [Google Scholar] [CrossRef]
  42. Hu, B.Q.; Wang, F.Z.; Sun, Z.X.; Liu, C.D.; Bai, L.H. The Pressure Gradient in the Lithosphere. Earth Sci. Front. 2003, 10, 129–133. [Google Scholar]
  43. Mandl, G. Mechanics of Tectonic Faulting, 1st ed.; Elsevier: Amsterdam, The Netherlands, 1988; pp. 1–407. [Google Scholar]
  44. Kumar, A.; Pramanik, S.; Mishra, M. COMSOL Multiphysics® Modeling in Darcian and Non-Darcian Porous Media. In Proceedings of the 2016 COMSOL Conference, Bangalore, India, 20–21 October 2016. [Google Scholar]
  45. Zhang, Z.; Li, J.; Zhou, J. Microscopic roles of “viscoelasticity” in HPMA polymer flooding for EOR. Trans. Porous Media 2011, 86, 199–214. [Google Scholar] [CrossRef]
  46. Emmermann, R.; Lauterjung, J. The German continental deep drilling program KTB: Overview and major results. J. Geophys. Res. 1997, 102, 18179–18201. [Google Scholar] [CrossRef]
  47. Huerta, A.D.; Nyblade, A.A.; Reusch, A.M. Mantle transition zone structure beneath Kenya and Tanzania: More evidence for a deep-seated thermal upwelling in the mantle. Geophys. J. Int. 2009, 177, 1249–1255. [Google Scholar] [CrossRef]
  48. Liu, J.X.; Hu, H.J.; Liu, C.M.; Han, S.L.; Xie, W. Application of Synthetical Geophysical Method on Exploration of Deep-seated Resources. Geol. Prospect. 2006, 4, 71–74. [Google Scholar]
  49. Nykänen, V.; Salmirinne, H. Prospectivity analysis of gold using regional geophysical and geochemical data from the Central Lapland Greenstone Belt, Finland. Geol. Surv. Finl. 2007, 44, 251–269. [Google Scholar]
  50. Yang, H.; Zhang, Y.; Zou, C.N.; Wen, B.H.; Li, J.Z.; Li, M. Exploration scheme of gas in deep-seated volcanic rocks in Songliao Basin. Petro. Explor. Dev. 2006, 33, 274–281. [Google Scholar]
Figure 1. Map showing the location of major volcanic basins and intrusions within the Middle and Lower Yangtze River Valley. Modified from [11,25]. a—Southeast Hubei mining district; b—Jiurui mining district; c—Anqing–Guichi mining district; d—Luzong mining district; e—Tongling mining district; f—Nanling–Xuancheng mining district, g—Ningwu mining district; h—Ningzhen mining district.
Minerals 09 00588 g001
Figure 2. Map showing the geology and mineral deposits of the Nanling–Xuancheng mining camp. Modified from [31].
Minerals 09 00588 g002
Figure 3. Map showing the geology and mineral deposits of the Magushan orefield. Modified from [31].
Minerals 09 00588 g003
Figure 4. Interpreted geological section based on a constrained joint inversion of gravity and magnetic potential field data (Section A–A’ in Figure 3).
Minerals 09 00588 g004
Figure 5. Map showing (a) the geology of the area around the skarn-type Magushan copper–molybdenum deposit (omitting Quaternary sediments for clarity) and (b) a cross-section along B–B’ showing the geology of the main orebody within the deposit. Modified from [22].
Minerals 09 00588 g005
Figure 6. Workflow used in the numerical modeling of the Magushan ore deposit.
Minerals 09 00588 g006
Figure 7. Simplified schematic illustration the formation of lobate skarn boundaries such as those within the Magushan deposit and corresponding fluid-flow patterns. Modified from [4].
Minerals 09 00588 g007
Figure 8. Simulation model used during modeling and constructed according to the conceptual model outlined in the text. Model state is after the solidification of the magma in this region.
Minerals 09 00588 g008
Figure 9. The coupled relationships between fluid flow, mechanics, heat transfer, material migration, and chemical reactions during mineralization and mineral deposit formation, with colors indicating the different physical fields involved in these processes.
Minerals 09 00588 g009
Figure 10. Cross-sections showing the predicted distribution of garnet during the modeling undertaken during this study; (a) entire model, (b) values > 2 × 10⁻²¹ mol/m3, (c) values > 4 × 10⁻²¹ mol/m3, and (d) values > 6 × 10⁻²¹ mol/m3.
Minerals 09 00588 g010
Figure 11. Graph showing variations in garnet area ratios (i.e., the proportion of a region that contains garnet at different relative concentrations) within the northwest and southeast limbs of the anticline with changes in minimum garnet concentrations. Note that the concentration values obtained during this modeling are relative and the actual values have no practical significance beyond highlighting relative changes in predicted garnet abundance.
Minerals 09 00588 g011
Figure 12. Map showing the location of the delineated target within the northwest limb of the syncline in relation to the rest of the Magushan orefield.
Minerals 09 00588 g012
Figure 13. Models used in sensitivity testing to determine the effect of variations in intrusion size: model with (a) a wider northwestern apophysis limb and (b) a narrower northwestern apophysis.
Minerals 09 00588 g013
Figure 14. The results of sensitivity testing undertaken during this study, comparing the distribution of generated garnet in (a1a4) the model with a wider northwestern apophysis, (b1b4) the original model, and (c1c4) a model with a narrower northwestern apophysis.
Minerals 09 00588 g014
Figure 15. Graphs showing variations in garnet-bearing area ratio values within the northwest and southwest limbs of the syncline in the study area relative to variations in garnet abundances as a result of modeling with (a) a wider northwestern apophysis, (b) the original modeling setup, and (c) with a narrower northwestern apophysis. Note that the concentration values obtained during this modeling are relative and the actual values have no practical significance beyond highlighting relative changes in predicted garnet abundance.
Minerals 09 00588 g015
Table 1. Stratigraphy of the study area; adapted from [23].
AgeLithostratigraphic UnitUnit CodeLithological DescriptionUnit Thickness (m)
Quaternary QClay1–30
Neogene NBreccia, mudstone0–25
Paleogene EBreccia, mudstone0–20
CretaceousChishan FormationK2cSandstone1055–7605
Xuannan FormationK2xQuartz sandstone50–700
Pukou FormationK1pSandstone, breccia379
Gecun FormationK1gMudstone, sandstone>1000
Zhongfencun FormationK1zLimestone, sandstone, andesite20–300
JurassicZhongfencun FormationJ3zLimestone, sandstone, andesite20–300
TriassicNanlinghu FormationT1nLimestone160–645
Helongshan FormationT1hLimestone130–220
Yinkeng FormationT1yLimestone200–300
PermianDalong FormationP3dQuartz sandstone10–50
Longtan FormationP2–3lQuartz sandstone100–300
Gufeng FormationP2gShale200–300
Qixia FormationP1qLimestone160–300
Chuanshan FormationP1cLimestone30–50
CarboniferousHuanglong FormationC2hLimestone30–50
Gaolishan FormationC1gSiltstone60–90
DevonianWutong FormationD3wQuartz sandstone85–176
SilurianMaoshan FormationS1–2mQuartz sandstone600–900
Fentou FormationS1fLithic sandstone800–1500
Gaojiabian FormationS1gFine-grained sandstone, mudstone, shale700–1300
Table 2. Rock material parameters used in simulation modeling; adapted from [23].
Rock TypeDensity (Kg/m3)Specific Heat Capacity (J/Kg K)Porosity (/1)Permeability (m2)Thermal Expansion Coefficient (10−6/K)Heat Conductivity (W/m K)
Wall rock26508200.238.0 × 101472.9
Intrusion26508700.226.0 × 101482.8
Denuded Cretaceous25807800.268.6 × 101473.1
Core of the syncline26508200.248.8 × 101482.9
Table 3. Pressure gradients within different layers in the lithosphere (where d p is pressure increment, d h is depth increment, g is the gravity constant, and ρ is the density of the object). Adapted from [42].
FormulaLayer ClassificationPressure Gradient (MPa/km)Calculated Depth (km)
Lithostatic gradient:
d p d h = g ·   ρ
Upper crust26.50–15
Middle crust2915–24.4
Lower crust33.7524.4–115
Crust (average)30Whole crust
Lithosphere (average)33Whole lithosphere
Table 4. Garnet area ratio values for the northwest and southeast limb of the syncline.
Concentration of Garnet (×10−21 mol/m3)Area Ratio of Northwest LimbArea Ration of Southeast Limb
>20.0220640.019843
>40.0096510.006918
>60.0024480.003103
Table 5. Garnet area ratio values for the northwest and southeast limb of the syncline.
Model ShapeConcentration of Garnet (×10−21 mol/m3)Area Ratio of Northwest LimbArea Ratio of Southeast Limb
Wider northwestern apophysis>20.0215800.019387
>40.0088540.010704
>60.0013380.003672
Original model>20.0220640.019843
>40.0096510.006918
>60.0024480.003103
Thinner northwestern apophysis>20.0214140.019098
>40.0064540.011078
>60.0012860.003767

