Article

Dehydroxylation and Structural Distortion of Kaolinite as a High-Temperature Sorbent in the Furnace

1
Jiangsu Provincial Key Laboratory of Materials Cycling and Pollution Control, School of Energy and Mechanical Engineering, Nanjing Normal University, Nanjing 210023, China
2
Key Laboratory of Energy Thermal Conversion and Control of Ministry of Education, School of Energy and Environment, Southeast University, Nanjing 210096, China
3
Zhenjiang Institute for Innovation and Development, Nanjing Normal University, Zhenjiang 212050, China
*
Authors to whom correspondence should be addressed.
Minerals 2019, 9(10), 587; https://doi.org/10.3390/min9100587
Submission received: 8 August 2019 / Revised: 21 September 2019 / Accepted: 26 September 2019 / Published: 27 September 2019
(This article belongs to the Special Issue Mineral Sorbents)

Abstract

:
As a high-temperature sorbent, kaolinite undergoes the flash calcination process in the furnace resulting in the dehydroxylation and structural distortion, which are closely related to its heavy metal/alkali metal adsorption characteristics. We investigated the flash calcination of kaolinite by the experiments using a drop tube furnace and by the characterization of flash-calcined products using thermogravimetric-differential scanning calorimeter (TG-DSC), X-ray diffraction (XRD), Fourier Transform Infrared Spectrometer (FTIR)and nuclear magnetic resonance (NMR). There were three kinds of hydroxyl groups in kaolinite during flash calcination at 800–1300 °C, E-type (~50%, easy), D-type (~40%, difficult) and U-type (~10%, unable) according to the removal difficulty. The hydroxyl groups activation was believed to be the first step of the removal of E-type and D-type hydroxyl groups. The kinetics model of dehydroxylation groups at 900–1200 °C was established following Arrhenius equation with the activation energy of 140 kJ/mol and the pre-exponential factor of 1.32 × 10⁶ s−1. At 800 °C, the removal of E-type hydroxyl groups resulted in the conversion of a part of VI-coordinated Al in kaolinite to V-coordinated Al and the production of meta-kaolinite. When the temperature rose up to 1200 °C, mullite was produced and a part of V-coordinated Al converted to IV-coordinated Al and VI-coordinated Al. Finally, the adsorption characteristics of kaolinite was discussed according to the results of dehydroxylation and structural distortion.

1. Introduction

Coal, biomass and solid waste contain Na, K, Pb, Cd and other alkali/heavy metals. During combustion, gasification and other processes, these semi-volatile metals are prone to cause the problems such as boiler slagging, ash deposition of heat transfer area, high-temperature corrosion, and emissions of heavy metals and ultra-fine particles [1,2,3,4,5]. Kaolinite can adsorb alkali/heavy metal vapor at high temperatures, and then be captured by dust removal equipment [6,7,8]. Therefore, the problems mentioned above can be solved by kaolinite addition into the furnace.
The hydroxyl groups in kaolinite exist in the form of inner-surface hydroxyl groups and inner hydroxyl groups. They are written as H2O in the chemical formula of kaolinite (Al2O3·2SiO2·2H2O) [9,10]. At high temperatures, these hydroxyl groups are divorced from kaolinite crystal followed by the significant structural distortions. These changes can be described by the following equations [8,11,12]:
At about 450 °C, kaolinite starts to dehydroxylate and transform to meta-kaolinite:
Al2O3·2SiO2·2H2O → Al2O3·2SiO2 + 2H2O
At about 925 °C, meta-kaolinite starts to transform to Al-Si spinel and amorphous silica:
2(Al2O3·2SiO2) → 2Al2O3·3SiO2 + SiO2 (amorphous)
At about 1050 °C, the aluminum silicon spinel starts to transform to mullite and cristobalite:
3(2Al2O3·3SiO2) → 2(3Al2O3·2SiO2) + 5SiO2 (cristobalite)
At about 1200 °C, amorphous silica starts to transform to cristobalite:
SiO2 (amorphous) → SiO2 (cristobalite)
The furnace temperatures for coal combustion and waste incineration are 1200–1500 °C and 800–1200 °C respectively, indicating that kaolinite would change to meta-kaolinite and even mullite in the furnace according to the transformation temperature mentioned above [3]. According to the theoretical calculation, Wang et al. found that the structural distortion of kaolinite for dehydroxylation has a decisive influence on its performance of metal vapor adsorption [9,10]. The hydroxyl groups were considered to hinder the adsorption of the PbO molecule and the CdO molecule. When the hydroxyl groups were removed, the exposed Al surface had a strong attraction to these two molecules. In contrast, the hydroxyl groups were necessary for the adsorption of the PbCl2 molecule and the CdCl2 molecule, because the unstable chloride adsorption can become the stable oxide adsorption through the participation of hydroxyl groups. In addition, mullite is generally considered to be inert, so its metal vapor adsorption capacity is weak. Therefore, the high-temperature adsorption characteristics of kaolinite are closely related to its dehydroxylation and structural distortion at high temperatures. Comprehending the structural distortion characteristics of kaolinite in the furnace is the vital basis to understand the adsorption behaviors in the furnace.
The thermal behavior of kaolinite has been investigated a lot from the perspective of kaolin processing which mainly uses rotary kiln calcination [11,13,14,15]. Therefore, the previous results are mostly in the view of soak calcination with the residence time of several hours. However, when kaolinite is used as a high-temperature sorbent to capture metal vapor, the process it undergoes in the furnace is flash calcination with the residence time of several seconds [4,16,17]. The kinetics control should be much more important in flash calcination than that in soak calcination. Thus, the conclusions from most previous researchers are not applicable to the in-furnace process of kaolinite as a high-temperature sorbent. Some researchers investigated flash calcination of kaolinite as a new technology of kaolin processing and focused on the material properties of products such as pozzolanic properties, thermal properties, density and so on [13,18,19]. Unfortunately, these conclusions did not reflect the dehydroxylation and structural distortion of kaolinite in the furnace completely.
In this paper, kaolinite injection into the furnace was simulated by the drop tube furnace experiments with the residence time of 0.5–3 s and temperatures of 800–1300 °C. Firstly, the dehydroxylation characteristics of kaolinite were analyzed according to the dehydroxylation rates of products obtained by thermogravimetric (TG) analysis. Secondly, the kinetics model of kaolinite dehydroxylation was established. Next, the structural distortion characteristics were investigated by X-ray diffraction (XRD), infrared spectroscopy (FTIR) as well as nuclear magnetic resonance (NMR) analyses. Finally, the metal vapor adsorption ability of kaolinite in the furnace was discussed according to the effect of dehydroxylation and structural distortion characteristics.

2. Materials and Methods

2.1. Experimental Material: Kaolinite

Kaolinite was purchased from Shanghai Fengxian Fengcheng Reagent Factory. The main components were determined by X-ray fluorescence spectroscopy (XRF) and were expressed in the form of oxides, as shown in Table 1. Because the XRF test requires the sample calcination at 900 °C, resulting in the removal of all the hydroxyl groups in kaolinite, the components did not conclude H2O. The impurities were potassium, sulfur, titanium, iron, magnesium, phosphorus and so on. In addition, quartz is the main impurity in kaolinite usually. If Al2O3 was not the impurity, the content of SiO2 should be 52% according to the chemical formula of Al2O3·2SiO2. Quartz content was considered as 1% in kaolinite by comparing with the SiO2 content of 53% in Table 1. Considering the hydroxyl groups not included, the purity of kaolinite used should be higher than 98%.
The particle size of kaolinite ranged from 0.70 μm to 20.00 μm, as shown in Figure 1. There were 90% of the kaolin smaller than 8.99 μm, 50% smaller than 2.76 μm and only 10% smaller than 1.18 μm. Therefore, kaolinite used in this paper met the requirements for the in-furnace sorbent usage [16,20].

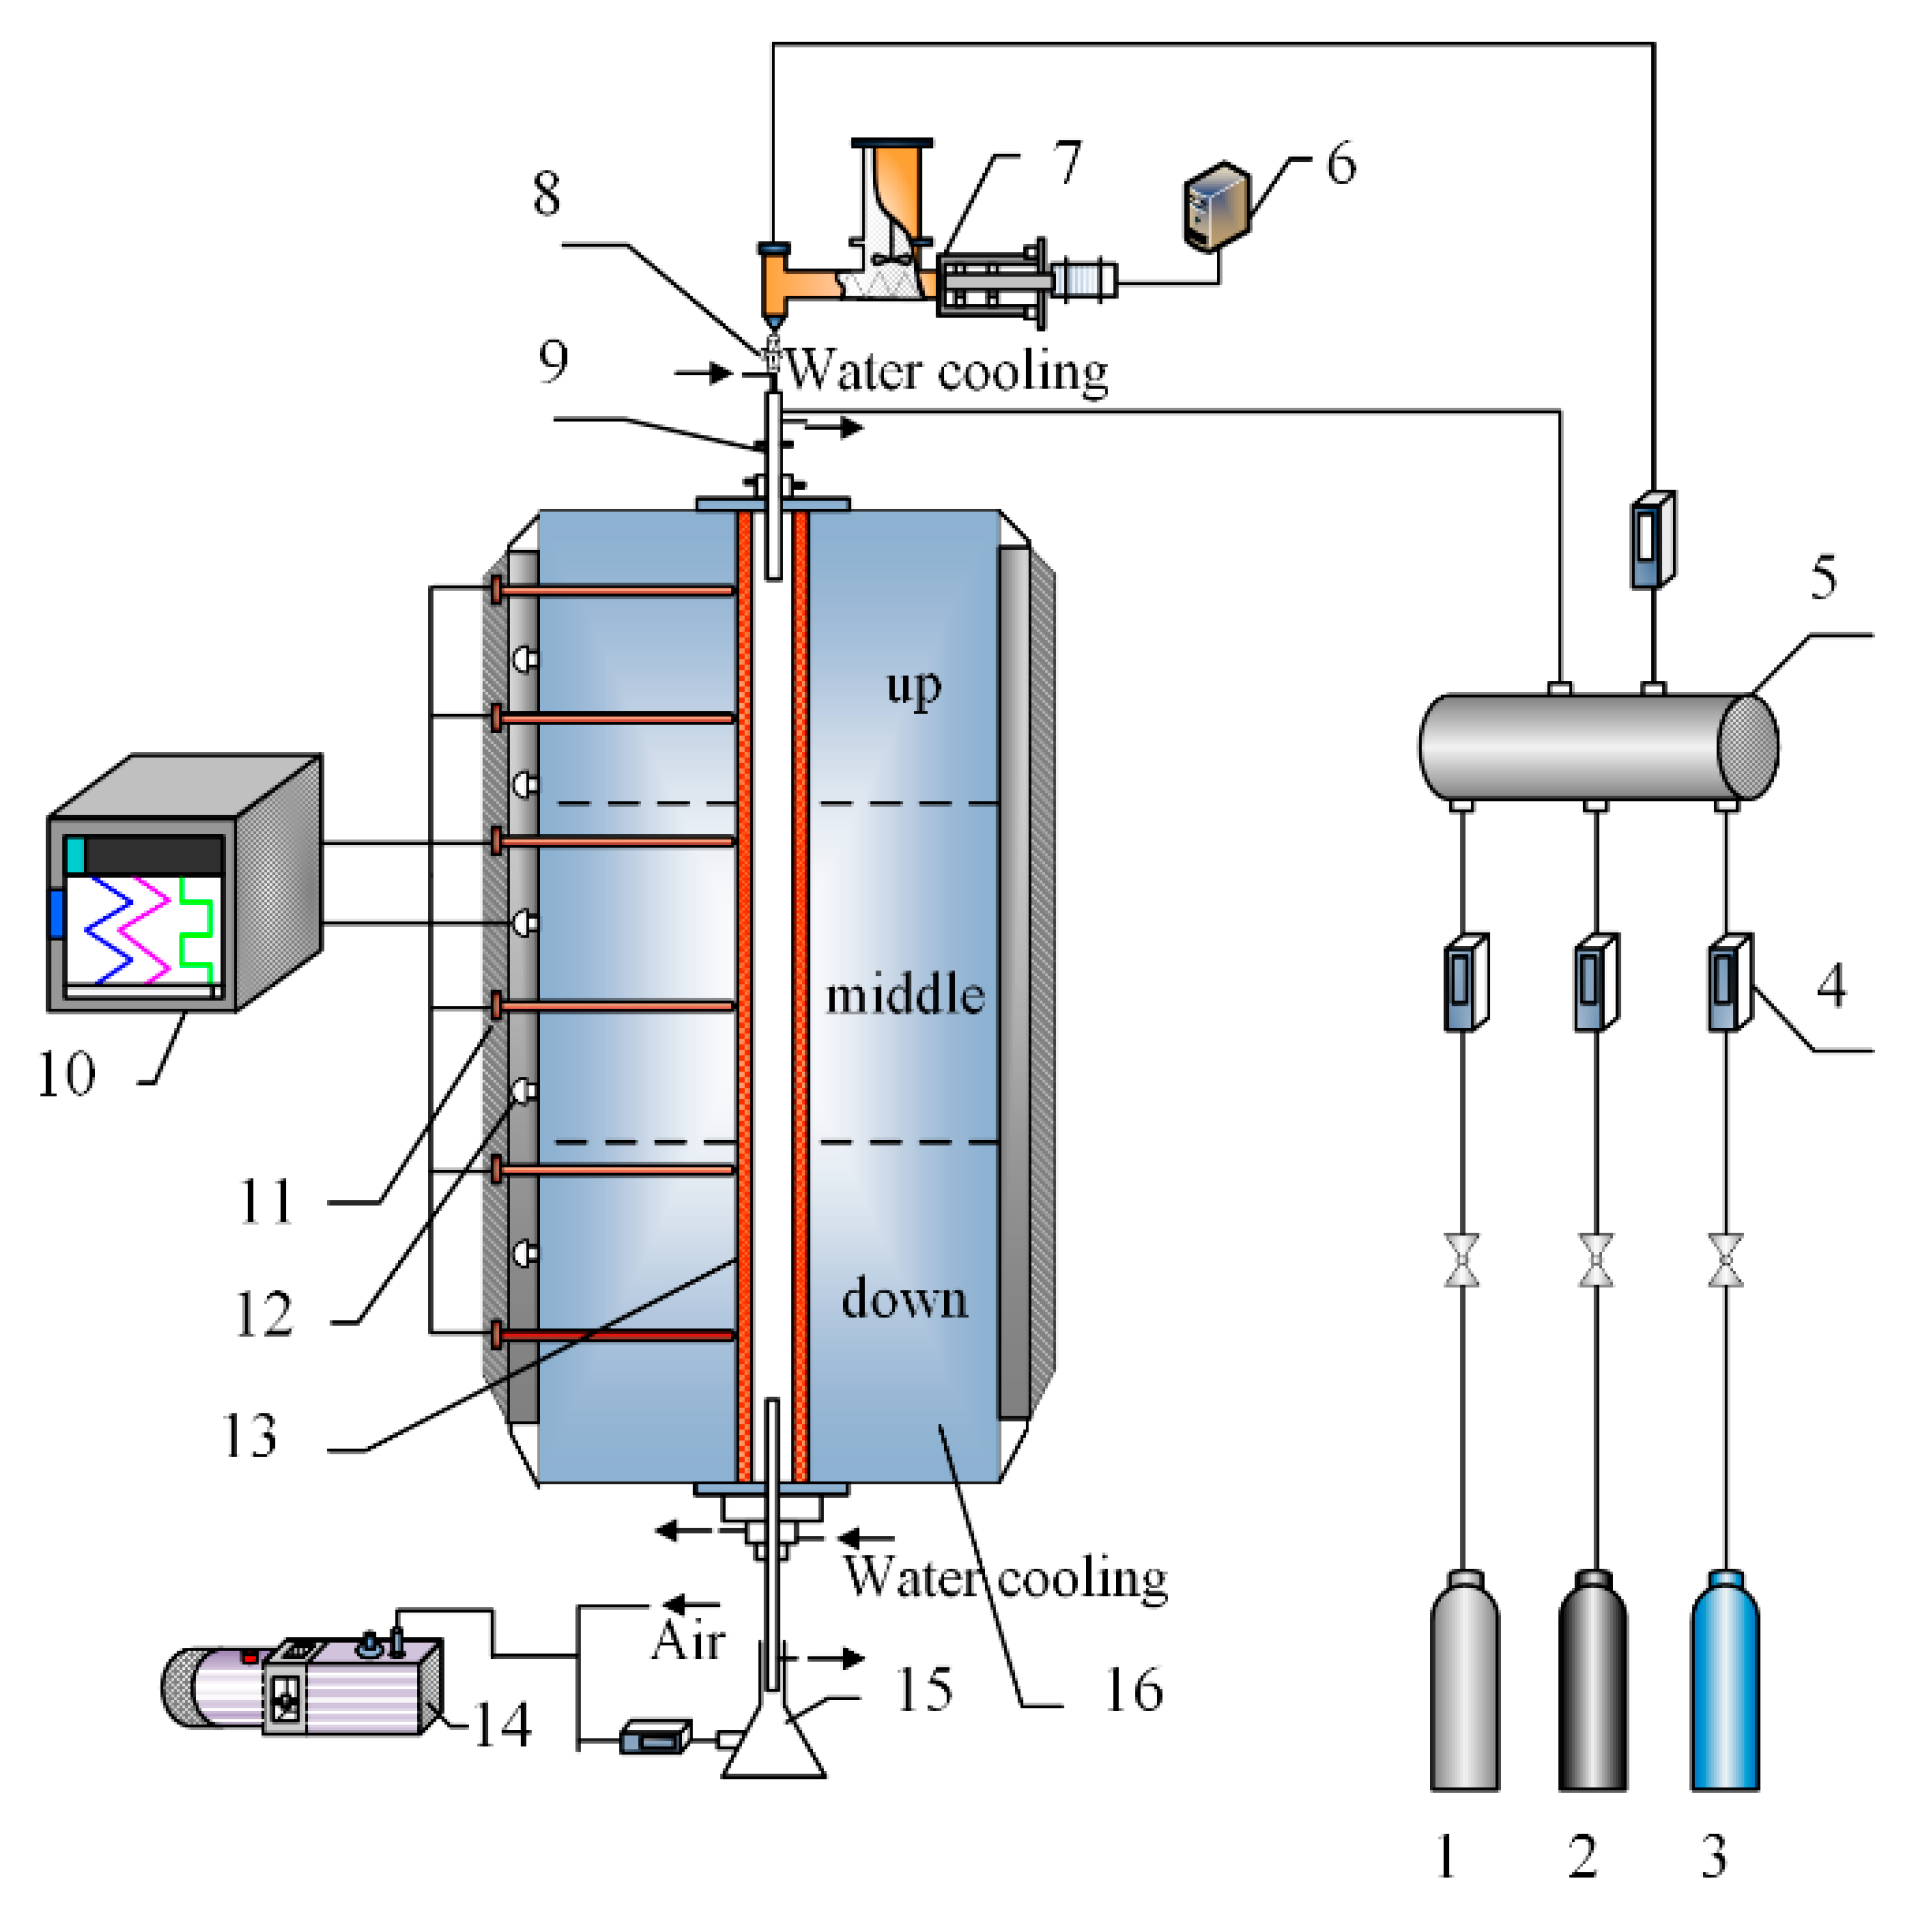
2.2. Exprimental Setup: Drop Tube Furnace

Kaolinite injection into the furnace was simulated by using a drop tube furnace system, as shown in Figure 2. The kaolinite powder was fed by a micro-screw feeder in the rate of 1.5 g/min and was injected into the furnace by an ejector. The carrier gas was supplied by the cylinder gas. The details of the choice of carrier gas is shown in Section 2.6. The reaction tube was made of quartz with the inner diameter of 44 mm and the heating length of 1740 mm. At the bottom of the reaction tube, there was an inertia separation bucket with glass fiber filter in the pumping outlet to sample the flash-calcined products. The residence time of the kaolinite in the heating zone was controlled in 0.5 s to 3 s by adjusting the gas flow rate. The temperature in furnace was controlled in the range from 800 °C to 1300 °C by the Proportional-Integral-Differential (PID) thermostat.

2.3. Dehydroxylation Fraction Determination of Products

The dehydroxylation fractions of the flash-calcined products were determined by thermogravimetry-differential scanning calorimeter (TG-DCS) analysis. The typical TG-DSC curve of the product is shown in Figure 3. The temperature was kept at 150 °C for 30 min to remove adsorbed water molecules. The initial dehydroxylation temperature of the kaolinite and the products was around 160 °C, different from the 445 °C reported commonly, but in agreement with the pre-dehydroxylation temperature reported by Ilić et al [21]. The maximum temperature up to 1200 °C ensured the complete removal of hydroxyl groups. The dehydroxylation fraction (θ) was calculated as Equation (5) to characterize the degree of dehydroxylation of the products.
θ = 1 δ a δ b × 100 %
where, δa is mass fraction of the residual hydroxyl groups in the product while δb is mass fraction of all the hydroxyl groups in the kaolinite used in this paper. δb should be 13.96% theoretically but we used the experimental value of 14.04%, as determined by TG analysis. The volatilization of impurities is the main reason for this error which has been analyzed in the Supplementary Materials.

2.4. Kinetics Description of Kaolinte Dehydroxylation

It is assumed that the dehydroxylation rate of kaolinite was only related to dehydroxylation fraction (α) and temperature (T) which were independent to each other. Thus, the dehydroxylation rate can be described as Equation (6):
d α d t = f ( α ) k ( T )
0 α d α f ( α ) = 0 t k ( T ) d t
where, t is the residence time of kaolinite in the furnace. Let G ( α ) = 0 α d α f ( α ) . For the isothermal condition, Equation (7) can be simplified as Equation (8):
G ( α ) = k ( T ) t
k(T) can be obtained by the linear dependency between G(α) and t under the isothermal condition. It is called the primary linear fitting.
The relationship between k(T) and T can be described by Arrhenius law as Equation (9):
k ( T ) = A exp ( E R T )
where, A is the pre-exponential (frequency) factor, E is the apparent activation energy and R is the universal gas constant (8.314 J·K−1·mol−1). Equation (10) can be obtained after the logarithmic processing on Equation (9):
ln k ( T ) = ln A E R T
E and A can be obtained according to the linear relationship between lnk(T) and 1/T. It is called the secondary linear fitting.

2.5. Structural Characterization Methods

The crystal structure transformation of kaolinite was analyzed by XRD. The surface functional group changes of kaolinite were analyzed by FTIR. The coordination changes of the Al atom and the Si atom in kaolinite were analyzed by NMR. The Hinckley index (HI) was calculated as Equation (11) to characterize the crystallinity of the kaolinite and the products [22,23].
HI = A + B A t
where, values representing individual parameters can be assessed from the XRD pattern according to Figure 4. The HI index of the kaolinite used was 1.05.

2.6. Choice of Carrier Gas

In the furnace, the main components of flue gas are oxygen, nitrogen and carbon dioxide. Thus, these three gases were used as a carrier gas separately to investigate the effect of atmosphere on the dehydroxylation and the structure distortion. The results from the detection of the products by TG-DSC, XRD, FTIR and NMR indicated that the dehydroxylation fraction, crystal structure, the surface functional groups and the coordination of Al and Si were almost the same in three atmospheres. Therefore, it is considered that the atmosphere (oxygen, nitrogen and carbon dioxide) has little effect in the experiments. In this paper, nitrogen was chosen as the carrier gas.

3. Results

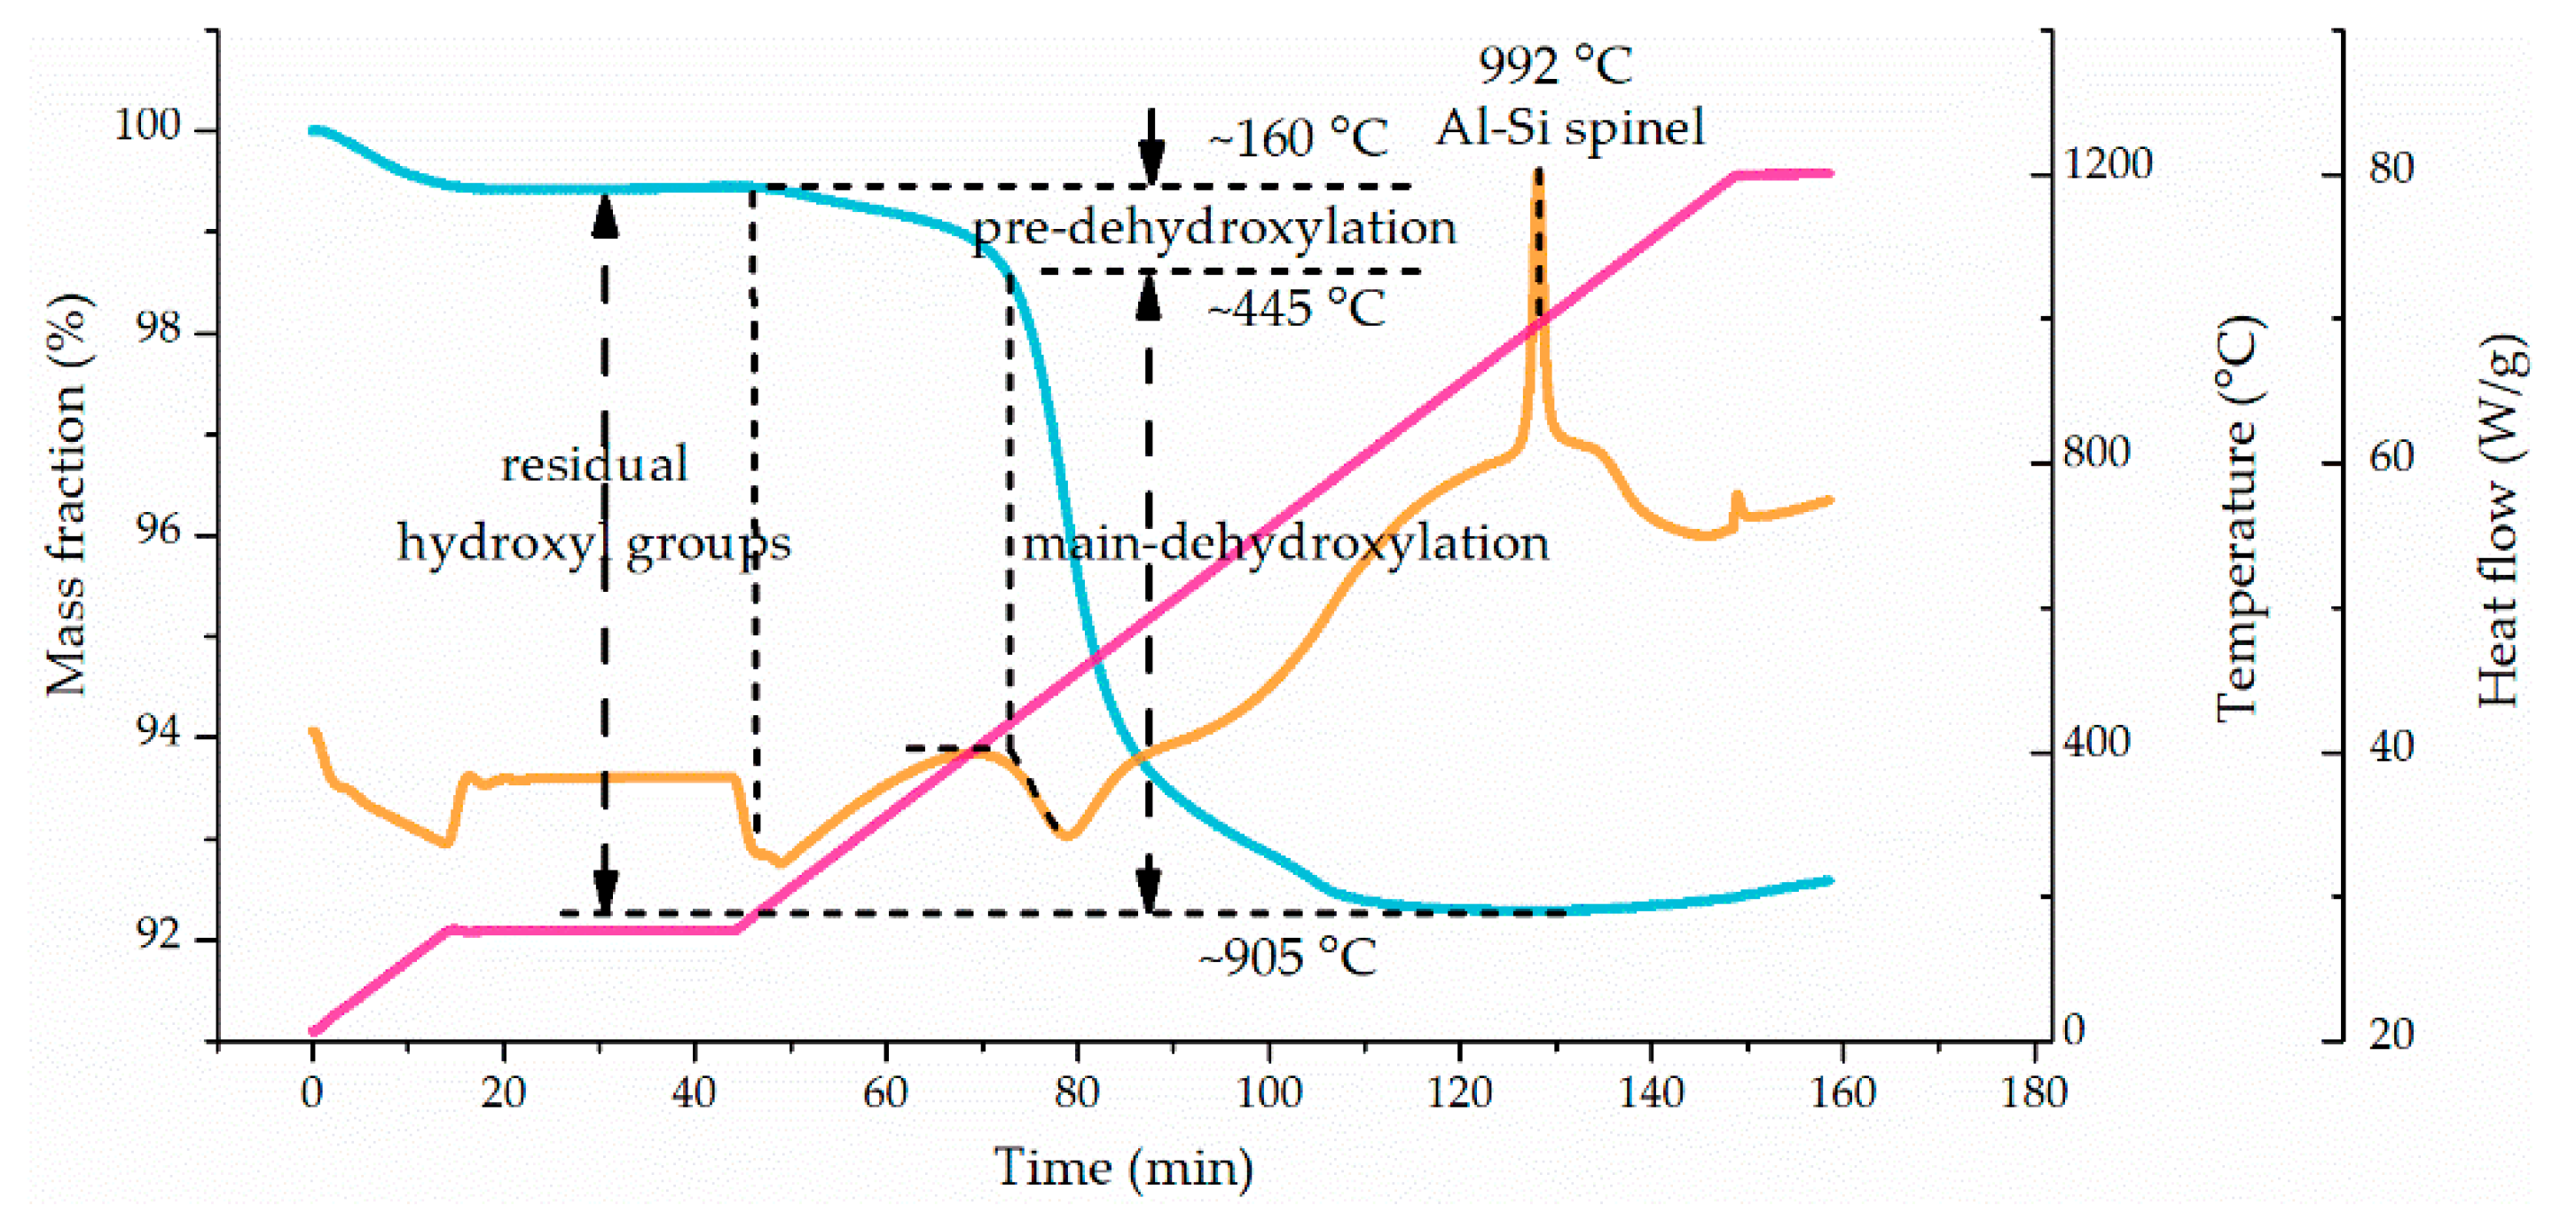
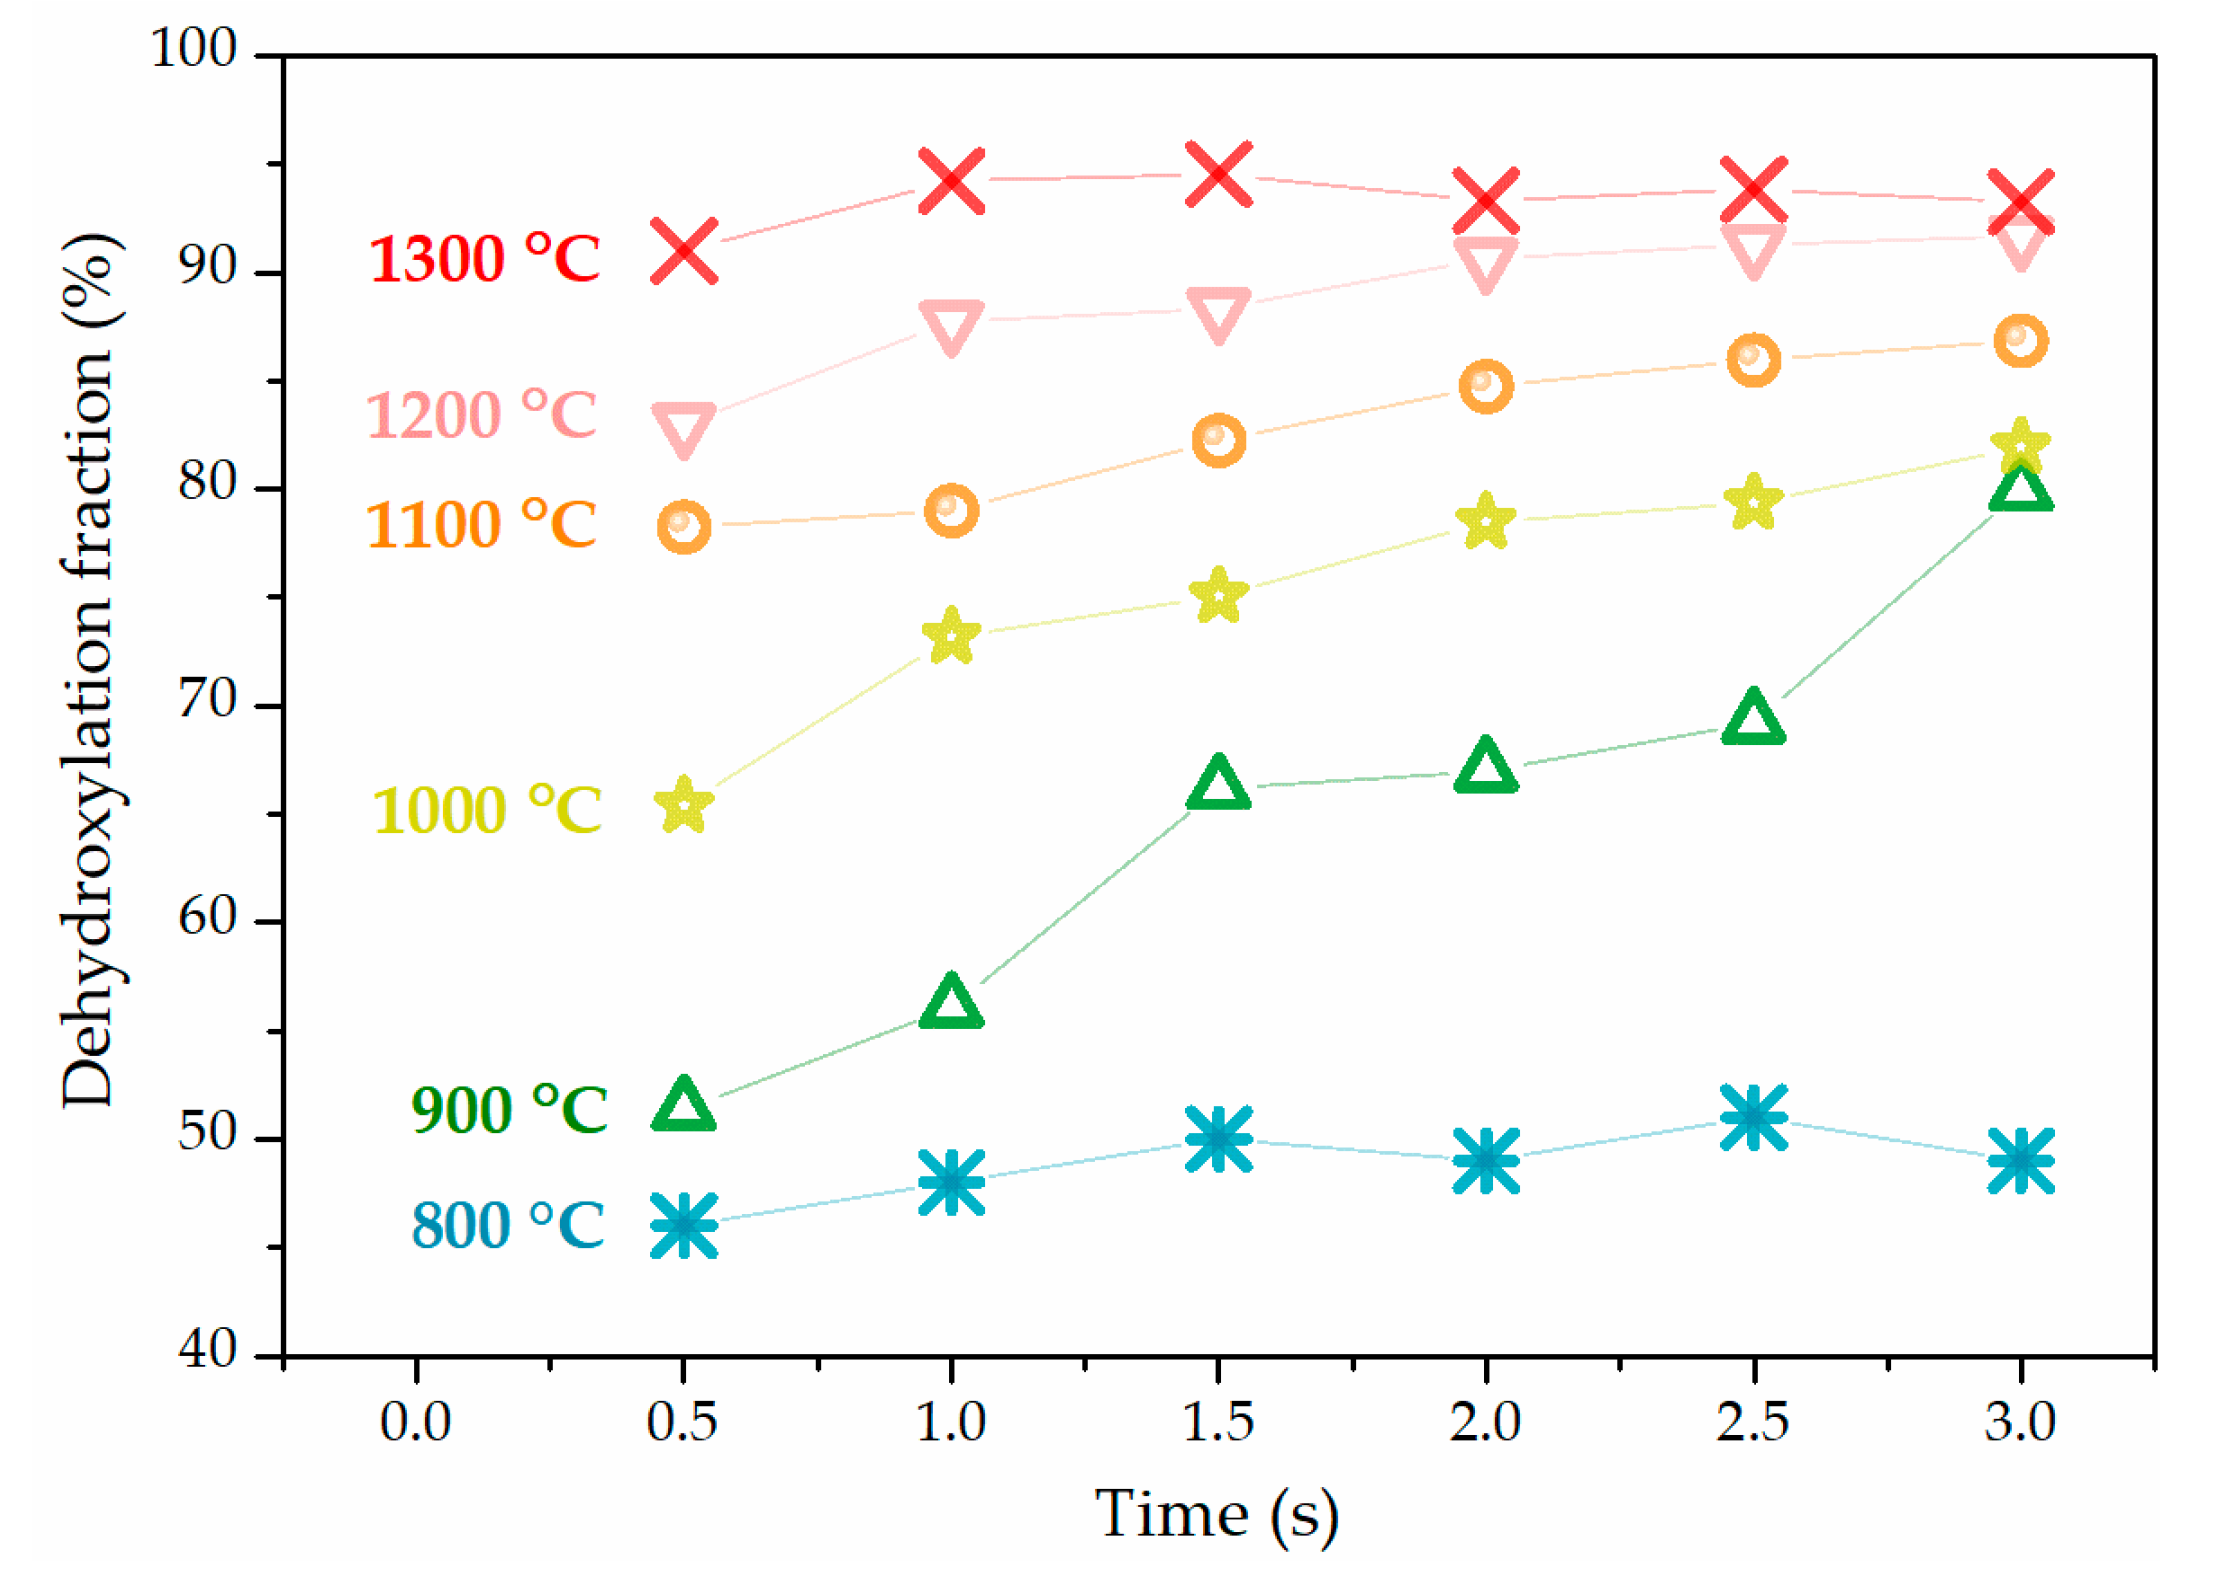
3.1. Dehydroxylation Characteristics of Kaolinite

The changes of the dehydroxylation fraction of flash-calcined products with temperatures and residence time are shown in Figure 5. The dehydroxylation fraction increased from less than 50% to higher than 90% with the increase of temperature from 800 °C to 1300 °C. However, residence time showed different effects on dehydroxylation from temperature. The dehydroxylation fraction had no obvious change with residence time at 800 °C and at 1300 °C, but increased with residence time at 900–1200 °C. The rate of increase with residence time decreased with the rising temperatures, until no obvious increase with residence time at 1300 °C.

3.2. Kaolinite Dehydroxylation Kinetics

Because the dehydroxylation fraction was not sensitive to residence time at 800 °C and 1300 °C, kinetics was not considered to dominate the dehydroxylation process at these two temperatures. Consequently, the dehydroxylation data of 800 °C and 1300 °C were not involved in the kinetic analysis. There were 34 mechanism functions used for the primary linear fitting of the dehydroxylation data of 900–1200 °C according to Equation (8) [4,24,25]. The highest linear correlation coefficient was from the random nucleation and subsequent growth model of f(α) = (1/4)(1 − α)(−ln(1 − α))−3 and G(α) = (−ln(1 − α))4). The reaction rate constant k(T) at different temperatures was obtained as shown in Figure 6. The apparent activation energy and pre-exponential factor were obtained (E = 140 kJ/mol, A = 1.32 × 10⁶ s−1) by the secondary linear fitting according to Equation (10). Consequently, the dehydroxylation rate of kaolinite during flash calcination can be described as Equation (12).
d α d t = 3.3 × 10 5 ( 1 α ) [ ln ( 1 α ) ] 3 e ( 1.68 × 10 4 T )

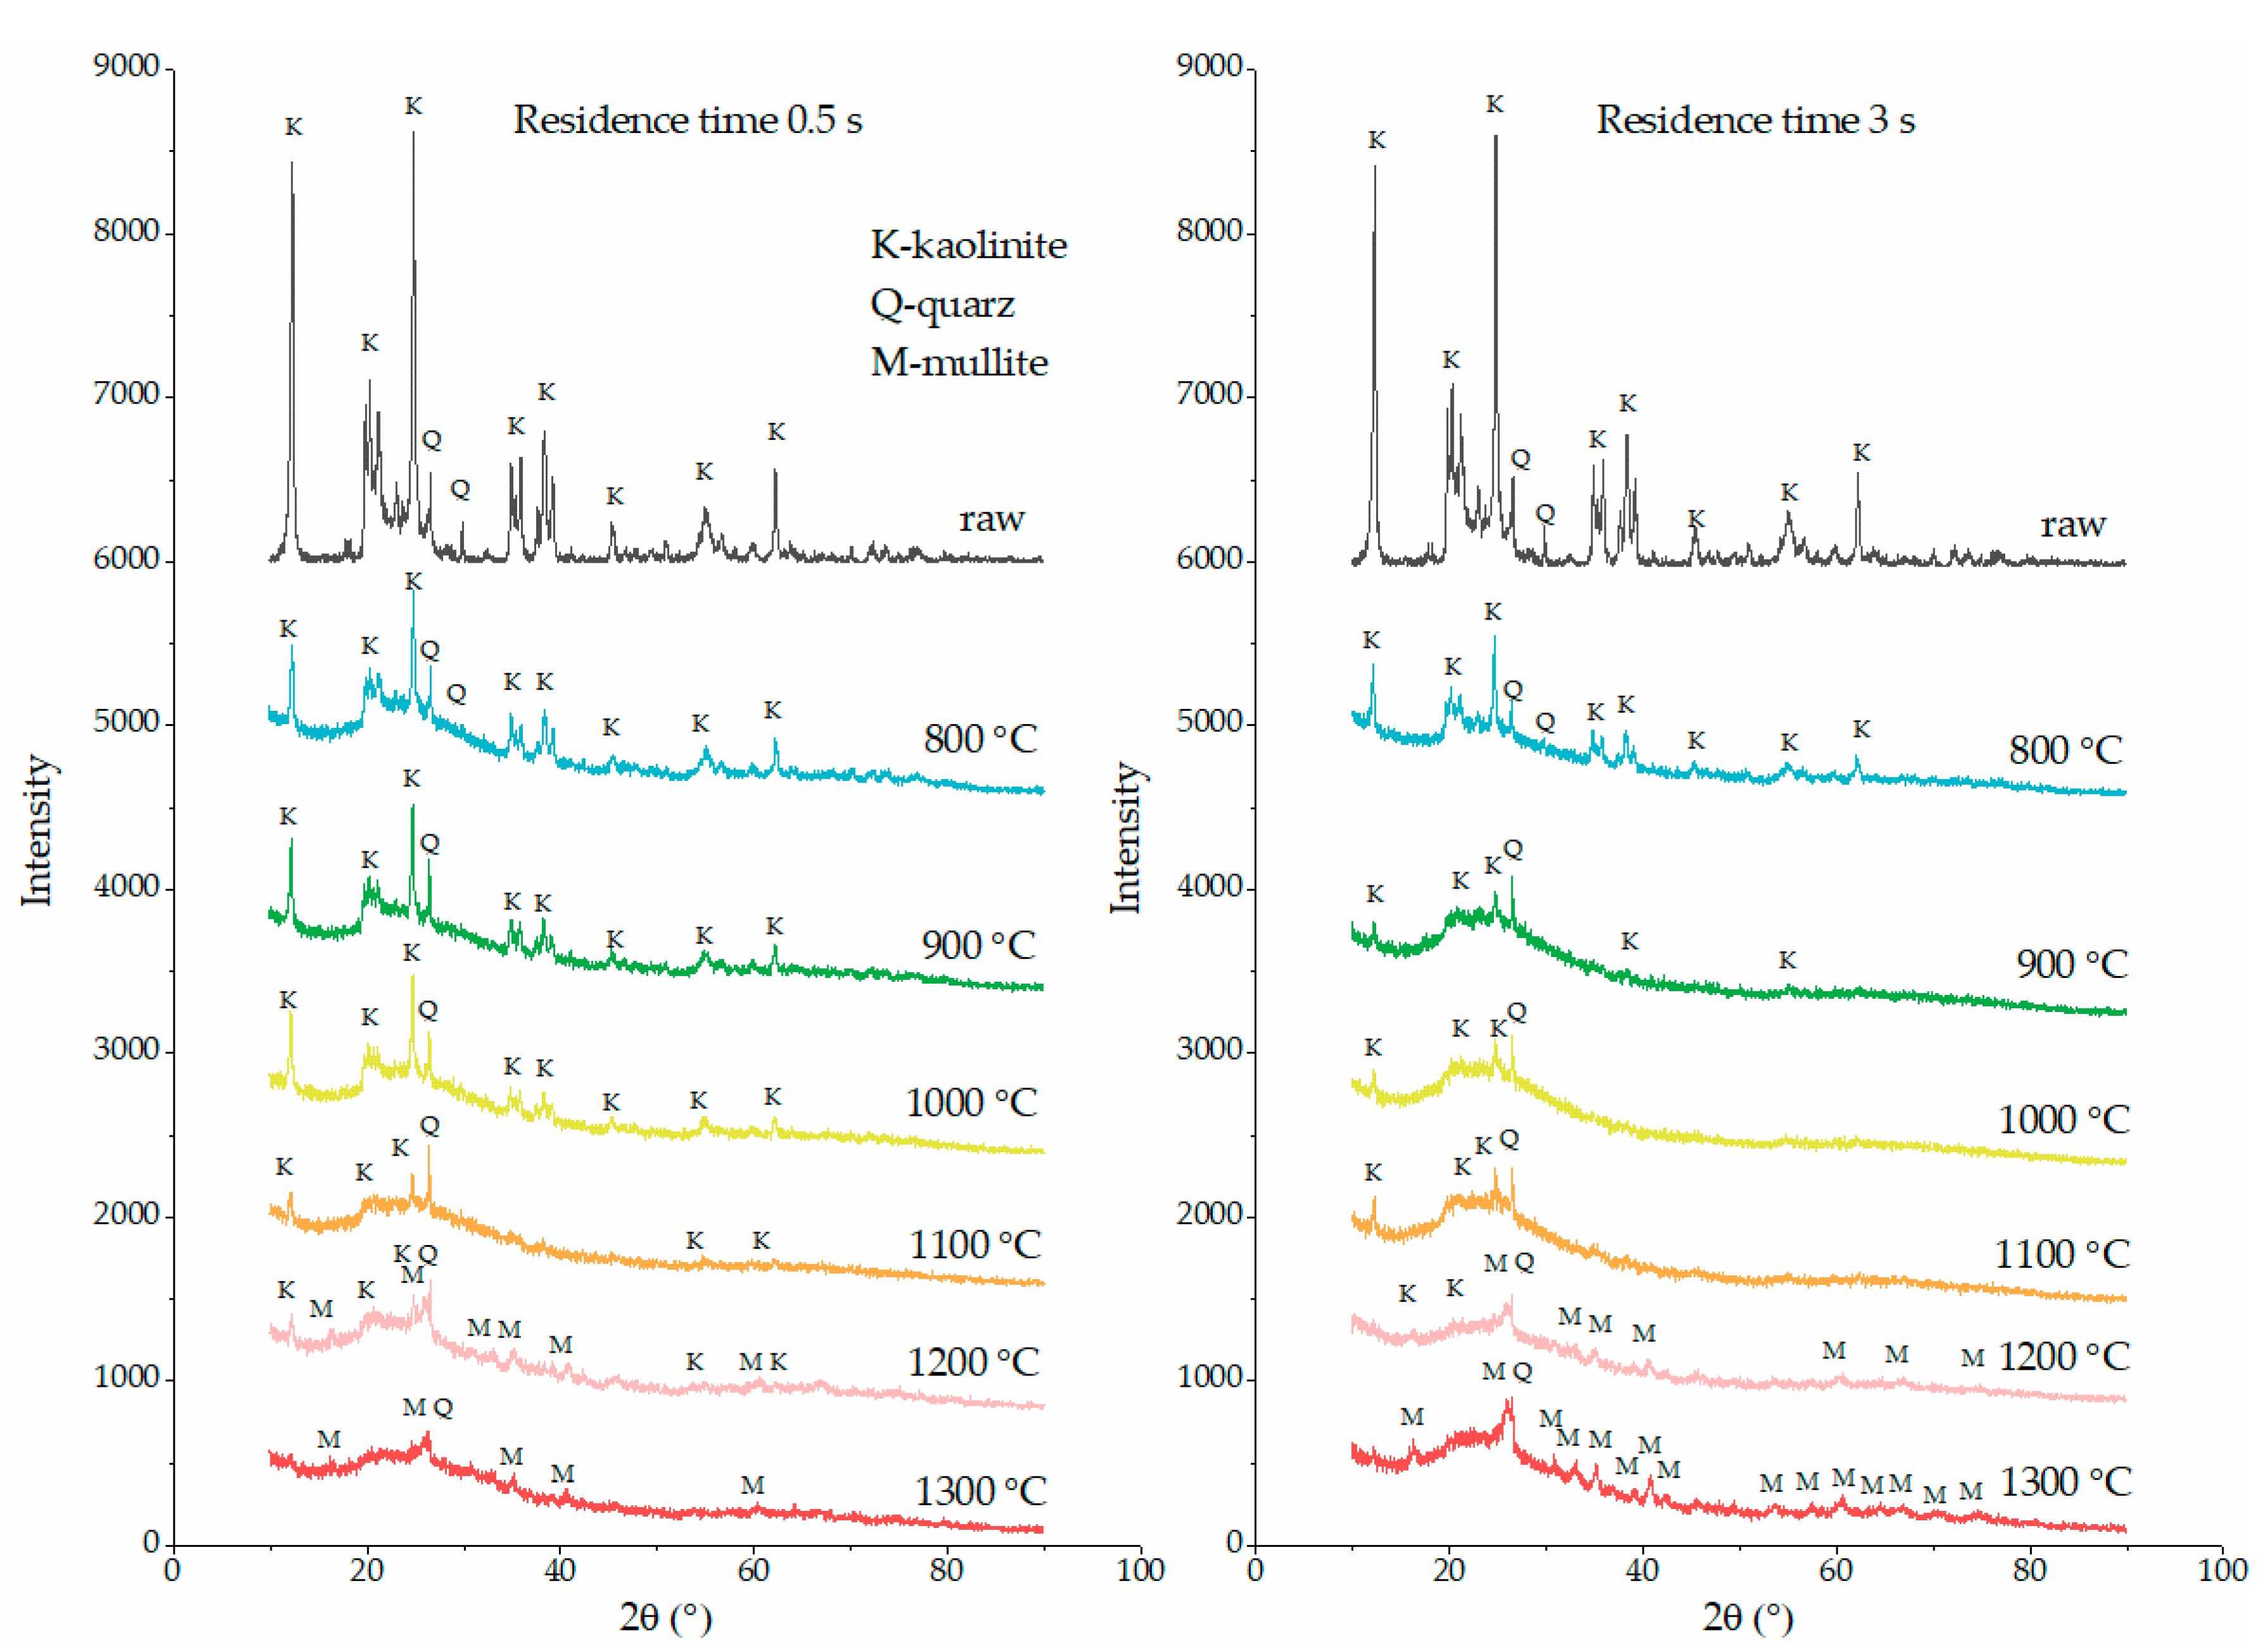
3.3. Kaolinite Crystal Phase Transition

The XRD detection of the flash-calcined products with the shortest and the longest residence time (0.5 s and 3 s) was performed to obtain the crystal phase transition of kaolinite during flash calcination. The XRD patterns are shown in Figure 7. Quartz was found as the main impurity in the raw kaolinite in agreement with the deduction resulting from XRF analysis.
The baselines of XRD patterns of flash-calcined products are not as straight as those of raw kaolinite, indicating the presence of amorphous phase species. However, the diffraction peaks of kaolinite are still preserved for the products at 800 °C and higher temperatures. As the temperature rose from 800 °C to 1200 °C, the crystal phase of kaolinite still remained in the products although the intensity of the diffraction peaks decreased gradually. When the temperature rose up to 1300 °C, all the diffraction peaks of kaolinite disappeared, indicating the removal of the crystal phase of kaolinite. Significantly, the crystal phase of mullite appeared at 1200 °C during flash calcination, 200 °C higher than the traditionally considered temperature of mullite formation (around 1000 °C) during soak calcination [11]. These descriptions are suitable for both the case of 0.5 s and the case of 3 s. The difference is that the longer residence time caused the weaker diffraction intensity of kaolinite and the stronger diffraction intensity of mullite. The diffraction peaks of kaolinite at 900 °C in the case of 3 s is as weak as that at 1100 °C in the case of 0.5 s. The diffraction peaks of kaolinite at 1200 °C in the case of 3 s are almost vanished, while the diffraction peaks of mullite at 1300 °C in the case of 3 s are much stronger than that in the case of 0.5 s.

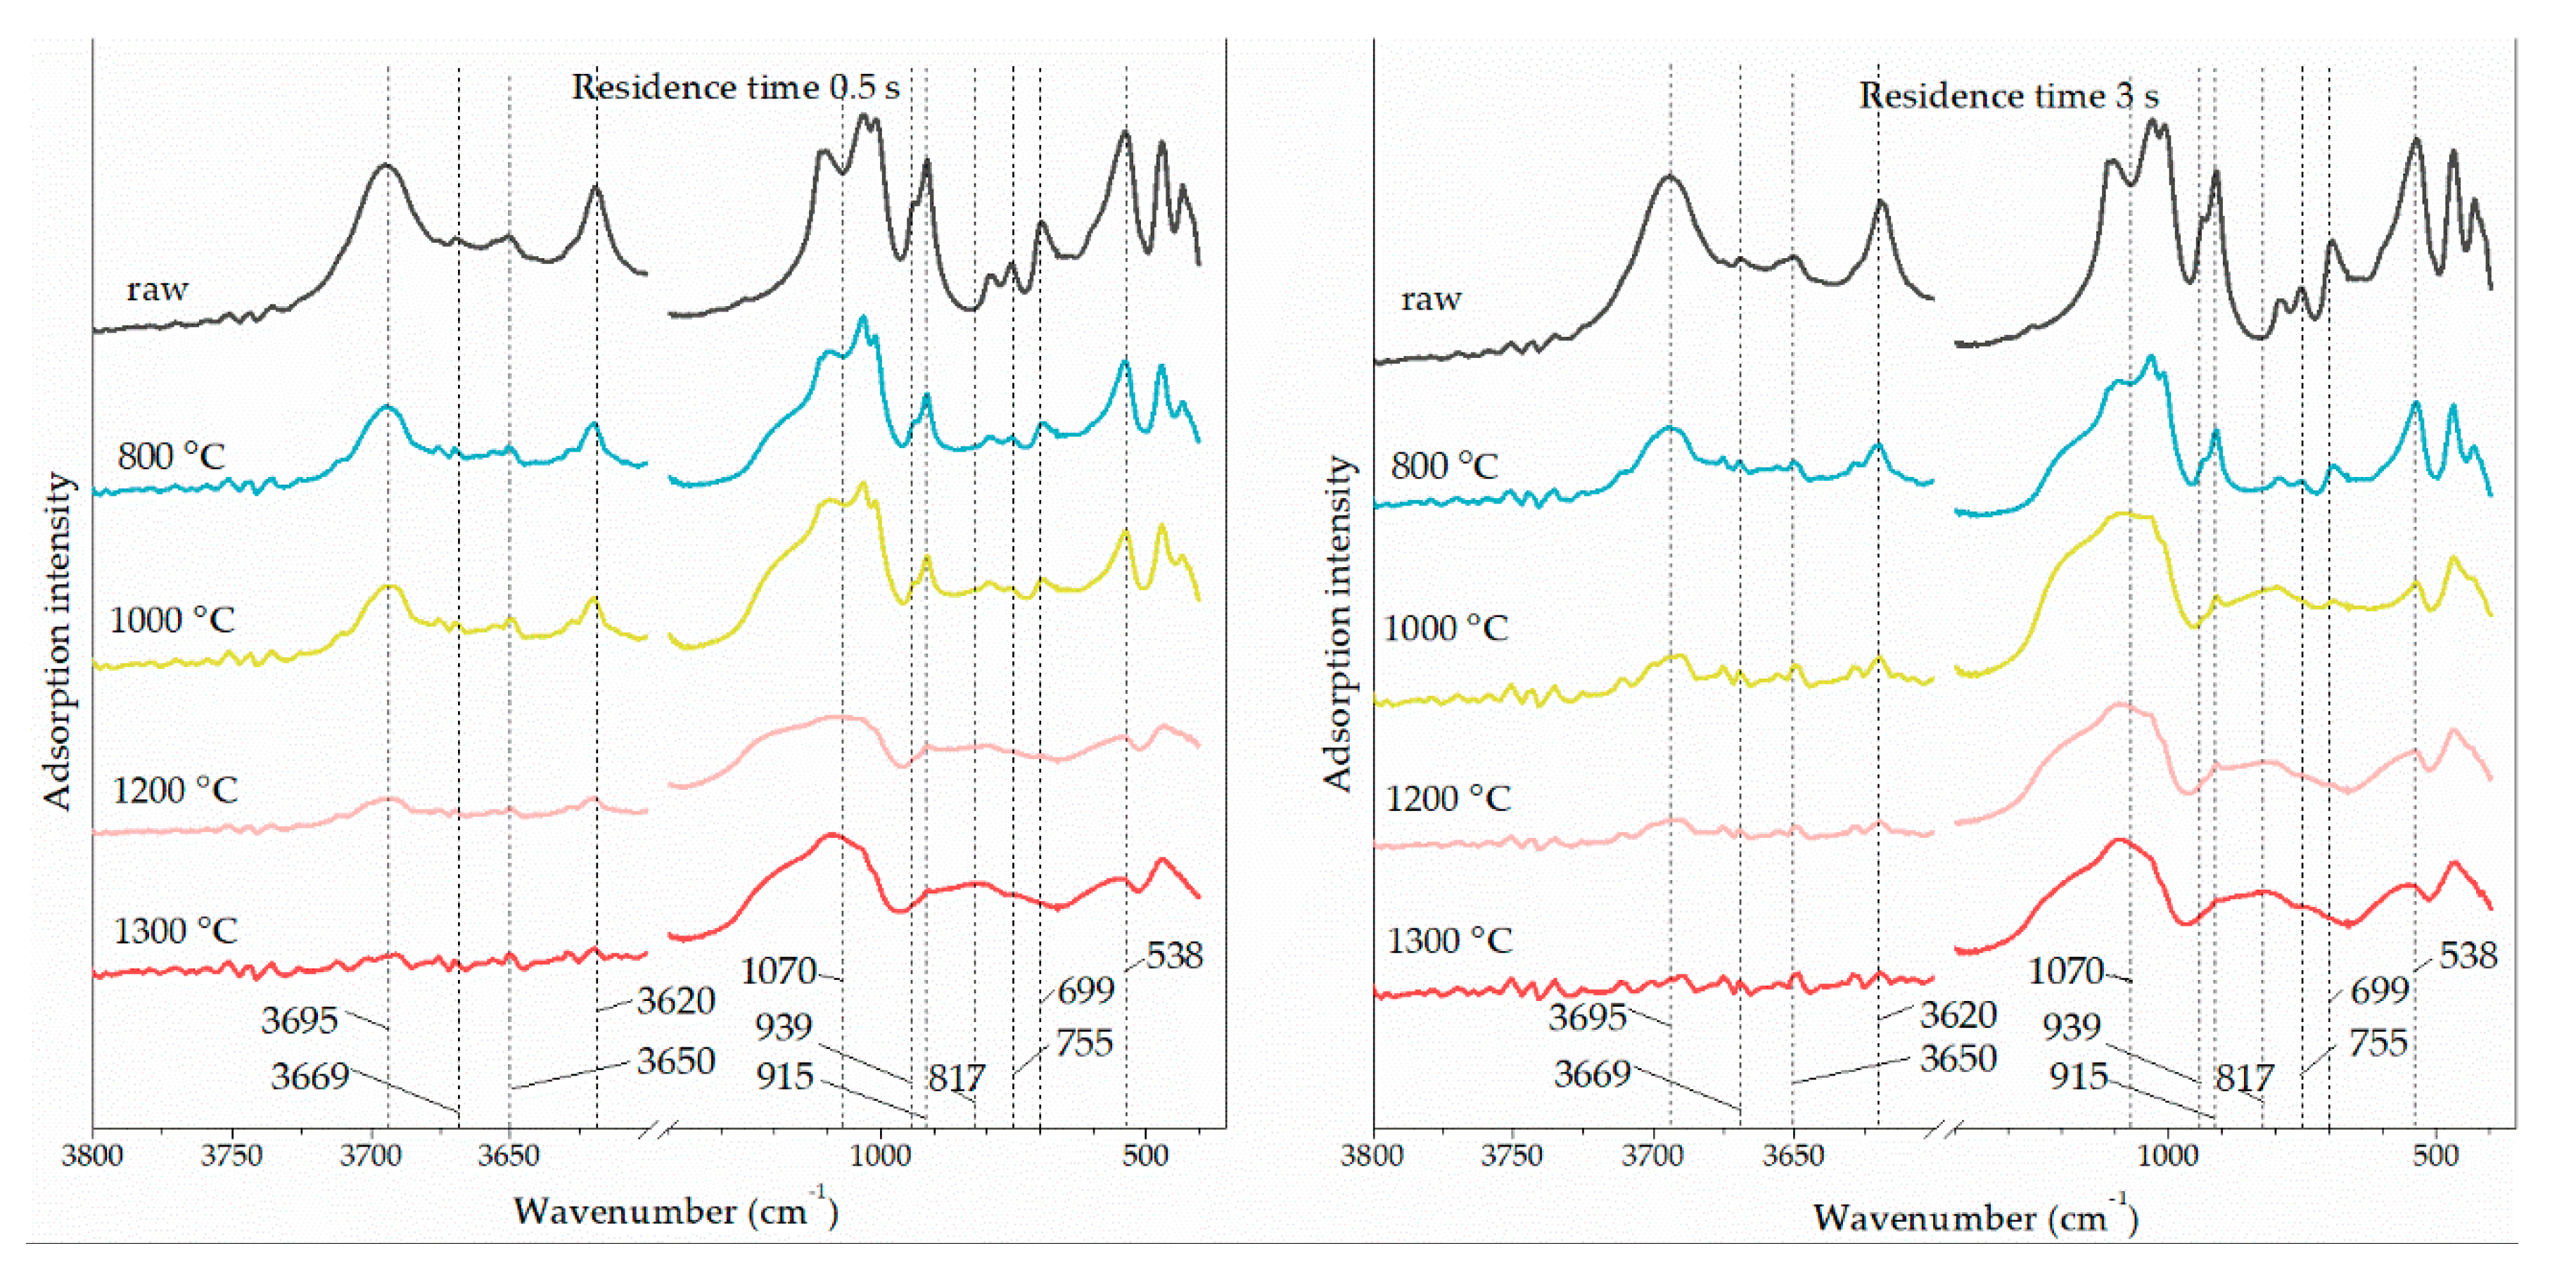
3.4. Kaolinite Surface Functional Groups Change

The FTIR detection was performed on the flash-calcined products with the shortest and the longest residence time (0.5 s and 3 s) to obtain the surface functional groups change of kaolinite during flash calcination. The infrared spectra are shown in Figure 8. The correspondence between absorption band and surface functional group is shown in Table 2 [14,26]. In the case of 0.5 s, the signal of octahedral O-Al-OH decreased with the rising temperature and disappeared at 1200 °C while the signals of tetrahedral Al-O and meta-kaolinite appeared at 1200 °C. The signal of inner-surface –OH disappeared at 1200 °C while the signal of inner –OH remained at 1200 °C. It is consistent with the dehydroxylation sequence that inner-surface –OH appears first, and then inner –OH. The typical signal of meta-kaolinite appeared at 1200 °C, above which the signal of kaolinite dominated the adsorption peaks.

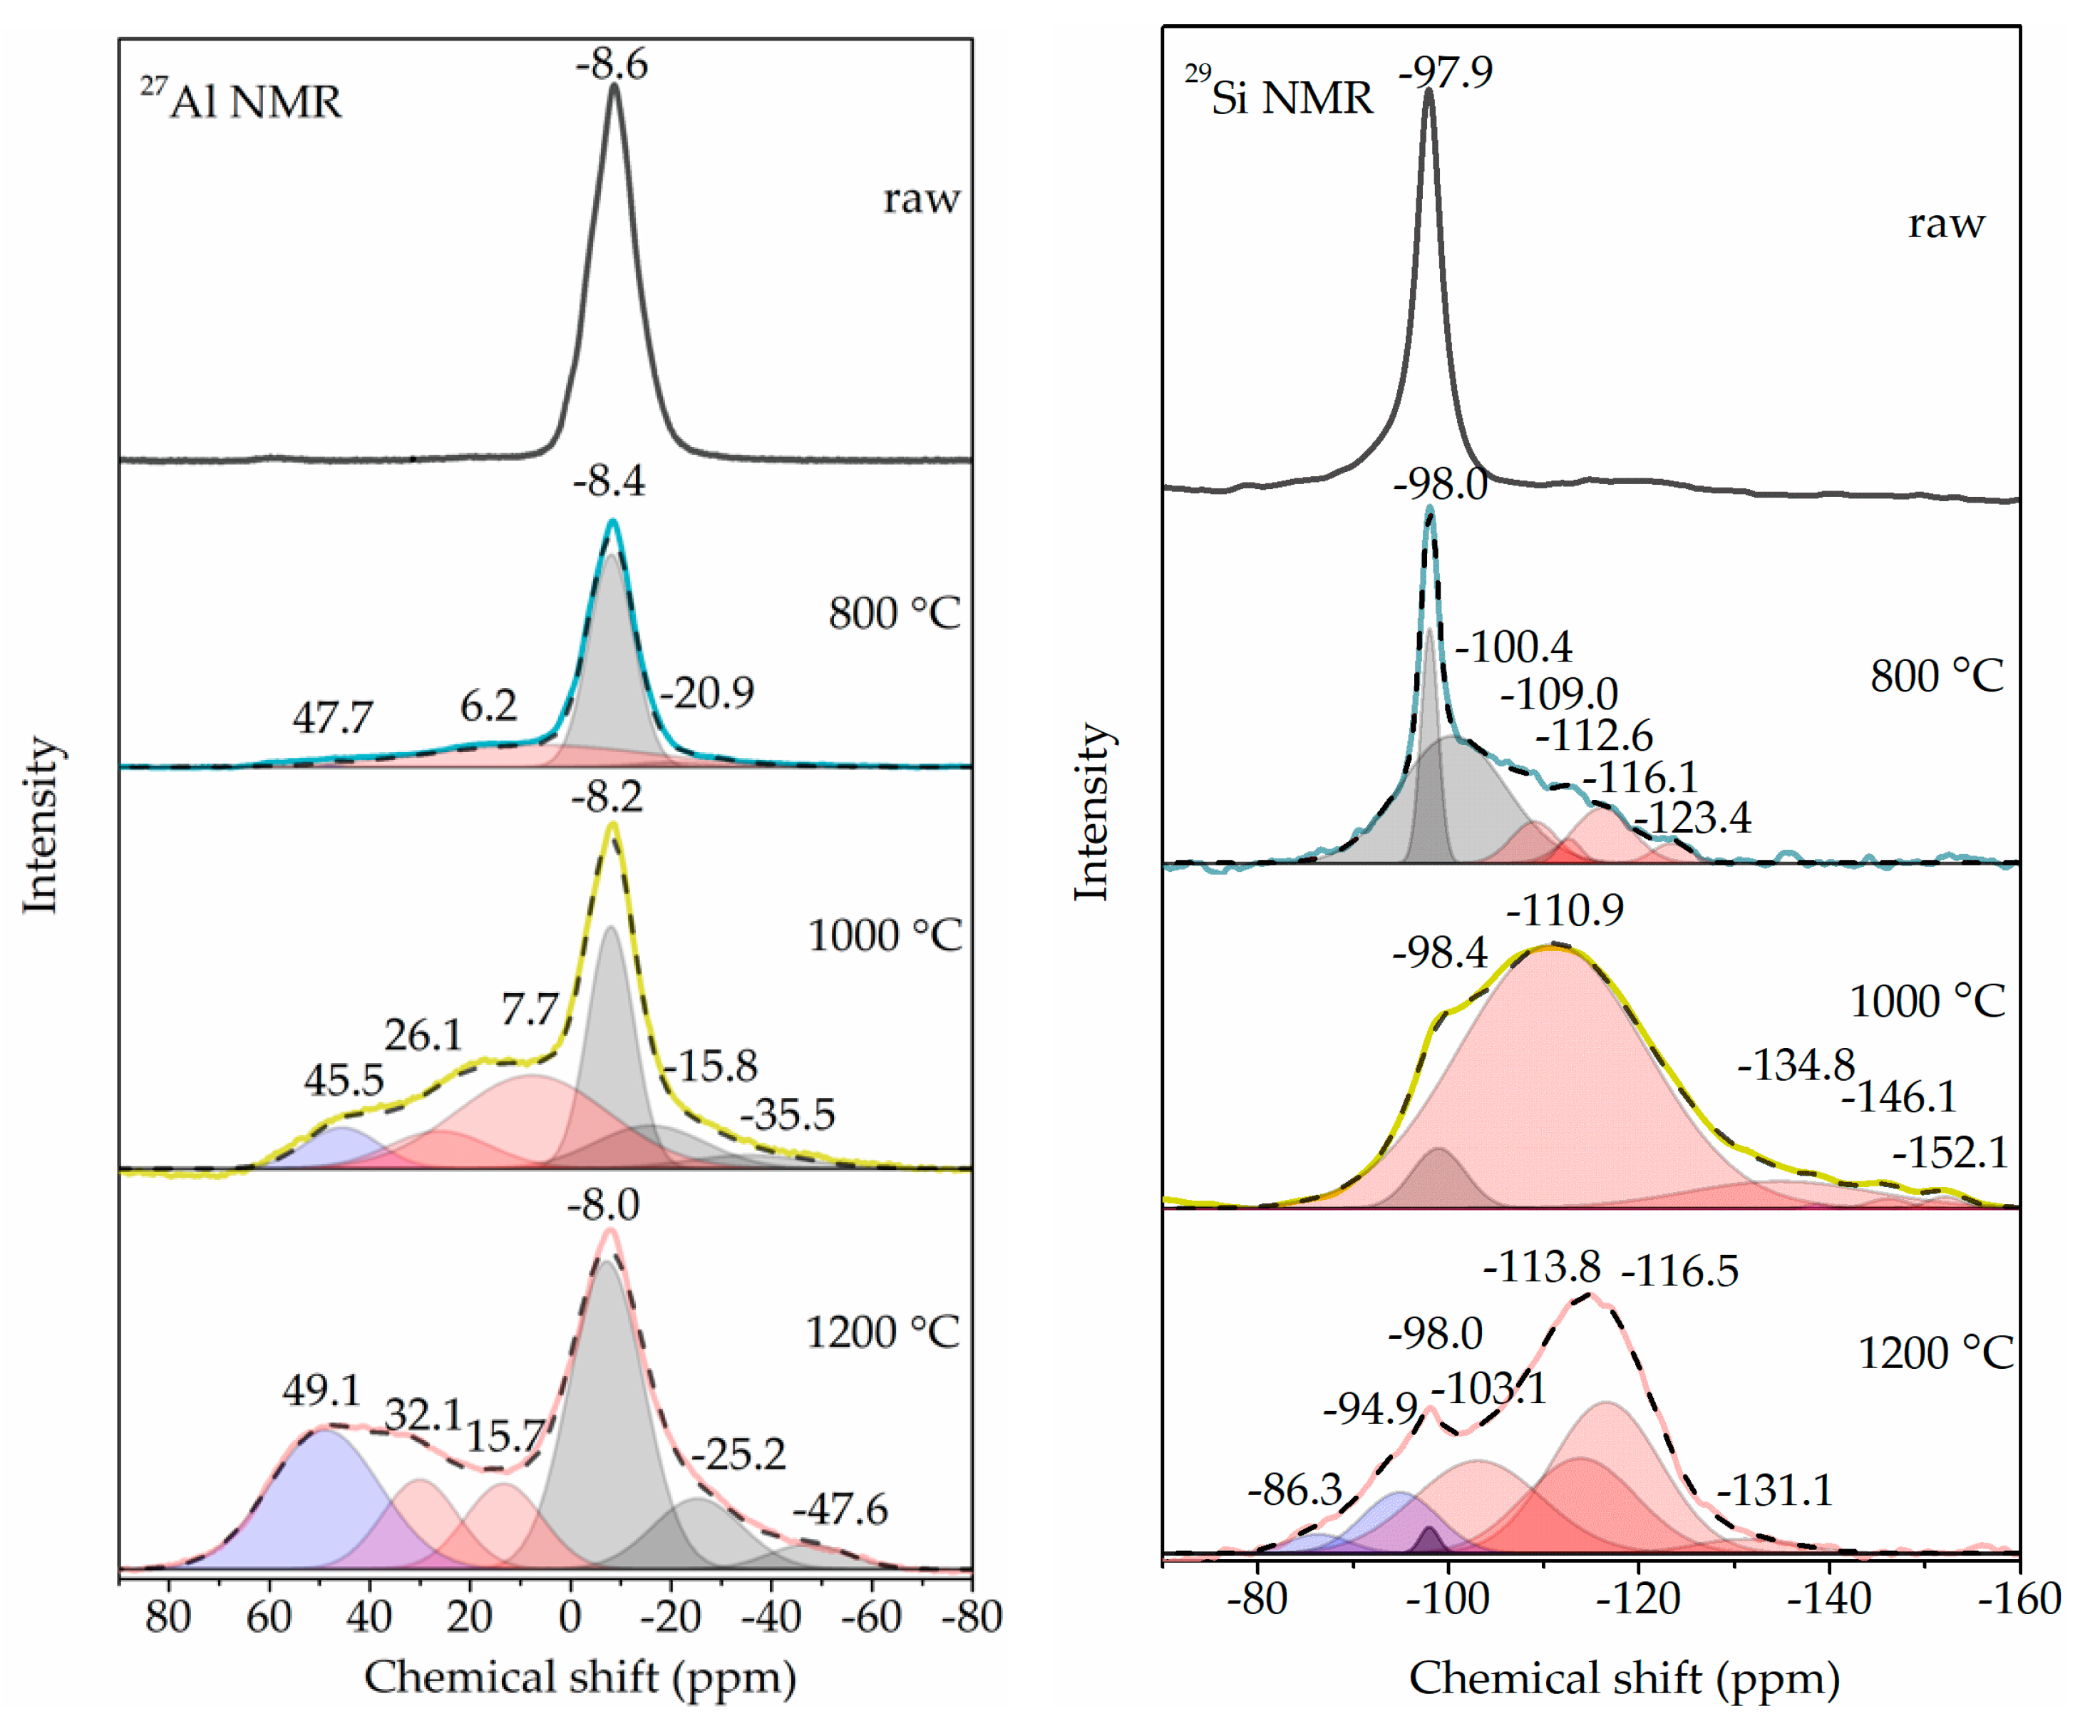
3.5. Coordination Change of Si and Al

The NMR detection was performed on the flash-calcined products with the longest residence time of 3 s to obtain the change of Si coordination and Al coordination of kaolinite during flash calcination. The NMR spectra were de-convoluted according to the Gaussian fitting method, as shown in Figure 9. For 27Al NMR, the resonances below 0 ppm, between 0 ppm and 40 ppm and above 40 ppm are considered as the signals derived from VI-coordinated Al, V-coordinated Al and IV-coordinated Al, respectively [27,28]. In the raw kaolinite, Al atoms were in the form of VI-coordinated Al with the single resonance at −8.6 ppm. After the flash calcination at 800 °C, the resonance shifted to −8.4 ppm, and three new resonances were found at 47.7 ppm representing IV-coordinated Al, 6.2 ppm representing V-coordinated Al, and −20.9 ppm representing IV-coordinated Al. When the flash calcination temperature rose up to 1000 °C and 1200 °C, the resonances representing VI-coordinated Al and V-coordinated Al shifted to the positions with higher absolute values, accompanying the formation of new resonances. It indicated the existence of various forms of VI-coordinated Al and V-coordinated Al.
The semi-quantitative fractions of Al coordination were calculated according to the areas of fitting peaks, as shown in Table 3. A part (33%) of VI-coordinated Al converted to V-coordinated Al for the flash calcination at 800 °C, without IV-coordinated Al formation. When the flash calcination temperature rose up to 1000 °C, more VI-coordinated Al converted to V-coordinated Al, followed by the conversion of a small amount (8%) of V-coordinated Al to IV-coordinated Al. However, when the flash calcination temperature rose up to 1200 °C, the fraction of VI-coordinated Al increased from 45% to 52%, the fraction of V-coordinated Al decreased from 47% to 22% and the fraction of IV-coordinated Al increased from 8% to 26%. Therefore, it is considered that the increased VI-coordinated Al and IV-coordinated Al were from the conversion of V-coordinated Al.
For 29Si NMR, the resonances below −101 ppm, at around −98 ppm and above −95 ppm are considered as the signals derived from meta-kaolinite-characterized Si + SiO2-characterized Si, kaolinite-characterized Si and mullite-characterized Si, respectively [28]. In the raw kaolinite, Si atoms were assigned to a Q3 Si environment (Si linked to three other Si atoms) with the single resonance at around −98.0 ppm. After the flash calcination at 800 °C, the new resonances from −109 ppm to −130 ppm appeared, representing meta-kaolinite-characterized Si. When the flash calcination temperature rose up to 1000 °C, the resonance at 110.9 ppm was pretty strong, representing meta-kaolinite-characterized Si + SiO2-characterized Si. When the flash calcination temperature rose up to 1000 °C, two new resonances near 90 ppm appeared, representing mullite-characterized Si. According to the semi-quantitative fractions of Si coordination in Table 3, more than 80% of kaolinite-characterized Si was converted for flash calcination. The formation of mullite-characterized Si appeared at 1200 °C, in agreement with the result of XRD.

4. Discussion

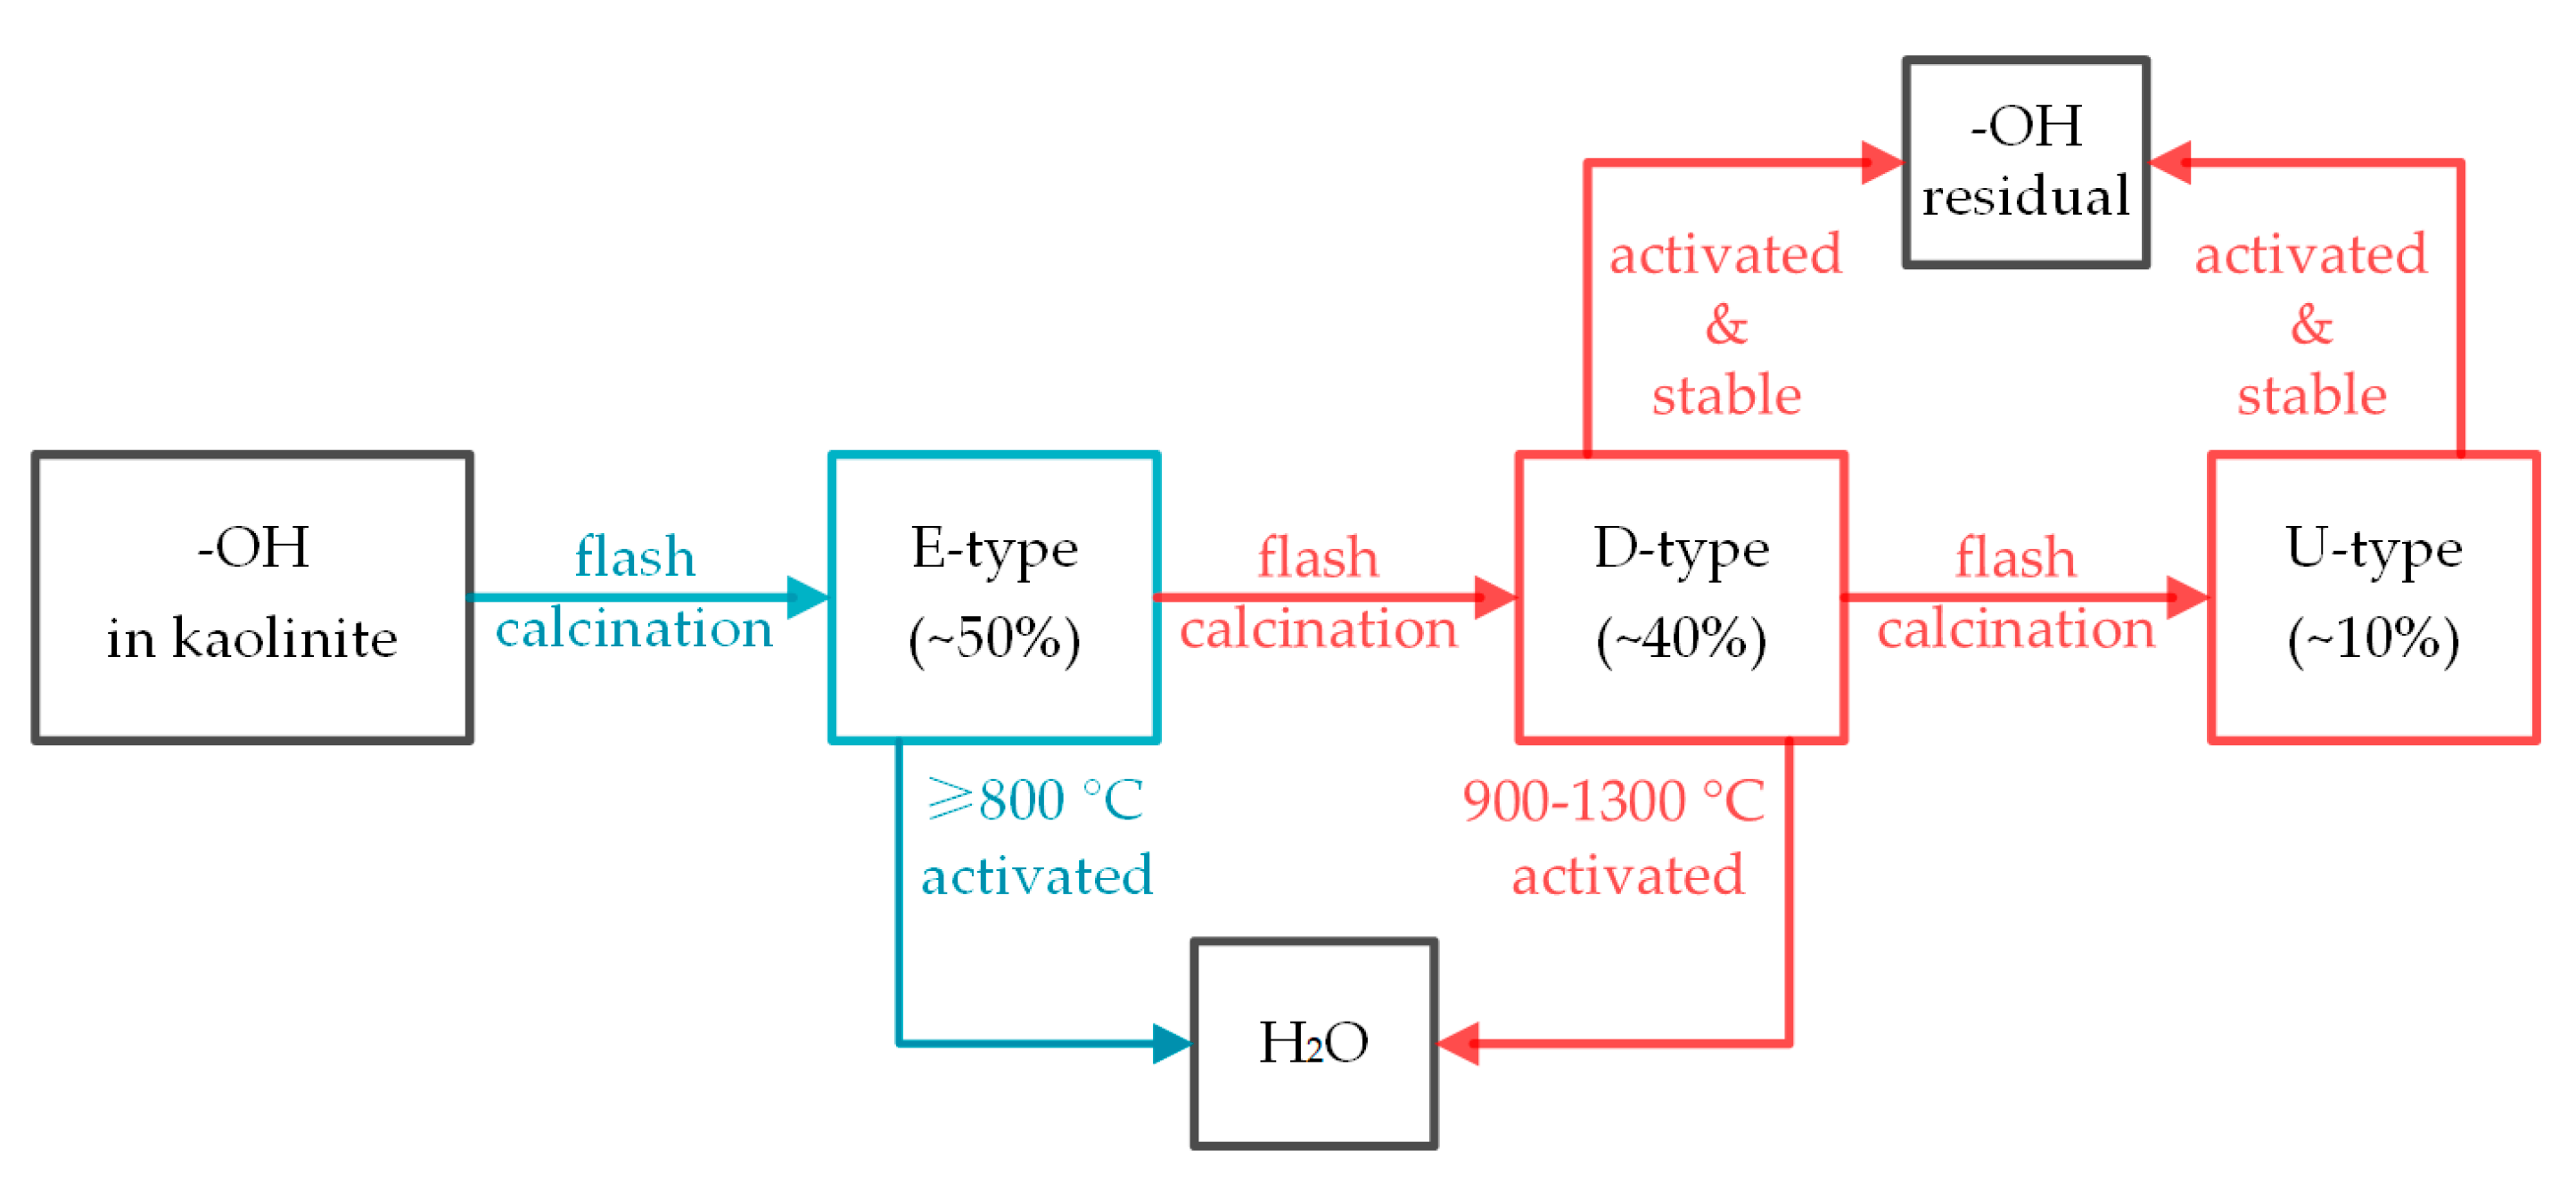
4.1. Process of Kaolinite Dehydroxylation during Flash Calcination

In Figure 5, the dehydroxylation fractions of flash-calcined products at 800 °C were around 48% and did not increase with the residence time. This leads to the assumption that there were two forms of hydroxyl groups at least in kaolinite, one that was easy to remove (E-type) and another that was difficult to removed (D-type). According to this assumption, it could be considered that the flash calcination at 800 °C removed the E-type hydroxyl groups and left D-type hydroxyl groups, so the increase of residence time had no effect on dehydroxylation. At higher temperatures, the increase of dehydroxylation fraction with the residence time indicates that the temperatures above 800 °C were effective to remove D-type hydroxyl groups. However, when the temperature rose up to 1300 °C, the increase of residence time had no effect on dehydroxylation, again that about 10% of hydroxyl groups were unable to remove and were named U-type. Therefore, the hydroxyl groups of kaolinite in the flash calcination process were divided into three categories: E-type, D-type and U-type.
The difference of three kinds of hydroxyl groups could be understood from the dehydroxylation process. The dehydroxylation of kaolinite is generally considered to consist of two steps: (a) formation of water molecules by chemical reaction of OH groups and (b) physical diffusion of water molecules towards the surface of kaolinite [29,30,31]. There are different kinetics mechanisms to describe the dehydroxylation of kaolinite, such as first-order kinetics, diffusion model and both [29,32]. The essence of the debate is whether the dehydroxylation process is water vapor diffusion-controlled. During soak calcination, the main channels for water vapor diffusion are the interlayer spaces and some structures for the vacancies and discontinuities of the layers [30]. During flash calcination, the explosive dehydroxylation causes the water vapor production to be far more than its diffusion, so the pressure of interlayer spaces rises dramatically resulting in the destruction of kaolinite platelets to form the extensive bubble-like voids [31,33,34]. These voids are another important diffusion channel during flash calcination [31]. Contrary to the formation of voids in flash calcination, the interlayer distance decreases in flash calcination until the collapse of interlayer spaces [31].
During the flash calcination at 800 °C, no more hydroxyl groups were removed with the increase of residence time, as shown in Figure 5. It may be due to the collapse of interlayer spaces but no voids formed, resulting in the high pressure of water vapor inside the kaolinite and no further reaction of hydroxyl groups to form water. At higher temperatures, dehydroxylation increased with the increase of residence time. It indicated the formation of bubble-like voids, resulting in the recovery of water vapor diffusion in the new channels. Therefore, it is considered that E-type hydroxyl groups diffused from interlayer spaces while D-type hydroxyl groups diffused from bubble-like voids. Because these voids are in larger size, the resistance inside was low during diffusion, so the kinetics mechanism in the temperature range from 900–1200 °C is reaction-controlled. The residual U-type hydroxyl groups accounted for around 10%, which is in agreement with that obtained from soak calcination [35]. Therefore, the diffusion control may not be the constraints to hinder the removal of this part of hydroxyl groups, but reaction control may be. These residual hydroxyl groups may be isolated in the flash-calcined products so that they were too far from each other to react. Another possibility is that they were trapped in a partially enclosed space after the layer collapses.
According to the crystal structure, there are two forms of hydroxyl groups in kaolinite, (a) inner-surface hydroxyl groups on the top of Al sublayer, accounting for 75%, and (b) inner-surface hydroxyl groups in the bottom of Al sublayer, accounting for 25%, as shown in Figure 10 [12,36]. It is generally considered that the inner-surface hydroxyl groups are easy to remove but the inner hydroxyl groups are not [36,37]. The dehydroxylation follows the rules that only hydroxyl groups located close to each other will react to form H2O molecules, which means the dehydroxylation process needs two hydroxyl groups at least [37]. If one inner hydroxyl group were left, one inner-surface hydroxyl group should be left as well, so the proportion of the removable inner surface hydroxyl groups was 50%, very close to the dehydroxylation fractions of flash-calcined products at 800 °C. However, the results from FTIR detection in Figure 8 negated this possibility that the signals derived from inner hydroxyl groups at 915 cm−1 and 3620 cm−1 were weakened for the flash calcination at 800 °C. Therefore, the inner hydroxyl groups were included in E-type hydroxyl groups as well.
In Figure 3, there are two processes during the removal of residual hydroxyl groups in flash-calcined products by TG, pre-dehydroxylation initiated at 160 °C and main-dehydroxylation initiated at 445 °C. It means one part of residual hydroxyl groups was more active than the rest. Therefore, the residual hydroxyl groups were divided as “activated hydroxyl groups” and “stable hydroxyl groups” corresponding to pre-dehydroxylation and main-dehydroxylation, respectively [37,38]. These two kinds of hydroxyl groups exist in the raw kaolinite as well. The mass of activated hydroxyl groups was the mass loss in pre-dehydroxylation while the mass of stable hydroxyl groups was the mass loss in main-dehydroxylation. The fractions of activated hydroxyl groups in total residual hydroxyl groups in flash-calcined products were calculated to analyze the change of hydroxyl groups during flash calcination, as shown in Figure 11.
At the temperatures above 800 °C, the fraction of activated hydroxyl groups decreased with the residence time, indicating that the flash calcination caused the conversion of a part of stable hydroxyl groups to activated hydroxyl groups. However, the conversion seems to not be fast enough to compensate the removal of activated hydroxyl groups at 800 °C. This conversion was related to the kinetic process of structure adjustment of kaolinite during flash calcination. During the flash calcination, dehydroxylation caused the vacancies of O atoms and the decrease of Al coordination, so the movement of Al atoms and O atoms was significant enough to make the structure re-stable [9,10]. The residual D-type hydroxyl groups and U-type hydroxyl groups bonded with Al atoms, so they moved significantly as well, resulting in them getting closer to each other. Because the activated hydroxyl groups were easier to remove than the stable hydroxyl groups, and all the products contained hydroxyl groups, it is considered that the activation of hydroxyl groups was the necessary step before dehydroxylation. The dehydroxylation process during flash calcination was surmised as Figure 12.

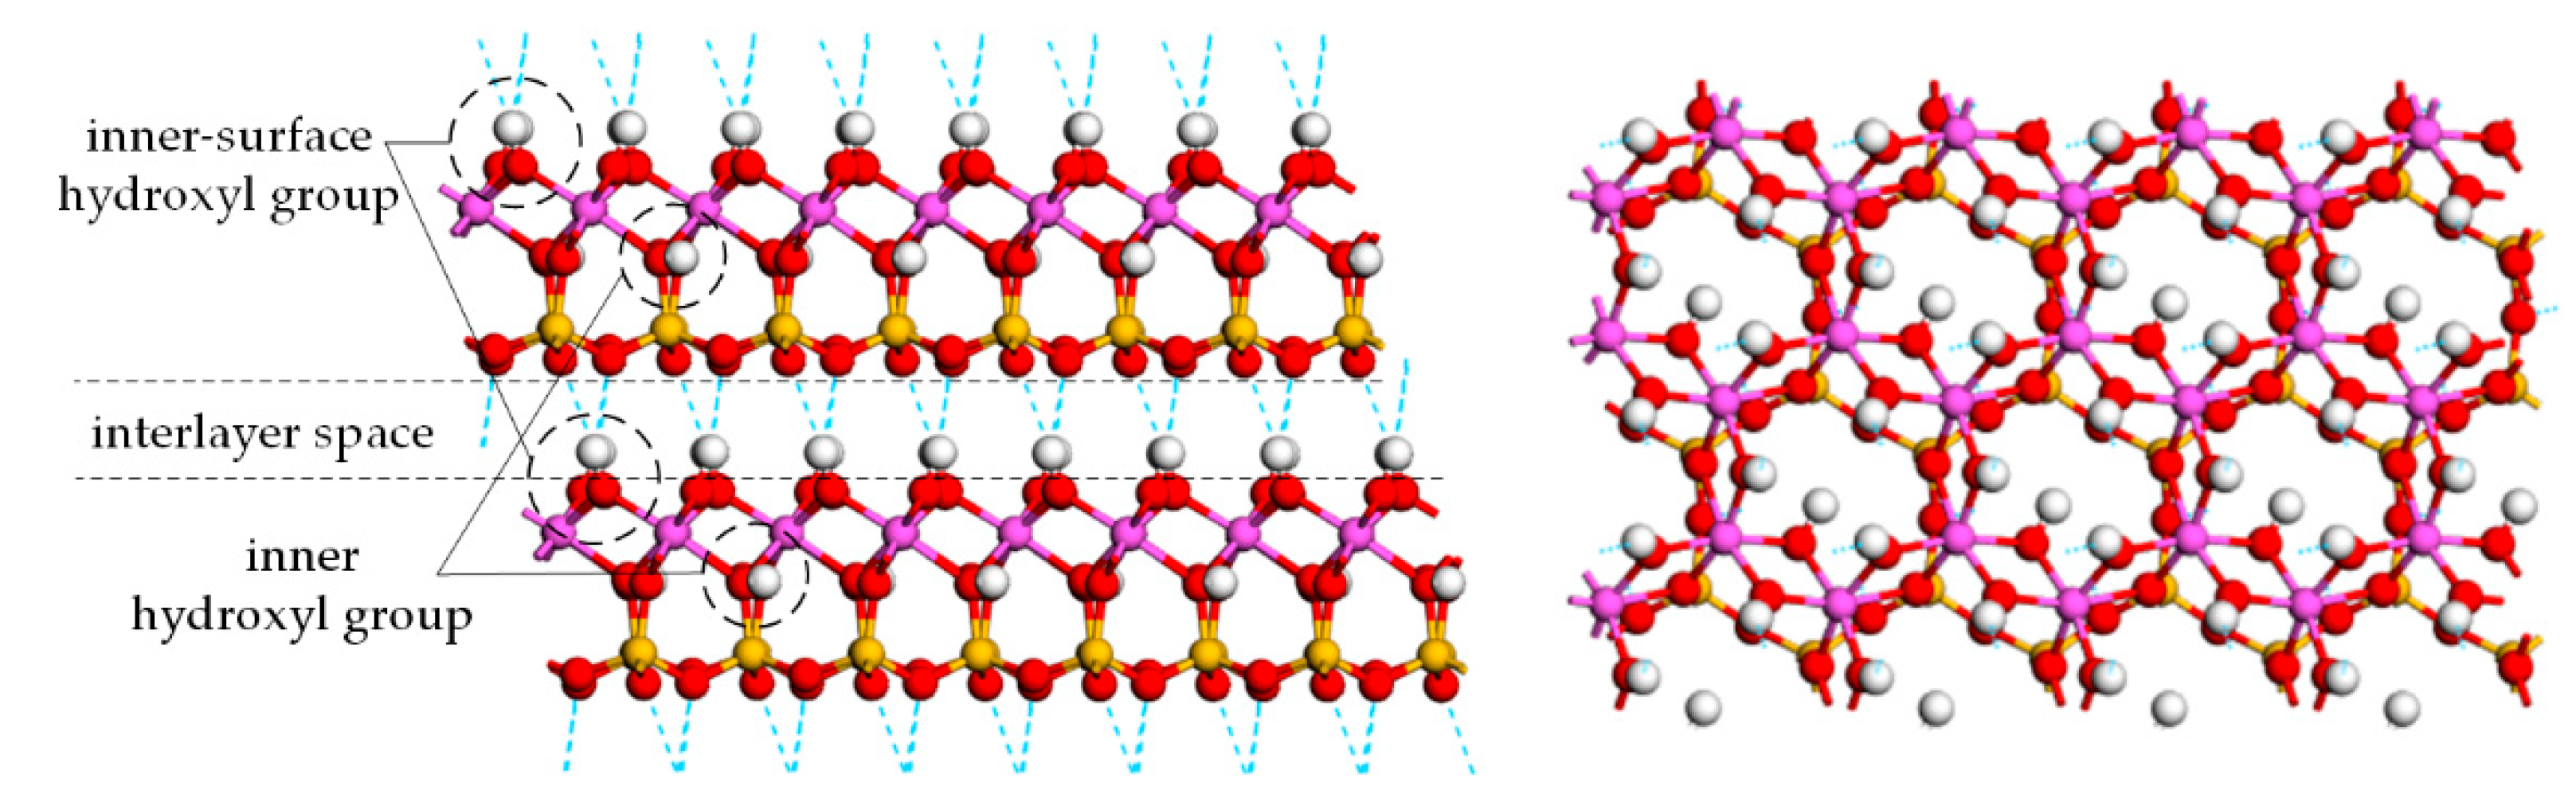
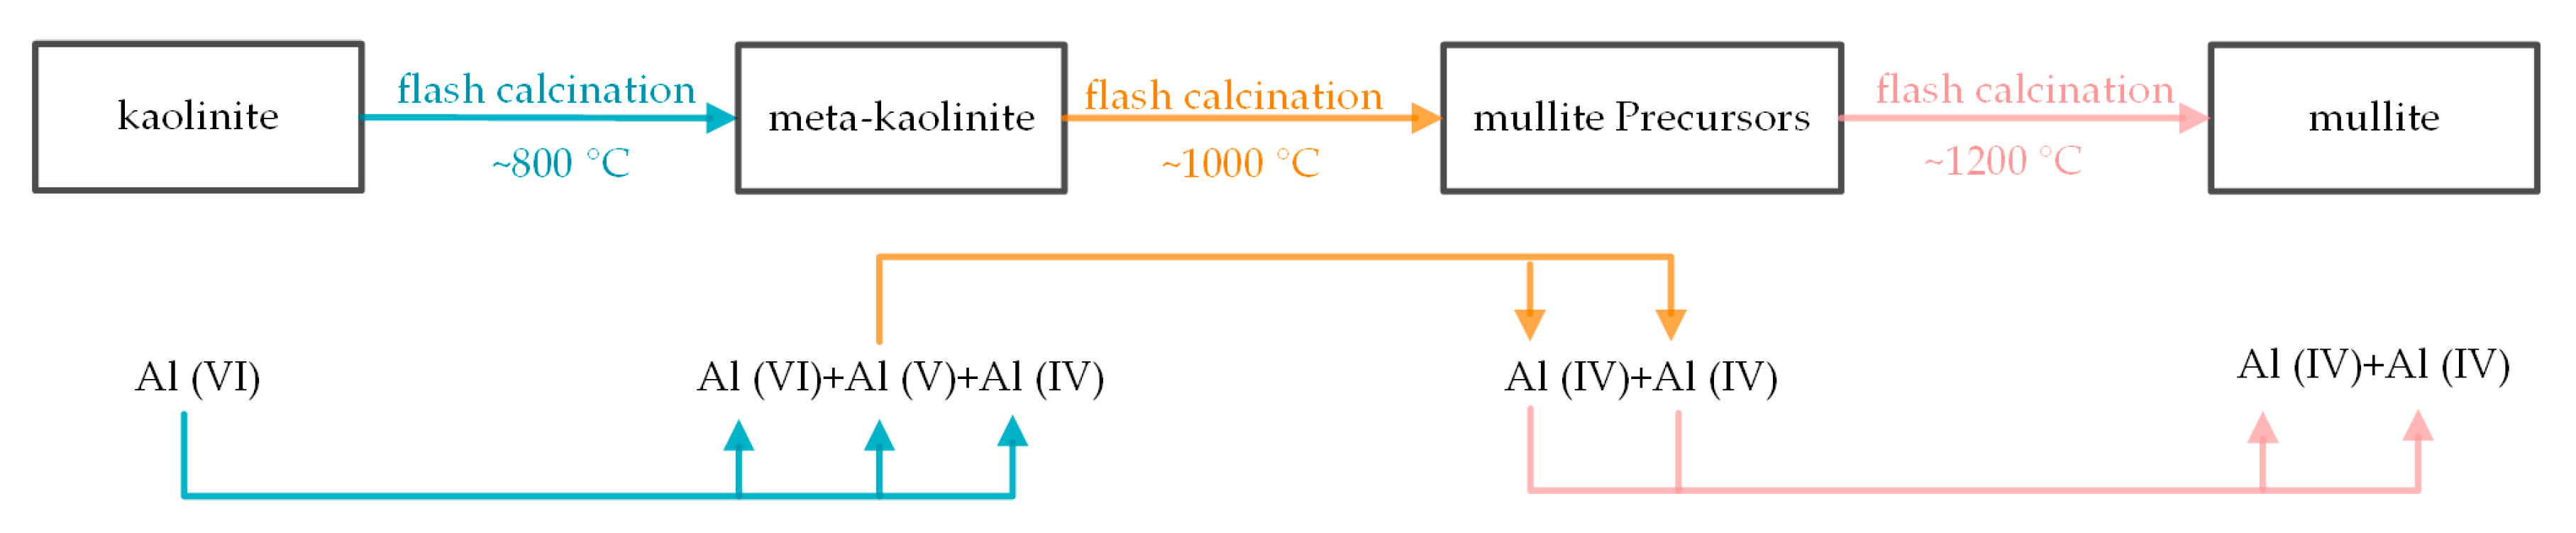
4.2. Process of Kaolinite Structural Distortion during Flash Calcination

The previous researchers reported the structural distortion of kaolinite during soak calcination in detail. Nevertheless, the results here from flash calcination show many differences. Because the residence time was in second level in flash calcination, almost one in ten thousand of soak calcination, the crystal transition during flash calcination was not sufficient, resulting in the presence of several crystal phases simultaneously. In Figure 7, the crystal phase did not convert to amorphous meta-kaolinite completely, and even coexisted with mullite. In contrast, kaolinite is usually completely converted to amorphous forms before the appearance of mullite during soak calcination. It should be emphasized that the temperature of mullite formation in flash calcination was around 1200 °C, significantly higher than 1050 °C in soak calcination. Moreover, the crystallinities of the residual kaolinite in flash-calcined products were much lower than the raw kaolinite, as shown in Table 4. The crystallinity of kaolinite decreased with the increase of residence time and calcination time. At 800 °C, although the dehydroxylation fraction did not increase with residence time, the crystallinity decreased obviously. The decrease of crystallinity also supported the activation of hydroxyl groups during flash calcination.
Besides the crystal transition, Al coordination and Si coordination can characterize the structural distortion as well. In the raw kaolinite, the Al coordination is VI, as shown in Figure 9. After 800 °C flash calcination, about 45% of hydroxyl groups (E-type) were removed, resulting in the formation of 33% of V-coordinated Al. Therefore, most E-type hydroxyl groups ought to distribute evenly on the Al sublayer, otherwise, VI-coordinated Al would be produced locally and be observed by NMR detection. In contrast, Soak calcination produces IV-coordinated Al at the temperature as low as 550 °C [28,39]. This difference was due to the low dehydroxylation fraction during flash calcination. At 1000 °C, the further dehydroxylation was the removal of D-type hydroxyl groups, resulting in the formation of IV-coordinated Al. According to the octahedral structure of Al-O(H)6, the loss of hydroxyl groups would decrease the coordination number. However, at 1200 °C, V-coordinated Al converted to not only IV-coordinated Al but also VI-coordinated Al, indicating the significant structural distortion of the octahedral structure of Al-O(H)6 and due to the formation of mullite (observed by XRD) and its precursors such as γ-Al2O3 and Si-Al spinel [27,28,39]. Simultaneously, the chemical shift at around −110 ppm indicated the conversion of Q3 Si (tetrahedral structure and Si linked, via oxygens, to three other Si atoms) to Q4 Si (Si linked, via oxygens, to four other Si atoms), due to the formation of silica, mullite (observed by XRD) and its precursors [28,39]. The structural distortion process during flash calcination was surmised as Figure 13.

4.3. Effect of Dehydroxylation and Structural Distortion on Metal Vapor Adsorption by Kaolinite

The temperature of municipal solid waste (MSW) incineration is usually 800–1200 °C, at which, semi-volatile heavy metals and alkali metals exist mainly in the form of chloride vapor, such as PbCl2, PbCl, CdCl2, CdCl, NaCl and KCl [40,41,42,43]. In the condition of in-furnace injection, the residence time of kaolinite in the furnace is usually less than 2 s, so 15–55% of hydroxyl groups or more would remain in kaolinite. Hydroxyl groups are the key of the chloride adsorption reactions [9,10]. It could be described as Equation (13) and Figure 14. Firstly, the chloride molecule adsorbs on Al surface of kaolinite. Metal atom bonds with the raised O atom which was formed by losing H atom from hydroxyl group for dedroxylation, while Cl atom bonds with the hydroxyl groups in the form of hydrogen bonds. Secondly, the enhancement of Cl-H bonds and the weakening of meta-Cl bond and H-O bonds causes the formation of HCl and raised O atoms. Finally, the remaining Cl atom bonds with the new raised O atom producing the structure same as that of oxide molecule adsorption which is much more stable than the chloride molecule adsorption in the first step.
Al2O3·2SiO2·2H2O + PbCl2 → PbO·Al2O3·2SiO2 + 2HCl + H2O
Therefore, the residue of hydroxyl groups is favorable for the adsorption. Water molecules can also participate in the reaction by conversion to surface hydroxyl groups first, and then react with metal chlorides. However, this first step may limit the adsorption rate, so the participation of residual hydroxyl groups should be more direct for reaction and the adsorption rate would be higher. In this view, the high temperature could promote the rate of adsorption reaction with the participation of hydroxyl groups but would reduce the amount of residual hydroxyl groups. Therefore, there should be an optimal temperature window for metal adsorption in the incinerator. There is currently no research in this area.
The temperature in the pulverized coal-fired furnace is usually 1200–1500 °C. The forms of semi-volatile heavy metals and alkali metals are mainly oxide vapors such as PbO, CdO, NaOH and KOH [4,40,42]. In the condition of in-furnace injection, the residence time of kaolinite in the furnace is usually less than 2 s, so around 90% of hydroxyl groups would be removed. The activity of Al atoms is the key to adsorption [9,10,40,44]. It could be described as Equation (14) and Figure 15. Raw kaolinite contained is invalid to oxide molecule adsorption. However, the dehydroxylation can produce the O vacancies resulting in the unsaturation of Al atoms. The metal oxide molecule can be adsorbed by O-Al bonds and metal-raised O bond. Therefore, unlike chloride molecule adsorption, hydroxyl groups are detrimental to oxide adsorption by the occupation of Al atoms and weakening the interaction between O atom and metal atom.
Al2O3·2SiO2 + PbO → PbO·Al2O3·2SiO2
During flash calcination, the formation of mullite should be harmful to metal oxide molecule adsorption. Although IV-coordinated Al was found in mullite, its activity was considered too low to bond with the metal oxide molecule. Therefore, the temperature as high as 1300 °C can produce a high reaction rate but decreased the adsorption sites for the formation of mullite. Therefore, there should be an optimal temperature window for metal adsorption in the pulverized coal-fired furnace.

5. Conclusions

There were three kinds of hydroxyl groups in kaolinite during flash calcination at 800–1300 °C, E-type, D-type and U-type, arranged according to the removal difficulty. E-type hydroxyl groups, accounting for around 50%, were considered to be distributed evenly in kaolinite, and were easy to remove at 800 °C. D-type hydroxyl groups, accounting for around 40%, were difficult to remove and their removal was kinetically controlled. U-type hydroxyl groups, accounting for around 10%, were unable to be removed at 1300 °C. According to the stability analysis of residual hydroxyl groups in the flash-calcined products, the removal of E-type and D-type hydroxyl groups were not direct but need the step of hydroxyl groups activation first, in which the residual hydroxyl groups probably got closer to each other for the structural distortion. The kinetics model of dehydroxylation at 900–1200 °C was established according to Arrhenius equation, with the apparent activation energy of 140 kJ/mol, and the pre-exponential factor of 1.32 × 10⁶ s−1. If kaolinite was injected into the municipal solid waste (MSW) incinerator, 15–55% of hydroxyl groups or more would remain, and they should be favorable for metal vapor adsorption.
During the flash calcination at 800 °C, part of VI-coordinated Al in kaolinite converted to V-coordinated Al for the removal of E-type hydroxyl groups and the formation of meta-kaolinite. With the removal of D-type hydroxyl groups at 1000 °C, more V-coordinated Al was produced and some of them converted to IV-coordinated Al. When the temperature rose up to 1200 °C, mullite was produced and part of V-coordinated Al converted to IV-coordinated Al and VI-coordinated Al. If kaolinite was injected into the pulverized coal-fired furnace, most hydroxyl groups would be removed to expose Al atoms and O atoms on the surface. However, the formation of mullite would reduce the activated Al atoms which were the main adsorption sites.

Supplementary Materials

The following are available online at https://www.mdpi.com/2075-163X/9/10/587/s1, The effect of impurities on the calculation of dehydroxylation fractions.

Author Contributions

Conceptualization, X.W. and H.X.; Methodology, X.W., H.X., C.B., J.Z., G.P. and Y.H.; Experiments and Writing—Original Draft Preparation, Y.C. and J.X.; Review and Editing, X.W., H.X., C.B., J.Z., G.P. and Y.H.

Funding

This research was funded by the National Key Research and Development Program of China (2018YFB0605102), the National Natural Science Foundation of China (51706106), the China Postdoctoral Science Foundation (2017M621778) and Jiangsu Planned Projects for Postdoctoral Research Funds (1701160B), Natural Science Research Project of Jiangsu Higher Education Institutions (17KJB470007) and Key R and D project of Zhenjiang (SH2018014).

Acknowledgments

Special thanks to Southeast University for its membership in the Institutional Open Access Program of MDPI.

Conflicts of Interest

The authors declare no conflict of interest.

References

  1. Gale, T.K.; Wendt, J. Mechanisms and models describing sodium and lead scavenging by a kaolinite aerosol at high temperatures. Aerosol. Sci. Technol. 2003, 37, 865–876. [Google Scholar] [CrossRef]
  2. Li, G.; Li, S.; Huang, Q.; Yao, Q. Fine particulate formation and ash deposition during pulverized coal combustion of high-sodium lignite in a down-fired furnace. Fuel 2015, 143, 430–437. [Google Scholar] [CrossRef]
  3. Wang, G.; Jensen, P.A.; Wu, H.; Frandsen, F.J.; Sander, B.; Glarborg, P. Potassium capture by kaolin, part 1: KOH. Energy Fuels 2018, 32, 1851–1862. [Google Scholar] [CrossRef]
  4. Xu, Y.; Liu, X.; Wang, H.; Zeng, X.; Zhang, Y.; Han, J.K.; Xu, M.; Pan, S. Influences of in-furnace kaolin addition on the formation and emission characteristics of PM2.5 in a 1000 MW coal-fired power station. Environ. Sci. Technol. 2018, 52, 8718–8724. [Google Scholar] [CrossRef] [PubMed]
  5. Song, M.; Wei, Y.; Cai, S.; Yu, L.; Zhong, Z.; Jin, B. Study on adsorption properties and mechanism of Pb2+ with different carbon based adsorbents. Sci. Total Environ. 2018, 618, 1416–1422. [Google Scholar] [CrossRef] [PubMed]
  6. Wang, X.; Huang, Y.; Zhong, Z.; Yan, Y.; Niu, M.; Wang, Y. Control of inhalable particulate lead emission from incinerator using kaolin in two addition modes. Fuel Process. Technol. 2014, 119, 228–235. [Google Scholar] [CrossRef]
  7. Sun, W.; Liu, X.; Xu, Y.; Zhang, Y.; Chen, D.; Chen, Z.; Xu, M. Effects of the modified kaolin sorbents on the reduction of ultrafine particulate matter (PM0.2) emissions during pulverized coal combustion. Fuel 2018, 215, 153–160. [Google Scholar] [CrossRef]
  8. Wang, G.; Jensen, P.A.; Wu, H.; Frandsen, F.J.; Sander, B.; Glarborg, P. Potassium capture by kaolin, part 2: K2CO3, KCl, and K2SO4. Energy Fuels 2018, 32, 3566–3578. [Google Scholar] [CrossRef]
  9. Wang, X.; Huang, Y.; Pan, Z.; Wang, Y.; Liu, C. Theoretical investigation of lead vapor adsorption on kaolinite surfaces with DFT calculations. J. Hazard. Mater. 2015, 295, 43–54. [Google Scholar] [CrossRef]
  10. Wang, X.; Huang, Y.; Zhong, Z.; Pan, Z.; Liu, C. Theoretical investigation of cadmium vapor adsorption on kaolinite surfaces with DFT calculations. Fuel 2016, 166, 333–339. [Google Scholar] [CrossRef]
  11. Gasparini, E.; Tarantino, S.C.; Ghigna, P.L.; Riccardi, M.P.; Cedillo-González, E.I.; Siligardi, C.; Zema, M. Thermal dehydroxylation of kaolinite under isothermal conditions. Appl. Clay Sci. 2013, 80, 417–425. [Google Scholar] [CrossRef]
  12. Sperinck, S.; Raiteri, P.; Marks, N.; Wright, K. Dehydroxylation of kaolinite to metakaolin—A molecular dynamics study. J. Mater. Chem. 2011, 21, 2118–2125. [Google Scholar] [CrossRef]
  13. Xing, H.; Liu, H.; Zhang, X.; Deng, H.; Hu, H.; Yao, H. Enhanced sodium adsorption capacity of kaolinite using a combined method of thermal pre-activation and intercalation-exfoliation: Alleviating the problems of slagging and fouling during the combustion of Zhundong coal. Fuel 2019, 239, 312–319. [Google Scholar] [CrossRef]
  14. Favergeon, L.; Morandini, J.; Pijolat, M.; Soustelle, M. A general approach for kinetic modeling of solid-gas reactions at reactor scale: Application to kaolinite dehydroxylation. Oil Gas Sci. Technol. 2013, 68, 1039–1048. [Google Scholar] [CrossRef]
  15. Slade, R.; Davies, T.; Atakül, H.; Hooper, R.M.; Jones, D.J. Flash calcines of kaolinite: Effect of process variables on physical characteristics. J. Mater. Sci. 1992, 27, 2490–2500. [Google Scholar] [CrossRef]
  16. Wendt, J.; Lee, S.J. High-temperature sorbents for Hg, Cd, Pb, and other trace metals: mechanisms and applications. Fuel 2010, 89, 894–903. [Google Scholar] [CrossRef]
  17. Wang, G.; Jensen, P.A.; Wu, H.; Frandsen, F.J.; Bøjer, M.; Glarborg, P. Entrained flow reactor study of k-capture by solid additives. In Proceedings of the 24th European Biomass Conference and Exhibition, Amsterdam, The Netherlands, 6–9 June 2016; pp. 762–766. [Google Scholar]
  18. San, R.; Cyr, M.; Escadeillas, G. Characteristics and applications of flash metakaolins. Appl. Clay Sci. 2013, 83, 253–262. [Google Scholar]
  19. Sarı, M.; Kalpaklı, Y.; Pişkin, S. Thermal behavior and dehydroxylation kinetics of naturally occurring sepiolite and bentonite. J. Therm. Anal. Calorim. 2013, 114, 1191–1199. [Google Scholar] [CrossRef]
  20. Yao, H.; Mkilaha, I.S.N.; Naruse, I. Screening of sorbents and capture of lead and cadmium compounds during sewage sludge combustion. Fuel 2004, 83, 1001–1007. [Google Scholar] [CrossRef]
  21. Ilić, B.R.; Mitrović, A.A.; Miličić, L.R. Thermal treatment of kaolin clay to obtain metakaolin. Hem. Ind. 2010, 64, 351–356. [Google Scholar] [Green Version]
  22. Hinckley, D.N. Variability in “crystallinity” Values among the kaolin deposits of the coastal plain of georgia and south carolina. Clay Clay Miner. 1962, 11, 229–235. [Google Scholar] [CrossRef]
  23. Ptček, P.; Opravil, T.; Soukal, F.; Wasserbauer, J.; Másilko, J.; Baráček, J. The influence of structure order on the kinetics of dehydroxylation of kaolinite. J. Eur. Ceram. Soc. 2013, 33, 2793–2799. [Google Scholar] [CrossRef]
  24. Ebrahimi-Kahrizsangi, R.; Abbasi, M.H. Evaluation of reliability of Coats-Redfern method for kinetic analysis of non-isothermal TGA. Trans. Nonferrous Met. Soc. China 2008, 18, 217–221. [Google Scholar] [CrossRef]
  25. Zhang, J.; Wang, R.; Zhai, X.; Zhao, J.; Yang, H.; Mo, L. Determination of mechanism function and kinetic Parameters of thermal decomposition of the 2,2’-Dipyridine tris (p-methoxybenzoate) Europium(III) with non-isothermal TG and DTG curves. Chin. J. Inorg. Chem. 2000, 16, 103–110. [Google Scholar]
  26. Zemenová, P.; Kloužková, A.; Kohoutková, M.; Král, R.M. Investigation of the first and second dehydroxylation of kaolinite. J. Therm. Anal. Calorim. 2014, 116, 633–639. [Google Scholar] [CrossRef]
  27. Meinhold, R.H.; Slade, R.C.T.; Davies, T.W. High-field 27Al mas NMR studies of the formation of metakaolinite by flash calcination of kaolinite. Appl. Magn. Reson. 1993, 4, 141–155. [Google Scholar] [CrossRef]
  28. Zhang, X.; Liu, H.; Xing, H.; Wang, G.; Deng, H.; Hu, H.; Li, X.; Yao, H. Correlations between the sodium adsorption capacity and the thermal behavior of modified kaolinite during the combustion of Zhundong coal. Fuel 2019, 237, 170–177. [Google Scholar] [CrossRef]
  29. Ortega, A.; Mac, A.M.; Gotor, F.J. The multistep nature of the kaolinite dehydroxylation: Kinetics and mechanism. J. Am. Ceram. Soc. 2010, 93, 197–203. [Google Scholar] [CrossRef]
  30. Stoch, L. Significance of structural factors in dehydroxylation of kaolinite polytypes. J. Therm. Anal. 1984, 29, 919–931. [Google Scholar] [CrossRef]
  31. Meinhold, R.H.; Atakul, H.; Daviesb, T.W.; Robert, C.T. Flash calcines of kaolinite: Kinetics of isothermal dehydroxyla.tion of partially dehydroxylated flash calcines and of flash calcination itself. J. Mater. Chem. 1992, 2, 913–921. [Google Scholar] [CrossRef]
  32. Redfern, S. The kinetics of dehydroxylation of kaolinite. Clay Miner. 1987, 22, 447–456. [Google Scholar] [CrossRef]
  33. Bridson, D.; Davies, T.; Harrison, D. Properties of flash-calcined kaolinite. Clay Clay Miner. 1985, 33, 258–260. [Google Scholar] [CrossRef]
  34. Zhang, X.; Liu, H.; Xing, H.; Li, H.; Hu, H.; Li, A.; Yao, H. Improved sodium adsorption by modified kaolinite at high temperature using intercalation-exfoliation method. Fuel 2017, 191, 198–203. [Google Scholar] [CrossRef]
  35. Mackenzie, K.; Brown, I.; Meinhold, R.H.; Bowden, M. Outstanding problems in the kaolinite-mullite reaction sequence investigated by 29Si and 27Al Solid-state nuclear magnetic resonance: I, metakaolinite. J. Am. Ceram. Soc. 1985, 68, 293–297. [Google Scholar] [CrossRef]
  36. White, C.E.; Provis, J.L.; Proffen, T.; Riley, D.P.; van Deventer, J.S.J. Density functional modeling of the local structure of kaolinite subjected to thermal dehydroxylation. J. Phys. Chem. A 2010, 114, 4988–4996. [Google Scholar] [CrossRef] [PubMed]
  37. Badogiannis, E.; Kakali, G.; Tsivilis, S. Metakaolin as supplementary cementitious material: Optimization of kaolin to metakaolin conversion. J. Therm. Anal. Calorim. 2005, 81, 457–462. [Google Scholar] [CrossRef]
  38. Fabbri, B.; Gualtieri, S.; Leonardi, C. Modifications induced by the thermal treatment of kaolin and determination of reactivity of metakaolin. Appl. Clay Sci. 2013, 73, 2–10. [Google Scholar] [CrossRef]
  39. Rocha, J.; Klinowski, J. 29Si and 27Al magic-angle-spinning NMR studies of the thermal transformation of kaolinite. Phys. Chem. Miner. 1990, 17, 179–186. [Google Scholar] [CrossRef]
  40. Wang, X.; Chen, M.; Liu, C.; Bu, C.; Zhang, J.; Zhao, C.; Huang, Y. Typical gaseous semi-volatile metals adsorption by meta-kaolinite: A DFT study. Int. J. Environ. Res. Public Health 2018, 15, 2154. [Google Scholar] [CrossRef] [PubMed]
  41. Huang, Y.; Wang, X.; Liu, C.; Wang, Y.; Dong, L. Kaolinite induced control of particulate lead and cadmium emissions during fluidized bed waste incineration. Asia-Pac. J. Chem. Eng. 2017, 12, 321–331. [Google Scholar] [CrossRef]
  42. Zhang, Y.; Liu, X.; Xu, Y.; Sun, W.; Xu, M. Investigation of reducing ultrafine particulate matter formation by adding modified montmorillonite during coal combustion. Fuel Process. Technol. 2017, 158, 264–271. [Google Scholar] [CrossRef]
  43. Wang, X.; Huang, Y.; Niu, M.; Wang, Y.; Liu, C. Effect of multi-factors interaction on trace lead equilibrium during municipal solid waste incineration. J. Mater. Cycles Waste 2016, 18, 287–295. [Google Scholar] [CrossRef]
  44. Zhang, Z.; Liu, J.; Yang, Y.; Shen, F.; Zhang, Z. Theoretical investigation of sodium capture mechanism on kaolinite surfaces. Fuel 2018, 234, 318–325. [Google Scholar] [CrossRef]
Figure 1. Particle size distribution of kaolinite.
Minerals 09 00587 g001
Figure 2. Schematic of drop tube furnace system: 1: nitrogen, 2: oxygen, 3: carbon dioxide, 4: flowmeter, 5: mixing tank, 6: speed controller, 7: feeder, 8: ejector, 9: connecting tube, 10: PID temperature controller, 11: silicon carbide rod, 12: thermocouple, 13: quartz tube, 14: vacuum pump, 15: sampling collection device and 16: furnace.
Minerals 09 00587 g002
Figure 3. Typical thermogravimetry-differential scanning calorimeter (TG-DSC) curve of the flash-calcined product. Heat from room temperature to 150 °C at the rate of 10 °C/min, next keep at 150 °C for 30 min, then heat from 150 °C to 1200 °C at the rate of 10 °C/min and finally stop heating at 1200 °C.
Minerals 09 00587 g003
Figure 4. An example illustrating the determination of values for the calculation of the Hinckley index (HI) from X-ray diffraction (XRD) data for the investigated sample of kaolinite.
Minerals 09 00587 g004
Figure 5. Dehydroxylation fractions of flash-calcined products at various temperatures and residence time conditions.
Minerals 09 00587 g005
Figure 6. Primary linear fitting of G(α) versus t (left) to calculate k at 900 °C, 1000 °C, 1100 °C and 1200 °C. Secondary linear fitting of ln(k(T)) versus T−1 (right) to calculate E and A.
Minerals 09 00587 g006
Figure 7. XRD patterns of flash-calcined products. In the left column, the products were sampled in the residence time of 0.5 s (left). In the right column, the products were sampled in the residence time of 3 s (right). Kaolinite, quartz and mullite were the main crystal phases in the products.
Minerals 09 00587 g007
Figure 8. Infrared spectra of flash-calcined products sampled in the residence time of 0.5 s (left) and the residence time of 3 s (right).
Minerals 09 00587 g008
Figure 9. 27Al nuclear magnetic resonance (NMR) spectra (left) and 29Si NMR spectra (right) of 3 s flash-calcined products. For 27Al NMR spectra, gray areas, red areas and blue areas indicate the fit picks of VI-coordinated Al, V-coordinated Al and IV-coordinated Al, respectively. For 29Si NMR spectra, gray areas, red areas and blue areas indicate the fit picks of kaolinite-characterized Si, meta-kaolinite-characterized Si + SiO2-characterized Si and mullite-characterized Si, respectively. A solid line indicates the experimental data while a dashed line indicates the cumulative fit peak.
Minerals 09 00587 g009
Figure 10. Side view (left) and top view (right) of the atomic structure of kaolinite crystal. Hydrogen is white, oxygen is red, aluminum is purple, and silicon is yellow.
Minerals 09 00587 g010
Figure 11. Fractions of activated hydroxyl groups in total residual hydroxyl groups in flash-calcined products at various temperatures and residence time conditions.
Minerals 09 00587 g011
Figure 12. Schematic of kaolinite dehydroxylation process during flash calcination at 800–1300 °C.
Minerals 09 00587 g012
Figure 13. Schematic of kaolinite structural distortion process during flash calcination at 800–1300 °C.
Minerals 09 00587 g013
Figure 14. Steps of PbCl molecule adsorption. Lead is gray and chlorine is green. Step 1: landing on surface. Step 2: bond broken of Pb-Cl. Step 3: formation of HCl.
Minerals 09 00587 g014
Figure 15. PbO molecule adsorption on kaolinite surface without dihydroxylation, with one H2O removal (two hydroxyl groups involved) and two H2O removal (four hydroxyl groups involved).
Minerals 09 00587 g015
Table 1. Elemental composition of kaolinite.
ElementSiO2Al2O3K2OSO3TiO2Fe2O3MgOP2O5Others
Content (%)53.0044.170.660.660.480.450.220.170.19
Table 2. Correspondence between absorption band and surface functional group
Band (cm−1)Functional GroupBand (cm−1)Functional GroupBand (cm−1)Functional Group
538octahedral O-Al-OH817tetrahedral Al-O3620inner –OH
699octahedral O-Al-OH915inner –OH3650inner-surface –OH
755octahedral O-Al-OH939inner-surface –OH3669inner-surface –OH
1070meta-kaolinite3695inner-surface –OH
Table 3. Semi-quantitative fractions of Si atoms and Al atoms in different forms.
Form of Al AtomFraction
Raw800 °C1000 °C1200 °C
VI-coordinated Al100%67%45%52%
(from original peak)0(64%)(29%)(38%)
(from new peaks)0(3%)(16%)(14%)
V-coordinated Al033%47%22%
IV-coordinated Al008%26%
Form of Si Atom
Kaolinite-characterized Si100%73%6%1%
meta-kaolinite-characterized Si + SiO2-characterized Si027%94%86%
Mullite-characterized Si00013%
Table 4. HI index of kaolinite and products.
HI of Raw KaoliniteResidence Time (s) HI of Product Calcined at
800 °C900 °C1000 °C
1.050.50.460.370.24
30.220.20

