Alumina Extraction from Coal Fly Ash via Low-Temperature Potassium Bisulfate Calcination

Abstract
1. Introduction
2. Experimental
2.1. Materials
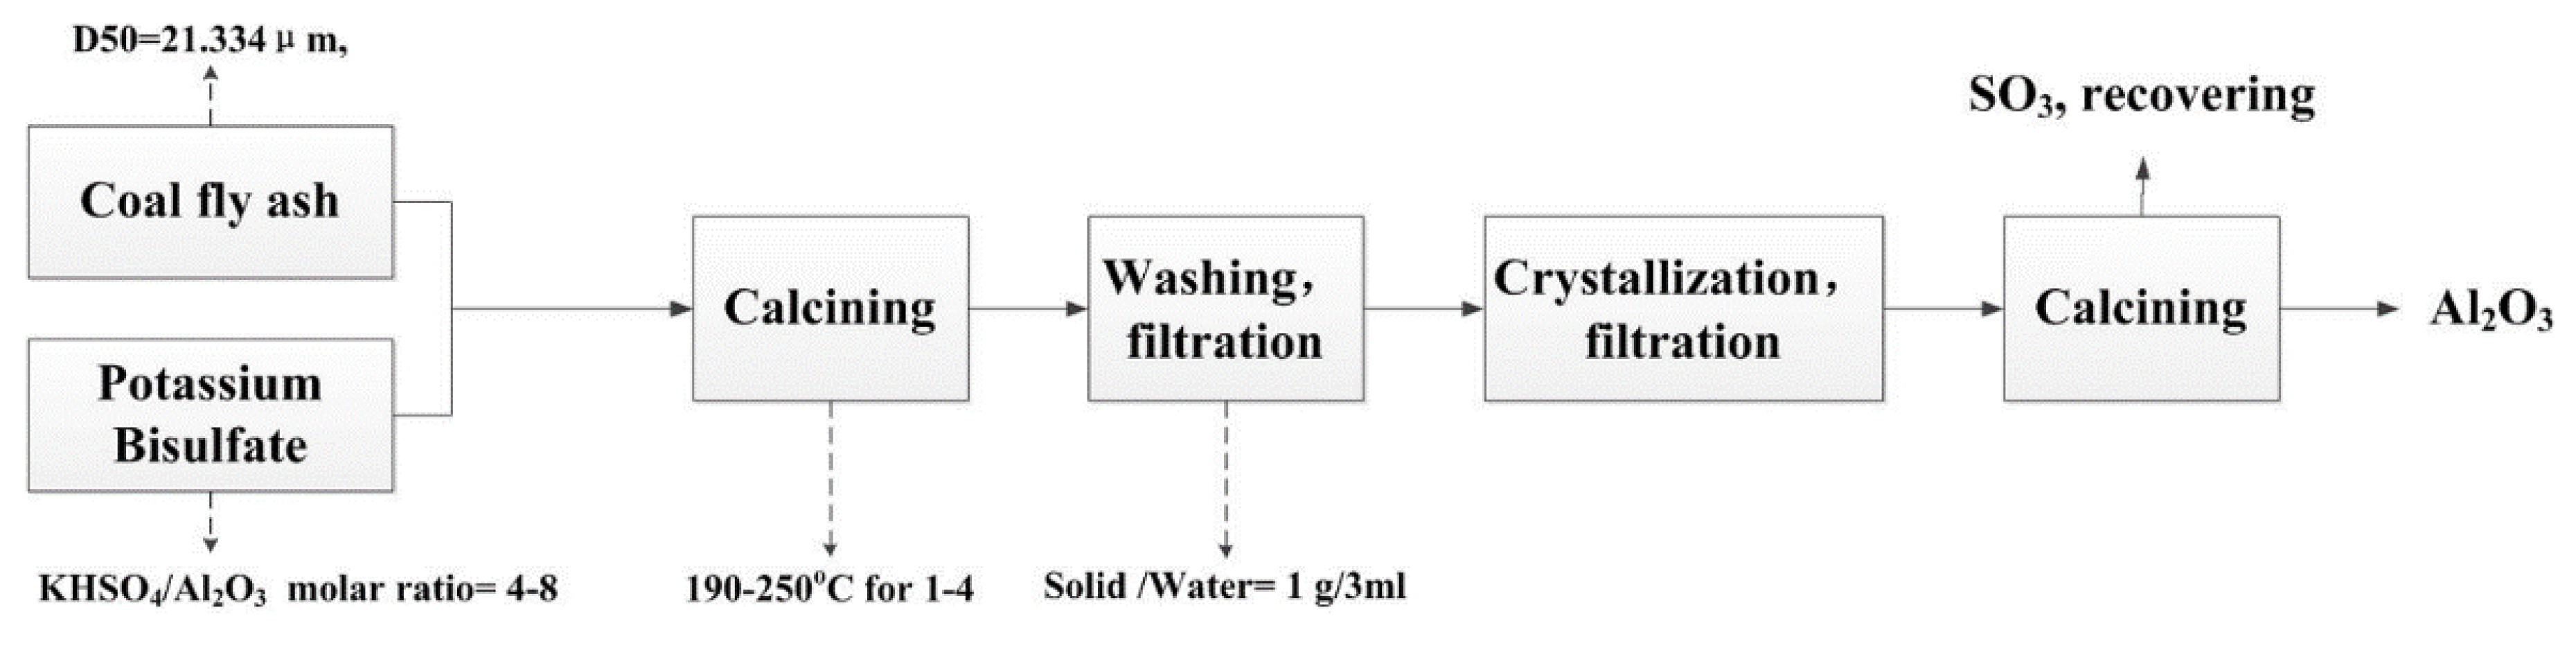
2.2. Procedures
2.3. Characterization
3. Results and Discussion
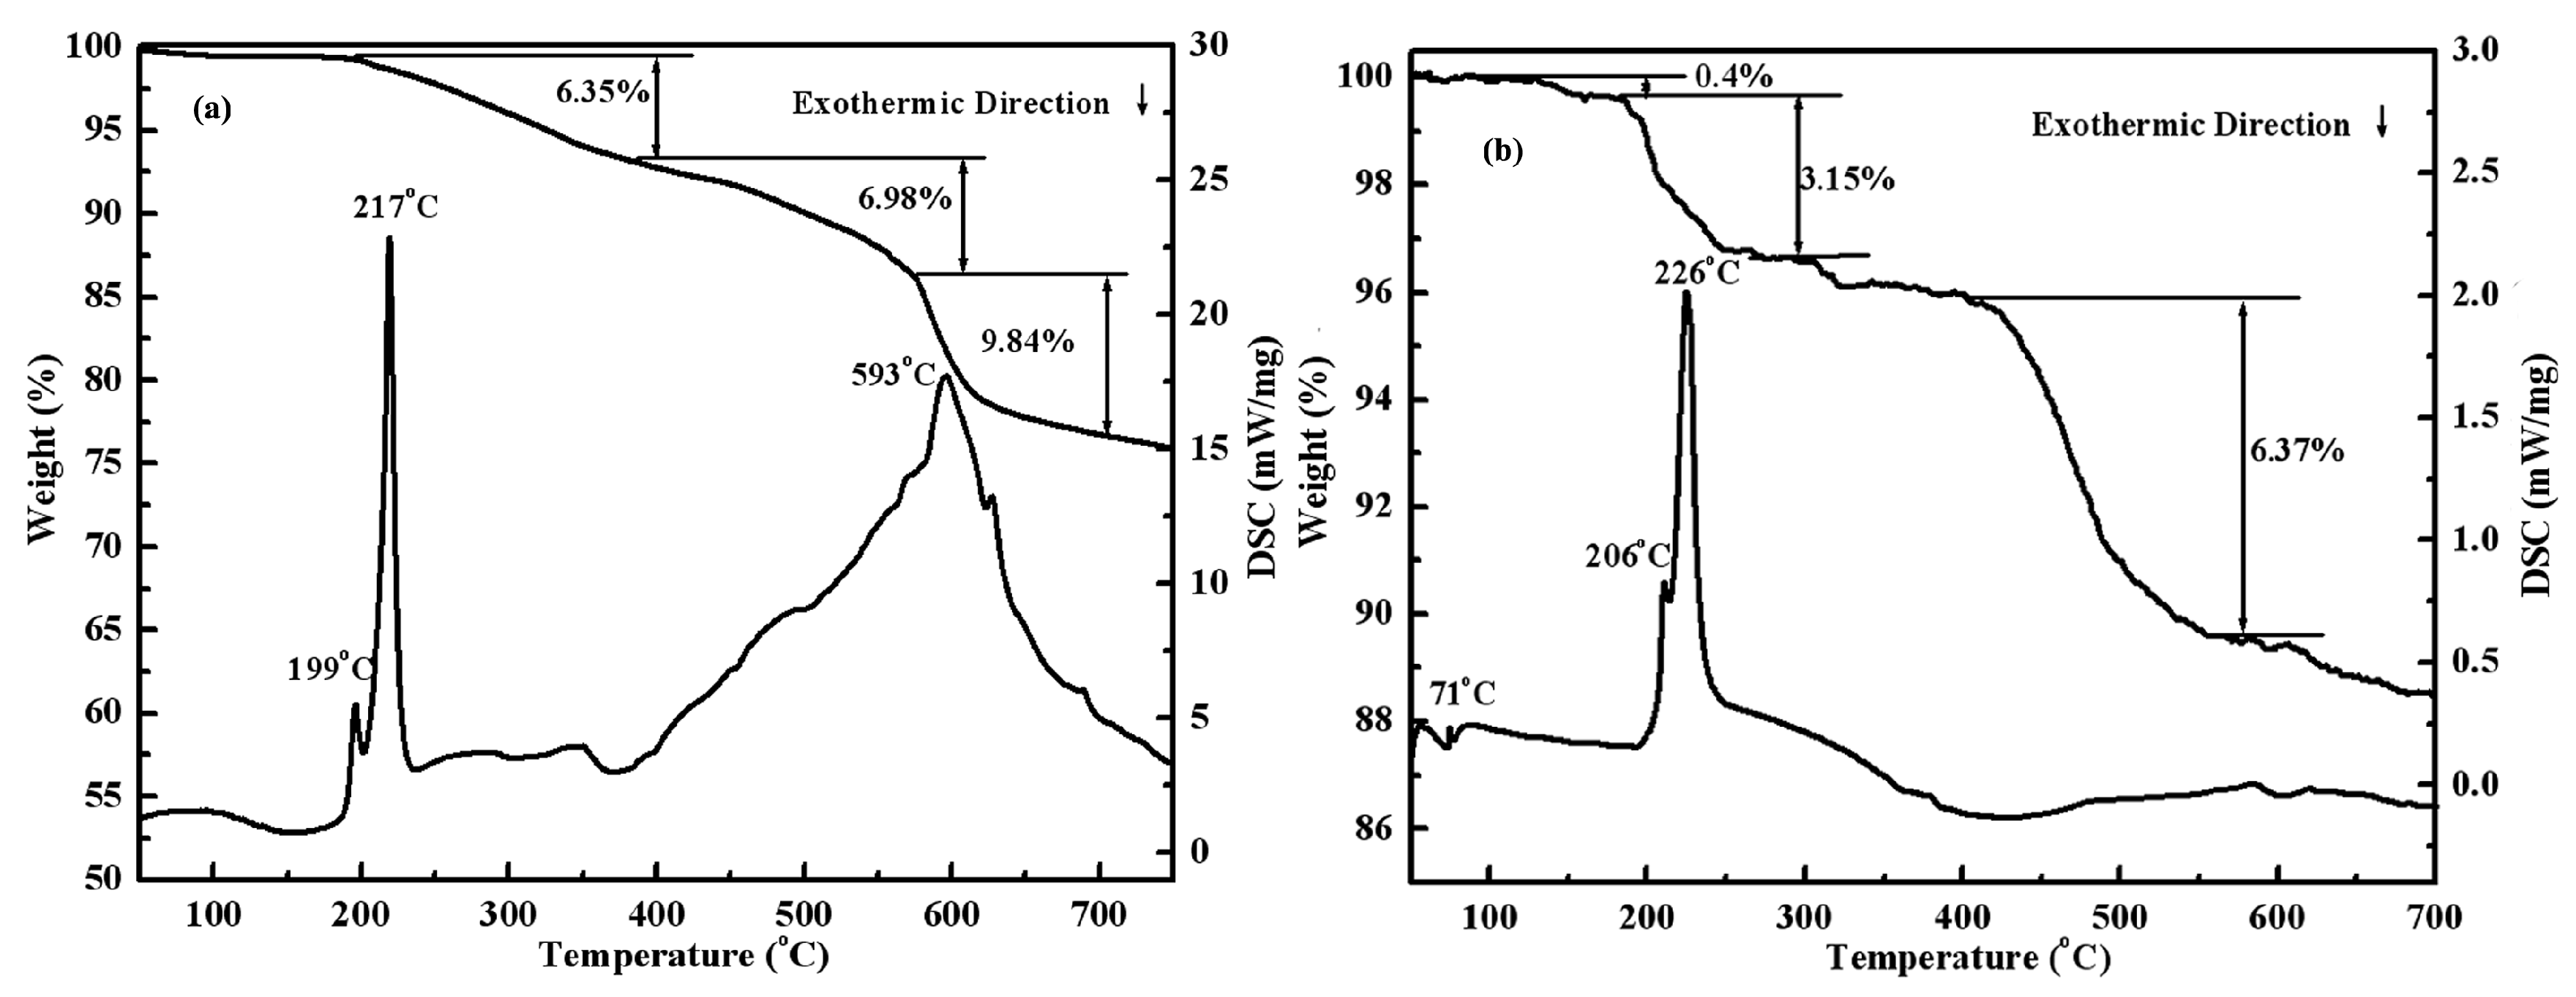
3.1. TG–DSC Results
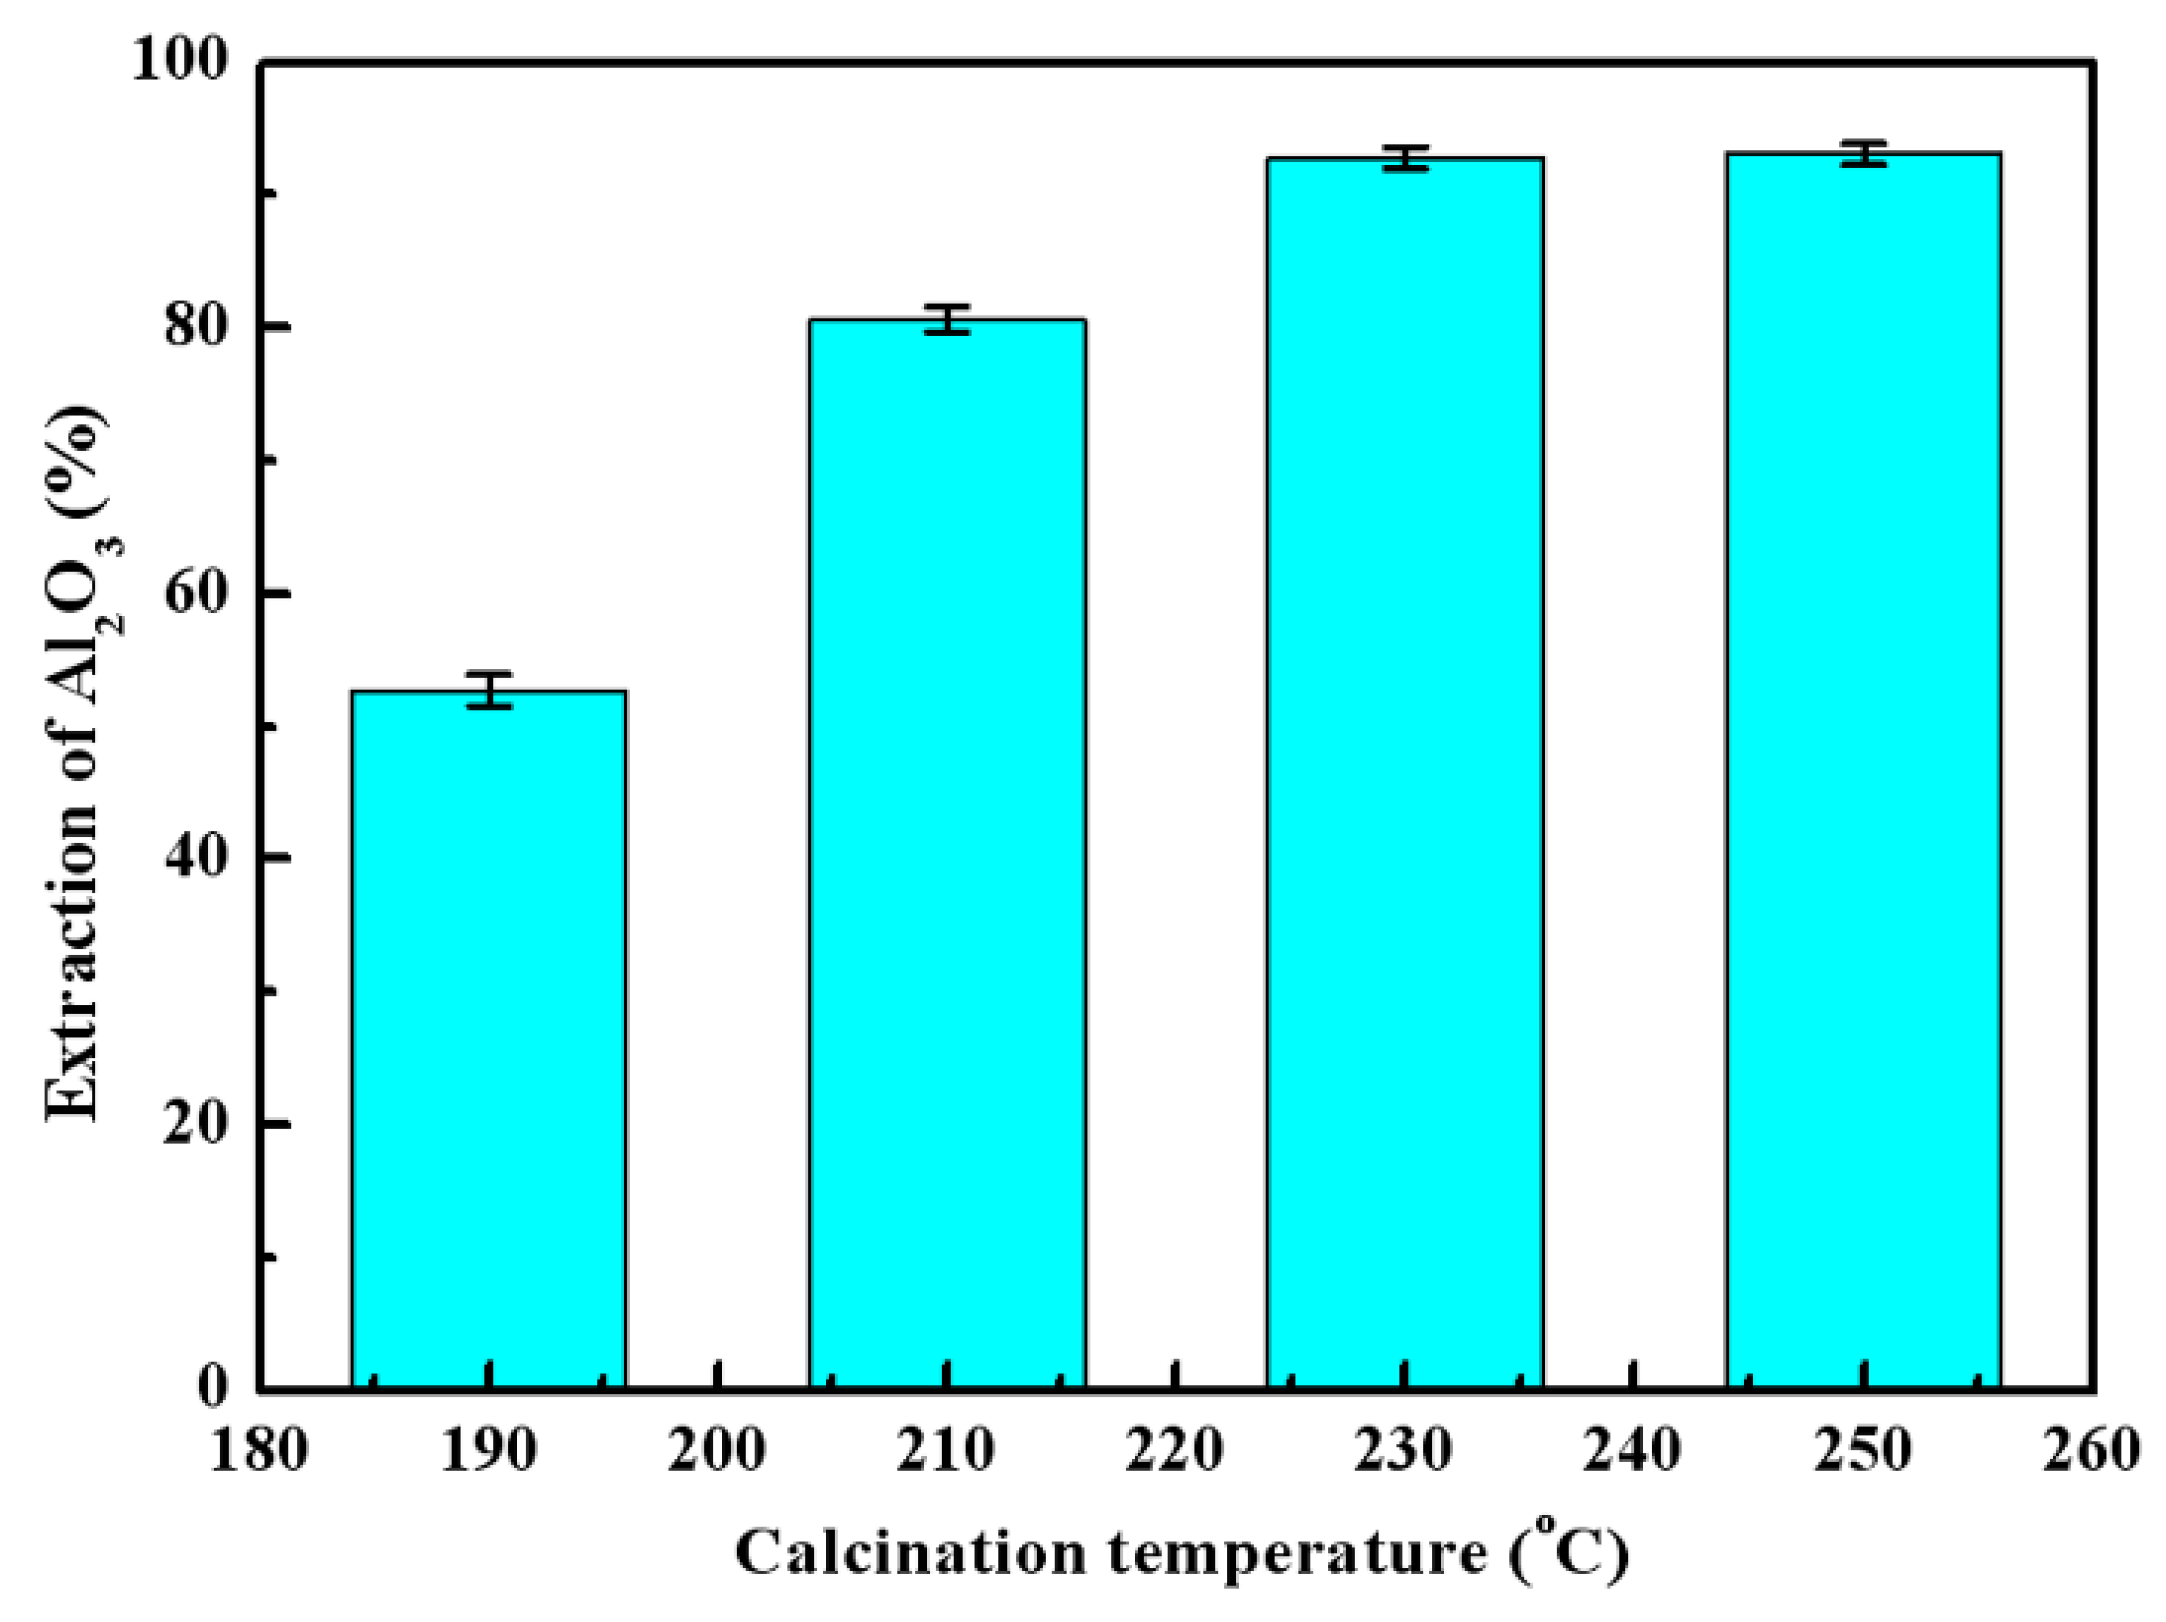
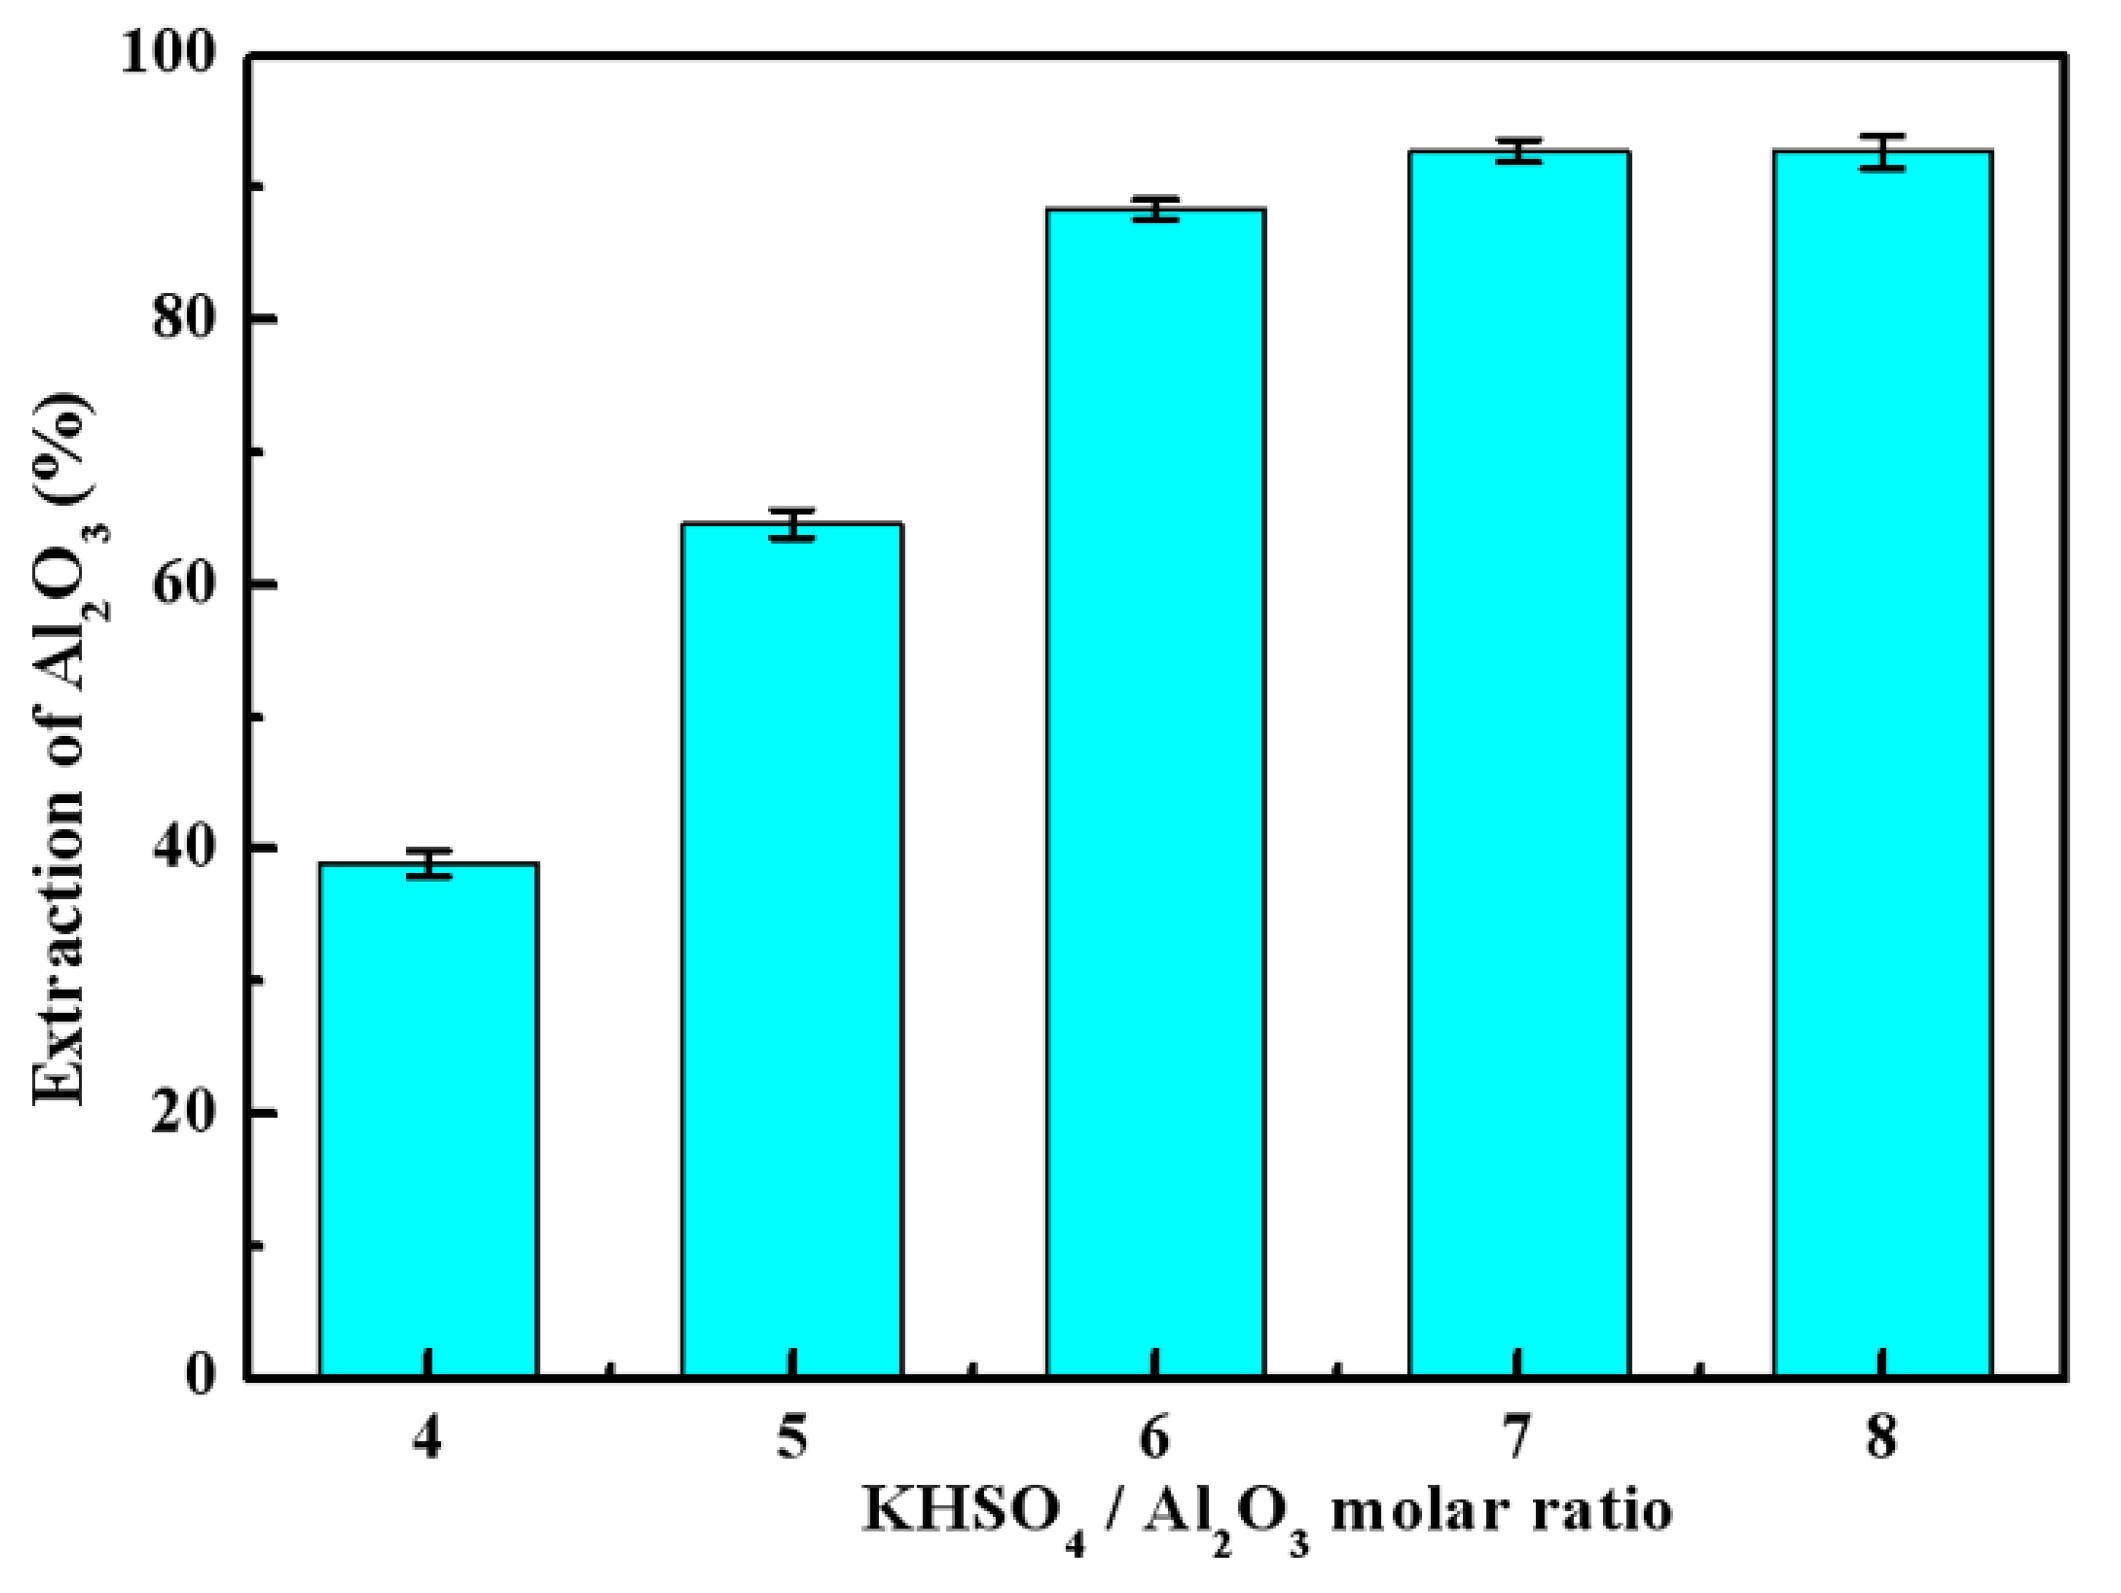
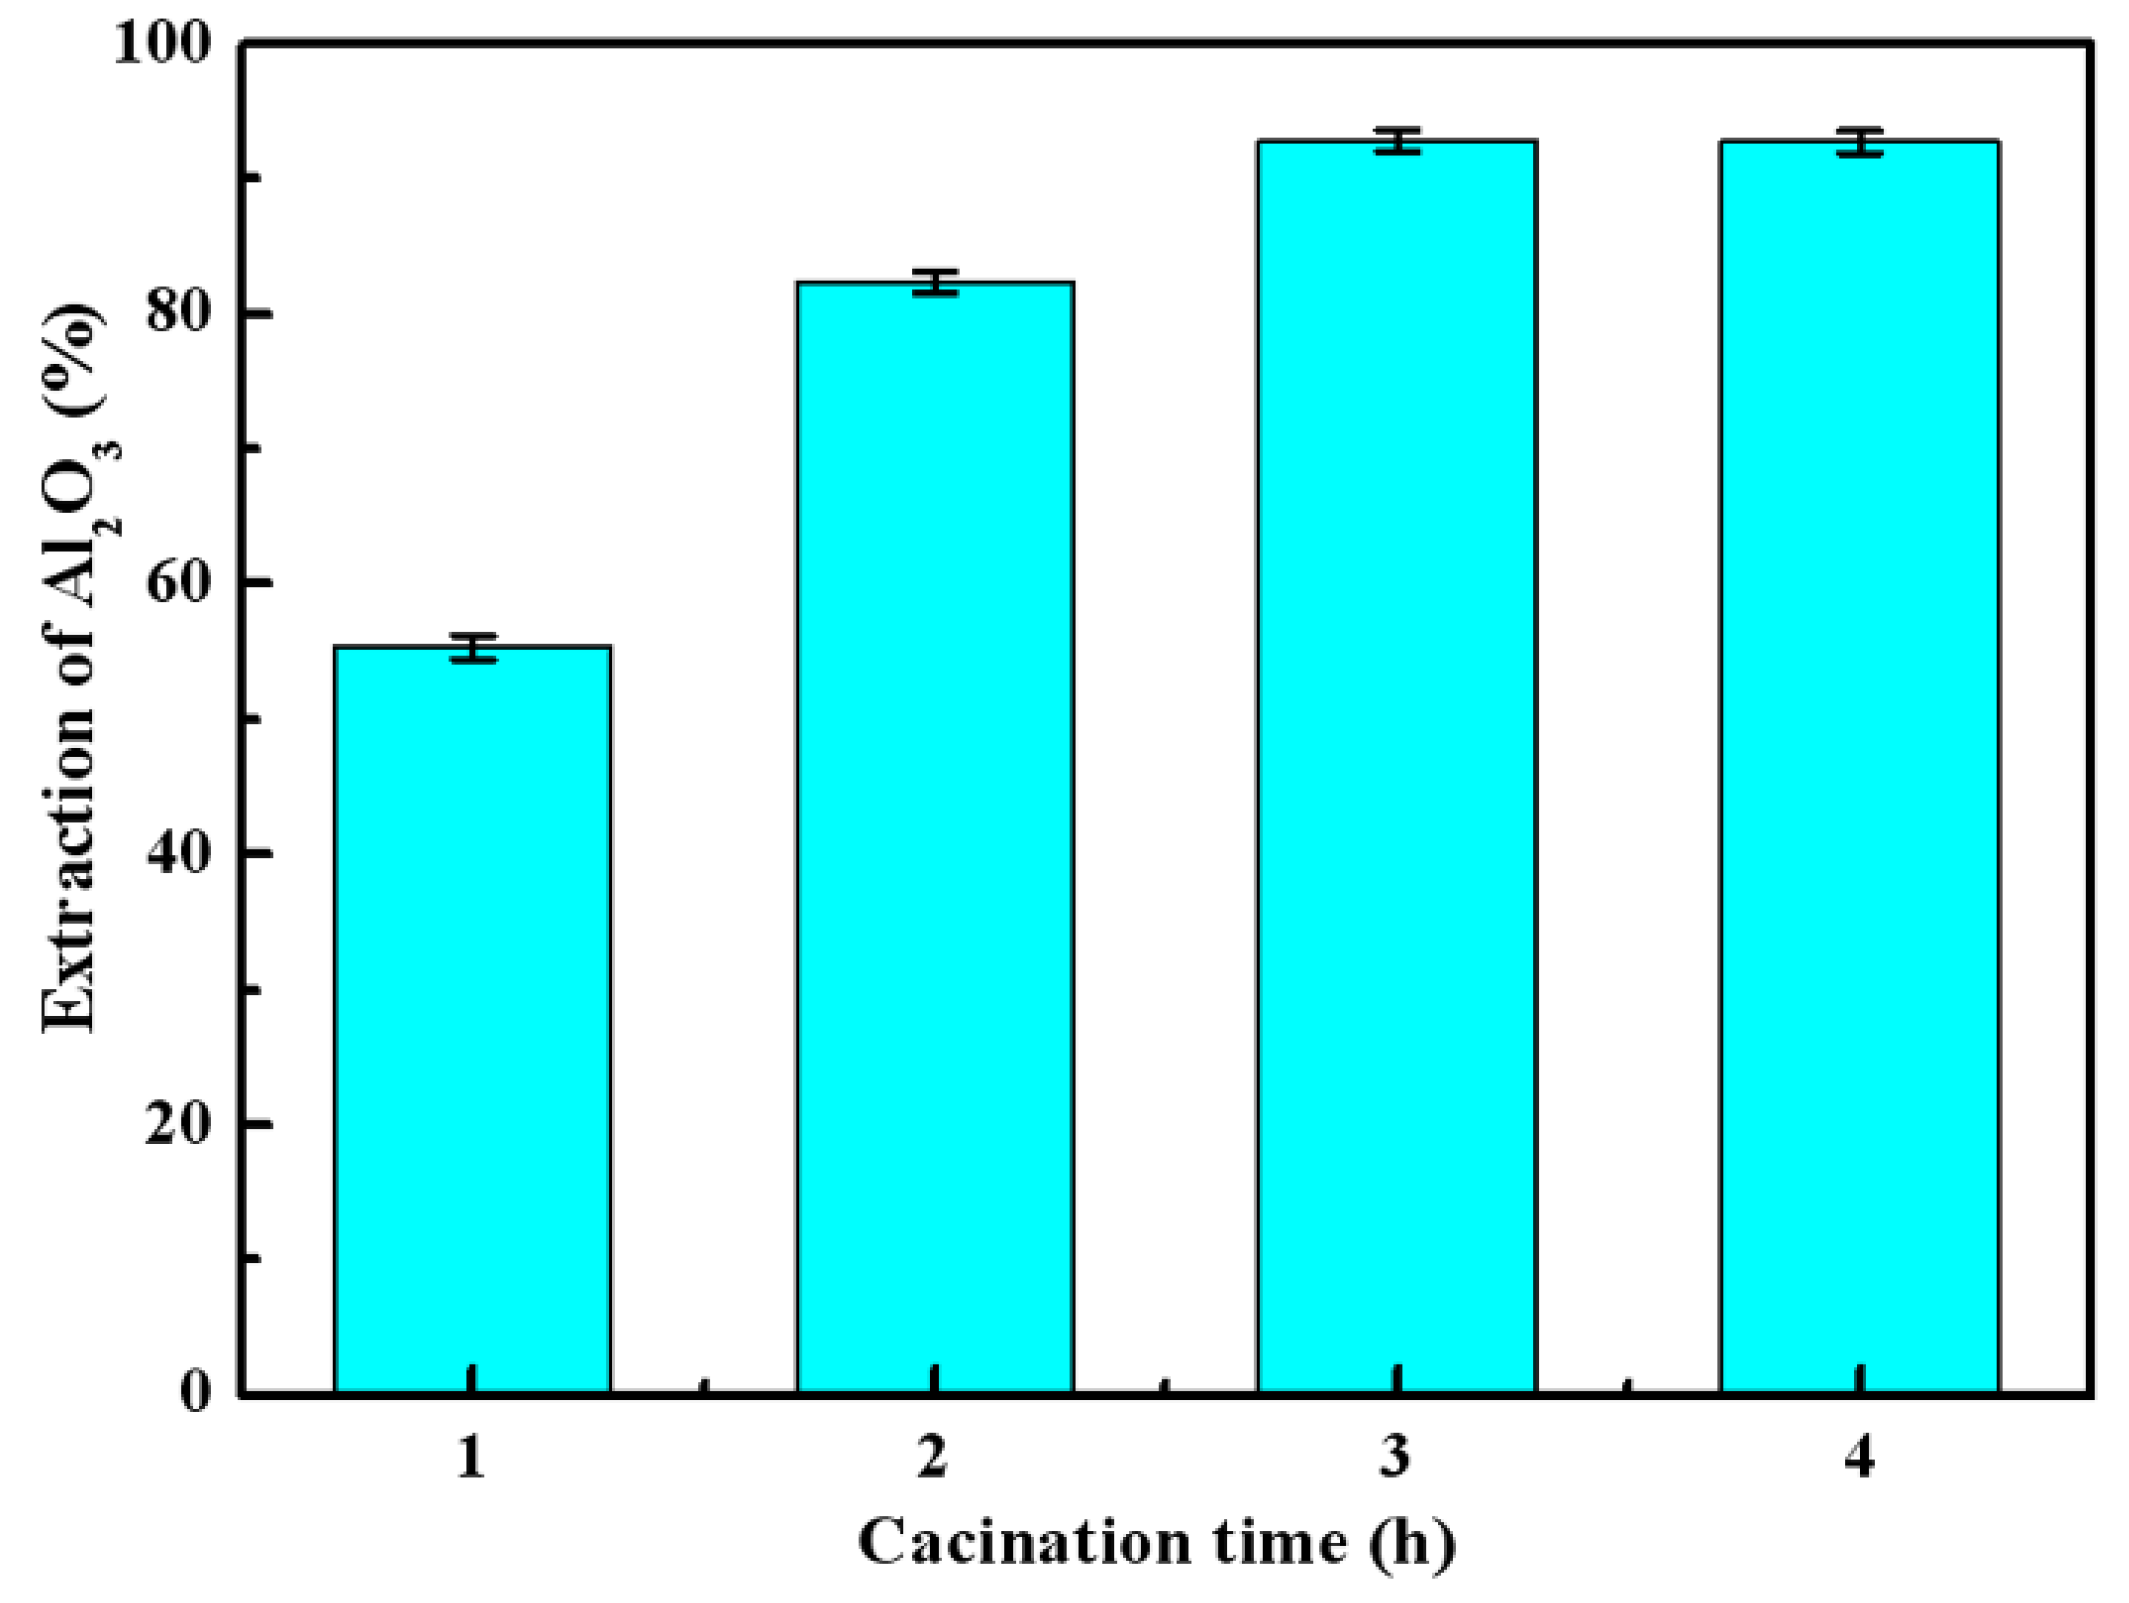
3.2. Effects of Calcination Parameters on Alumina Extraction Efficiency
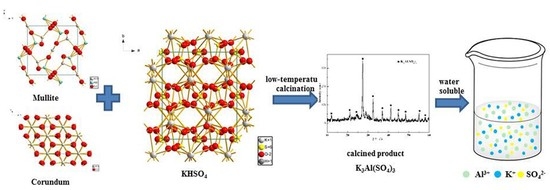
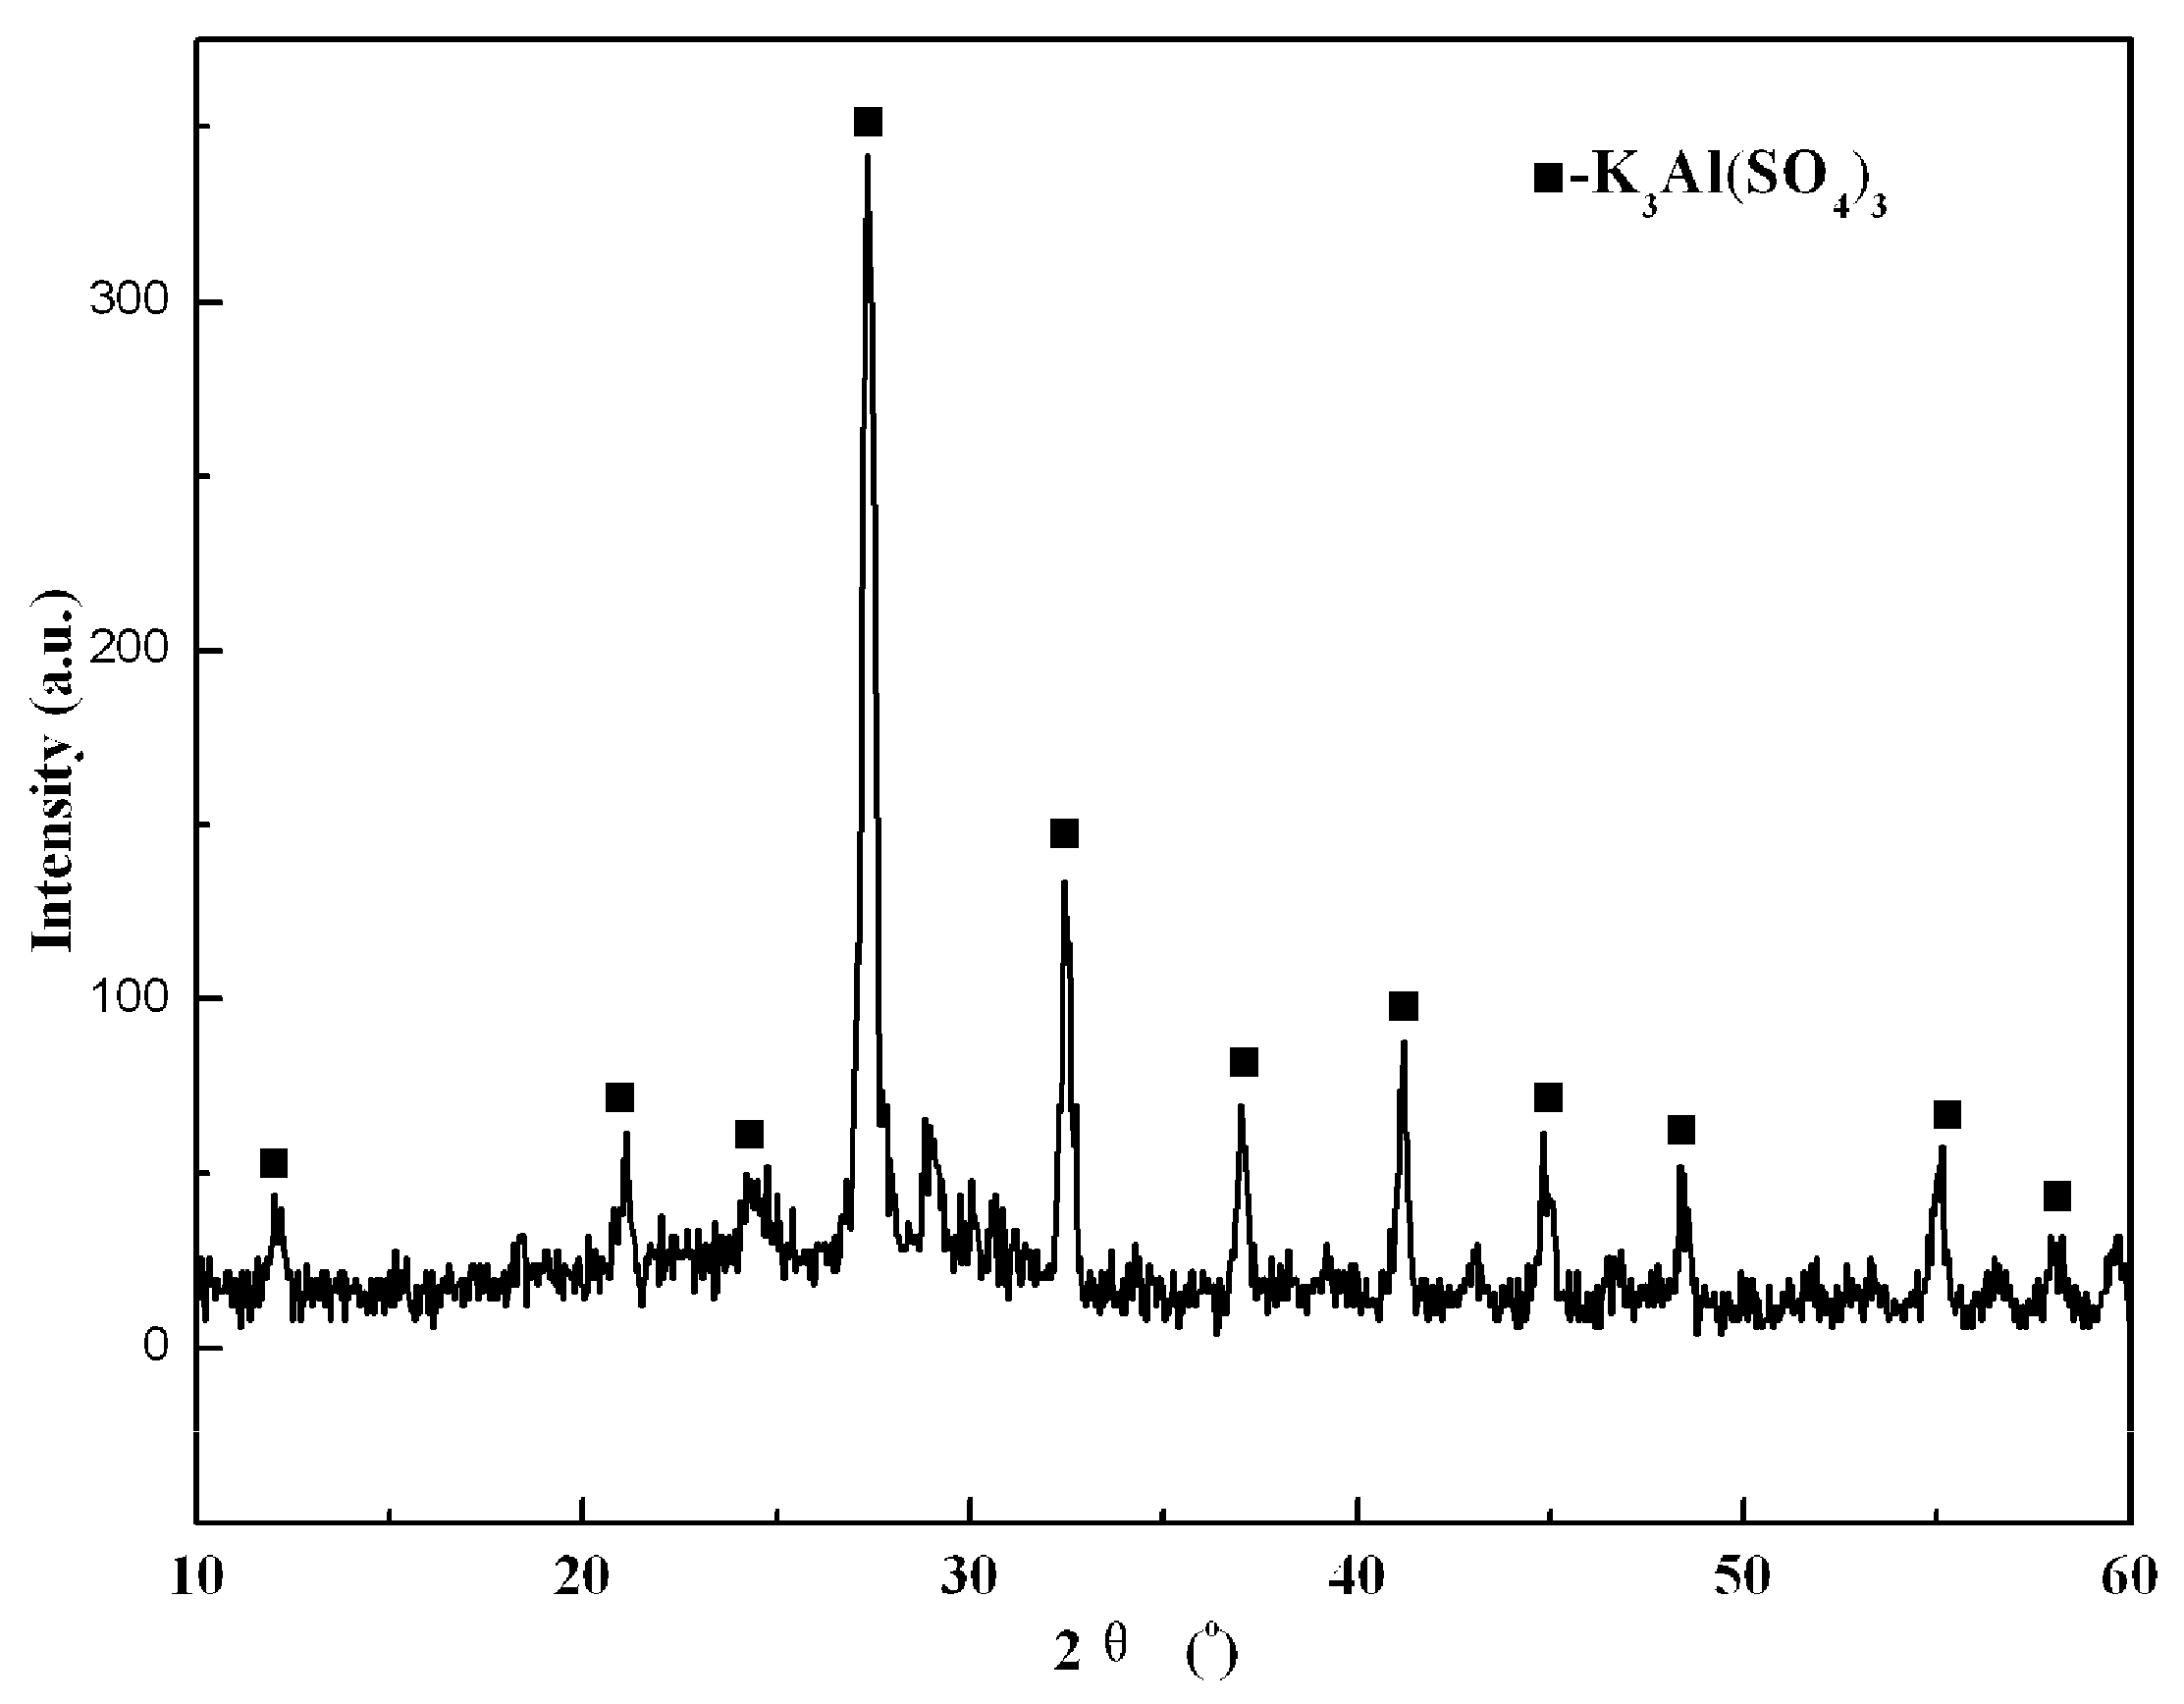
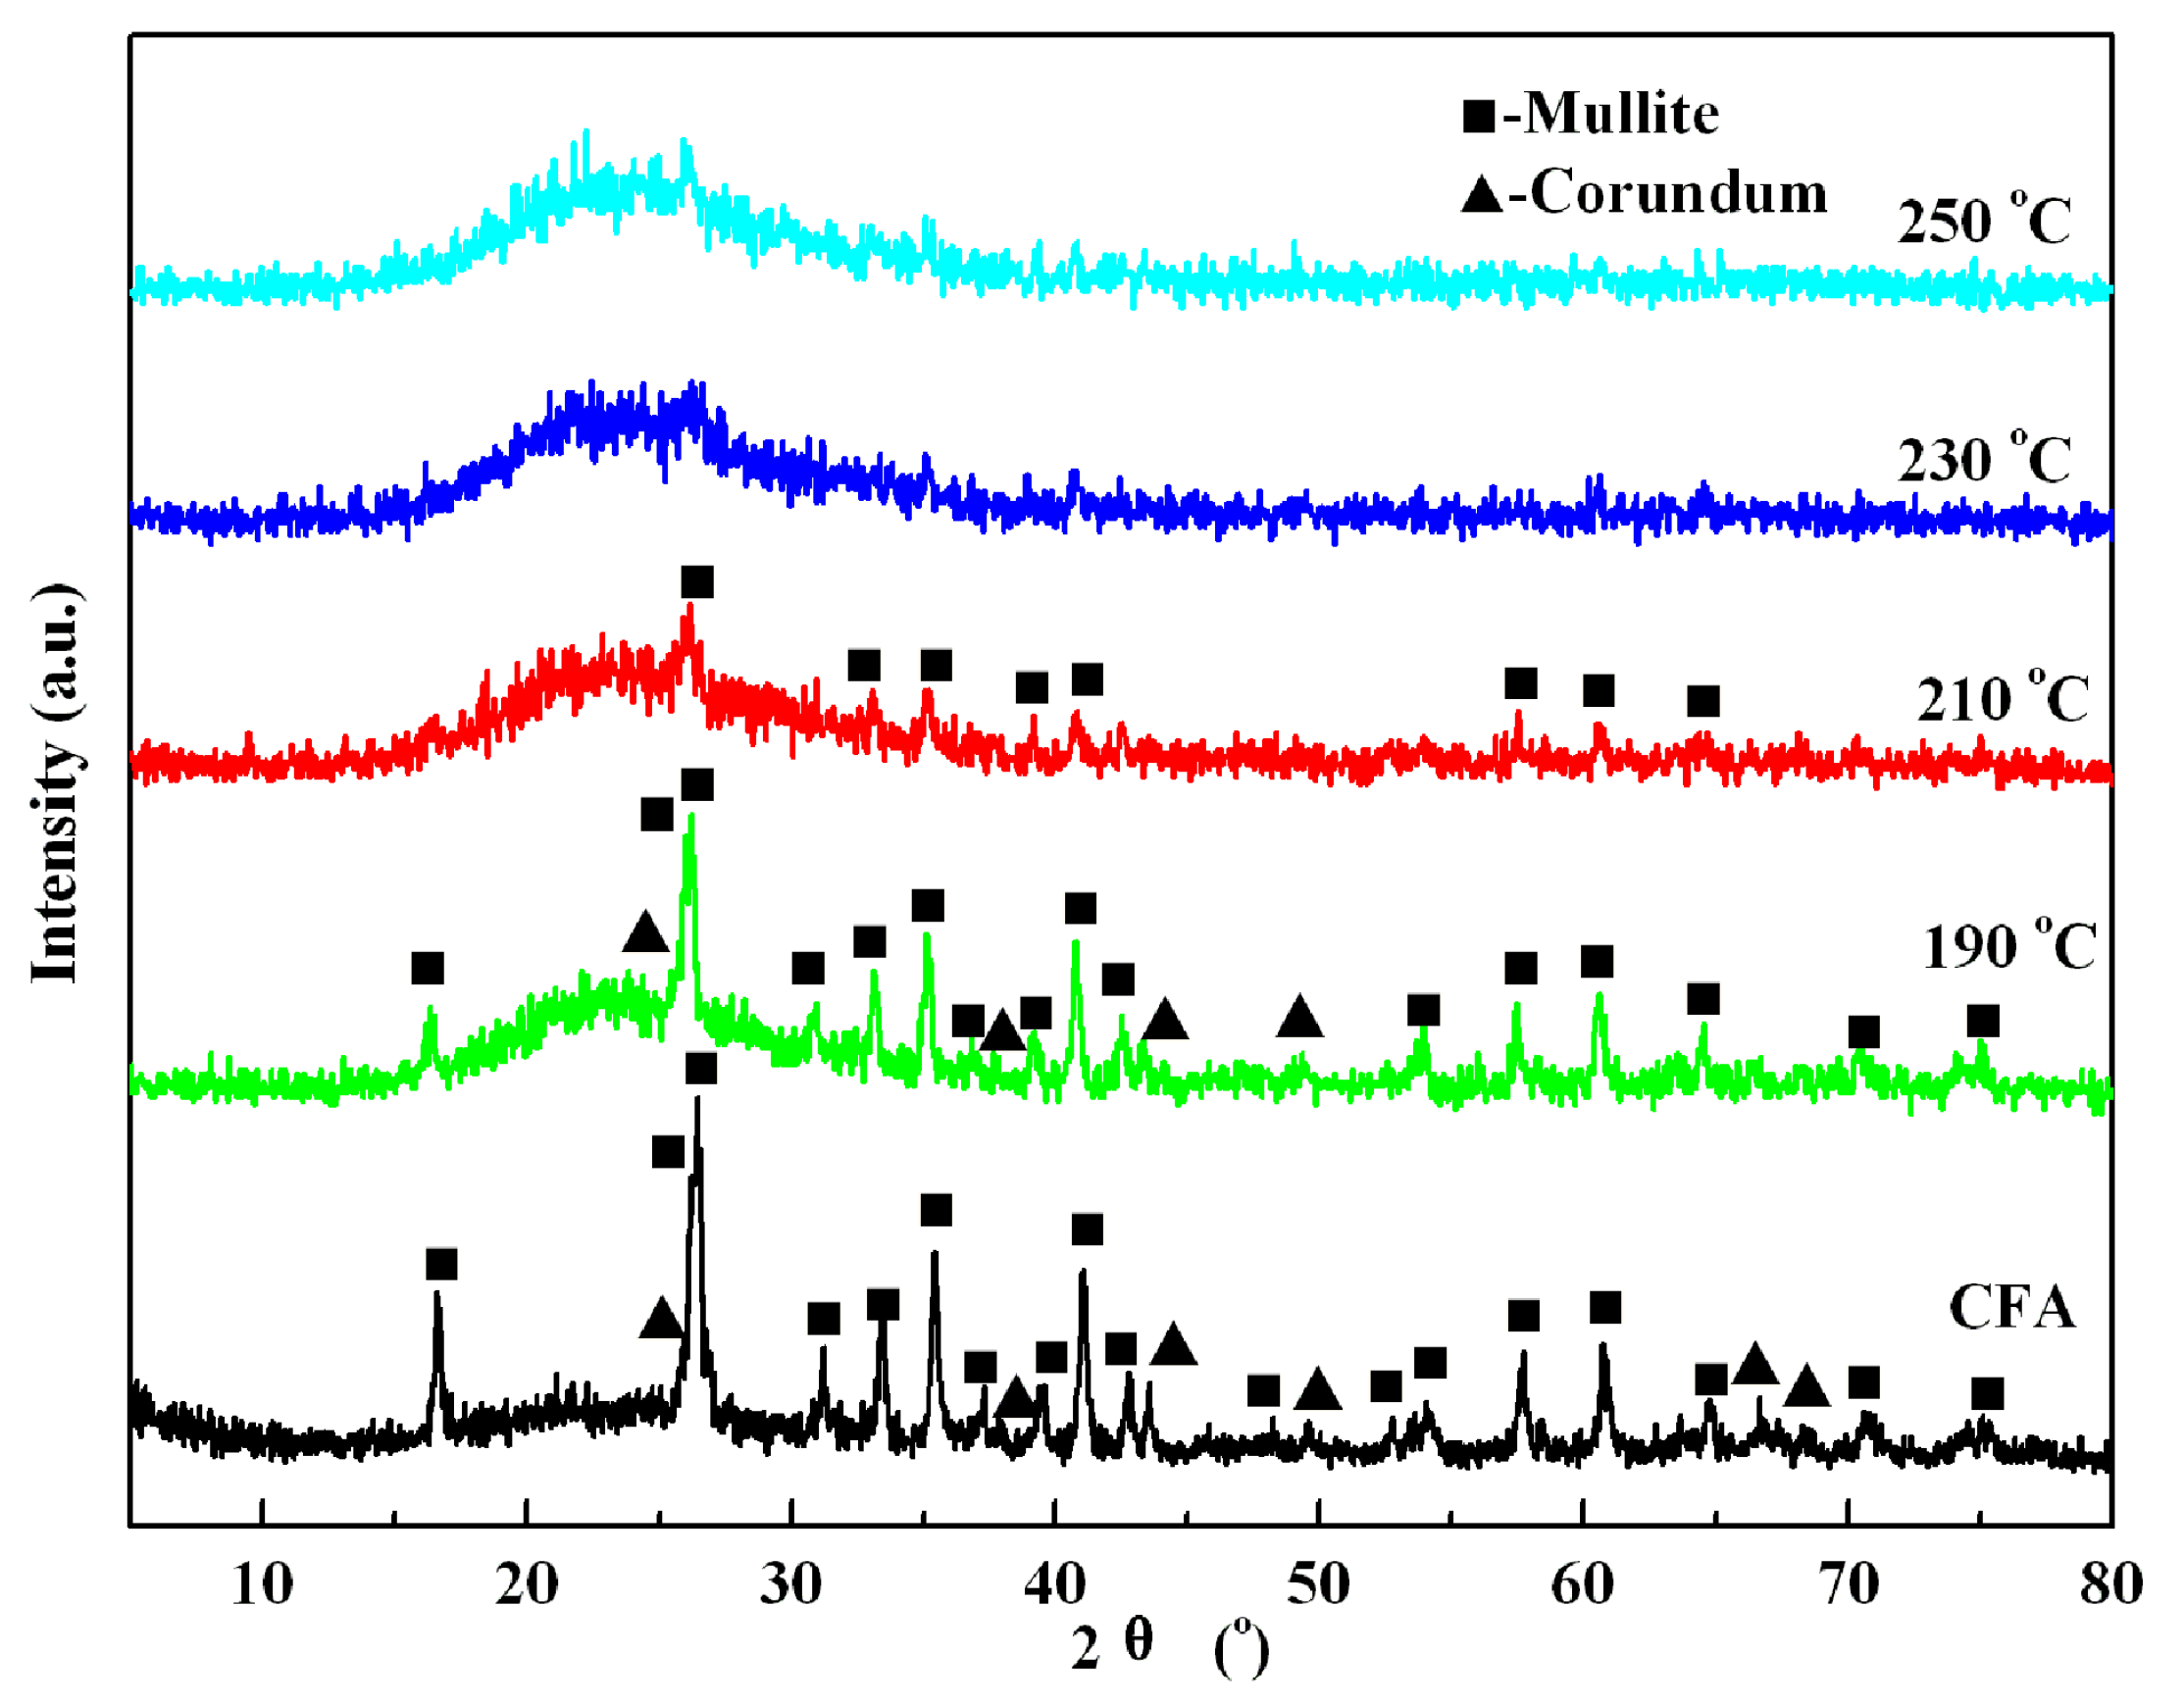
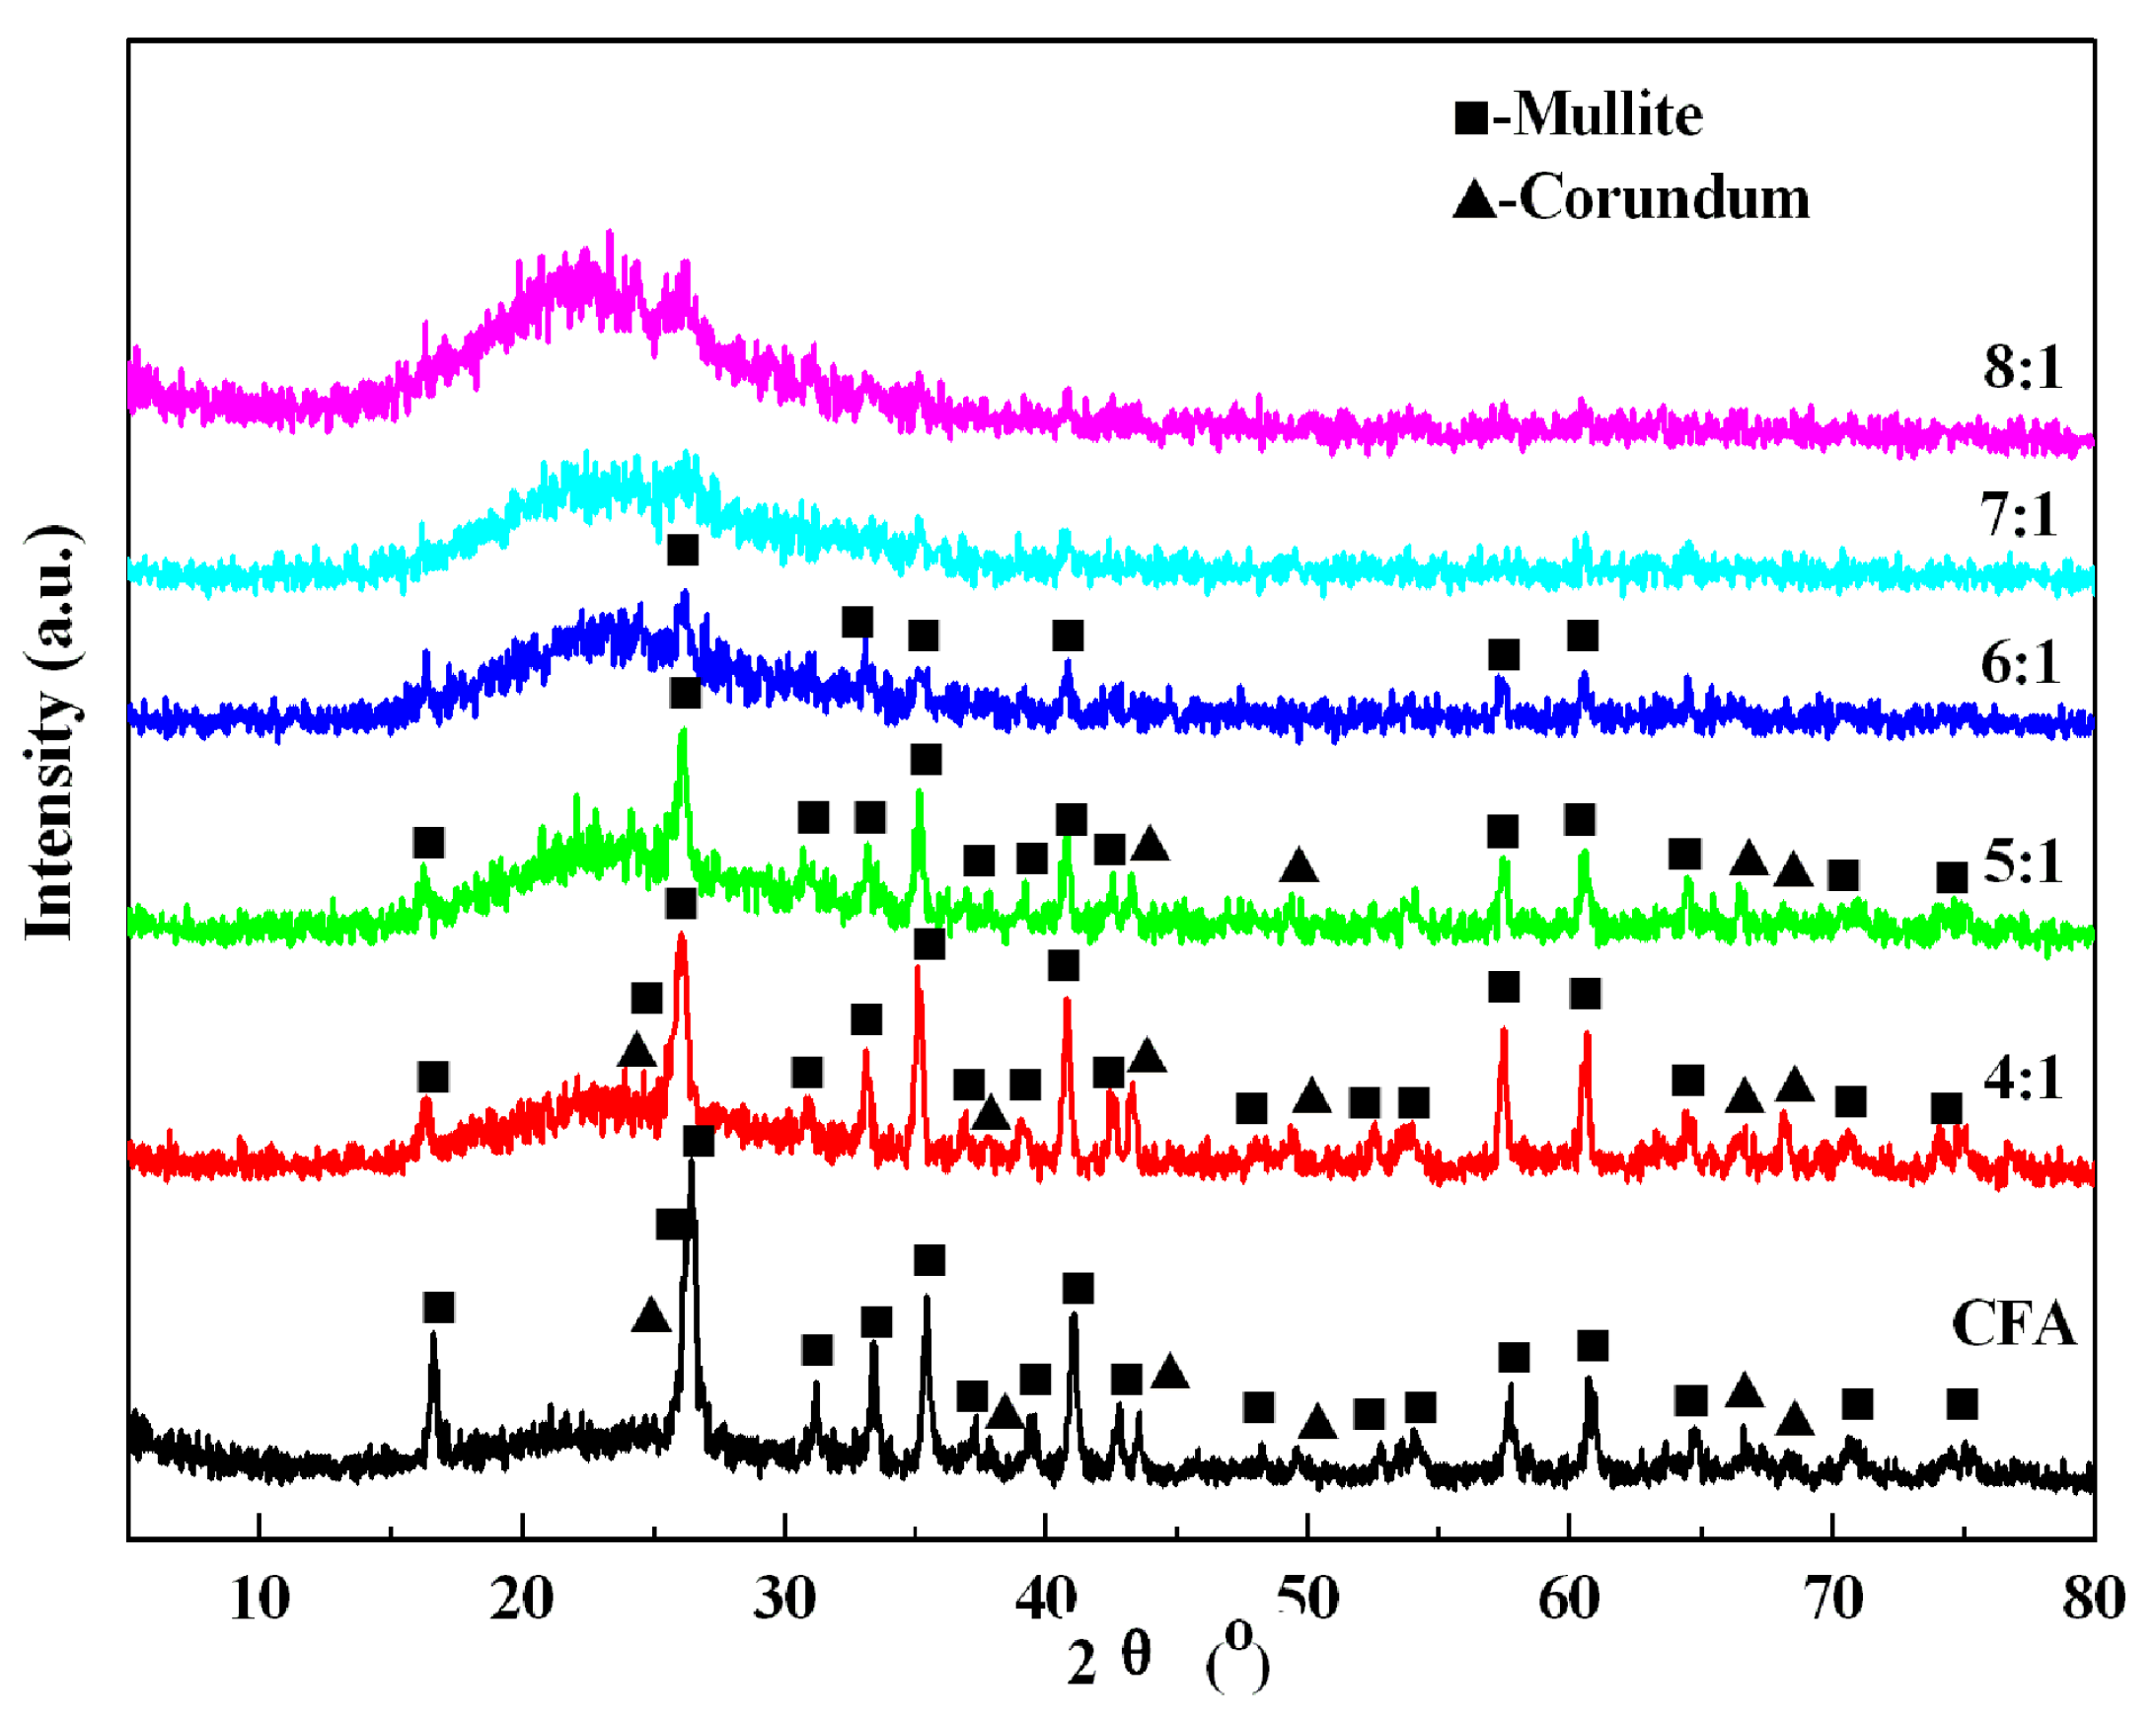
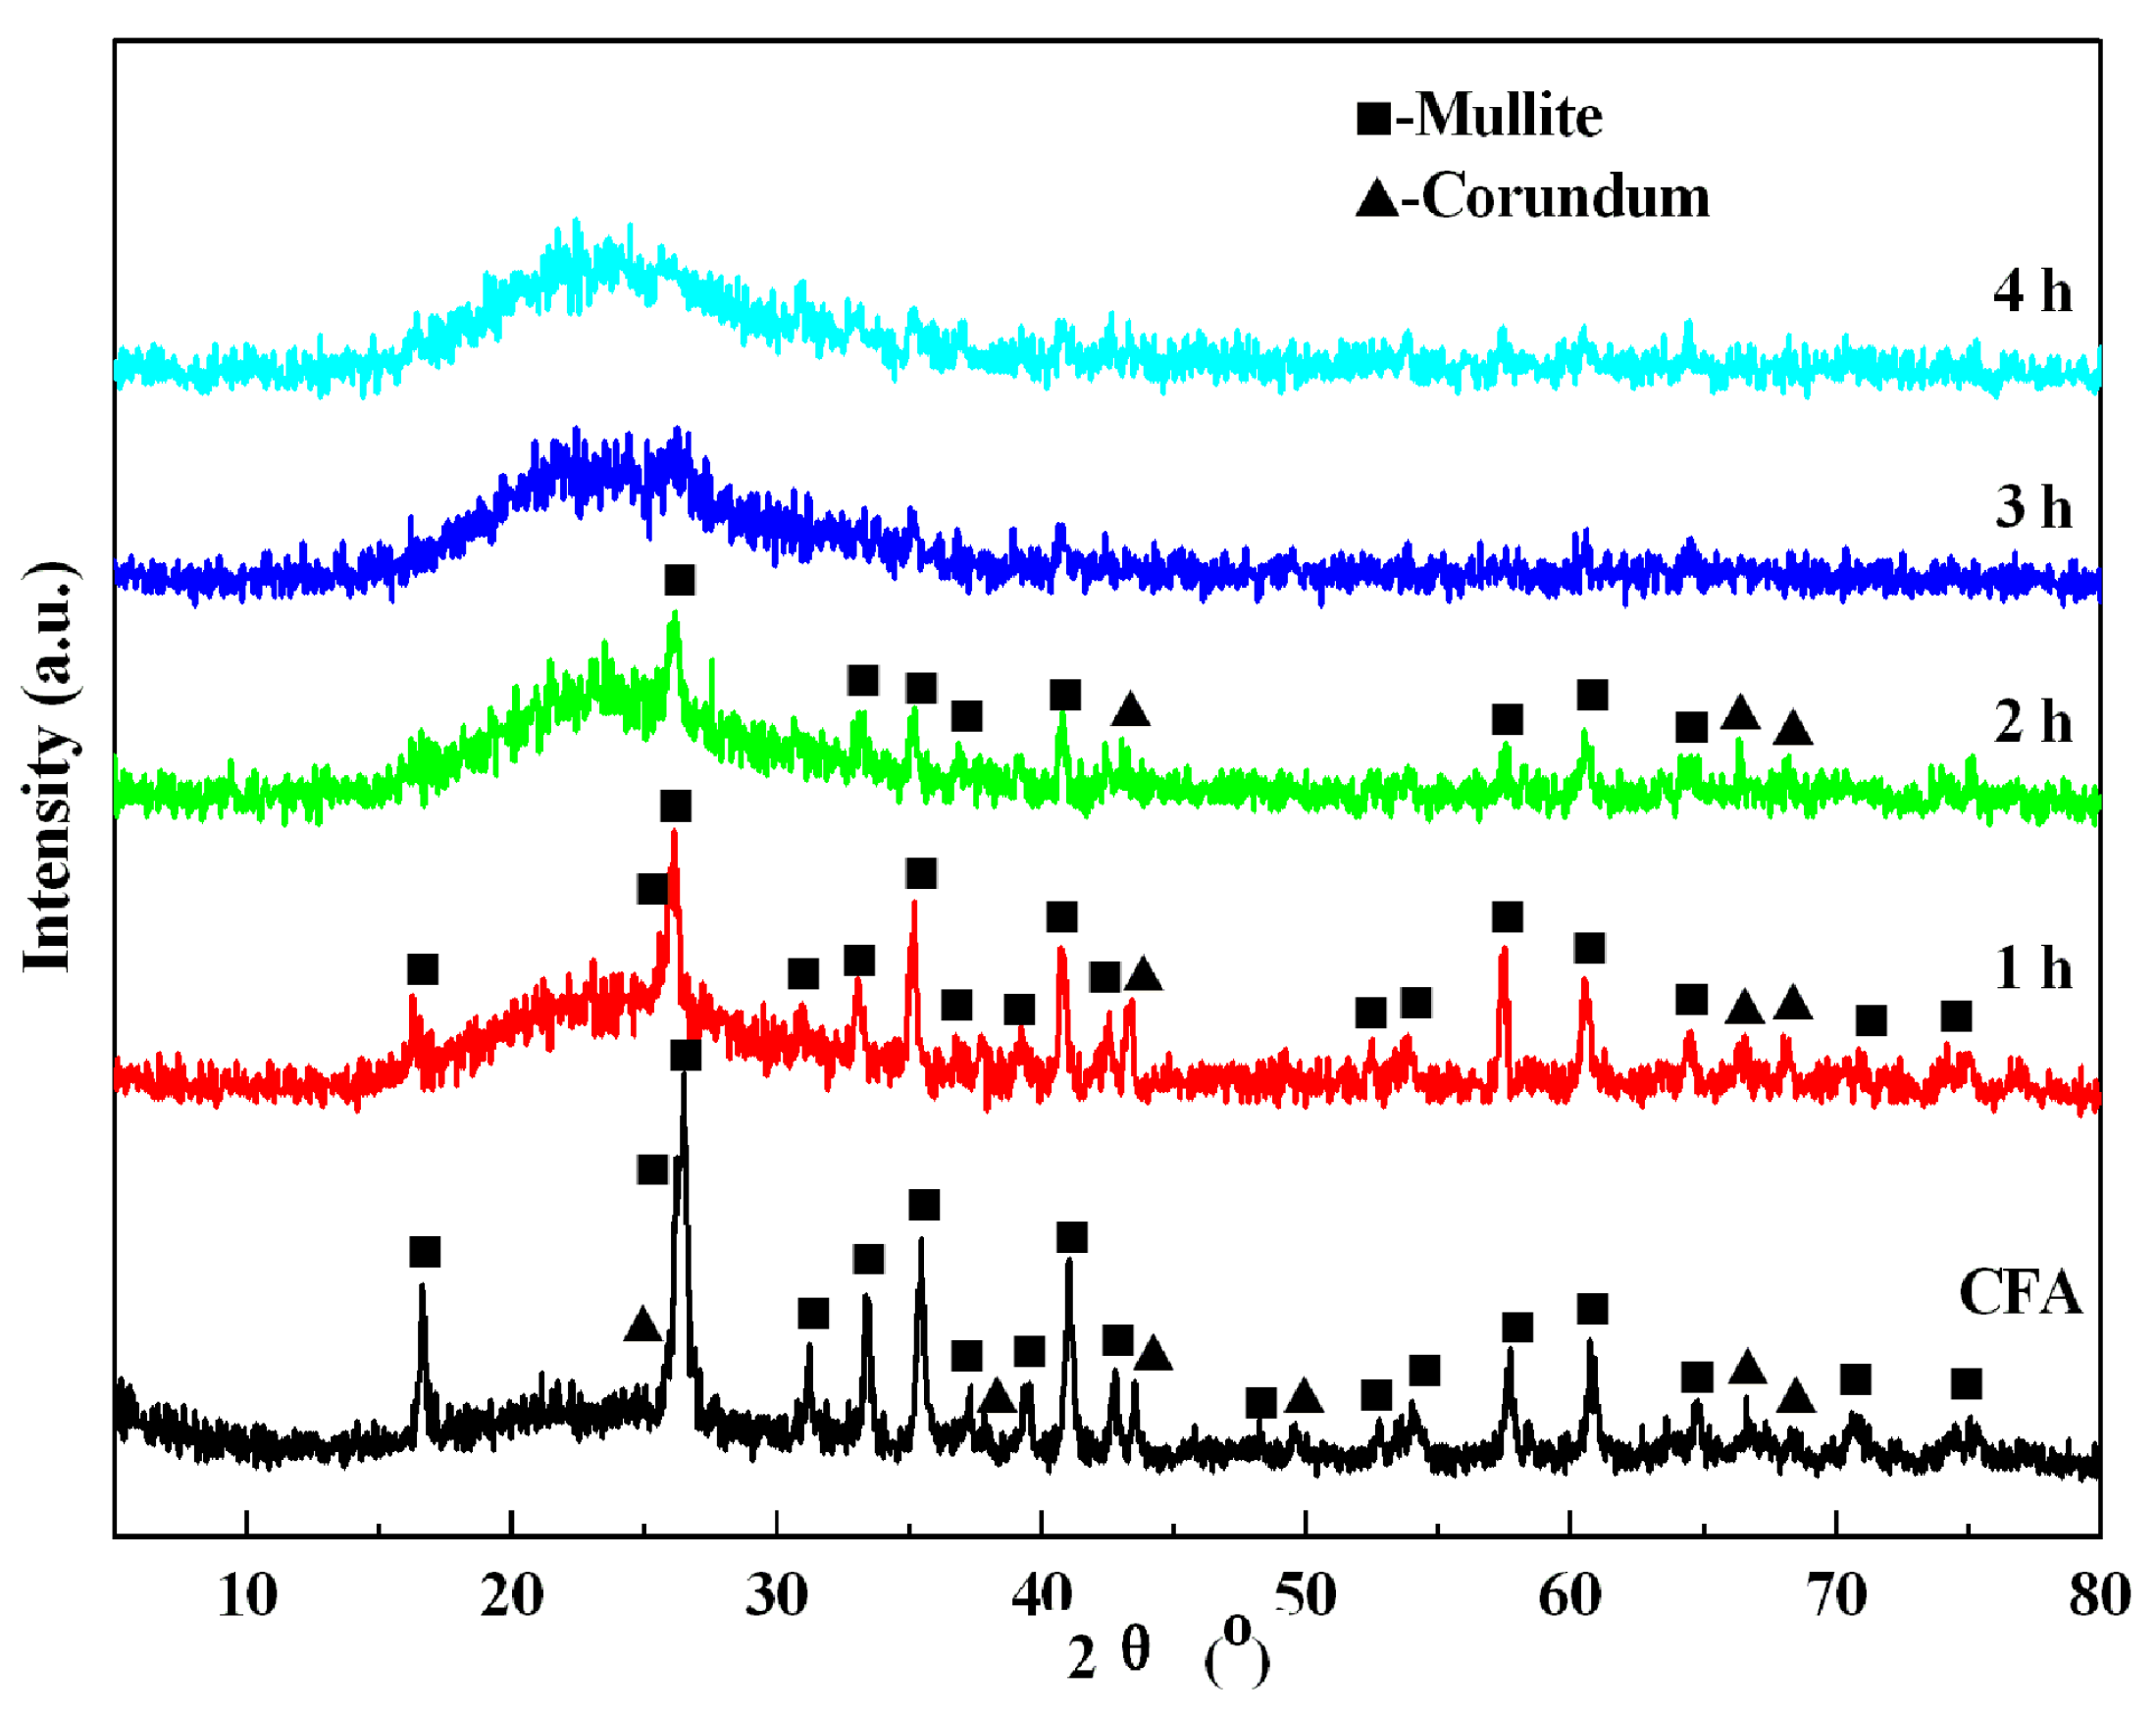
3.3. Decomposition Mechanism
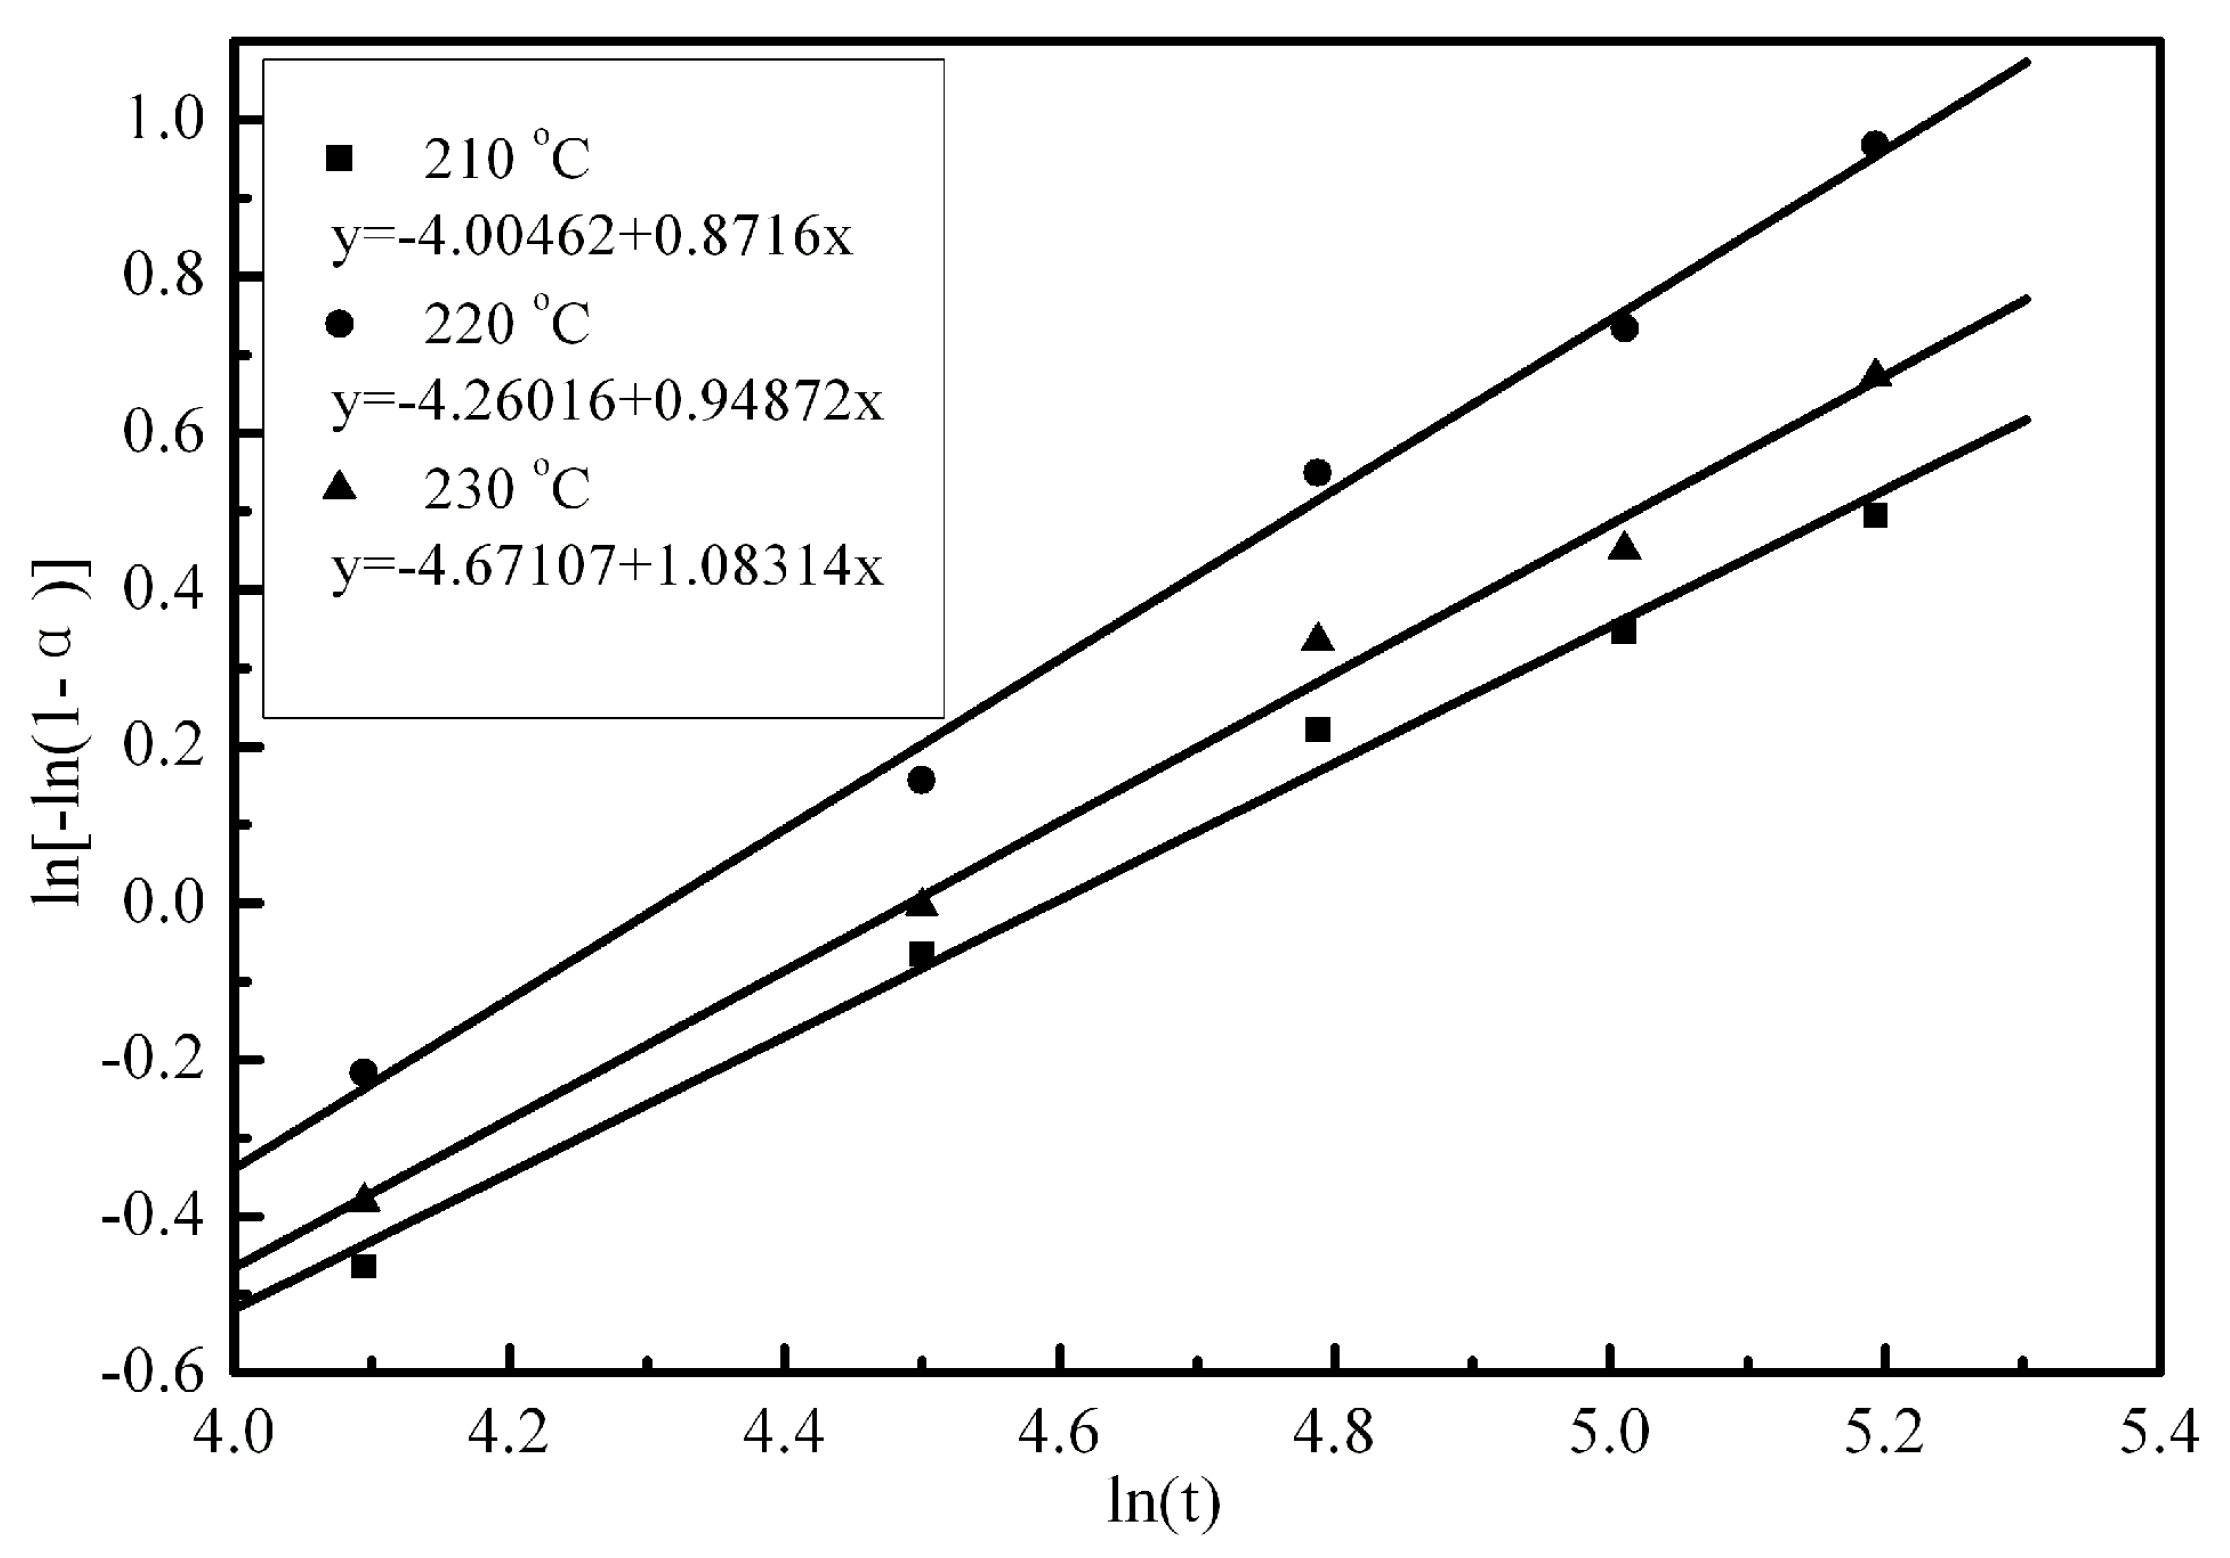
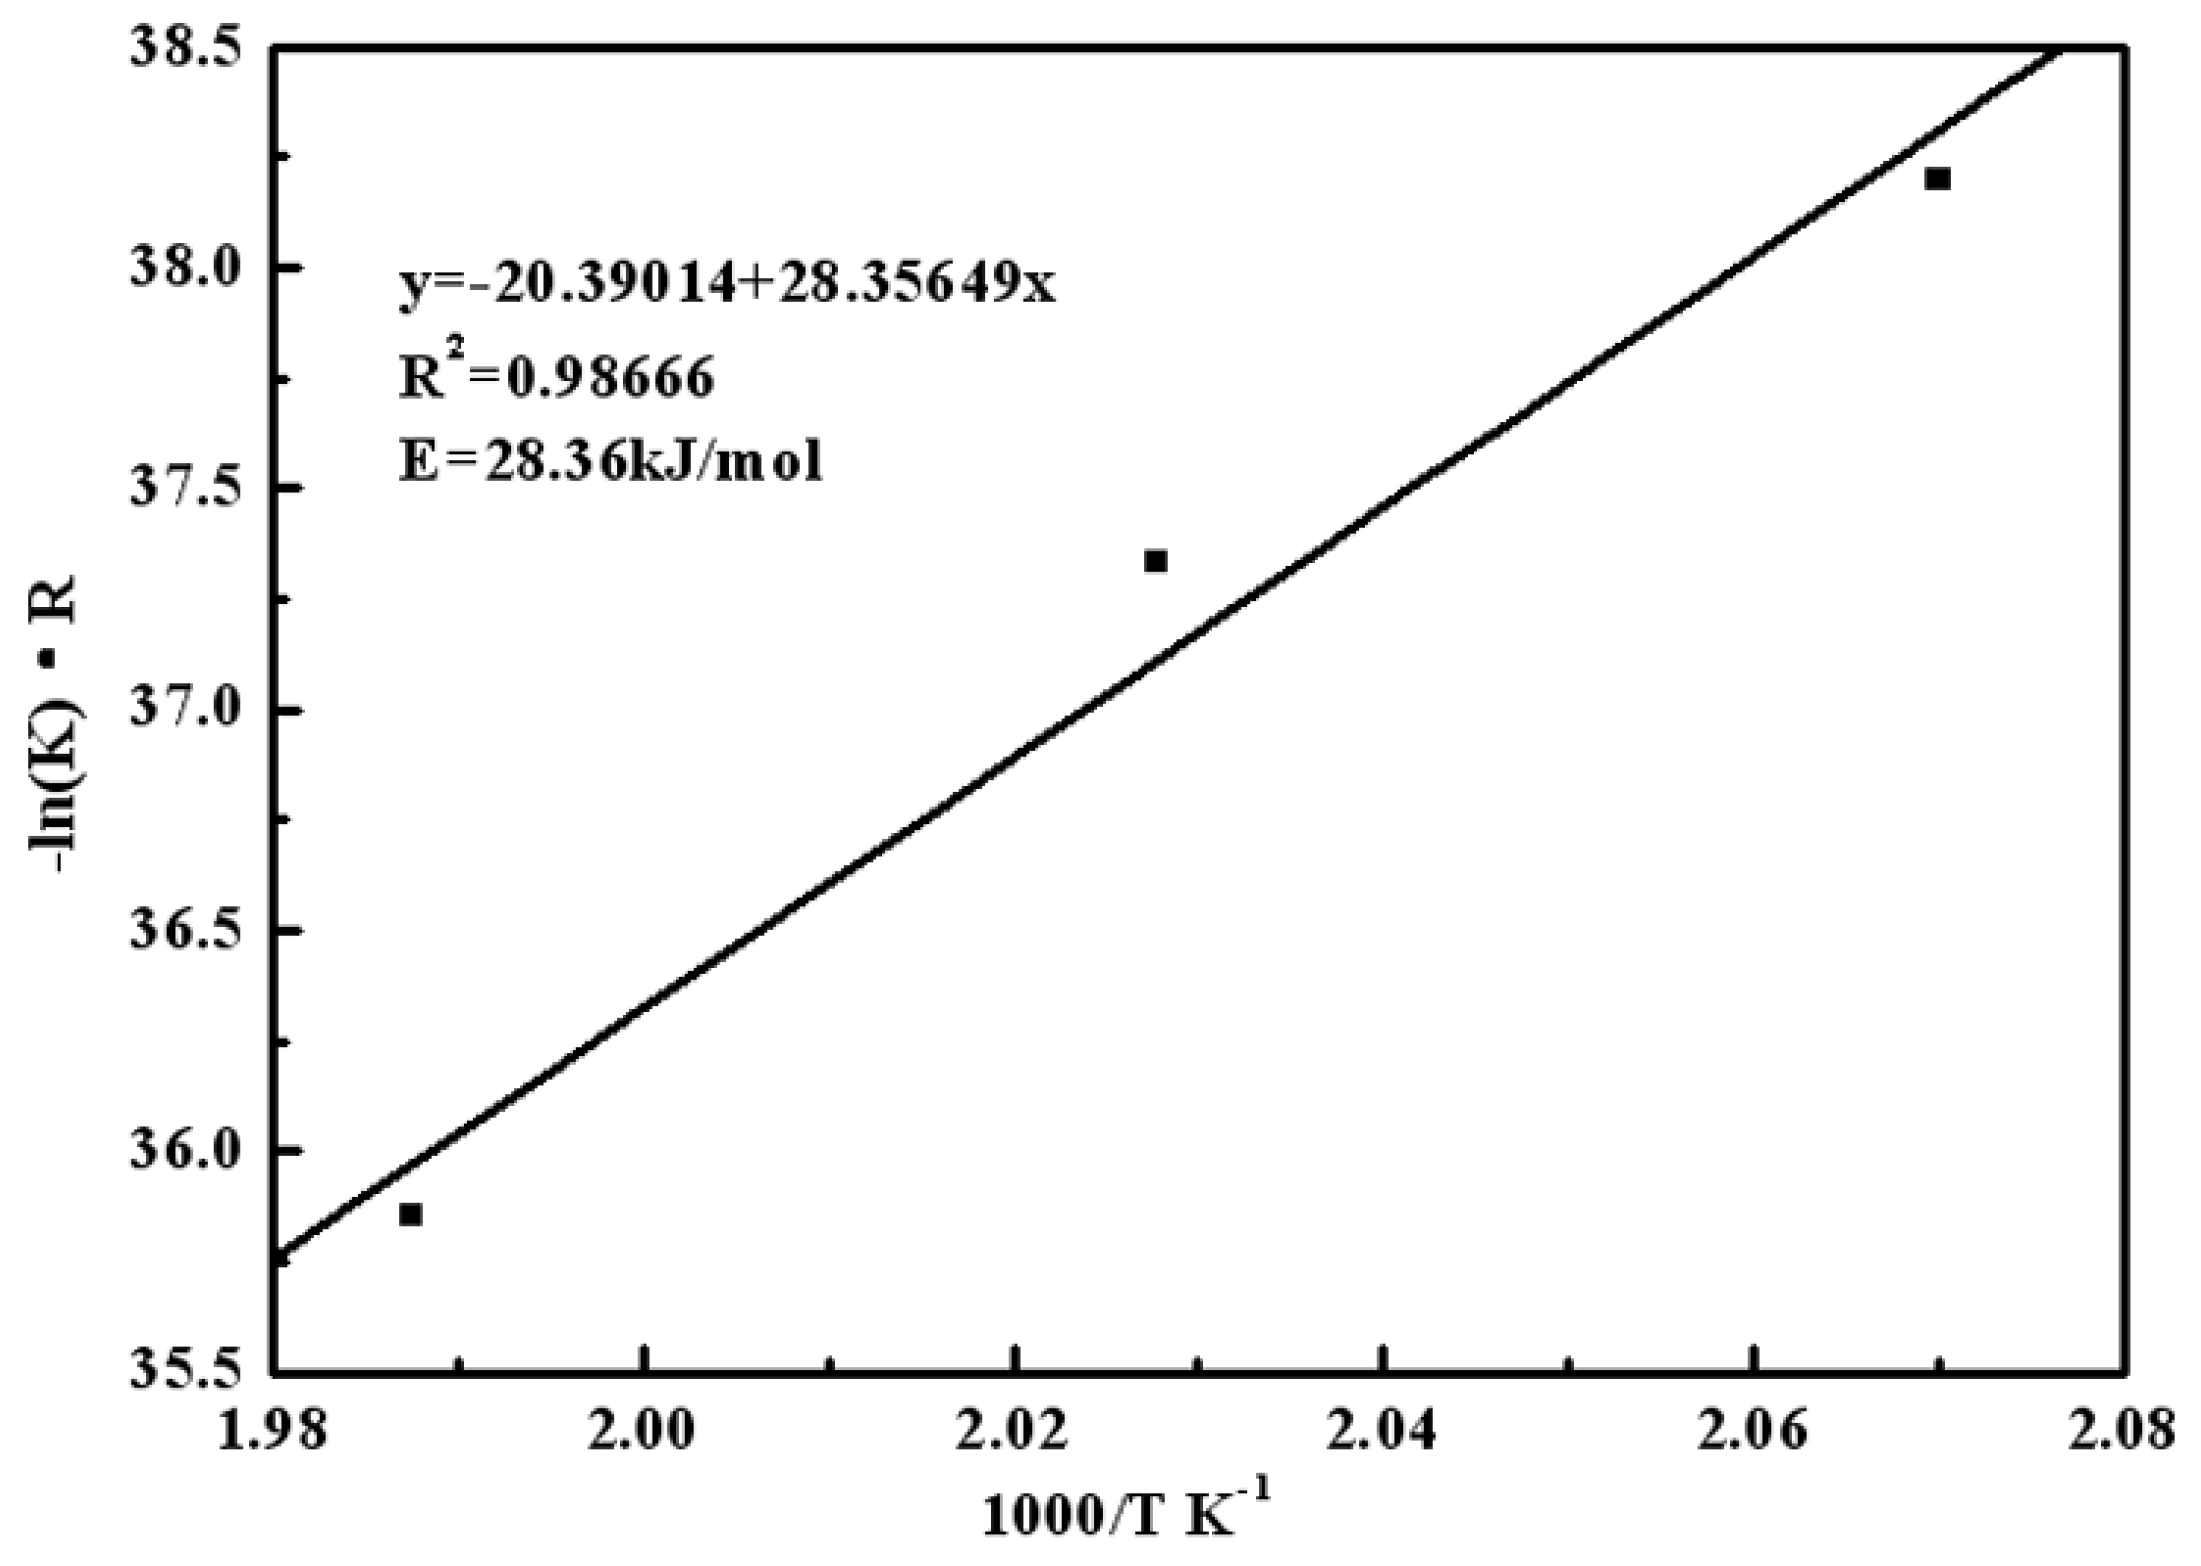
3.4. Analysis of Reaction Kinetics Using Kinetic Model
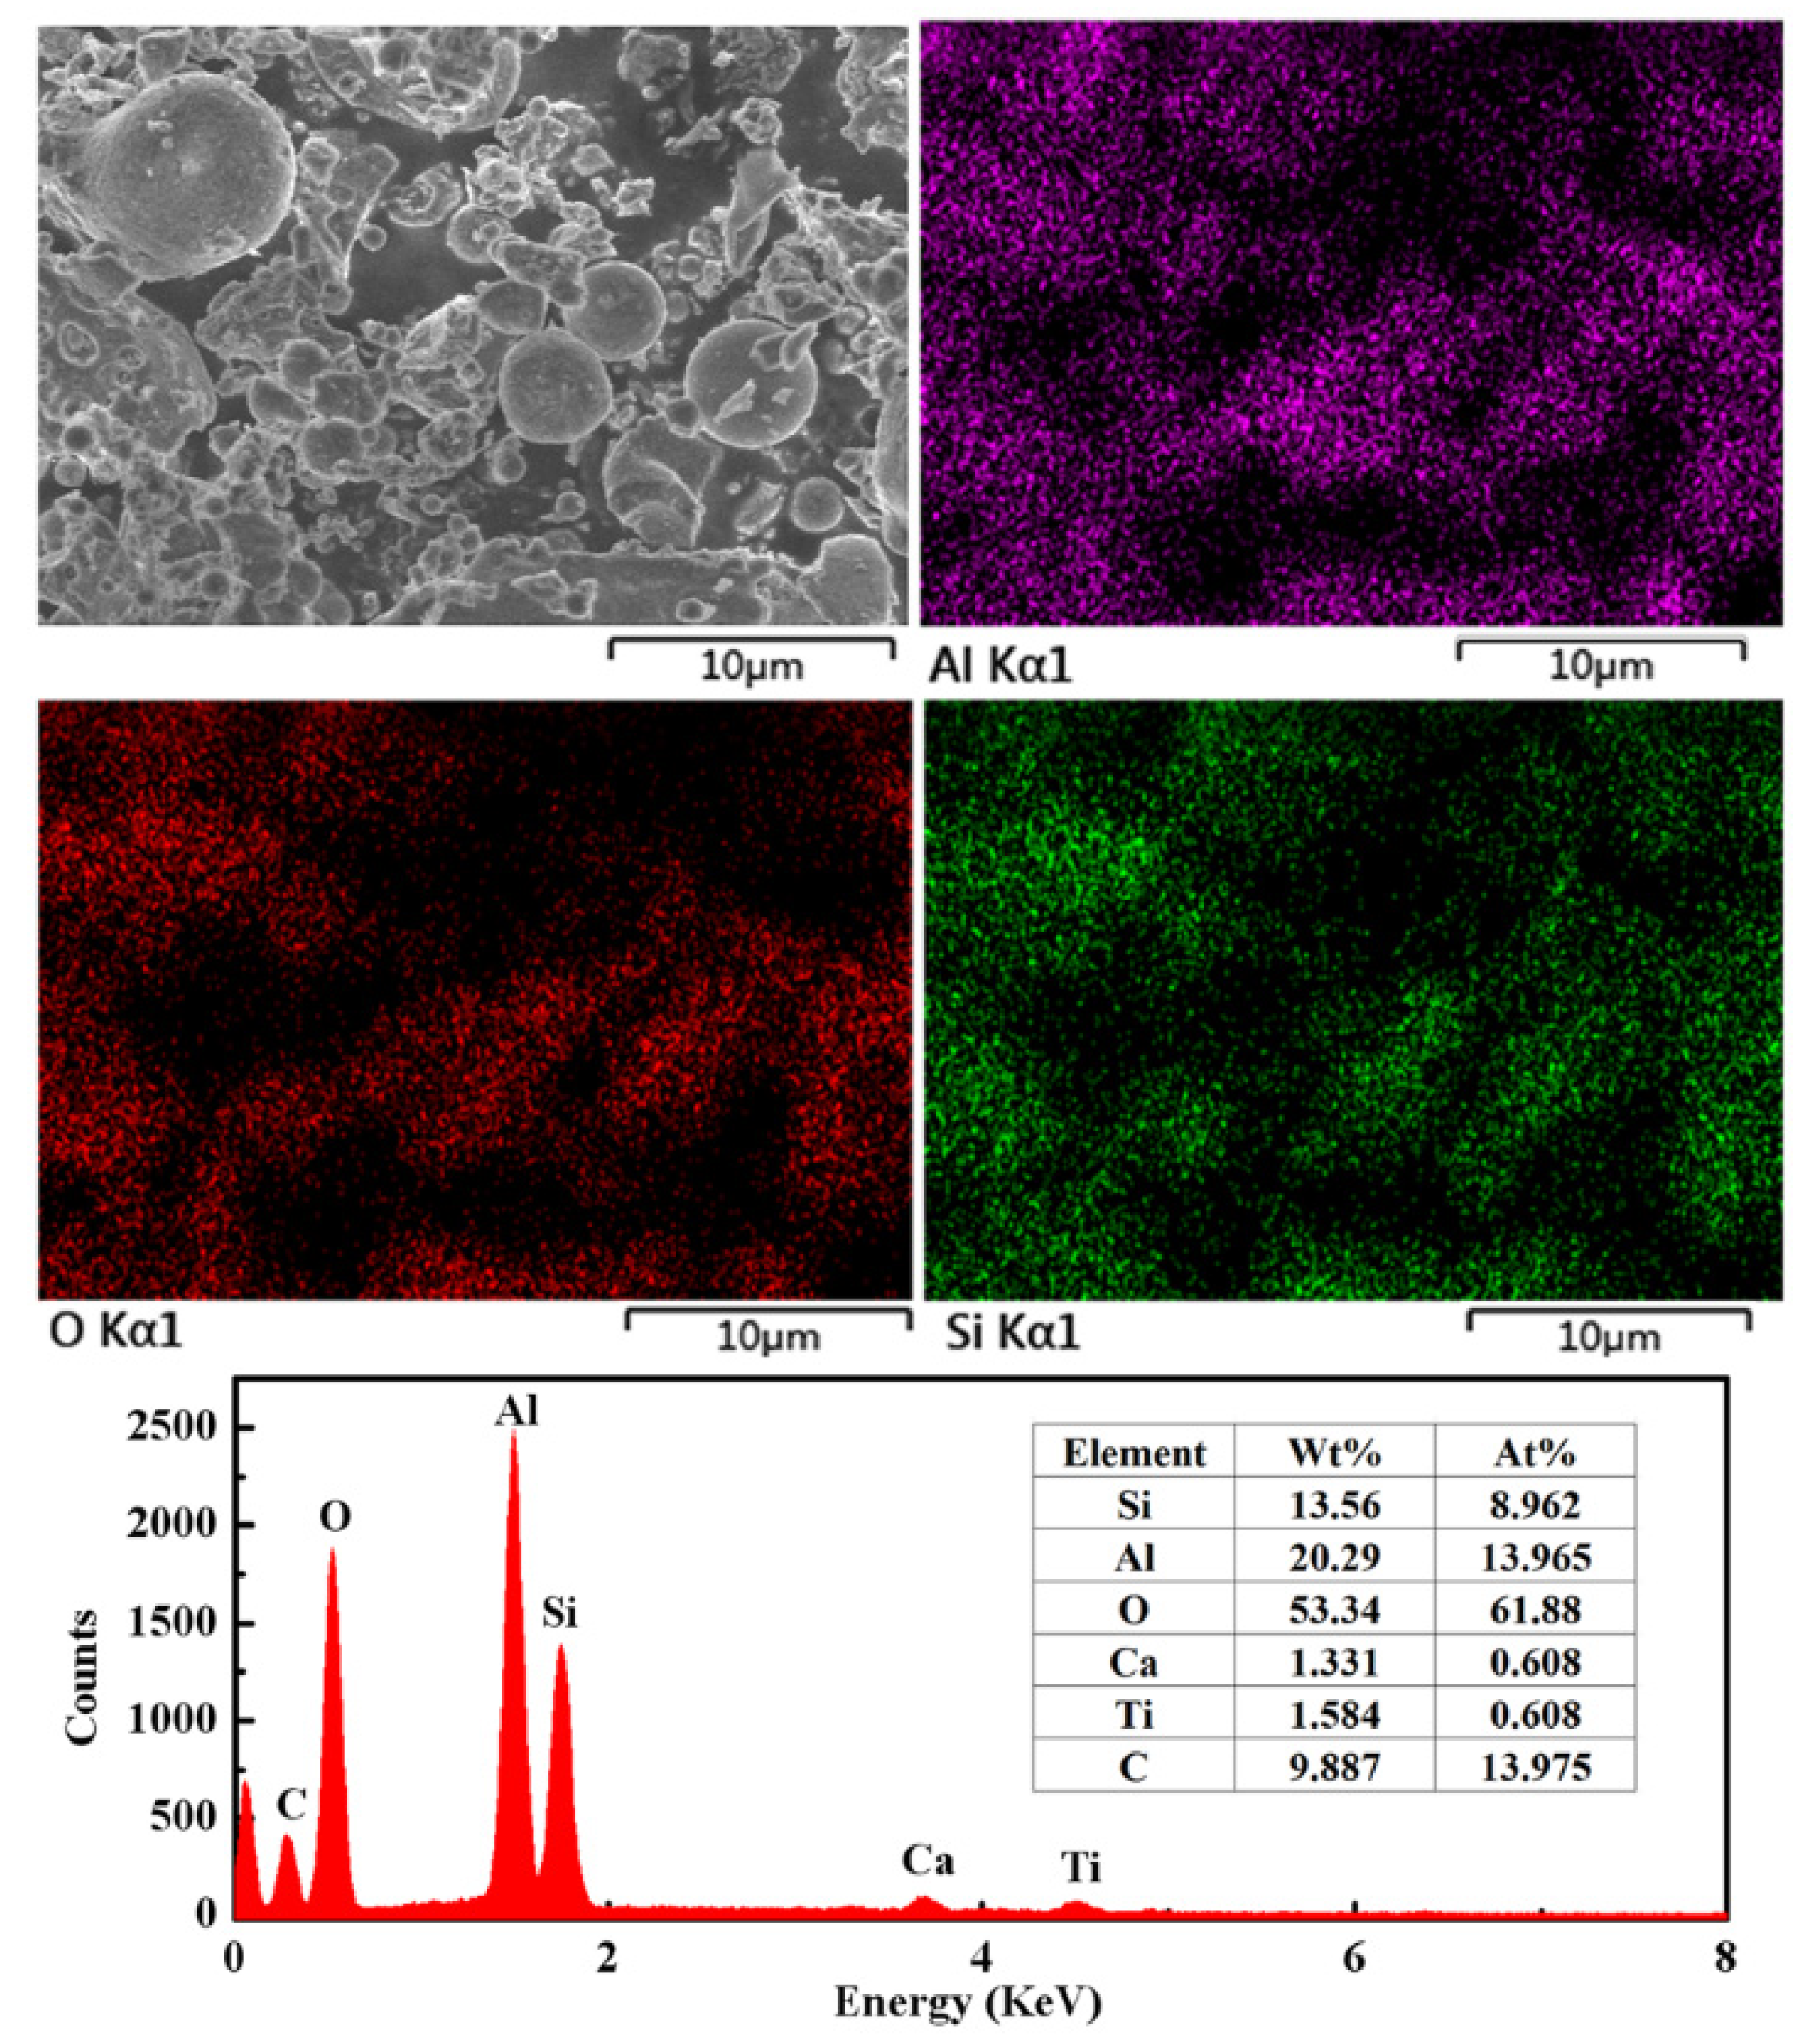
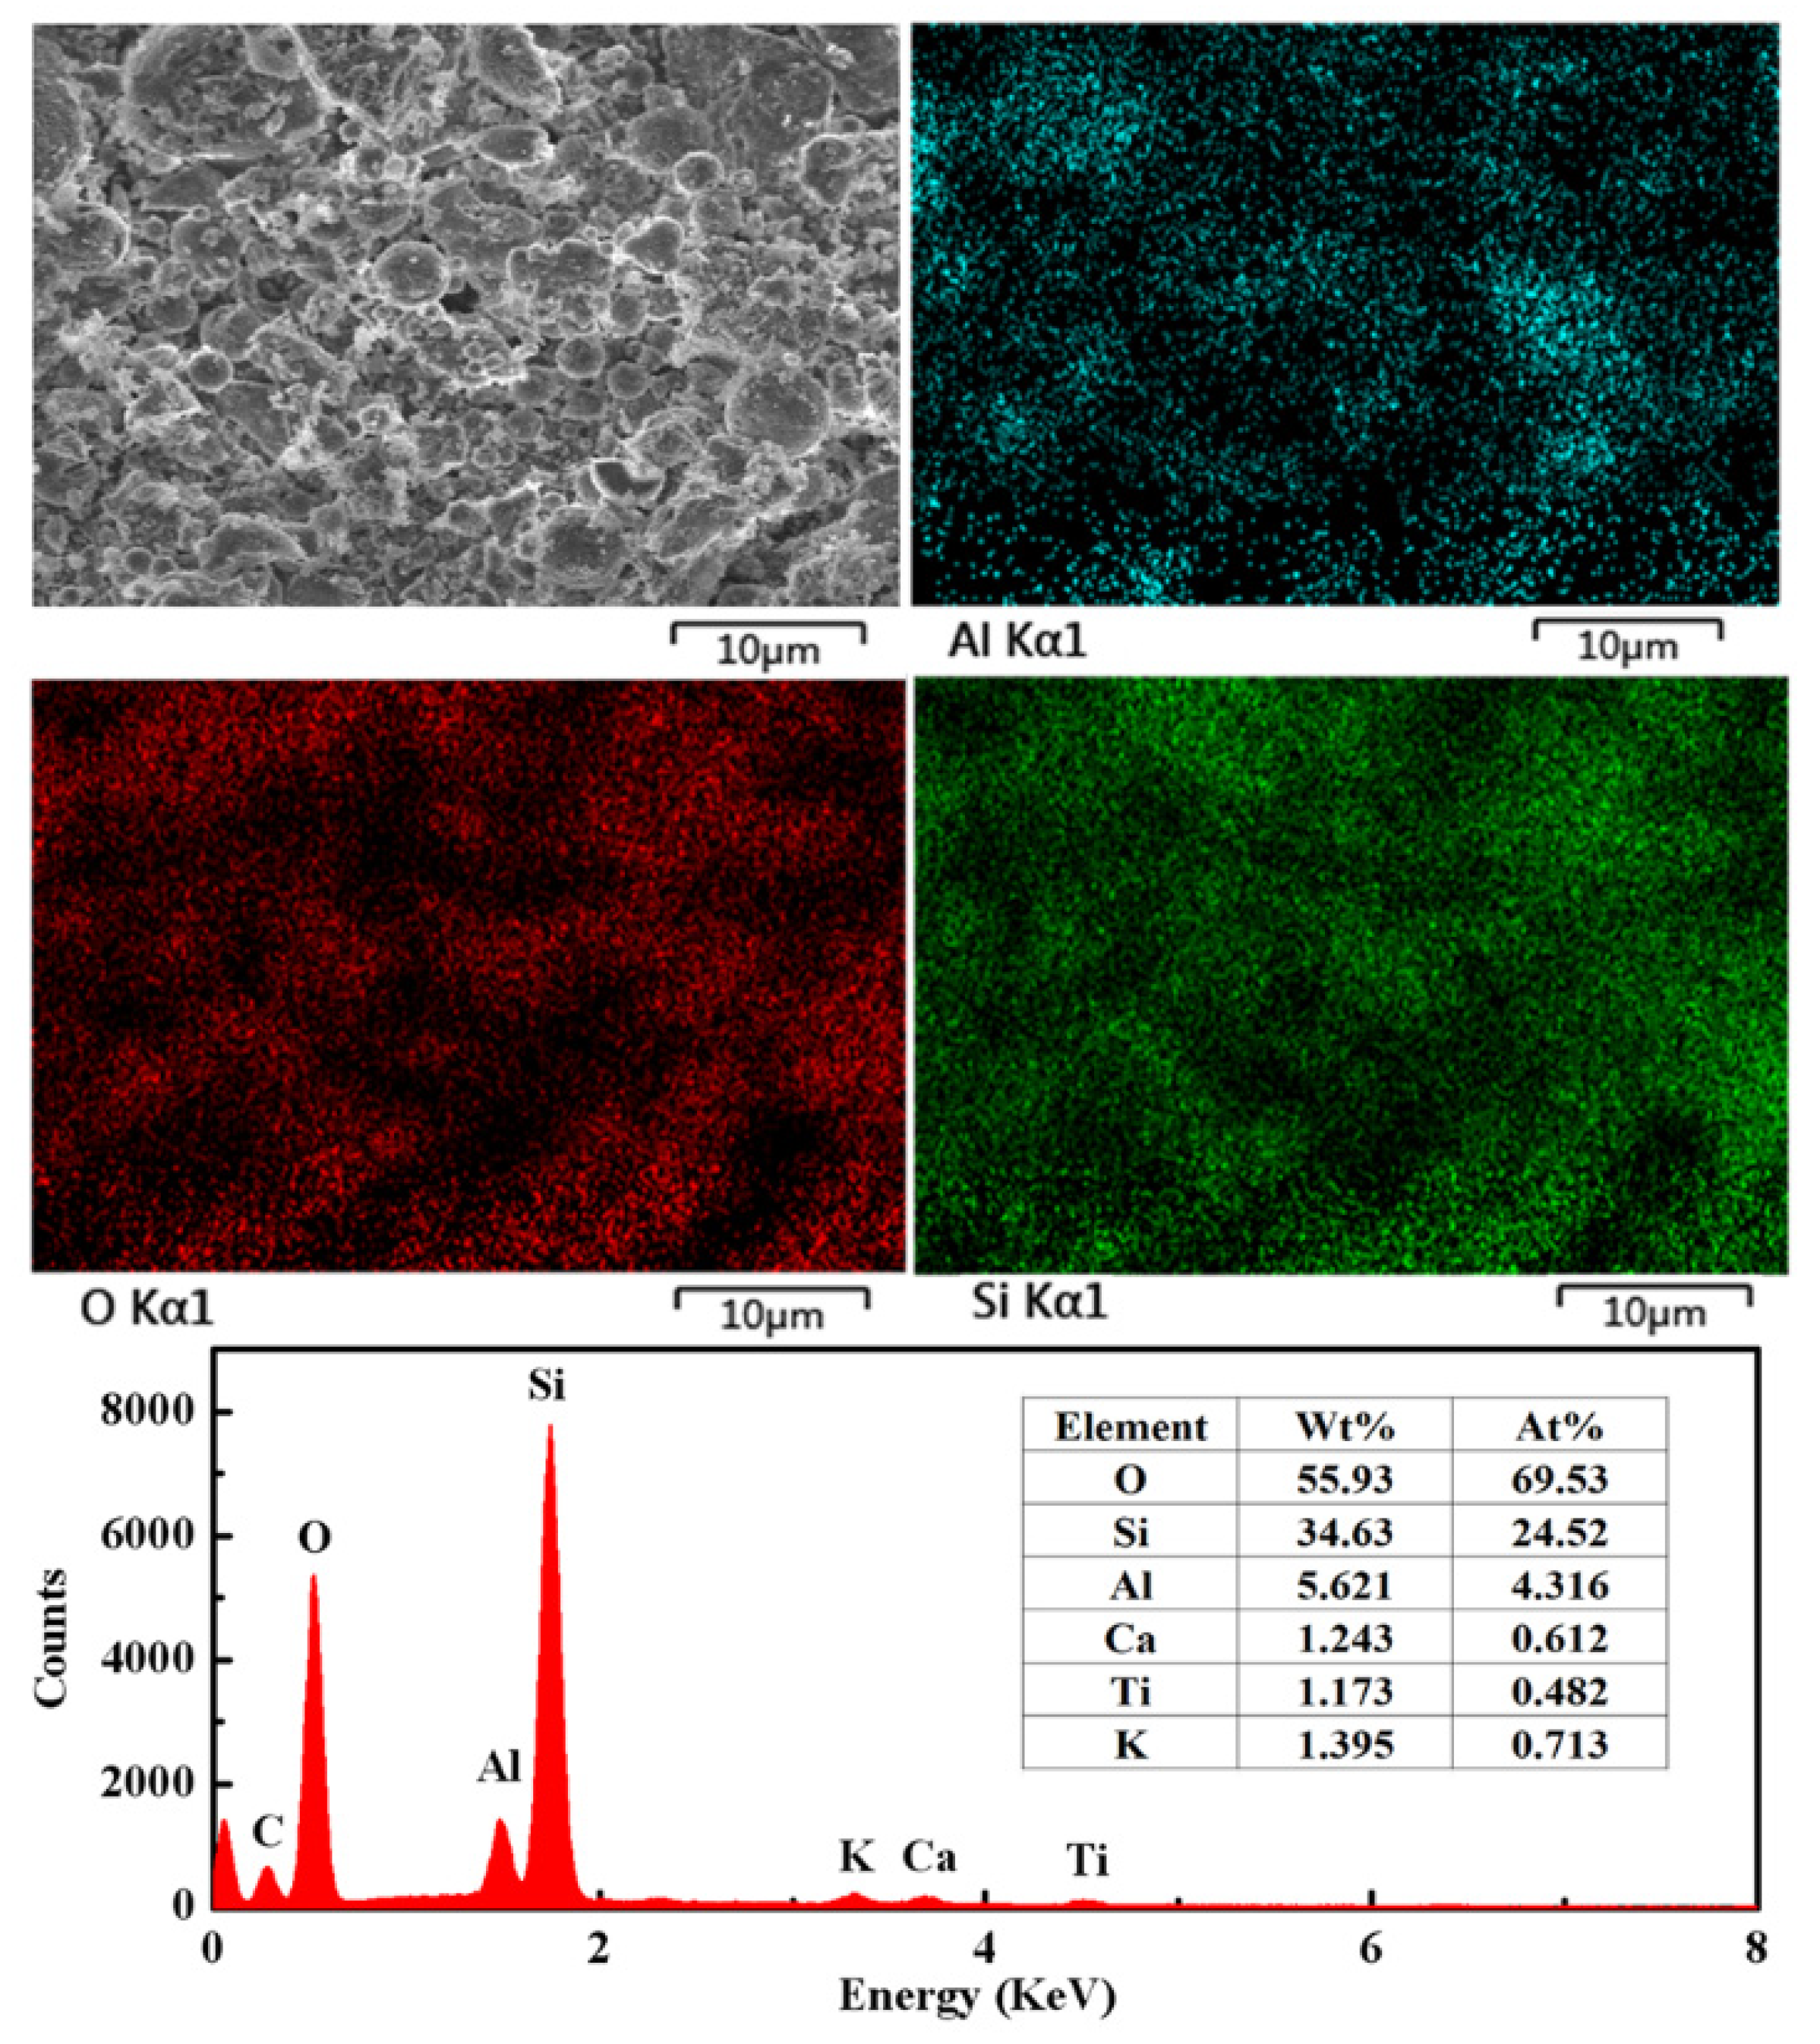
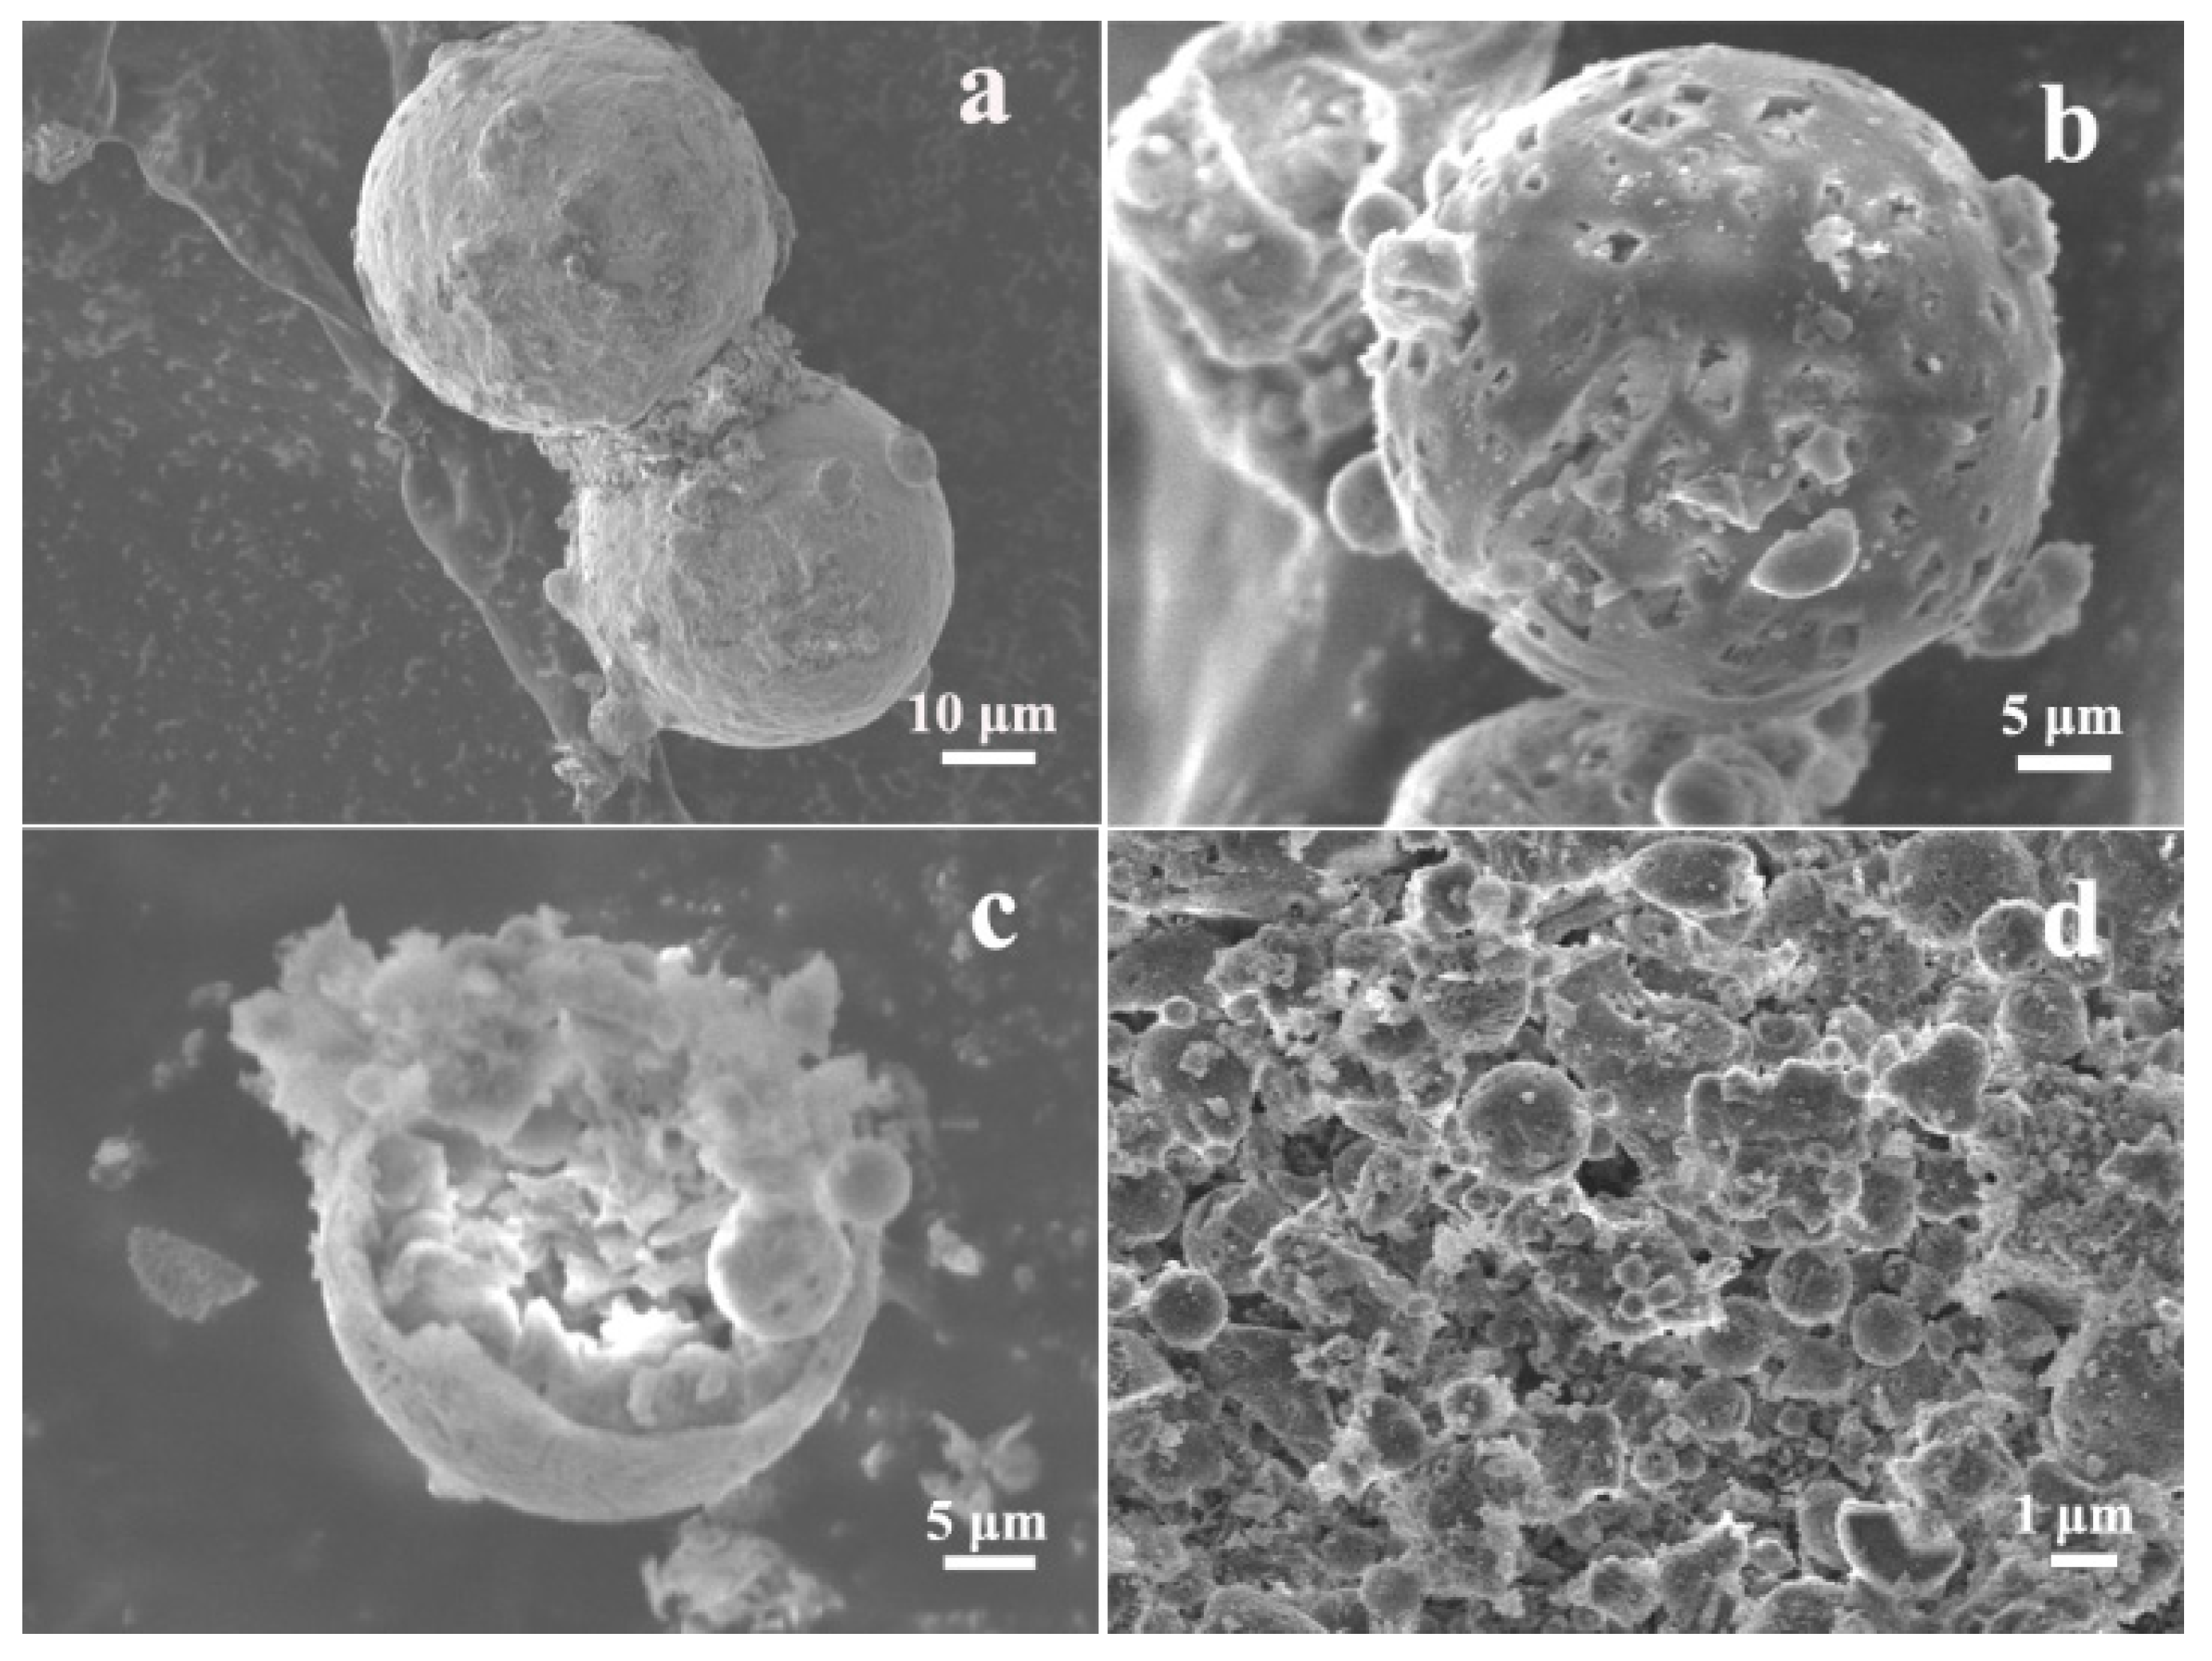
3.5. SEM and EDS Results
4. Conclusions
Author Contributions
Funding
Conflicts of Interest
References
- Zhang, S.Y.; Dai, S.F.; Finkelman, R.B.; Graham, I.T.; French, D.; Hower, J.C.; Li, X.W. Leaching characteristics of alkaline coal combustion by-products: A case study from a coal-fired power plant, Hebei province, China. Fuel 2019, 255, 115710. [Google Scholar] [CrossRef]
- Yao, Z.T.; Xia, M.S.; Sarker, P.K.; Chen, T. A review of the alumina recovery from coal fly ash with a focus in China. Fuel 2014, 120, 74–85. [Google Scholar] [CrossRef]
- Blissett, R.S.; Rowson, N.A. A review of the multi-component utilisation of coal fly ash. Fuel 2012, 97, 1–23. [Google Scholar] [CrossRef]
- Ahmaruzzaman, M. A review on the utilization of fly ash. Prog. Energy Combust. Sci. 2010, 36, 327–363. [Google Scholar] [CrossRef]
- Zou, J.J.; Guo, C.B.; Zhou, X.Q.; Sun, Y.J.; Yang, Z. Sorption capacity and mechanism of Cr3+ on tobermorite derived from fly ash acid residue and carbide slag. Colloid Surf. A Physicochim. Eng. Asp. 2018, 538, 825–833. [Google Scholar] [CrossRef]
- Nath, P.; Sarker, P.K. Flexural strength and elastic modulus of ambient-cured blended low-calcium fly ash geopolymer concrete. Constr. Build. Mater. 2017, 130, 22–31. [Google Scholar] [CrossRef]
- Bukhari, S.S.; Behin, J.; Kazemian, H.; Rohani, S. Conversion of coal fly ash to zeolite utilizing microwave and ultrasound energies: A review. Fuel 2015, 140, 250–266. [Google Scholar] [CrossRef]
- Guo, C.B.; Zou, J.J.; Wei, C.D.; Jiang, Y.S. Comparative study on extracting alumina from circulating fluidized-bed and pulverized-coal fly ashes through salt activation. Energy Fuel 2013, 27, 7868–7875. [Google Scholar] [CrossRef]
- Wang, X.W. China’s Bauxite Resource Product Demand Forecasting and Countermeasure Study; China University of Geosciences: Beijing, China, 2018. [Google Scholar]
- Guo, Y.; Li, Y.; Cheng, F.; Wang, M.; Wang, X. Role of additives in improved thermal activation of coal fly ash for alumina extraction. Fuel Process. Technol. 2013, 110, 114–121. [Google Scholar] [CrossRef]
- Gomes, S.; Francois, M. Characterization of mullite in silicoaluminous fly ash by XRD, TEM, and 29Si MAS NMR. Cem. Concr. Res. 2000, 30, 175–181. [Google Scholar] [CrossRef]
- Bai, G.H.; Qiao, Y.H.; Shen, B.; Chen, S.L. Thermal decomposition of coal fly ash by concentrated sulfuric acid and alumina extraction process based on it. Fuel Process. Technol. 2011, 92, 1213–1219. [Google Scholar] [CrossRef]
- Shemi, A.; Ndlovu, S.; Sibanda, V.; van Dyk, D.V. Extraction of alumina from coal fly ash using an acid leach-sinter-acid leach technique. Hydrometallurgy 2015, 157, 348–355. [Google Scholar] [CrossRef]
- Nayak, N.; Panda, C.R. Aluminium extraction and leaching characteristics of Talcher Thermal Power Station fly ash with sulphuric acid. Fuel 2010, 89, 53–58. [Google Scholar] [CrossRef]
- Ji, H.M.; Lu, H.X.; Hao, X.G.; Wu, P. High purity alumina powders extracted from fly ash by the calcining-leaching process. J. Chin. Ceram. Soc. 2007, 35, 1657–1660. [Google Scholar]
- Sun, Z.H.; Li, H.Q.; Bao, W.J.; Wang, C.Y. Mineral phase transition of desilicated high alumina fly ash with alumina extraction in mixed alkali solution. Int. J. Miner. Process. 2016, 153, 109–117. [Google Scholar] [CrossRef]
- Yang, Z.; Sun, J.; Zhang, Z.; Ye, J.; Miao, R. Using silicate-calcium slag generated in process of extracting alumina from fly ash as cement admixture. Chin. J. Environ. Eng. 2014, 8, 3989–3995. [Google Scholar]
- Ma, Y.; Hu, J.; Ye, G. The effect of activating solution on the mechanical strength, reaction rate, mineralogy, and microstructure of alkali-activated fly ash. J. Mater. Sci. 2012, 47, 4568–4578. [Google Scholar] [CrossRef]
- Louet, N.; Gonon, M.; Fantozzi, G. Influence of the amount of Na2O and SiO2 on the sintering behavior and on the microstructural evolution of a Bayer alumina powder. Ceram. Int. 2005, 31, 981–987. [Google Scholar] [CrossRef]
- Guo, C.B.; Zou, J.J.; Jiang, Y.S.; Huang, T.P.; Cheng, Y.; Wei, C.D. Thermal activation of coal fly ash by sodium hydrogen sulfate for alumina extraction. J. Mater. Sci. 2014, 49, 4315–4322. [Google Scholar] [CrossRef]
- Valeev, D.; Kunilova, I.; Alpatov, A.; Mikhailova, A.; Goldberg, M.; Kondratiev, A. Complex utilisation of ekibastuz brown coal fly ash: Iron & carbon separation and aluminum extraction. J. Clean. Prod. 2019, 218, 192–201. [Google Scholar]
- Ma, Z.B.; Zhang, S.; Zhang, H.R.; Cheng, F.Q. Novel extraction of valuable metals from circulating fluidized bedderived high-alumina fly ash by acidealkaliebased alternate method. J. Clean. Prod. 2019, 230, 302–313. [Google Scholar] [CrossRef]
- Matjie, R.H.; Bunt, J.R.; Van Heerden, J.H.P. Extraction of alumina from coal fly ash generated from a selected low rank bituminous South African coal. Miner. Eng. 2005, 18, 299–310. [Google Scholar] [CrossRef]
- Liu, K.; Xue, J.L.; Zhu, J. Extracting alumina from coal fly ash using acid sintering-leaching process. Light Met. 2012, 201–206. [Google Scholar]
- Bai, G.H.; Wang, T.S.; Li, P.C.; Lv, L.; He, C.L. Separation of Gallium from aluminum in fly ash digested solution by soda-lime sintering process. Adv. Mater. Res. 2012, 560, 474–481. [Google Scholar] [CrossRef]
- Doucet, F.J.; Mohamed, S.; Neyt, N.; Castleman, B.A.; van der Merwe, E.M. Thermochemical processing of a South African ultrafine coal fly ash using ammonium sulphate as extracting agent for aluminium extraction. Hydrometallurgy 2016, 166, 174–184. [Google Scholar] [CrossRef]
- Jiang, Z.Q.; Ma, H.W.; Yang, J.; Ma, X.; Yuan, J.Y. Thermal decomposition mechanism of desilication coal fly ash by low-lime sinter method for alumina extraction. Ferroelectrics 2015, 486, 143–155. [Google Scholar] [CrossRef]
- Park, H.C.; Park, Y.J.; Stevens, R. Synthesis of alumina from high purity alum derived from coal fly ash. Mater. Sci. Eng. A 2004, 367, 166170. [Google Scholar] [CrossRef]
- Van der Merwea, E.M.; Graya, C.L.; Castlemana, B.A.; Mohamed, S.; Krugerc, R.A.; Doucet, F.J. Ammonium sulphate and/or ammonium bisulphate as extracting agents for the recovery of aluminium from ultrafine coal fly ash. Hydrometallurgy 2017, 171, 185–190. [Google Scholar] [CrossRef]
- Ministry of Public Health. Pharmacopoeia of PRC; Chemical Industry Press: Beijing, China, 1995. [Google Scholar]
- Eriksen, K.M.; Fehrmann, R.; Hatem, G.; Gaune-Escard, M.; Lapina, O.B.; Mastikhin, V.M. Conduvtivity, NMR, thermal measurements and phase diagram of the K2S2O7-KHSO4 System. J. Phys. Chem. 1996, 100, 10771–10778. [Google Scholar] [CrossRef]
- Sánchez, R.M.T.; Basaldella, E.I.; Marco, J.F. The effect of thermal and mechanical treatments: Characterization by XPS and IEP measurements. J. Colloid Interface Sci. 1999, 215, 339–344. [Google Scholar] [CrossRef]
- Payá, J.; Monzó, J.; Borrachero, M.V.; Perris, E.; Amahjour, F. Thermogravimetric methods for determining carbon content in fly ashes. Cem. Concr. Res. 1998, 28, 675–686. [Google Scholar] [CrossRef]
- Zhang, Z.J.; Sun, J.M.; Yao, Q. Research on the extraction amorphous SiO2 from high-aluminium fly ash. Acta Miner. Sin. 2007, 27, 137–142. [Google Scholar]
- Padilla, R.; Sohn, H.Y. Sintering Kinetics and Alumina Yield in lime-soda sinter process for alumina from coal wastes. Metall. Trans. B 1985, 16, 385–395. [Google Scholar] [CrossRef]
- Rogozhnikov, D.A.; Shoppert, A.A.; Dizer, O.A.; Karimov, K.A.; Rusalev, R.E. Leaching Kinetics of Sulfides from Refractory Gold Concentrates by Nitric Acid. Metals 2019, 9, 465. [Google Scholar] [CrossRef]
- Avrami, M. Kinetics of phase change. II transformation-time relations for random distribution of nuclei. J. Chem. Phys. 1940, 8, 212–224. [Google Scholar]
- Rodriguez, M.; Quiroga, O.; Ruiz, M.D.C. Kinetic study of ferrocolumbite dissolution in hydrofluoric acid medium. Hydrometallurgy 2007, 85, 87–94. [Google Scholar] [CrossRef]
- Kahruman, C.; Yusufoglu, I. Leaching kinetics of synthetic CaWO4 in HCl solutions containing H3PO4 as chelating agent. Hydrometallurgy 2006, 81, 182–189. [Google Scholar] [CrossRef]
- Peng, M.; Ruan, X.Y. Study on both shape and chemical composition at the surface of fly ash by scanning electron microscope, focused ion beam, and field emission-scanning electron microscope. Chin. J. Anal. Chem. 2004, 32, 1196–1198. [Google Scholar]
- Kutchko, B.G.; Kim, A.G. Fly ash characterization by SEM–EDS. Fuel 2006, 85, 2537–2544. [Google Scholar] [CrossRef]
- Zou, J.J.; Guo, C.B.; Wei, C.D.; Jiang, Y.S. Dynamic hydrothermal synthesis of xonotlite from acidextracting residues of circulating fluidized bed fly ash. Res. Chem. Intermed. 2016, 2, 519–530. [Google Scholar] [CrossRef]
- Zou, J.J.; Guo, C.B.; Jiang, Y.S.; Wei, C.D.; Li, F.F. Structure, morphology and mechanism research on synthesizing xonotlite fiber from acid-extracting residues of coal fly ash and carbide slag. Mater. Chem. Phys. 2016, 172, 121–128. [Google Scholar] [CrossRef]
- Kaze, C.R.; Djobo, J.N.Y.; Nana, A.; Tchakoute, H.K.; Kamseu, E.; Melo, U.C.; Leonelli, C.; Rahier, H. Effect of silicate modulus on the setting, mechanical strength and microstructure of iron-rich aluminosilicate (laterite) based-geopolymer cured at room temperature. Ceram. Int. 2018, 44, 21442–21450. [Google Scholar] [CrossRef]


| Component | Al2O3 | SiO2 | CaO | TiO2 | Fe2O3 | K2O | FeO | MgO | Na2O | LOI a |
|---|---|---|---|---|---|---|---|---|---|---|
| Content | 51.70 | 36.30 | 2.68 | 1.75 | 1.28 | 0.34 | 0.30 | 0.24 | 0.09 | 2.21 |
| Limiting Step | Equation | R2 | ||
|---|---|---|---|---|
| 190 °C | 210 °C | 230 °C | ||
| 1. Deformation of Avrami–Erofeev equation | 0.99573 | 0.99644 | 0.99755 | |
| 2. Diffusion through the product layer (sp) | 0.98859 | 0.98359 | 0.98212 | |
| 3. Diffusion through the product layer (pp) | 0.98500 | 0.98859 | 0.98627 | |
| 4. Diffusion through the product layer (cp) | 0.99010 | 0.98909 | 0.98975 | |
| 5. Diffusion through the liquid film (sp) | 0.89787 | 0.90375 | 0.89545 | |
| 6. Surface chemical reactions (cp) | 0.95330 | 0.96554 | 0.97435 | |
| 7. Surface chemical reactions (sp) | 0.96794 | 0.97994 | 0.99006 | |
| 8. New shrinking core model | 0.94335 | 0.89564 | 0.84721 | |
| Temperature (°C) | Order, n | Rate Constant, k | R2, Linear Regression Fit |
|---|---|---|---|
| 210 | 0.8716 | 0.010106649 | 0.99573 |
| 220 | 0.94872 | 0.011215829 | 0.99644 |
| 230 | 1.08314 | 0.013399652 | 0.99755 |
| Component | Al2O3 | SiO2 | CaO | TiO2 | Fe2O3 | K2O | FeO | MgO | Na2O | LOI a |
|---|---|---|---|---|---|---|---|---|---|---|
| Content | 13.88 | 70.32 | 1.93 | 2.12 | 1.15 | 1.18 | 0.18 | 0.22 | 0.19 | 7.32 |
© 2019 by the authors. Licensee MDPI, Basel, Switzerland. This article is an open access article distributed under the terms and conditions of the Creative Commons Attribution (CC BY) license (http://creativecommons.org/licenses/by/4.0/).
Share and Cite
Guo, C.; Zou, J.; Ma, S.; Yang, J.; Wang, K. Alumina Extraction from Coal Fly Ash via Low-Temperature Potassium Bisulfate Calcination. Minerals 2019, 9, 585. https://doi.org/10.3390/min9100585
Guo C, Zou J, Ma S, Yang J, Wang K. Alumina Extraction from Coal Fly Ash via Low-Temperature Potassium Bisulfate Calcination. Minerals. 2019; 9(10):585. https://doi.org/10.3390/min9100585
Chicago/Turabian StyleGuo, Chunbin, Jingjing Zou, Shuhua Ma, Jianlin Yang, and Kehan Wang. 2019. "Alumina Extraction from Coal Fly Ash via Low-Temperature Potassium Bisulfate Calcination" Minerals 9, no. 10: 585. https://doi.org/10.3390/min9100585
APA StyleGuo, C., Zou, J., Ma, S., Yang, J., & Wang, K. (2019). Alumina Extraction from Coal Fly Ash via Low-Temperature Potassium Bisulfate Calcination. Minerals, 9(10), 585. https://doi.org/10.3390/min9100585