Rutile from Panasqueira (Central Portugal): An Excellent Pathfinder for Wolframite Deposition

 , ,
, ,
Abstract
:1. Introduction
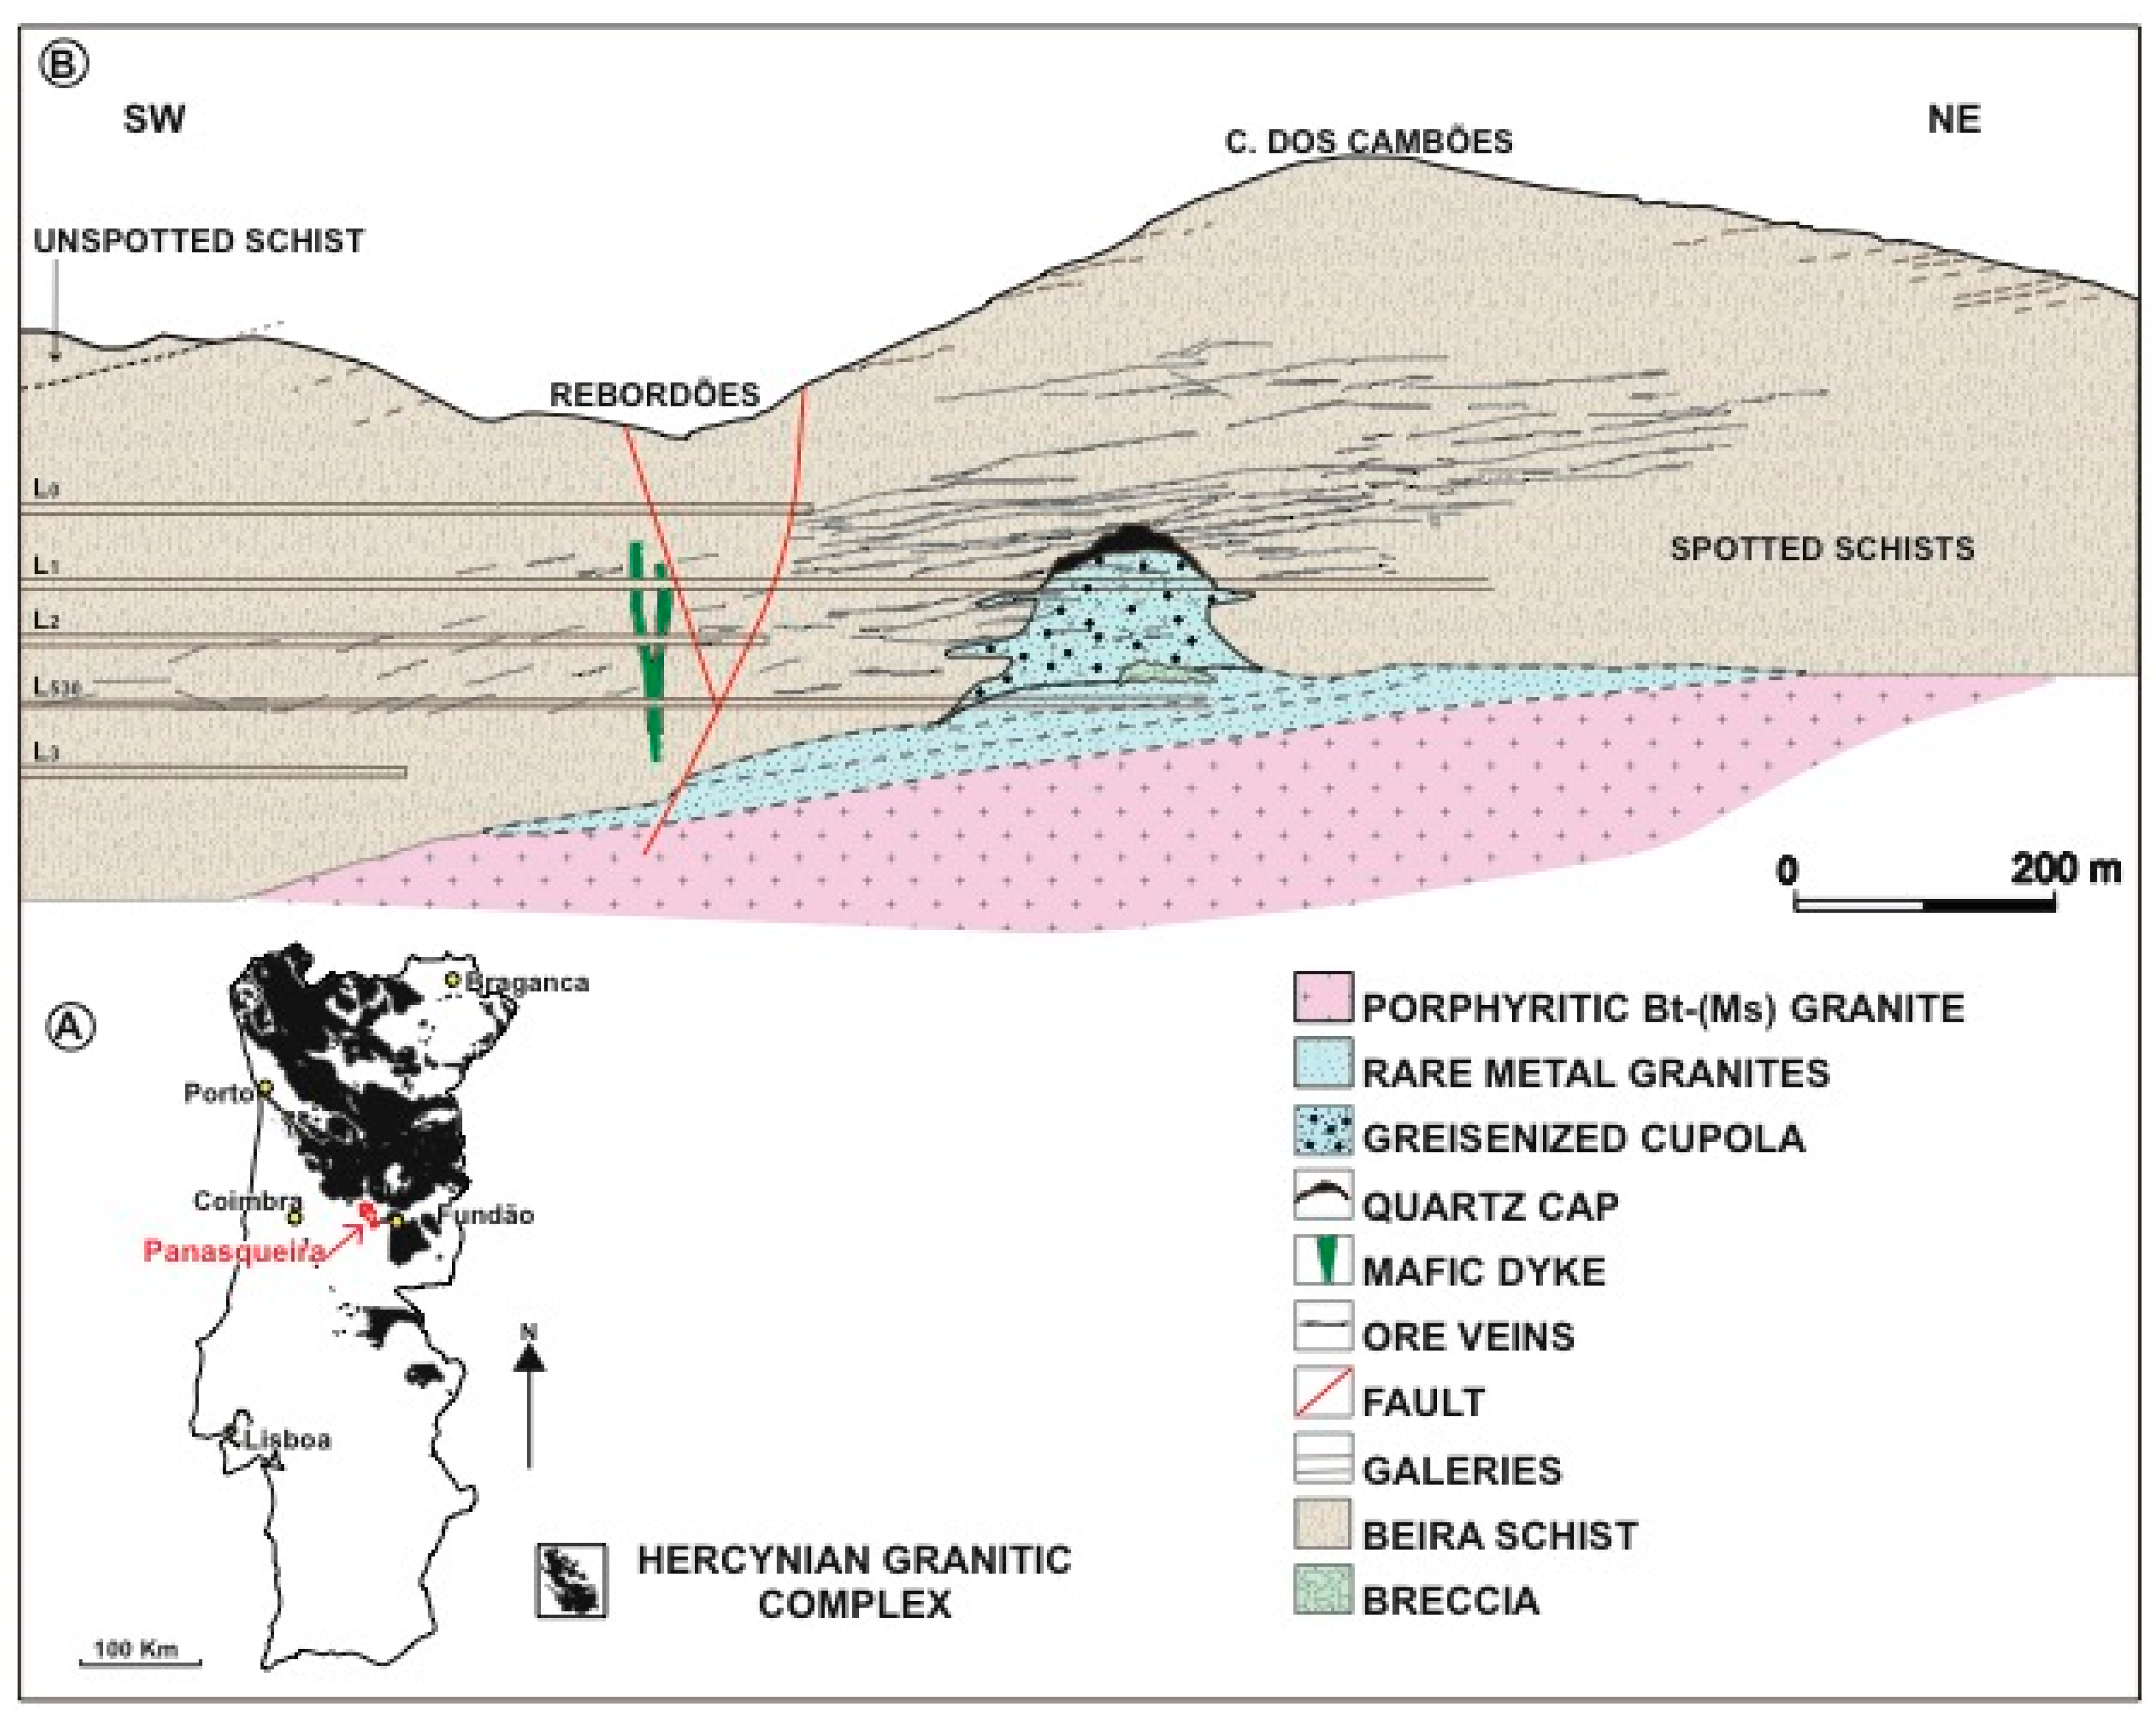
2. Geological Setting
3. Material and Methods
4. Results
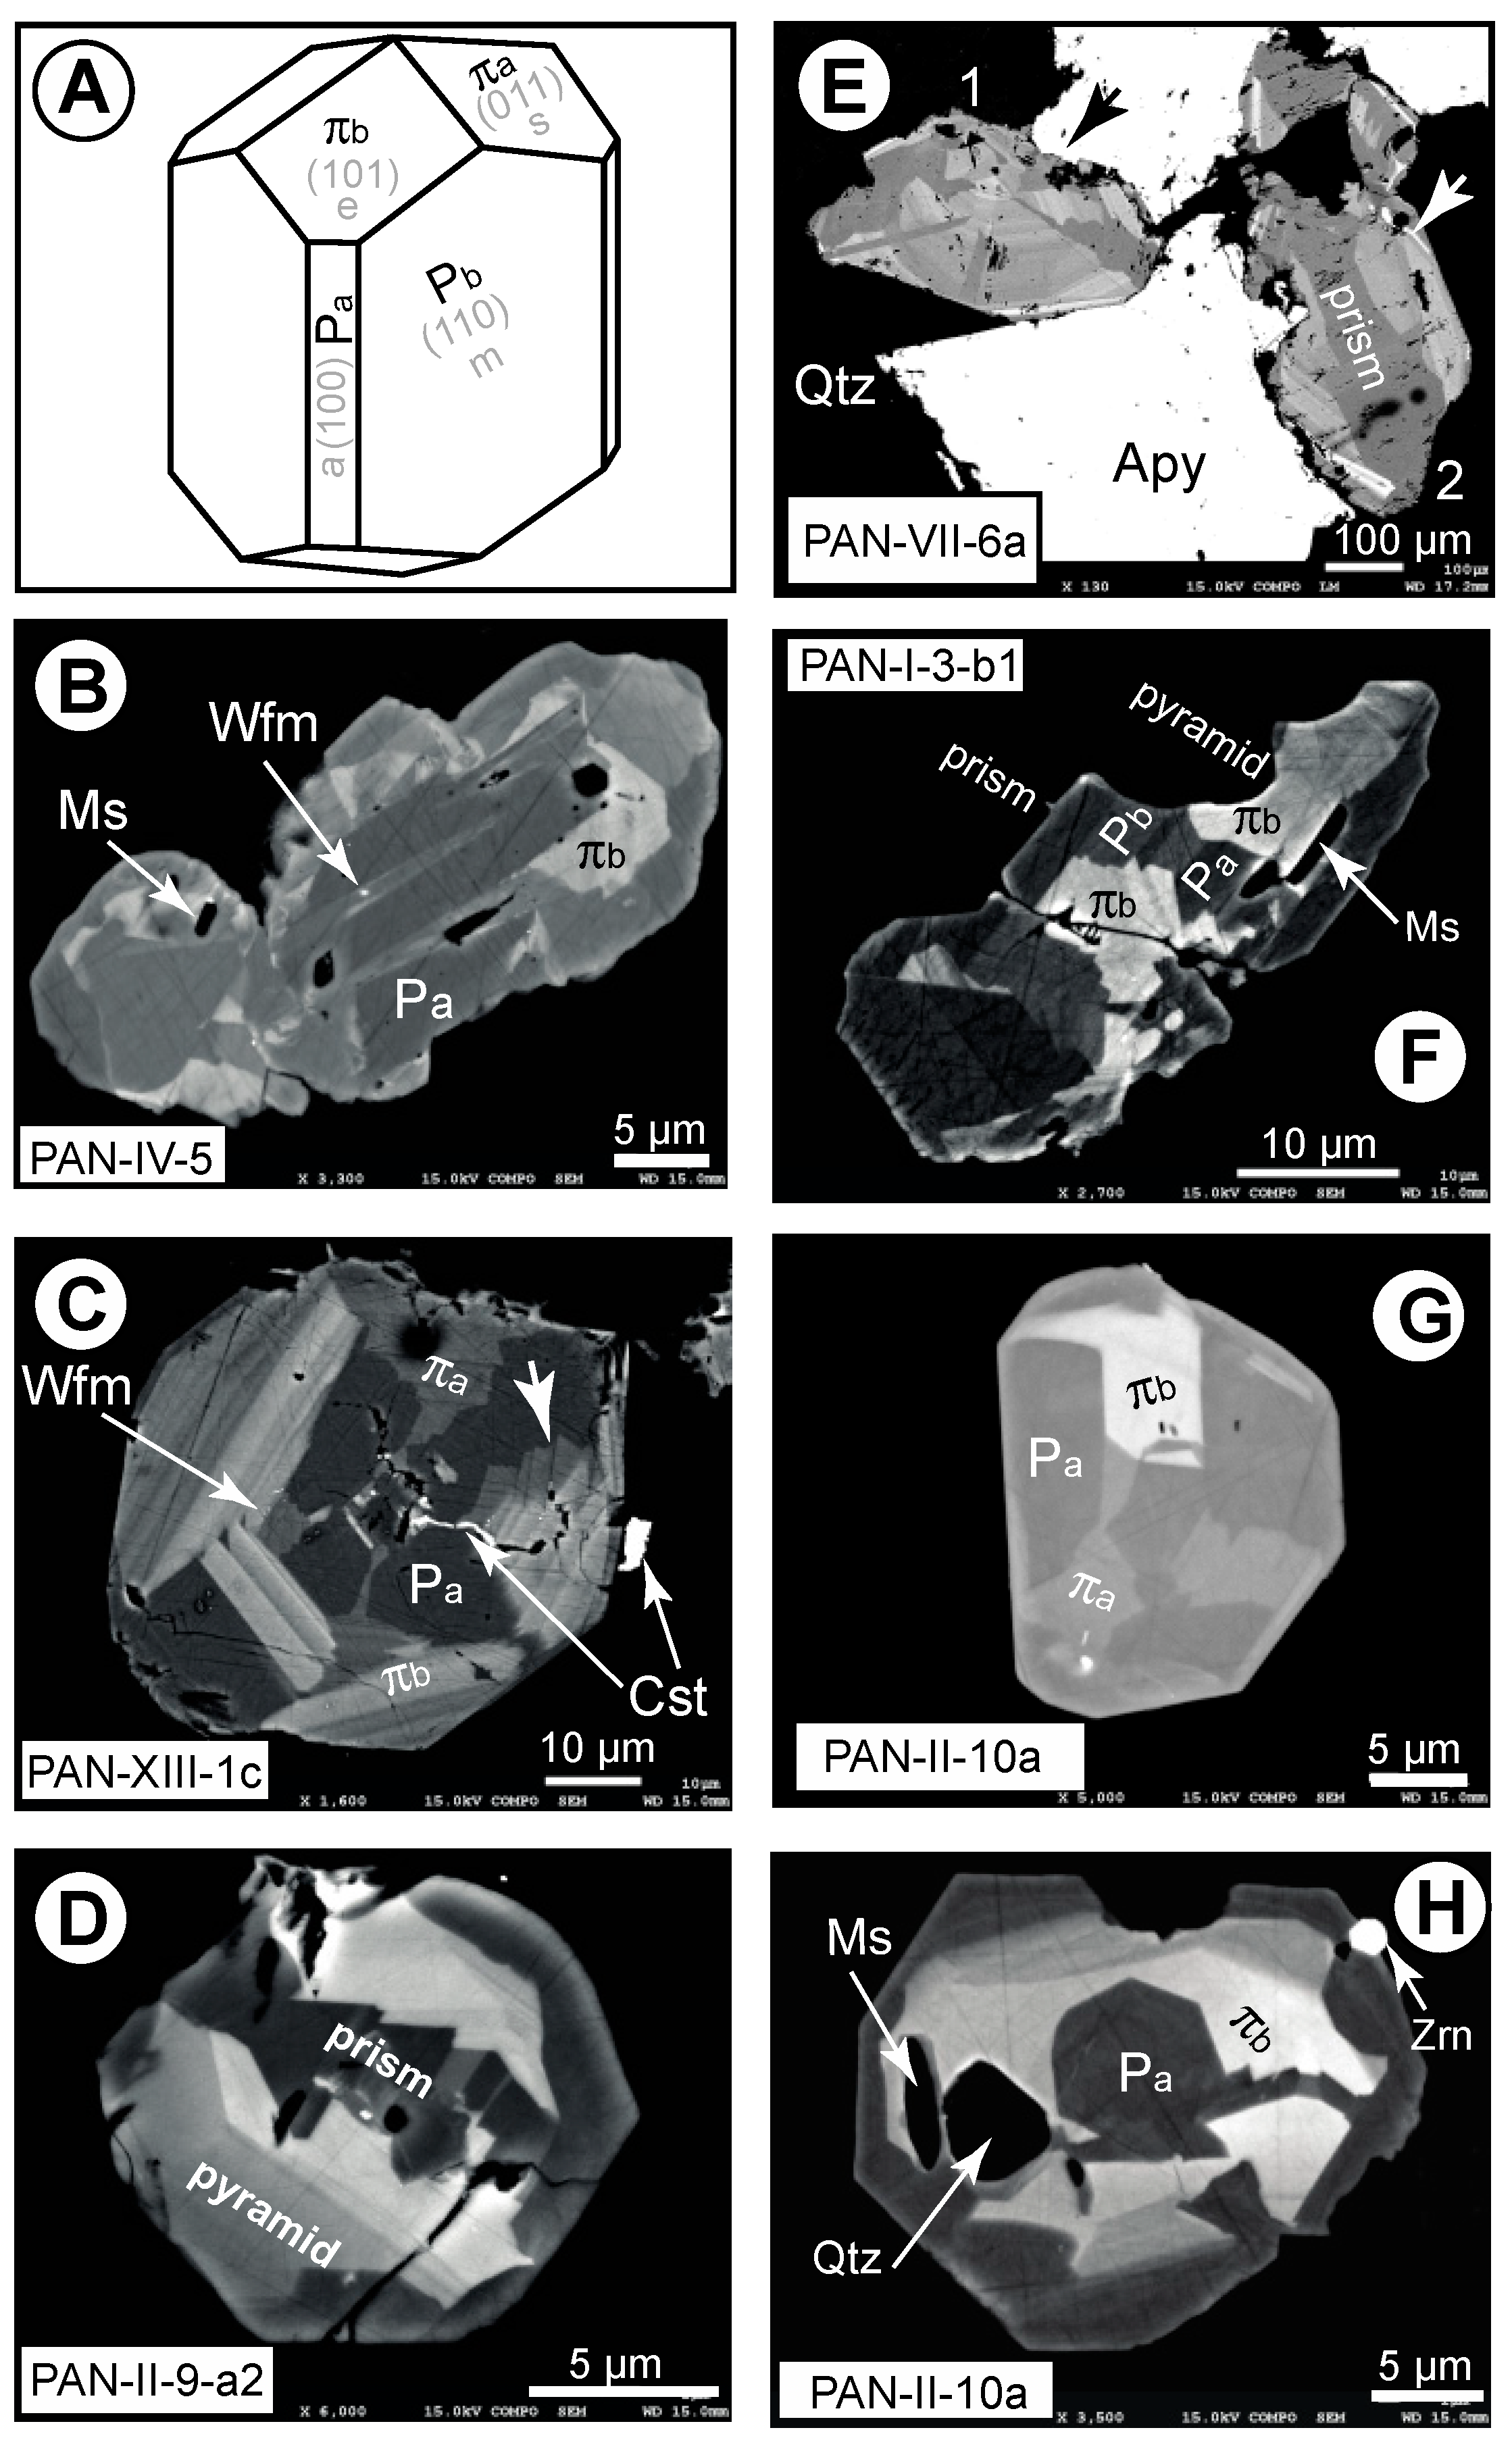
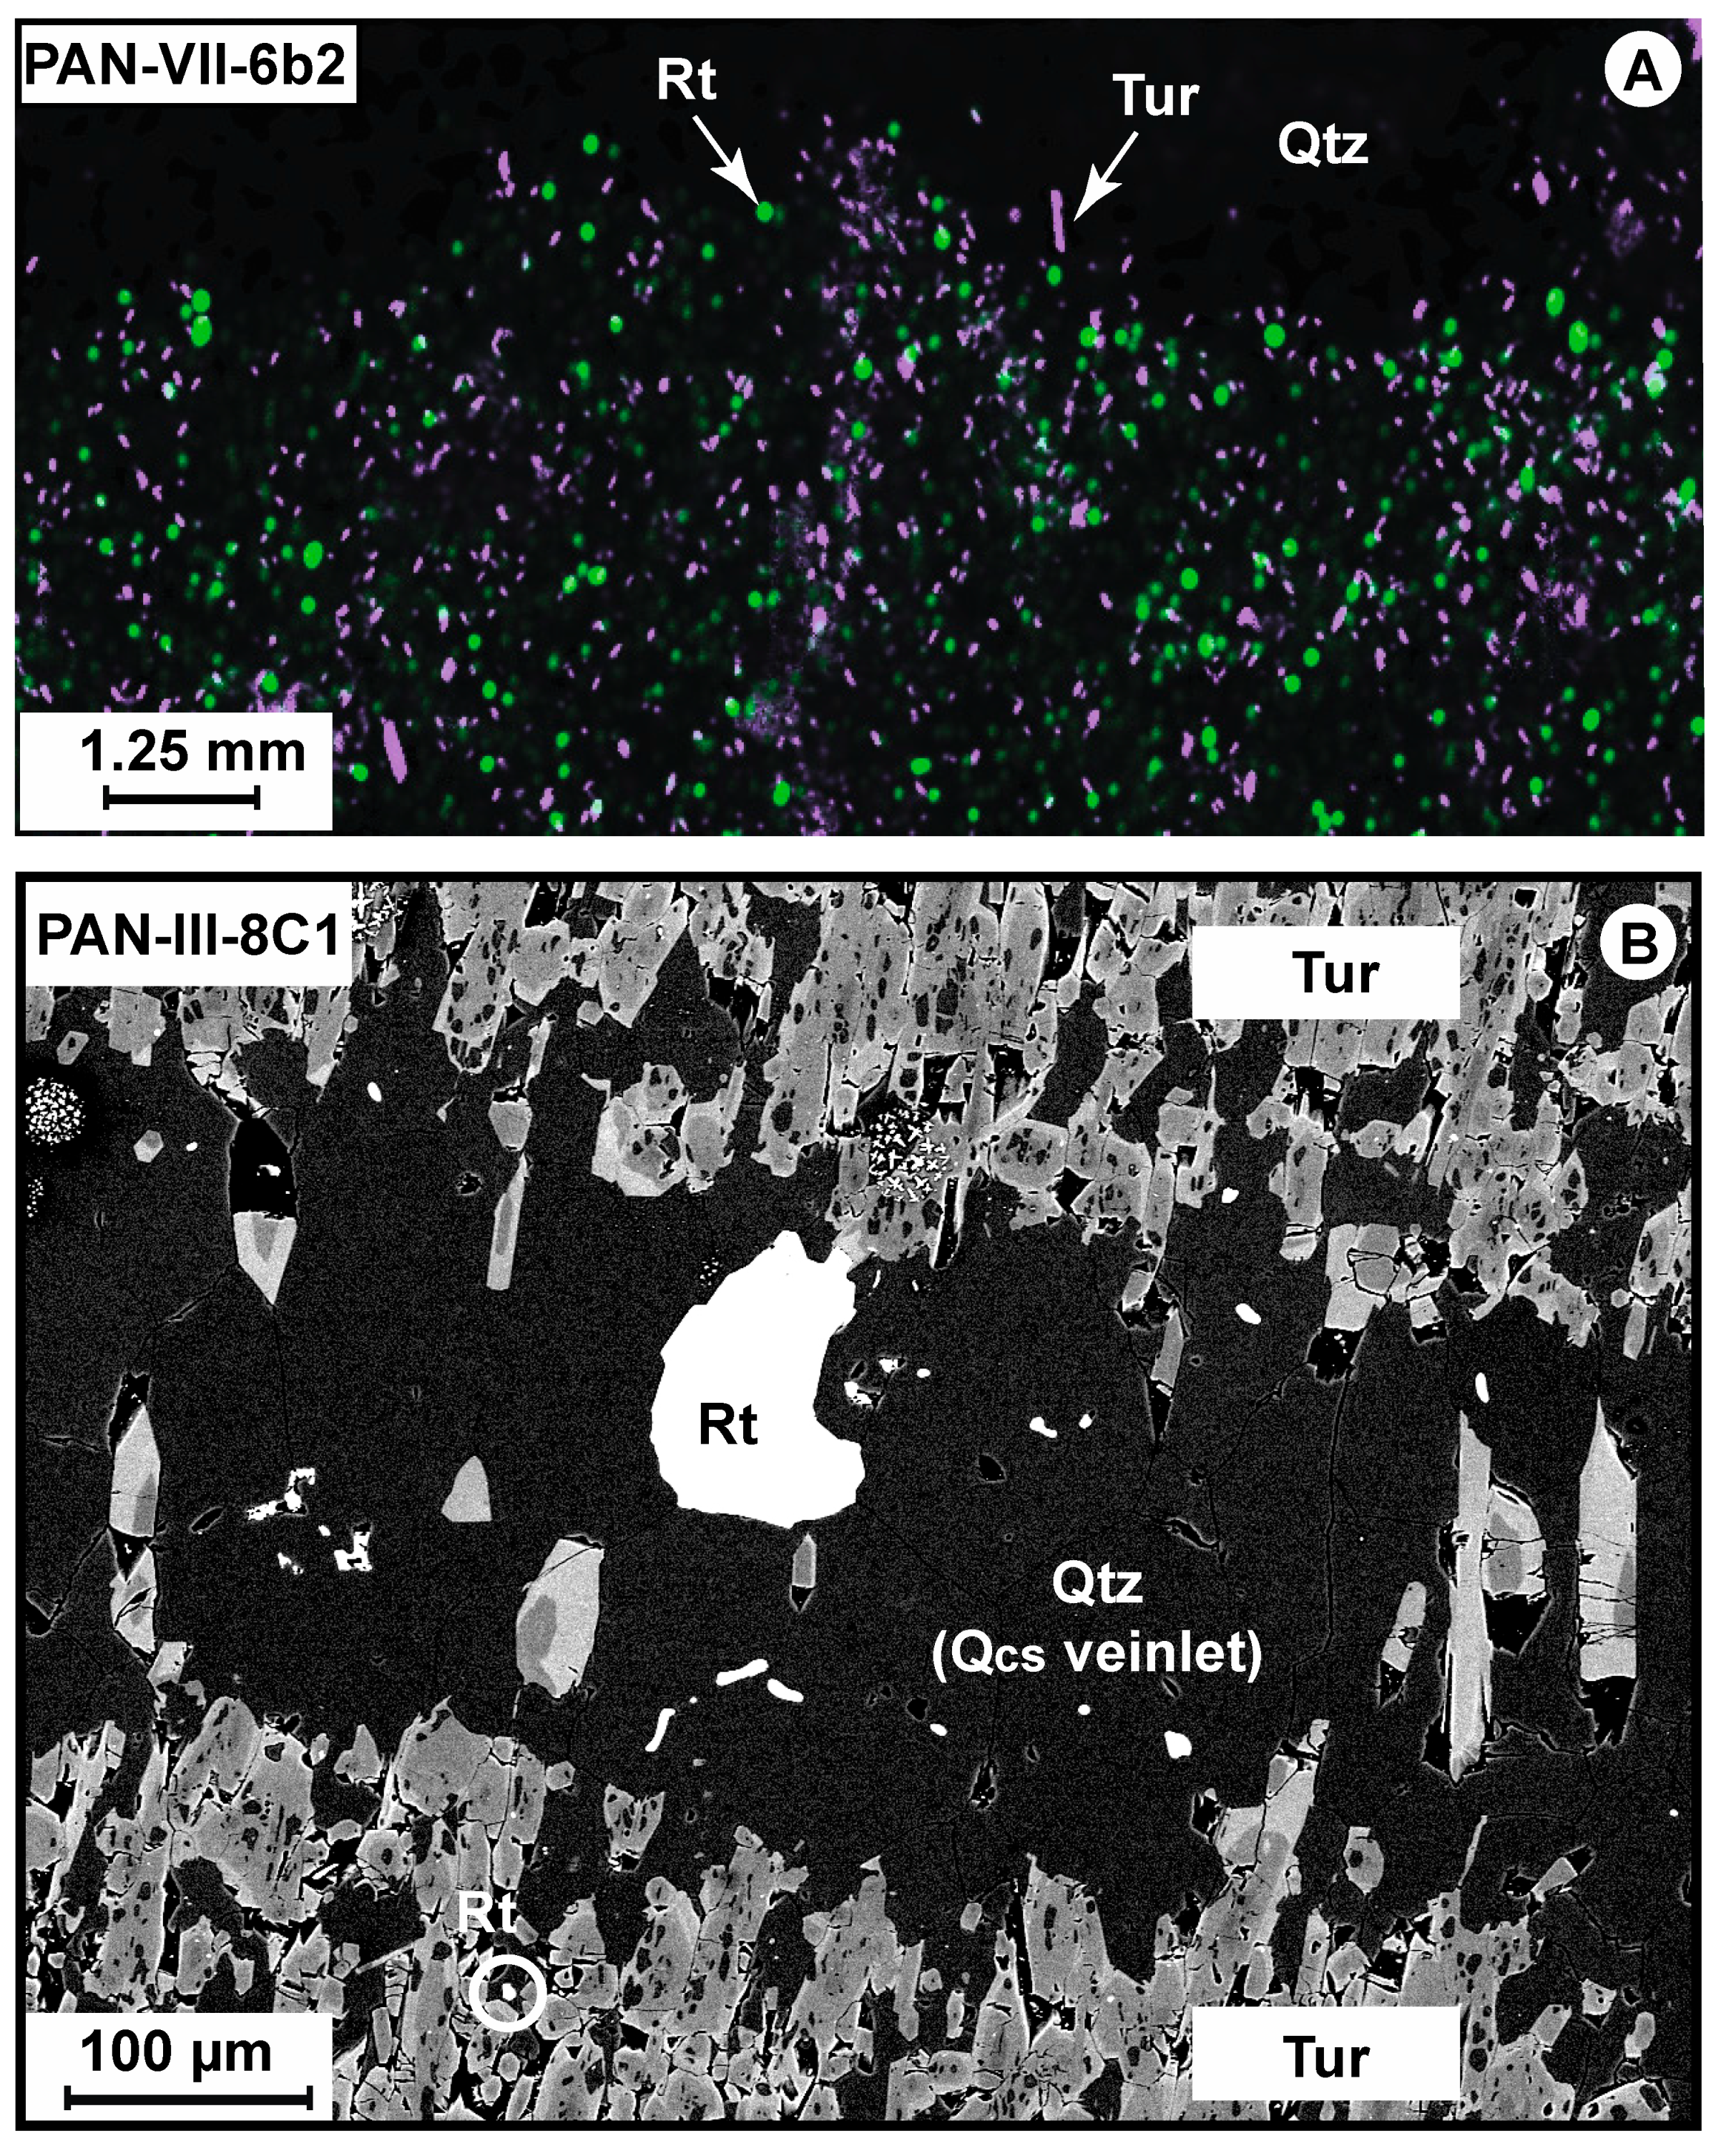
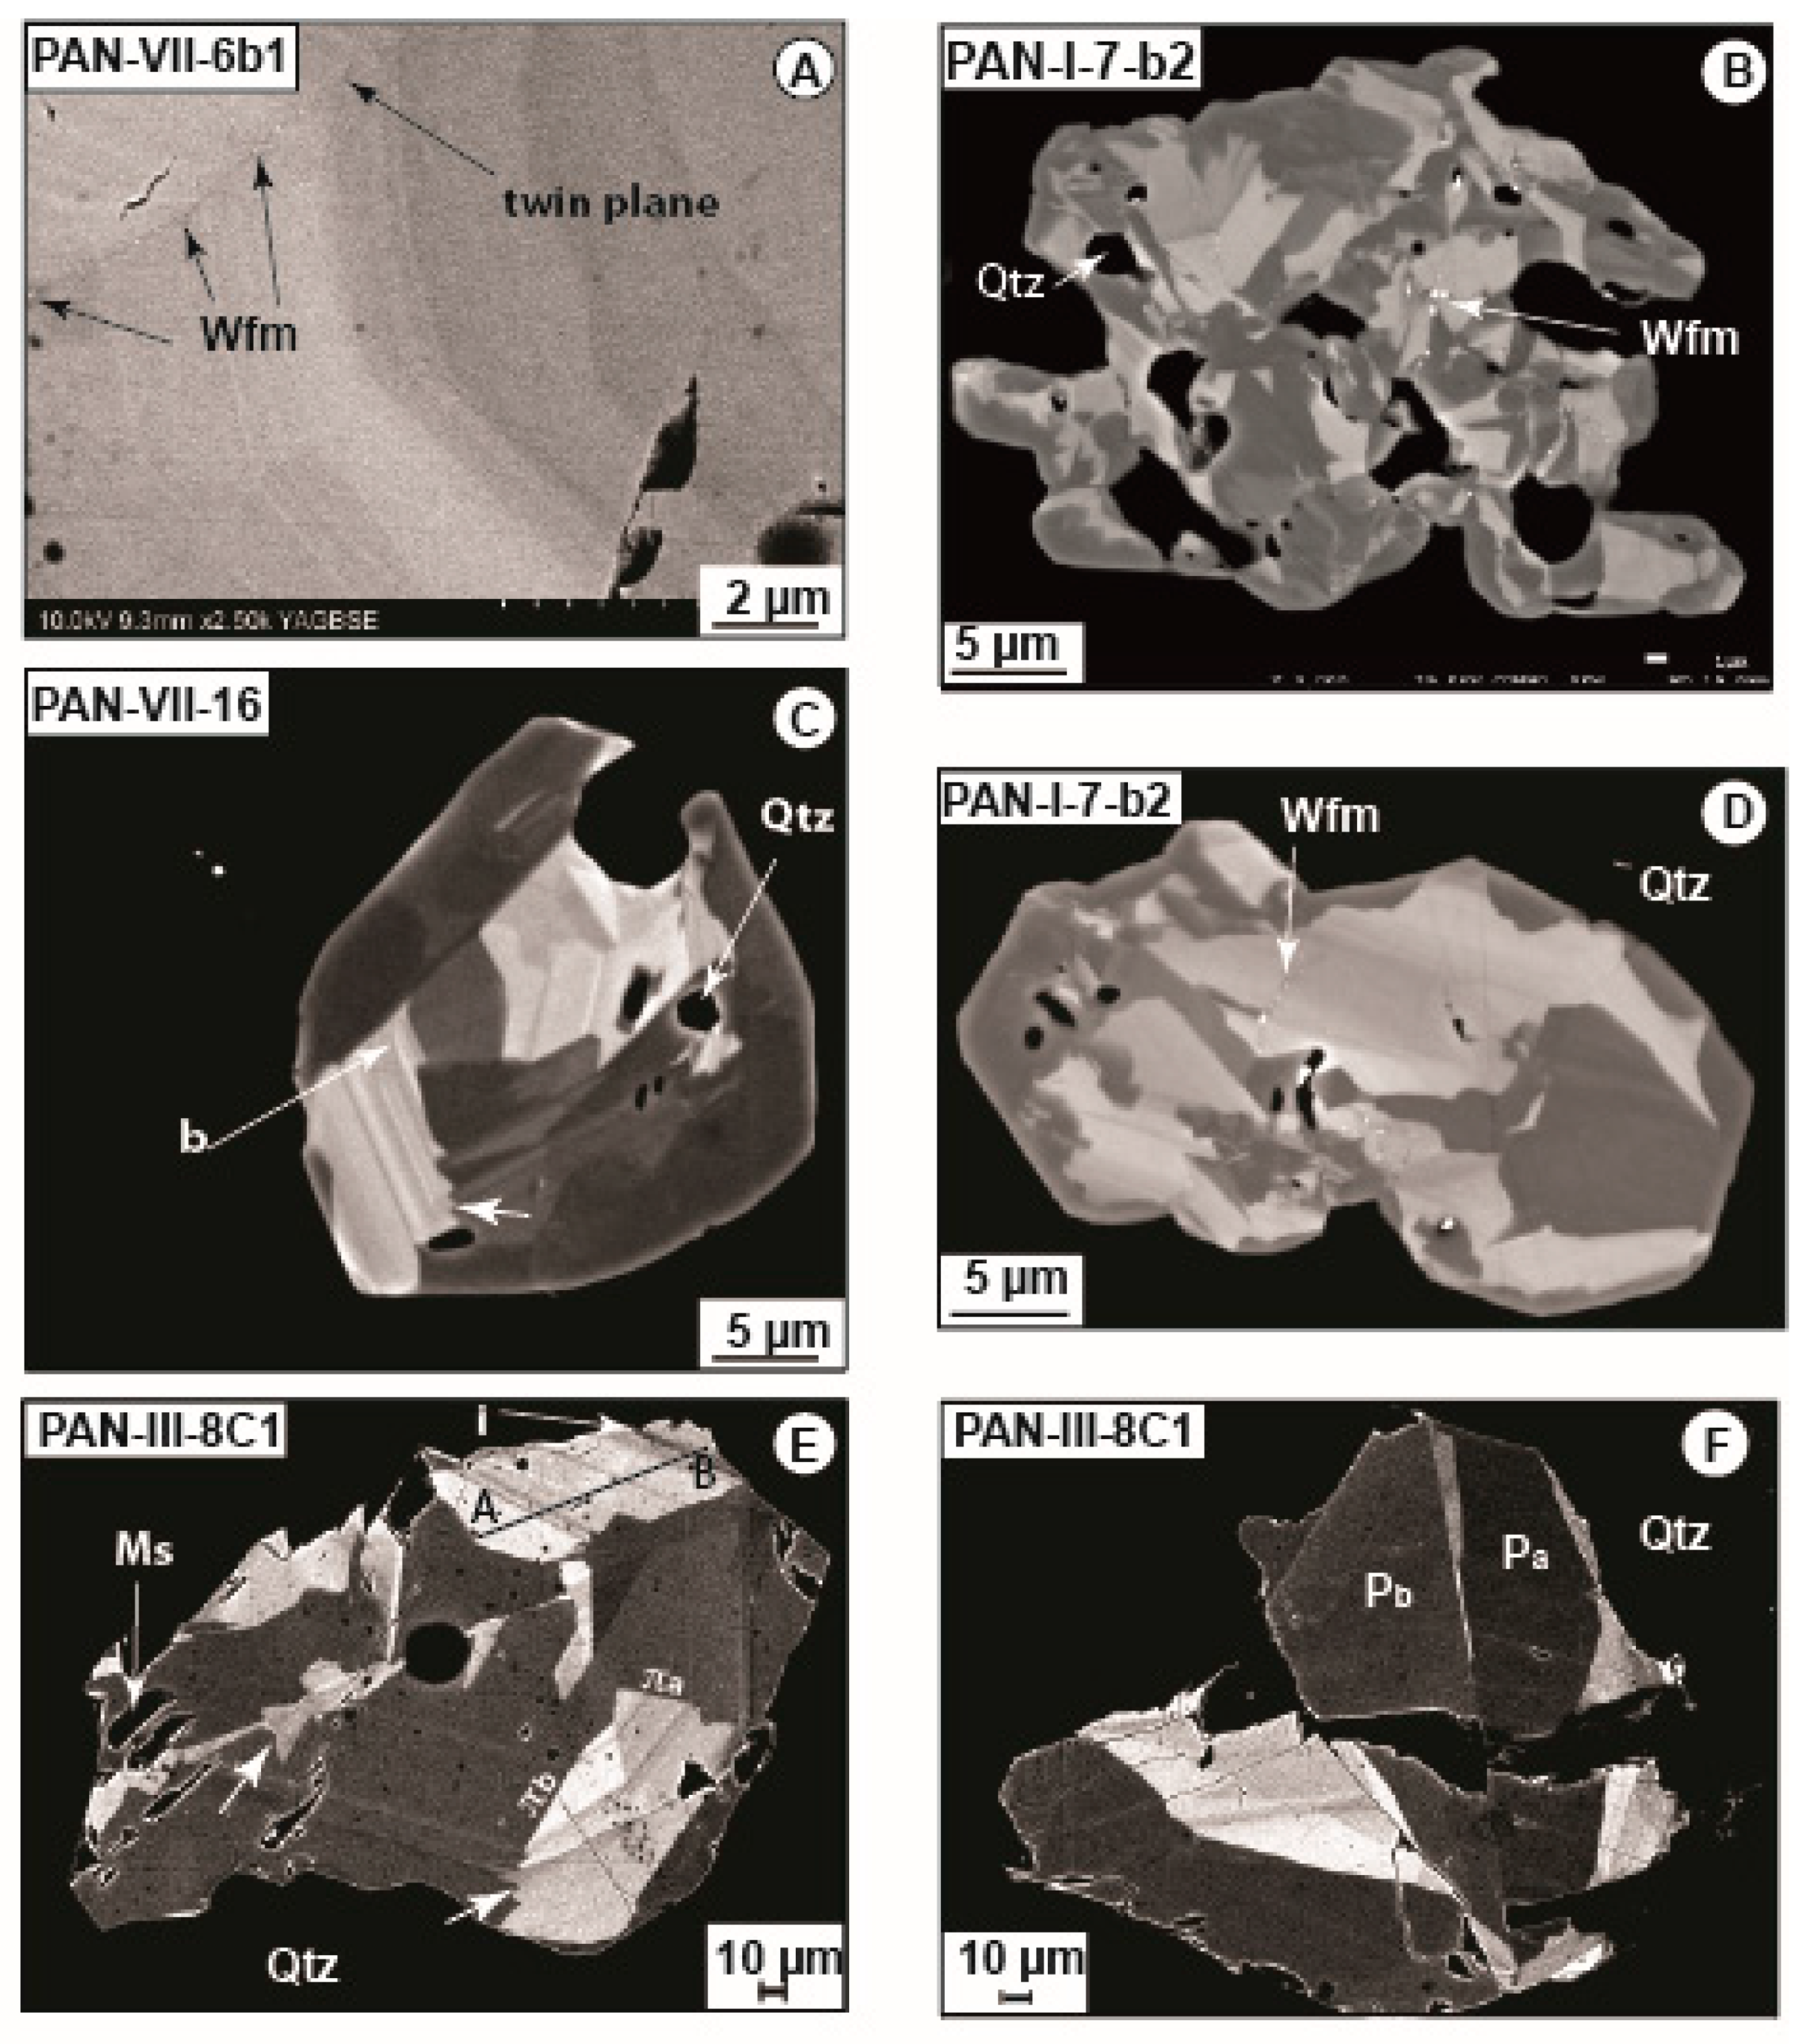
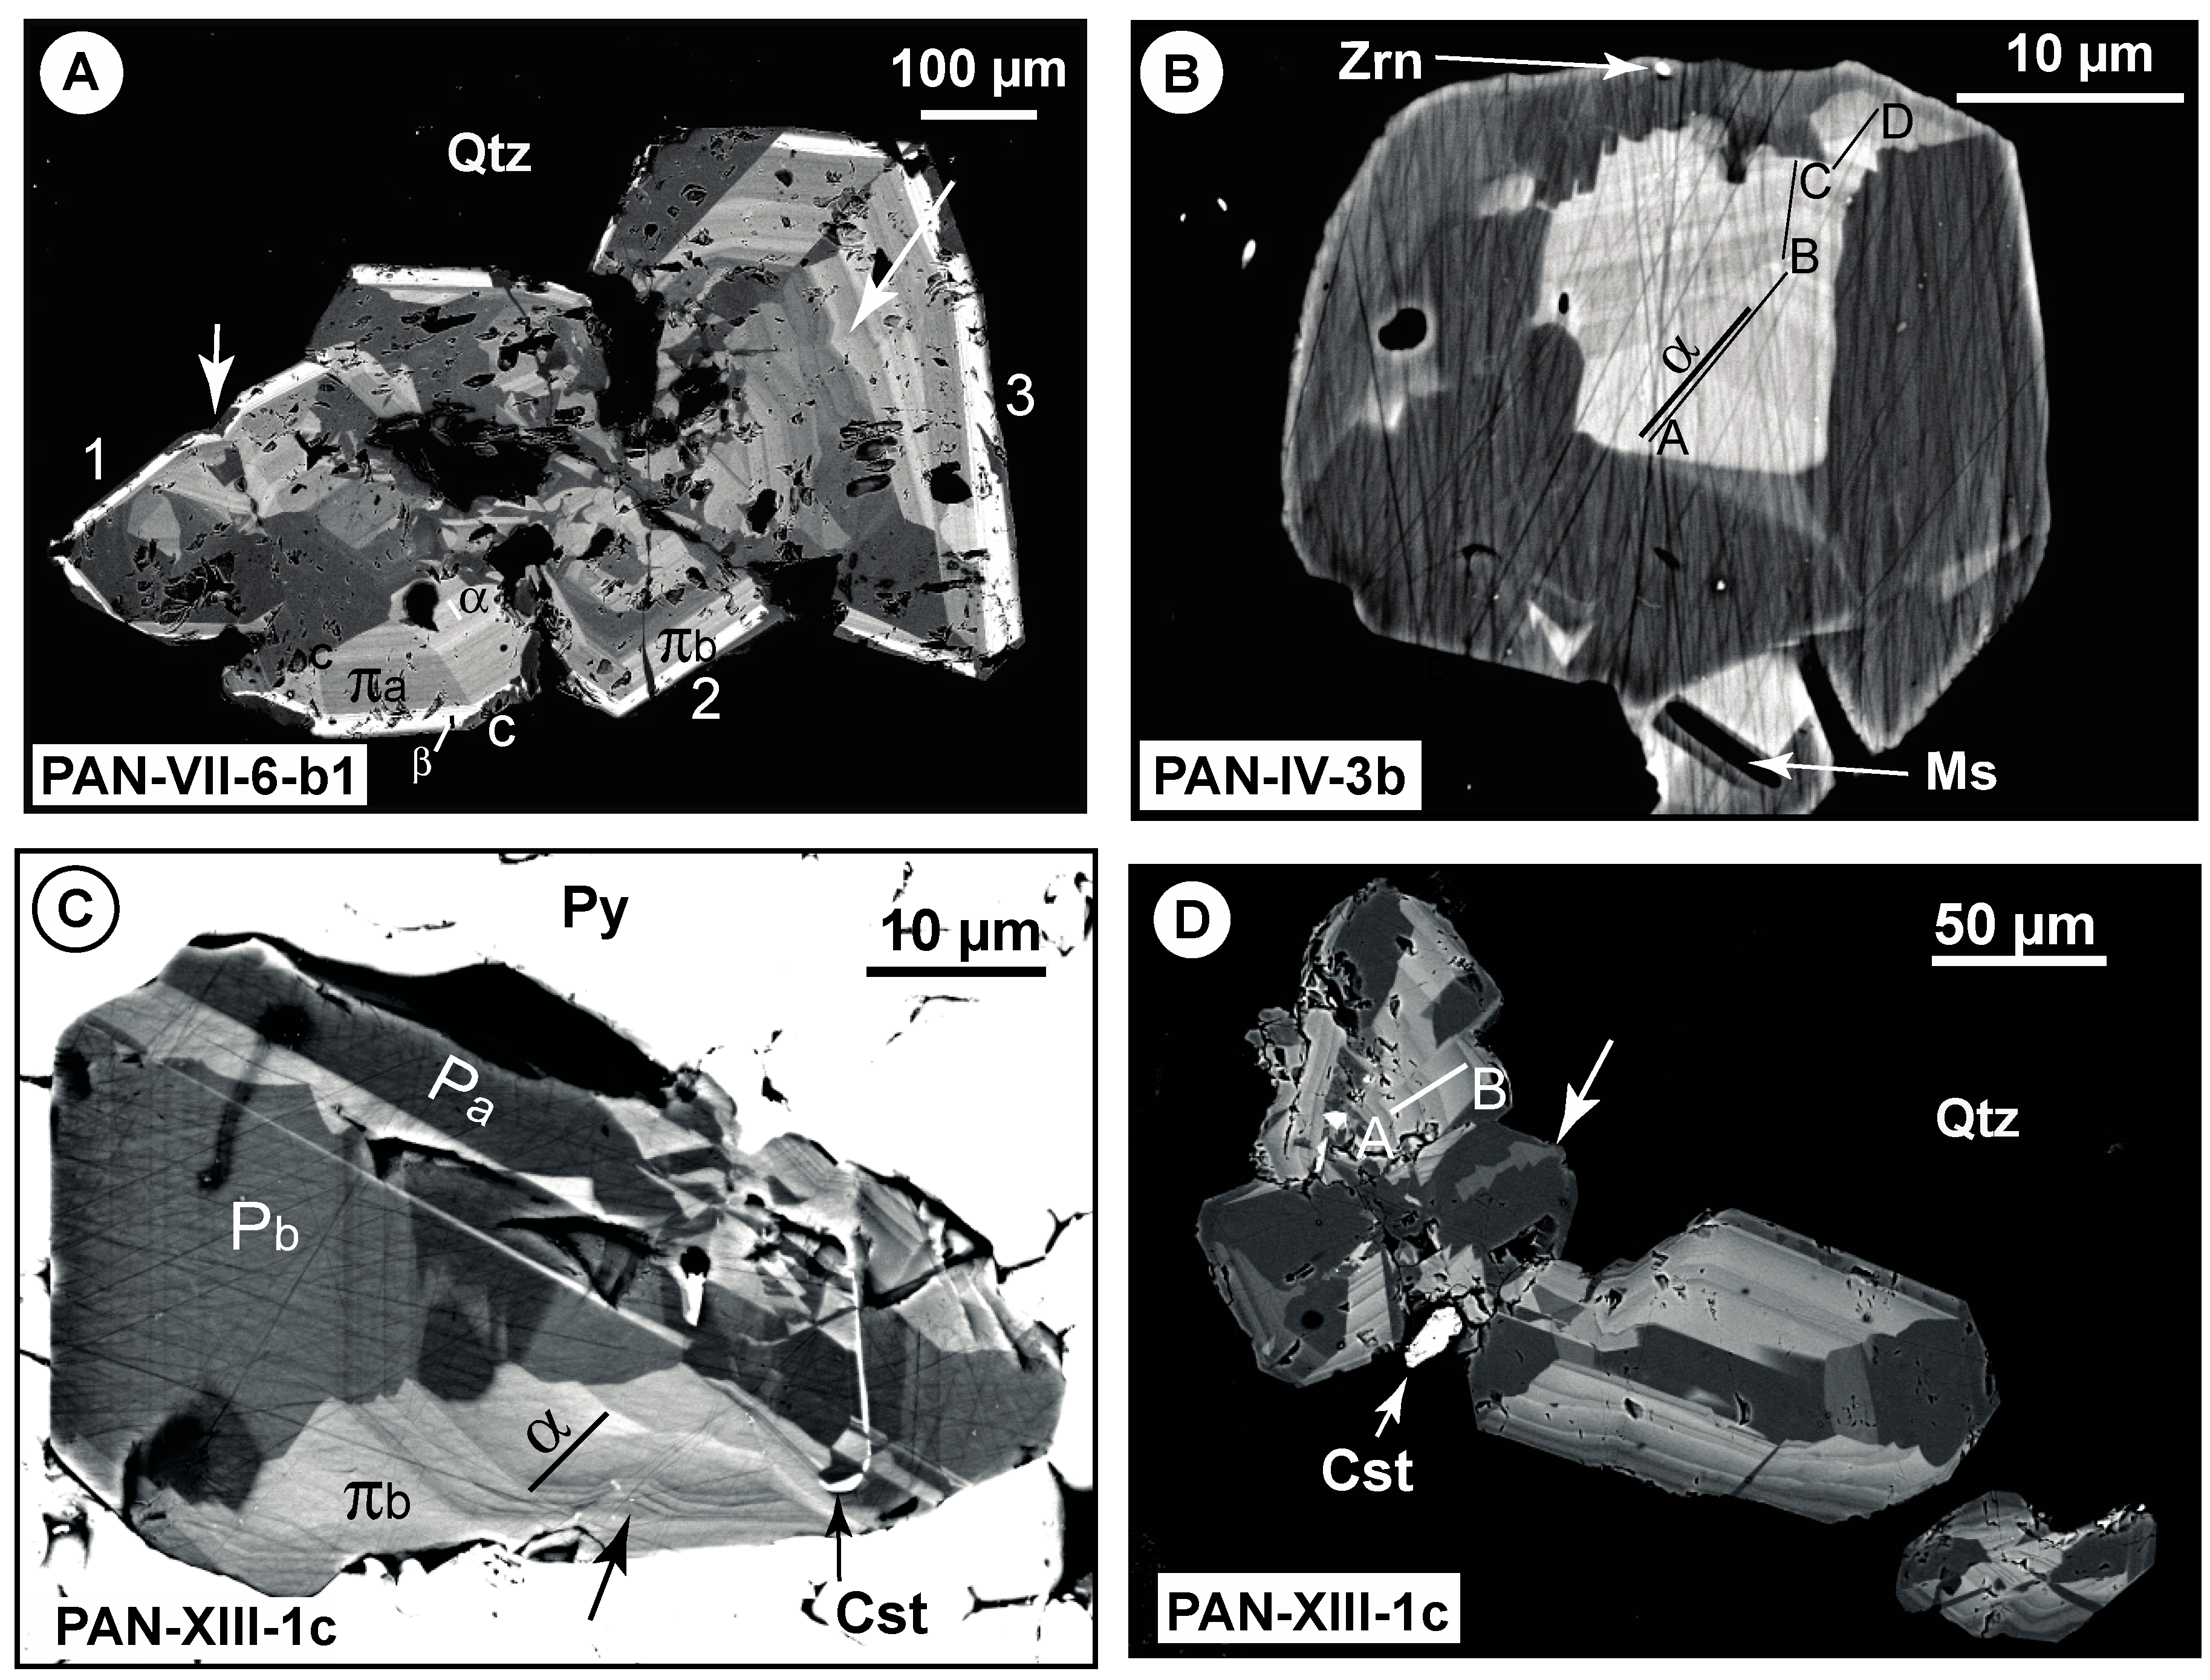
4.1. Petrography
4.2. Rutile Chemical Composition
5. Interpretation
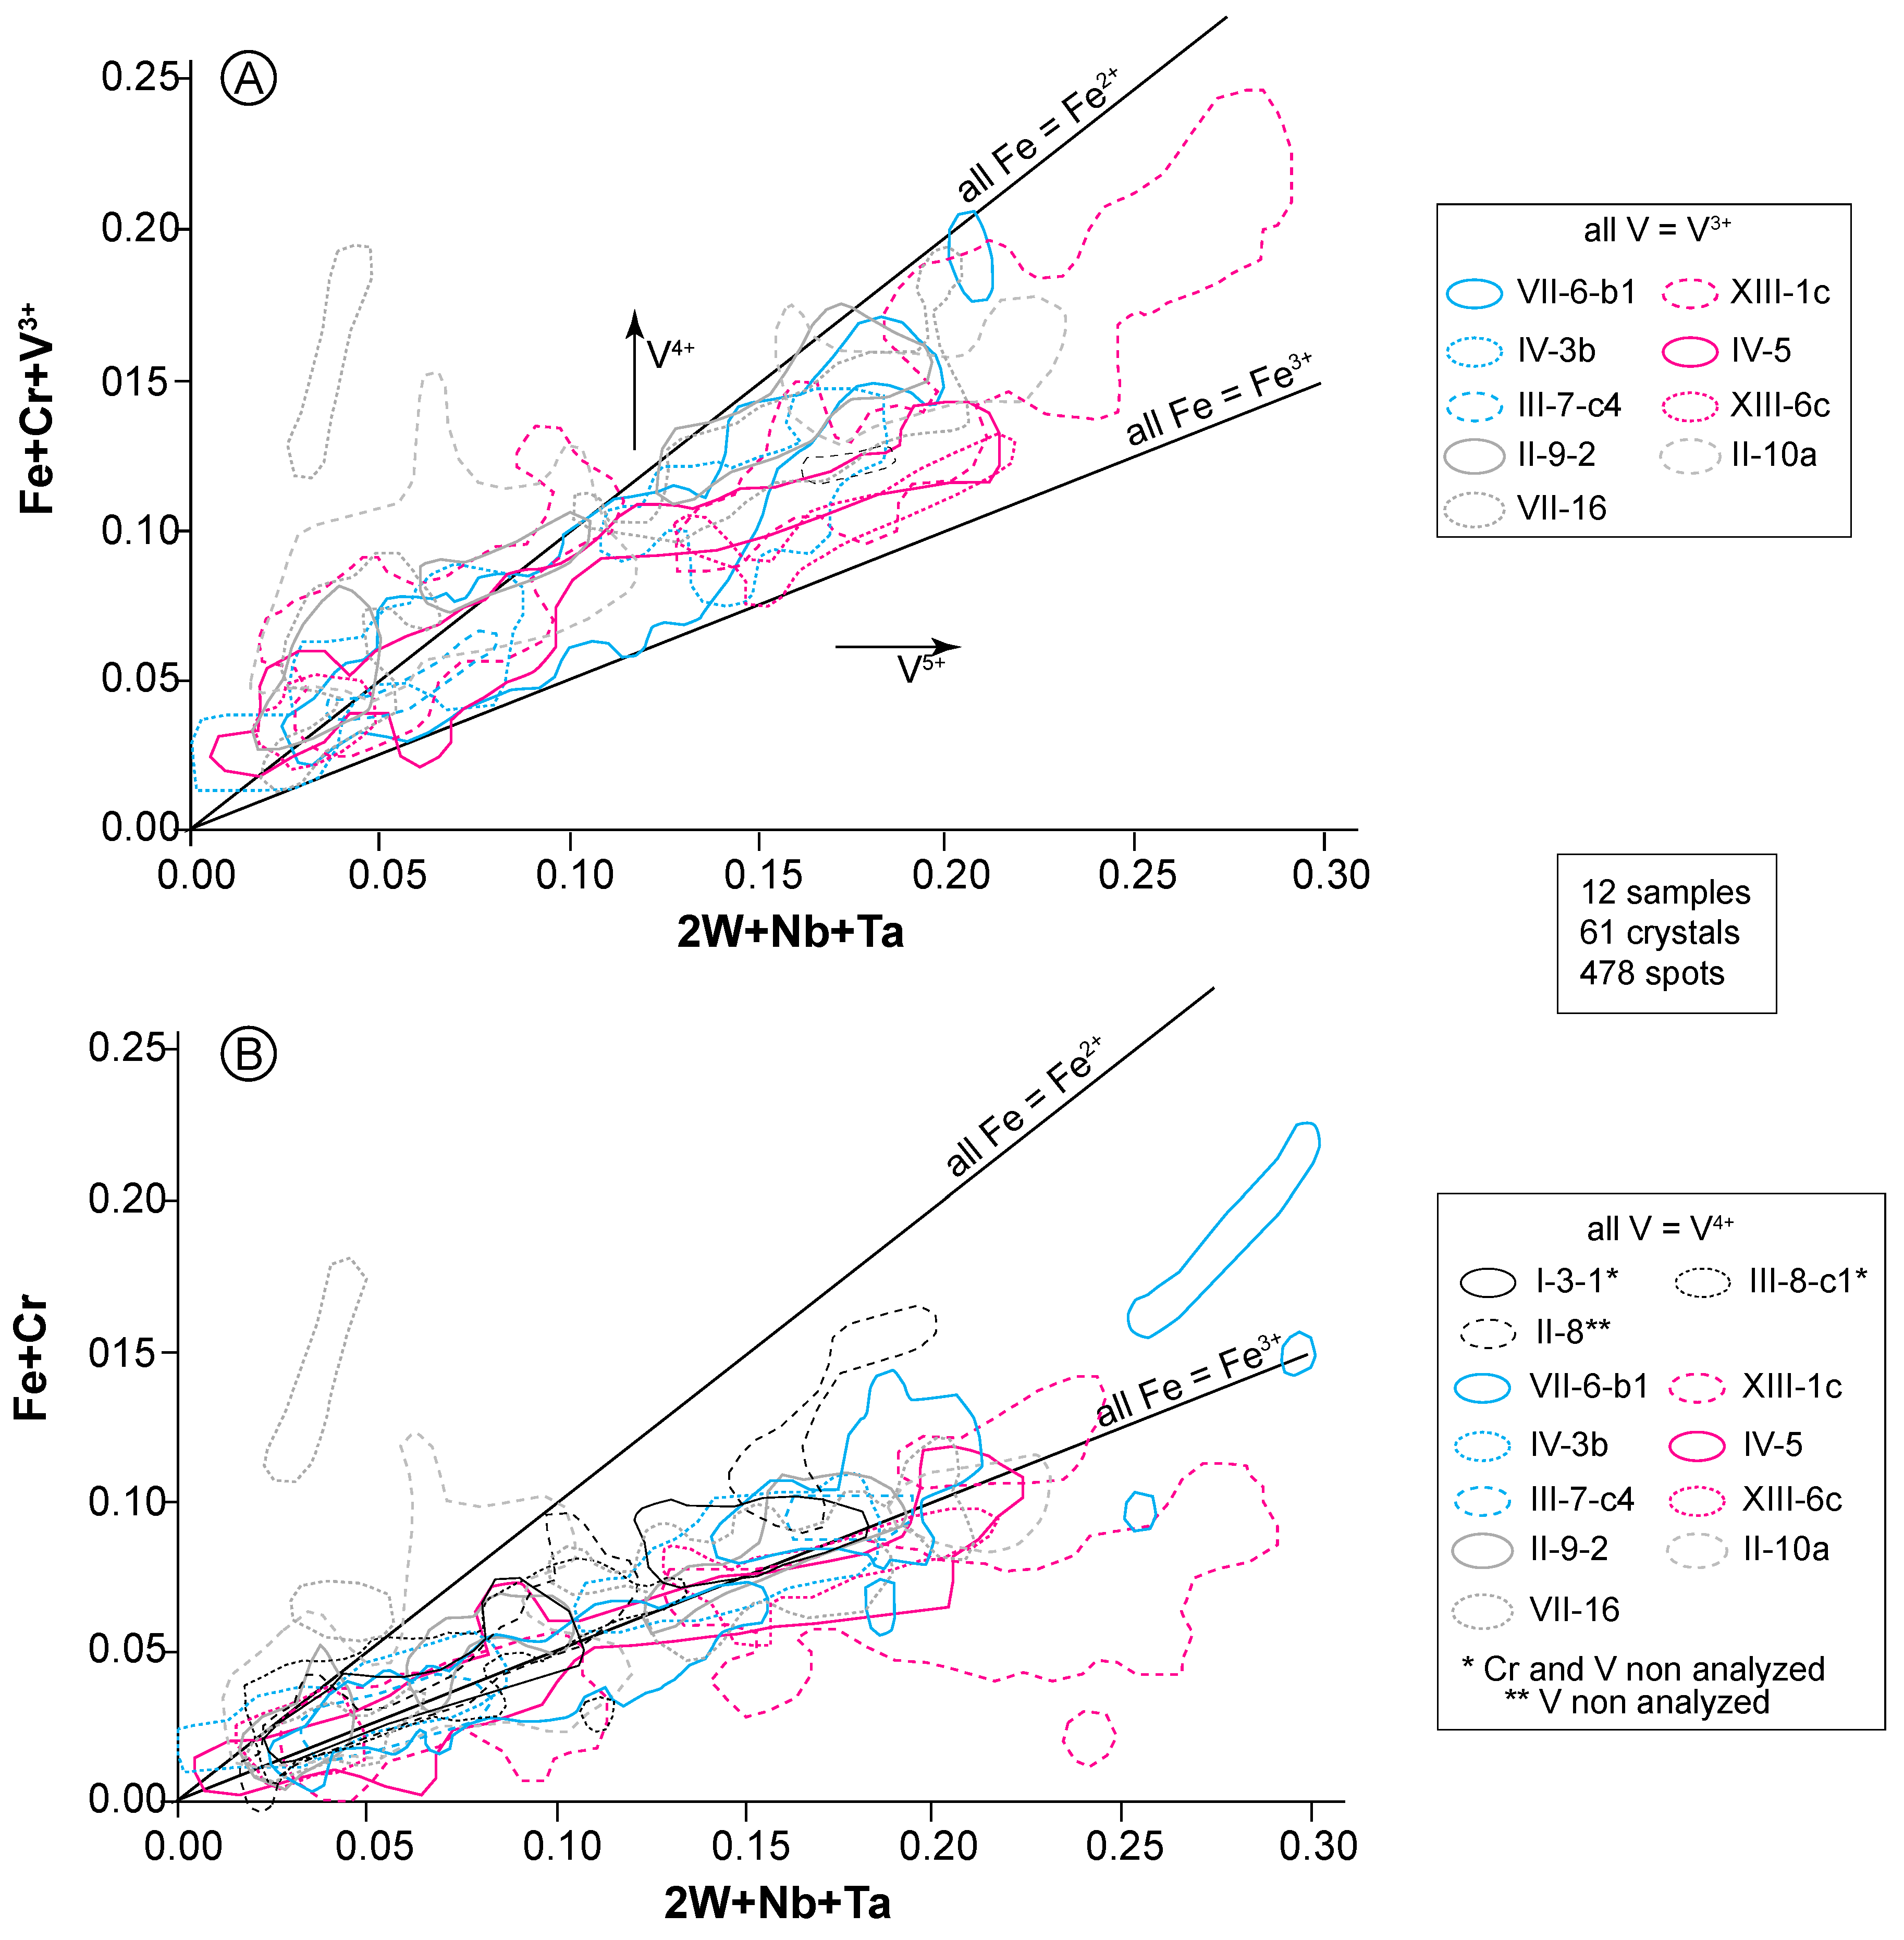
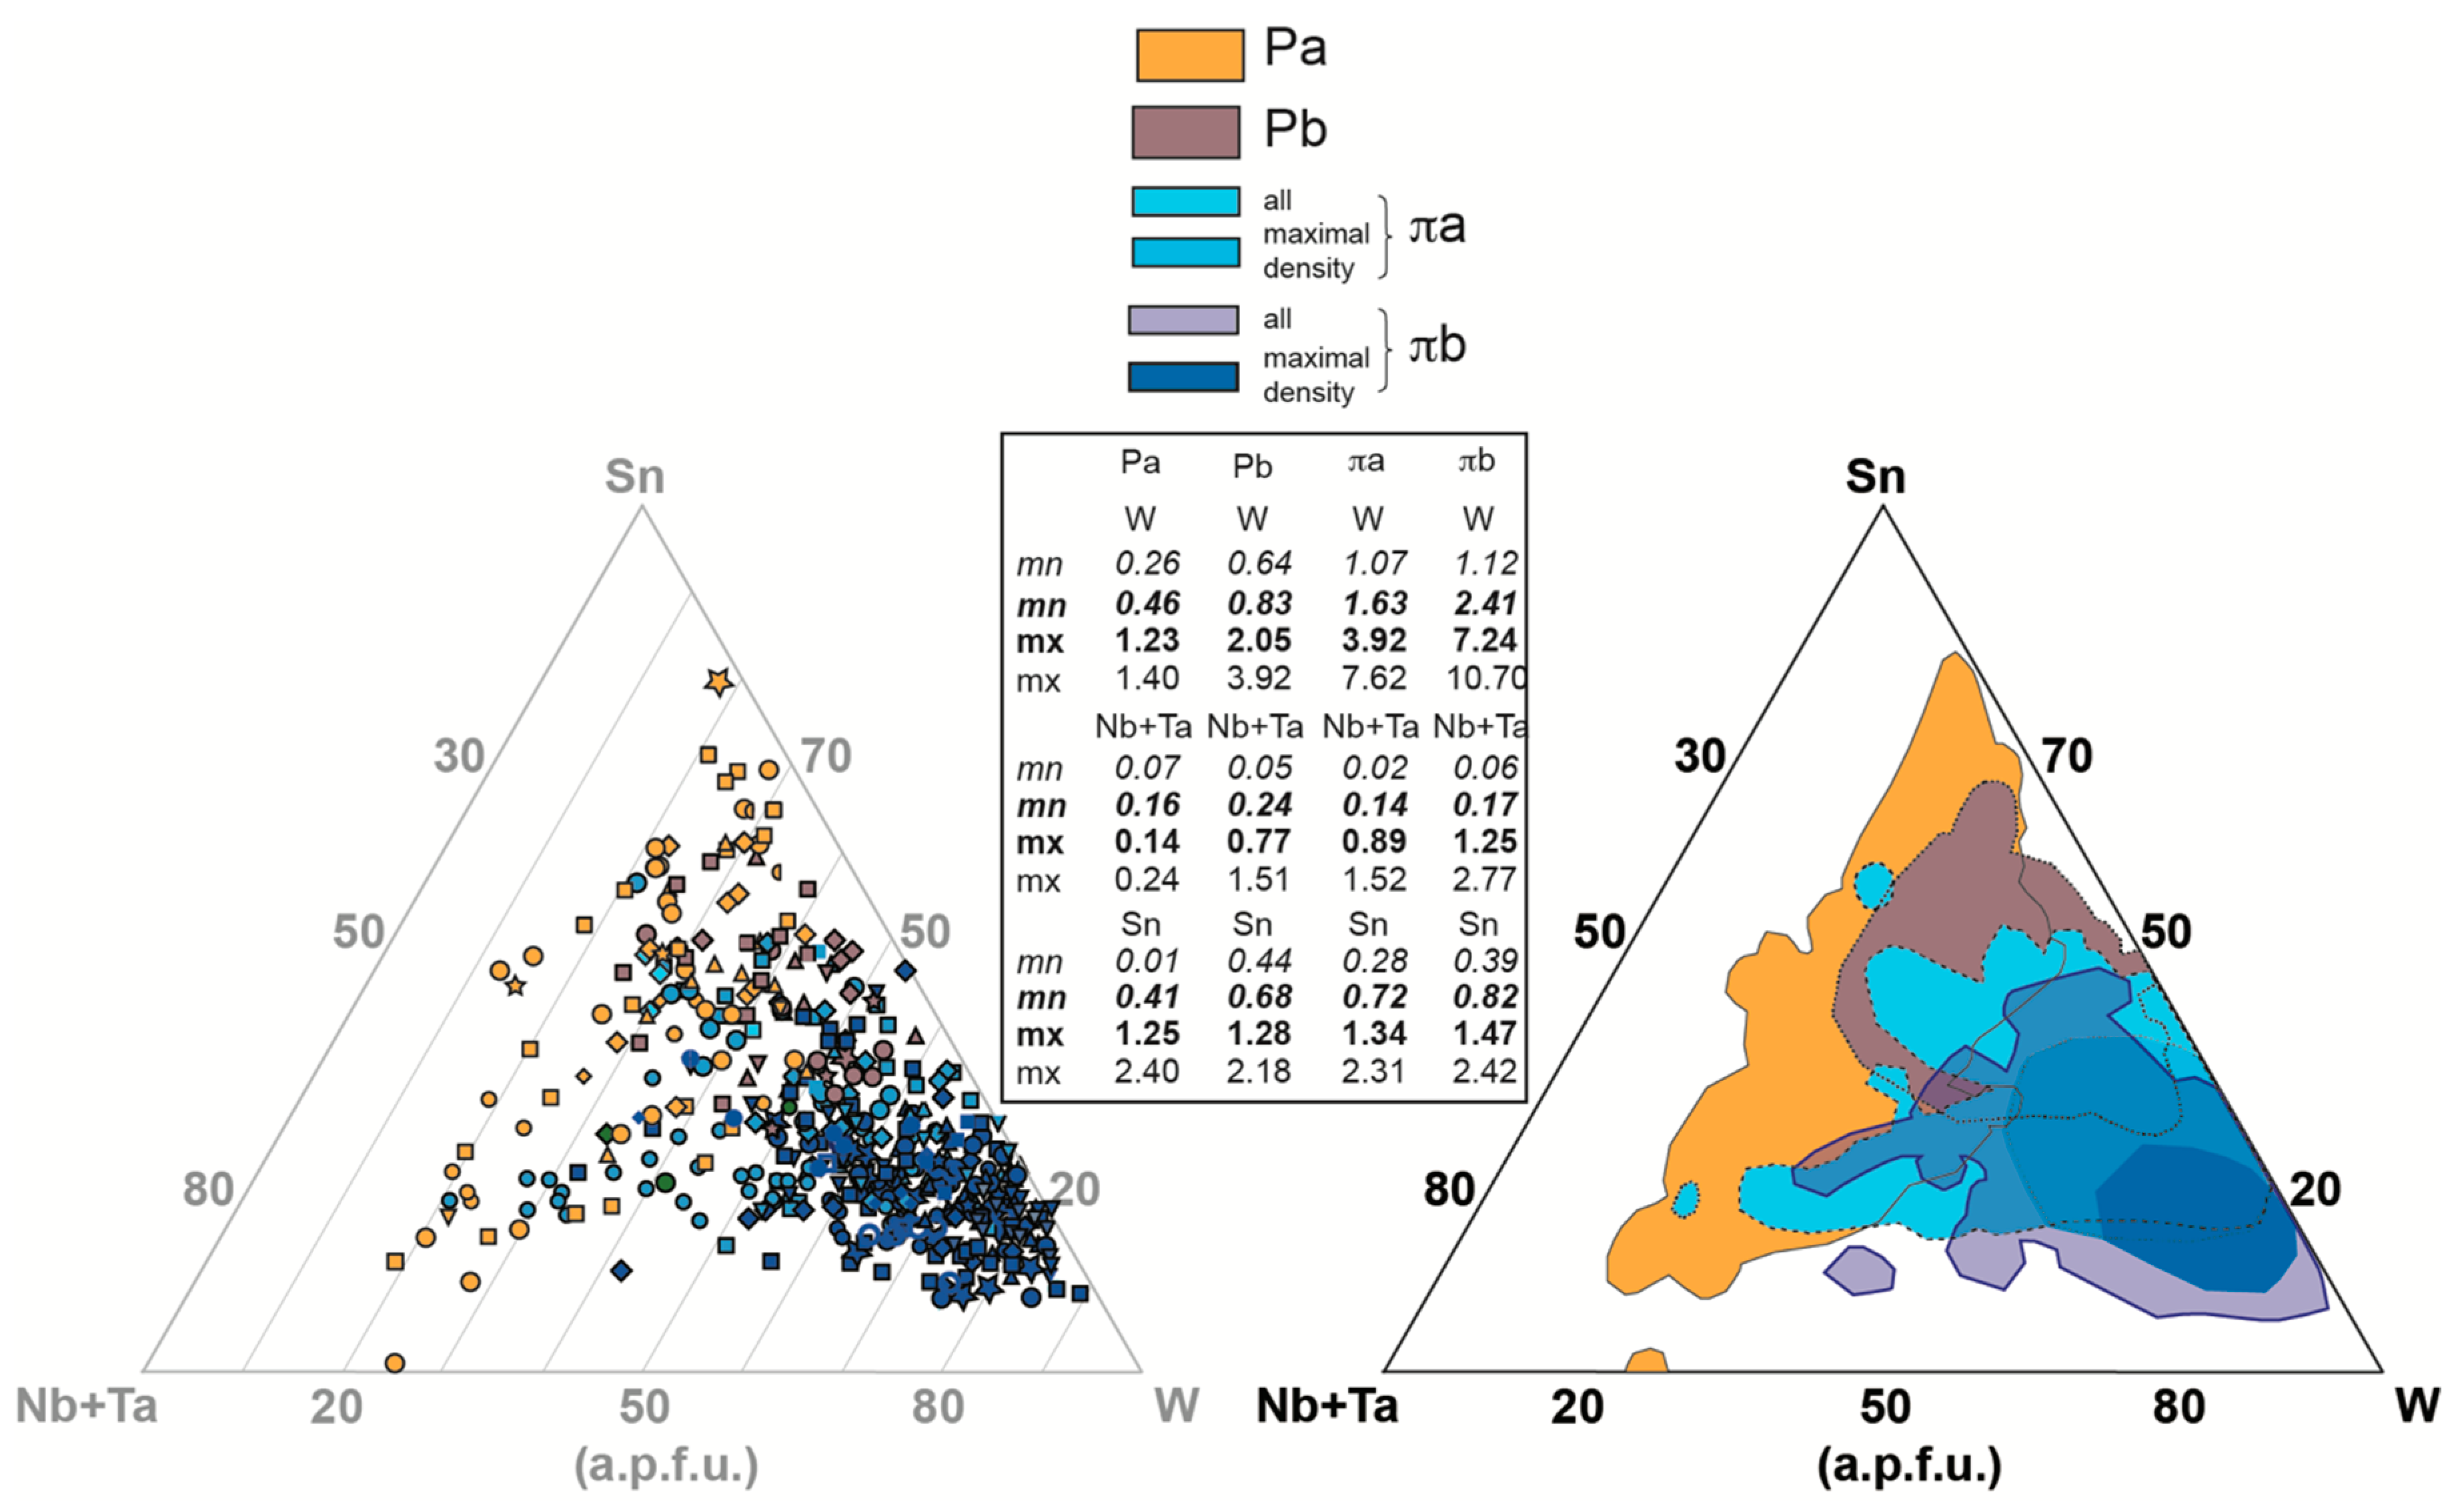
5.1. Crystal Chemistry
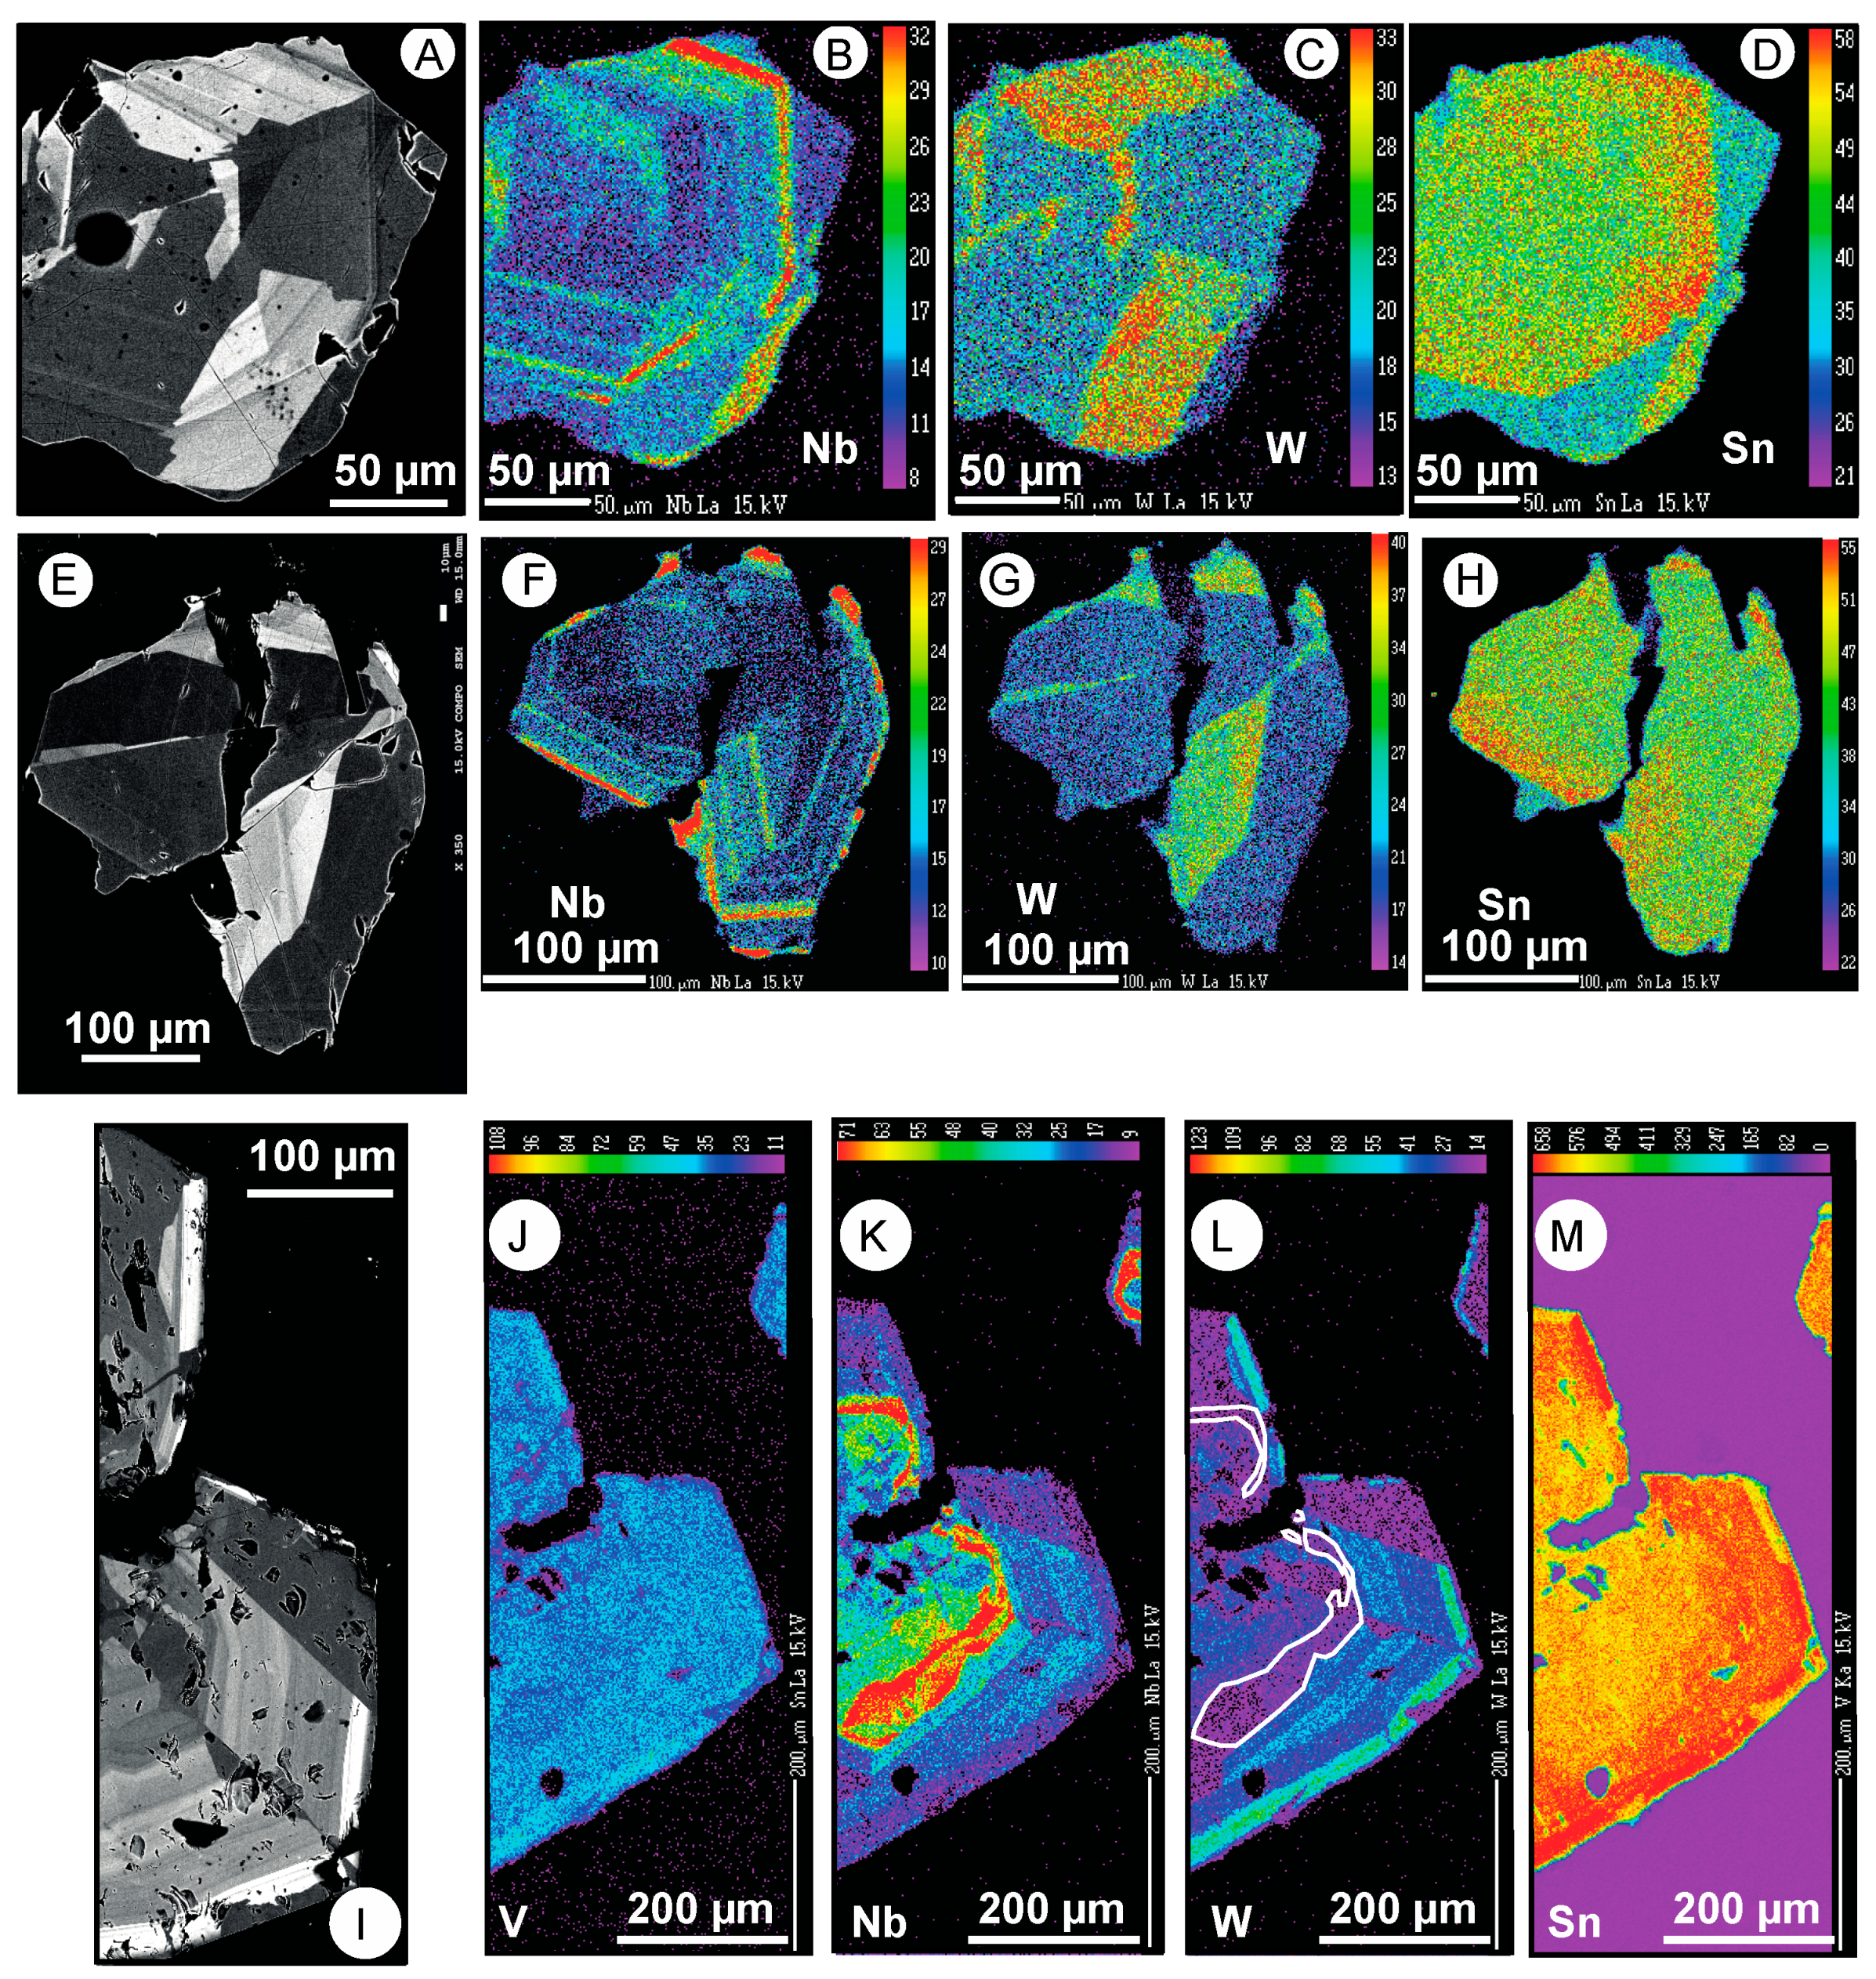
5.2. Compositional Zoning: Sector Zoning
5.3. Compositional Zoning: Oscillatory Zoning
6. Discussion
6.1. Oscillatory Zoning: External or Internal Control?
6.2. Open or Closed System Evolution?
6.3. Oscillatory Zoning as a Consequence of Seismic Activity?
6.4. Nature of the Fluid(s)
7. Conclusions
Supplementary Materials
Author Contributions
Funding
Acknowledgments
Conflicts of Interest
References
- Meinhold, G. Rutile and its applications in earth sciences. Earth-Sci. Rev. 2010, 102, 1–28. [Google Scholar] [CrossRef]
- Graham, J.; Morris, R.C. Tungsten- and antimony-substituted rutile. Mineral. Mag. 1973, 39, 470–473. [Google Scholar] [CrossRef]
- Hassan, W.F. Geochemistry and mineralogy of Ta–Nb rutile from Peninsular Malaysia. J. Asian Earth Sci. 1994, 10, 11–23. [Google Scholar] [CrossRef]
- Murad, E.; Cashion, J.D.; Noble, C.J.; Pilbrow, J.R. The chemical state of Fe in rutile from an albitite in Norway. Mineral. Mag. 1995, 59, 557–560. [Google Scholar] [CrossRef]
- Smith, D.; Perseil, E.-A. Sb-rich rutile in the manganese concentrations at St. Marcel-Praborna, Aosta Valley, Italy; petrology and crystal-chemistry. Mineral. Mag. 1997, 61, 655–669. [Google Scholar] [CrossRef]
- Rice, C.; Darke, K.; Still, J. Tungsten-bearing rutile from the Kori Kollo gold mine Bolívia. Mineral. Mag. 1998, 62, 421–429. [Google Scholar] [CrossRef]
- Zack, T.; Kronz, A.; Foley, S.F.; Rivers, T. Trace element abundances in rutiles from eclogites and associated garnet mica schists. Chem. Geol. 2002, 184, 97–122. [Google Scholar] [CrossRef]
- Bromiley, G.D.; Hilairet, N. Hydrogen and minor element incorporation in synthetic rutile. Mineral. Mag. 2005, 69, 345–358. [Google Scholar] [CrossRef]
- Scott, K.M. Rutile geochemistry as a guide to porphyry Cu–Au mineralization, Northparkes, New South Wales, Australia. Geochem. Explor. Environ. Anal. 2005, 5, 247–253. [Google Scholar] [CrossRef]
- Carruzzo, S.; Clarke, D.B.; Pelrine, K.M.; MacDonald, M.A. Texture, composition, and origin of rutile in the South Mountain Batholith, Nova Scotia. Can. Mineral. 2006, 44, 715–729. [Google Scholar] [CrossRef]
- Zack, T.; von Eynatten, H.; Kronz, A. Rutile geochemistry and its potential use in quantitative provenance studies. Sediment. Geol. 2004, 171, 37–58. [Google Scholar] [CrossRef]
- Triebold, S.; von Eynatten, H.; Luvizotto, G.L.; Zack, T. Deducing source rock lithology from detrital rutile geochemistry: An example from the Erzgebirge, Germany. Chem. Geol. 2007, 244, 421–436. [Google Scholar] [CrossRef]
- Plank, T.; Langmuir, C.H. The geochemical composition of subducting sediment and its consequences for the crust and mantle. Chem. Geol. 1998, 145, 325–394. [Google Scholar] [CrossRef]
- La Tourette, T.; Hervig, R.L.; Holloway, J.R. Trace element partitioning between amphibole, phlogopite and basanite melt. Earth Planet. Sci. Lett. 1995, 135, 13–30. [Google Scholar] [CrossRef]
- Barth, M.G.; McDonough, W.F.; Rudnick, R.L. Tracking the budget of Nb and Ta in the continental crust. Chem. Geol. 2000, 165, 197–213. [Google Scholar] [CrossRef]
- Zack, T.; Stockli, D.F.; Luvizotto, G.L.; Barth, M.G.; Belousova, E.; Wolfe, M.R.; Hinton, R.W. In situ U-Pb rutile dating by LA-ICP-MS: 208Pb correction and prospects for geological applications. Contrib. Mineral. Petrol. 2011, 162, 515–530. [Google Scholar] [CrossRef]
- Ferreira-Filho, C.F.; Naldrett, A.J.; Fuck, R.A.; Kamo, S.L.; Krogh, T.E. Zircon and rutile U-Pb geochronology of the Niquelândia layered mafic and ultramafic intrusion, Brazil: Constraints for the timing of magmatism and high grade metamorphism. Prec. Res. 1994, 68, 241–255. [Google Scholar] [CrossRef]
- Richards, J.P.; Krogh, T.E.; Spooner, E.T.C. Fluid inclusion characteristics and U–Pb rutile age of late hydrothermal alteration and veining at the Musoshi stratiform copper deposit, Central African copper belt, Zaire. Econ. Geol. 1998, 83, 118–139. [Google Scholar] [CrossRef]
- Schandl, E.S.; Davis, D.W.; Krogh, T.E. Are the alteration halos of massive sulfide deposits syngenetic? Evidence from U–Pb dating of hydrothermal rutile at the Kidd volcanic center, Abitibi subprovince, Canada. Geology 1990, 18, 505–508. [Google Scholar] [CrossRef]
- Wong, L.; Davis, D.W.; Krogh, T.E.; Robert, F. U–Pb zircon and rutile geochronology of Archean greenstone formation and gold mineralization in the Val d’Or region, Quebec. Earth Planet. Sci. Lett. 1991, 104, 325–336. [Google Scholar] [CrossRef]
- Carocci, E.; Marignac, C.; Cathelineau, M.; Truche, L.; Pinto, F. Trace Elements in Tourmaline: Markers of Incipient W Deposition in Panasqueira Mine. In Proceedings of the Goldschmidt Conference, Paris, France, 13–18 August 2017. [Google Scholar]
- Zack, T.; Moraes, R.; Kronz, A. Temperature dependence of Zr in rutile: Empirical calibration of a rutile thermometer. Contrib. Mineral. Petrol. 2004, 148, 471–488. [Google Scholar] [CrossRef]
- Novák, M.; Černý, P. Niobium–tantalum oxide minerals from complex granitic pegmatites in the Moldanubicum, Czech Republic: Primary versus secondary compositional trends. Can. Mineral. 1998, 36, 659–672. [Google Scholar]
- Tindle, A.G.; Breaks, F.W. Oxide minerals of the Separation Rapids rare-element granitic pegmatite group, Northwestern Ontario. Can. Mineral. 1998, 36, 609–635. [Google Scholar]
- Černý, P.; Goad, B.E.; Hawthome, F.C.; Chapman, R. Fractionation trends of the Nb- and Ta-hearing oxide minerals in the Greer Lake pegmatitic granite and its pegmatite aureole, southeastern Manitoba. Am. Mineral. 1986, 71, 501–517. [Google Scholar]
- Černý, P.; Chapman, R.; Simmons, W.B.; Chackowsky, L.E. Niobian rutile from the McGuire granitic pegmatite, Park County, Colorado; solid solution, exsolution, and oxidation. Am. Mineral. 1999, 84, 754–763. [Google Scholar] [CrossRef]
- Hanson, S.L.; Simmons, W.B.; Falster, A.U. Nb–Ta–Ti oxides in granitic pegmatites from the Topsham pegmatite district, southern Maine. Can. Mineral. 1998, 36, 601–608. [Google Scholar]
- Uher, P.; Černý, P.; Chapman, R.; Határ, J.; Miko, O. Evolution of Nb, Ta-oxide minerals in the Prašivá granitic pegmatites, Slovakia. I. Primary Fe, Ti-rich assemblage. Can. Mineral. 1998, 36, 525–534. [Google Scholar]
- Belkasmi, M.; Cuney, M.; Pollard, P.J.; Bastoul, A. Chemistry of the Ta-Nb-Sn-W oxide minerals from the Yichun rare metal granite (SE China): Genetic implications and comparison with Moroccan and French Hercynian examples. Mineral. Mag. 2000, 64. [Google Scholar] [CrossRef]
- Aurisicchio, C.; De Vito, C.; Ferrini, V.; Orlandi, P. Nb and Ta oxide minerals in the Fonte Del Prete granitic pegmatite dike, Island of Elba, Italy. Can. Mineral. 2002, 40, 799–814. [Google Scholar] [CrossRef]
- Bouabsa, L.; Marignac, C.; Chabbi, R.; Cuney, M. 2010. The Filfila (NE Algeria) topaz bearing granites and their rare metal minerals: Petrologic and metallogenic implications. J. Afr. Earth Sci. 2010, 56, 107–113. [Google Scholar] [CrossRef]
- Rabbia, O.M.; Hernández, L.B. Mineral chemistry and potential applications of natural-multi-doped hydrothermal rutile from porphyry copper deposits. In Rutile: Properties, Synthesis and Application; Low, I.-M., Ed.; Nova Science Publishers, Inc.: Hauppauge, NY, USA, 2012; pp. 209–228. [Google Scholar]
- Clark, J.R.; Williams-Jones, A.E. Rutile as a Potential Indicator Mineral for Metamorphosed Metallic ore Minerals Deposits; Rapport Final de DIVEX, Sous-projet SC2; Divex: Montréal, QC, Canada, 2004; 17p. [Google Scholar]
- Scott, K.M.; Radford, N.W. Rutile compositions at the Big Bell Au deposit as a guide for exploration. Geochem. Explor. Environ. Anal. 2007, 7, 353–361. [Google Scholar] [CrossRef]
- Dostal, J.; Kontak, D.J.; Chatterjee, A. Trace element geochemistry of scheelite and rutile from metaturbidite-hosted quartz vein gold deposits, Meguma Terrane, Nova Scotia, Canada: Genetic implications. Mineral. Petrol. 2009, 97, 95–109. [Google Scholar] [CrossRef]
- Scott, K.M.; Radford, N.; Hough, R.; Reddy, S. Rutile compositions in the Kalgoorlie Goldfields and their implications for exploration. Aust. J. Earth Sci. 2011, 58, 803–812. [Google Scholar] [CrossRef]
- Černý, P.; Novák, M.; Chapman, R.; Ferreira, K.J. Subsolidus behavior of niobian rutile from the Písek region, Czech Republic: A model for exsolution in W- and Fe2+ ≫Fe3+-rich phases. J. Geosci. 2007, 52, 143–159. [Google Scholar] [CrossRef]
- Harlaux, M. Tungsten and Rare-Metal (Nb, Ta, Sn) Hydrothermal Metallogenic Systems in the Late Variscan Orogenic Context: Example of the French Massif Central. Ph.D. Thesis, Lorraine University, Lorraine, France, 2016; p. 576. [Google Scholar]
- Michailidis, K.M. An EPMA and SEM study of niobian-tungstenian rutile from the Fanos aplitic granite, central Macedonia, northern Greece. Neues Jahrbuch fur Mineralogie-Monatshefte 1997, 12, 549–563. [Google Scholar]
- Baksheev, T.A.; Guseva, E.V.; Spiridonov, E.M. W- rutile from vein post-skarn mineralization of the Bestiube deposit, north Kazakhstan. In Proceedings of the 16th General Meeting Abstracts International Mineralogical Association (IMA), Pisa, Italy, 4–9 September 1994; Volume 16, pp. 25–26. [Google Scholar]
- Vigne, J.-L.; André, G.; Kapal, F. Données industrielles, économiques, géographiques sur les principaux produits chimiques, métaux, matériaux, 2018. Available online: http://www.societechimiquedefrance.fr/extras/Donnees/acc.htm (accessed on 20 December 2018).
- Almonty Industries. Report NI 43-101. Technical Report on the Mineral Resources and Reserves of the Panasqueira Mine, Portugal. 2016. Available online: http://www.almonty.com/_resources/Panasqueira_43-101_Tech_Rep_Dec16_SEDAR.PDF (accessed on 20 December 2018).
- Díez Fernández, R.; Barreiro, J.G.; Martínez Catalán, J.R.; Ayarza, P. Crustal thickening and attenuation as revealed by regional fold interference patterns: Ciudad Rodrigo basement area (Salamanca, Spain). J. Struct. Geol. 2013, 46, 115–128. [Google Scholar] [CrossRef]
- Ribeiro, R.F. Gravimetric Modelling and Geological Interpretation of Argemela-Panasqueira Area. Ph.D. Thesis, Porto University, Porto, Portugal, 2017; p. 61. [Google Scholar]
- Kelly, W.C.; Rye, R.O. Geologic, fluid inclusion, and stable isotope studies of the tin–tungsten deposits of Panasqueira, Portugal. Econ. Geol. 1979, 74, 1721–1822. [Google Scholar] [CrossRef]
- Bussink, R.W. Geochemistry of the Panasqueira tungsten-tin deposit, Portugal. Geol. Ultraiect. 1984, 33, 1–159. [Google Scholar]
- De Amorin, A. Petrographie géochimie des granitoides de la mine de W de Panasqueira (Portugal): Rôle dans la genèse des minéralisations. Unpublished MSc Thesis, Lorraine University (France), Lorraine, France, 2017; p. 31. [Google Scholar]
- Thadeu, D. Geologia e jazigos de chumbo e zinco da Beira Baixa. Bol. da SGP (Soc. Geol. de Por.) 1951, 9, 1–144. [Google Scholar]
- Polya, D.A. Chemical behaviour of tungsten in hydrothermal flulids and genesis of the Panasqueira W-Cu-Sn deposit, Portugal. Unpublished Ph.D. Thesis, Manchester University, Manchester, UK, 1988; 334p. [Google Scholar]
- Polya, D.A. Compositional variation in wolframites from the Barroca Grande mine, Portugal: Evidence for fault-controlled ore formation. Mineral. Mag. 1988, 52, 497–503. [Google Scholar] [CrossRef]
- Polya, D.A. Efficiency of hydrothermal ore formation and the PanasqueiraW-Cu(Ag)-Snvein deposit. Nature 1988, 333, 838–841. [Google Scholar] [CrossRef]
- Polya, D.A. Chemistry of the main-stage ore-forming fluids of the Panasqueira W–Cu(Ag)–Sn deposit, Portugal: Implications for models of ore genesis. Econ. Geol. 1989, 84, 1134–1152. [Google Scholar] [CrossRef]
- Snee, L.W.; Sutter, J.F.; Kelly, W.C. Thermochronology of economic mineral deposits: Dating the stages of mineralisation at Panasqueira, Portugal, by high-precision 40Ar-39Ar age spectrum techniques on muscovite. Econ. Geol. 1988, 83, 335–354. [Google Scholar] [CrossRef]
- Noronha, F.; Dória, F.; Dubessy, J.; Charoy, B. Characterization and timing of the different types of fluids present in the barren and ore veins of the W–Sn deposit of Panasqueira, central Portugal. Miner. Depos. 1992, 27, 72–79. [Google Scholar] [CrossRef]
- Lüders, V. Contribution of infrared microscopy to fluid inclusion studies in some opaque minerals (wolframite, stibnite, bournonite): Metallogenic implications. Econ. Geol. 1996, 91, 1462–1468. [Google Scholar] [CrossRef]
- Foxford, K.A.; Nicholson, R.; Polya, D.A. Textural evolution of W–Cu–Sn bearing hydrothermal quartz veins at Minas da Panasqueira, Portugal. Mineral. Mag. 1991, 55, 435–445. [Google Scholar] [CrossRef]
- Foxford, K.A.; Nicholson, R.; Polya, D.A.; Hebblethwaite, R.P.B. Extensional failure and hydraulic valving at Minas da Panasqueira, Portugal: Evidence from vein spatial distributions, displacements and geometries. J. Struct. Geol. 2000, 22, 1065–1086. [Google Scholar] [CrossRef]
- Polya, D.A.; Foxford, K.A.; Stuart, F.; Boyce, A.; Fallick, A.E. Evolution and paragenetic context of low δD hydrothermal fluids from the Panasqueira W-Sn deposit, Portugal: New evidence from microthermometric, stable isotope, noble gas and halogen analyses of primary fluid inclusions. Geochim. Cosmochim. Acta 2000, 64, 3357–3371. [Google Scholar] [CrossRef]
- Lourenço, A. Paleofluidos e mineralizações associadas às fases tardias da Orogenia Hercínica. Unpublished Ph.D. Thesis, Porto University, Porto, Portugal, 2002; 326p. [Google Scholar]
- Burnard, P.G.; Polya, D.A. Importance of mantle derived fluids during granite associated hydrothermal circulation: He and Ar isotopes of ore minerals from Panasqueira. Geochim. Cosmochim. Acta 2004, 68, 1607–1615. [Google Scholar] [CrossRef]
- Pinto, F.; Vieira, R.; Noronha, F. Different cassiterite generations at the Panasqueira Deposit (Portugal): Implications for the metal zonation model. In Mineral Resources in a Sustainable World; André-Mayer, A.S., Cathelineau, M., Muchez, P., Pirard, E., Sindern, S., Eds.; Proceedings of the Society of Geology Appplied to Mineral Deposits (SGA) Biennal Meeting: Nancy, France, 2015; Volume 2, pp. 827–830. [Google Scholar]
- Lecumberri-Sanchez, P.; Vieira, R.; Heinrich, C.; Pinto, F.; Walle, M. Fluid-rock interaction is decisive for the formation of tungsten deposits. Geology 2017, 45, 579–582. [Google Scholar] [CrossRef]
- Codeço, M.S.; Weis, P.; Trumbull, R.B.; Pinto, F.; Lecumberri-Sanchez, P.; Wilke, F.D. Chemical and boron isotopic composition of hydrothermal tourmaline from the Panasqueira W-Sn-Cu deposit, Portugal. Chem. Geol. 2017, 468, 1–16. [Google Scholar] [CrossRef]
- Launay, G.; Sizaret, S.; Guillou-Frottier, L.; Gloaguen, E.; Pinto, F. Deciphering fluid flow at the magmatic-hydrothermal transition: A case study from the world-class Panasqueira W–Sn–(Cu) ore deposit (Portugal). Earth Planet. Sci. Lett. 2018, 499, 1–12. [Google Scholar] [CrossRef]
- Carocci, E.; Marignac, C.; Cathelineau, M.; Pinto, F.; Truche, L. Le stade initial du dépôt de la wolframite dans le gisement à W-Sn-Cu de Panasqueira (Portugal): Caractérisation indirecte des fluides par l’étude des tourmalines précoces. In Proceedings of the 24th Réunion des Sciences de la Terre, Lille, France, 22–26 October 2018; p. 439. [Google Scholar]
- Černý, P.; Ercit, T.S. Mineralogy of niobium and tantalum: crystal chemical relationships, paragenetic aspects and their economic implications. In Lanthanides, Tantalum and Niobium; Mӧller, P., Cérný, P., Saupé, F., Eds.; Springer–Verlag: Heidelberg, Germany, 1989; pp. 27–79. [Google Scholar]
- Liu, L.; Xiao, Y.; Aulbach, S.; Li, D.; Hou, Z. Vanadium and niobium behavior in rutile as a function of oxygen fugacity: Evidence from natural samples. Contrib. Mineral. Petrol. 2014, 167, 1025–1077. [Google Scholar] [CrossRef]
- Paterson, B.A.; Stephens, W.E. Kinetically induced compositional zoning in titanite: Implications for accessory-phase/melt partitioning of trace elements. Contrib. Mineral. Petrol. 1992, 109, 373–385. [Google Scholar] [CrossRef]
- Allègre, C.J.; Provost, A.; Jaupart, C. Oscillatory zoning: A pathological case of crystal growth. Nature 1981, 294, 223–228. [Google Scholar] [CrossRef]
- Ortoleva, P.; Merino, E.; Moore, C.; Chadam, J. Geochemical self-organization. I: Reaction-transport feedbacks and modeling approach. Am. J. Sci. 1987, 287, 979–1007. [Google Scholar] [CrossRef]
- L’Heureux, I. Oscillatory zoning in crystal growth: A constitutional undercooling mechanism. Phys. Rev. E 1993, 48, 4460–4469. [Google Scholar] [CrossRef]
- Miura, H.; Tsukamoto, K. Role of Impurity on Growth Hysteresis and Oscillatory Growth of Crystals. Cryst. Growth Des. 2013, 13, 3588–3595. [Google Scholar] [CrossRef]
- Katsev, S.; L’Heureux, I. Autocatalytic model of oscillatory zoning in experimentally grown (Ba,Sr)SO4 solid solution. Phys. Rew. E 2002, 66. [Google Scholar] [CrossRef]
- Wang, Y.; Merino, E. Dynamic model of oscillatory zoning of trace elements in calcite: Double layer, inhibition, and self-organization. Geochim. Cosmochim. Acta 1992, 56, 587–596. [Google Scholar] [CrossRef]
- Barker, S.L.L.; Cox, S.F. Oscillatory zoning and trace element incorporation in hydrothermal. minerals: Insights from calcite growth experiments. Geofluids 2011, 11, 48–56. [Google Scholar] [CrossRef]
- Guskov, S.S.; Faddeev, M.A.; Chuprunov, E.V. Concentration oscillations at doped crystal growth from solutions. Crystallogr. Rep. 2010, 55, 626–631. [Google Scholar] [CrossRef]
- Shkutenberg, A.G.; Punin, Y.O. Micromorphological instability of a growing face as a source of oscillatory zoning in crystals. Mineral. Mag. 2011, 75, 169–183. [Google Scholar]
- Ginibre, C.; Wörner, G.; Kronz, A. Minor and trace element zoning in plagioclase: Implications for magma chamber processes at Parinacota Volcano, N. Chile. Contrib. Mineral. Petrol. 2002, 143, 300–315. [Google Scholar] [CrossRef]
- Ginibre, C.; Kronz, A.; Wörner, G. High-resolution quantitative imaging of plagioclase composition using accumulated back-scattered electron image: New constraints on oscillatory zoning. Contrib. Mineral. Petrol. 2002, 142, 436–448. [Google Scholar] [CrossRef]
- Green, T.H.; Pearson, N.J. T-rich accessory phase saturation in hydrous mafic-felsic compositions at high P, T. Chem. Geol. 1986, 54, 185–201. [Google Scholar] [CrossRef]
- Laudise, R.A.; Kolb, E.D.; Caporaso, A.J. Hydrothermal growth of large sound crystals of zinc oxide. J. Am. Ceram. Soc. 1964, 47. [Google Scholar] [CrossRef]
- Kolb, E.D.; Grenier, J.-C.; Laudise, R.A. Solubility and growth of AlPO4 in a hydrothermal solvent: HCl. J. Cryst. Growth 1981, 51, 178–182. [Google Scholar] [CrossRef]
- Hosaka, M.; Taki, S. Hydrothermal growth of quartz crystals at low fillings in NaCl and KCl solutions. J. Cryst. Growth 1986, 78, 413–417. [Google Scholar] [CrossRef]
- Lander, R.H.; Larese, R.E.; Bonnell, L.M. Toward more accurate quartz cement models: The importance of euhedral versus noneuhedral growth rates. AAPG Bullet. 2008, 92, 1537–1563. [Google Scholar] [CrossRef]
- Nielsen, A.E.; Toft, J.M. Electrolyte crystal growth kinetics. J. Cryst. Growth 1984, 67, 278–288. [Google Scholar] [CrossRef]
- Kralj, D.; Brecevic, L.; Nielsen, A.E. Vaterite growth and dissolution in aqueous solution I. Kinetics of crystal growth. J. Cryst. Growth 1990, 104, 793–800. [Google Scholar] [CrossRef]
- Yanagisawa, K.; Feng, Q.; Ioku, N.; Yamasaki, N. Hydrothermal single crystal growth of calcite in ammonium acetate solution. J. Cryst. Growth 1996, 163, 285–294. [Google Scholar] [CrossRef]
- Tai, C.Y.; Chien, W.-C.; Chen, C.-Y. Crystal growth kinetics of calcite in a dense fluidized-bed crystallizer. AIChE J. 1999, 45, 1605–1614. [Google Scholar] [CrossRef]
- Teng, H.H.; Dove, P.M.; De Yoreo, J.J. Kinetics of calcite growth: Surface processes and relationships to macroscopic rate laws. Geochim. Cosmochim. Acta 2000, 64, 2255–2266. [Google Scholar] [CrossRef]
- Charmoille, A. Traçage hydrochimique des interactions hydrauliques et mécaniques entre les volumes perméables et peu perméables au sein des aquifères fracturés carbonatés: Aquifère karstique de Fourbanne (Avant-pays jurassien, 25), Laboratoire naturel de Coaraze (Alpes Méridionales, 06). Ph.D. Thesis, Besançon University, Besançon, France, 2005; 271p. [Google Scholar]
- Charmoille, A.; Fabbri, O.; Mudry, J.; Guglielmi, Y.; Bertrand, C. Post-seismic permeability change in a shallow fractured aquifer following a ML 5.1 earthquake (Fourbanne karst aquifer, Jura outermost thrust unit, eastern France). Geophy.s Res. Lett. 2005, 32, LA8406. [Google Scholar] [CrossRef]
- Borg, S.; Liu, W.; Pearce, M.; Cleverley, J.; MacRae, C. Complex mineral zoning patterns caused by ultra-local equilibrium at reaction interfaces. Geology 2014, 42, 415–418. [Google Scholar] [CrossRef] [Green Version]


| Qcs Veinlet | Wall Rock | ||||||||||
| Crystal | A | A | A | A | A | B | C | D | E | F | G |
| Face | Pa | Pb | πa | πb | πb | Pa | Pb | πa | πa | πb | πb |
| W | 0.99 | 1.75 | 3.92 | 5.01 | 9.13 | 0.33 | 1.64 | 2.59 | 4.37 | 5.97 | 6.37 |
| Sn | 0.51 | 0.62 | 0.75 | 0.45 | 0.71 | 0.67 | 0.75 | 0.84 | 0.95 | 1.66 | 0.79 |
| Nb | 1.24 | 0.16 | 0.21 | 0.26 | 0.22 | 0.23 | 0.12 | 0.16 | 0.21 | 1.48 | bdl |
| Ta | 0.15 | 0.34 | 0.15 | 0.15 | 0.15 | 0.43 | 0.36 | 0.32 | 0.15 | 0.58 | 0.33 |
| Cr | bdl | bdl | 0.27 | 0.15 | 1.39 | bdl | 0.18 | bdl | 1.56 | bdl | bdl |
| V | 0.58 | 0.5 | 0.96 | 0.74 | 0.66 | 0.19 | 0.67 | 0.56 | 0.55 | 0.60 | 0.56 |
| Fe | 0.59 | 0.58 | 0.96 | 1.29 | 1.40 | 0.42 | 0.36 | 0.95 | 0.20 | 2.05 | 1.91 |
| Ti | 56.22 | 57.28 | 54.11 | 53.46 | 50.08 | 58.24 | 57.09 | 55.75 | 53.28 | 50.72 | 51.85 |
| O | 39.28 | 39.68 | 38.79 | 38.5 | 37.92 | 39.70 | 39.67 | 39.13 | 38.39 | 38.00 | 37.85 |
| ∑ | 99.65 | 100.91 | 100.12 | 100.01 | 101.66 | 100.21 | 100.84 | 100.30 | 99.80 | 101.06 | 99.67 |
| Base 3 Cations | |||||||||||
| W | 0.013 | 0.023 | 0.053 | 0.069 | 0.127 | 0.004 | 0.022 | 0.035 | 0.060 | 0.083 | 0.089 |
| Sn | 0.011 | 0.013 | 0.016 | 0.010 | 0.015 | 0.014 | 0.015 | 0.017 | 0.020 | 0.036 | 0.017 |
| Nb | 0.033 | 0.004 | 0.006 | 0.007 | 0.006 | 0.006 | 0.003 | 0.004 | 0.006 | 0.41 | |
| Ta | 0.003 | 0.005 | 0.002 | 0.003 | 0.002 | 0.006 | 0.005 | 0.004 | 0.003 | 0.008 | 0.005 |
| Cr | 0.013 | 0.007 | 0.069 | 0.008 | 0.000 | 0.075 | |||||
| V | 0.028 | 0.024 | 0.047 | 0.037 | 0.033 | 0.009 | 0.032 | 0.027 | 0.027 | 0.030 | 0.028 |
| Fe | 0.026 | 0.025 | 0.043 | 0.058 | 0.064 | 0.018 | 0.016 | 0.042 | 0.009 | 0.094 | 0.088 |
| Ti | 2.882 | 2.906 | 2.820 | 2.810 | 2.683 | 2.943 | 2.899 | 2.870 | 2.799 | 2.708 | 2.773 |
| O | 6.025 | 6.023 | 6.049 | 6.054 | 6.078 | 6.002 | 6.026 | 6.027 | 6.035 | 6.071 | 6.057 |
| Nb + Ta | 0.04 | 0.01 | 0.01 | 0.02 | 0.01 | 0.01 | 0.01 | 0.01 | 0.01 | 0.05 | 0.01 |
| Nb# | 0.92 | 0.43 | 0.72 | 0.74 | 0.75 | 0.51 | 0.39 | 0.49 | 0.630 | 0.83 | 0 |
© 2018 by the authors. Licensee MDPI, Basel, Switzerland. This article is an open access article distributed under the terms and conditions of the Creative Commons Attribution (CC BY) license (http://creativecommons.org/licenses/by/4.0/).
Share and Cite
Carocci, E.; Marignac, C.; Cathelineau, M.; Truche, L.; Lecomte, A.; Pinto, F. Rutile from Panasqueira (Central Portugal): An Excellent Pathfinder for Wolframite Deposition. Minerals 2019, 9, 9. https://doi.org/10.3390/min9010009
Carocci E, Marignac C, Cathelineau M, Truche L, Lecomte A, Pinto F. Rutile from Panasqueira (Central Portugal): An Excellent Pathfinder for Wolframite Deposition. Minerals. 2019; 9(1):9. https://doi.org/10.3390/min9010009
Chicago/Turabian StyleCarocci, Eleonora, Christian Marignac, Michel Cathelineau, Laurent Truche, Andreï Lecomte, and Filipe Pinto. 2019. "Rutile from Panasqueira (Central Portugal): An Excellent Pathfinder for Wolframite Deposition" Minerals 9, no. 1: 9. https://doi.org/10.3390/min9010009
APA StyleCarocci, E., Marignac, C., Cathelineau, M., Truche, L., Lecomte, A., & Pinto, F. (2019). Rutile from Panasqueira (Central Portugal): An Excellent Pathfinder for Wolframite Deposition. Minerals, 9(1), 9. https://doi.org/10.3390/min9010009