Article

Geology, Apatite Geochronology, and Geochemistry of the Ernest Henry Inter-lens: Implications for a Re-Examined Deposit Model

1
Academics with Exploration, Studies of Mount Isa and the Eastern Succession (A.W.E.S.O.M.E.S), Department of Earth Sciences, The University of Adelaide, Adelaide SA 5005, Australia
2
Centre for Tectonics, Resources and Exploration (TRaX), Department of Earth Sciences, School of Physical Sciences, The University of Adelaide, Adelaide SA 5005, Australia
*
Author to whom correspondence should be addressed.
Minerals 2018, 8(9), 405; https://doi.org/10.3390/min8090405
Submission received: 2 July 2018 / Revised: 10 September 2018 / Accepted: 11 September 2018 / Published: 13 September 2018
(This article belongs to the Special Issue Apatite and Ore Deposits)

Abstract

:
The Ernest Henry Iron-Oxide-Copper-Gold deposit is the largest known Cu-Au deposit in the Eastern Succession of the Proterozoic Mount Isa Inlier, NW Queensland. Cu-Au mineralization is hosted in a K-feldspar altered breccia, bounded by two major pre-mineralization shear zones. Previous research suggests that Cu-Au mineralization and the ore-bearing breccia formed simultaneously through an eruption style explosive/implosive event, facilitated by the mixing of fluids at ~1530 Ma. However, the preservation of a highly deformed, weakly mineralized, pre-mineralization feature (termed the Inter-lens) within the orebody indicates that this model must be re-examined. The paragenesis of the Inter-lens is broadly consistent with previous studies on the deposit, and consists of albitization; an apatite-calcite-quartz-garnet assemblage; biotite-magnetite ± garnet alteration; K-feldspar ± hornblende alteration; Cu-Au mineralization and post-mineralization alteration and veining. Apatite from the paragenetically early apatite-calcite-quartz-garnet assemblage produce U–Pb ages of 1584 ± 22 Ma and 1587 ± 22 Ma, suggesting that the formation of apatite, and the maximum age of the Inter-lens is synchronous with D2 deformation of the Isan Orogeny and regional peak-metamorphic conditions. Apatite rare earth element-depletion trends display: (1) a depletion in rare earth elements evenly, corresponding with an enrichment in arsenic and (2) a selective light rare earth element depletion. Exposure to an acidic NaCl and/or CaCl2-rich sedimentary-derived fluid is responsible for the selective light rare earth element-depletion trend, while the exposure to a neutral to alkaline S, Na-, and/or Ca-rich magmatic fluid resulted in the depletion of rare earth elements in apatite evenly, while producing an enrichment in arsenic. We suggest the deposit experienced at least two hydrothermal events, with the first event related to peak-metamorphism (~1585 Ma) and a subsequent event related to the emplacement of the nearby (~1530 Ma) Williams–Naraku Batholiths. Brecciation resulted from competency contrasts between ductile metasedimentary rocks of the Inter-lens and surrounding shear zones against the brittle metavolcanic rocks that comprise the ore-bearing breccia, providing permeable pathways for the subsequent ore-bearing fluids.

Graphical Abstract

1. Introduction

The Ernest Henry Iron-Oxide-Copper-Gold (IOCG) deposit is situated ~35 km NE of Cloncurry (−20.70°, 140.51°), NW Queensland (Figure 1) and represents the largest known IOCG deposit in the Proterozoic Eastern Succession of the Mount Isa Inlier. The deposit is covered by 30–60 m of Mesozoic to Cainozoic sediments, and was discovered by drilling a significant magnetic geophysical anomaly in 1992 [1]. A pre-mining resource of 166 Mt at 1.1% Cu, 0.54 g/t Au was mined as open pit between 1996 to 2013, until transitioning into a sublevel cave operation with 87.1 Mt at 1.18% Cu, 0.60 g/t Au as of December 2015 [1]. Cu-mineralization occurs as chalcopyrite, and Au occurs as native gold with minor electrum [2]. Economic mineralization is hosted in a pipe-like geometry, bound by the hangingwall shear zone (HWSZ) and the footwall shear zone (FWSZ) (Figure 2) [3]. Alteration associated with the deposit is grouped into five broad stages: regional sodic-calcic alteration, pre-ore (K-Mn-Fe-rich) alteration, K-feldspar alteration, Cu-Au mineralization and post-mineralization alteration and veining [4]. Previous research suggests that the mixing of basinal and magmatic fluids caused fluid over-pressurization, resulting in a violent eruption that formed the ore-bearing breccia, multiple stages of hydrothermal alteration, and the precipitation of Cu-Au mineralization [5,6].
The transition from open-pit to underground mining in 2014, and the continued development of underground infrastructure has highlighted geological features that have previously been overlooked in ore genesis research, partly because their relative depth in the ore system prevented systematic sampling and observation. The Inter-lens is a weakly mineralized, highly deformed, pre-mineralization feature that separates the orebody into two distinct lenses at depth. This structure was discovered during the initial resource drilling in the early 1990s, but its significance to ore genesis has only recently been investigated. The well-preserved Inter-lens, and its pre-mineralization timing requires the ‘explosive eruption’ model to be re-examined.
Apatite-rich veins and lithologies are a common feature of the Inter-lens, and are associated with a paragenetically early, pre-ore mineral assemblage of apatite-calcite-quartz-garnet. Apatite has been dated using the U–Pb laser-ablation inductively coupled plasma-mass spectrometry (LA-ICP-MS) method in magnetite-apatite deposits [8], IOCG deposits [9], and is often applied in tectonic studies as a medium temperature thermochronometer with a closure temperature of 350–550 °C [10,11,12,13,14]. Constraining the age of apatite from apatite-rich veins and lithologies will allow the maximum age of the Inter-lens, and subsequently the age of the paragenetically early apatite-calcite-quartz-garnet stage to be constrained.
The rare earth element (REE) composition of apatite can be used to provide information regarding the characteristics of fluids responsible for metasomatism [15,16,17,18]. Therefore, by analyzing metasomatized regions of apatite from the paragenetically early apatite-rich lithologies, the characteristics of subsequent fluid phases can be determined.
The primary aims of this study are to: (1) investigate the paragenesis and mineralogy of the Inter-lens; (2) constrain the age of apatite from pre-mineralization, apatite-rich assemblages; and (3) analyze the trace element geochemistry in regions of altered apatite. Evidence from this study, coupled with evidence from previous work, will assist in the production of an updated ore deposit model that considers the age and the preservation of the Inter-lens within the ore-bearing breccia.

2. Geological Background

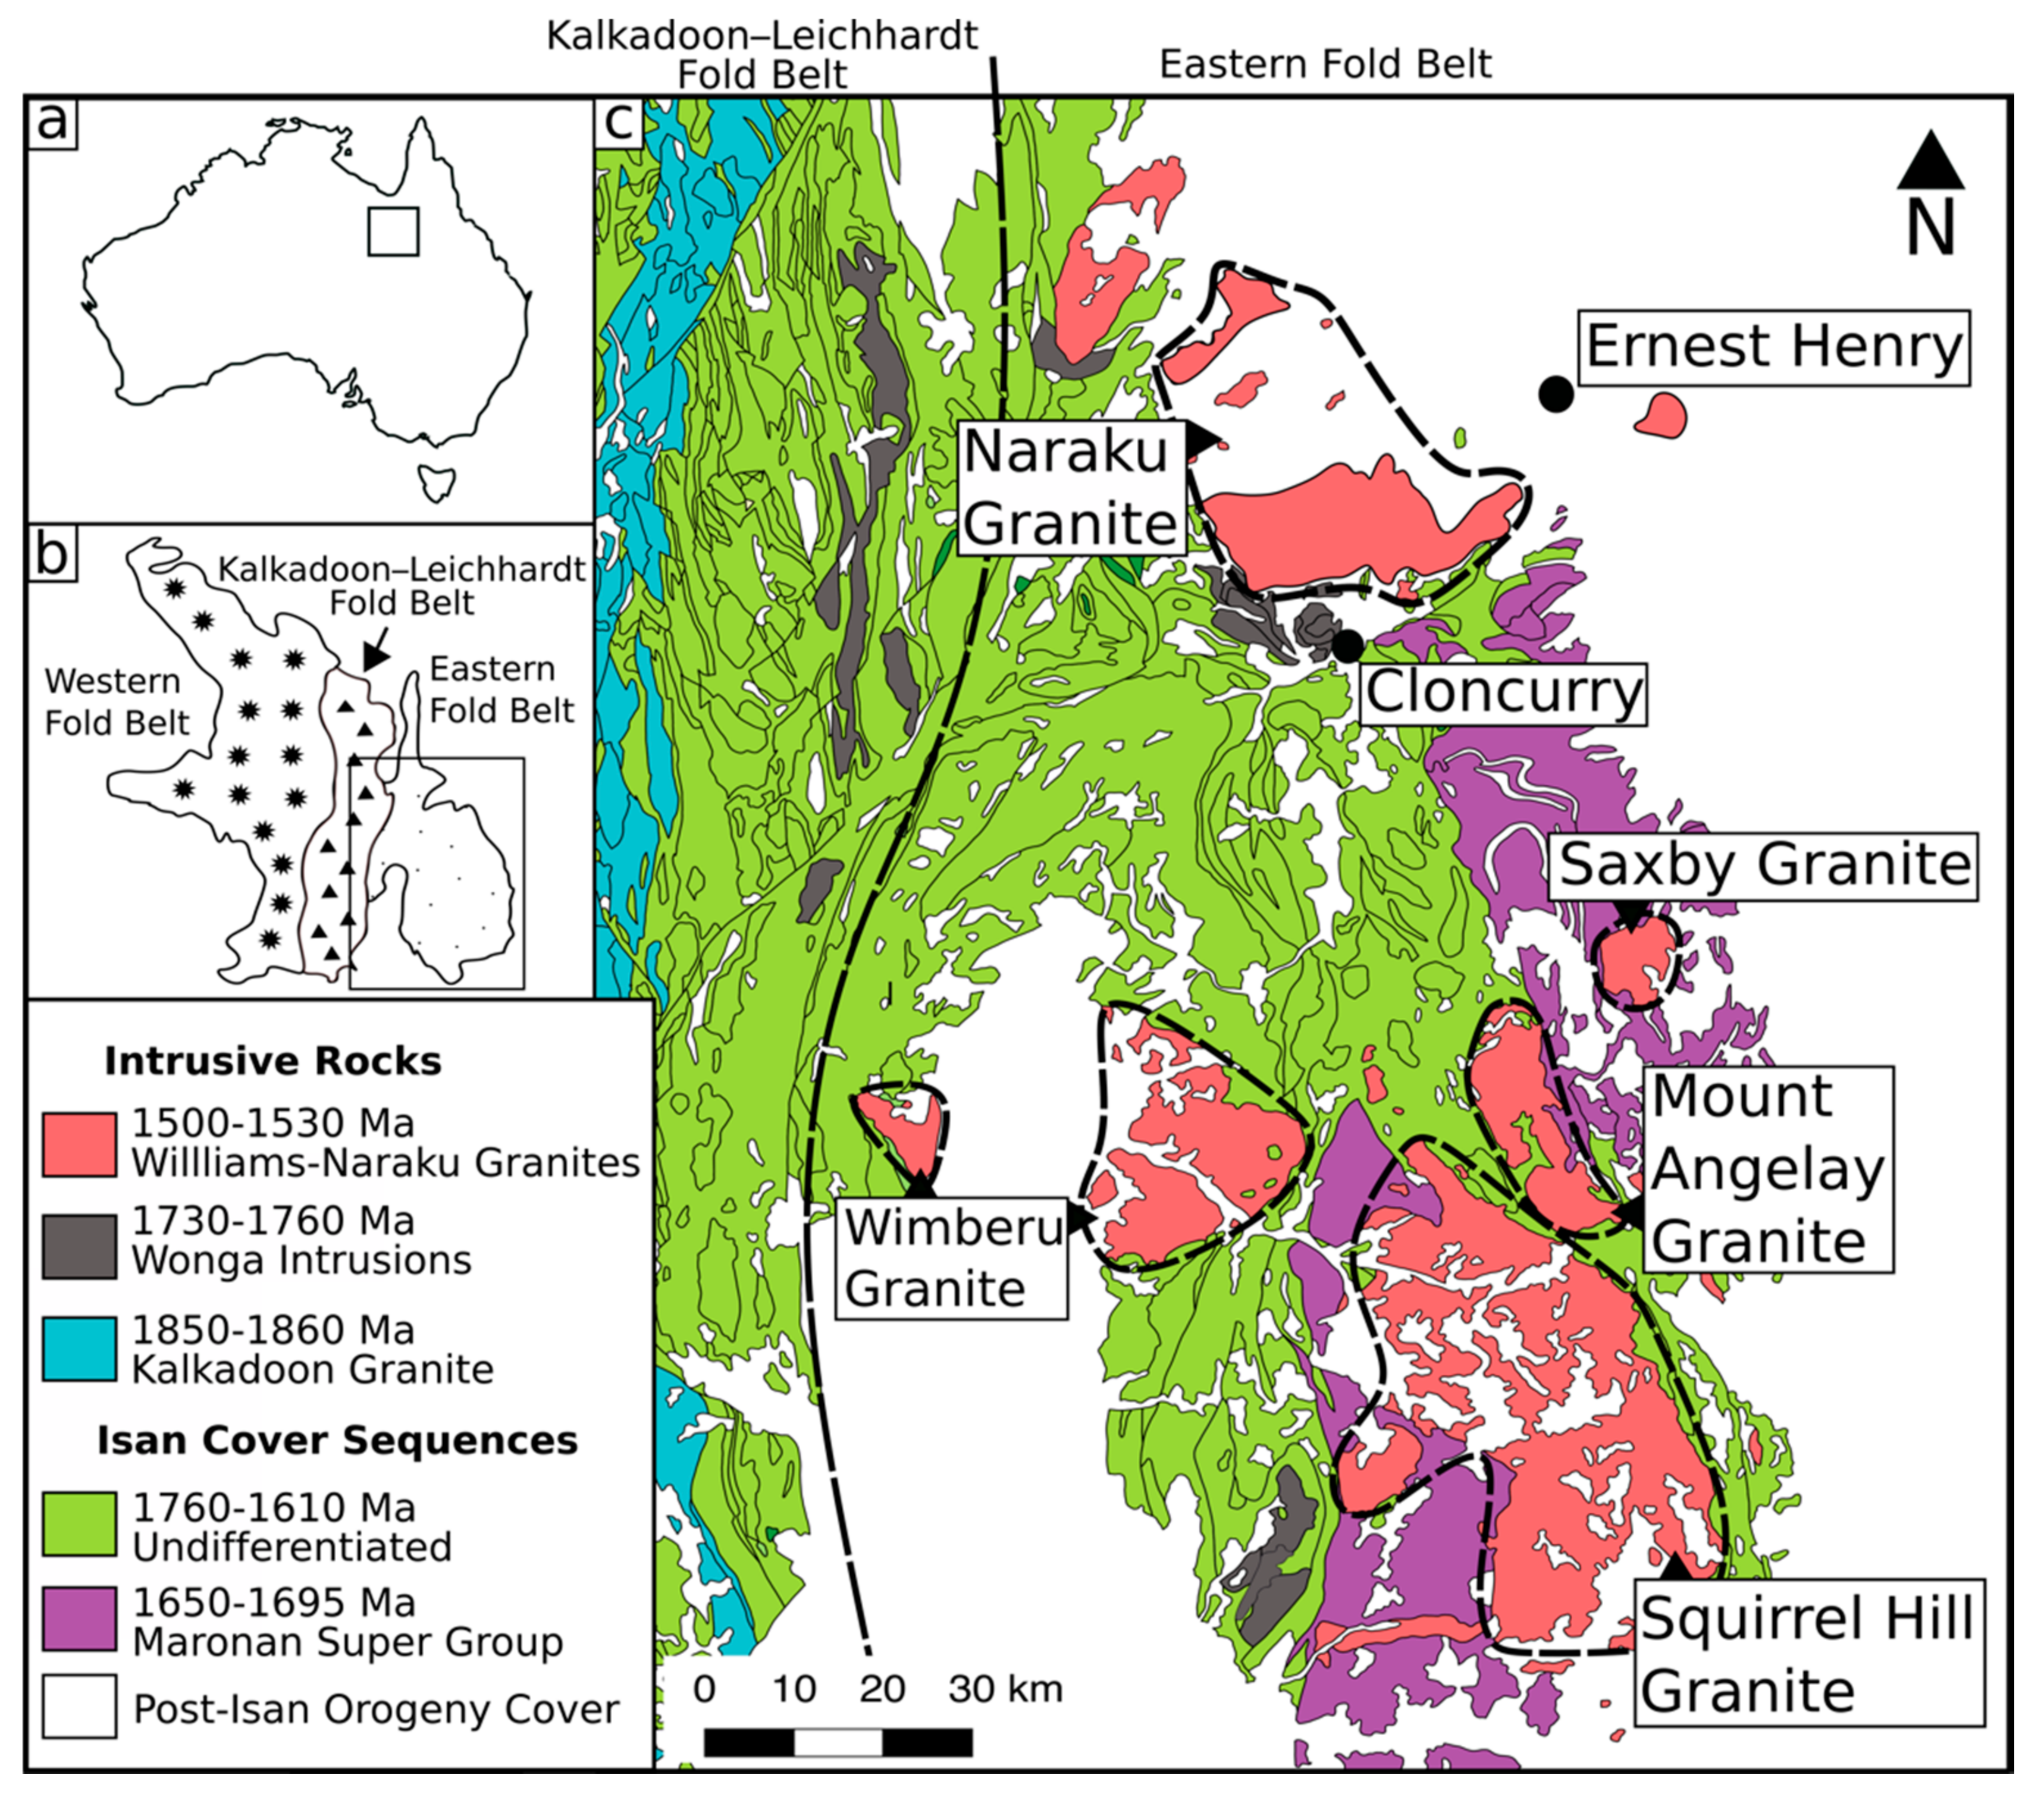
2.1. Regional Geology

Ernest Henry is located in the Eastern Fold Belt of the Proterozoic Mount Isa Inlier, NW Queensland (Figure 1). Regional stratigraphy is divided into four major sequences: basement rocks, Cover Sequence 1, Cover Sequence 2, and Cover Sequence 3. The majority of Cu-Au mineralization occurs in Cover Sequences 2 and 3 [19]. The Williams–Naraku Batholiths intrudes these cover sequences, and consist of several I- and A-type granite plutons emplaced from 1550–1490 Ma [20,21,22]. The Isan Orogeny involved the shortening of a complex rift system from ~1650 to 1500 Ma, and broadly consisted of three deformation events (D1, D2, and D3) [23,24]. D1 is poorly understood, and is thought to be associated with E–W trending folds as a result of N–S shortening [24,25]. Ages that record this direction of shortening range from 1649 ± 12 Ma (U–Pb monazite) [26] to 1610 ± 13 Ma (U–Pb zircon) [27]. D2 consisted of a W–E shortening event, resulting in the dominant N–S grain of the Mount Isa Inlier. Evidence for shortening in this direction has been dated at 1591 ± 10 Ma (U–Pb monazite), correlating with regional peak amphibolite to granulite metamorphic conditions from 1580–1600 Ma [22,24,26]. D3 consisted of a W–E transpressional event with a minimum age of 1530 ± 8 Ma (U–Pb zircon) [22], resulting in the reactivation of D2 faults and N–NE upright folding. D3 deformation is synchronous with the emplacement of the Williams–Naraku Batholiths and the formation of various Cu-Au deposits [24,28]. It is generally accepted that more than three deformation events occurred during the Isan orogeny. For example, Coward [29] suggested four separate deformation events have affected the Ernest Henry deposit, with a post-D3 deformation event resulting in late brittle faulting. These late deformation events are often localized, and cannot be inferred across the entire Eastern Fold Belt of the Mount Isa Inlier.

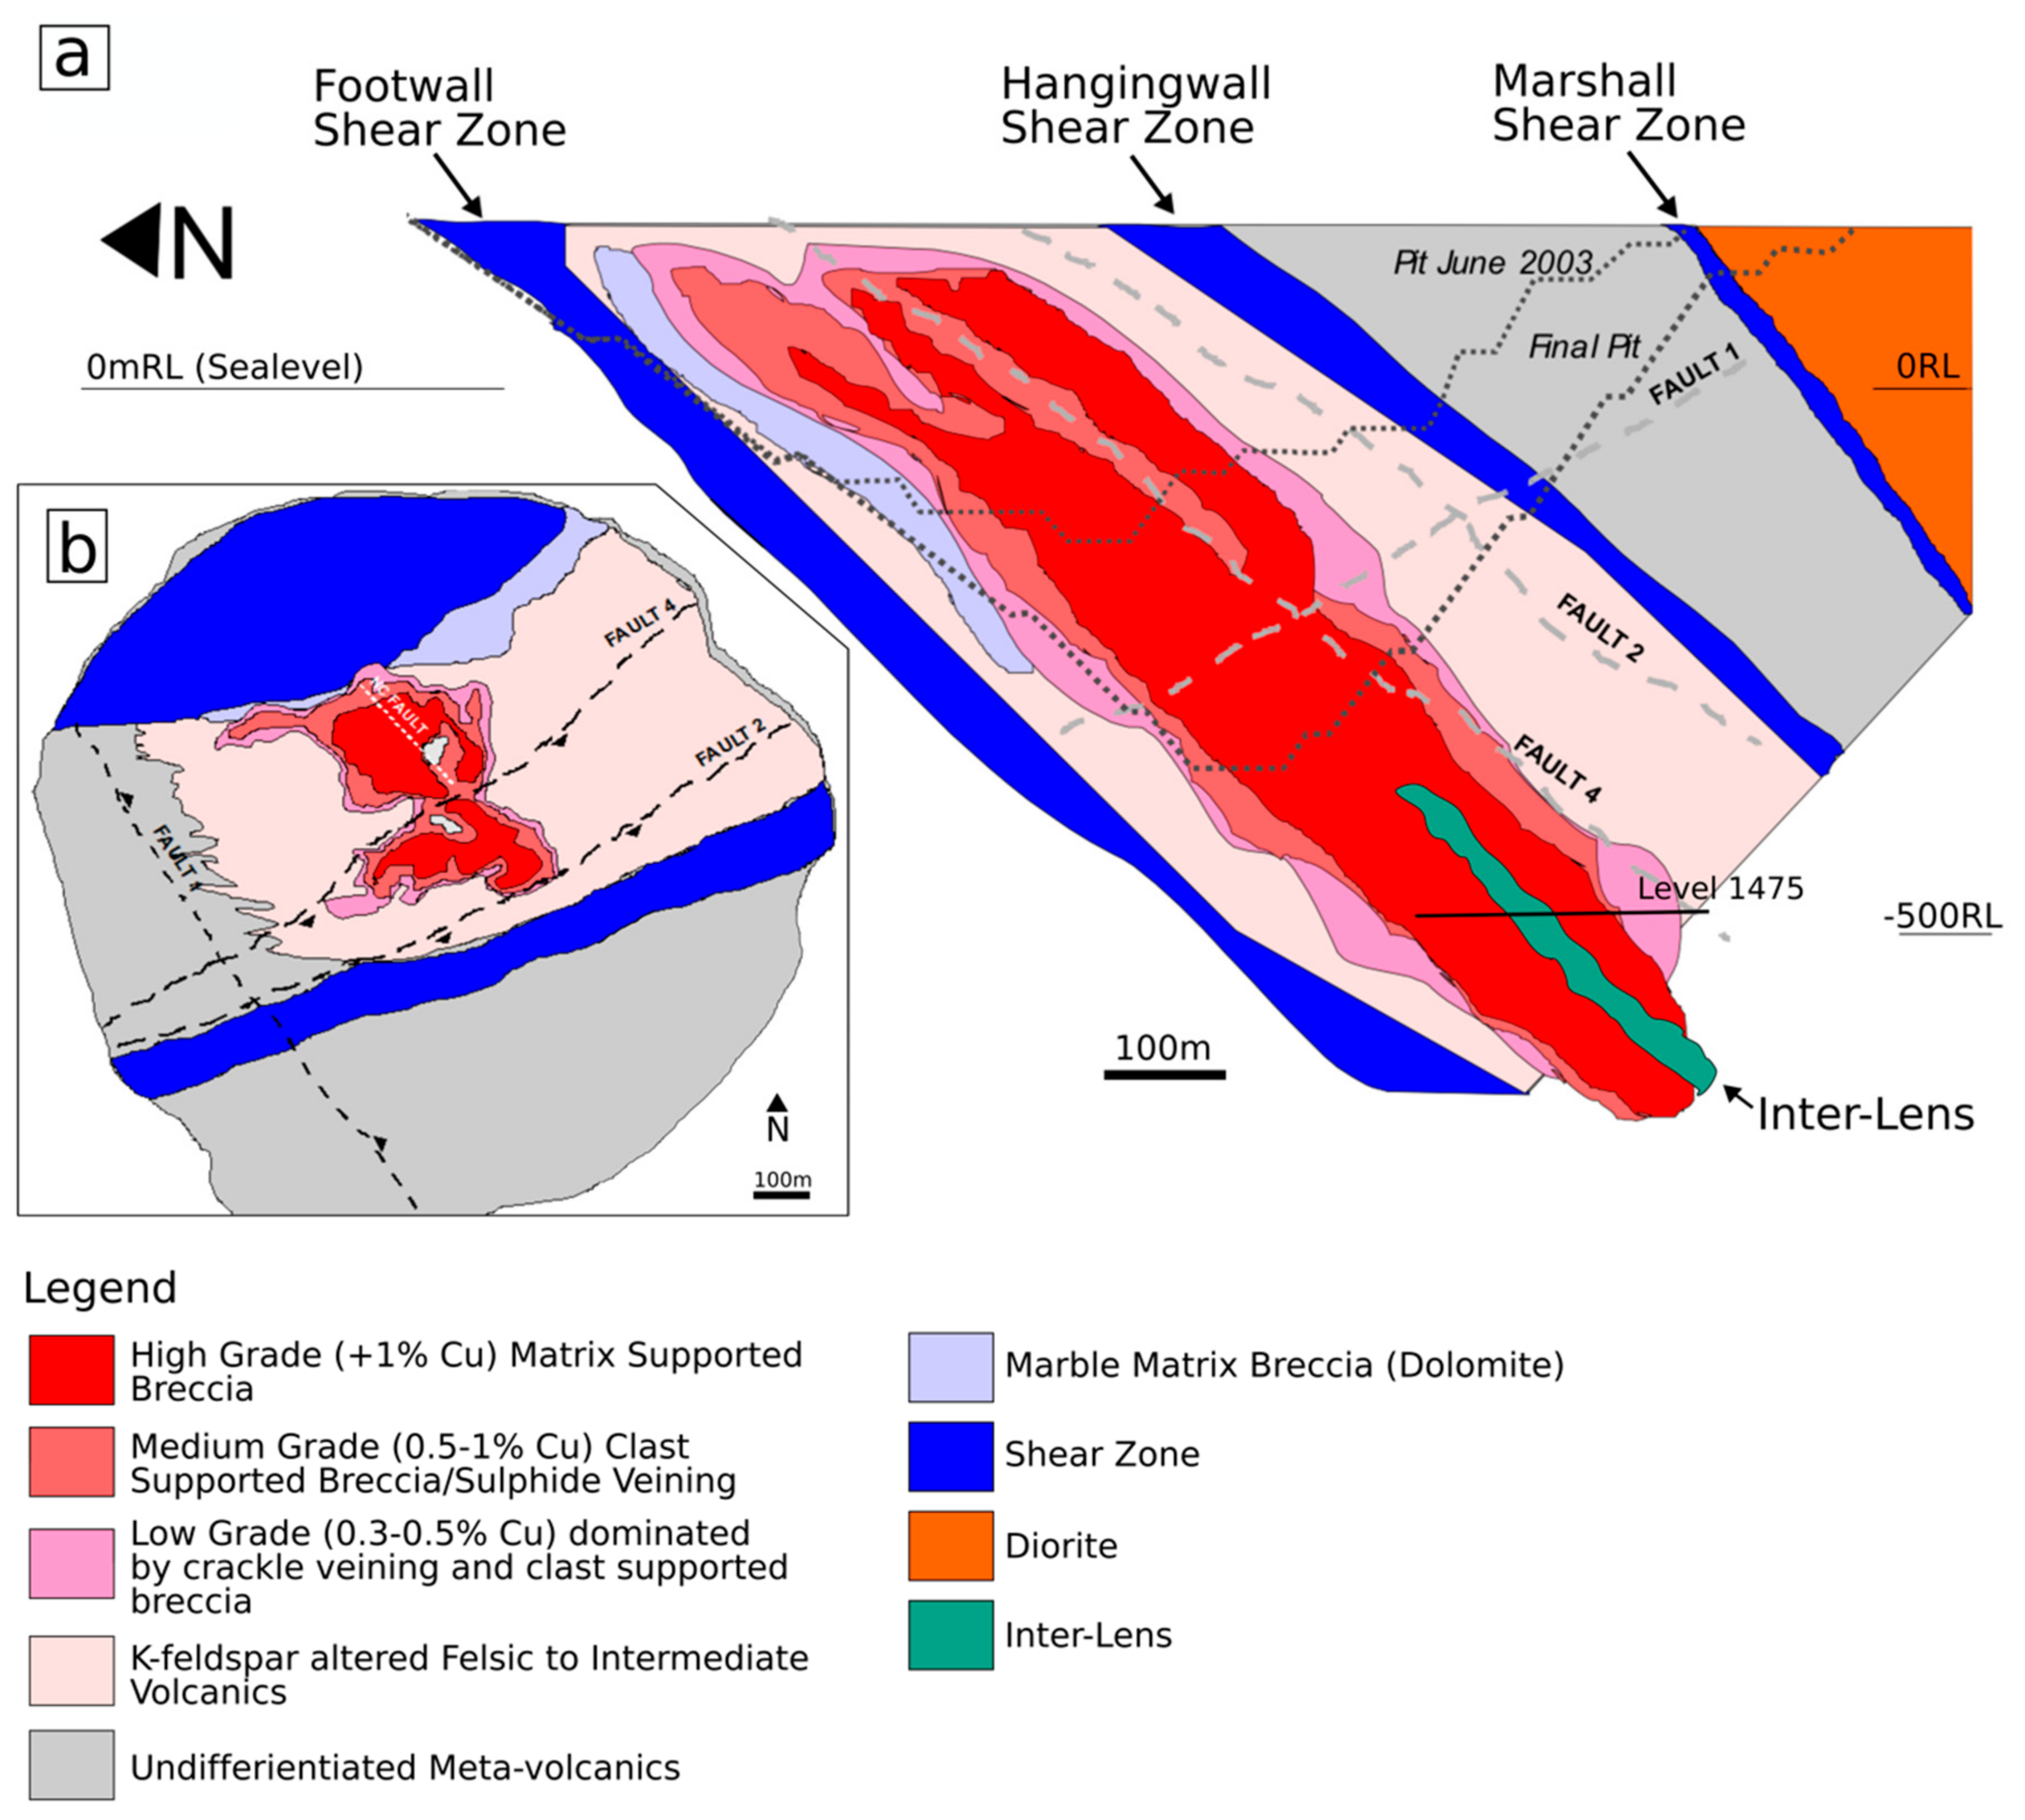
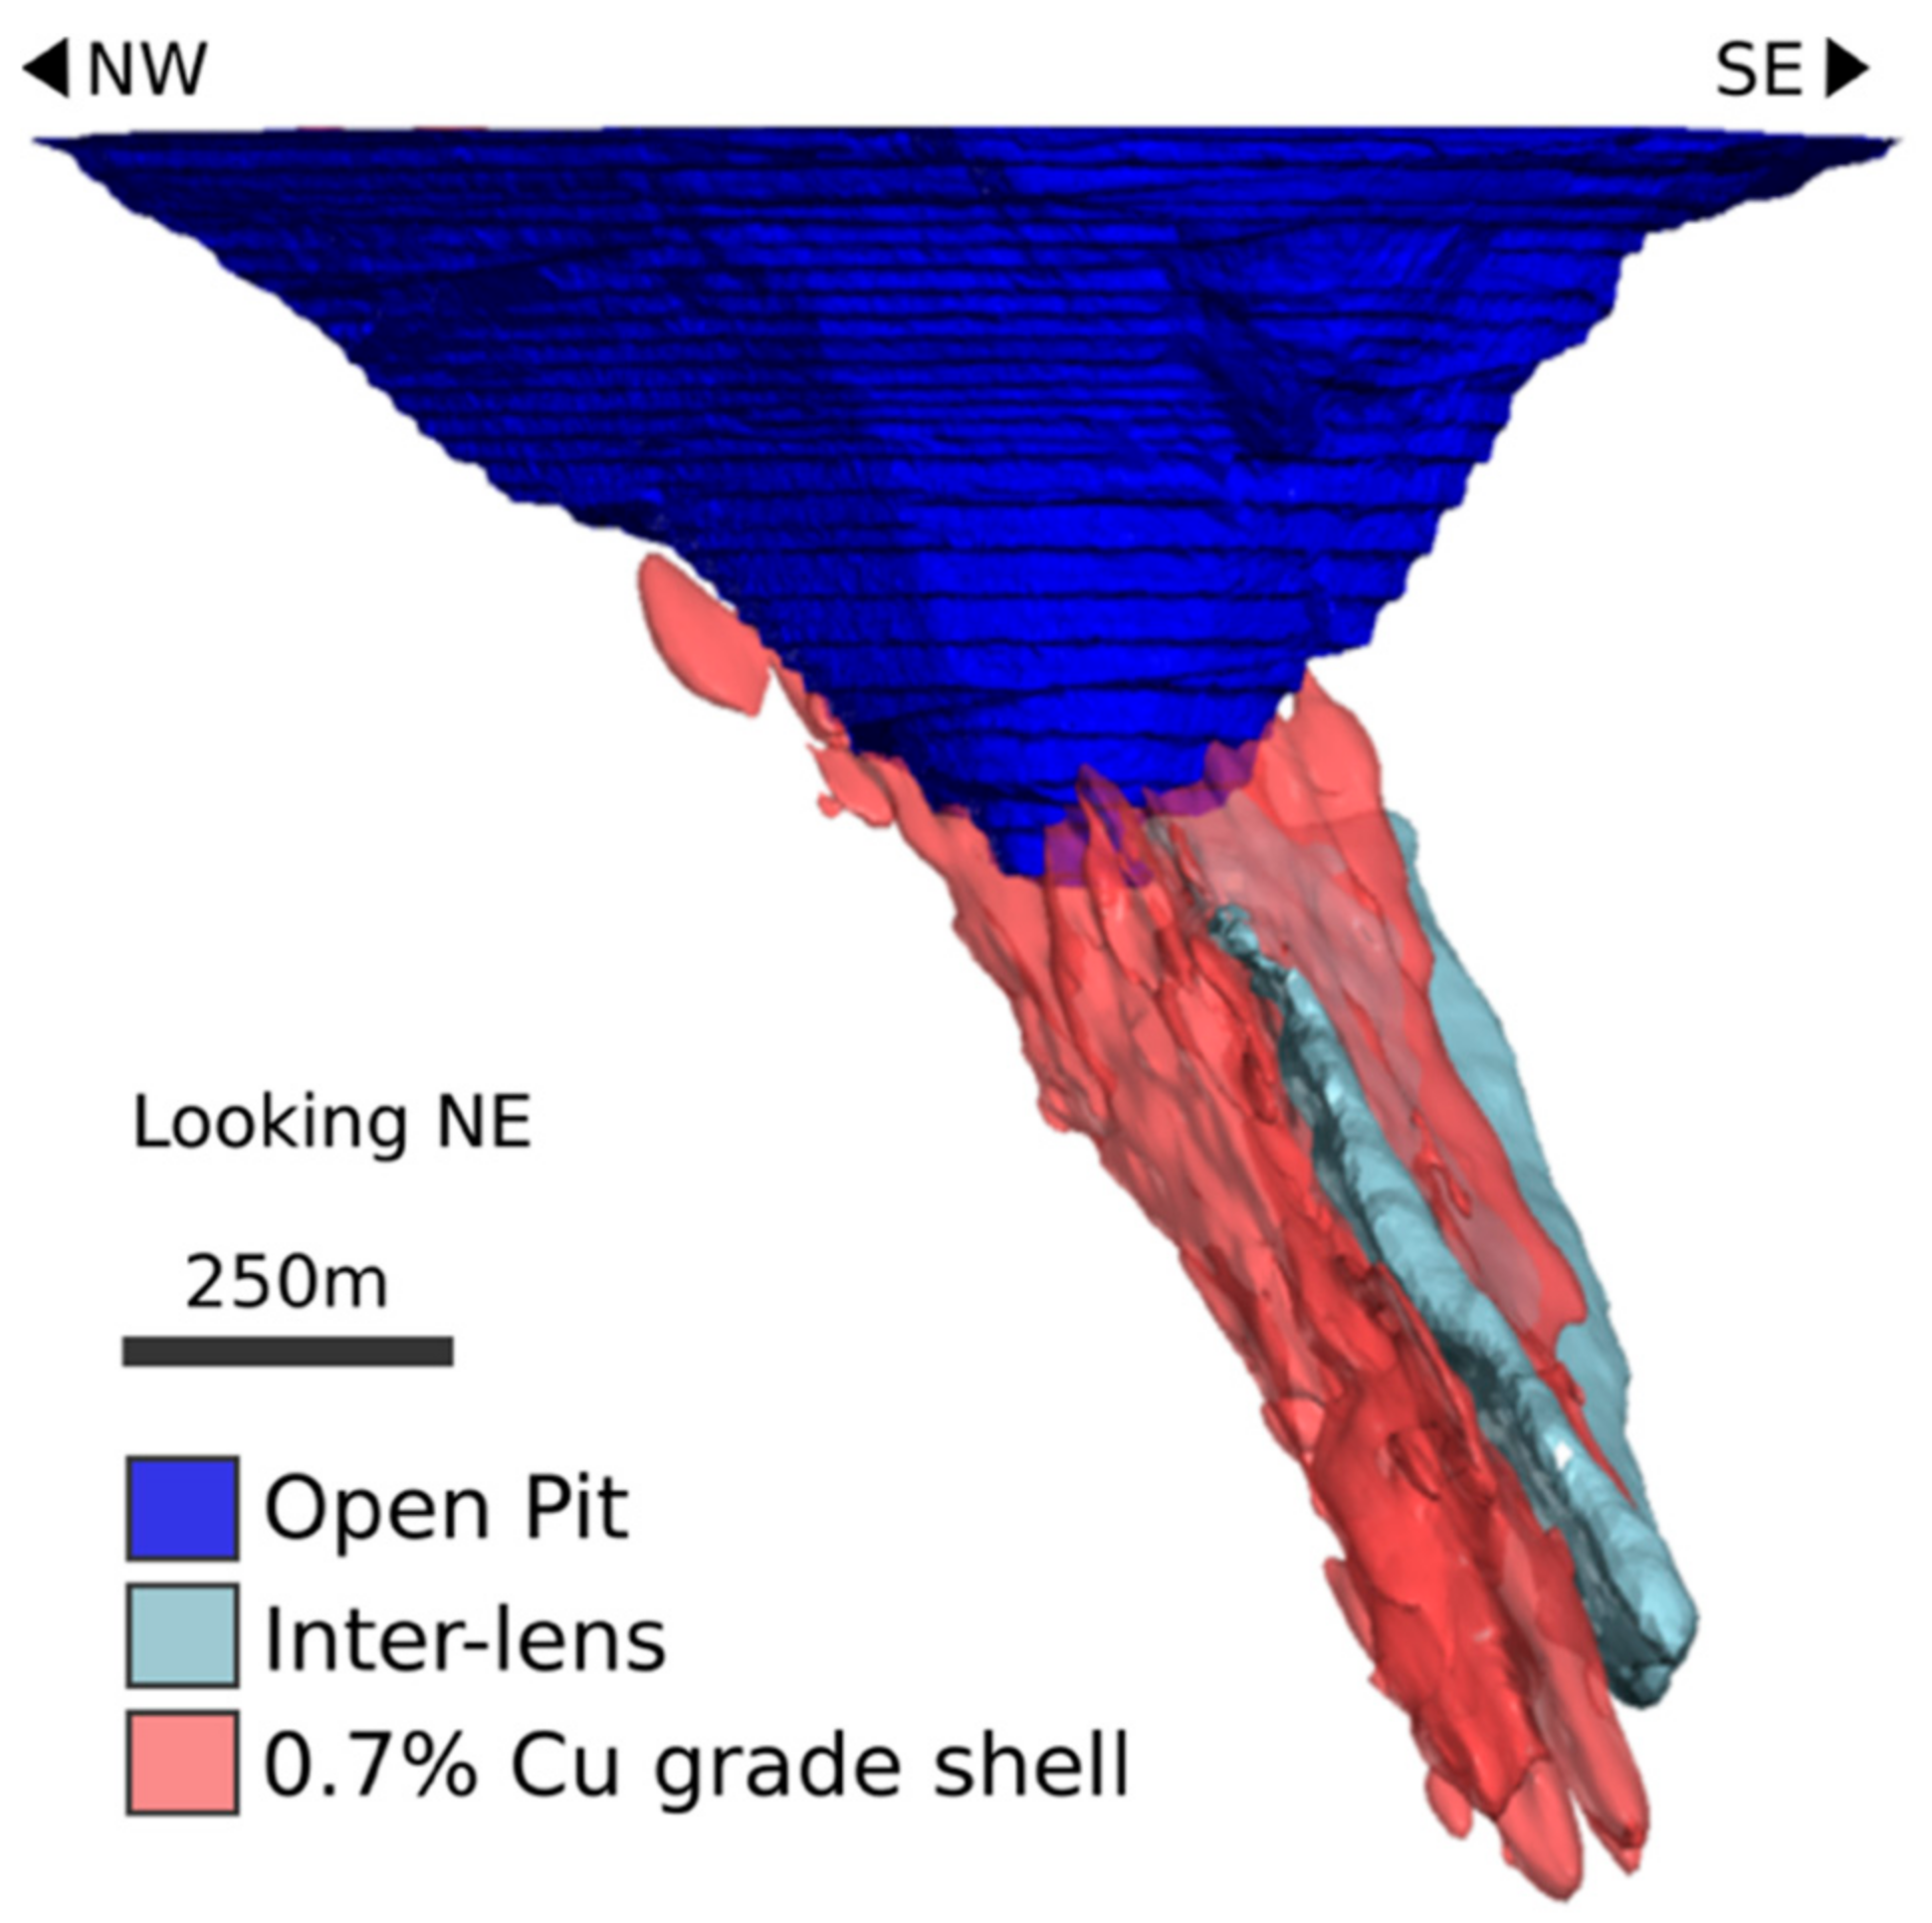
2.2. Deposit Geology

The Ernest Henry orebody is hosted in metaandesite rocks, interpreted as the temporal equivalent of the Mount Fort Constantine metavolcanics (~1745 Ma [22]). This unit is primarily composed of euhedral plagioclase phenocrysts (45%–85%) set in a fine-grained groundmass of biotite (5%–30%), magnetite (5%–20%), and quartz (>5%), with minor apatite, K-feldspar, and amphibole [3,4]. A variety of porphyritic, glomeroporphyritic, seriate, and non-porphyritic igneous textures are preserved in this unit [4]. The metaandesite is intercalated with multiple metasedimentary units consisting of biotite and muscovite-rich schists, banded scapolitic calc-silicate rocks, biotite and muscovite-rich psammite, and graphitic schists [4].
The orebody consists of a structurally controlled breccia in a pipe-like geometry, bound by the HWSZ and FWSZ that dip ~45° southeast (Figure 2) [3]. A third shear zone termed the Marshall Shear Zone (MSZ) is also present ~400 m south of the deposit, and possess a lithology comparable to the HWSZ and FWSZ [3]. These shear zones are associated with a kilometer-scale duplex that formed during D2 deformation, with the orebody sitting in a pronounced flexture of these zones [30].
The alteration and paragenesis of the Ernest Henry deposit has been documented by previous workers [3,4,31] and consists of early sodic-calcic alteration overprinted by pre-ore (K-Mn-Fe-rich) alteration, K-feldspar alteration, Cu-Au mineralization, and post-mineralization alteration and veining.
Regional sodic-calcic alteration involved intense albitization of the metavolcanic and metasedimentary host rocks surrounding the lease of the deposit, resulting in a homogenous, fine-grained albite-rich rock [31]. This is consistent with the regional scale sodic-calcic alteration event that occurred throughout the Eastern Succession as a result of hot brines (400–500 °C) flowing through faults, veins, and lithological contacts [31,32]. Sodic-calcic alteration is also associated with the formation of a fine- to coarse-grained magnetite, apatite, actinolite, calcite, and quartz assemblage that is preserved in the major shear zones of the deposit [4].
Pre-ore (K-Mn-Fe-rich) alteration overprints earlier sodic-calcic alteration and produces a highly foliated fine- to medium-grained biotite and magnetite-rich assemblage with rare fine- to medium-grained K-feldspar [4]. Coarse-grained Mn-rich garnet is also associated with this alteration stage, occurring in veins and as hydrothermal replacement [4]. The intensity of pre-ore (K-Mn-Fe-rich) alteration varies from high in the metasedimentary rocks of the shear zones to relatively low in the host metavolcanic units.
K-feldspar alteration overprints earlier sodic-calcic and pre-ore (K-Mn-Fe-rich) alteration, and involves the alteration of pre-existing albite to K-feldspar [3]. In this stage, biotite is also replaced by chlorite and sericite [3]. K-feldspar alteration is localized between the HWSZ and FWSZ, extending >1 km away from the deposit [4]. This alteration stage is most intense within areas hosting Cu-Au mineralization, and therefore a temporal relationship is often implied.
Cu-Au mineralization occurs as hydrothermal infill around K-feldspar altered breccia clasts with medium- to coarse-grained magnetite and calcite producing the dominant matrix [3]. The ore-stage mineralogy consists of medium- to coarse-grained magnetite, calcite, pyrite, and quartz with minor, coarse- to fine-grained biotite, specular hematite, K-feldspar, barite, fluorite, and fine-grained apatite [3,4]. Au is present as native gold and electrum, with Cu present as chalcopyrite [2,3]. In some instances, replacement textures are exhibited and given by the replacement of K-feldspar altered clasts by medium- to coarse-grained magnetite, quartz, pyrite, and chalcopyrite [3]. The dominant K-feldspar altered breccia is occasionally overprinted by a later, and mineralogically different assemblage of fine-grained calcite and quartz with chalcopyrite, pyrite, magnetite, K-feldspar, barite, and apatite [3,31]. Often, veins containing this mineralogy gradually increase in abundance over a few meters until they become the dominant lithology [3]. This assemblage is termed Stage 2 breccia, and is thought to have formed by fracturing, replacing, and recrystallization of the earlier ore-stage assemblage during ongoing dilation of the binding shear zones [3,31].
Late calcite veins cross-cut mineralization and the Stage 2 breccia and is accompanied by the post-mineralization alteration of biotite, magnetite, and calcite to chlorite and sericite [3].

2.3. Previous Deposit Models

Several studies have proposed models for the formation of the Ernest Henry IOCG deposit. Twyerould [3] proposed that the deposit formed through deep convective circulation of magmatic fluids over a prolonged period, with the breccia forming due to the hydrofracturing of rocks between the rheological softer shear zones, providing a pathway for later ore-bearing fluid. Oliver et al. [6] used analytical equations on particle transport to propose the ore-bearing breccia marked the transition between explosive (top of the deposit) and implosive (bottom of the deposit), suggesting breccia formation occurred as a result of over-pressured magmatic-hydrothermal fluid. Mark et al. [4] used geochemical modelling and titanite U–Pb geochronology to suggest a fluid mixing model for the deposit, of which occurred immediately after regional Na-Ca and localized biotite-magnetite alteration, synchronous with ongoing dilation and brecciation of the deposit at ~1530 Ma. A fluid mixing model was also favoured by Kendrick et al. [33], who used fluid inclusion data from ore-stage quartz veins to suggest that ore precipitated from the mixing of a magmatic fluids from regionally abundant ‘A-type’ granites, and a highly saline brine generated from sedimentary formation water. The most recent detailed deposit model produced by Rusk et al. [5] proposed that an explosive event formed the breccia through fluid overpressure, suggesting the replacement textures documented in deeper parts of the deposit formed as a result of prolonged fluid interaction due to a slower degradation in fluid pressure and temperatures. Recent work completed by Case et al. [34] proposes a similar breccia mechanism to Twyerould [3], in which the formation of the ore-bearing breccia was the result of strain partitioning between ductile metasedimentary/biotite-rich rocks of the HWSZ and FWSZ around the competent Mount Fort Constantine metavolcanic rocks.

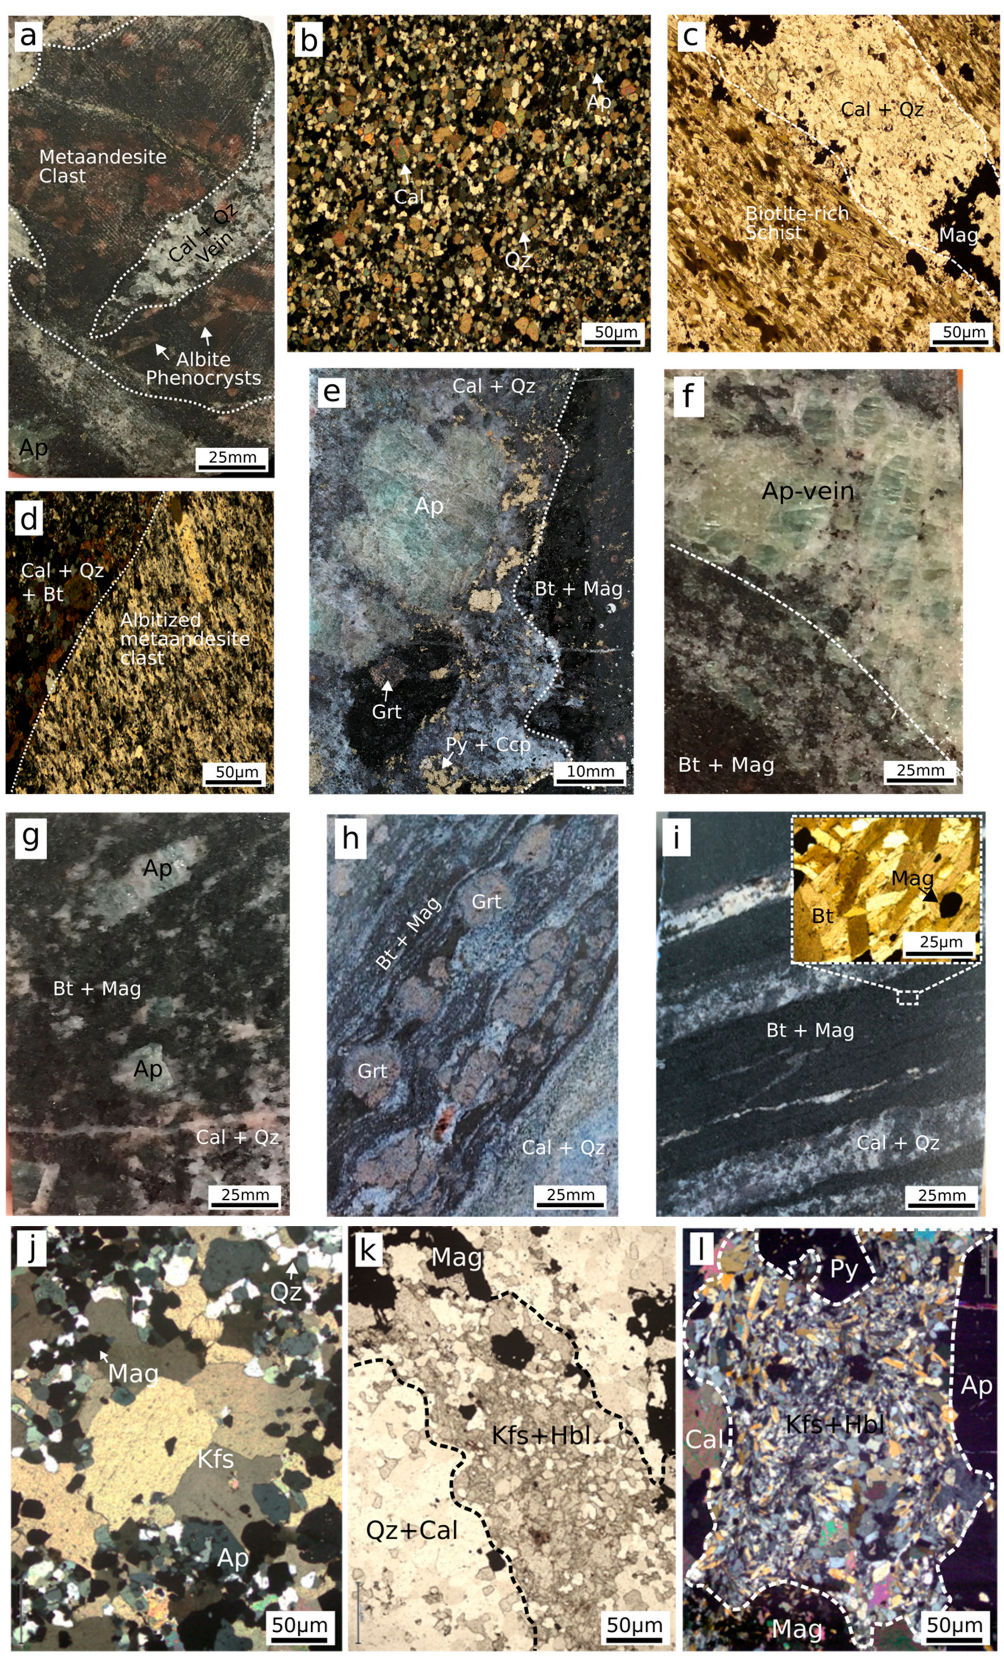
3. Geology and Mineral Paragenesis of the Inter-Lens

Contacts between the ore-bearing breccia and the Inter-lens are identified by a dramatic change in the colour and texture of exposed rocks. The clast supported breccia has a distinct red colour due to the high intensity of K-feldspar alteration, while rocks of the Inter-lens are predominantly dark, foliated, and exhibit intense biotite-magnetite alteration. In assay data, the Inter-lens can be identified by a large increase in P, accompanied by a significant decrease in Cu, Au, S, As (Figure 3), Ag, U, Mo, Co, and Ni (not pictured). No significant change in Fe is observed (Figure 3). As the Inter-lens contact is approached, the K-feldspar altered breccia is often overprinted by a fine-grained calcite and quartz mineralogy, analogous to the Stage 2 breccia.
Modelling the outer shell of the Inter-lens using existing mine data produces a feature that dips moderately south to southeast, subparallel to mineralization, and could potentially intersect, or anastomose with the HWSZ (Figure 4).

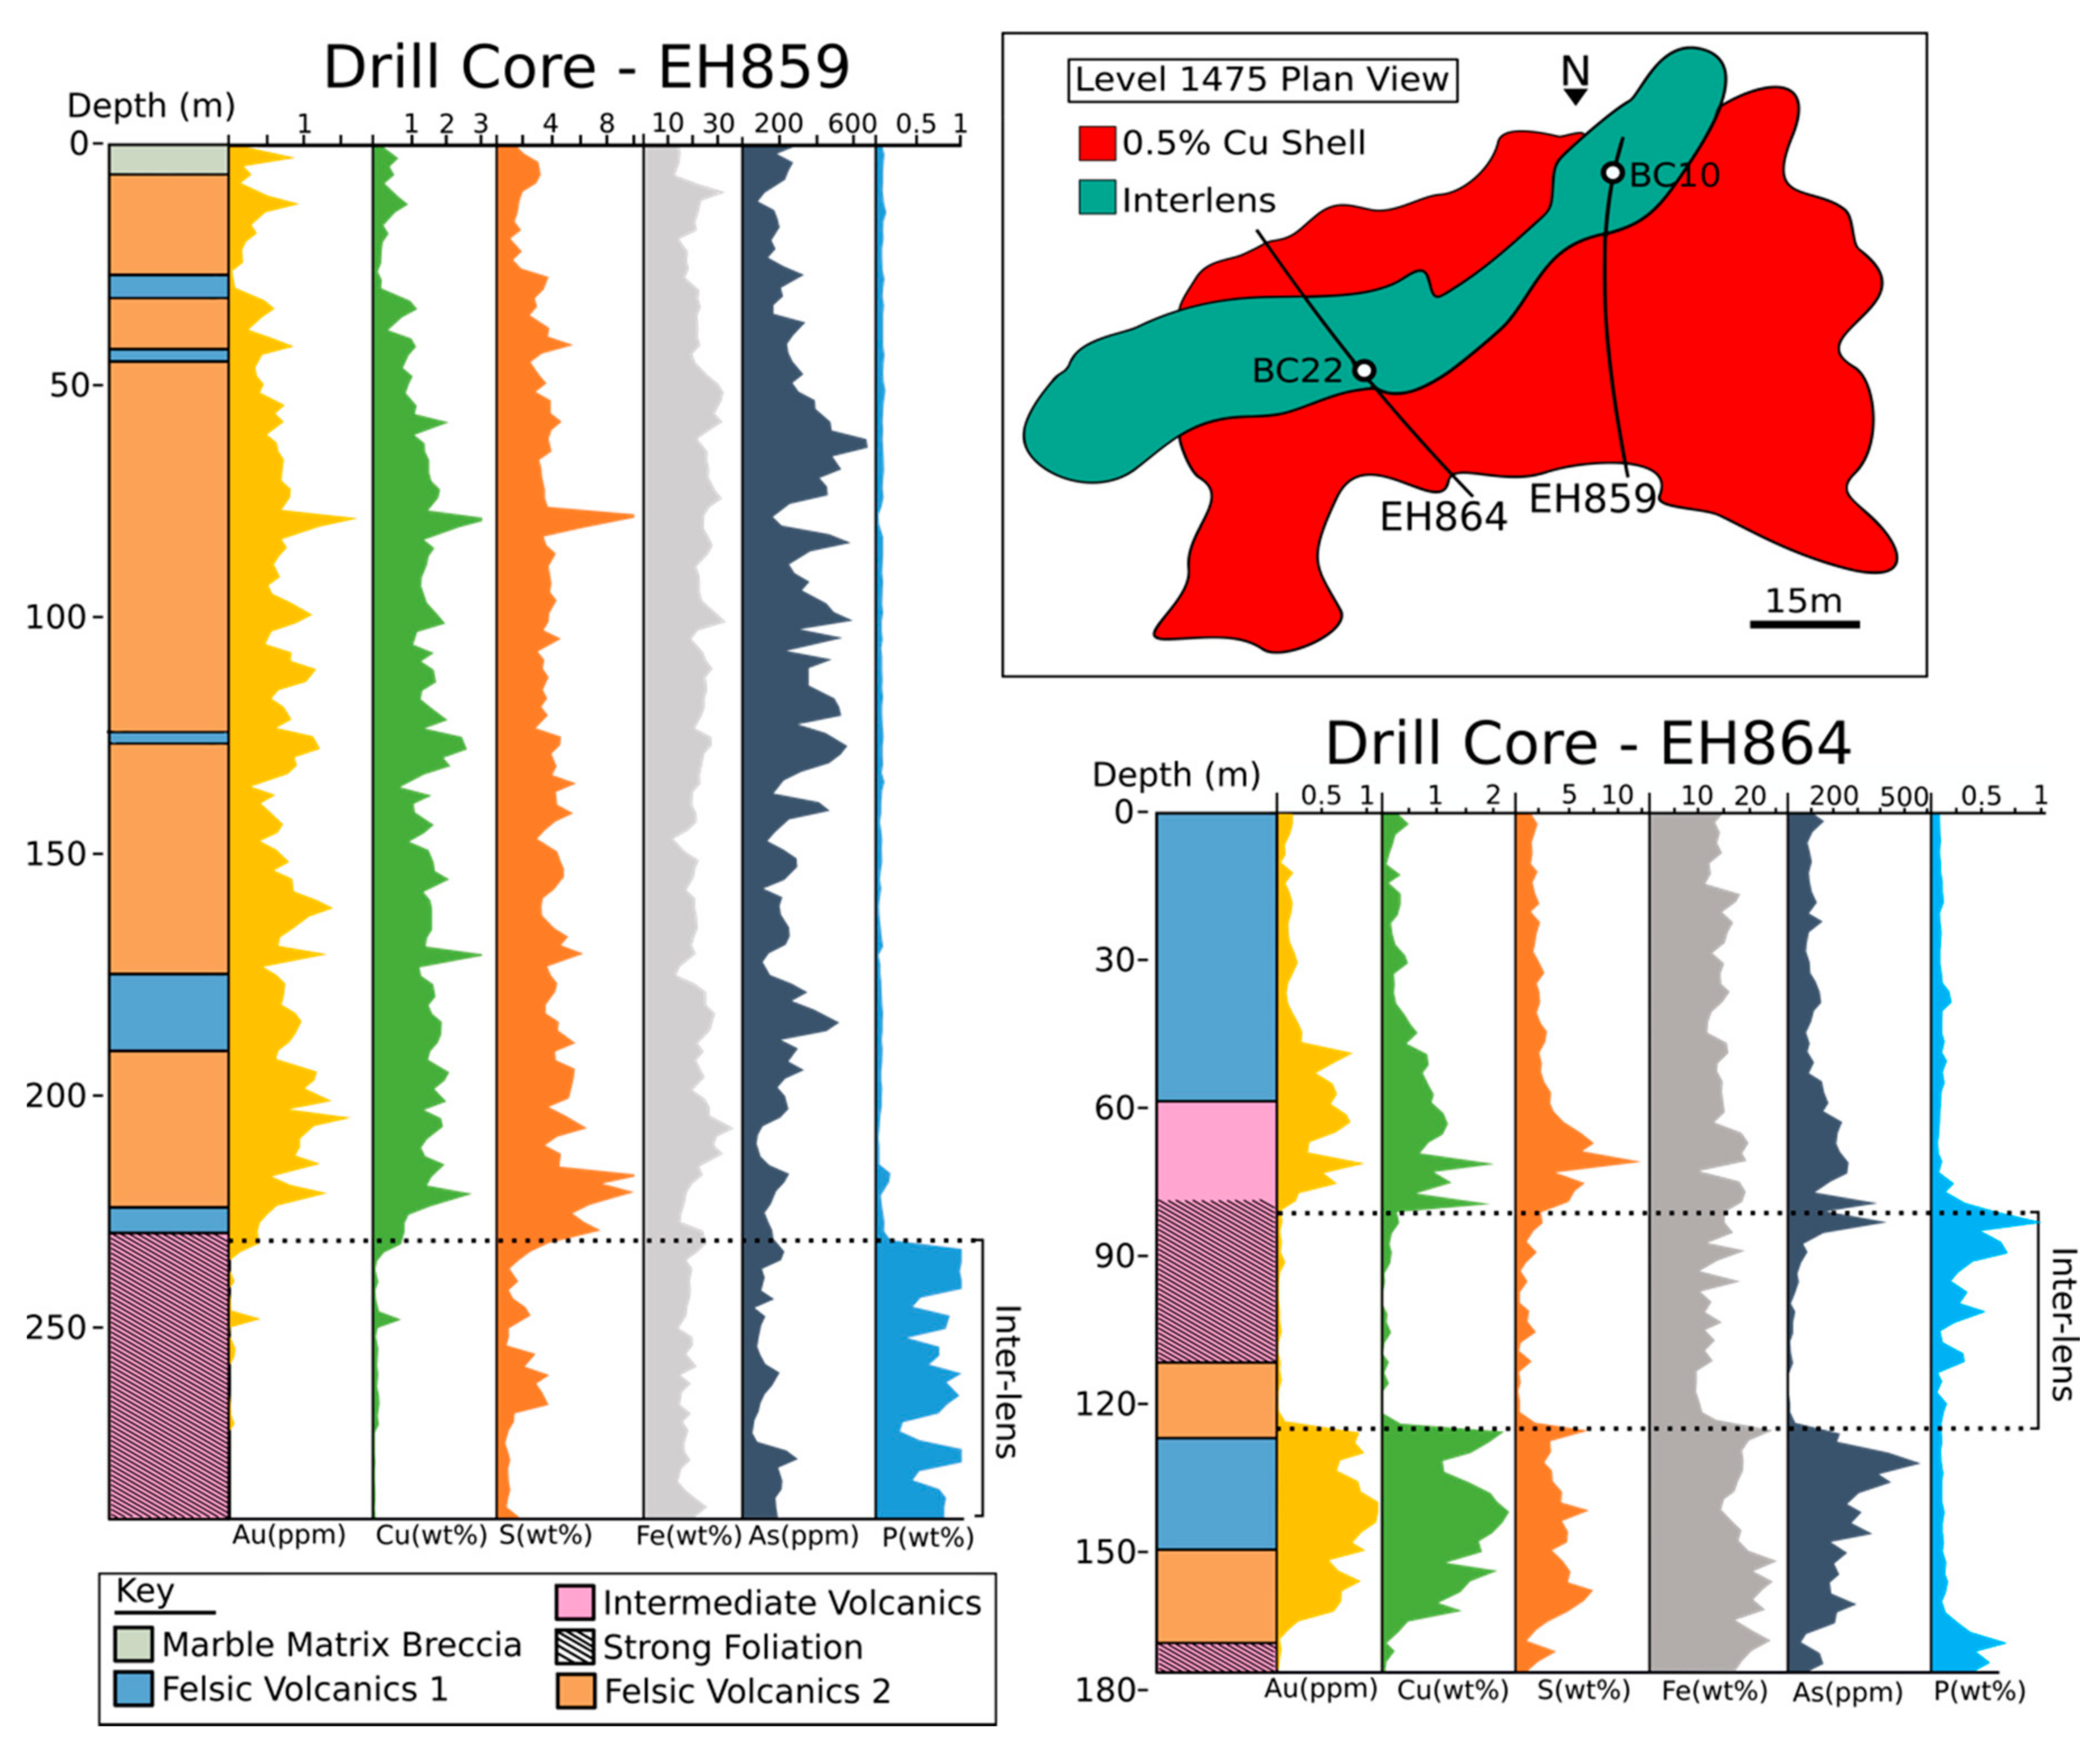
3.1. Protolith Geology

Breccia clasts appear mainly volcanic in origin and possess seriated porphyritic plagioclase (40%–60%) textures in a fine-grained biotite and plagioclase-rich groundmass (Figure 5a). In some instances, large (>10 cm diameter) breccia clasts of porphyritic metaandesites are present in a medium- to coarse-grained calcite and quartz-rich matrix. Breccia clast textures vary between ductile sigmoidal shaped and brittle, angular clasts that often possess a biotite and magnetite-rich rim up to 5 mm thick. As a result of experiencing metamorphism and intense hydrothermal alteration, the metasedimentary host rocks of the Inter-lens are difficult to resolve. Fine- to medium-grained quartzite textures are common in the majority samples (Figure 5b), and consist of primarily of quartz (>80%) and carbonate (10%–30%) with variable K-feldspar (<10%) and minor apatite (>5%). Layered biotite-rich schists are also documented in a minor amount of samples (Figure 5c), and are shown by a large decrease in the amount of calcite and quartz, accompanied by an increase in medium-grained, highly foliated biotite. These schists consist primarily of biotite (>70%), with fine-grained quartz (10%–20%) and fine-grained calcite (5%–10%).

3.2. Mineral Paragenesis of the Inter-Lens

The paragenesis of the Inter-lens (Figure 6) is broadly consistent with the paragenesis of the deposit given by Mark et al. [4]. This consists of (1) early albitization; (2) an apatite-calcite-quartz-garnet assemblage; (3) biotite-magnetite ± garnet alteration; (4) K-feldspar ± hornblende alteration; (5) ore-stage mineralization and; (6) post-mineralization calcite ± quartz veining and late chlorite-sericite alteration. Detailed descriptions of each stage are given below.

3.2.1. Albitization

Albitization is commonly preserved in the breccia clasts of the host metaandesites. This stage is characterized by the presence of homogenous fine-grained albite (with occasional medium-grained albite) that replaces the previous groundmass of coarse-grained plagioclase and fine-grained quartz and biotite (Figure 5d). Early albitization is also documented in the biotite-rich schists, and consists of fine- to medium-grained albite that replaces the previous assemblage of biotite, quartz, and calcite.

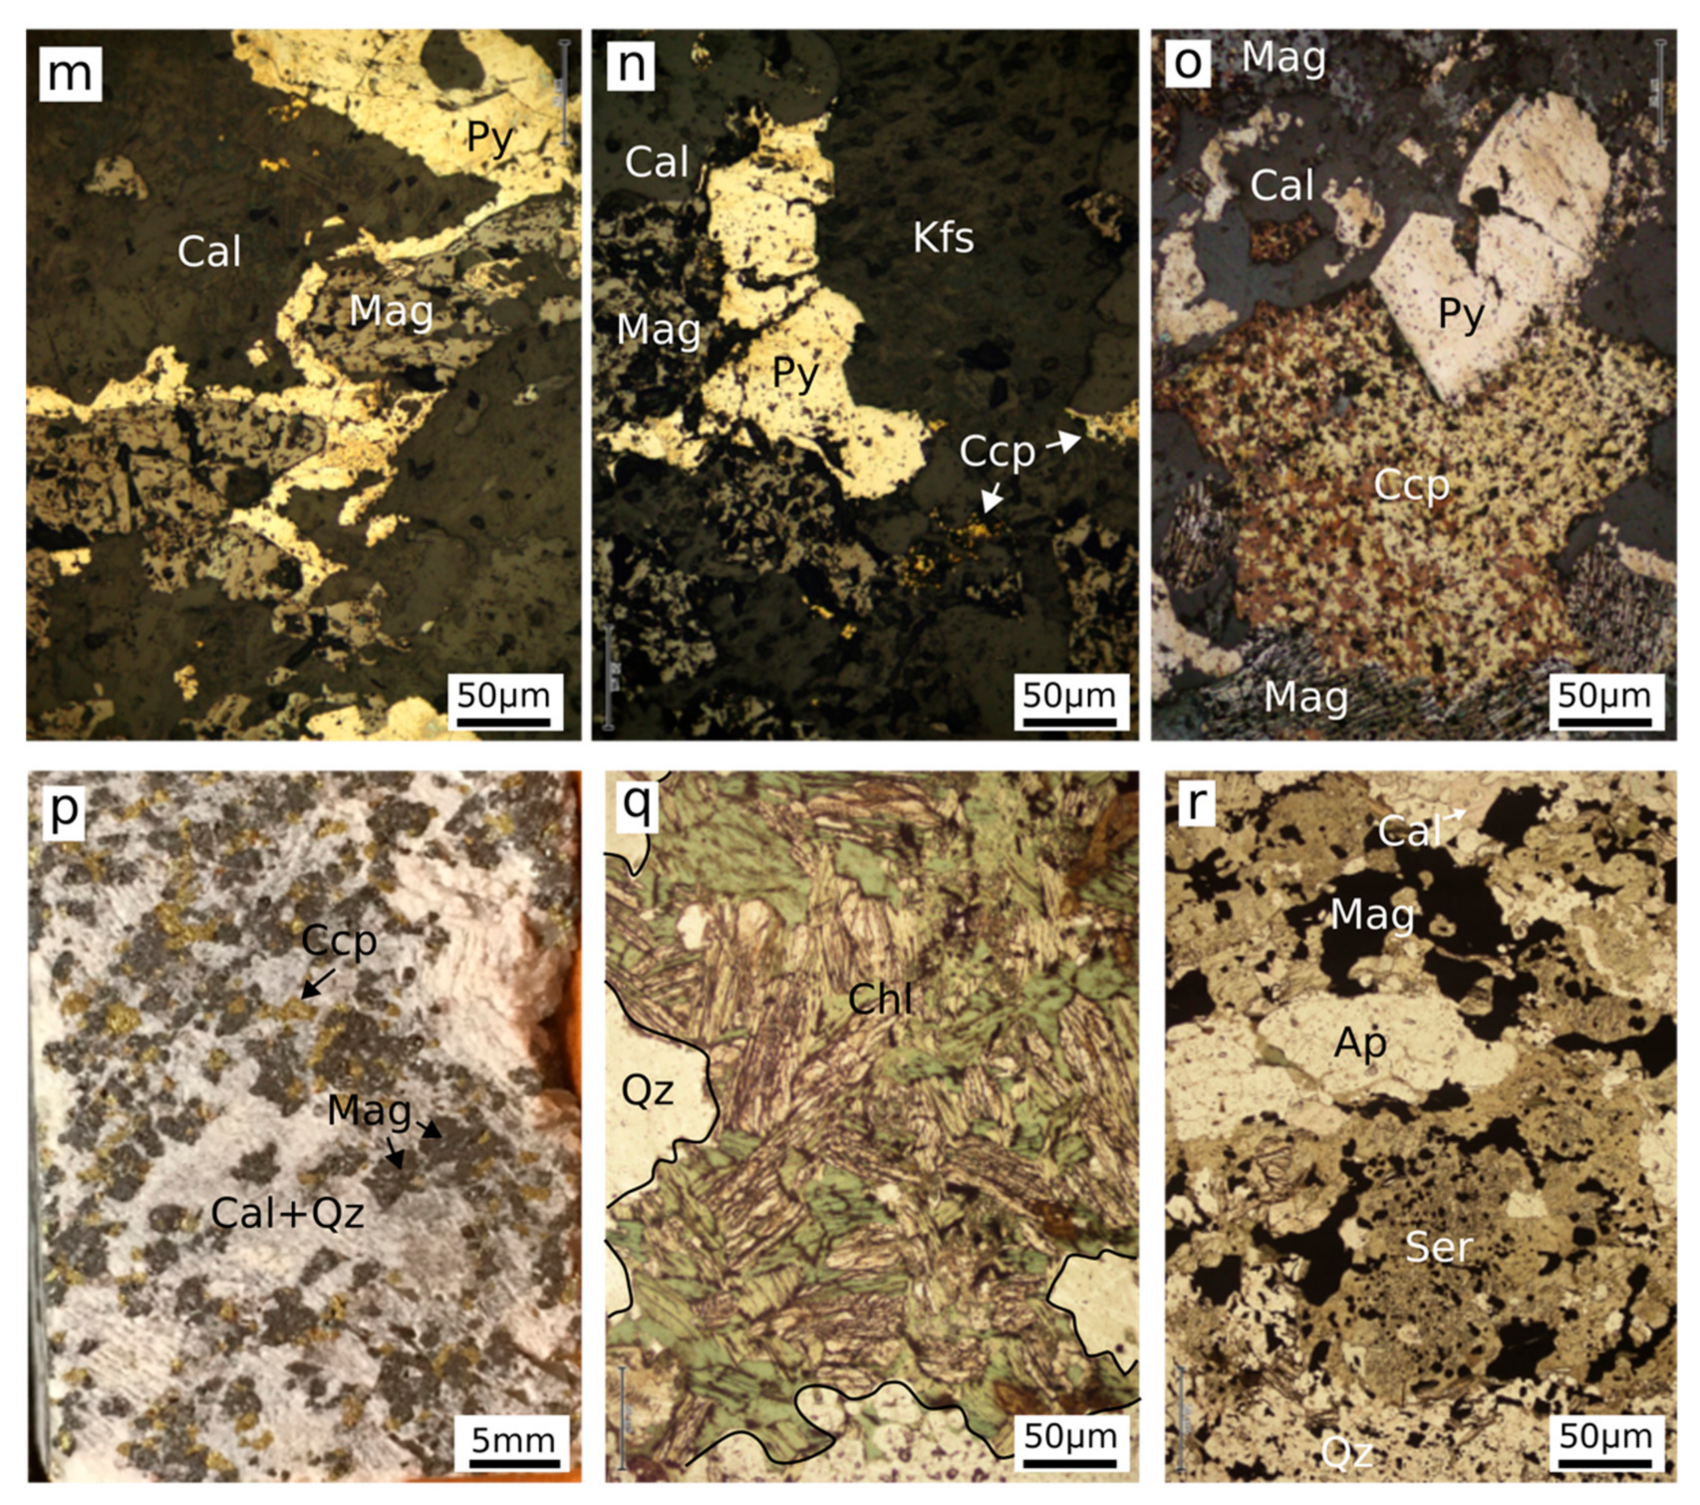
3.2.2. Apatite-Calcite-Quartz-Garnet

Apatite is commonly found in the Inter-lens, often producing apatite-rich assemblages >2 m thick in drill core. Coarse-grained euhedral apatite occur in veins with medium- to coarse-grained calcite and quartz ± garnet (Figure 5e,f). Apatite also exists as fine- to medium-grained angular to sub-rounded grains that appear disseminated throughout a fine-grained biotite-magnetite dominated matrix with fine- to medium-grained calcite and quartz (Figure 5g). In both cases, apatite appears to be early in the paragenesis of the Inter-lens, and is surrounded by a paragenetically later matrix of medium- to coarse-grained calcite, quartz, biotite, magnetite ± hornblende ± pyrite ± chalcopyrite ± hematite. Apatite is often fractured and replaced by subsequent calcite and quartz, suggesting that it was the first to crystallize. Garnet associated with this stage varies from medium- to fine-grained and occurs as both discontinuous and irregular veins and euhedral crystals (Figure 5e) that typically form around various apatite, calcite, and quartz grains.

3.2.3. Biotite-Magnetite ± Garnet Alteration

Biotite and magnetite occur as the dominant infill and alteration stage in the majority of apatite-rich samples (Figure 5e–g), forming a fine- to medium-grained matrix. Often, euhedral and well-developed coarse-grained garnets are associated with this alteration stage, and form in banded layers with fine- to medium-grained calcite and quartz (Figure 5h). Garnet also occurs as euhedral crystals in a matrix of biotite and magnetite. Biotite-magnetite alteration is dominant in the fine-grained quartz-rich metasedimentary units, but can also be seen replacing the albite in the plagioclase-rich metaandesite. As the result of replacing a previously highly-foliated unit, this alteration stage can appear highly foliated on a macroscopic scale, but is commonly non-foliated on a microscopic scale (Figure 5i). This intensity of this alteration stage varies from high in the metasedimentary units, often leaving the original host-rocks unrecognizable, to moderate in the metaandesite units.

3.2.4. K-Feldspar ± Hornblende Alteration

K-feldspar alteration affects earlier calcite, quartz, apatite, biotite and garnet, resulting in fine- to medium-grained K-feldspar-rich assemblage (Figure 5j). K-feldspar is often associated with hornblende, forming a fine-grained texturally destructive assemblage (Figure 5k,l). In the metaandesite units, K-feldspar replaces albite phenocrysts, turning previous porphyritic albite clasts a red brick color (Figure 5a). This alteration stage can also be seen partially replacing coarse-grained albite in previously albitized metasedimentary units, but is most intense in the metaandesite host rock.

3.2.5. Ore-Stage Cu-Mineralization

Chalcopyrite and pyrite occur as both infill and replacement. In the Inter-lens, pyrite is significantly more abundant than chalcopyrite. Both minerals form fine- to medium-grained assemblages that occur around the grain boundaries, and inclusions within calcite, quartz, apatite, and K-feldspar (Figure 5m,n). Pyrite and chalcopyrite are both commonly seen replacing magnetite, and pyrite is often replaced by successive chalcopyrite (Figure 5o). Gold is not visible within the samples collected in this study, and will not be discussed further in this contribution. Pyrite and chalcopyrite can also be seen concentrated between the apatite-calcite-quartz-garnet assemblage and areas that have previously undergone intense biotite-magnetite alteration, taking advantage of pre-existing contacts between the two hydrothermal stages (Figure 5e). Other minerals associated with this stage include medium- to coarse-grained calcite, quartz, biotite, magnetite, and hematite. In the outer portions of the Inter-lens, clasts of metavolcanic rocks are cross-cut by mineralized calcite ‘crackle’ style veins that eventually progress into a fine- to medium-grained calcite-dominated breccia (Figure 5p), analogous to the Stage 2 breccia described by Twyerould [3].

3.2.6. Post-Mineralization Calcite ± Quartz Veining and Chlorite-Sericite Alteration

Calcite ± quartz tension gashes cross-cut the ore-stage, and the Stage 2 breccia, and are broadly parallel in orientation. Retrograde chlorite replaces biotite, pyrite, magnetite, and calcite, forming an irregular and texturally destructive groundmass (Figure 5q). Sericite replaces K-feldspar, albite, and calcite (Figure 5r), also forming an irregular and texturally destructive groundmass.

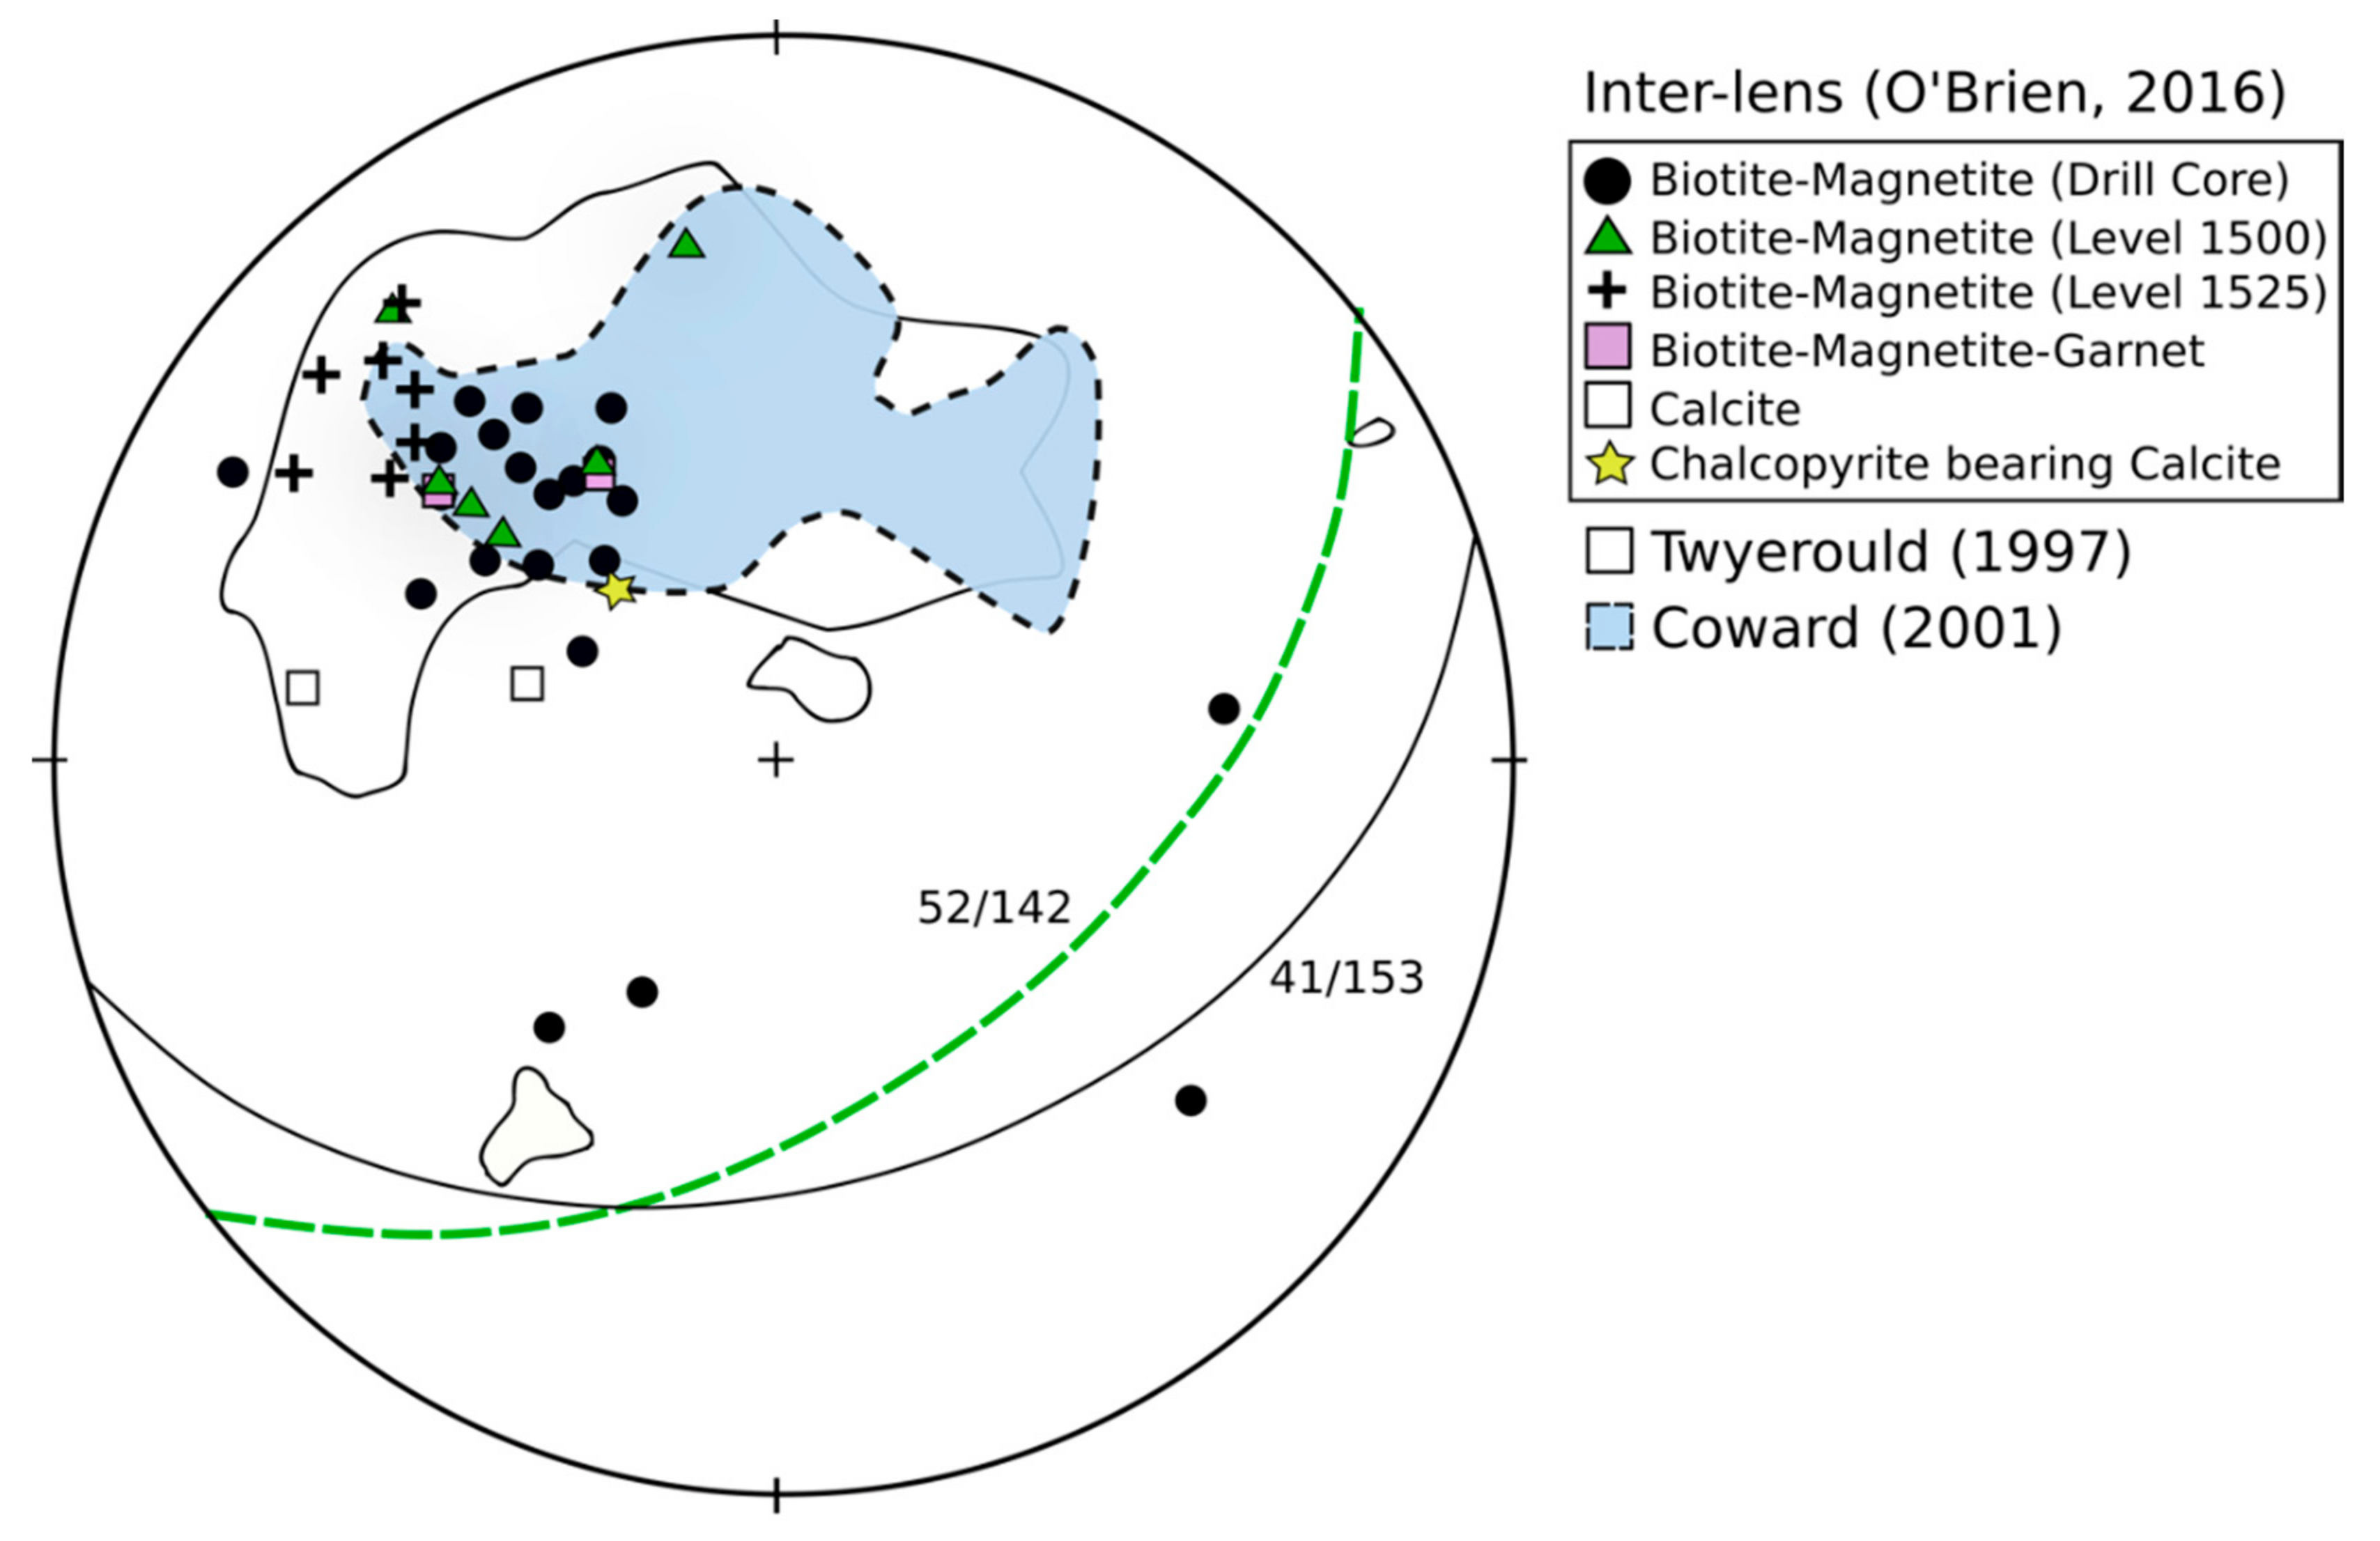
3.3. Structural Similarities to the HWSZ and FWSZ

O’Brien [36] measured the dominant S2 mineral foliation of biotite from within the Inter-lens on level 1500 and 1525, of which averaged 52/142 and 41/153, respectively (Figure 7). It was also shown by O’Brien [36] that the mineral foliations from biotite-magnetite alteration, garnet bearing biotite-magnetite alteration, calcite veins, and chalcopyrite-bearing calcite veins possess the same moderately southeast plunging foliation as recorded on levels 1500 and 1525 (Figure 7). It is shown that the foliation of minerals from the Inter-lens strongly correlate with previous measurements of S2 (as a result of D2) mineral foliations from the HWSZ and FWSZ [3,29], suggesting a genetic association with the structures.

4. Materials and Methods

4.1. Sample Information (Apatite Geochronology and Trace Element Analysis)

Sample BC10 was sourced from a depth of 262.1 m from drill core EH859 (Figure 3), located on the west side of the Inter-lens. This sample was selected as it represents a vein of coarse-grained apatite (up to 1 cm) that have been mildly fractured and brecciated by coarse-grained calcite and fine-grained quartz with less abundant biotite, magnetite, K-feldspar, and hornblende with minor pyrite and chalcopyrite (Figure 8a–c). Smaller (~100 μm), darker, and rounded grains of apatite are found in this sample (termed Ap2), typically located within fractures, or along the boundary of the coarse-grained euhedral apatite (Figure 8d). Cathodoluminescence (CL) imaging suggests the composition of the coarse-grained apatite is relatively homogeneous, with the exception of a variable (often ~20 μm) sized rim around the coarse-grained apatite (Figure 8e). This rim is significantly darker in CL images and possesses a sharp boundary with the coarse-grained apatite. As the Ap2 apatite and the outer rims of the coarse-grained apatite possess similar characteristics under CL, they are grouped together in this study (Figure 8d,e). Samples from the homogeneous, coarse-grained apatite are termed “BC10a”, while samples from the rim of coarse-grained apatite and Ap2 are termed “BC10b”.
Sample BC22 was sourced from a depth of 88.2 m from drill core EH864 and is located on the east side of the Inter-lens (Figure 3). This sample was selected as it contains much smaller (5 mm, typically ~500 μm) disseminated apatite in a compositionally different biotite and magnetite-rich matrix, following a weak but visible shearing texture depicted by the alignment of variable sized apatite, quartz, calcite, and sulphide grains. The matrix of this sample is primarily made up of fine- to medium-grained biotite and magnetite with calcite, fine-grained quartz, and minor pyrite and chalcopyrite (Figure 8f–h). Concentric-like, irregular zonation is identified by the presence of a light core and a dark rim in medium-sized (~500 μm) apatite grains (Figure 9i,j). Unlike the majority of apatite in the BC10 sample, apatite from the BC22 sample commonly display a vuggy texture that can be distinguished in BS (Electron Backscatter) and CL images (Figure 8g–j). Samples from light regions in vuggy apatite from this sample are termed “BC22a”, while samples from the darker regions in this sample are termed “BC22b”.

4.2. Apatite U–Pb Geochronology

Mineral liberation analysis (MLA) and BS images of apatite-bearing samples were produced using the Quanta SEM 600 (Field Electron and Ion Company, Hillsboro, OR, USA) at Adelaide Microscopy. Selected grains from the various samples were imaged using a cathodoluminescence detector attached to a Quanta SEM 600 to reveal greyscale compositional zonation, and to select targets for LA-ICP-MS work. All LA-ICP-MS work was performed at Adelaide Microscopy. This study used methods adapted from Chew et al. [11], with the same LA-ICP-MS setup and laser parameters as Jepson et al. [13] and Glorie et al. [14] (Outlined in Supplementary Table S1). The Iolite software package [37] with the VizualAge_UcomPbine data reduction scheme (DRS) [11] was used to reduce the apatite U–Pb data. Madagascar apatite (U–Pb TIMS age of 473.5 ± 0.7 Ma; [11]) was used as a primary standard with the McClure Mountain apatite (U–Pb TIMS age of 523.51 ± 1.47 Ma; [38]) used as a secondary standard to perform accuracy checks. Ages were calculated using an unanchored linear regression approach with IsoplotR [39]. The lower intercept on the Terra–Wasserburg plot represents the estimated age of the sample, and the upper intercept represents the estimated initial common Pb (207Pb/206Pb ratio) composition. Forty analyses of the primary Madagascar apatite standards were measured alongside 40 analyses of the secondary McClure Mountain apatite standard using a standard-sample bracketing approach. The McClure Mountain standard resulted in a weighted mean 207Pb corrected age of 521.3 ± 8.4 Ma (MSWD = 0.65), in good agreement with the published values of 523.51 ± 1.47 Ma [37]. There was no correlation regarding the concentration of 238U (even samples with less than 1ppm), and the ages produced from these samples, suggesting that they are valid to use in the production of an overall U–Pb age.

4.3. Trace Element Analysis

Trace element analysis was performed simultaneously with the acquisition of isotopes for geochronology, and reduced using the Trace Element_IS DRS in Iolite [37]. NIST610 glass was used as a primary standard, with an internal standard value of 39.36 wt % Ca. Limited trace element maps were produced using the parameters outlined in italics in Supplementary Table S1, and reduced using the Trace_Element DRS in Iolite [37].

5. Analytical Results

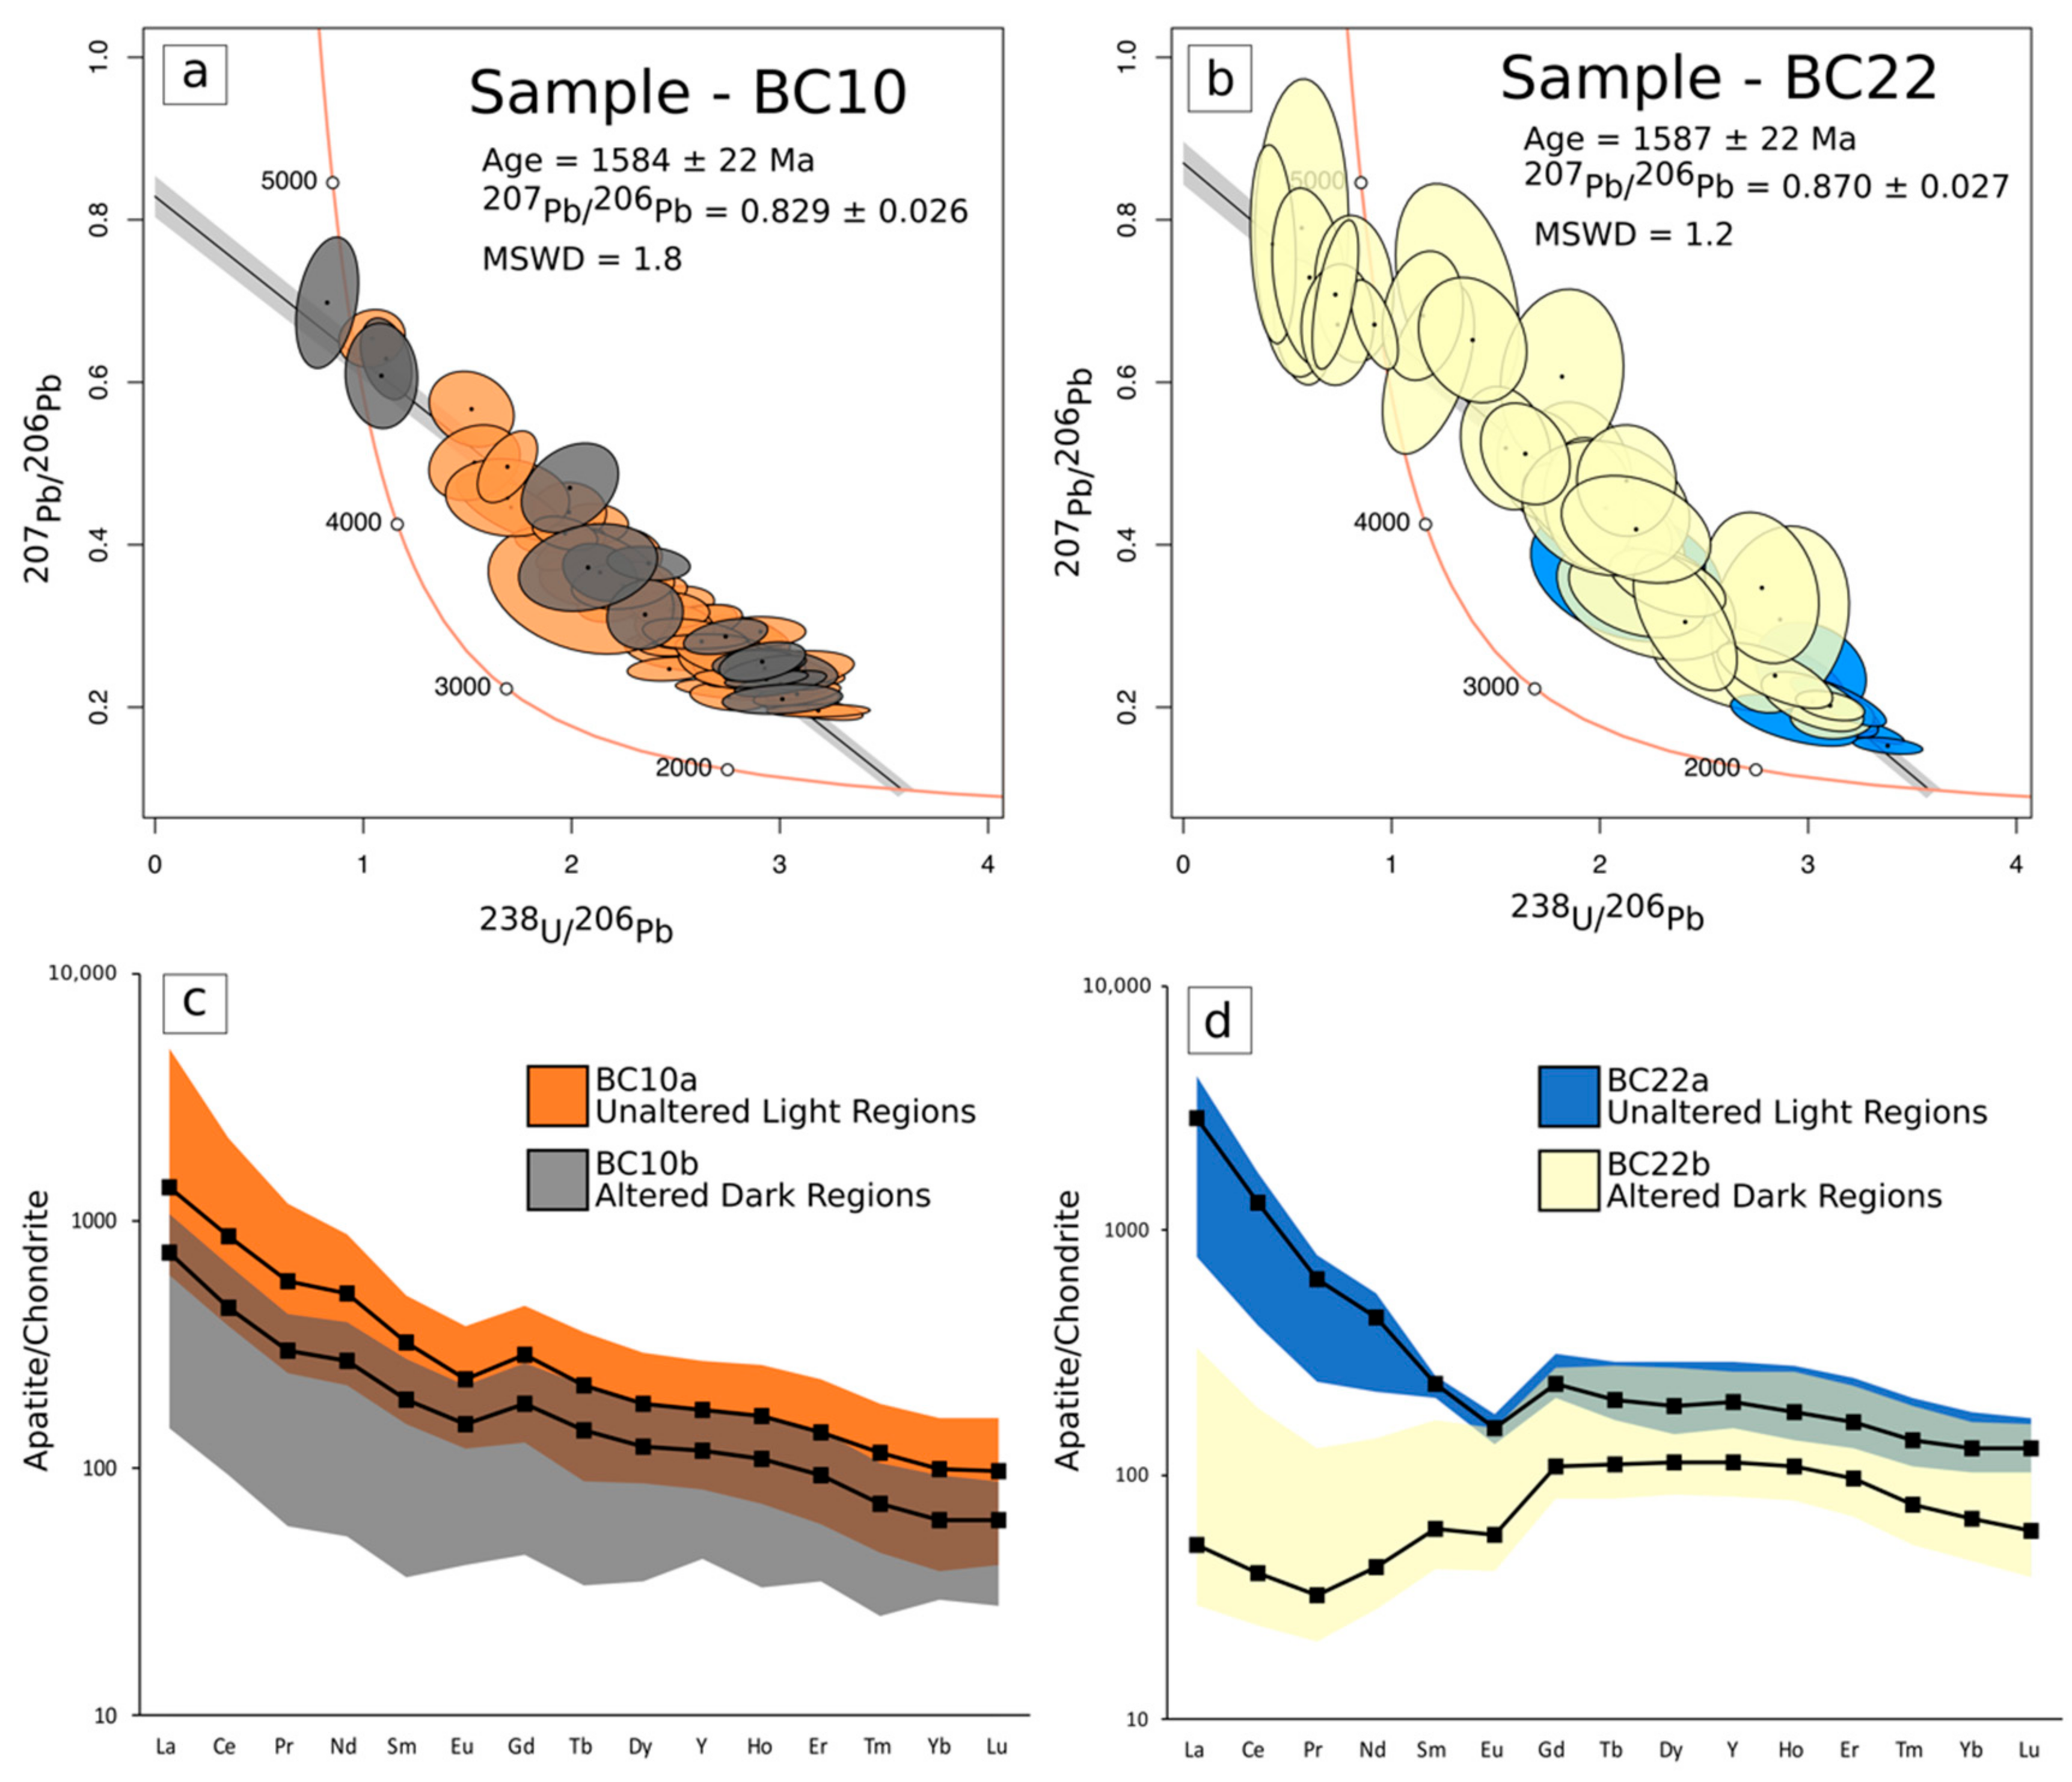
5.1. Apatite U–Pb Geochronology

Sixty-eight analyses of the BC10a apatite results in an age of 1581 ± 26 Ma (MSWD = 1.9) and a 207Pb/206Pb ratio of 0.818 ± 0.030 (Supplementary Figure S1). Sixteen analyses of BC10b apatite produce an indistinguishable age of 1572 ± 50 Ma (MSWD = 1) and a 207Pb/206Pb ratio of 0.849 ± 0.05 (Supplementary Figure S1). As individual common Pb regression lines for the unaltered and altered apatite regions produce the same U–Pb dates within uncertainty, and the 207Pb/206Pb estimates are within error of each other, the data was pooled to obtain an overall age with better statistics. The pooled data produces a Terra–Wasserburg plot that defines a discordant array with an upper intercept (207Pb/206Pb ratio) of 0.829 ± 0.026 and a lower intercept of 1584 ± 22 Ma (MSWD = 1.8) (Figure 9a). 238U concentrations from BC10a apatite range from 8.00 ppm to 1.09 ppm with a median of 4.47 ppm (Table 1). Altered BC10b apatite possesses 238U concentrations ranging from 5.82 ppm to 0.64 ppm, with a median of 3.33 ppm (Table 1).
Eleven analyses from the BC22a apatite result in a poorly constrained age of 1538 ± 60 Ma (MSWD = 0.78) and a poorly defined 207Pb/206Pb composition of 0.740 ± 0.128 (Supplementary Figure S1). Thirty-six samples of the BC22b apatite regions gave a more precise age of 1601 ± 40 Ma (MSWD = 1.2) and a 207Pb/206Pb ratio of 0.878 ± 0.029 (Supplementary Figure S1). As the 207Pb/206Pb estimates and the U–Pb dates are within uncertainty, the forty-seven analyses were also pooled to obtain an overall age with better statistics. The resulting Terra–Wasserburg plot defines a discordant array with an upper intercept (207Pb/206Pb ratio) of 0.870 ± 0.027 and a lower intercept of 1587 ± 22 Ma (MSWD = 1.2) (Figure 9b). 238U concentrations from BC22a apatite samples range from 7.11 ppm to 4.80 ppm with a median of 6.73 ppm (Table 1). BC22b samples possess lower 238U, with concentrations ranging from 5.76 ppm to 0.12 ppm, and a median of 0.74 ppm (Table 1). Individual measurements from the BC22 sample have larger errors compared to measurements taken from the BC10 sample. This is likely the result of lower 238U concentrations, and the variably vuggy texture of apatite from this sample. U–Pb isotopic compositions from all samples are available in the Supplementary Table S2.

5.2. Trace Element Data

BC10a apatite possesses a LREE enriched profile, with normalized La/Lu values ranging from 41.1 to 8.99 and a median of 14.4 (Figure 9c; Table 1). BC10b apatite possesses a similar LREE enriched profile, with a systematic depletion in all REEs and lower La/Lu values ranging from 15.4 to 3.08, with a median of 11.5 (Figure 9c; Table 1). BC10b apatite generally have a lower Th content, ranging from 5.08 ppm to 0.26 ppm, with a median 1.21 ppm. This is compared to BC10a apatite that have Th values ranging from 57.4 ppm to 0.79 ppm, with a median of 18.9 ppm. The Th + REE-depletion trend is also seen in trace element maps (Figure 10), showing a large As enrichment (up to ~2 wt %) on the rim of the grain, coinciding with the depletion in Th + REE.
BC22a apatite samples are LREE-enriched, and have La/Lu values ranging from 37.5 to 4.69, with a median of 23.0 (Figure 9d; Table 1). BC22b apatite samples are LREE-depleted, and possesses lower La/Lu values ranging from 2.29 to 0.52, with a median of 0.84 (Figure 9d; Table 1). All BC22 apatite samples have a flat profile across the MREEs and a relative depletion in HREEs. BC22b apatite samples are also generally depleted in Th, with concentrations from 37.3 ppm to 0.04 ppm, and a median of 2.02 ppm (Table 1). This is compared with BC22a apatite samples that have Th concentrations ranging from 39.7 ppm to 15.7 ppm, with a median of 32.2 ppm (Table 1).

6. Discussion

6.1. The Inter-Lens Protolith and Similarities with the FWSZ, HWSZ, and MSZ

Volcanic clasts documented in the Inter-lens are texturally and mineralogically consistent with metaandesites of the Mount Fort Constantine volcanics, suggesting that they constitute at least one component of the Inter-lens’ protolith. Biotite-rich schists were also documented in a limited number of samples, suggesting that they also constitute a minor portion of the Inter-lens’ protolith. In the overwhelmingly majority of the samples, fine- to medium-grained quartz (often possessing quartzite textures) (>70%) with fine- to medium-grained calcite (10%–30%), variable K-feldspar (<10%) and minor apatite (>5%) produce the dominant precursor lithology. This mineralogy is consistent with a quartz-rich metasediment possessing a varying amount of carbonate, and due to its high abundance in the samples from this study, is thought to make up the dominant protolith of the Inter-lens.
Paragenetically early albite from the Inter-lens is likely associated with syn-metamorphic sodic-calcic alteration, of which has been recorded in the nearby Starra and Osborne deposits [41,42]. The apatite-calcite-quartz-garnet assemblage is also paragenetically early in the Inter-lens, and has also been documented in the HWSZ, FWSZ, and MSZ by various authors [3,4,29]. Due to the age and common Pb composition of the samples analyzed, this assemblage is interpreted to have been derived from a fluid with a metamorphic origin (see Section 6.2.). Intense biotite-magnetite ± garnet alteration of the Inter-lens is associated with pre-ore (K-Mn-Fe) alteration that is common in all the major shear zones [3,4]. Mark et al. [4] dated biotite-magnetite alteration to 1514 ± 24 Ma (U–Pb TIMS titanite), and suggested the origin of this alteration style could be related to cooling, wall rock interaction, or de-pressurization of the system. As the apatite-calcite-quartz-garnet assemblage, and intense biotite-magnetite alteration is confined to the metasedimentary units of the Inter-lens, HWSZ, FWSZ, and HWSZ, protolith geology is suggested to be a dominant control regarding the distribution of these alteration/hydrothermal stages. K-feldspar ± hornblende alteration of the Inter-lens is equivalent to the intense K-feldspar alteration exhibited in areas of high Cu-Au mineralization. It is suggested by Mark et al. [4] that the fluid responsible for biotite-magnetite alteration likely evolved into a K-rich fluid as a result of alkali exchange during fluid-rock interaction, producing K-feldspar alteration. This alteration stage is followed by the precipitation of the ore-stage assemblage, post-mineralization calcite ± quartz veining and sericite and chlorite alteration.
As the lithologies that comprise the Inter-lens strongly resemble the lithologies documented in the HWSZ, MSZ, and FWSZ, and a strong correlation exists between dominant S2 foliation of the HWSZ, FWSZ, and the Inter-lens, it is interpreted that a genetic association exists between these structures. It is suggested that the Inter-lens was likely formed during D2 deformation of the Isan orogeny, coeval with the formation of the MSZ, HWSZ, and FWSZ.

6.2. Radiometric Dating (Apatite U–Pb Geochronology)

Apatite U–Pb ages of 1584 ± 22 Ma (BC10) and 1587 ± 22 Ma (BC22) suggest the formation/cooling below the closure temperature of apatite was coeval across the Inter-lens at ~1585 Ma. The common Pb (207Pb/206Pb ratio) estimates of apatite from samples BC10 (0.829 ± 0.026) and BC22 (0.870 ± 0.027), based on a linear regression through the U–Pb analyses in Terra–Wasserburg space, are inconsistent with the calculated common Pb composition of 0.96 for 1590 Ma using the Stacey and Kramers [43] two-stage Pb evolution model estimate with an average crustal growth curve of (μ = 9.74) [9]. Low common Pb estimates in titanite have been attributed to the formation of the mineral by recycled Ti phases during metamorphism, incorporating ancient radiogenic Pb into the lattice and reducing the 207Pb/206Pb ratio [44]. This would suggest that the apatite-rich lithologies are related to the break-down of a precursor U-bearing mineral phase during metamorphic conditions, and therefore was likely derived from a fluid with a metamorphic origin. This is validated by the ages presented above, which correlate with regional peak amphibolite metamorphic conditions at 1584 ± 17 Ma, and are synchronous with D2 deformation from 1595−1575 Ma [22,24]. As apatite is early in the paragenesis of the Inter-lens (See Section 3.3), these ages provide a good estimation of the maximum formation age of the Inter-lens. Furthermore, as the Inter-lens is suggested to have a genetic association the FWSZ, HWSZ, and MSZ, it would also suggest that these structures share a similar maximum age. Older ages of 1611 ± 4 Ma and 1610 ± 2 Ma (40Ar/39Ar amphibolite isochron) have been documented by Twyerould [3] from actinolite-magnetite alteration and veining in the MSZ. These ages were attributed to D1 deformation, or the partial resetting of older amphibolite during subsequent metamorphism. Examples of nearby metamorphic related alteration include pre-ore Ca-rich alteration of the Osborne deposit (1595 ± 6 Ma; 187Re–187Os molybdenite) by Gauthier et al. [42], syn-D2 albitite and quartz + (andalusite + staurolite + kyanite) veining in the Snake Creek anticline [45], and early (1594 ± 8 Ma; U–Pb titanite) sodic-calcic alteration at the nearby Starra deposit [41]. Multiple geochronological studies have dated minerals from Ernest Henry at ~1530–1470 Ma, and generally overlap with the intrusion of the nearby Williams–Naraku Batholiths (1550–1490 Ma). Early sodic-calcic alteration has been dated at 1529 +11/−8 Ma (U–Pb TIMS titanite) and paragenetically later biotite-magnetite alteration at 1514 ± 24 Ma (U–Pb TIMS titanite) [4]. Cu-Au mineralization has been dated at 1504 ± 3 Ma (40Ar/39Ar biotite) [3], 1538 ± 37 Ma (U–Pb rutile) [46], and ca 1476 (40Ar/39Ar biotite) [47].
The results from this study, with evidence from previous geochronological studies indicate the presence of at least two stages of hydrothermal fluids in the deposit. The first stage is associated with peak-metamorphism and D2 deformation (~1585 Ma), and the second stage is associated with the emplacement of the Williams–Naraku Batholiths and D3 deformation of the Isan Orogeny (1530–1470 Ma).

6.3. Characterization of Metasomatic Fluids

The REE composition of metasomatized apatite can be used to infer the characteristics of fluids responsible for alteration [18], and therefore can be used to provide information regarding the composition of subsequent fluids that have migrated through the orebody. As multiple fluids have been documented in the deposit [33,48] and textural observations correlate with criteria outlined by Putnis [49], it is interpreted that the geochemical changes across apatite grains from this study are a result of fluid induced metasomatism. Compared to the experimental studies [15,16,17,18,50], the presence of REE-bearing minerals, such as monazite and allanite, documented in metasomatized apatite from both the BC10 and BC22 samples are negligible. This is characteristic of alteration by a Na- and/or Ca-rich fluid, as the availability of Na+ and Ca2+ maintain a charge balance if Na+, Si4+ or (Y + REE)3+ is removed, hindering the formation of REE-bearing minerals [50]. This suggests that in the case of samples from this study (BC10 and BC22), the metasomatic fluids responsible for altering the apatite would be required to possess abundant Ca and/or Na.
The different REE-depletion trends (selective LREE depletion vs. non-selective REE depletion) suggest different mechanisms were involved during the metasomatism of the apatite from the various samples, indicating that they were altered by fluids with different compositions.
BC22a and BC22b display a noticeable vuggy texture (Figure 9i,j), which is likely the result of increased porosity due to a high degree of metasomatism [18,49]. A selective LREE-depletion trend is shown from BC22a to BC22b. Previous studies have attributed a selective LREE-depletion trend in apatite to metasomatic reactions that result in the formation of monazite and allanite, or co-genetic growth alongside epidote [50,51,52]. A selective LREE-depletion trend in apatite can also be the result of hydrothermal fractionation of LREEs and HREEs during fluid induced metasomatism [53,54]. –SO4 and –Cl complexes are the dominant transport mechanism for REEs, with LREE–Cl complexes considerably more stable than HREE–Cl complexes at temperatures exceeding 250 °C [55]. It has also been shown that Nd and Er (representative of REEs) are preferentially mobilized by –Cl complexes in acidic conditions (pH ~3.5 at 400 °C), while an increase in the pH to neutral/alkaline conditions favours the formation and solubility of REE–SO4 complexes [55]. A lack of LREE-mineral inclusions in BC22b and no co-genetic epidote implies that the selective LREE-depletion from BC22a to BC22b is likely the result of fluid induced metasomatism by a Cl-rich fluid, with the LREEs contributing to a later mineral assemblage. As formerly mentioned, a fluid capable of fractionating LREEs from BC22a to produce BC22b apatite would be required to be relatively hot (>250 °C), acidic, and Cl-rich. The characteristics of such a fluid best reflect the interaction with a saline brine. This is in agreement with Kendrick et al. [33] and Mark et al. [48], who have documented fluid inclusions possessing up to 69 wt % NaCl eq, and 55 wt % NaCl eq, respectively in the ore-stage assemblage, and attributed this to the presence of a sedimentary derived saline brine. This saline brine could become acidic as the result of adding CO2 to form carbonic acid through the reaction: CO2 + H2O → H2CO3 [56]. Alternatively, the brine could become acidic through a reaction in which iron chlorides react with H2O to form magnetite and hydrochloric acid (3FeCl2 + 4H2O → Fe3O4 + 6HCl + H2O) [57], consistent with the dominant magnetite-rich alteration stage present in this sample.
The sharp reaction front between the parent (BC10a) and product (BC10b) phases in sample BC10, as well as their close spatial relationships are characteristic of dissolution re-precipitation reactions [49]. It has been shown that –SO4 complexes are stable across all REEs, with no preference for LREE mobility [55]. Therefore, the non-selective REE-depletion trend from BC10a to BC10b is likely the result of fluid induced metasomatism by a SO4-rich fluid. Evidence for the presence of sulphur is shown by a mineral assemblage containing pyrite and chalcopyrite directly adjacent to a BC10b sampling site, and inclusions of chalcopyrite within the region’s sampled. Areas depleted in REEs are enriched in As (up to 2 wt %), of which is also primarily transported by hydroxide and sulphide complexes [58,59], providing further evidence in favour of a S-rich fluid. The As-rich apatite from this sample is comparable with the As-rich apatite found in the ore-stage assemblage [5,60], suggesting a possible link to ore-stage mineralization. As the mobilization of REEs by –SO4 is only significant at temperatures ≥ 300 °C, and the production of REE–SO4 is favoured in neutral/alkaline conditions, the second fluid would be required to be relatively hot, neutral/alkaline, and possess relevant –SO4. Such characteristics would best reflect the interaction with an alkaline, S-rich magmatic fluid, which has been described in previous studies on the deposit by Fuss [61], or a mantle derived H-C-O-S-rich fluid as described by Oliver et al. [62].
Alternatively, the different REE-depletion trends could record a temporal/spatial variation in a single fluid. However, as the fluid has to be relatively hot (>200 °C) for –Cl to fractionate REEs, and the mobilization of REEs by –SO4 is only significant at temperatures ≥ 300 °C [55], the differences in alteration would ultimately represent a spatial/temporal difference in the pH of the fluid.
As there is a substantial amount of evidence to suggest the presence of multiple and complex fluids associated with ore-stage mineralization [4,5,6,34,56,61,62], the first hypothesis is favoured by this study. It is suggested that the exposure to a Na- and/or Ca-rich acidic brine with abundant Cl was responsible for the LREE-depletion trend in apatite from the BC22 sample, whilst the exposure to a Na- and/or Ca-rich neutral/alkaline magmatic fluid with abundant SO4 resulted in a non-preferential REE-depletion trend in apatite from the BC10 sample.

6.4. The Re-examined Ore-Deposit Model

The new ages for early apatite-calcite-quartz-garnet assemblage suggests the deposit has experienced at least two major hydrothermal events over a ~100 Ma period (Figure 11).
The preservation of the Inter-lens within surrounding mineralization suggests the ore-bearing breccia did not form as the result of a single eruptive explosive/implosive event, as proposed by Oliver et al. [6] and Rusk et al. [5]. Instead, an interpretation similar to Twyerould [3] and Case et al. [34] is favoured. This suggests the incompetent shear-zones and Inter-lens (as a result of rheological softer metasedimentary rocks) acted in a ductile manner during D2 deformation and the formation of the km-scale duplex, while the more competent volcanic rocks that comprise the ore-bearing breccia acted in a brittle manner (Figure 11a). Intense fine-grained biotite-magnetite alteration followed, preferentially affecting the metasedimentary units, while the metadiorite host rocks were conversely altered to K-feldspar (Figure 11b). Ore-stage fluids penetrated areas that had previously undergone brittle deformation (while the Inter-lens and surrounding shear zones acted as a rheological barrier), and accompanied by D3 deformation, resulted in hydrofracturing and further brecciation, overprinting D2 foliation and allowing for the preservation of Inter-lens (Figure 11c).
The REE-depletion trend of metasomatized apatite records the interaction of two fluids with different compositions. The first fluid is interpreted as a sedimentary derived, NaCl and/or CaCl-rich acidic brine, while the second fluid is interpreted as a Na- and/or Ca-rich neutral/alkaline magmatic fluid with sufficient –SO4. The timing of these fluids are relatively unconstrained. The first fluid could be associated with the biotite-magnetite-rich alteration stage, whilst the second fluid is likely associated with ore-stage mineralization.
The deposition of ore-stage mineralization is interpreted to have occurred during D3 deformation of the Isan Orogeny, coeval with the emplacement of the ~1550–1490 Ma second phase of the Williams–Naraku Batholiths. The K-feldspar altered breccia is often replaced by a later, fine-grained calcite-quartz dominated breccia [3,31]. This mineralogy dominates the K-feldspar altered breccia as the Inter-lens is approached, and could represent spent hydrothermal fluids, or the introduction of new fluids during the brittle, post-mineralization D4 deformation event, as proposed by Coward [29]. These fluids would be focused into pre-weakened structures (such as contact zones of the Inter-lens and the ore-bearing breccia) during deformation, overprinting and replacing the established K-feldspar breccia (Figure 11d).

7. Conclusions

The Inter-lens is a pre-mineralization structure preserved within the Ernest Henry IOCG deposit and possesses a comparable paragenesis to the ore-bearing breccia. Due to similarities in lithologies and structural features, the Inter-lens is suggested to share a common genesis with the HWSZ, MSZ, and FWSZ. The different lithologies present in the Inter-lens and surrounding shear zones reflect the dominant metasedimentary protolith of these structures, compared to the dominant metaandesite protolith of the ore-bearing breccia.
Apatite from the paragenetically early apatite-calcite-quartz-garnet assemblage produce U–Pb ages of 1584 ± 22 Ma and 1587 ± 22 Ma, providing evidence to suggest the formation of this assemblage, and the formation of the Inter-lens is coeval with peak metamorphic conditions and regional D2 deformation of the Isan Orogeny.
REE-depletion trends in metasomatized apatite record: (1) depletion in LREEs and (2) systematic depletion in REEs, accompanied by an increase in As. The interaction with an acidic, Cl-rich sedimentary brine is likely responsible for the selective LREE-depletion trend in BC22 apatite, while the interaction with a neutral/alkaline magmatic fluid with sufficient –SO4 systematically depleted REEs evenly, producing an enrichment in As in the BC10 apatite.
The presence, age, and paragenesis of the Inter-lens confirms for the first time a contribution from metamorphic (~1585 Ma) related fluids to the deposit, and suggests the breccia was likely formed as a result of competency contrasts between ductile metasedimentary rocks of the surrounding shear zones and the Inter-lens, against the brittle metavolcanic rocks that constitute the ore-bearing breccia.

Supplementary Materials

The following are available online at https://www.mdpi.com/2075-163X/8/9/405/s1, Figure S1: Individual geochronology results of altered and unaltered apatite, Table S1: LA-ICP-MS parameters used in this study, Table S2: Apatite LA-ICP-MS U–Pb isotopic composition of altered and unaltered BC10 and BC22 samples.

Author Contributions

B.W.C. performed analytical work and data processing under the guidance of S.G. and J.G. S.G. provided apatite U–Pb geochronology standards. R.L. devised and supervised the project, acquired funding and contributed deposit information. B.W.C. wrote the paper, with contributions from all other authors.

Funding

This research was funded by the Mount Isa Mines—University of Adelaide Embedded Researcher Project 2015-2018]. S.G. and J.G. are supported by an Australian Research Council Discovery project (DP150101730).

Acknowledgments

I would like to thank the team from Ernest Henry Mining, including Brad Miller, Chloe Hawtin, Dan Ashton, Jack Gurney and Vanessa Sexton for their generosity during fieldwork and for providing feedback to this work. I would like to thank Mount Isa Mines for project funding this project and providing additional logistical assistance during fieldwork. Furthermore, thanks to Dave Kelsey and Sarah Gilbert from Adelaide Microscopy for assisting with technical work and the use of various analytical methods. I would also like to thank George Case and the three anonymous reviewers whose edits greatly improved the quality of this article.

Conflicts of Interest

The authors declare no conflict of interest. The project sponsors approve publication of the manuscript.

References

  1. Lilly, R.; Case, G.; Miller, B. Ernest Henry iron oxide copper-gold deposit. Aust. Ore Depos. 2017, 6, 1–6. [Google Scholar]
  2. Foster, A.R.; Williams, P.J.; Ryan, C.G. Distribution of gold in hypogene ore at the Ernest Henry iron oxide copper-gold deposit, Cloncurry district, NW Queensland. Explor. Min. Geol. 2007, 16, 125–143. [Google Scholar] [CrossRef]
  3. Twyerould, S.C. The Geology and Genesis of the Ernest Henry Fe-Cu-Au Deposit, NW Queensland, Australia. Unpublished Ph.D. Thesis, 1997. [Google Scholar]
  4. Mark, G.; Oliver, N.H.S.; Williams, P.J. Mineralogical and chemical evolution of the Ernest Henry Fe oxide–Cu–Au ore system, Cloncurry district, northwest Queensland, Australia. Miner. Depos. 2006, 40, 769–801. [Google Scholar] [CrossRef]
  5. Rusk, B.; Oliver, N.; Cleverley, J.; Blenkinsop, T.; Zhang, D.; Williams, P.; Habermann, P. Physical and chemical characteristics of the Ernest Henry iron oxide copper gold deposit, Australia. In Implications for IOGC Genesis; PGC Publishing: Adelaide, Australia, 2010; ISBN 0987119605. [Google Scholar]
  6. Oliver, N.H.S.; Rubenach, M.J.; Fu, B.; Baker, T.; Blenkinsop, T.G.; Cleverley, J.S.; Marshall, L.J.; Ridd, P.J. Granite-related overpressure and volatile release in the mid crust: Fluidized breccias from the Cloncurry District, Australia. Geofluids 2006, 6, 346–358. [Google Scholar] [CrossRef]
  7. Raymond, O.L.; Liu, S.; Gallagher, R.; Zhang, W.; Highet, L.M. Surface Geology of Australia 1:1 million scale dataset 2012 edition. Geosci. Aust. 2012. Available online: https://data.gov.au/dataset/surface-geology-of-australia-1-1-million-scale-dataset-2012-edition (accessed on 13 September 2018).
  8. Liu, W.; Zhang, J.; Sun, T.; Wang, J. Application of apatite U–Pb and fission-track double dating to determine the preservation potential of magnetite–apatite deposits in the Luzong and Ningwu volcanic basins, eastern China. J. Geochem. Explor. 2014, 138, 22–32. [Google Scholar] [CrossRef]
  9. Huang, Q.; Kamenetsky, V.S.; Ehrig, K.; McPhie, J.; Kamenetsky, M.; Cross, K.; Meffre, S.; Agangi, A.; Chambefort, I.; Direen, N.G. Olivine-phyric basalt in the Mesoproterozoic Gawler silicic large igneous province, South Australia: Examples at the Olympic Dam Iron Oxide Cu–U–Au–Ag deposit and other localities. Precambrian Res. 2016, 281, 185–199. [Google Scholar] [CrossRef]
  10. Chew, D.M.; Sylvester, P.J.; Tubrett, M.N. U–Pb and Th–Pb dating of apatite by LA-ICPMS. Chem. Geol. 2011, 280, 200–216. [Google Scholar] [CrossRef] [Green Version]
  11. Chew, D.M.; Petrus, J.A.; Kamber, B.S. U–Pb LA–ICPMS dating using accessory mineral standards with variable common Pb. Chem. Geol. 2014, 363, 185–199. [Google Scholar] [CrossRef] [Green Version]
  12. Glorie, S.; Agostino, K.; Dutch, R.; Pawley, M.; Hall, J.; Danišík, M.; Evans, N.J.; Collins, A.S. Thermal history and differential exhumation across the Eastern Musgrave Province, South Australia: Insights from low-temperature thermochronology. Tectonophysics 2017, 703, 23–41. [Google Scholar] [CrossRef]
  13. Jepson, G.; Glorie, S.; Konopelko, D.; Gillespie, J.; Danišík, M.; Evans, N.J.; Mamadjanov, Y.; Collins, A.S. Thermochronological insights into the structural contact between the Tian Shan and Pamirs, Tajikistan. Terra Nov. 2018, 30, 95–104. [Google Scholar] [CrossRef]
  14. Glorie, S.; Alexandrov, I.; Nixon, A.; Jepson, G.; Gillespie, J.; Jahn, B.-M. Thermal and exhumation history of Sakhalin Island (Russia) constrained by apatite U-Pb and fission track thermochronology. J. Asian Earth Sci. 2017, 143, 326–342. [Google Scholar] [CrossRef]
  15. Harlov, D.E.; Andersson, U.B.; Förster, H.-J.; Nyström, J.O.; Dulski, P.; Broman, C. Apatite–monazite relations in the Kiirunavaara magnetite–apatite ore, northern Sweden. Chem. Geol. 2002, 191, 47–72. [Google Scholar] [CrossRef]
  16. Harlov, D.E.; Förster, H.-J. Fluid-induced nucleation of (Y+ REE)-phosphate minerals within apatite: Nature and experiment. Part II. Fluorapatite. Am. Mineral. 2004, 88, 1209–1229. [Google Scholar] [CrossRef]
  17. Harlov, D.E.; Wirth, R.; Förster, H.-J. An experimental study of dissolution–reprecipitation in fluorapatite: Fluid infiltration and the formation of monazite. Contrib. Mineral. Petrol. 2005, 150, 268–286. [Google Scholar] [CrossRef]
  18. Harlov, D.E. Apatite: A fingerprint for metasomatic processes. Elements 2015, 11, 171–176. [Google Scholar] [CrossRef]
  19. Foster, D.R.W.; Austin, J.R. The 1800–1610 Ma stratigraphic and magmatic history of the Eastern Succession, Mount Isa Inlier, and correlations with adjacent Paleoproterozoic terranes. Precambrian Res. 2008, 163, 7–30. [Google Scholar] [CrossRef]
  20. Mark, G.; Pollard, P.J.; Foster, D.R.W.; McNaughton, N.; Mustard, R.; Blenkinsop, T.G. Episodic syn-tectonic magmatism in the Eastern Succession, Mount Isa Block, Australia: Implications for the origin, derivation and tectonic setting of potassic ‘A-type’magmas. In Final Report, Total Systems Analysis of the Mt Isa Eastern Succession, Predictive Mineral Discovery CRC; Geoscience Australia: Canberra, Australia, 2005; pp. 51–74. Available online: https://researchonline.jcu.edu.au/633/2/I2_digital_report_final.pdf (accessed on 13 September 2018).
  21. Wyborn, L. Younger ca 1500 Ma granites of the Williams and Naraku Batholiths, Cloncurry district, eastern Mt Isa Inlier: Geochemistry, origin, metallogenic significance and exploration indicators*. Aust. J. Earth Sci. 1998, 45, 397–411. [Google Scholar] [CrossRef]
  22. Page, R.W.; Sun, S. Aspects of geochronology and crustal evolution in the Eastern Fold Belt, Mt Isa Inlier*. Aust. J. Earth Sci. 1998, 45, 343–361. [Google Scholar] [CrossRef]
  23. Betts, P.; Giles, D. The 1800–1100 Ma tectonic evolution of Australia. Precambrian Res. 2006, 144, 92–125. [Google Scholar] [CrossRef]
  24. Rubenach, M.; Foster, D.; Evins, P.; Blake, K.; Fanning, C. Age constraints on the tectonothermal evolution of the Selwyn Zone, Eastern Fold Belt, Mount Isa Inlier. Precambrian Res. 2008, 163, 81–107. [Google Scholar] [CrossRef]
  25. Rubenach, M.J. Relative timing of albitization and chlorine enrichment in biotite in Proterozoic schists, Snake Creek Anticline, Mount Isa Inlier, northeastern Australia. Can. Mineral. 2005, 43, 349–366. [Google Scholar] [CrossRef]
  26. Abu Sharib, A.S.A.A.; Sanislav, I.V. Polymetamorphism accompanied switching in horizontal shortening during Isan Orogeny: Example from the Eastern Fold Belt, Mount Isa Inlier, Australia. Tectonophysics 2013, 587, 146–167. [Google Scholar] [CrossRef]
  27. Page, R.; Bell, T. Isotopic and structural responses of granite to successive deformation and metamorphism. J. Geol. 1986, 94, 365–379. [Google Scholar] [CrossRef]
  28. Oliver, N.H.S.; Cleverley, J.S.; Mark, G.; Pollard, P.J.; Fu, B.; Marshall, L.J.; Rubenach, M.J.; Williams, P.J.; Baker, T. Modeling the role of sodic alteration in the genesis of Iron Oxide-Copper-Gold Deposits, Eastern Mount Isa Block, Australia. Econ. Geol. 2004, 99, 1145–1176. [Google Scholar] [CrossRef]
  29. Coward, M. Structural Controls on Ore Formation and Distribution at the Ernest Henry Cu–Au Deposit, NW Queensland. Honors Thesis, James Cook University, Townsville, Australia, 2001. [Google Scholar]
  30. Keys, D.L. Mechanical Localisation of Copper Deposits in the Mt Isa Inlier, North Queensland. Ph.D. Thesis, James Cook University, Townsville, Australia, 2008. [Google Scholar]
  31. Mark, G.; Crookes, R.A. Epigenetic alteration at the Ernest Henry Fe-oxide-(Cu-Au) deposit, Australia. Miner. Depos. Process. Process. Rotterdam Balkema 1999, 2, 185–188. [Google Scholar]
  32. De Jong, G.; Williams, P.J. Giant metasomatic system formed during exhumation of mid-crustal Proterozoic rocks in the vicinity of the Cloncurry Fault, northwest Queensland. Aust. J. Earth Sci. 1995, 42, 281–290. [Google Scholar] [CrossRef]
  33. Kendrick, M.A.; Mark, G.; Phillips, D. Mid-crustal fluid mixing in a Proterozoic Fe oxide–Cu–Au deposit, Ernest Henry, Australia: Evidence from Ar, Kr, Xe, Cl, Br, and I. Earth Planet. Sci. Lett. 2007, 256, 328–343. [Google Scholar] [CrossRef]
  34. Case, G.; Blenkinsop, T.; Chang, Z.; Huizenga, J.M.; Lilly, R.; McLellan, J. Delineating the structural controls on the genesis of iron oxide–Cu–Au deposits through implicit modelling: A case study from the E1 Group, Cloncurry District, Australia. Geol. Soc. Lond. Spec. Publ. 2017, 453. [Google Scholar] [CrossRef]
  35. Whitney, D.L.; Evans, B.W. Abbreviations for names of rock-forming minerals. Am. Mineral. 2010, 95, 185–187. [Google Scholar] [CrossRef]
  36. O’Brien, S. Structural and Mineralogical Controls on the Formation of the ‘Inter-lens’ at the Ernest Henry Deposit, Queensland. Honors Thesis, University of Adelaide, Adelaide, Australia, 2016. [Google Scholar]
  37. Paton, C.; Hellstrom, J.; Paul, B.; Woodhead, J.; Hergt, J. Iolite: Freeware for the visualisation and processing of mass spectrometric data. J. Anal. At. Spectrom. 2011, 26, 2508–2518. [Google Scholar] [CrossRef]
  38. Schoene, B.; Crowley, J.L.; Condon, D.J.; Schmitz, M.D.; Bowring, S.A. Reassessing the uranium decay constants for geochronology using ID-TIMS U.–Pb data. Geochim. Cosmochim. Acta 2006, 70, 426–445. [Google Scholar] [CrossRef]
  39. Vermeesch, P. IsoplotR: A free and open toolbox for geochronology. Geosci. Front. 2018. [Google Scholar] [CrossRef]
  40. Sun, S.-S.; McDonough, W. Chemical and isotopic systematics of oceanic basalts: Implications for mantle composition and processes. Geol. Soc. Lond. Spec. Publ. 1989, 42, 313–345. [Google Scholar] [CrossRef]
  41. Duncan, R.J.; Stein, H.J.; Evans, K.A.; Hitzman, M.W.; Nelson, E.P.; Kirwin, D.J. A new geochronological framework for mineralization and alteration in the Selwyn-Mount Dore corridor, Eastern fold belt, Mount Isa inlier, Australia: Genetic implications for iron oxide copper-gold deposits. Econ. Geol. 2011, 106, 169–192. [Google Scholar] [CrossRef]
  42. Gauthier, L.; Hall, G.; Stein, H.; Schaltegger, U. The Osborne deposit, Cloncurry district: A 1595 Ma Cu-Au skarn deposit. Contrib. Econ. Geol. Res. Unit 2001, 59, 58–59. [Google Scholar]
  43. Stacey, J.S.; Kramers, J.D. Approximation of terrestrial lead isotope evolution by a two-stage model. Earth Planet. Sci. Lett. 1975, 26, 207–221. [Google Scholar] [CrossRef]
  44. Kirkland, C.L.; Hollis, J.; Danišík, M.; Petersen, J.; Evans, N.J.; McDonald, B.J. Apatite and titanite from the Karrat Group, Greenland; implications for charting the thermal evolution of crust from the U-Pb geochronology of common Pb bearing phases. Precambrian Res. 2017, 300, 107–120. [Google Scholar] [CrossRef]
  45. Rubenach, M.J.; Barker, A.J. Metamorphic and metasomatic evolution of the Snake Creek Anticline, Eastern Succession, Mt Isa Inlier. Aust. J. Earth Sci. 1998, 45, 363–372. [Google Scholar] [CrossRef]
  46. Gunton, C.G. A Study of Molybdenum at the Ernest Henry Cu-Au deposit, Northwest Queensland. Honors Thesis, Australian National University, Acton, Australian Capital Territory, Australia, 1999. [Google Scholar]
  47. Perkins, C.; Wyborn, L.A.I. Age of Cu-Au mineralisation, Cloncurry district, eastern Mt Isa Inlier, Queensland, as determined by 40Ar/39Ar dating. Aust. J. Earth Sci. 1998, 45, 233–246. [Google Scholar] [CrossRef]
  48. Mark, G.; Williams, P.J.; Oliver, N.H.S.; Ryan, C.; Mernagh, T. Fluid inclusion and stable isotope geochemistry of the Ernest Henry Fe oxide-Cu-Au deposit, Queensland, Australia. In Mineral Deposit Research: Meeting the Global Challenge; Springer: Beijing, China 2005; pp. 785–788. [Google Scholar]
  49. Putnis, A. Mineral replacement reactions. Rev. Mineral. Geochem. 2009, 70, 87–124. [Google Scholar] [CrossRef]
  50. Harlov, D.E.; Forster, H.-J.; Nijland, T.G. Fluid-induced nucleation of (Y+ REE)-phosphate minerals within apatite: Nature and experiment. Part, I. Chlorapatite. Am. Mineral. 2002, 87, 245–261. [Google Scholar] [CrossRef]
  51. Henrichs, I.A.; O’Sullivan, G.; Chew, D.M.; Mark, C.; Babechuk, M.G.; McKenna, C.; Emo, R. The trace element and U-Pb systematics of metamorphic apatite. Chem. Geol. 2018, 483, 218–238. [Google Scholar] [CrossRef]
  52. Broom-Fendley, S.; Styles, M.T.; Appleton, J.D.; Gunn, G.; Wall, F. Evidence for dissolution-reprecipitation of apatite and preferential LREE mobility in carbonatite-derived late-stage hydrothermal processes. Am. Mineral. 2016, 101, 596–611. [Google Scholar] [CrossRef]
  53. Krneta, S.; Ciobanu, C.L.; Cook, N.J.; Ehrig, K.; Kontonikas-Charos, A. Rare earth element behaviour in apatite from the Olympic Dam Cu–U.–Au–Ag Deposit, South Australia. Minerals 2017, 7, 135. [Google Scholar] [CrossRef]
  54. Krneta, S.; Cook, N.J.; Ciobanu, C.L.; Ehrig, K.; Kontonikas-Charos, A. The Wirrda Well and Acropolis prospects, Gawler Craton, South Australia: Insights into evolving fluid conditions through apatite chemistry. J. Geochem. Explor. 2017, 181, 276–291. [Google Scholar] [CrossRef]
  55. Migdisov, A.; Williams-Jones, A.E.; Brugger, J.; Caporuscio, F.A. Hydrothermal transport, deposition, and fractionation of the REE: Experimental data and thermodynamic calculations. Chem. Geol. 2016, 439, 13–42. [Google Scholar] [CrossRef]
  56. Liu, Q.; Maroto-Valer, M.M. Investigation of the effect of brine composition and pH buffer on CO2-brine sequestration. Energy Procedia 2011, 4, 4503–4507. [Google Scholar] [CrossRef]
  57. Kreiner, D.C.; Barton, M.D. Sulfur-poor intense acid hydrothermal alteration: A distinctive hydrothermal environment. Ore Geol. Rev. 2017, 88, 174–187. [Google Scholar] [CrossRef]
  58. Ballantyne, J.M.; Moore, J.N. Arsenic geochemistry in geothermal systems. Geochim. Cosmochim. Acta 1988, 52, 475–483. [Google Scholar] [CrossRef]
  59. Pokrovski, G.S.; Kara, S.; Roux, J. Stability and solubility of arsenopyrite, FeAsS, in crustal fluids. Geochim. Cosmochim. Acta 2002, 66, 2361–2378. [Google Scholar] [CrossRef] [Green Version]
  60. Liu, W.; Mei, Y.; Etschmann, B.; Brugger, J.; Pearce, M.; Ryan, C.G.; Borg, S.; Wykes, J.; Kappen, P.; Paterson, D. Arsenic in hydrothermal apatite: Oxidation state, mechanism of uptake, and comparison between experiments and nature. Geochim. Cosmochim. Acta 2017, 196, 144–159. [Google Scholar] [CrossRef] [Green Version]
  61. Fuss, M. Strontium and Stable C and O Isotopic Composition of Carbonates in the Ernest Henry Deposit, Queensland, Australia: Implications for Genesis and Exploration. Honors Thesis, James Cook University, Townsville, Australia, 2014. [Google Scholar]
  62. Oliver, N.H.S.; Butera, K.M.; Rubenach, M.J.; Marshall, L.J.; Cleverley, J.S.; Mark, G.; Tullemans, F.; Esser, D. The protracted hydrothermal evolution of the Mount Isa Eastern Succession: A review and tectonic implications. Precambrian Res. 2008, 163, 108–130. [Google Scholar] [CrossRef]
Figure 1. (a) The location of the Mount Isa Inlier relative to Australia; (b) The location of the Eastern Succession within the Mount Isa Inlier; (c) A simplified geological map of the Eastern Succession, modified from Raymond et al. [7].
Minerals 08 00405 g001
Figure 2. (a) Local geology of the Ernest Henry IOCG deposit. Image facing east. Displays the location of level 1475, where samples for this study were collected. (b) Top-down view of the local geology of Ernest Henry. Images modified from Ernest Henry Mining section.
Minerals 08 00405 g002
Figure 3. The lithology and assay data of Cu, Au, S, As, and P from drill core EH859 and EH864. As the Inter-lens is intersected, there is a large increase in P, no significant change in Fe, and a decrease in Cu, Au, S, and As concentrations. A map of the drill core locations is provided, displaying the location of samples BC10 and BC22 used for U–Pb geochronology and trace element analysis.
Minerals 08 00405 g003
Figure 4. A 3D model depicting the extent of the Inter-lens. The Inter-lens is represented in grey, the 0.7% Cu grade shell is shown in red, and the open pit is shown in blue. Modelling shows a structure running parallel to mineralization, and trending in a moderately south to southeast direction. (Image courtesy of Chloe Hawtin, Ernest Henry Mining).
Minerals 08 00405 g004
Figure 5. Mineralogy of the Inter-lens: (a) Porphyritic metavolcanic host rock possessing albite (Ab) phenocrysts; (b) XPL photomicrograph of fine-grained calcite (Cal) and Quartz (Qz) with minor apatite (Ap) displaying a quartzite texture; (c) PPL photomicrograph of fine-grained biotite-rich schist interlayered with a calcite and quartz-rich lithology; (d) XPL photomicrograph of an albitized metaandesite breccia clast; (e) Coarse-grained apatite-calcite-quartz vein surrounded by paragenetically later biotite (Bt) and magnetite (Mag) with minor garnet (Grt), pyrite (Py), and chalcopyrite (Ccp); (f) Coarse-grained apatite-rich vein partially overprinted by subsequent biotite-magnetite alteration; (g) Angular to sub-angular apatite disseminated throughout a biotite-magnetite-rich matrix; (h) Coarse-grained banded garnet associated with biotite-magnetite alteration; (i) Intensely foliated biotite-magnetite alteration. Inset of the XPL photomicrograph shows non-foliated biotite on a microscopic scale. (j) XPL photomicrograph of coarse-grain K-feldspar (Kfs) forming in and around quartz, apatite, and magnetite; (k) PPL photomicrograph showing texturally destructive K-feldspar and hornblende (Hbl) altering a previous assemblage of apatite, quartz, and magnetite; (l) XPL photomicrograph of texturally destructive K-feldspar and hornblende altering a previous assemblage of calcite, apatite, and magnetite with a late overprinting pyrite grain; (m) RL photomicrograph of pyrite growing in and around paragenetically younger calcite and magnetite grains; (n) RL photomicrograph of pyrite growing in and around earlier K-feldspar, magnetite, and calcite. Minor chalcopyrite (Ccp) replaces magnetite and also grows around K-feldspar; (o) RL photomicrograph of coarse-grained chalcopyrite replacing magnetite and pyrite, while growing in and around calcite; (p) Stage 2 magnetite, pyrite and chalcopyrite-rich breccia dominated by a groundmass of calcite and quartz; (q) PPL photomicrograph of intense chlorite (Chl) alteration of biotite; (r) PPL photomicrograph showing sericite (Ser) alteration of apatite, quartz, calcite, and magnetite. (XPL = cross-polarized light; PPL = plane-polarized light; RL = reflected light). Mineral abbreviations follow Whitney and Evans [35].
Minerals 08 00405 g005aMinerals 08 00405 g005b
Figure 6. Paragenesis of the Inter-lens. Early albitization is followed by the apatite-calcite-quartz-garnet assemblage, biotite-magnetite ± garnet alteration, K-feldspar ± hornblende alteration, Ore-Stage Cu-mineralization, Post-Ore calcite ± quartz veining, and chlorite/sericite alteration.
Minerals 08 00405 g006
Figure 7. Poles to S2 mineral foliations measured in the Inter-lens on level 1500 (green triangles) and 1525 (crosses) from O’Brien [36]. The green dotted great circle represents the average foliation on level 1500, the solid black great circle represents the average foliation on level 1525. Measurements of magnetite-biotite foliation (black dots); biotite-magnetite-garnet foliation (pink squares), calcite veins (unfilled squares), and a chalcopyrite-bearing calcite vein (yellow star) from orientated drill-core that intersects the Inter-lens [35]. The clear solid outline represents the extent of S2 foliation measurements in the HWSZ and FWSZ recorded by Twyerould [1]. Areas within the blue dotted outline represent the extent of S2 mineral foliation measurements in the HWSZ and FWSZ recorded by Coward [29]. The Inter-lens possess a dominant southeast plunging foliation, consistent with the HWSZ and FWSZ.
Minerals 08 00405 g007
Figure 8. (a) Sample BC10 displaying coarse-grained apatite with fine-grained calcite, quartz, magnetite, and pyrite; (b) BS image of a coarse-grained apatite from the BC10 sample brecciated by a later assemblage of calcite, pyrite, and chalcopyrite with fine-grained Ap2 apatite; (c) BS image of a coarse-grained apatite rim from sample BC10 showing inclusions of biotite, pyrite, and calcite. CL images of (d) Figure 8b and; (e) Figure 8c. CL images highlight the difference in the homogeneous, light, coarse-grained apatite and the dark rims/Ap2 apatite; (f) Sample BC22 consisting of medium-grained apatite in a matrix of quartz, calcite, magnetite and biotite with minor sulphides; (g) BS image of apatite from the BC22 sample enveloped by the later growth of pyrite, with surrounding quartz and calcite; (h) BS image of apatite from sample BC22 surrounded by paragenetically later calcite, quartz, biotite, and magnetite. CL images of (i) Figure 8g and (j) Figure 8h highlighting the vuggy textures and irregular zonation depicted by dark and light zones.
Minerals 08 00405 g008
Figure 9. Terra–Wasserburg plot of samples: (a) BC10 and; (b) BC22. Ovals represent the 2 σ error associated with each analysis. The lower intercept on Terra–Wasserburg plots represent the estimated age of each sample, and the upper intercept represents the common Pb (207Pb/206Pb) estimate. Chondrite-normalized REE profiles for samples (c) BC10 and (d) BC22. Samples were normalized to Sun and McDonough [40]. BC10b samples are systematically depleted in all REEs compared to the BC10a samples. BC22b samples show a selective depletion in LREEs compared with HREEs, while BC22a samples possess a LREE enriched profile. Dotted lines on the REE plots represent the median value of the samples, while the shaded regions represent the minimum and maximum values.
Minerals 08 00405 g009
Figure 10. Elemental maps produced across the altered (BC10b) rim to the unaltered (BC10a) core from sample BC10. The BS image of the sample is shown on the top left. The apatite’s core is relatively enriched in LREEs and HREEs. 238U and 206Pb is consistent across the unaltered core and altered rim. As is significantly enriched in the altered rim of the grain, while Th is significantly depleted. All concentrations are in ppm.
Minerals 08 00405 g010
Figure 11. A re-examined formation model for the Ernest Henry IOCG deposit. (a) D2 deformation accompanied by peak metamorphic conditions resulted in brecciation of competent metavolcanic rocks and shearing of the metasedimentary rocks. This stage is coeval with the timing of apatite-calcite-quartz-garnet veining and alteration. (b) Subsequent K-feldspar alteration preferentially affected the felsic volcanics, while biotite-magnetite alteration preferentially affected metasedimentary and intermediate volcanic units. (c) The introduction of multiple fluids, alongside D3 deformation resulted in further hydrofracking of the breccia, and the precipitation of Cu-Au mineralization. (d) D4 deformation allowed fluids to penetrate pre-weakened structures, such as contact zones between the breccia and the Inter-lens, producing the calcite-rich Stage 2 breccia. Abbreviations follow Whitney and Evans [35]. Cal—Calcite, Ap—Apatite, Grt—Garnet, Qz—Quartz, Bt—Biotite, Mag—Magnetite, Ccp—Chalcopyrite.
Minerals 08 00405 g011
Table 1. Apatite LA-ICP-MS trace element data.
All Measurements Are in ppmLa Ce Pr Nd Sm Eu Gd Tb Dy YHo Er Tm YbLu Th238U
BC10aHigh11801315111.241175.621.992.713.1273.942414.8837.84.6527.14.0457.48.00
Median336.4553754.65239.8549.5513.4358.558.0545.85273.39.30523.062.9717.282.4718.94.47
Low143.623122.910122.9726.13.3322.1127.64.079.81.176.51.030.791.09
BC10bHigh252.440539.8180.342.112.5954.88.0446.6268.59.2223.532.6715.842.235.085.82
Median185.5303.831.48143.130.659.8340.15.6632.75195.756.6516.471.9911.451.591.213.33
Low34.2575.524.65.52.359.11.268.8681.865.80.645.00.70.260.64
BC22aHigh1005104375255.838.510.2564.410.8674.145515.8341.35.2130.934.3339.77.11
Median662.5752.558.25206.736.38.7548.757.4648.1308.8510.1627.1053.5321.583.232.26.73
Low183251.322.96102.531.77.7142.26.337244.37.8921.062.7417.32.615.74.80
BC22bHigh77.9115.412.1366.125.48.9555.910.4270412.914.9638.34.8527.914.0637.35.76
Median12.1923.663.0118.98.833.1522.14.0928.21746.1215.911.910.731.482.020.74
Low6.8914.811.9813.286.362.3316.292.9821.1128.54.4211.221.327.60.960.040.12

