1. Introduction
As the complexity of newly discovered and developed deposits is increasing, the concept of geometallurgy expands in new directions and faces new challenges, showing more possibilities within a holistic approach to mining. In order to understand and characterize the flow of information and material in the development of the link between in-situ raw material properties and mineral processing parameters, the authors introduce a new concept of geometallurgical flowsheets. Hence, this study presents and discusses the definition, design and development of geometallurgical flowsheets. Further, the use of the modified Integration Definition for Function Modeling (IDEF0) language is introduced as the choice of the modeling technique.
The main objectives of the present study are: (1) To define the concept of geometallurgical flowsheet as a tool to design, visualize, and communicate a geometallurgical program; (2) to clarify the geometallurgical model definition; (3) to show the relationships between the geometallurgical program, the geometallurgical flowsheet, the geometallurgical model and the mining value chain; and (4) to assess the usefulness of the IDEF0 technique in geometallurgical flowsheet design.
To illustrate the creation of a specific geometallurgical flowsheet, the authors present a case study from the Verdalskalk AS industrial mineral operation in mid-Norway. While the main contributions to the geometallurgical approach come from the metal ore mining industry [
1,
2,
3], it is important to ask the question about whether the geometallurgical approach can be broadened and therefore applied to industrial mineral operations. The challenge of linking processing performance with geological information, being the cornerstone of the geometallurgical approach, is also highly relevant in industrial mineral mining [
4,
5].
2. Background
2.1. Geometallurgy and Definitions
The concept of geometallurgy is already well defined and tested. Most sources define geometallurgy as an interdisciplinary view incorporating geology with metallurgy/mineral processing in order to increase mine performance and minimize risk values [
6,
7]. On a more detailed level, the definitions vary depending on the scope of the geometallurgical approach in the mine operations, as well as the predictability level of the defined geometallurgical models [
8].
A geometallurgical model is defined as “organization of geological and metallurgical information into a spatial and predictive tool to be used in production planning and management in the mining industry” [
2]. Several studies show the importance of creating a valid and effective geometallurgical model in order to fully benefit from the use of the geometallurgical approach in mining operations [
1,
9]. A successful geometallurgical model must be based on both geological/geochemical/mineralogical inputs and metallurgical tests [
10].
A geometallurgical program is often seen as an industrial application of geometallurgy that improves the understanding of the resource [
9]. Processes, such as sampling, data collection, establishing models and model validation, are an inherent part of the geometallurgical program [
2,
11].
The relationship between the geometallurgical model and the program is unclear in the literature. The model may be seen as a final outcome of the geometallurgical program [
2] or as the development taken prior to running the program [
9,
12].
2.2. Geometallurgy for Industrial Mineral Operations
The industrial mineral sector is mainly based on controlling product or concentrate qualities and specific customer requirements. Product prices are negotiated, often according to specific requirements from different customers. The prices are also typically kept confidential. The price primarily depends on the ability to compete in product quality (typically purity of concentrate), and thus competence and the ability to produce high quality specialized products for the high end market will increase prices, but also significantly increase operational costs. Hence, industrial mineral mining can be highly diverse and a geometallurgical approach is critical for expanding the knowledge of the commodity as well as maximizing the outputs, as reported by Aasly and Ellefmo [
4]. The two case studies presented in this paper show that the elements of geometallurgy have already been implemented in industrial minerals operations, but as yet no geometallurgical block model—in the traditional sense—has been established.
2.3. Verdalskalk AS Case Study
The industrial mineral company Verdalskalk AS is located in mid-Norway and mines a calcite marble deposit in an open pit operation. The deposit is a pure, low metamorphic calcite marble (CaCO
3) of the Ordovician period (approximately 460 Ma). The deposit is assumed to contain approximately 7.5 billion metric tons, having a length of 6 km and maximum width of about 2.2 km [
13]. Other phases present are graphite, iron oxides (limonite, hematite), sulfides (pyrite), and silicate minerals such as quartz, feldspar, and biotite [
14]. Verdalskalk AS divides the marble into qualities with respect to the amount of CaO, Fe
2O
3, SiO
2 and Al
2O
3. The qualities that are exploited are divided into: Pure, standard and cement quality (
Table 1). X-ray fluorescence (XRF) analysis is performed on drill cores during the pre-operational sampling campaign, as well as on drill chips prior to blasting and during production. The pure quality is used for quicklime and slaked lime production (Personal communication with Ruiz, J.R., 6 March 2015). Processing and geometallurgical development of the standard and cement qualities are beyond the scope of the presented research.
After blasting, the fragmented marble is loaded onto trucks and transported to the crushing plant. The rock used for the quicklime production is crushed and sized to 30–100 mm.
At the kiln facility, crushed pure quality marble is burnt in a two-shaft Maerz furnace in temperatures reaching 1000–1200 °C in the burning zone (Personal communication with Storli, A.M., 7 March 2015). The quicklime (CaO, burnt lime) is created via the reaction:
The burnt lime is processed to a variety of products of 0–0.2 mm to 0–40 mm particle size (Personal communication with Mork, H., 22 February 2018).
Lang, et al. [
16] proposed a series of proxies that can be used in a geometallurgical flowsheet at the mine site. Conclusions were made based on knowledge gained during fieldwork and laboratory work, as well as on literature study and personal communication:
The calcite burning response is a function of grain size and textures [
17]. As the quicklime key performance indicators (KPIs), which are CO
2 residue and CaO activity, depend on the burning performance, the indirect link between the mineralogical properties and the KPIs can be established.
Surface hardness rebound tests provide a proxy for the rock crushing and milling performance [
18].
Surface hardness can also be a representation of the mineralogical and textural (grain size) features [
19]. As mineralogical characterization under the microscope is time consuming and costly, the surface hardness tests were proposed as a proxy for the textural and mineralogical features of the rock.
Burning performance is a function of kiln feed particle size distribution [
17].
2.4. Integration Definition for Function Modeling (IDEF0)
The graphical presentation of either geometallurgical operations or ways to build a geometallurgical model has been presented in the literature before, for example by Keeney and Walters [
20], Sola and Harbort [
10], and Lund and Lamberg [
21]. However, in this study, the authors explored the idea of treating the graphical presentation as a tool to be used on site. A detailed presentation with consistent use of the modeling language IDEF0 is proposed.
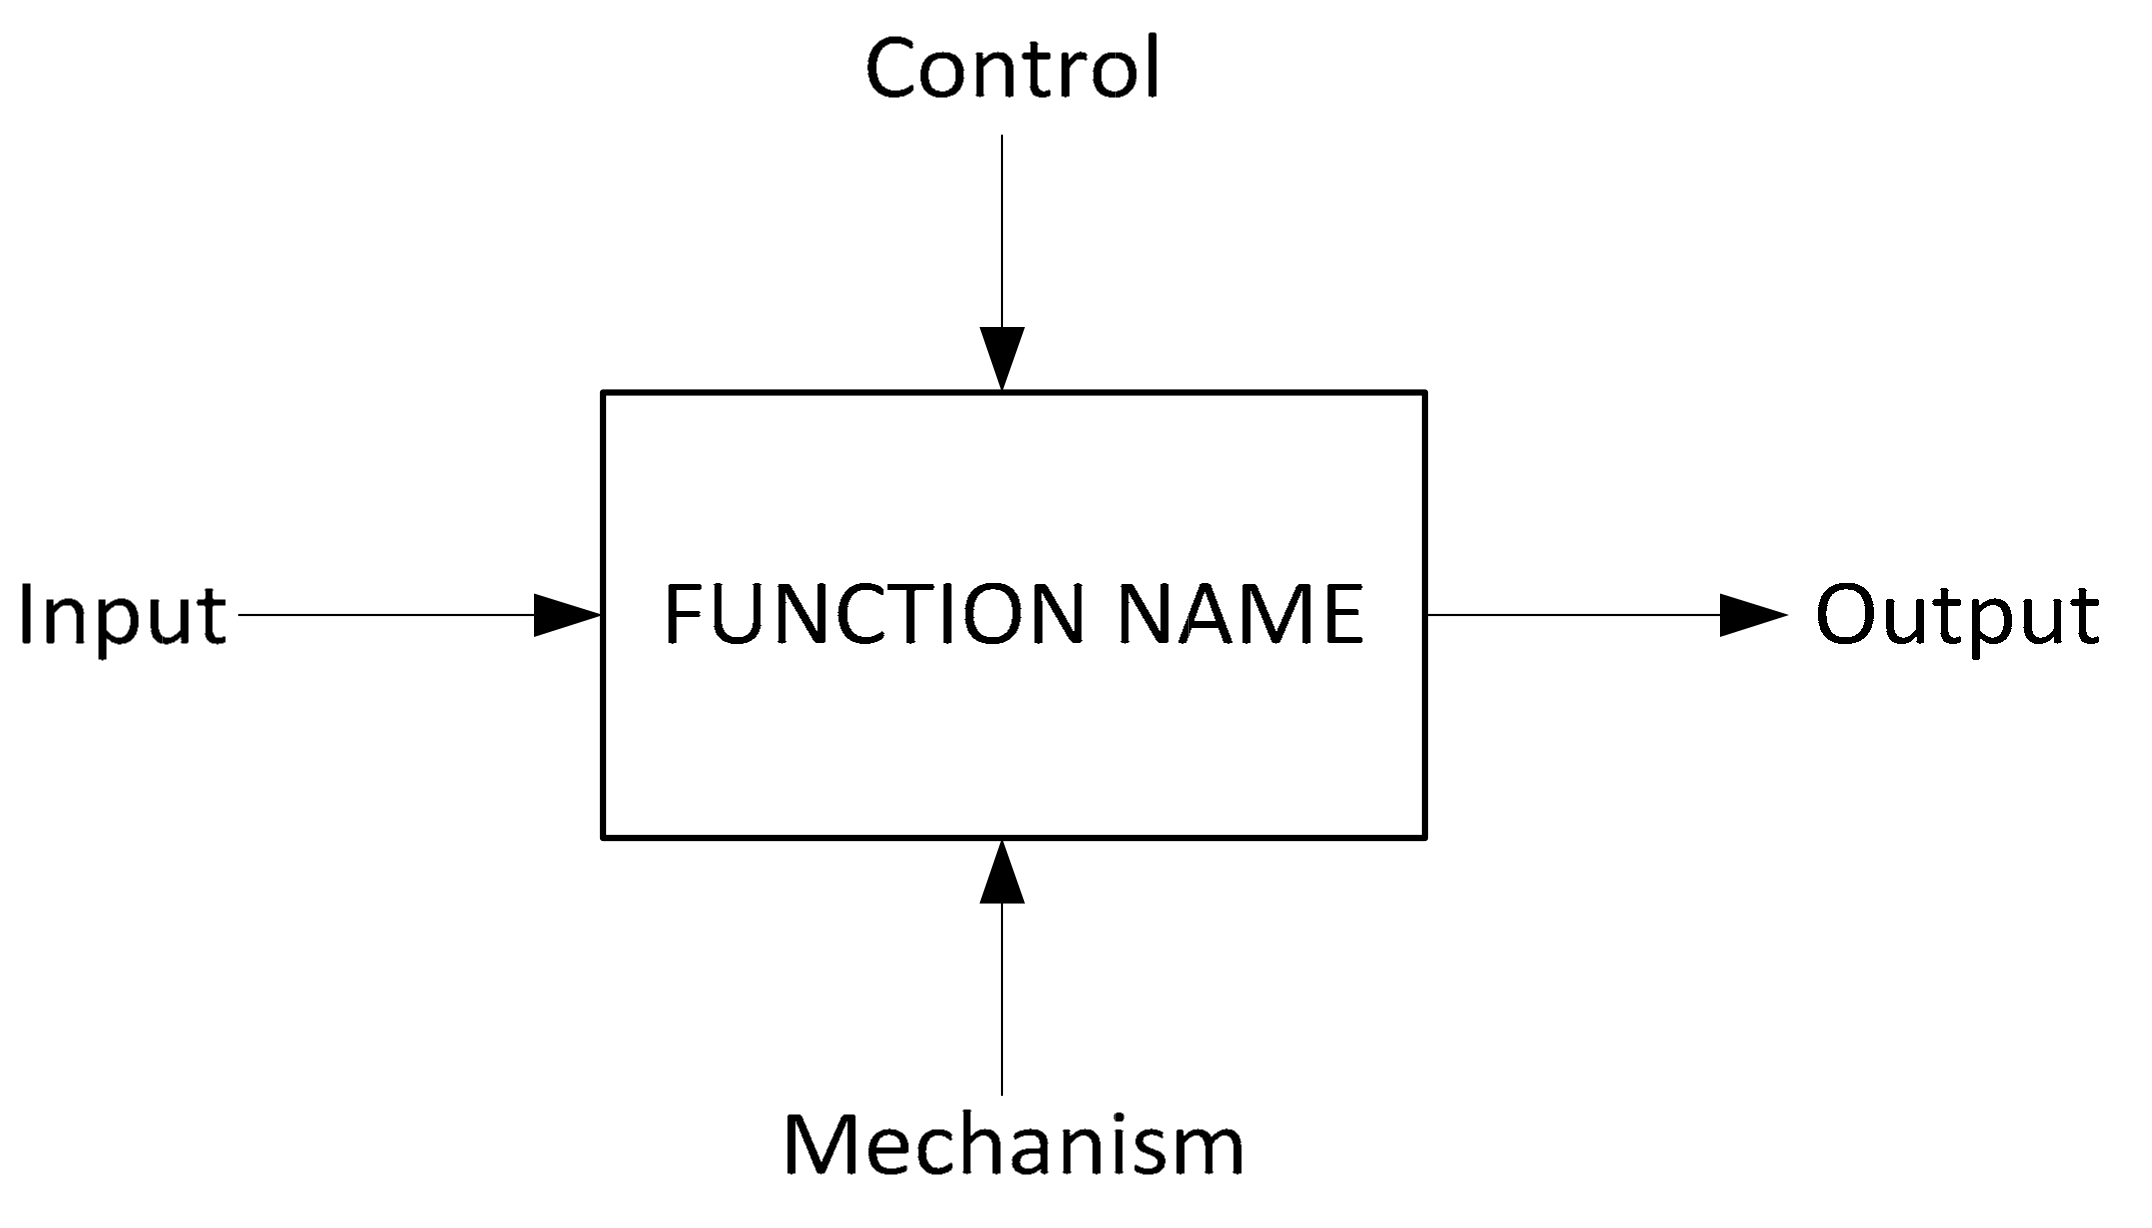
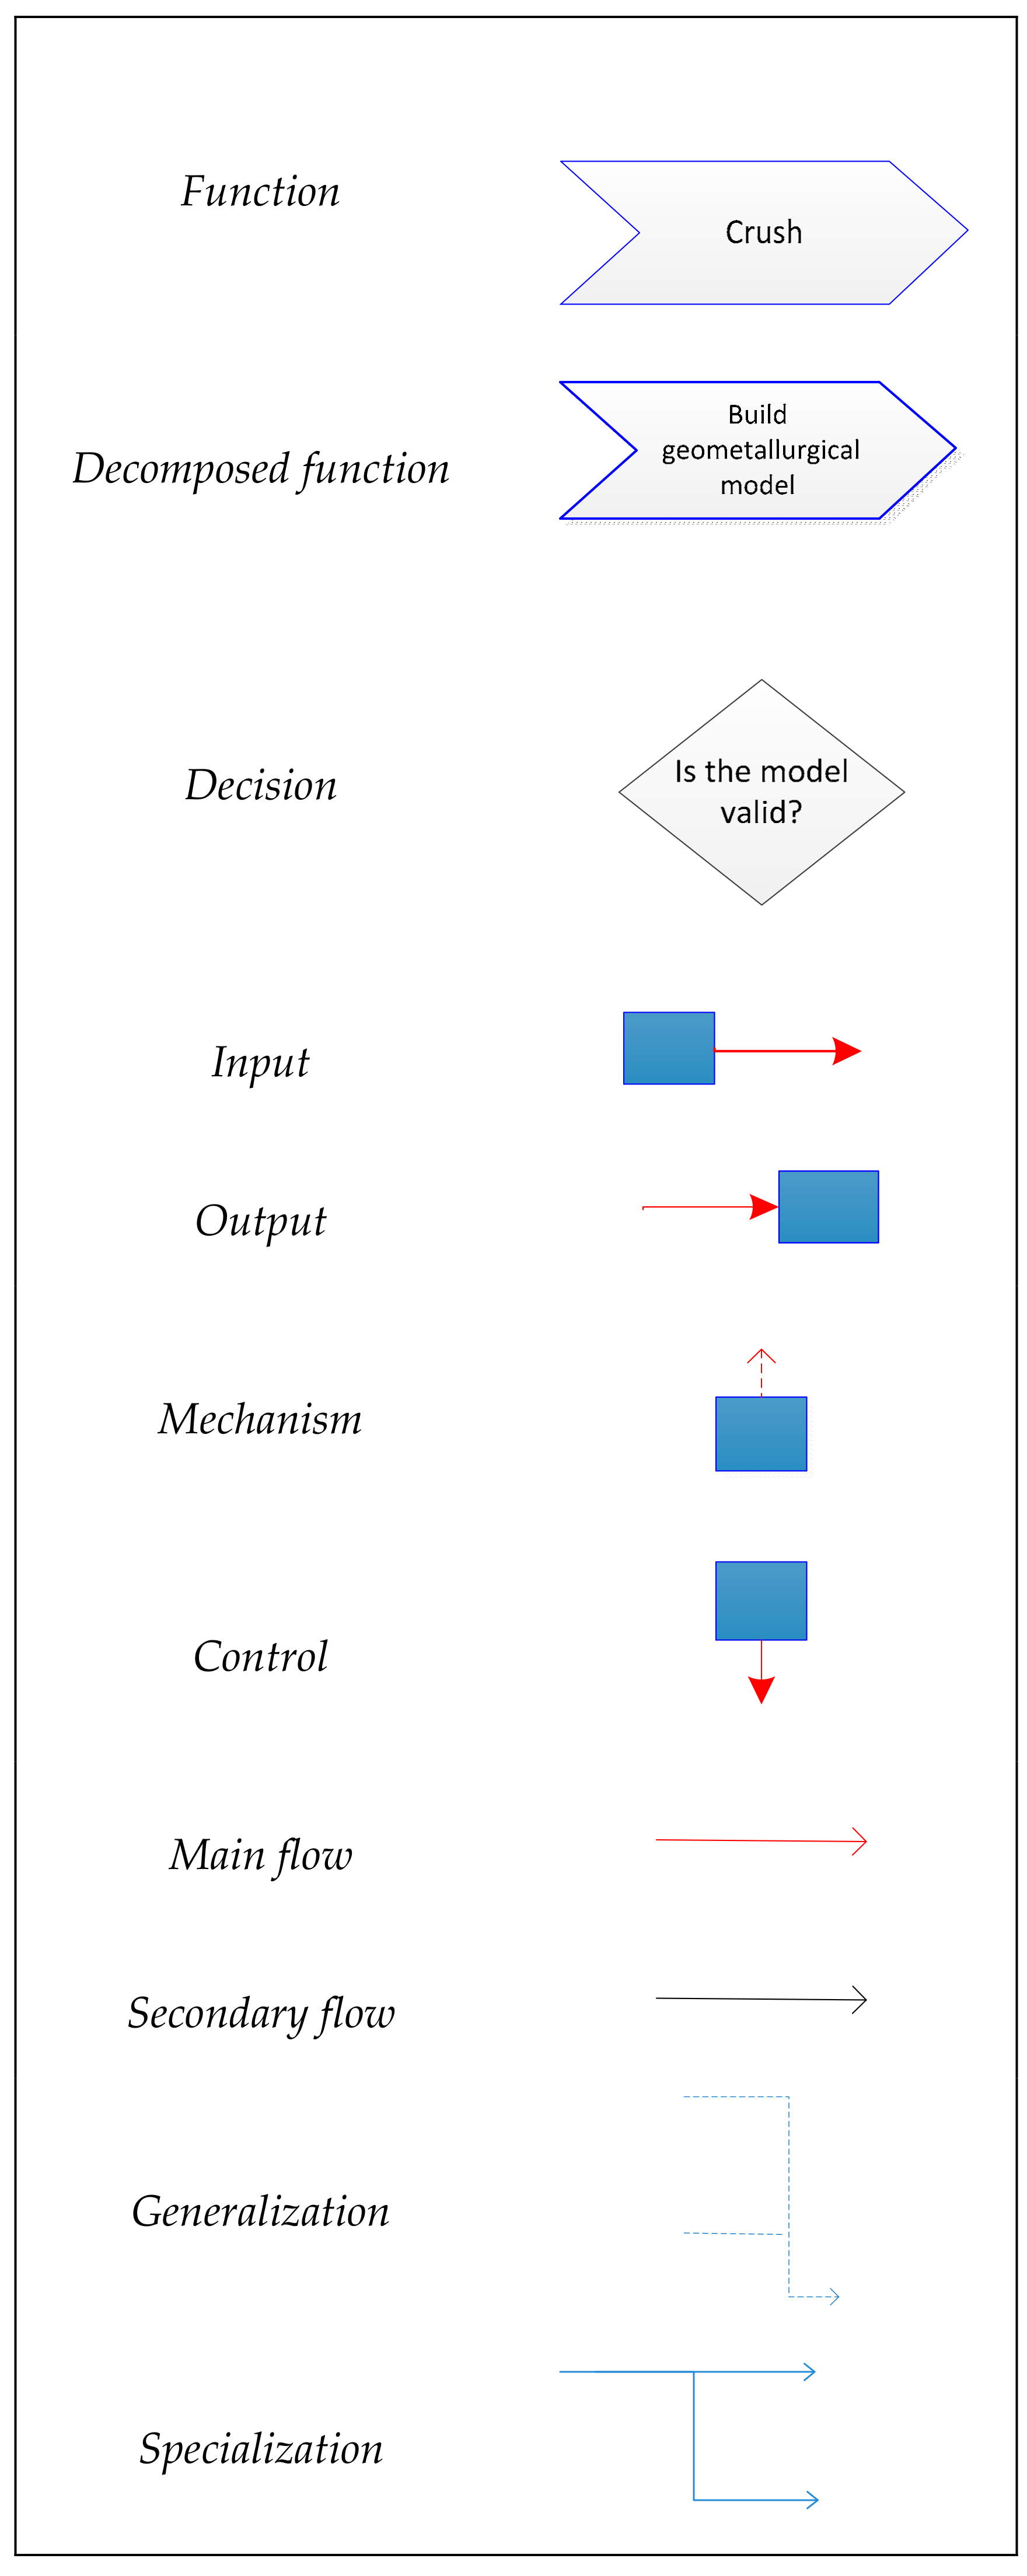
IDEF0 is a methodology designed to model the decisions, activities and actions within a system or a process using a combination of graphics and text. The methodology evolved from a well-established graphical language, the Structured Analysis and Design Technique (SADT). Two primary modelling components are functions that are represented on a diagram as boxes, and objects that belong to four main types of relations: inputs, controls, outputs and mechanisms—abbreviated as ICOMs. The ICOMs are linked to functions using arrows (
Figure 1). The functions can be processes, activities or actions. The IDEF0 methodology is simple and coherent, and provides a precise visualization of relationships and dependences within a modeled system using a fixed set of symbols. The methodology is applicable to, and recommended for, projects that require a modelling technique for the analysis, development or re-engineering of a system [
22].
3. Materials and Methods
The IDEF0 method used in this study for the geometallurgical flowsheet visualization is a modified version of the method originally proposed by Lund and Bilov-Olsen [
23]. The modifications are related to the appearance of the symbols used in the modeling (
Figure 2), and are based on a model developed by Industrial and Financial Systems [
24]. The functions are presented by white chevrons with a blue rim, and the ICOMs are shown as blue boxes.
Input boxes are linked to the left side of chevrons. Inputs examples are requirements, information, problems, material or conditions. The input is used, consumed, or altered by the function.
Controls are objects vital to produce an output, as they control the way the function is executed. The control boxes are linked to the top side of chevrons. Examples of controls are standards, regulations, plans, and conditions that have to be fulfilled.
Outputs, such as results, information or products, are created or come out of the function. The output boxes are linked to the right side of the chevron.
Mechanism boxes are placed below the chevron and connect to the bottom side of it. Mechanisms are used but not consumed, and they support the execution of the functions. Examples are human resources, tools, equipment, systems and facilities.
The relationships between functions and ICOMs are presented by lines in different colors and styles. It is therefore possible to distinguish between main flow, secondary flow, specializations and generalizations. The preferred flow direction between inputs and functions, and between functions and outputs, within the modelled system is from left to right. All of the symbols utilized in this study may be visualized in
Figure 2.
In the IDEF0 methodology, the functions can be decomposed into more detailed diagrams called child diagrams. In the model proposed for this study, the elements that are detailed are presented with shadows. Each IDEF0 diagram has an A-number. The top-level diagram is called A-0 diagram (A minus zero), and represents the major function of the system. It provides the most general description and scope. The next level diagram is A0. Lower level diagrams are numbered according to the function from which they started (A1, A11, etc.).
The flowsheet development was based on extensive fieldwork and literature study. The fieldwork comprised of data collection, interviews with employees and investigation of the data flow and data management within facilities. The different views on the graphic presentation were tested and developed within numerous meetings and discussions. For the creation of flowsheets, Microsoft Visio 2010 software (Microsoft Corporation, Redmond, WA, USA) was used.
The first step of the case specific geometallurgical program and model development is to define the parameters responsible for the mine’s KPIs and to outline the initial model. For the case of Verdalskalk AS, the main dependencies were hypothesized based on literature [
17,
18,
25], as well as the mine operators experience (Personal communication with Storli, A.M., 7 March 2015) and laboratory study detailed in Lang, Aasly and Ellefmo [
16].
4. Results
In the authors’ view, a geometallurgical flowsheet is a tool for designing, visualizing and communicating a geometallurgical program; that is, steps that need to be taken for the geometallurgical model development. According to this perspective, a geometallurgical program is a summary of the geometallurgical operations that, combined in a sequence, lead to the geometallurgical model’s establishment and implementation into mine operations.
Based on the available definition in the literature [
2], a geometallurgical model is defined as a function that links georeferenced in-situ geological characteristics and a georeferenced measure of performance in a processing plant, emphasizing the positioning of the geoscientific data. The dependency can either be quantitative, semi-quantitative or qualitative. The dependencies can take the following form:
where examples of performance measure are metal or mineral recovery, breakdown costs or product quality (e.g., purity), and examples of variables that influence the performance include the rock/ore chemistry, mineralogy or hardness. A qualitative dependency is a descriptive understanding of the relation between in-situ properties and the performance.
In the authors’ view, a geometallurgical model is the outcome of the implementation of a geometallurgical program that consists of the execution of a number of working processes.
The inconsistencies in the literature regarding the geometallurgical model to program relationship have been resolved using the term a priori model for the initial model that had existed as an idea before the geometallurgical program has been started. The a priori model can be viewed as a controlling element of the geometallurgical program development. An a priori model is seen by the authors as a list of dependencies between in-situ parameters and a metallurgic response that has to be hypothesized, and is based on operational experience, literature review and test-work. Through the execution of the geometallurgical program, geometallurgical test-work and characterization are performed to formulate the equations that describe the nature of the dependencies. Further, the preliminary coefficients used in the equations are determined and validated by iterating the geometallurgical program. The reconciliation of the coefficients by the use of production data is the next logical step and it is only at this point that the geometallurgical model is fully developed.
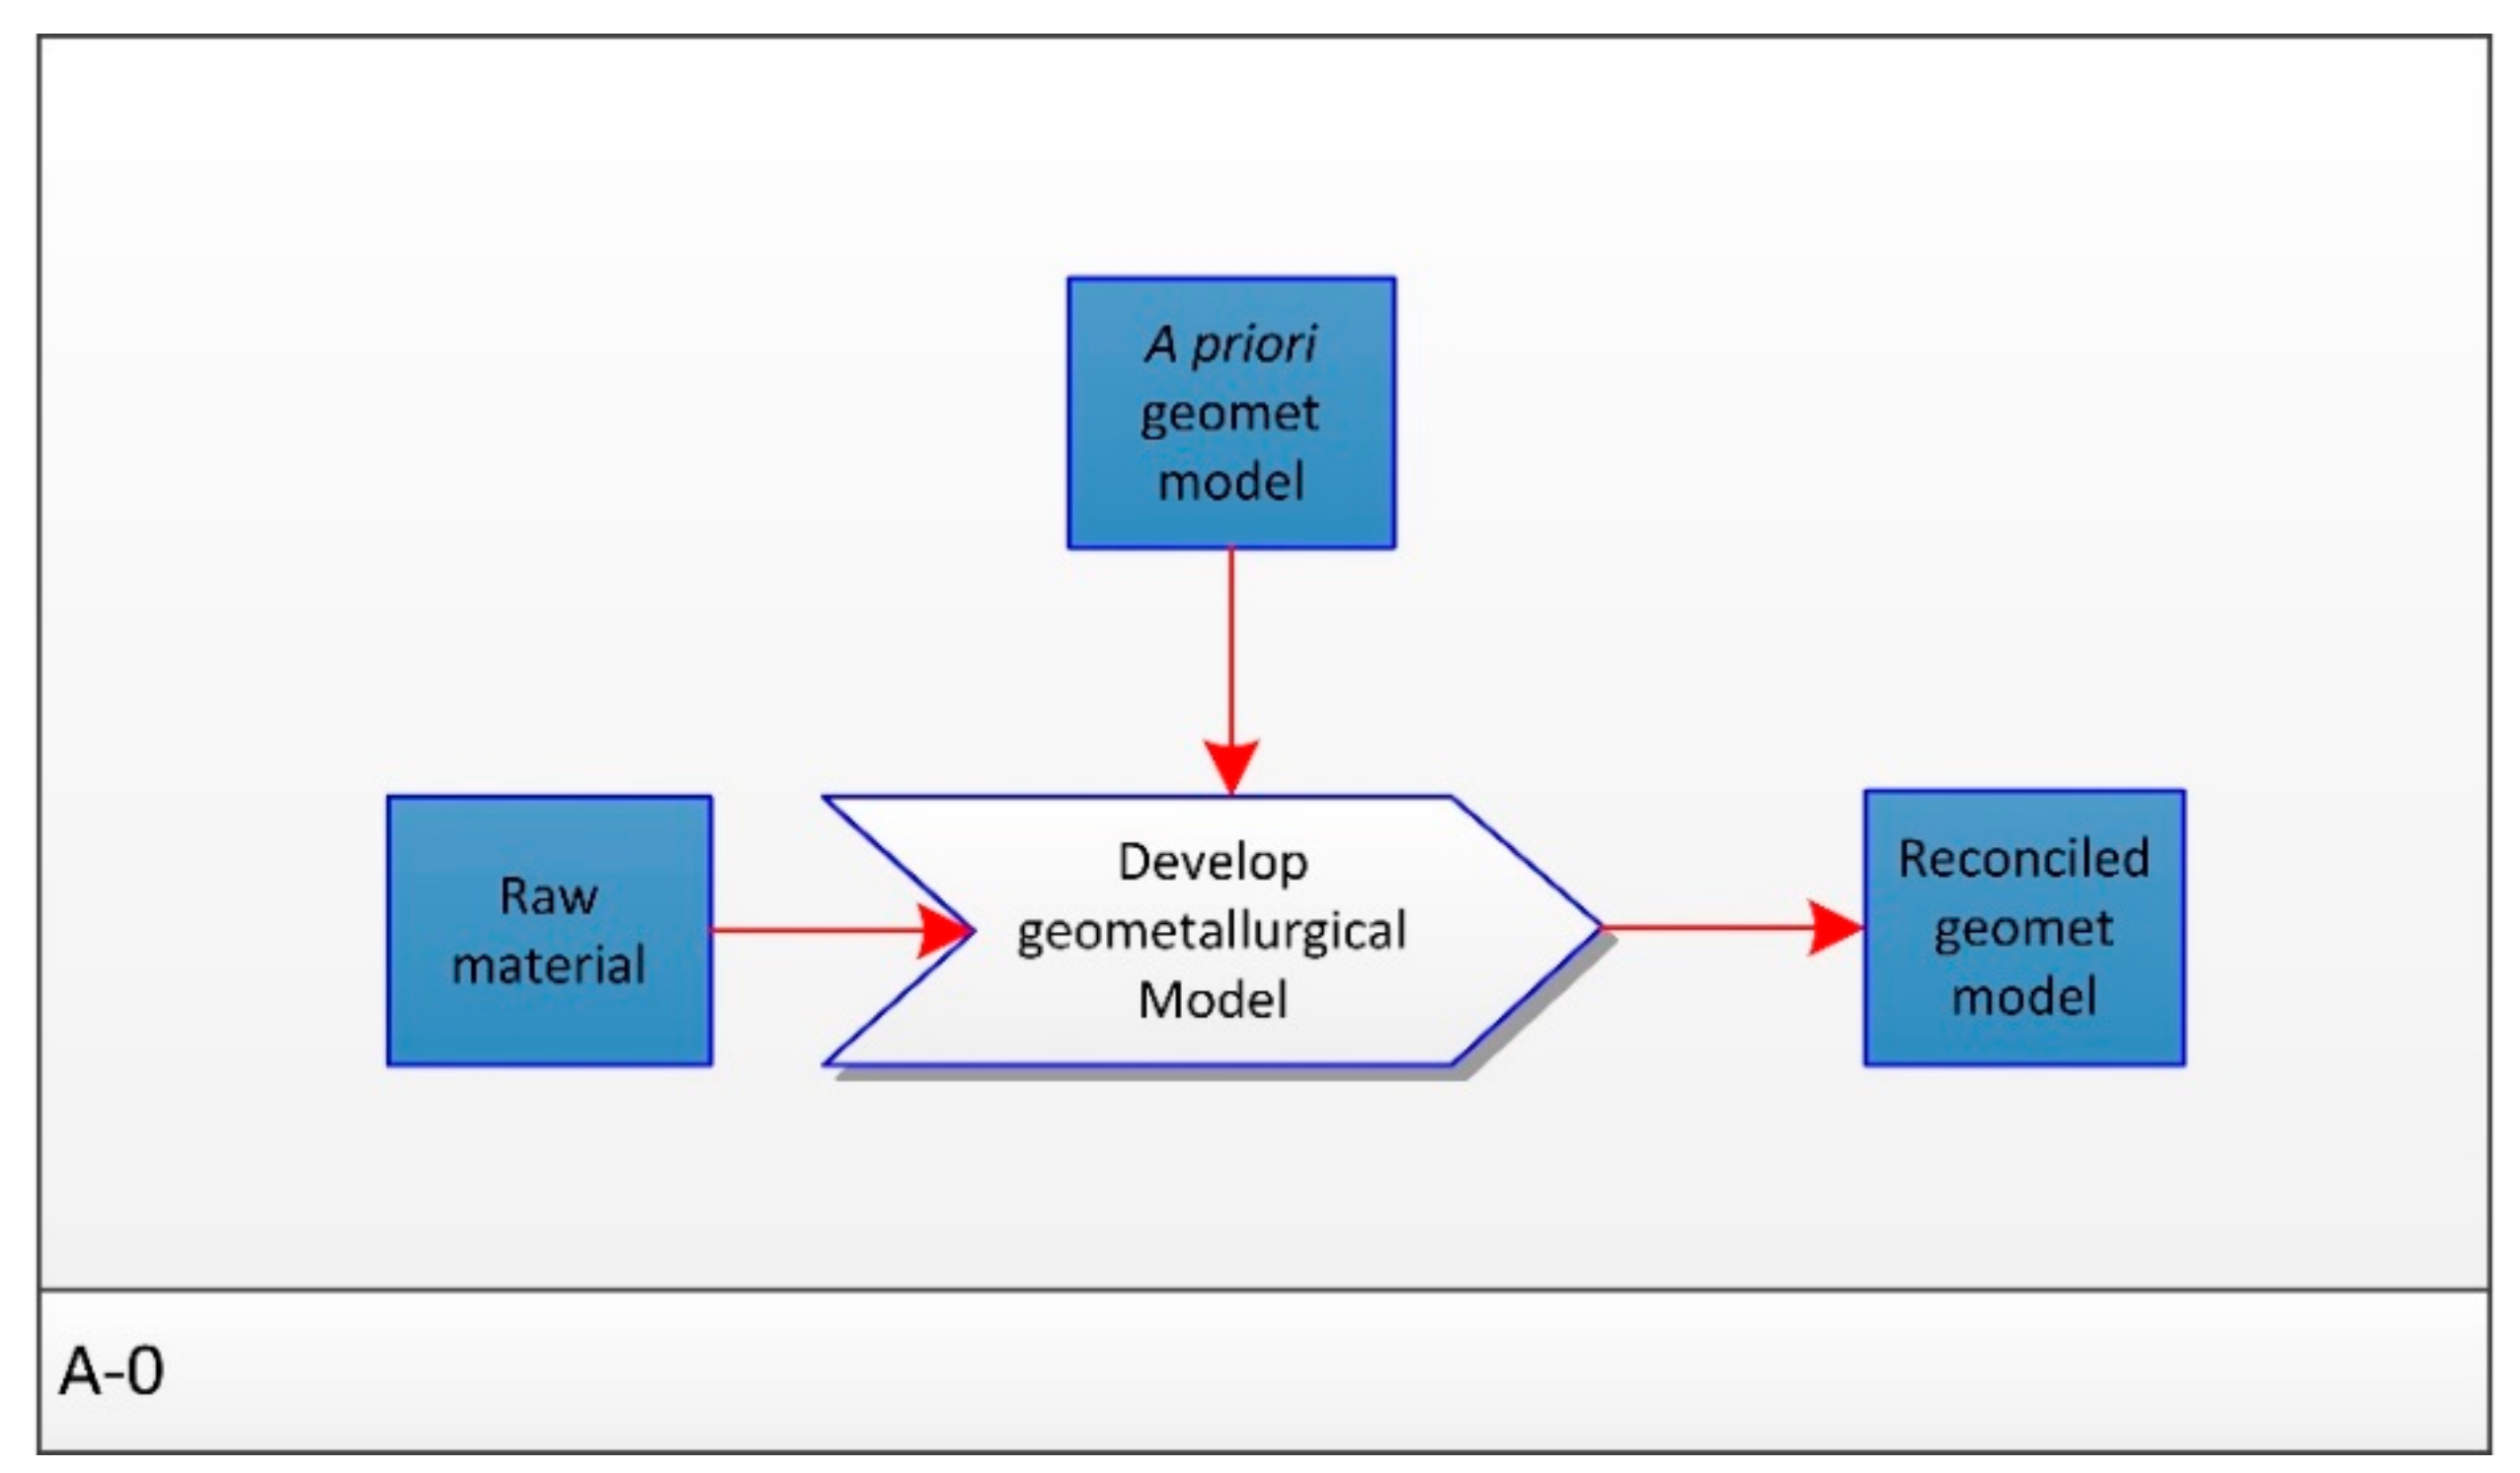
4.1. General Geometallurgical Flowsheet
Figure 3 shows the A-0 level geometallurgical flowsheet. The
a priori model serves as the control of the
Develop geometallurgical model process. The raw material has certain properties (mineral characteristics, processing behavior etc.). These properties are revealed and tested during the
Develop geometallurgical model process in order to develop the mathematically oriented geometallurgical model.
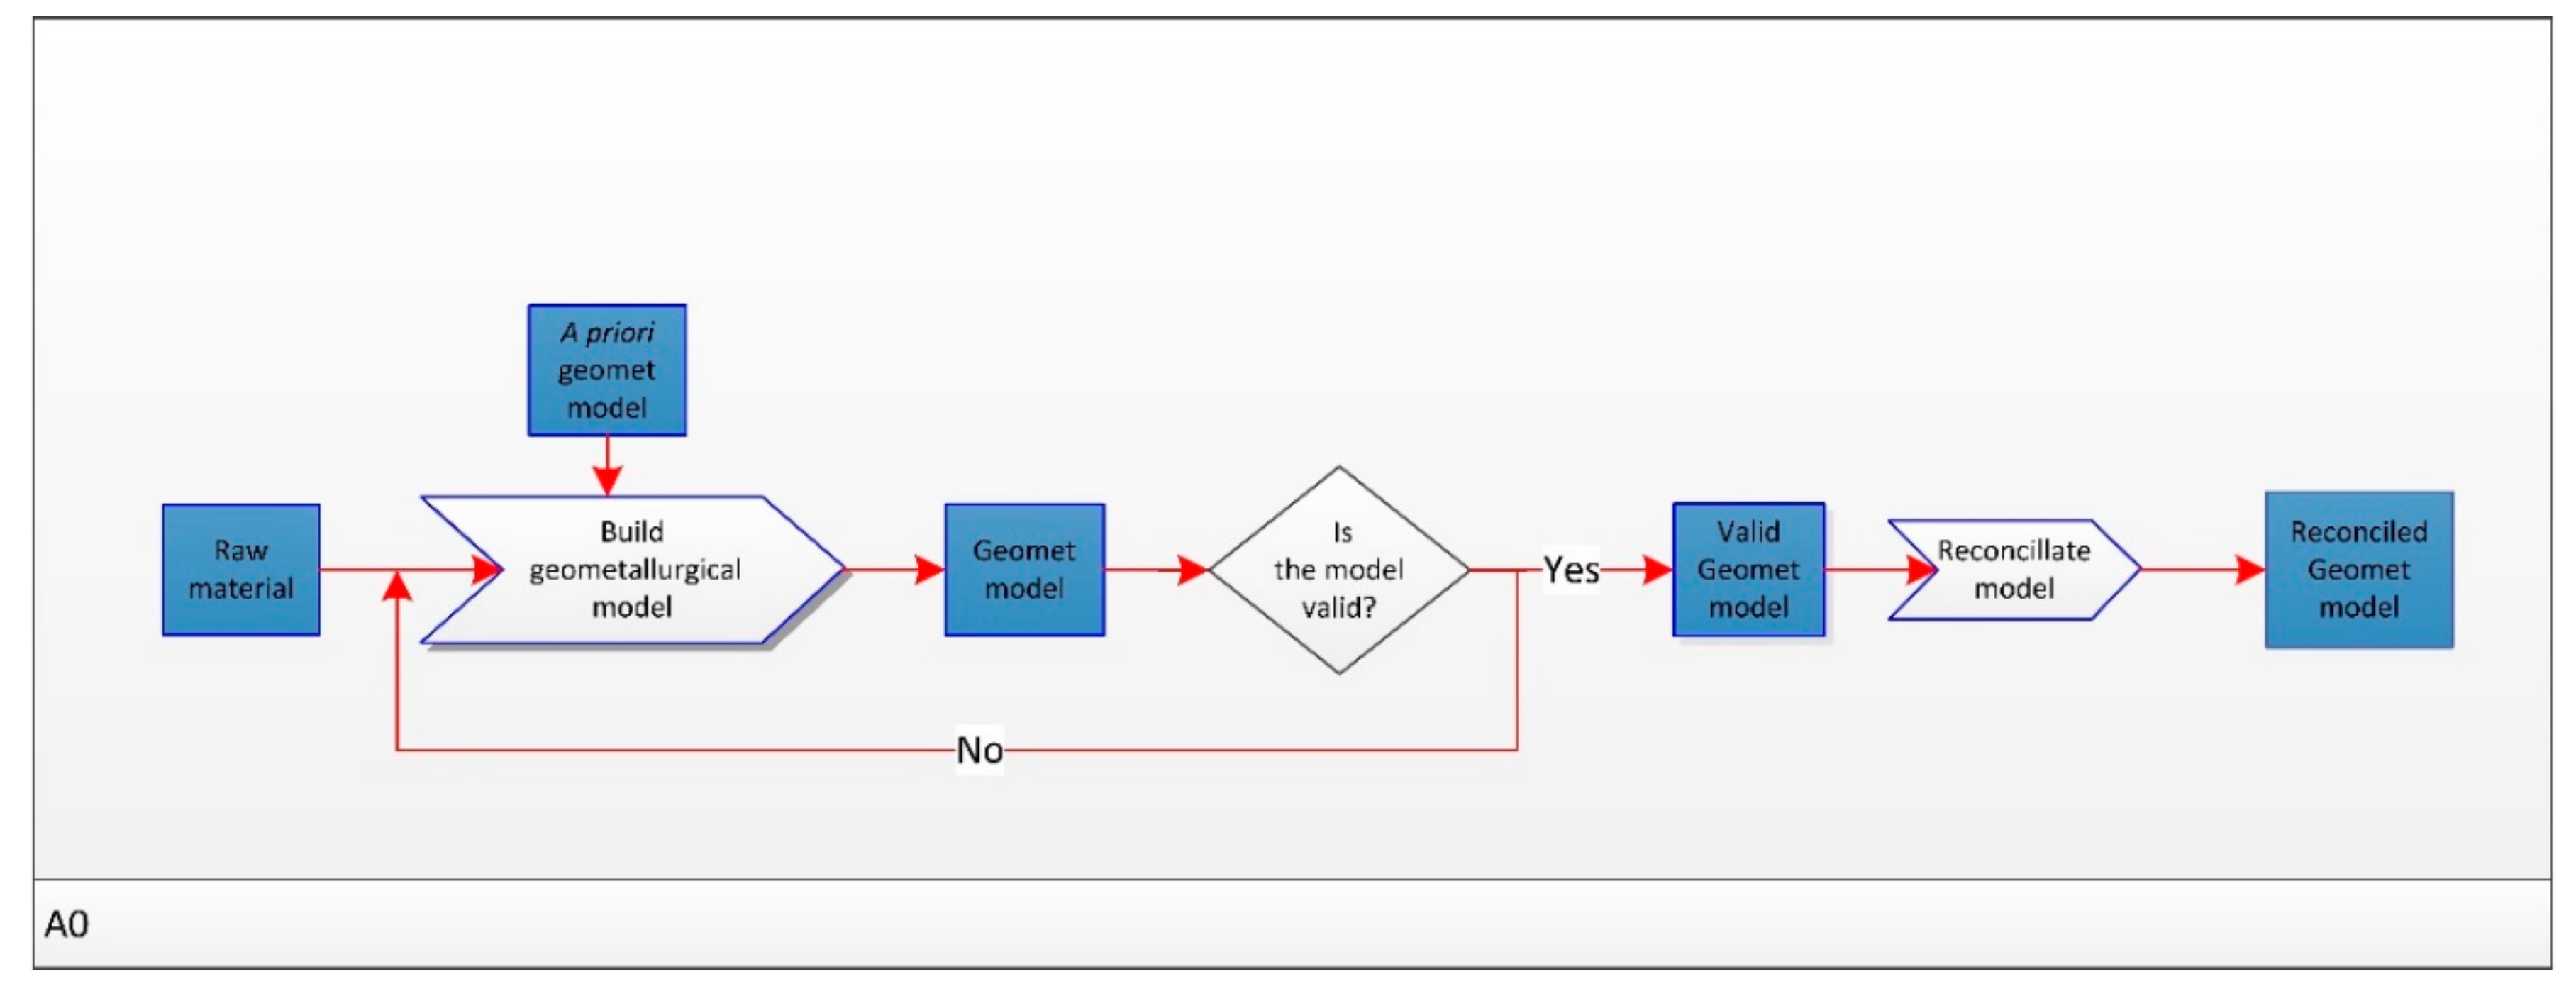
On a more detailed level, the
Develop geometallurgical model process is broken down into the process of building the model and reconciliation of the model (A0 level). The model is verified on two levels: First, by possible iterations during
Build a geometallurgical model process, where the defined coefficients can be adjusted during continuous testing and analyzing, and secondly during the
Reconcile model process where the coefficients are refined using the data from the regular production (
Figure 4). During the reconciliation stage, the model development is a result of adaptations to changes in raw material characteristics and product requirements. Regression analyses are used to update the equations and the coefficients.
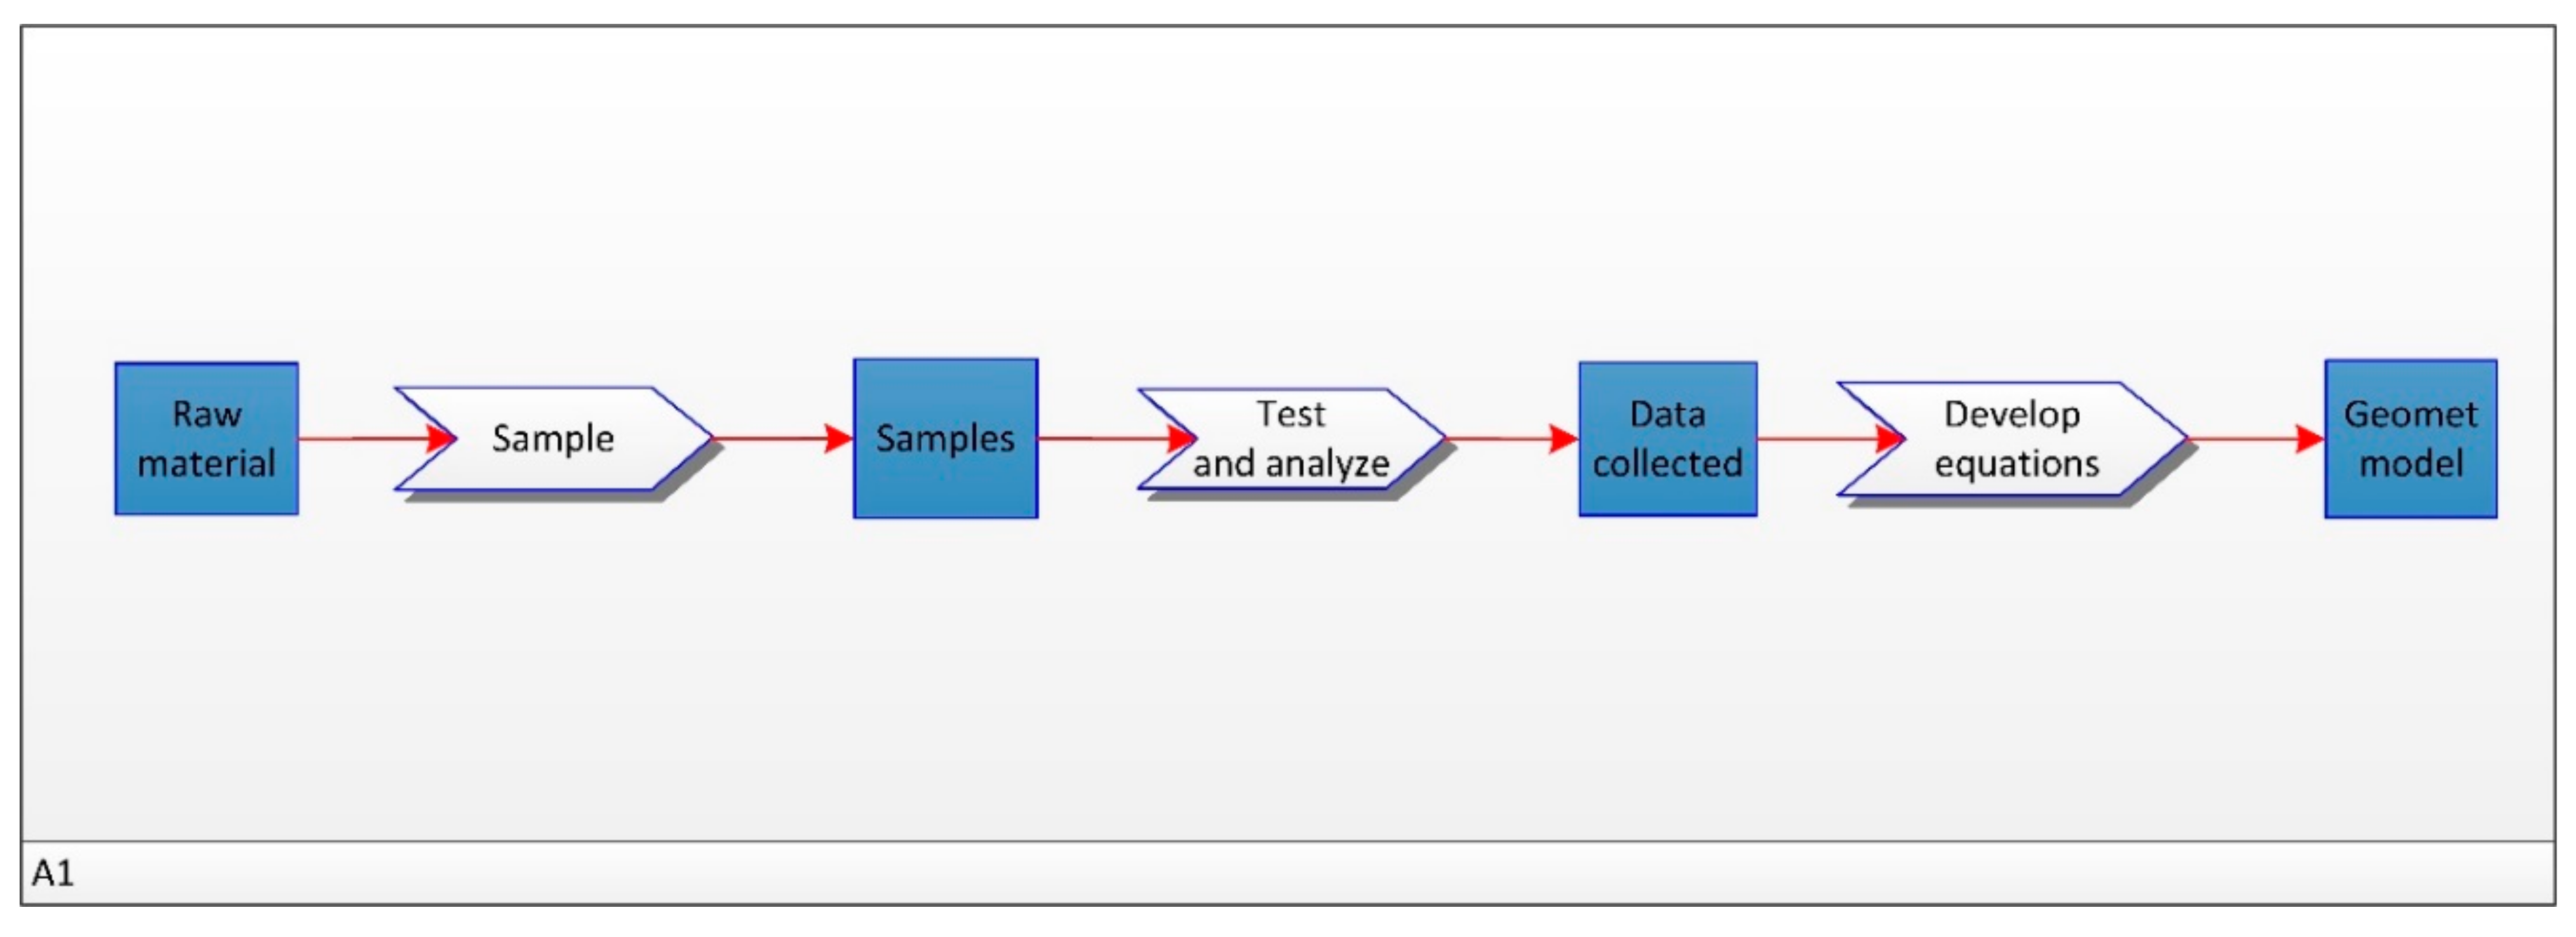
The function
Build geometallurgical model has been decomposed further into more detailed functions on the A1 level (
Figure 5). The main functions of this part of the geometallurgical flowsheet are:
Sample,
Test and analyze, and
Develop equations. This concludes the general geometallurgical flowsheet, and these functions will then be decomposed in the development of a case-specific flowsheet. The processes related to data cleaning and quality assurance (QA)/quality control (QC) are within the child diagrams of the
Test and analyze function in
Figure 5. This implies that the data in the
Data collected box are cleaned and quality assured and controlled.
4.2. Case-Specific Geometallurgical Flowsheet—Example from Verdalskalk AS
The geometallurgical flowsheet presented in the following is a combination of the procedures performed during mining operations at Verdalskalk AS and the herein proposed procedures.
4.2.1. The A Priori Model
The a priori model for Verdalskalk AS is formulated as follows:
Raw material textural and mineralogical characteristics = f(x,y,z, surface hardness).
Quicklime CaO activity and CO2 residue = f(x,y,z, raw material textural and mineralogical characteristics, kiln feed particle size distribution (PSD), burning parameters).
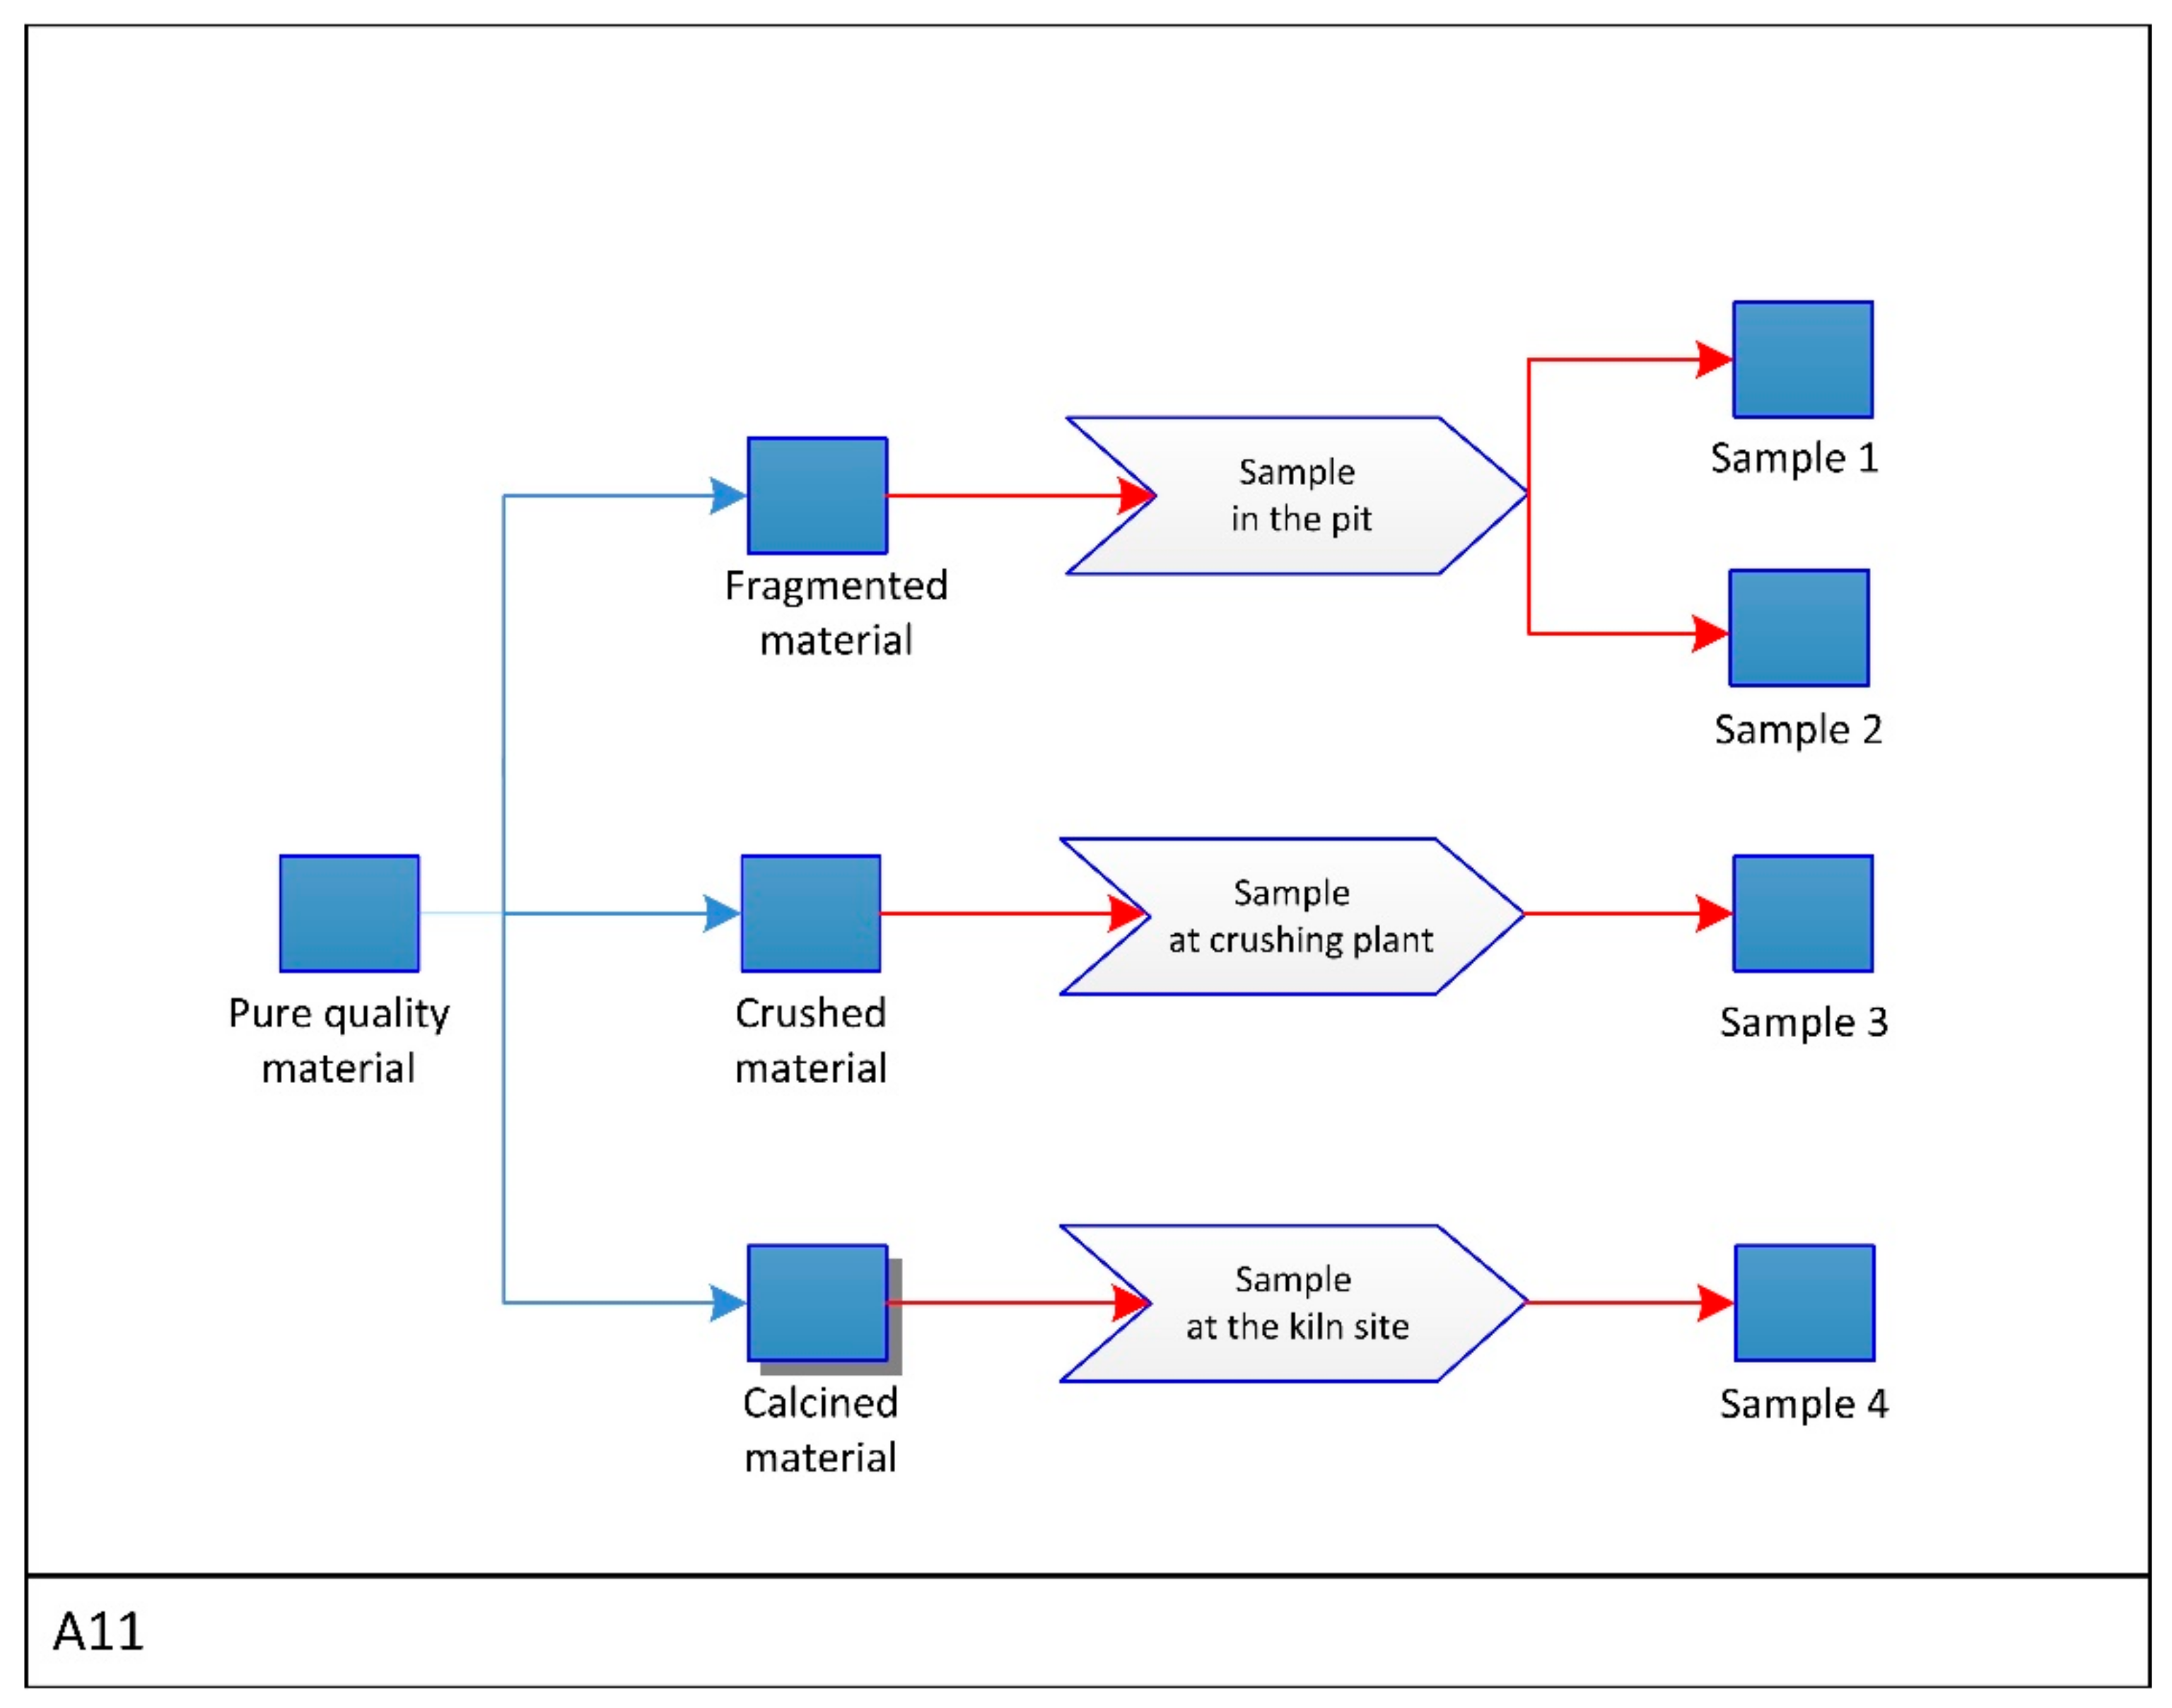
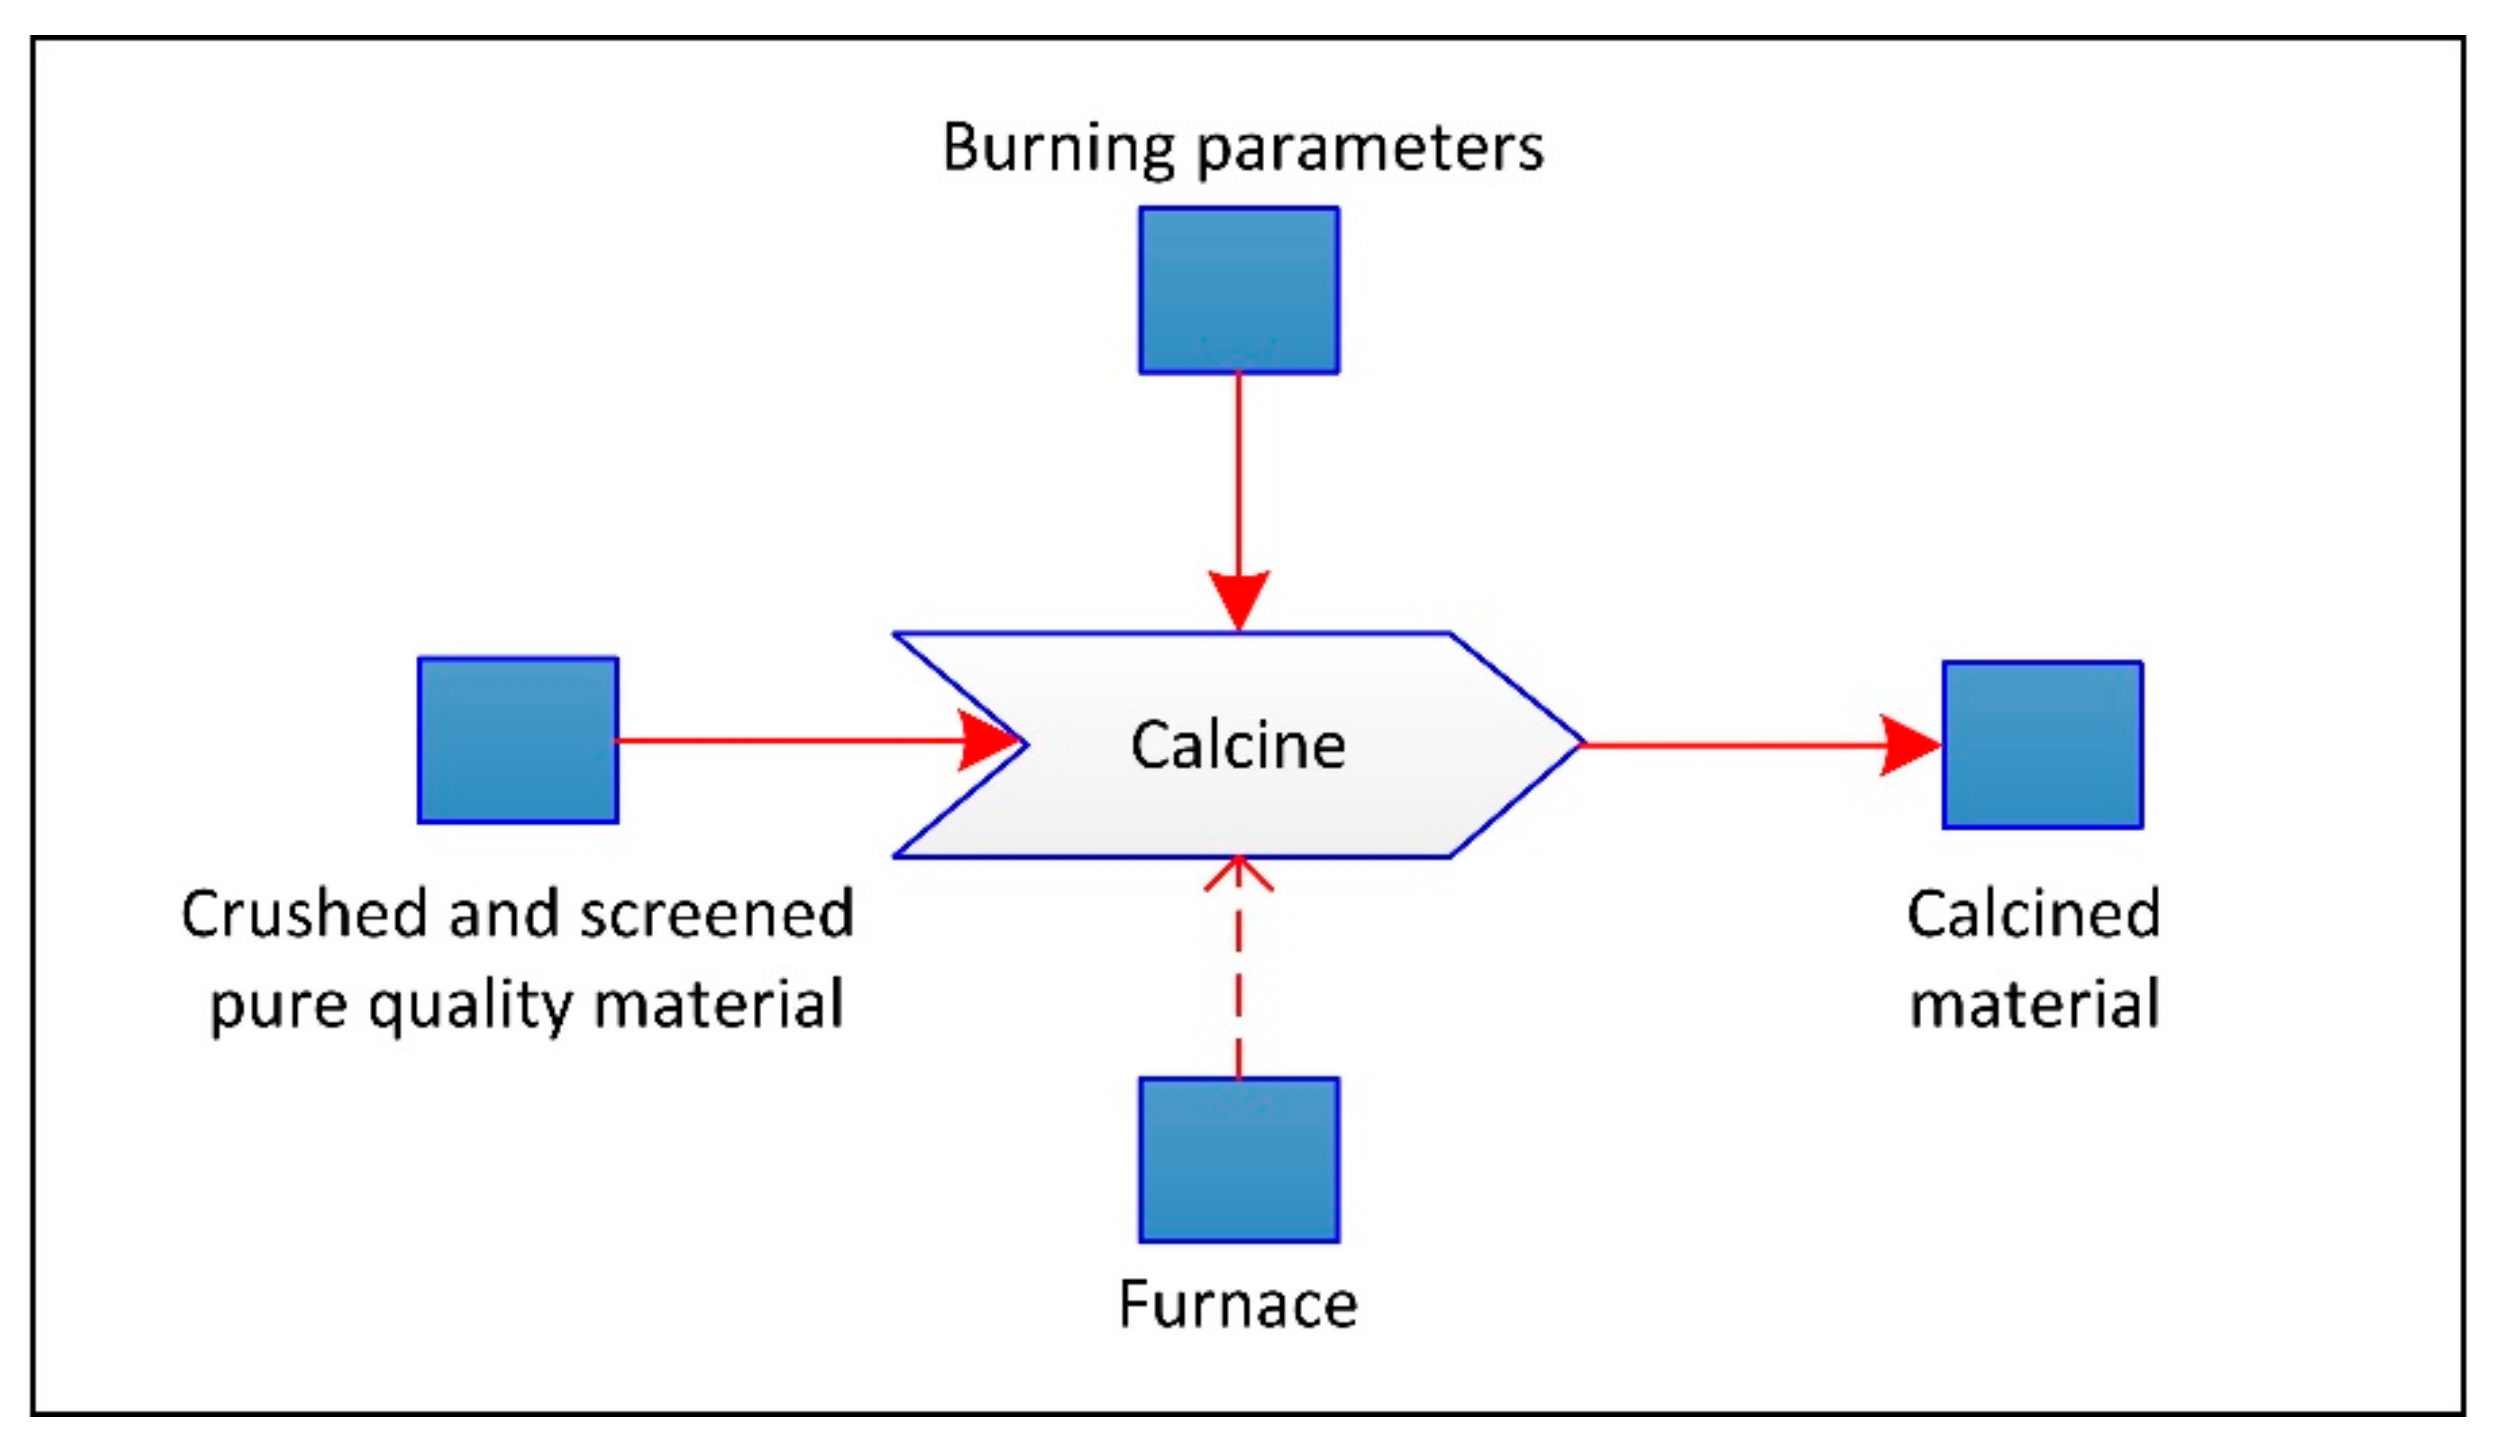
4.2.2. The Sample Function, A11 Level
The detailed
Sample function, presented in
Figure 6, shows the sampling strategy that is needed to follow the
a priori model.
In the study, a geometallurgical flowsheet was designed for the pure quality material that had been already qualified based on chemistry. Therefore, geochemical testing of the rock is not shown as a part of the flowsheet in this case.
The flowsheet uses the relation “consists of”. The pure quality material used for sampling consists of fragmented, crushed and calcined material. The three types of material are sampled at different stages of the mine operations: After blasting, after crushing and after calcining the raw material.
Every element of such a flowsheet can and should be decomposed further, showing for example the origin of the specified material or details of the sampling procedure. In
Figure 6, the box
Calcined material is presented with a shadow that indicates later decomposition. This example is expanded in
Figure 7.
Other important factors that can be communicated at this level are, for example, detailed sampling procedure, amount of the material needed, and equipment necessary for sampling.
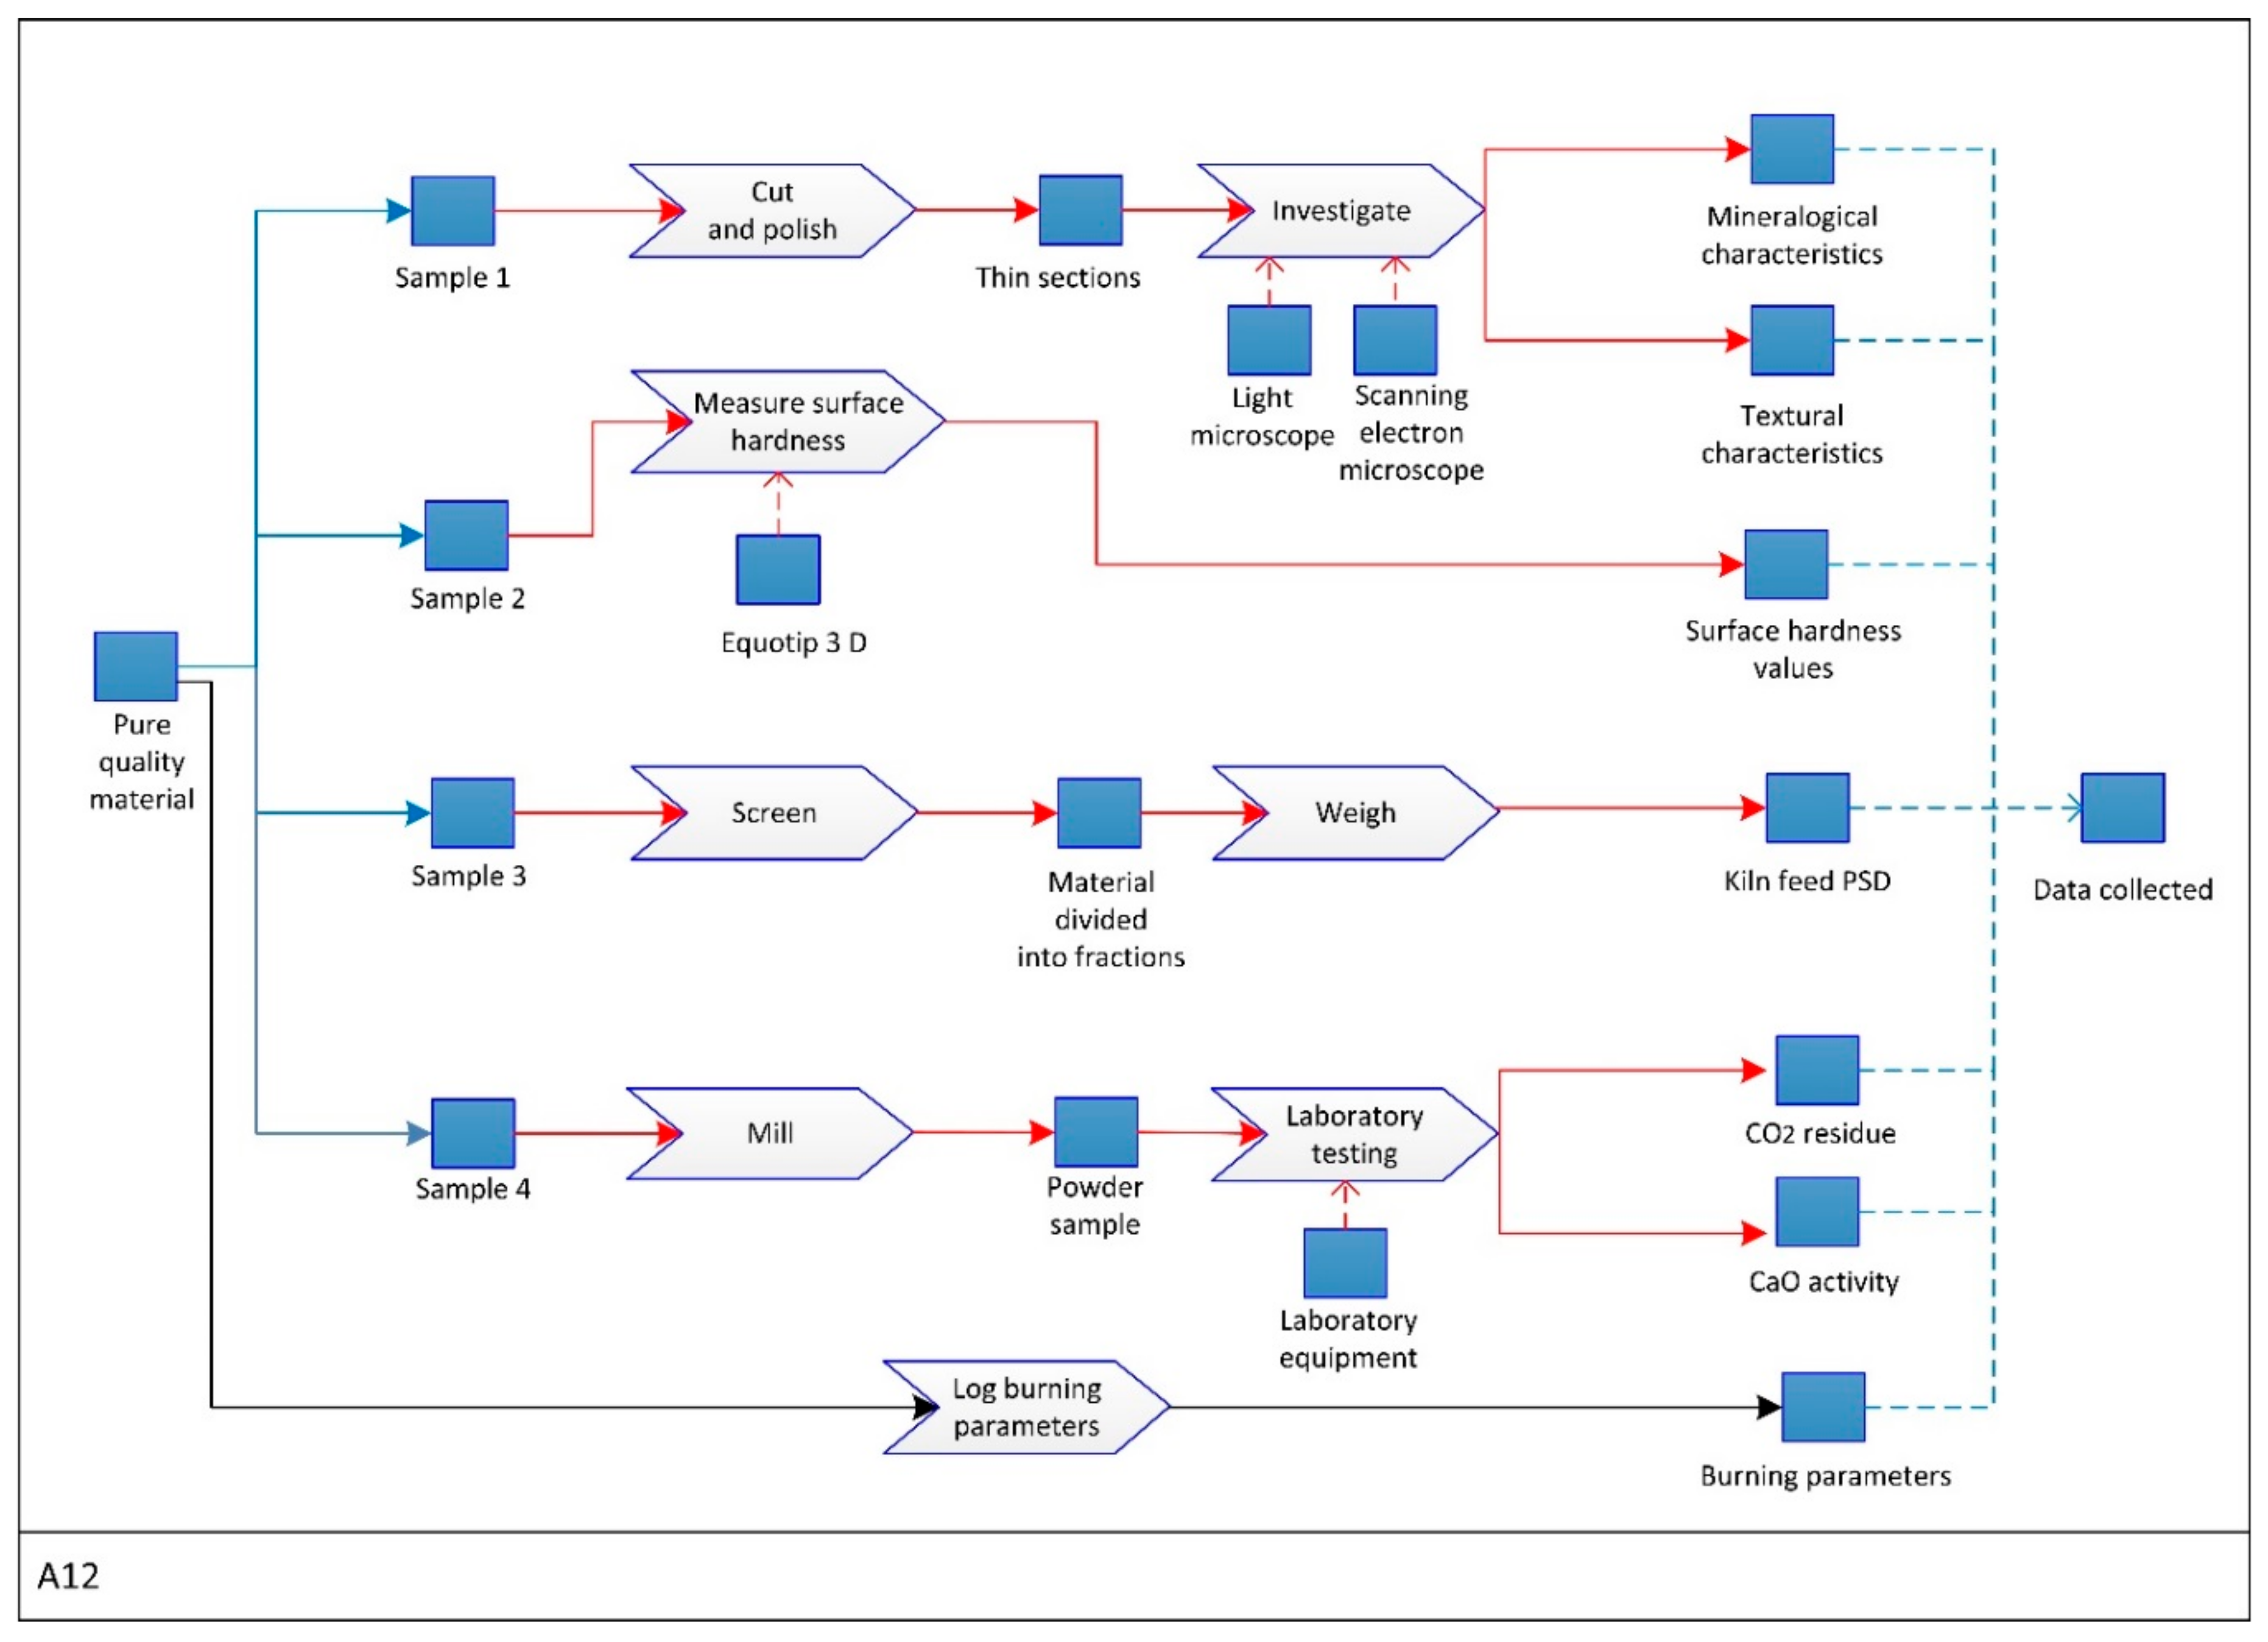
4.2.3. The Test and Analyze Function, A12 Level
The detailed
Test and analyze function is shown in
Figure 8.
The pure quality material is divided into sampling lines and samples are ready to be used based on the previous part of the flowsheet, as shown in
Figure 8. At this point, possible decomposition allows for a detailed view of the analyses taken. The fractional collected data is combined as a final
Data collected output. The analysis proposed for Verdalskalk is based on four sampling lines:
1. The material sampled in the pit after blasting is used to prepare thin sections that undergo the textural and mineralogical analysis with the use of a light and scanning electron microscope.
The textural characteristics that affect the kiln performance are grain size and textural variations [
16,
17]. In terms of mineralogy, the content of graphite-, quartz- and iron oxides may vary, even if the values are within specifications or below the XRF detection limit [
16], hence textural and modal mineralogy tests are proposed.
2. Surface hardness is measured directly in the pit after blasting, with the use of an Equotip 3 D device.
Since the product quality after burning is the function of textural characteristics, which is itself the function of surface hardness, in the ideal situation the surface hardness values could serve as direct proxy for the burnt lime KPIs. However, in our study the direct proxy was not yet possible to establish, hence we propose the program that consists of both surface hardness and textural/mineralogical tests with possible improvements in the future.
3. The kiln feed material after crushing (30–100 mm) is screened and weighed in order to measure the particle size distribution.
The burning performance can be affected by too much fines in the kiln. Currently the tests done by Verdalskalk serve in order to check if the feed kiln is within the desired PSD, but it is advisable to run the tests more often in order to notify potential relationships between the PSD and burning performance on a daily basis.
4. Samples of calcined material are milled, split and tested for CO2 residue and CaO activity.
CaO activity and CO2 residue are important qualifying parameters of the final product (burnt lime). For measuring the CaO activity a sample of milled burnt lime is added to water. The time that it takes the water temperature to rise from 20 °C to 60 °C (T60) and a total temperature rise (ΔTtot) as a result of the exothermic slaking reaction between the water and the lime, is measured. CO2 residue in quicklime is measured with the use of hydrochloric acid and the gasometric method.
In addition to the four sampling lines, there is also a need for logging and collecting the burning parameters as furnace temperature, pressure, oil usage. This line is presented in
Figure 8 as a secondary flow because it represents the observations and not sampling results.
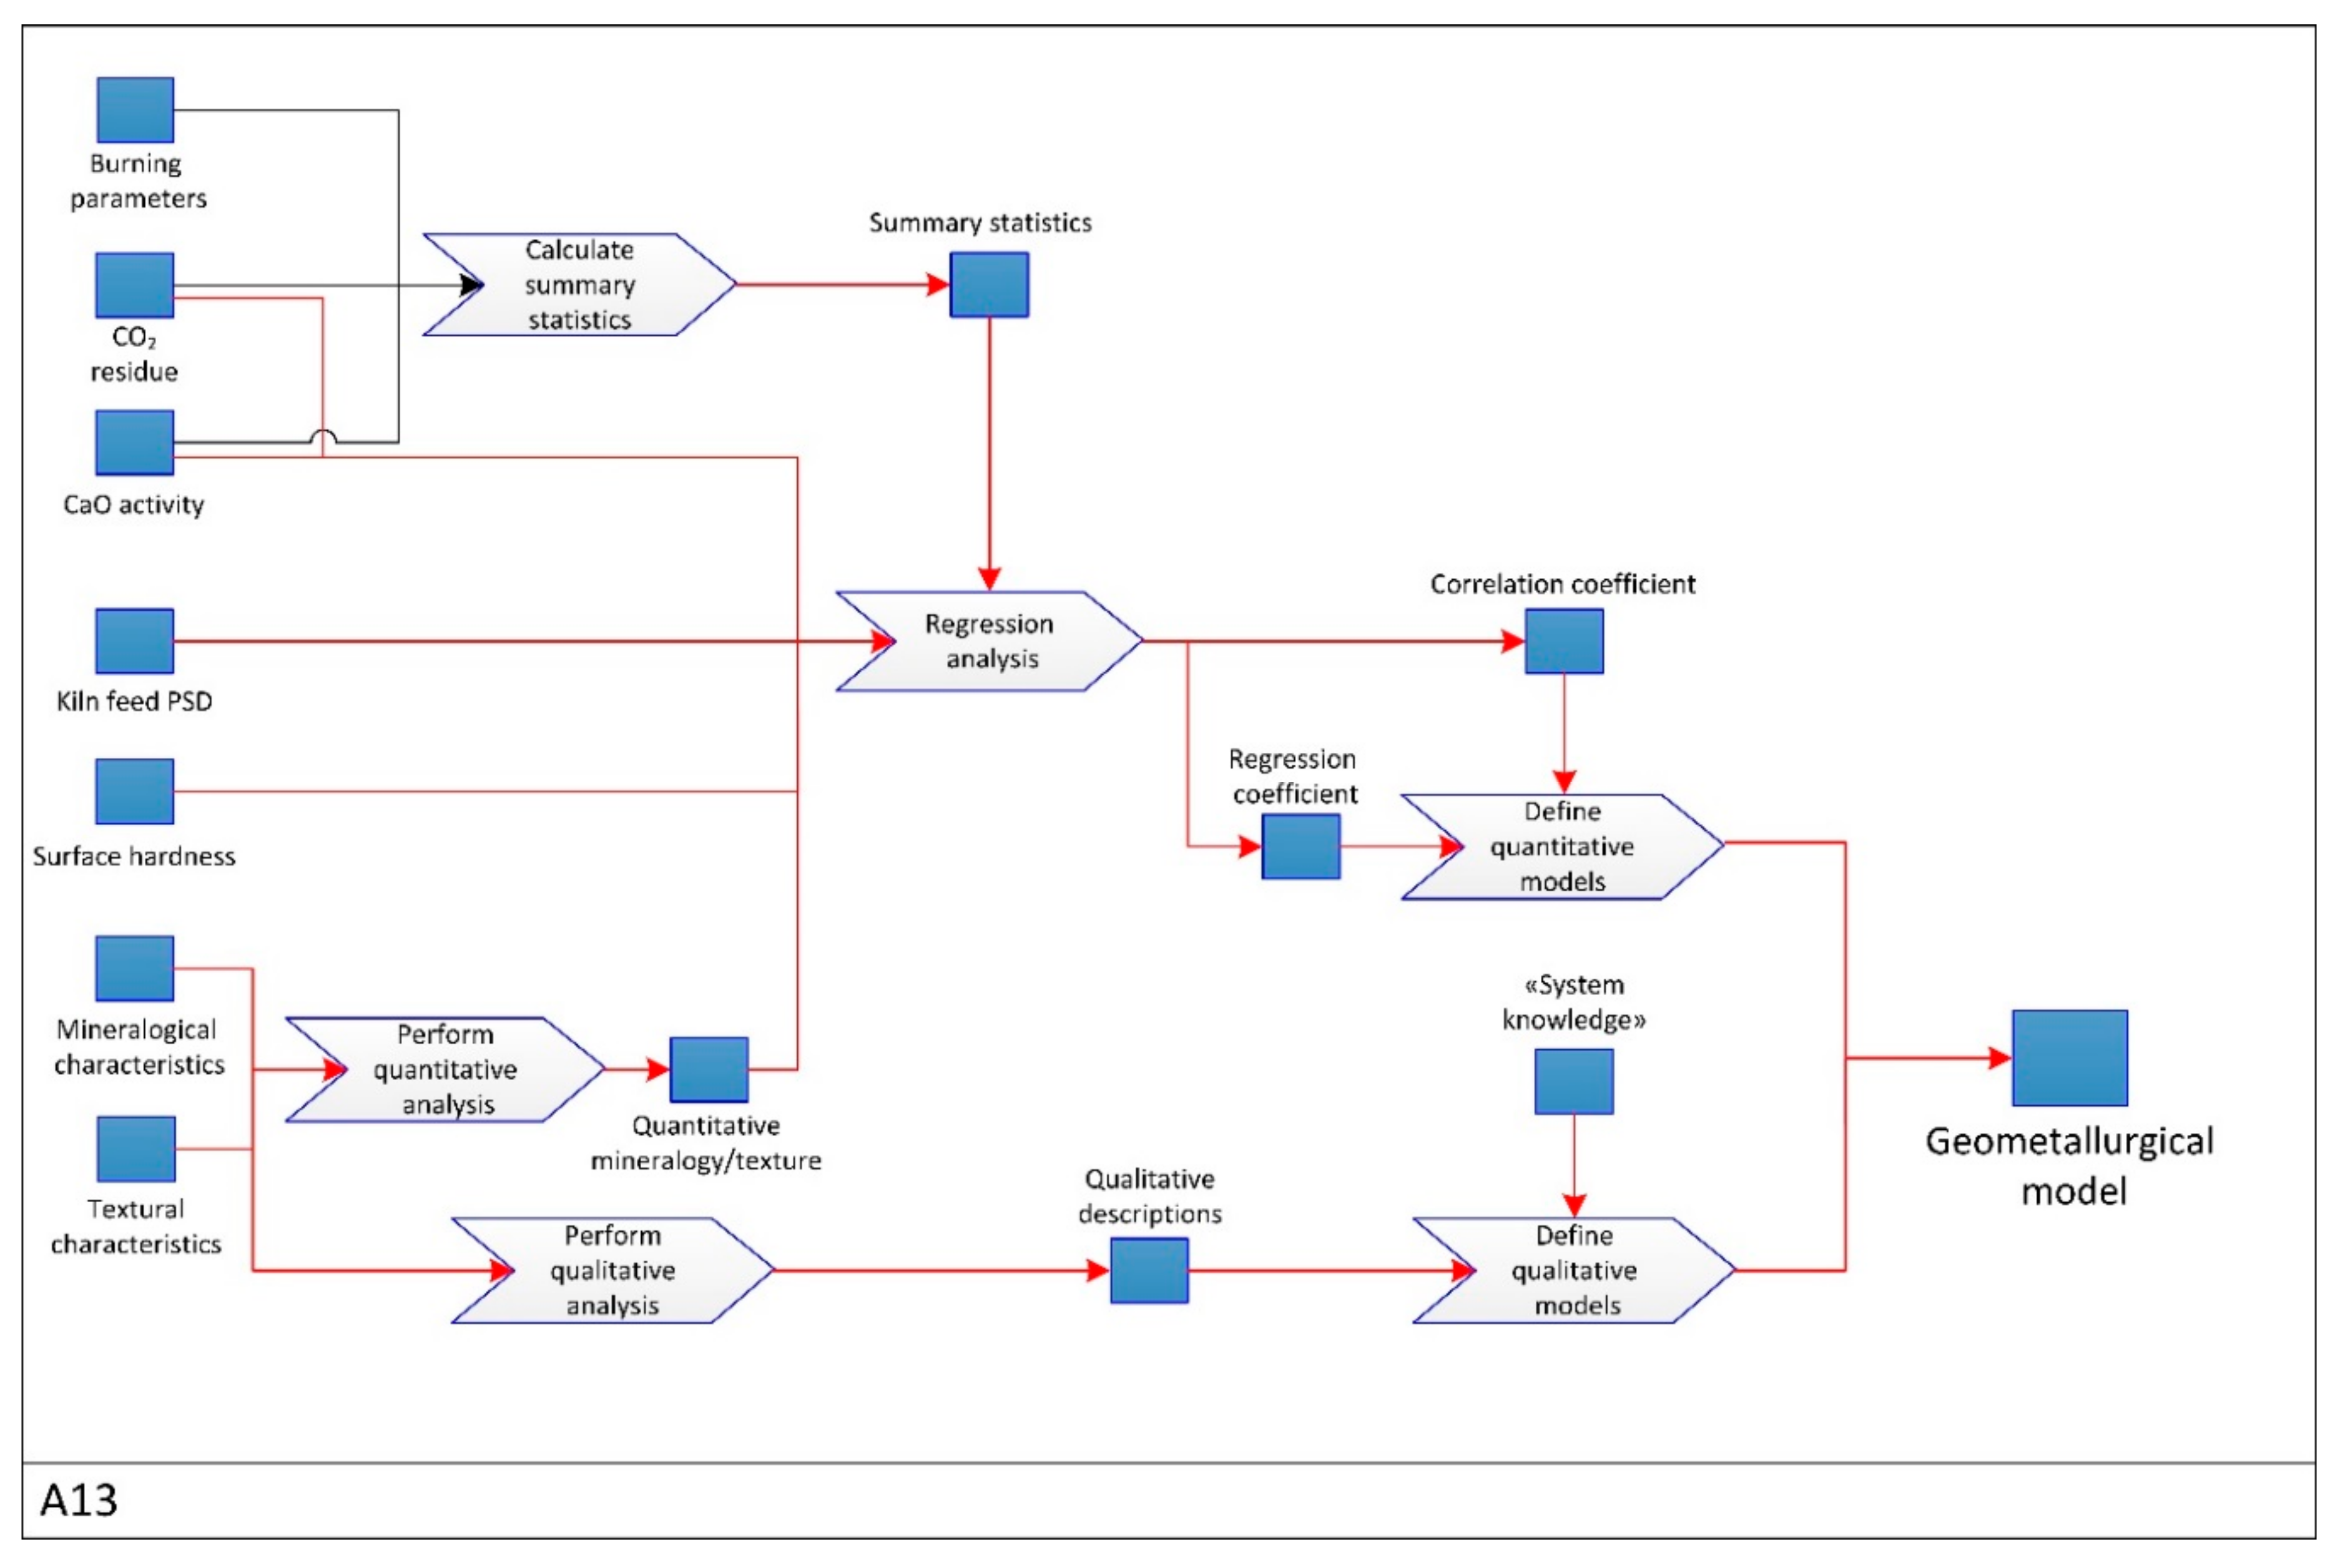
4.2.4. The Develop Equations Function, A13 Level
The
Develop equations function is decomposed into details, as shown in
Figure 9.
On this level, all the quantitative data undergo mathematical analysis and all the qualitative data are also processed in order to find relations between parameters. Burning parameters, CO
2 residue, and CaO activity form a large dataset that undergo the
Calculate summary statistics process and the output of the process can be used as the control of the
Regression analysis process. CO
2 residue, CaO activity, and surface hardness results are quantitative data that might be correlated. The final geometallurgical model in
Figure 9 is the combination of the quantitative and qualitative models.
Examples of further decomposition of the processes on this level are the details of mathematical operations, the software used for analysis and the detailed qualitative descriptions of the textures and mineralogy.
The example summary statistics from Verdalskalk AS kiln operation are provided in
Table 2. The statistics comprise the burning parameters and quicklime KPIs on three random days within a production year. These data can be used as a control for establishing the regression coefficient between KPIs and raw material parameters.
5. Discussion
The geometallurgical flowsheet has been coined and defined in this study as a tool for the design, visualization and communication of a geometallurgical program. It is to be used on site and developed in collaboration with specialists associated with different parts of the mining value chain. This is supported by Lund et al. [
23], who proposes that any process flowsheets are created within an organization during meetings and workshops, thereby allowing for collaboration and experience exchange between specialists and between departments.
In this work, the definition of the program, as the summary of operations, needed to establish the final and validated geometallurgical model [
2], was followed and expanded by introducing the concept of the
a priori model as a control of the model development. This clarified the inconsistencies that exist in literature [
2,
21,
26]. It is imperative to identify the potential relations between geological and metallurgical parameters first, but it is only after the program is executed and data are obtained that one can establish the quantitative and qualitative relationships that constitute the geometallurgical model. The geometallurgical model will continuously be developed through the geometallurgical program execution, specifically as a part of the reconciliation process.
After the model creation, the program is still executed further to validate the model and to implement the model as a controlling element of the mining value chain. The ideal situation is to build a model that is fully predictive and therefore the geometallurgical program is non-repetitive. However, it is important to keep in mind that the program and the flowsheet design must remain dynamic and agile, and the need for iterations and fast modifications, controlled by such elements like in-situ raw material variations, technical issues, mine capacity demand and new customer requirements is essential.
The general geometallurgical flowsheet should be treated as the basis when building an operation-specific geometallurgical flowsheet. The following main functions and associated ICOMs, vital for the flowsheet development, must be considered:
The a priori model: A preliminary model based on pre-testing, experience and literature.
The sampling function: Presentation of sampling methods and taking care of representativeness of the samples.
The testing and analyzing function: Presentation of the testing and analyzing technologies and methodologies used to develop the model.
The develop equations function: The presentation of the development of the mathematical relationships included in the final model.
The predictive capabilities of the model cannot be better than the quality of the input used during model development. Having a function for data cleaning and QA/QC is therefore vital. In the proposed flowsheets, these functions were implicit and included within the testing and analyzing function. Therefore, the output from the function should be considered as clean and quality assured/controlled.
A case-specific geometallurgical flowsheet is the natural evolution of the general flowsheet into case-dependent details of the geometallurgical program. The authors chose to present the geometallurgical flowsheet as a series of diagrams presenting sampling, testing and analyzing, and establishing equations needed for model establishment. Most of the presented functions can be decomposed into child diagrams. Decomposing avoids chaos in the graphical representation of processes as it prohibits mixing the details that are important at different levels.
Other proposed elements not stated in the graphical presentations in this paper are, for example, a description of the types of material available for analysis, amount of the material, cost and location of analysis, as well as the detailed flow of the results, including who will be using them and at which step.
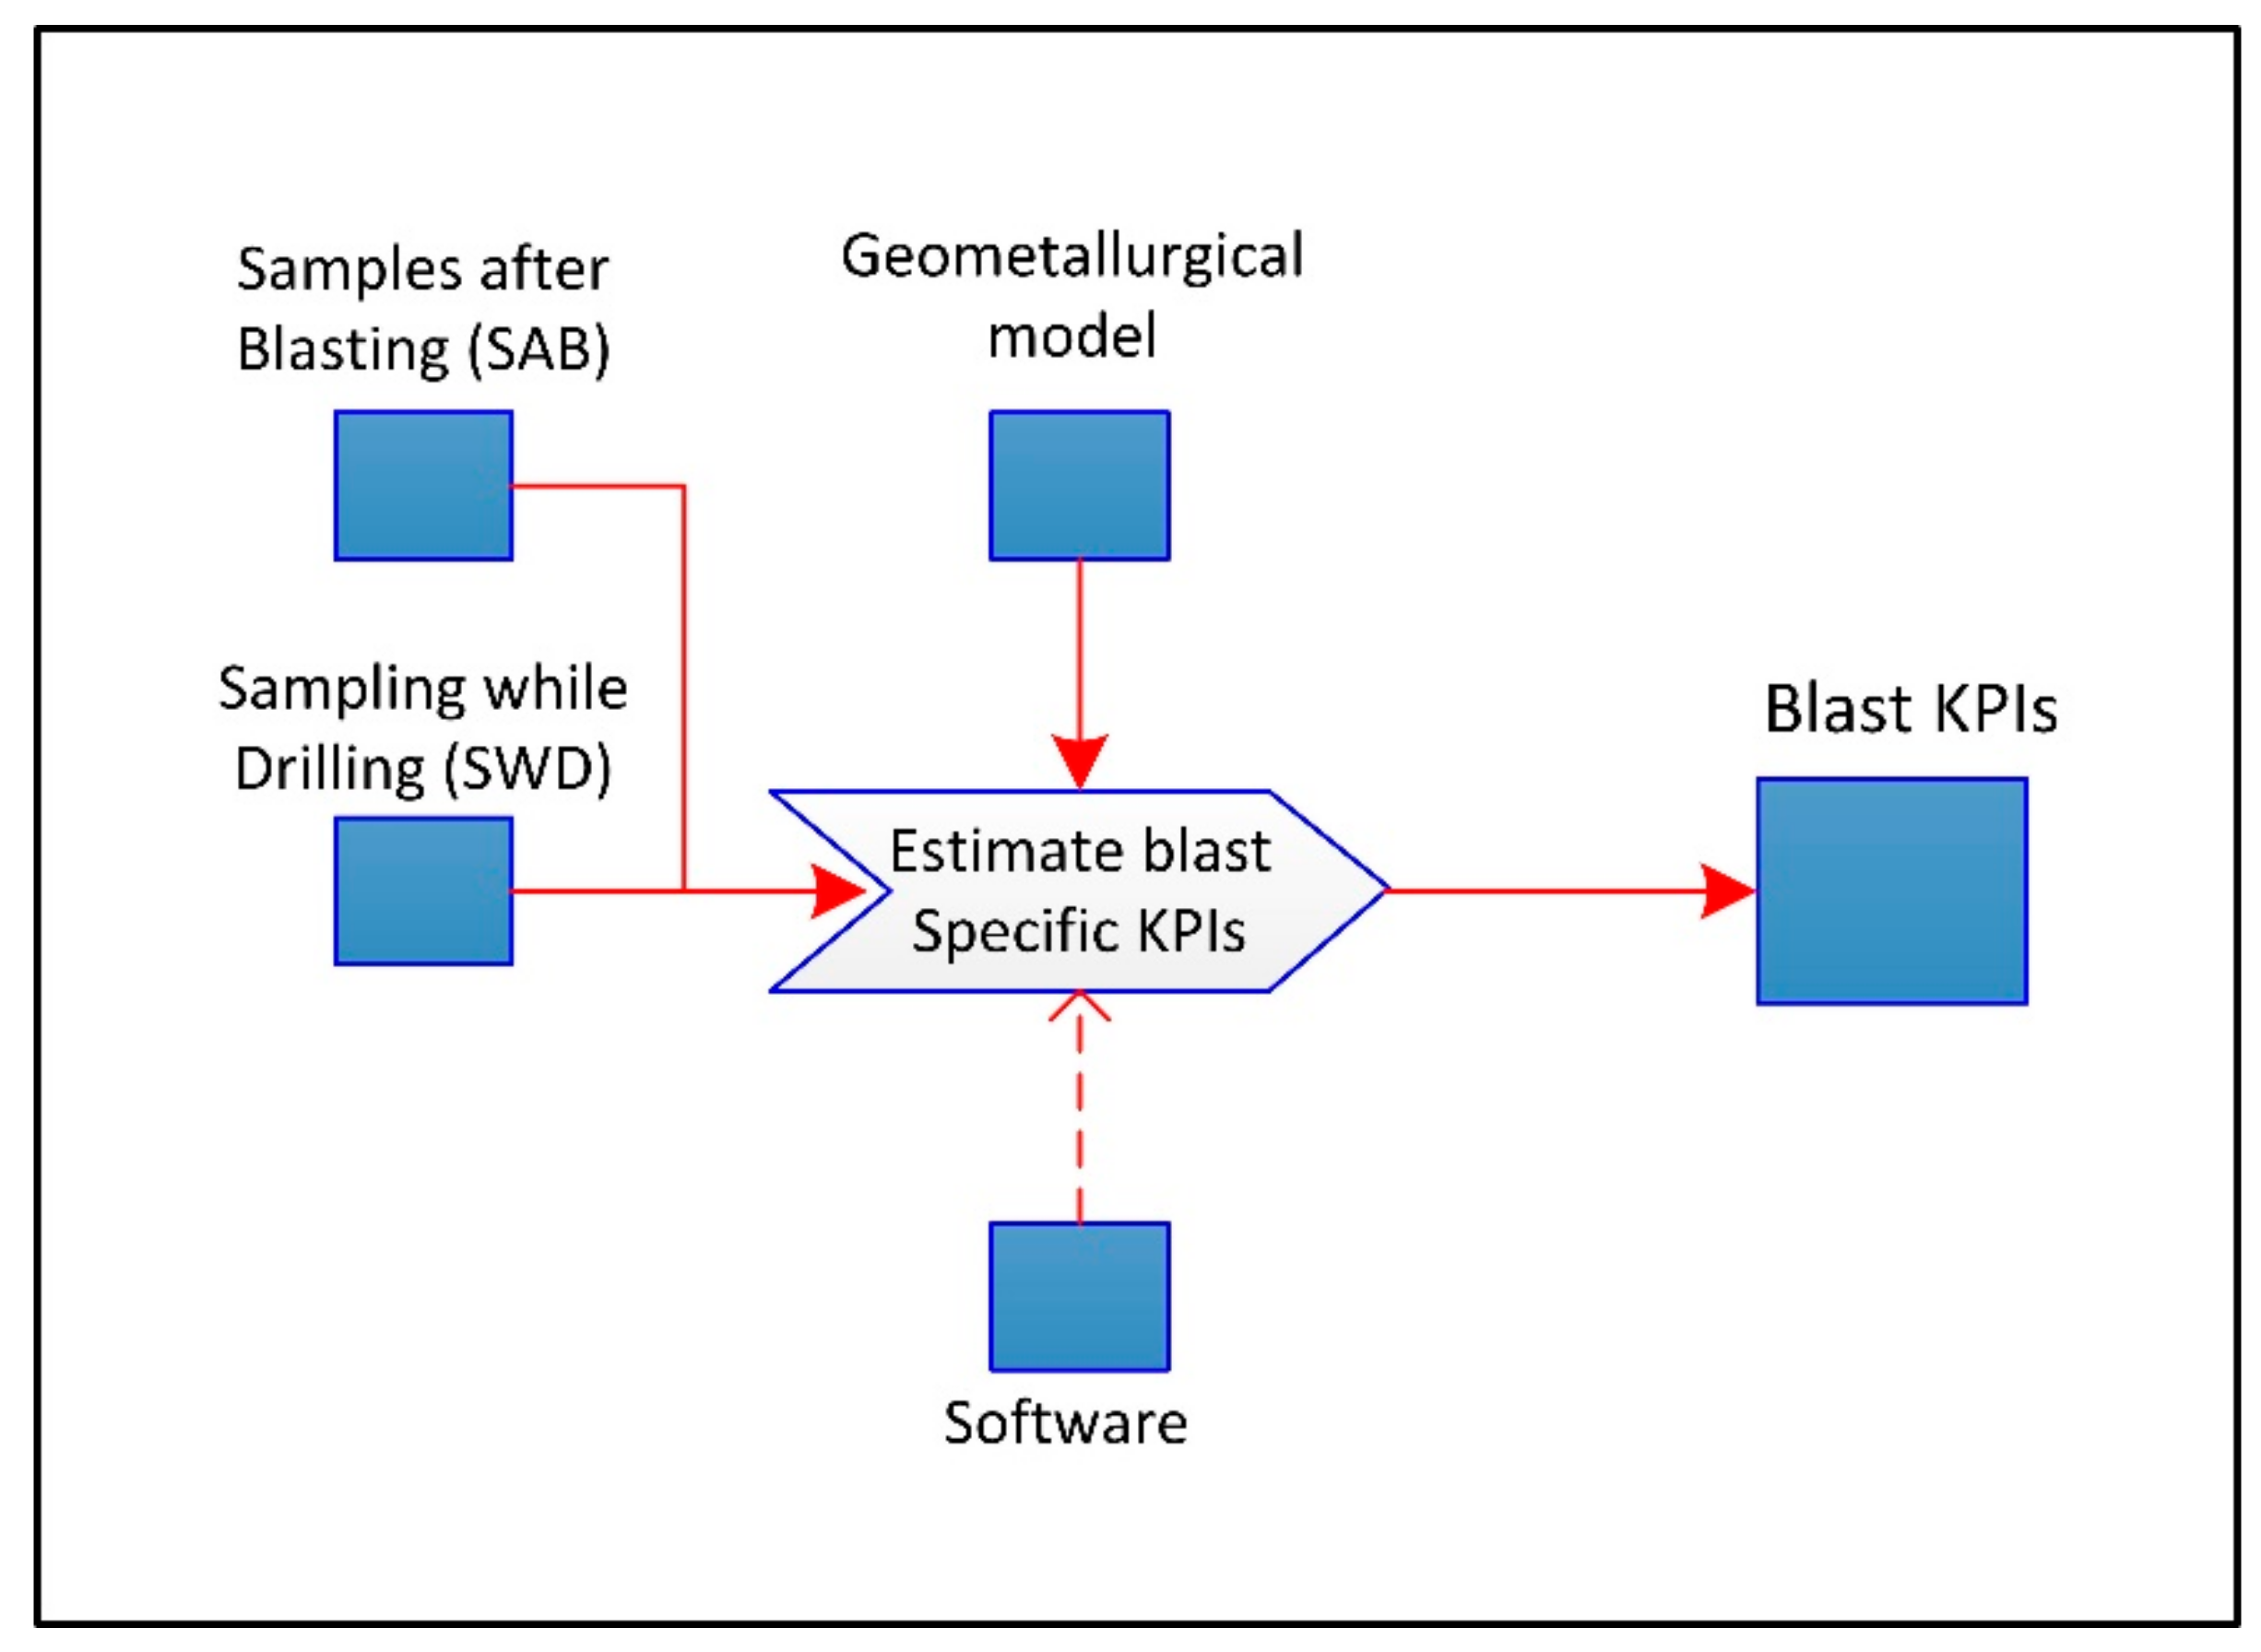
It is essential to provide a link between the geometallurgical flowsheet and the actual mining value chain. The final geometallurgical flowsheet is full-fledged only after its relation to the actual mine value chain is fully developed and understood. In the current work, it is proposed that the established geometallurgical model becomes a controlling element of an
Estimate blast specific KPIs function (
Figure 10).
For Verdalskalk AS, the main goal is to predict the quicklime CaO activity and CO2 residue for each blast. In other cases, the specific KPIs can be used either in a blending procedure or for selecting the processing route the blast material should follow.
This also leads to possible geometallurgical domaining or re-domaining of the deposit. The Verdalskalk commodity is an example of a relatively homogenous deposit. It has to be mentioned that in more complex deposits the geometallurgical domains of different characteristics are often subdivided. This raises the need for an even more detailed flowsheet with precise descriptions of relations and significant parameters within each domain.
The main advantage in communicating the program through the geometallurgical flowsheet is the increased understanding of what types of processes have to be performed and how the processes are linked. It is also helpful in realizing what types of requirements are needed to be put on processes and what has to be done to assure that the requirements are met.
In the current study, the authors propose a structured and detailed presentation with a consistent use of the well-established modeling language IDEF0. The IDEF0 language is one of many that can be used when presenting the process development. The main strength of the IDEF0 language is that the method serves well for communication as the detailed description of activities can be presented by ICOMs, and that a model can be refined into greater and greater detail when needed. IDEF0 is a good analysis tool as well, as it assists in identifying controls and mechanisms of the functions. The “input versus control” separation rule allows for better determination of the role of data as there is an increased level of understanding about what processes/objects are consumed and what processes/objects are not modified but serve as controlling elements [
27]. In the presented study, the communication was enhanced by the modified Lund version [
23], where greater variety in terms of colors and shapes of the flowsheet compared to the original standard can help with even more effective use of the created models. The modified IDEF0 used in this study presents details that are not very visible in the original method. The presentation of the ICOMs as boxes (and not only text fields, as in the original IDEF0) causes increased visibility and understanding of the processes.
Additionally, including too much information in a single flowsheet must be avoided. IDEF0 methodology serves well for this challenge as possible decomposition of diagrams can easily lead from more general to more detailed operations. Also different types of flows are clearly marked and easy to distinguish.
The use of colors represents both strengths and weaknesses of the modified method. It allows for greater variability of communicated messages, however it does not follow the “keep it simple” rule and may cause chaotic appearance if the color coding is not properly explained. On the other hand, the color system can, in future developments, be further enhanced and used to distinguish between physical- (samples, equipment, etc.) and non-physical objects (data, analysis, etc.).
The original IDEF0 method encourages the horizontal types of flow, while the advantage of the modified method is that it is possible to amalgamate several processes and visualize them as several lines shown simultaneously (
Figure 6,
Figure 8 and
Figure 9). This provides an enhanced and more holistic view of the processes. It is possible to amalgamate the processes horizontally and compose longer chains of diagrams, especially if a broader view of the geometallurgical program is needed. However, the authors do not recommend creating the diagrams only on a single horizontal level as such design would contradict the holistic view of the geometallurgical program. It is important to note that the IDEF0 technique is not a representation of a timeline, and therefore the processes can be looped and repeated until a better understanding of the model and the program is achieved.
6. Conclusions
The geometallurgical flowsheet is an illustrative tool used to visualize and communicate the elements of a geometallurgical program. It is proposed to be used on site, for enhanced communication between specialists.
The execution of geometallurgical program leads to creation of a geometallurgical model, which is the quantitative (as well as qualitative, if quantitative is not possible) and geo-referenced formulation of links between processing parameters and key performance indicators.
The geometallurgical a priori model serves as a controlling element of the geometallurgical program. A validated geometallurgical model is an outcome of the geometallurgical program.
The general geometallurgical flowsheet is a base for creating the specific geometallurgical flowsheet.
On a general geometallurgical level, it is important to relate the a priori model to the actual geometallurgical program and to relate the flowsheet to the mine value chain.
The case-specific geometallurgical flowsheet creation needs an understanding of the relations between geology, processing and the final product outcome. On a case-specific level of the geometallurgical flowsheet it is vital to provide detailed information about sampling, testing and analyzing, developing the quantitative as well as qualitative relations, and validating the model against the a priori model by iterations.
The geometallurgical flowsheet, built with the use of IDEF0 technique, is an easy to understand, coherent and intuitive tool. The ability to decompose the diagrams into sub diagrams helps with visualization of both the main process flow as well as the details. The use of colors assists in distinguishing between primary and secondary flows of processes.
As geometallurgy as a concept leads toward better communication between disciplines, the IDEF0 methodology is a tool that fits well in to the idea of elevated interdisciplinary communication.
The case study of Verdalskalk shows a potential in applying geometallurgy and geometallurgical flowsheets into industrial mineral operations.


