New Outlier Top-Cut Method for Mineral Resource Estimation via 3D Hot Spot Analysis of Borehole Data


Abstract
:1. Introduction
2. Materials and Methods
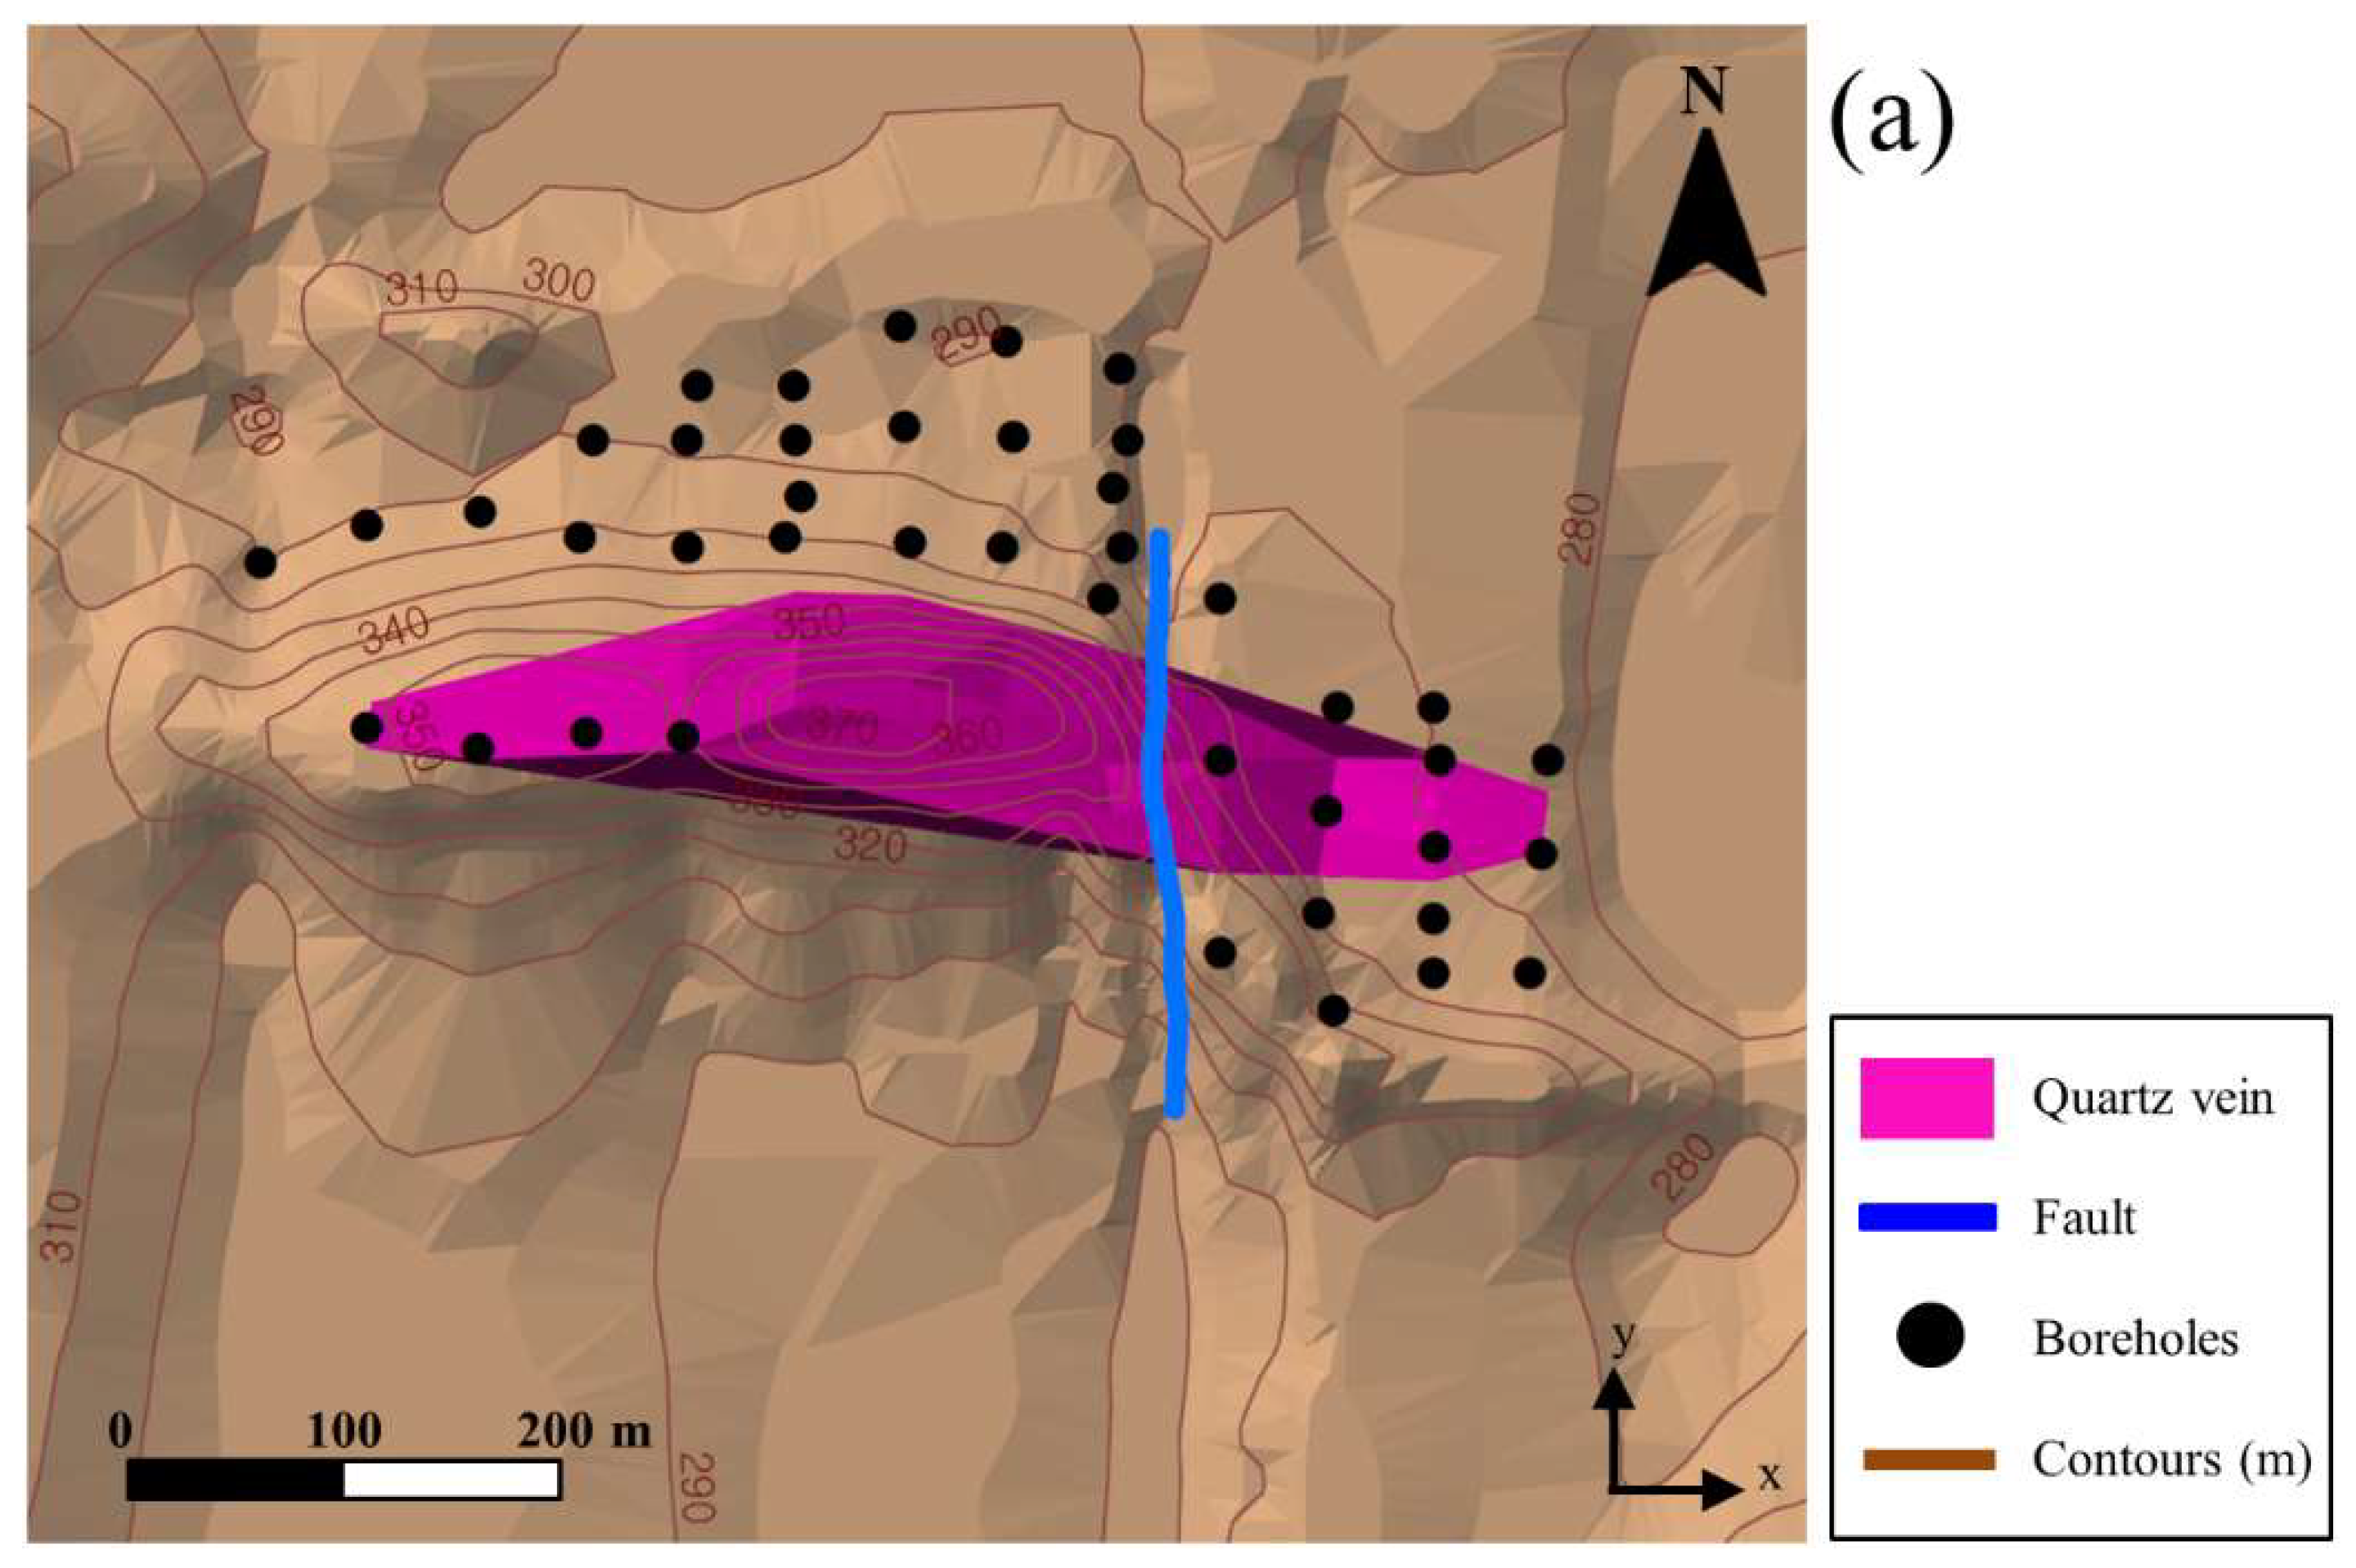
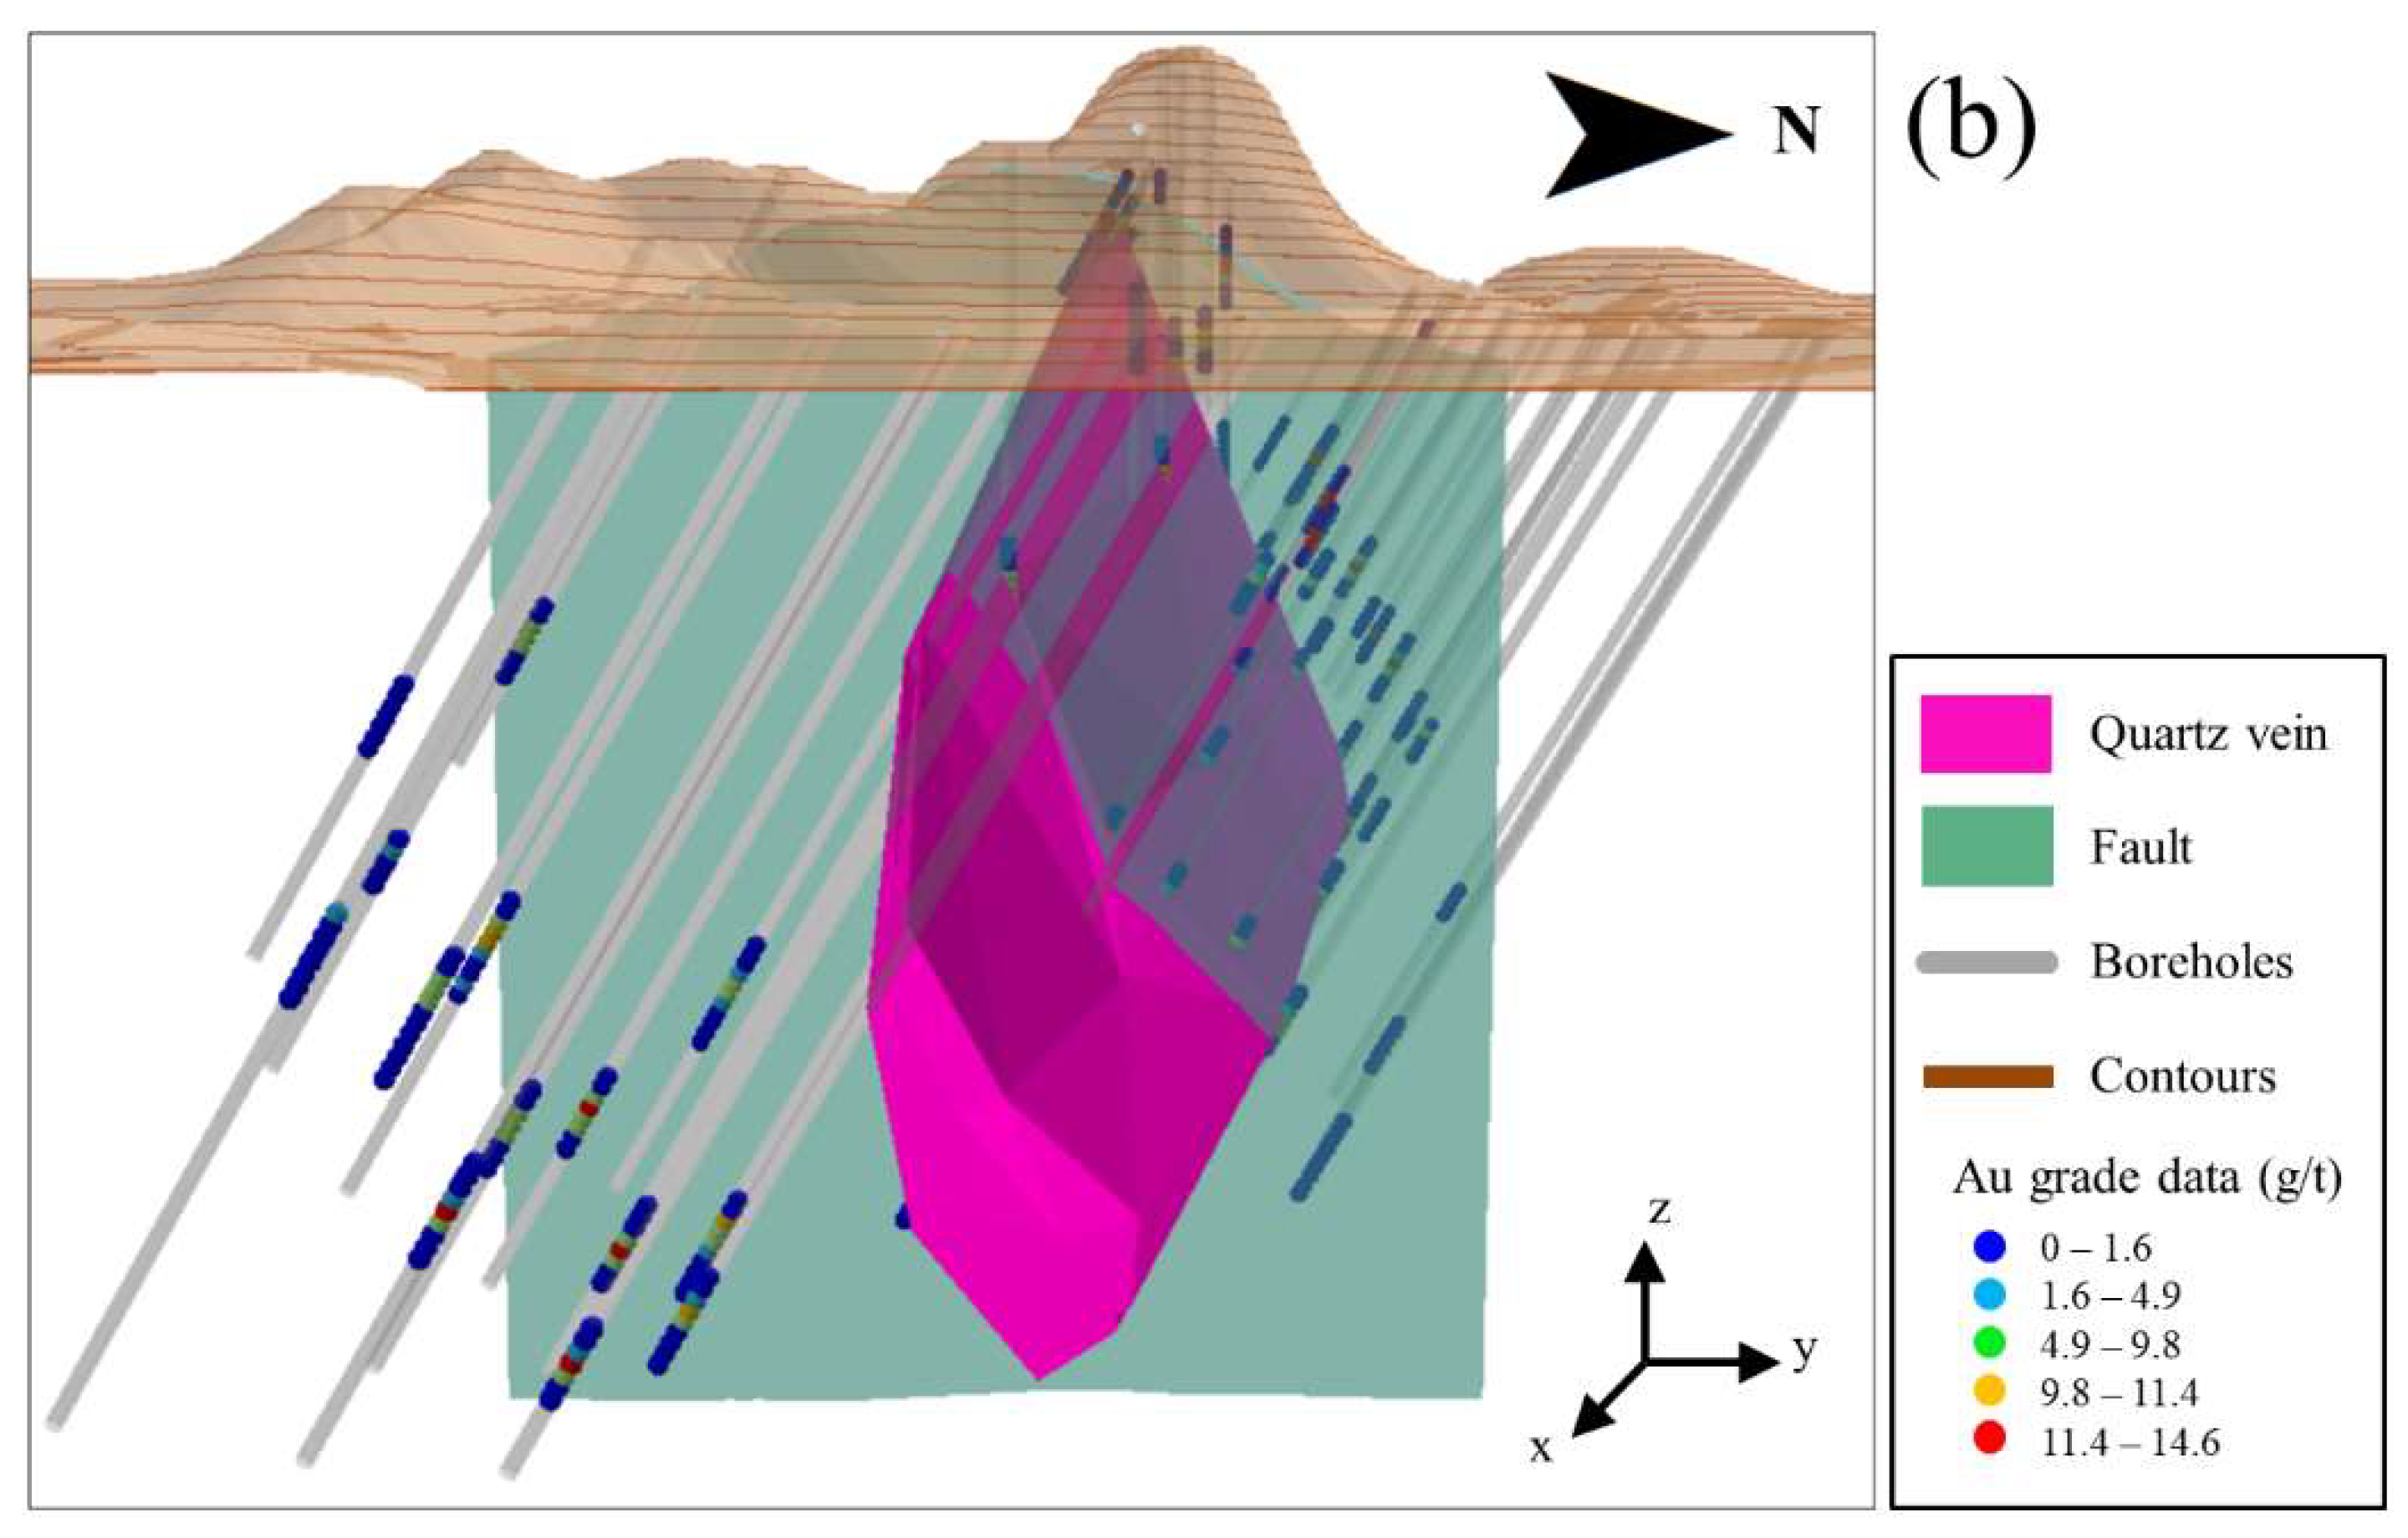
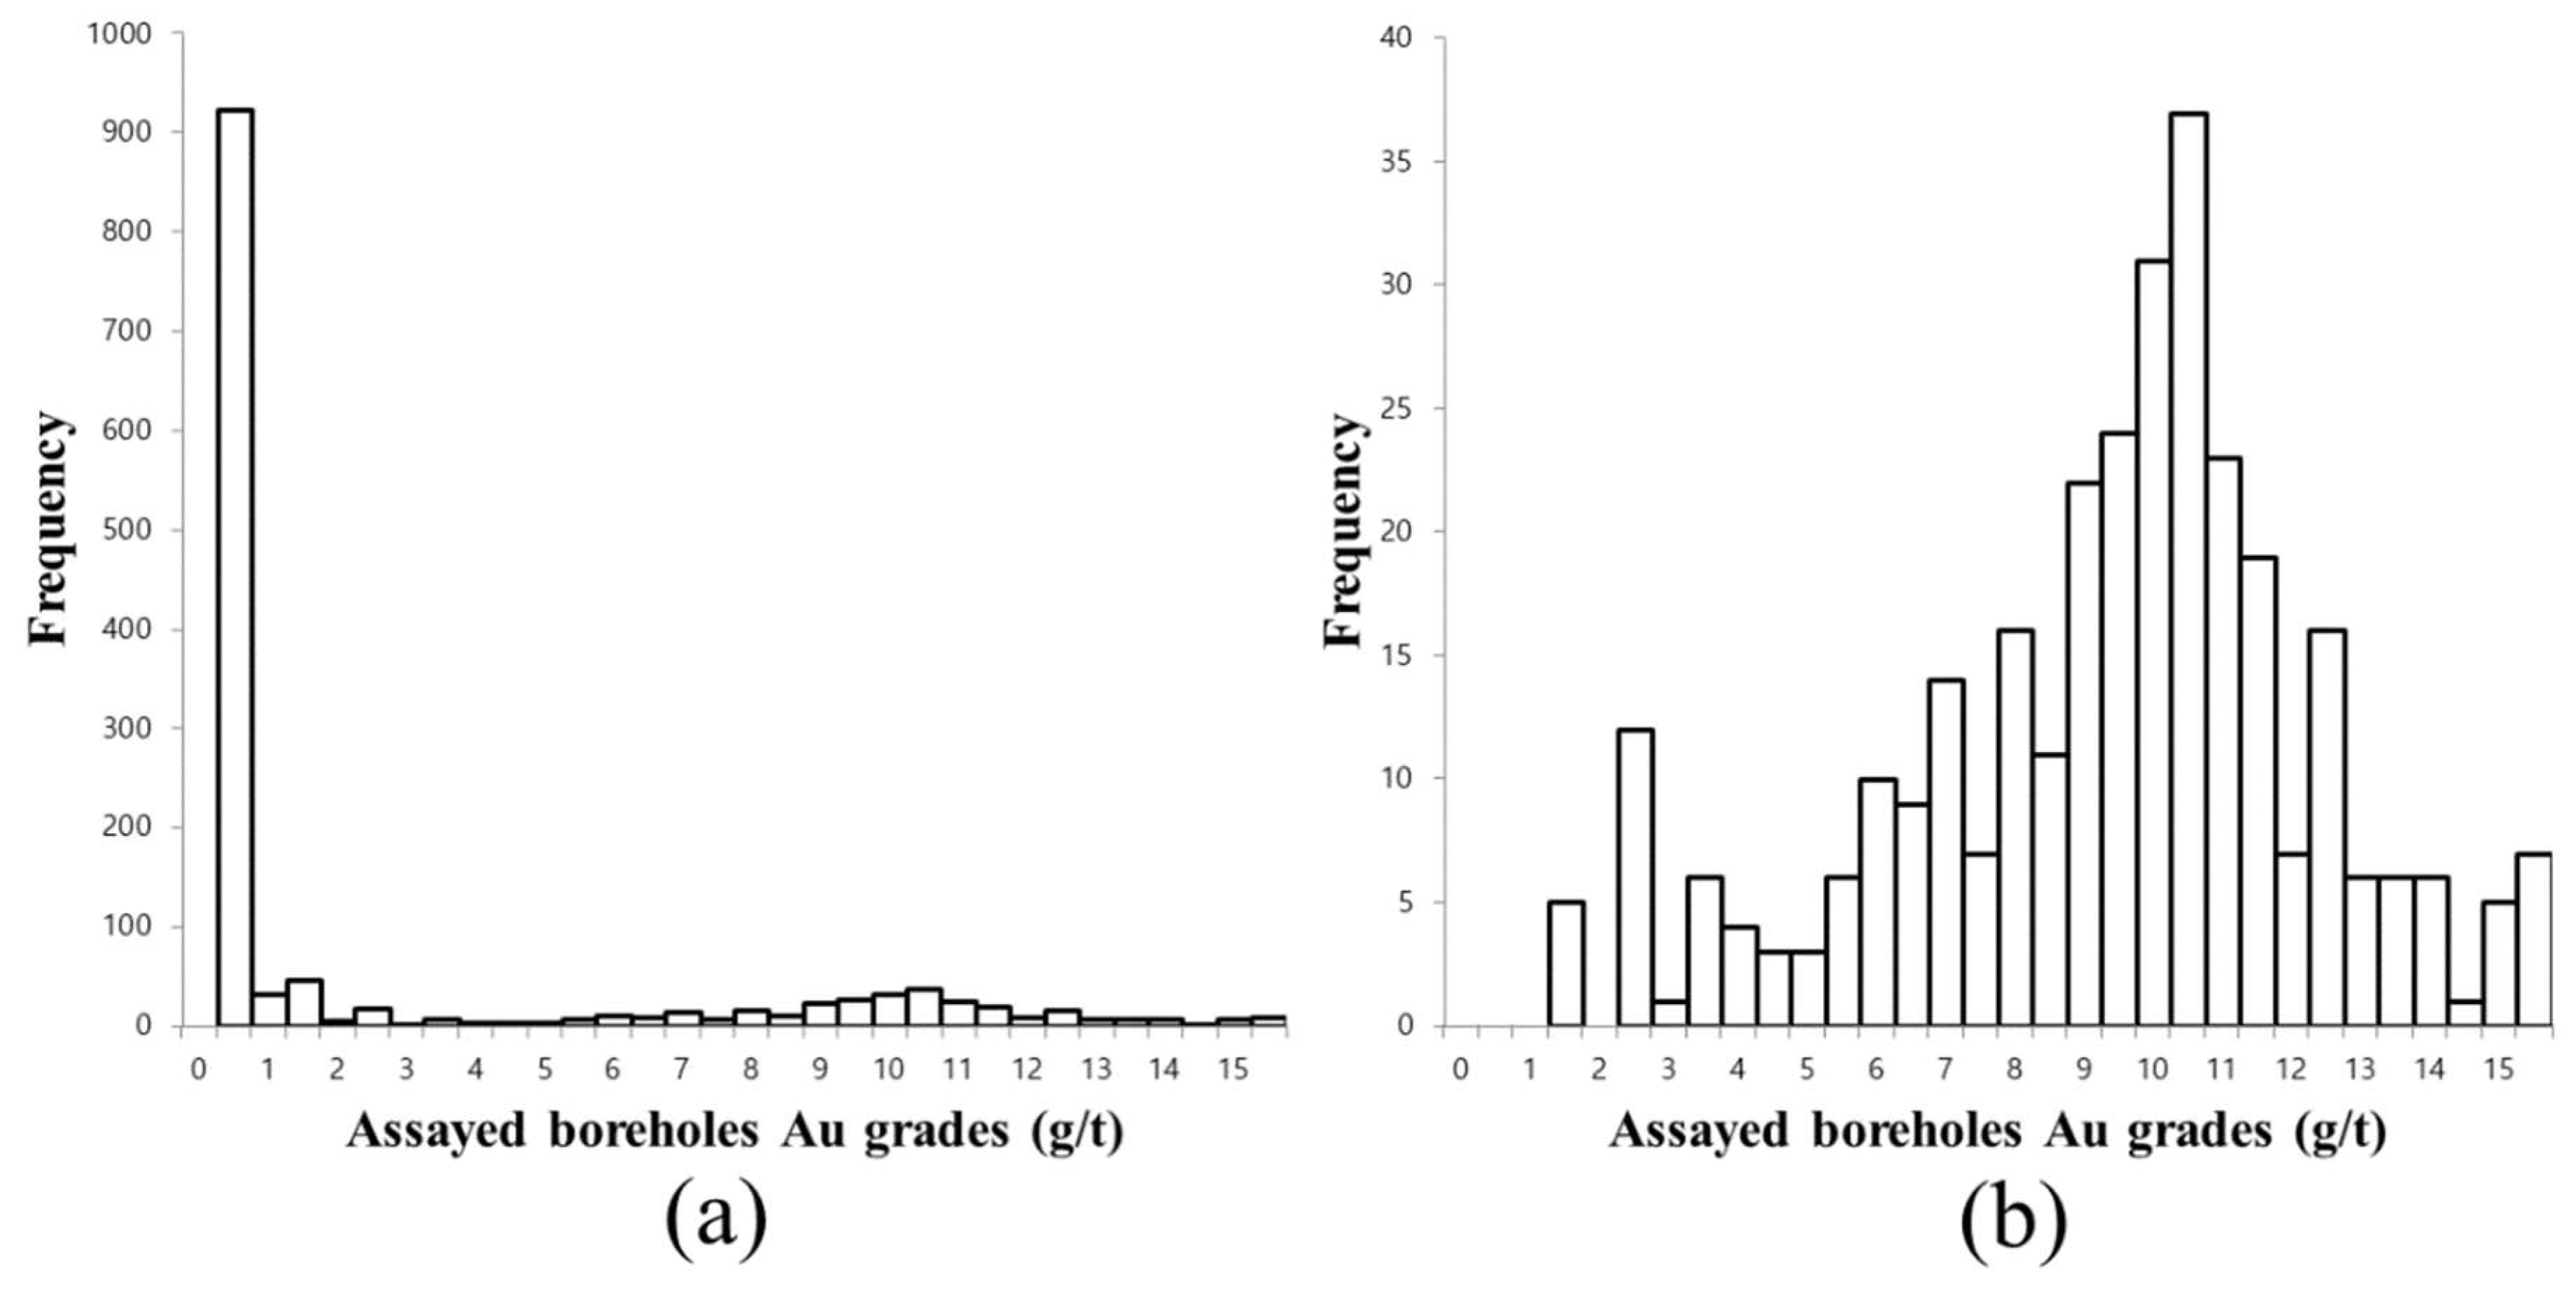
2.1. Study Area and Data
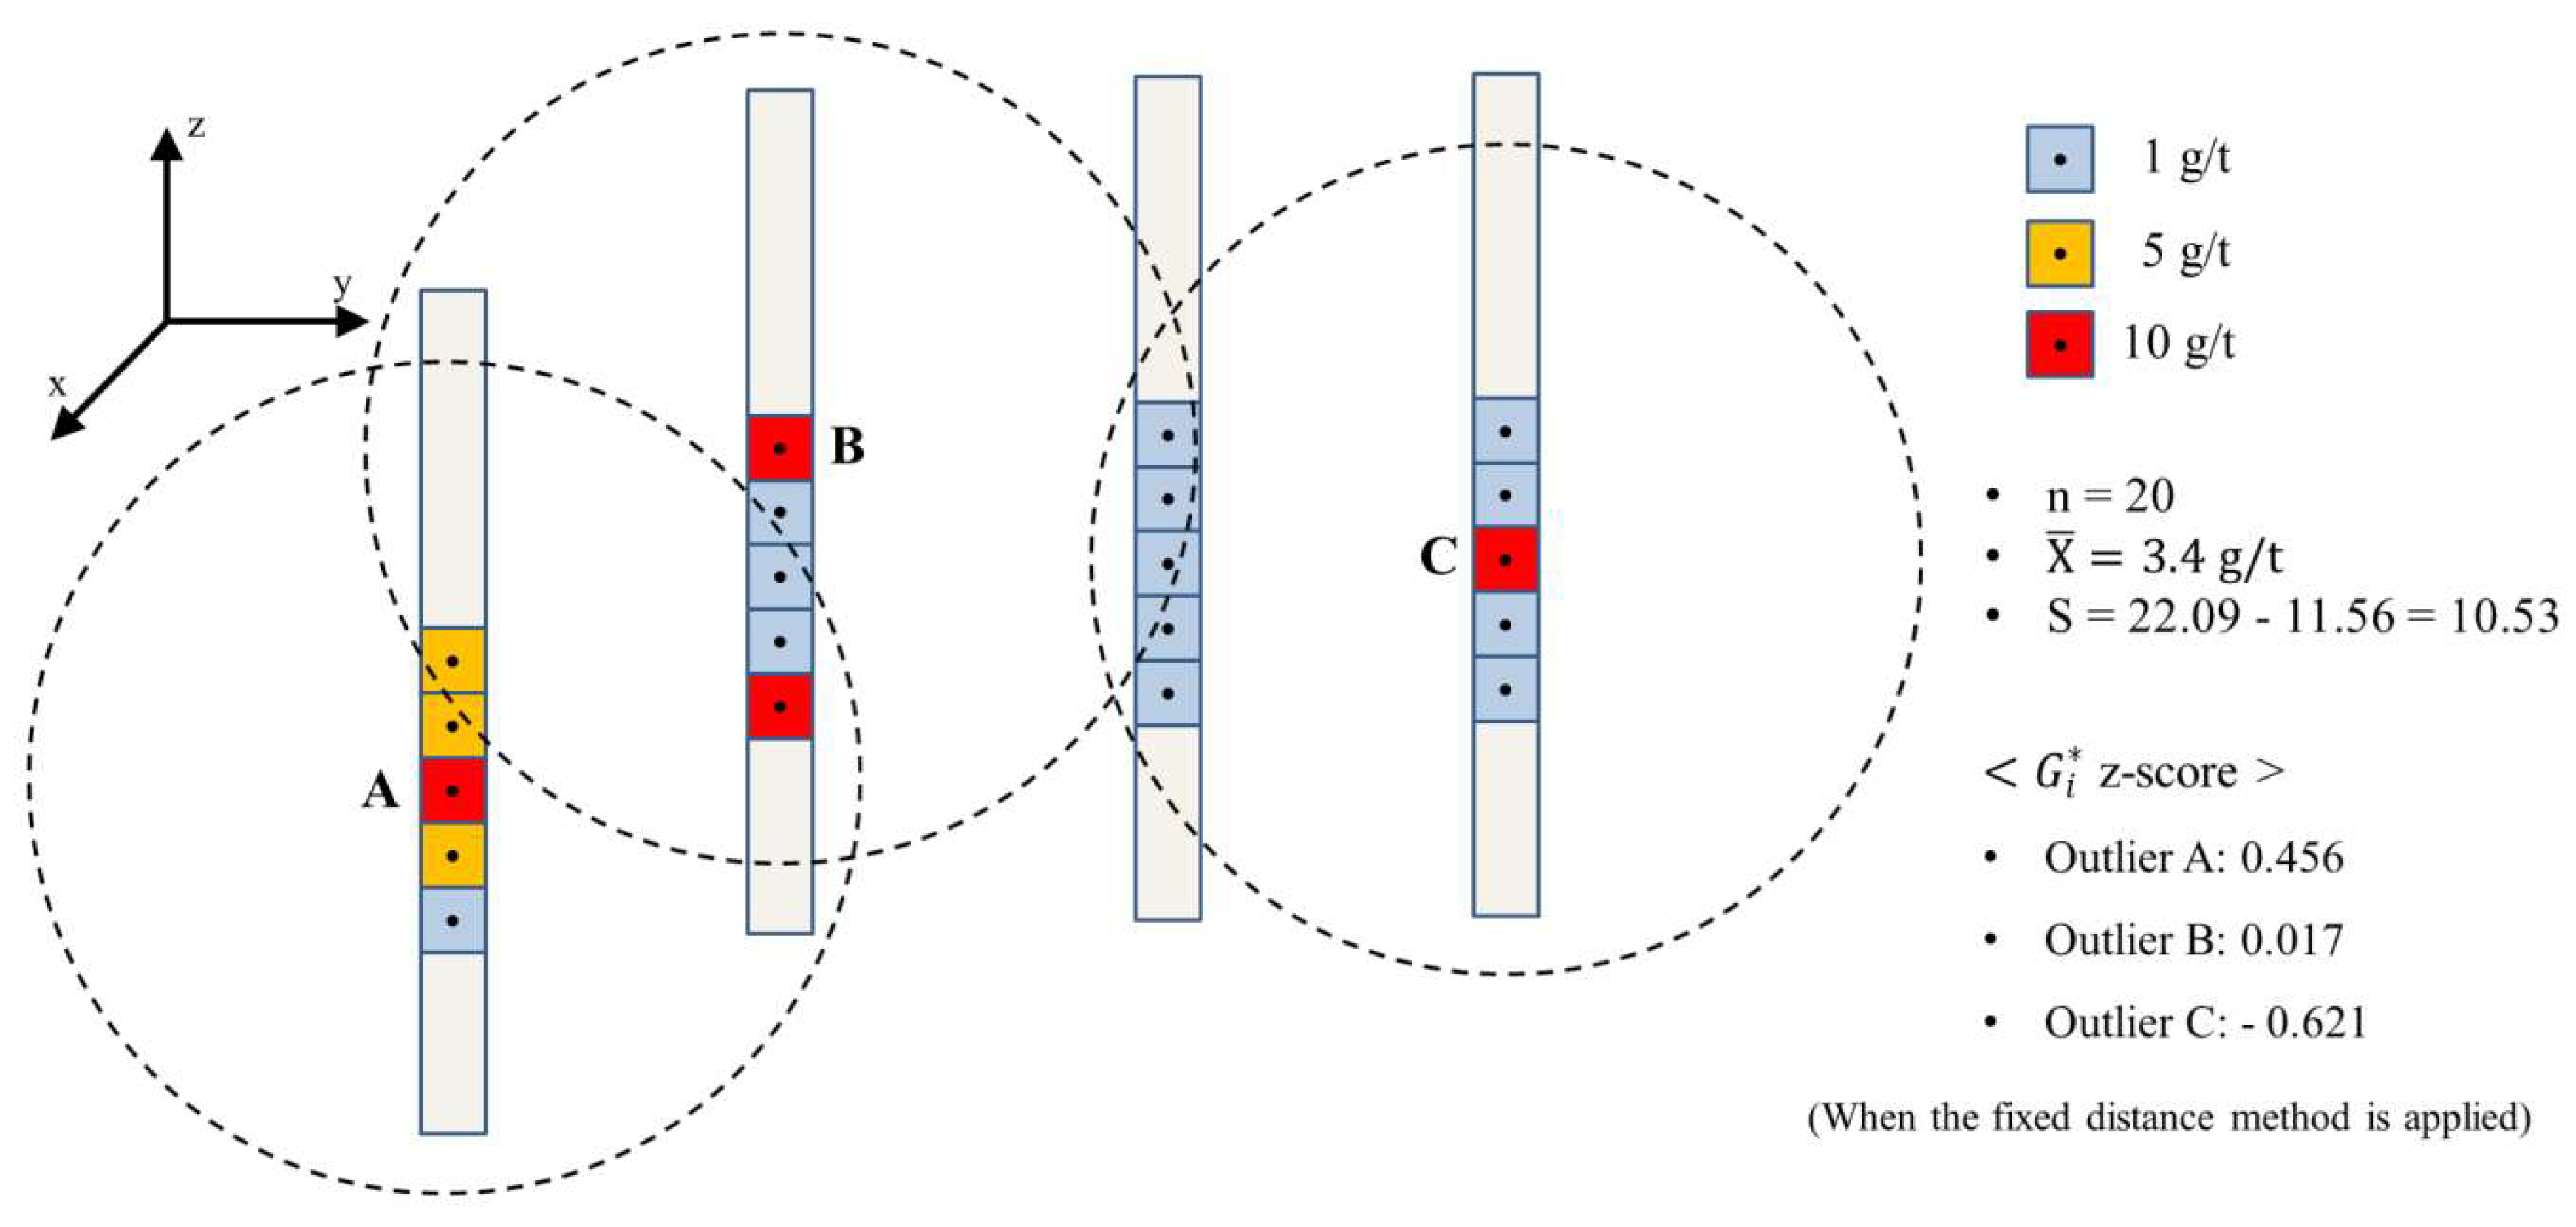
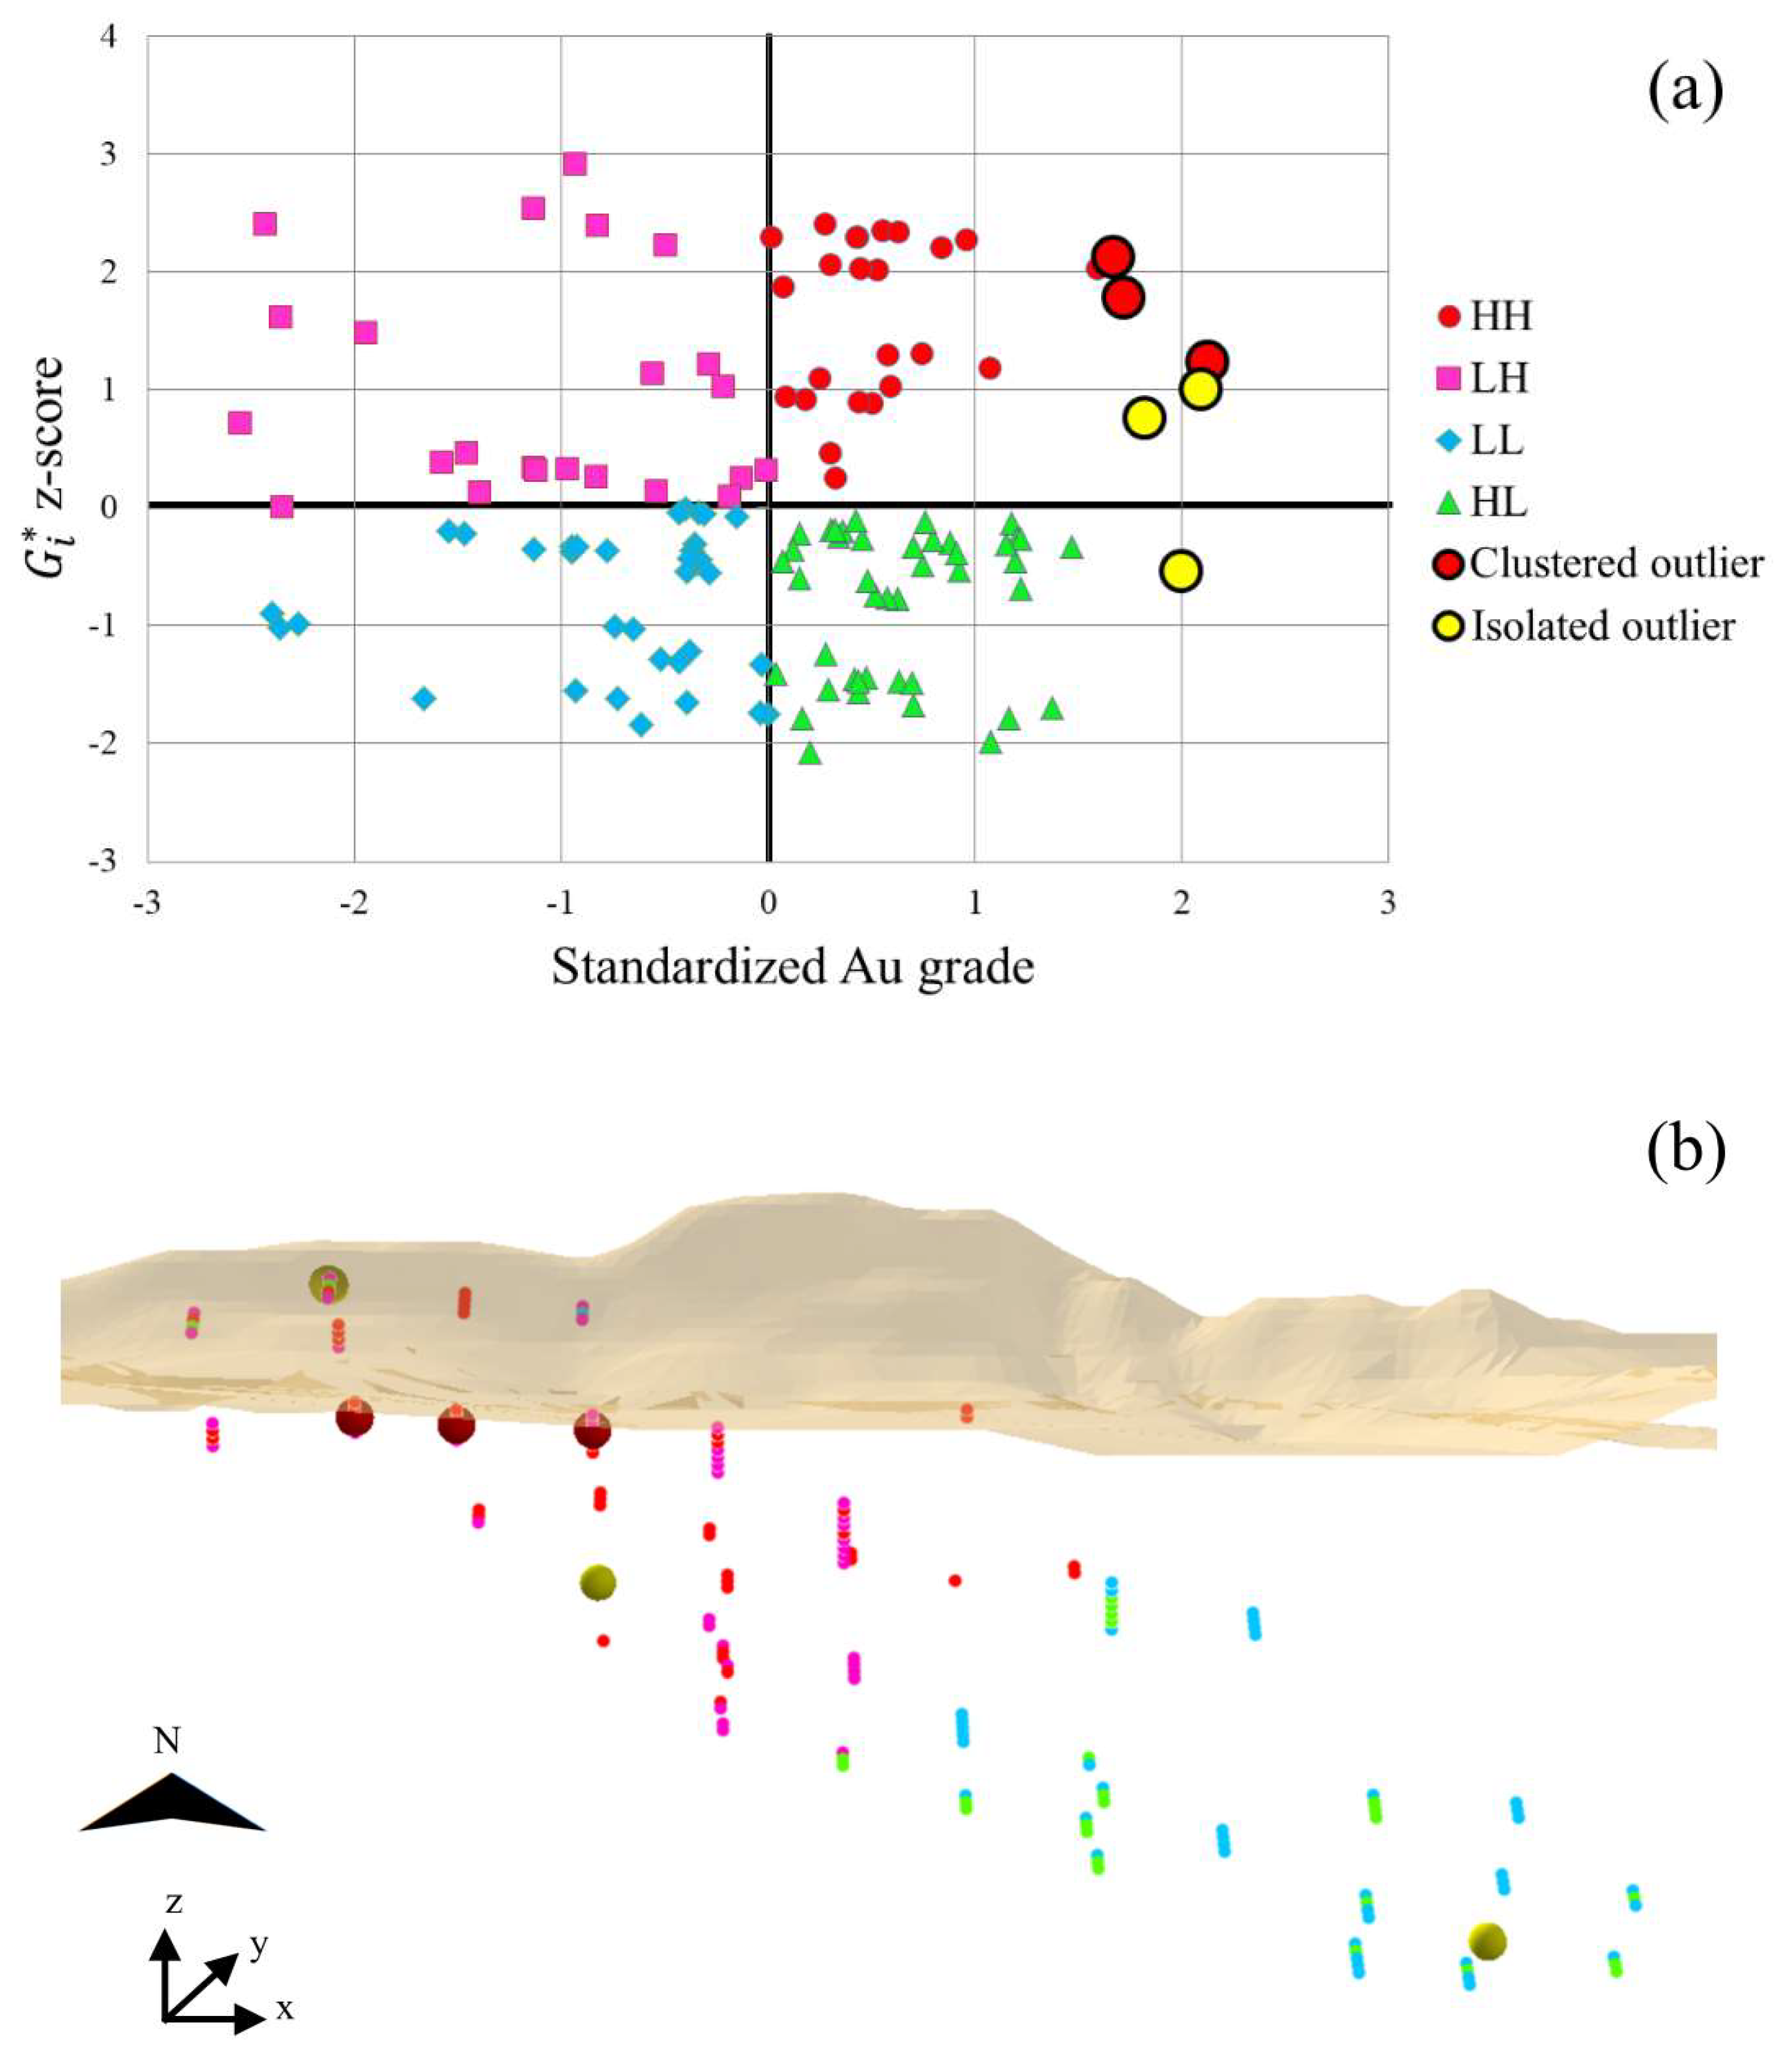
2.2. Hot Spot Analysis for Determining the Capping Grade
2.3. Variography and Grade Estimation
3. Results and Discussion
3.1. Outlier Determination
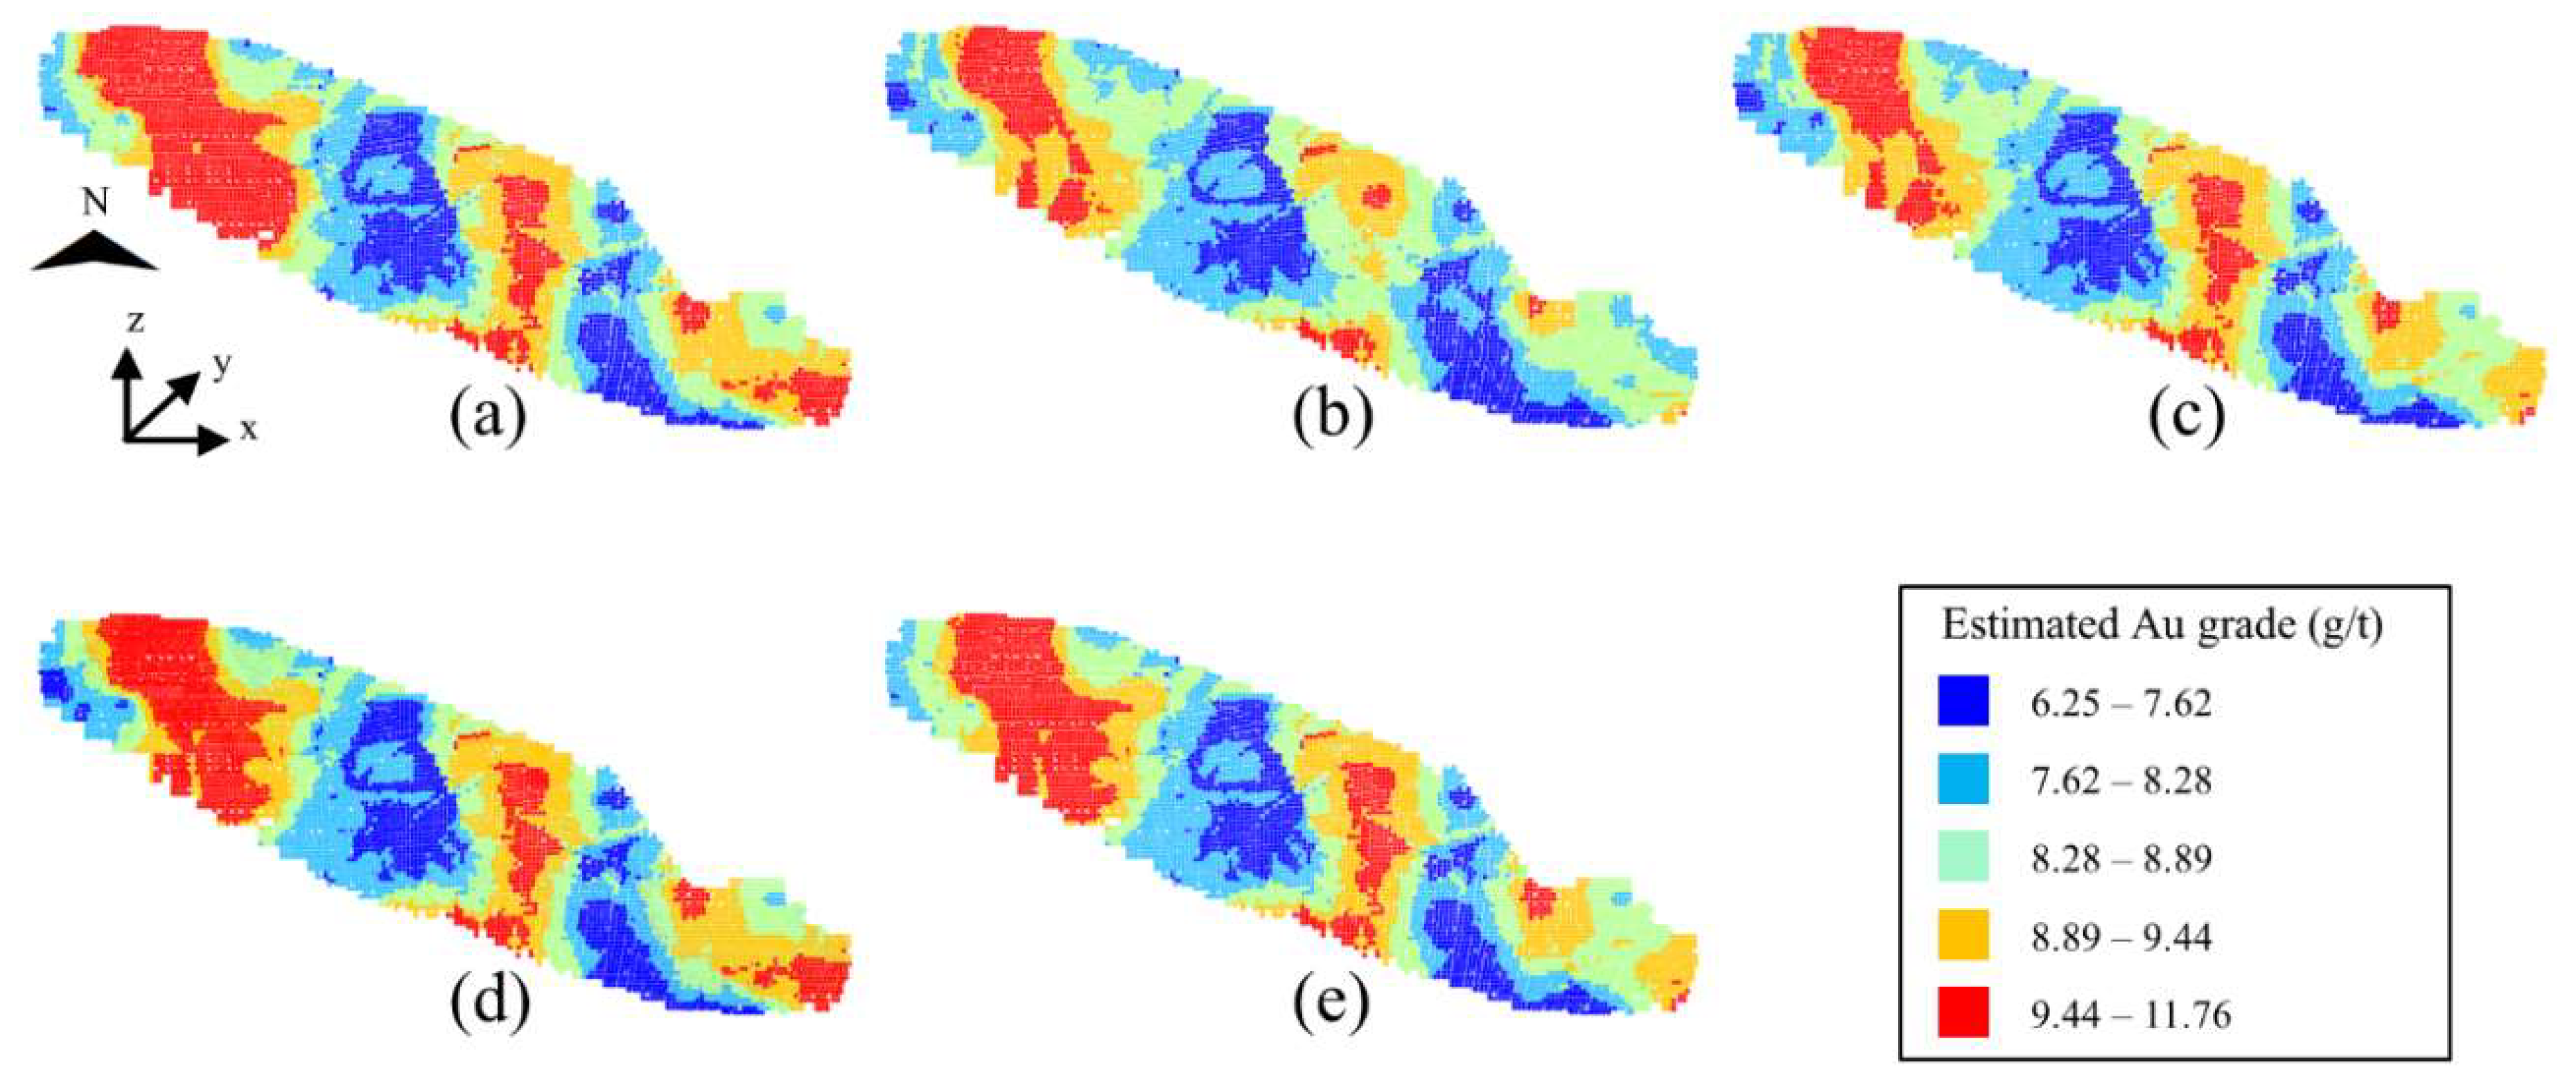
3.2. Variogram Modeling and Kriging Analysis
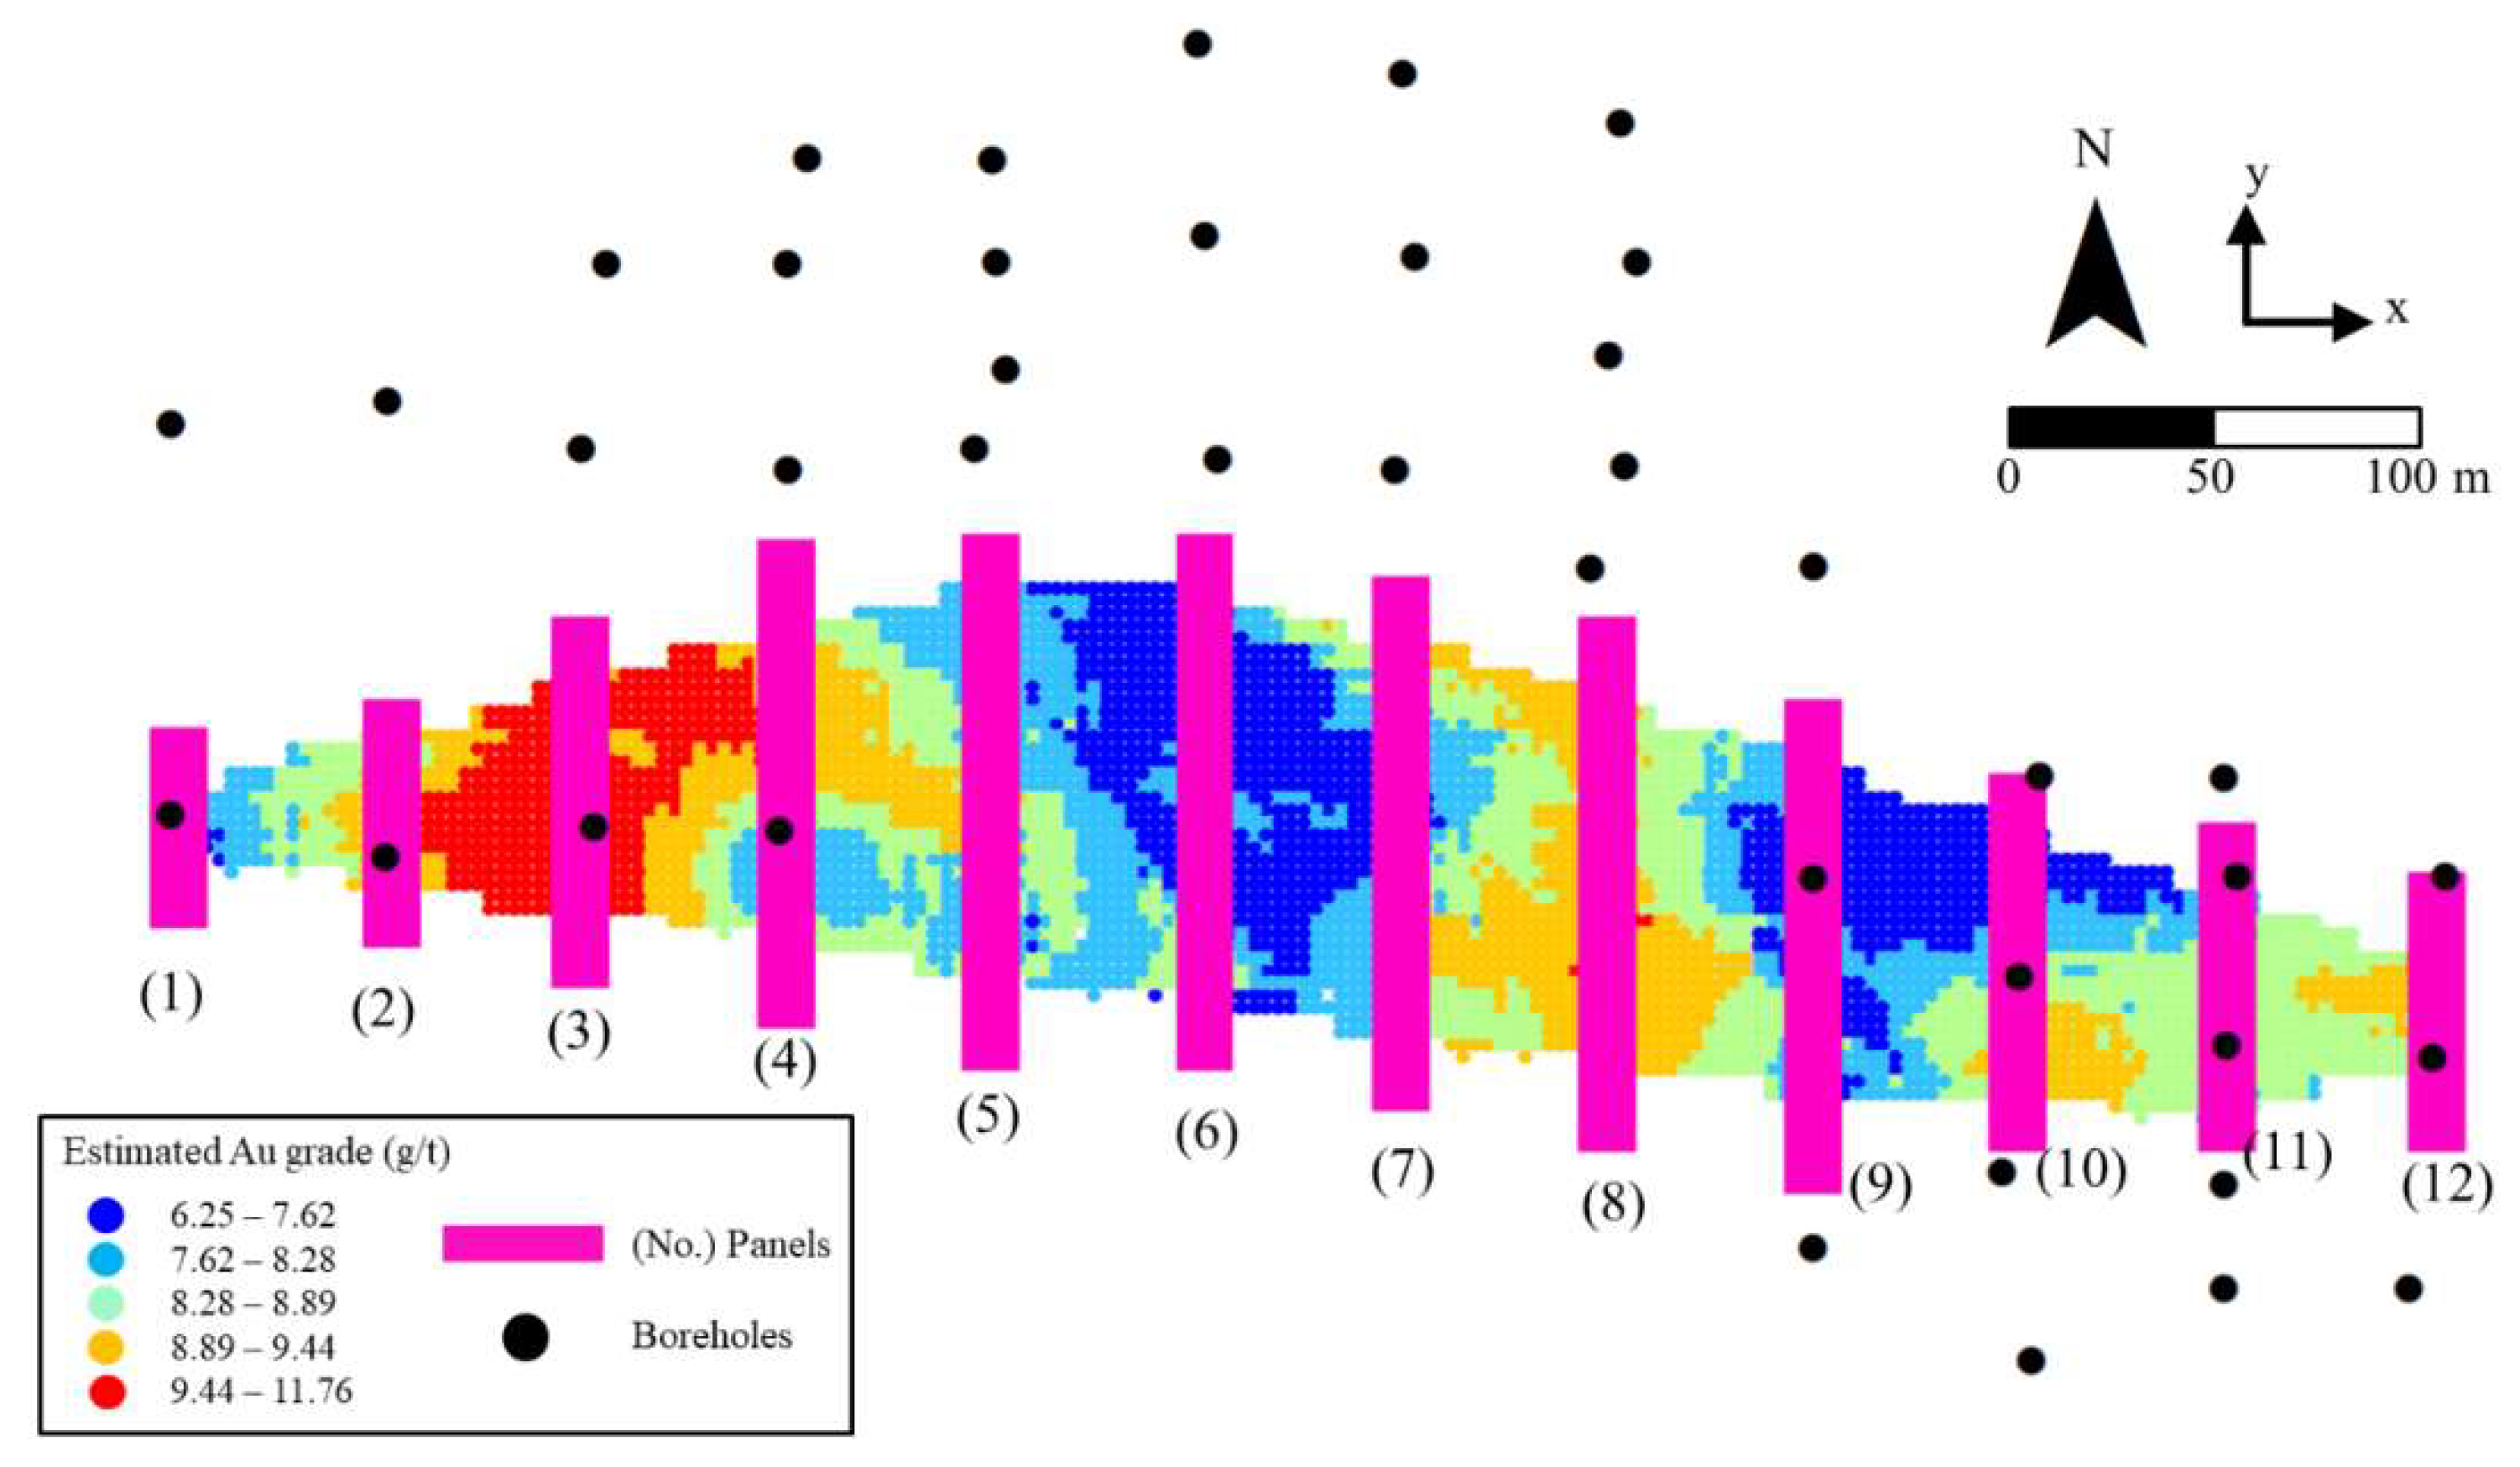
3.3. Validation
4. Conclusions
Author Contributions
Funding
Conflicts of Interest
References
- Mallet, J.L. Geomodeling Applied Geostatistics Serie; Oxford University Press: New York, NY, USA, 2002. [Google Scholar]
- Zanchi, A.; Francescac, S.; Stefano, Z.; Simone, S.; Graziano, G. 3D reconstruction of complex geological bodies: Examples from the Alps. Comput. Geosci. 2009, 35, 49–69. [Google Scholar] [CrossRef]
- Bullock, R.L.; Mernitz, S. Mineral Property Evaluation: Handbook for Feasibility Studies and Due Diligence; Society for Mining, Metallurgy & Exploration: Englewood, NJ, USA, 2017. [Google Scholar]
- Valley, M.; David, M.; Dagbert, M.; Desrochers, C. Guide to the Evaluation of Gold Deposits; Geological Society of CIM: Calgary, AB, Canada, 1992. [Google Scholar]
- Sinclair, A.J. A fundamental approach to threshold estimation in exploration geochemistry: Probability graphs revisited. J. Geochem. Explor. 1991, 41, 1–22. [Google Scholar] [CrossRef]
- Parker, H.M. Statistical treatment of outlier data in epithermal gold deposit reserve estimation. Math. Geol. 1991, 23, 175–199. [Google Scholar] [CrossRef]
- Sinclair, A.J.; Garston, H.B. Applied Mineral Inventory Estimation; Cambridge University Press: Cambridge, UK, 2006. [Google Scholar]
- Rossi, M.E.; Clayton, V.D. Mineral Resource Estimation; Springer: Berlin, Germany, 2013. [Google Scholar]
- Getis, A.; Ord, J.K. The analysis of spatial association by use of distance statistics. Geogr. Anal. 1992, 24, 189–206. [Google Scholar] [CrossRef]
- McClintock, N. Assessing soil lead contamination at multiple scales in Oakland, California: Implications for urban agriculture and environmental justice. Appl. Geogr. 2012, 35, 460–473. [Google Scholar] [CrossRef]
- Griffith, D.A.; Chun, Y.; Lee, M. Locational Error Impacts on Local Spatial Autocorrelation Indices: A Syracuse Soil Sample Pb-Level Data Case Study. In Proceedings of the Spatial Accuracy Assessment in Natural Resources and Environmental Sciences, Montpellier, France, 5–8 July 2016. [Google Scholar]
- Kim, S.M.; Choi, Y. Assessing statistically significant heavy-metal concentrations in abandoned mine areas via Hot Spot Analysis of portable XRF data. Int. J. Environ. Res. Public Health 2017, 14, 654. [Google Scholar] [CrossRef] [PubMed]
- Rose, W.L.; Burge, C.; Davis, B.; Kozak, A.; Sim, R.; Wells, G.S. Mina De Cobre Panamá Project, Panamá, NI 43-101 Technical Report; Inmet Mining Corporation: Toronto, ON, Canada, 2010. [Google Scholar]
- Sepp, M.D.; John, H.D. Structural evolution, vein orientation, and paragenesis of the botija porphyry Cu-Mo-(Au) deposit, Panama. Econ. Geol. 2018, 113, 857–890. [Google Scholar] [CrossRef]
- Gray, D.; Lawlor, M.; Stone, R. Cobre Panamá Project, Colón Province, Republic of Panamá, NI 43-101 Technical Report; First Quantum Minerals Limited: Vancouver, BC, Canada, 2015. [Google Scholar]
- Pan, G. Practical issues of geostatistical reserve estimation in the mining industry. CIM Bull. 1995, 88, 31–37. [Google Scholar]
- Abzalov, M. Applied Mining Geology; Springer: Berlin, Germany, 2016. [Google Scholar]
- Environmental Systems Research Institute (ESRI). ArcGIS Desktop Help 10.2 How Hot Spot Analysis (Getis–Ord Gi*) works. Available online: http://resources.arcgis.com/en/help/main/10.2/index.html (accessed on 1 July 2018).
- Wang, G.; Huang, L. 3D geological modeling for mineral resource assessment of the Tongshan Cu deposit, Heilongjiang Province, China. Geosci. Front. 2012, 3, 483–491. [Google Scholar] [CrossRef]
- Shahbeik, S.; Afzal, P.; Moarefvand, P.; Qumarsy, M. Comparison between ordinary kriging (OK) and inverse distance weighted (IDW) based on estimation error. Case study: Dardevey iron ore deposit, NE Iran. Arab. J. Geosci. 2014, 7, 3693–3704. [Google Scholar] [CrossRef]
- Yamamoto, J.K. Quantification of uncertainty in ore-reserve estimation: Applications to Chapada copper deposit, State of Goiás, Brazil. Nat. Resour. Res. 1999, 8, 153–163. [Google Scholar] [CrossRef]
- Badel, M.; Angorani, S.; Panahi, M.S. The application of median indicator kriging and neural network in modeling mixed population in an iron ore deposit. Comput. Geosci. 2011, 37, 530–540. [Google Scholar] [CrossRef]
- Lemmer, I.C. Estimating local recoverable reserves via indicator kriging. In Geostatistics for Natural Resources Characterization; Springer: Dordrecht, The Netherlands, 1984; pp. 349–364. [Google Scholar]
- Abzalov, M. Quality control of assay data: A review of procedures for measuring and monitoring precision and accuracy. Explor. Min. Geol. 2008, 17, 131–144. [Google Scholar] [CrossRef]
- Abzalov, M.; Bower, J. Geology of bauxite deposits and their resource estimation practices. Appl. Earth Sci. 2014, 123, 118–134. [Google Scholar] [CrossRef]


| Minimum (g/t) | Maximum (g/t) | Average (g/t) | Skewness | Total Amount of Au (t) | ||
|---|---|---|---|---|---|---|
| Ordinary kriging | All data | 6.25 | 11.76 | 8.63 | 0.44 | 15.54 |
| Prob top-cut | 6.37 | 10.39 | 8.30 | 0.14 | 14.95 | |
| Perc top-cut | 6.38 | 10.86 | 8.44 | 0.21 | 15.13 | |
| Std top-cut | 6.29 | 11.15 | 8.55 | 0.26 | 15.40 | |
| Hot spot top-cut | 6.31 | 11.31 | 8.53 | 0.34 | 15.36 | |
| Assayed borehole data | 1.79 | 14.63 | 8.80 | −0.50 | - | |
| Panel 01 | Panel 02 | Panel 03 | Panel 04 | Panel 05 | Panel 06 | Panel 07 | Panel 08 | Panel 09 | Panel 10 | Panel 11 | Panel 12 | |
|---|---|---|---|---|---|---|---|---|---|---|---|---|
| A 1 | 7.70 | 9.75 | 10.64 | 9.41 | 8.40 | 7.63 | 8.43 | 9.48 | 7.51 | 8.41 | 8.93 | 9.46 |
| B 2 | 7.59 | 8.76 | 9.79 | 8.65 | 8.35 | 7.70 | 8.42 | 9.12 | 7.51 | 7.94 | 8.31 | 8.56 |
| C 3 | 7.56 | 8.77 | 10.06 | 8.68 | 8.26 | 7.68 | 8.45 | 9.48 | 7.57 | 8.39 | 8.43 | 9.26 |
| D 4 | 7.52 | 9.23 | 10.37 | 8.97 | 8.42 | 7.64 | 8.44 | 9.52 | 7.53 | 8.42 | 8.93 | 9.47 |
| E 5 | 7.73 | 9.47 | 10.52 | 8.97 | 8.34 | 7.65 | 8.44 | 9.48 | 7.54 | 8.38 | 8.43 | 9.26 |
| F 6 | 7.53 | 9.95 | 11.04 | 9.40 | 8.37 | 7.92 | 8.49 | 9.62 | 6.57 | 8.64 | 8.49 | 9.59 |
© 2018 by the authors. Licensee MDPI, Basel, Switzerland. This article is an open access article distributed under the terms and conditions of the Creative Commons Attribution (CC BY) license (http://creativecommons.org/licenses/by/4.0/).
Share and Cite
Kim, S.-M.; Choi, Y.; Park, H.-D. New Outlier Top-Cut Method for Mineral Resource Estimation via 3D Hot Spot Analysis of Borehole Data. Minerals 2018, 8, 348. https://doi.org/10.3390/min8080348
Kim S-M, Choi Y, Park H-D. New Outlier Top-Cut Method for Mineral Resource Estimation via 3D Hot Spot Analysis of Borehole Data. Minerals. 2018; 8(8):348. https://doi.org/10.3390/min8080348
Chicago/Turabian StyleKim, Sung-Min, Yosoon Choi, and Hyeong-Dong Park. 2018. "New Outlier Top-Cut Method for Mineral Resource Estimation via 3D Hot Spot Analysis of Borehole Data" Minerals 8, no. 8: 348. https://doi.org/10.3390/min8080348