1. Introduction
Thalhammerite, ideally Pd
9Ag
2Bi
2S
4, was observed in the same holotype specimen as kravtsovite, PdAg
2S [
1], and vymazalováite, Pd
3Bi
2S
2 [
2]. The type sample (polished section) comes from vein-disseminated pyrite-chalcopyrite-galena ore from the Komsomolsky mine in the Talnakh deposit of the Noril’sk district, Russia. The sample was found at coordinates: 69°30′20″ N and 88°27′17″ E. The mineralization is characterized by lack of Ni minerals and high galena content and Pt-Pd-Ag bearing minerals in an association of pyrite and chalcopyrite. The host rocks of pyrite-chalcopyrite-galena ore are diopside-hydrogrosssular-serpentine metasomatites developed in diopside-monticellite skarns below the lower exocontact of the Talnakh intrusion (the eastern part of the Komsomolsky mine). Thalhammerite, in pyrite-chalcopyrite-galena ores, occurs in association with cooperite, braggite, vysotskite, stibiopalladinite, telargpalite, sobolevskite, kotulskite, sopcheite, insizwaite, kravtsovite, vymazalováite, Au-Ag alloys, and Ag-bearing sulphides, selenides, sulphoselenides, and tellurosulphoselenides. The mineral was also observed in vein-disseminated millerite-bornite-chalcopyrite ore from the Talnakh and Oktyabrsk deposits of the Noril’sk region [
3]. The host rocks of millerite-bornite-chalcopyrite ore are pyroxene-hornfels at the lower exocontact of the Kharaelakh intrusion (the western part of the Komsomolsky mine). In millerite-bornite-chalcopyrite ore, thalhammerite occurs in association with kotulskite, telargpalite, laflammeite, and Au-Ag alloys.
The mineral likely formed under the same conditions as kravtsovite and vymazalováite, with decreasing temperature [
3], most likely below 400 °C. Thalhammerite was also observed, in intergrowths with sobolevskite, in PGE ores from the Fedorov-Pana Layered Intrusive Complex, Russia (V.V. Subbotin—per. communication). Furthermore, the occurrence of unknown phases corresponding to Pb- and Tl-analogues of thalhammerite from the Fedorov-Pana Layered Intrusive Complex has been reported [
4].
Both the mineral and name were approved by the Commission on New Minerals, Nomenclature and Classification of the International Mineralogical Association (IMA No 2017-111). The mineral name is for Dr. Oskar Thalhammer (b. 1956) Associate Professor at the University of Leoben, Austria for his contributions to the ore mineralogy and mineral deposits of platinum group elements. The type specimen is deposited at the Department of Earth Sciences of the Natural History Museum, London, UK, catalogue no. BM 2016, 150.
2. Appearance, and Physical and Optical Properties
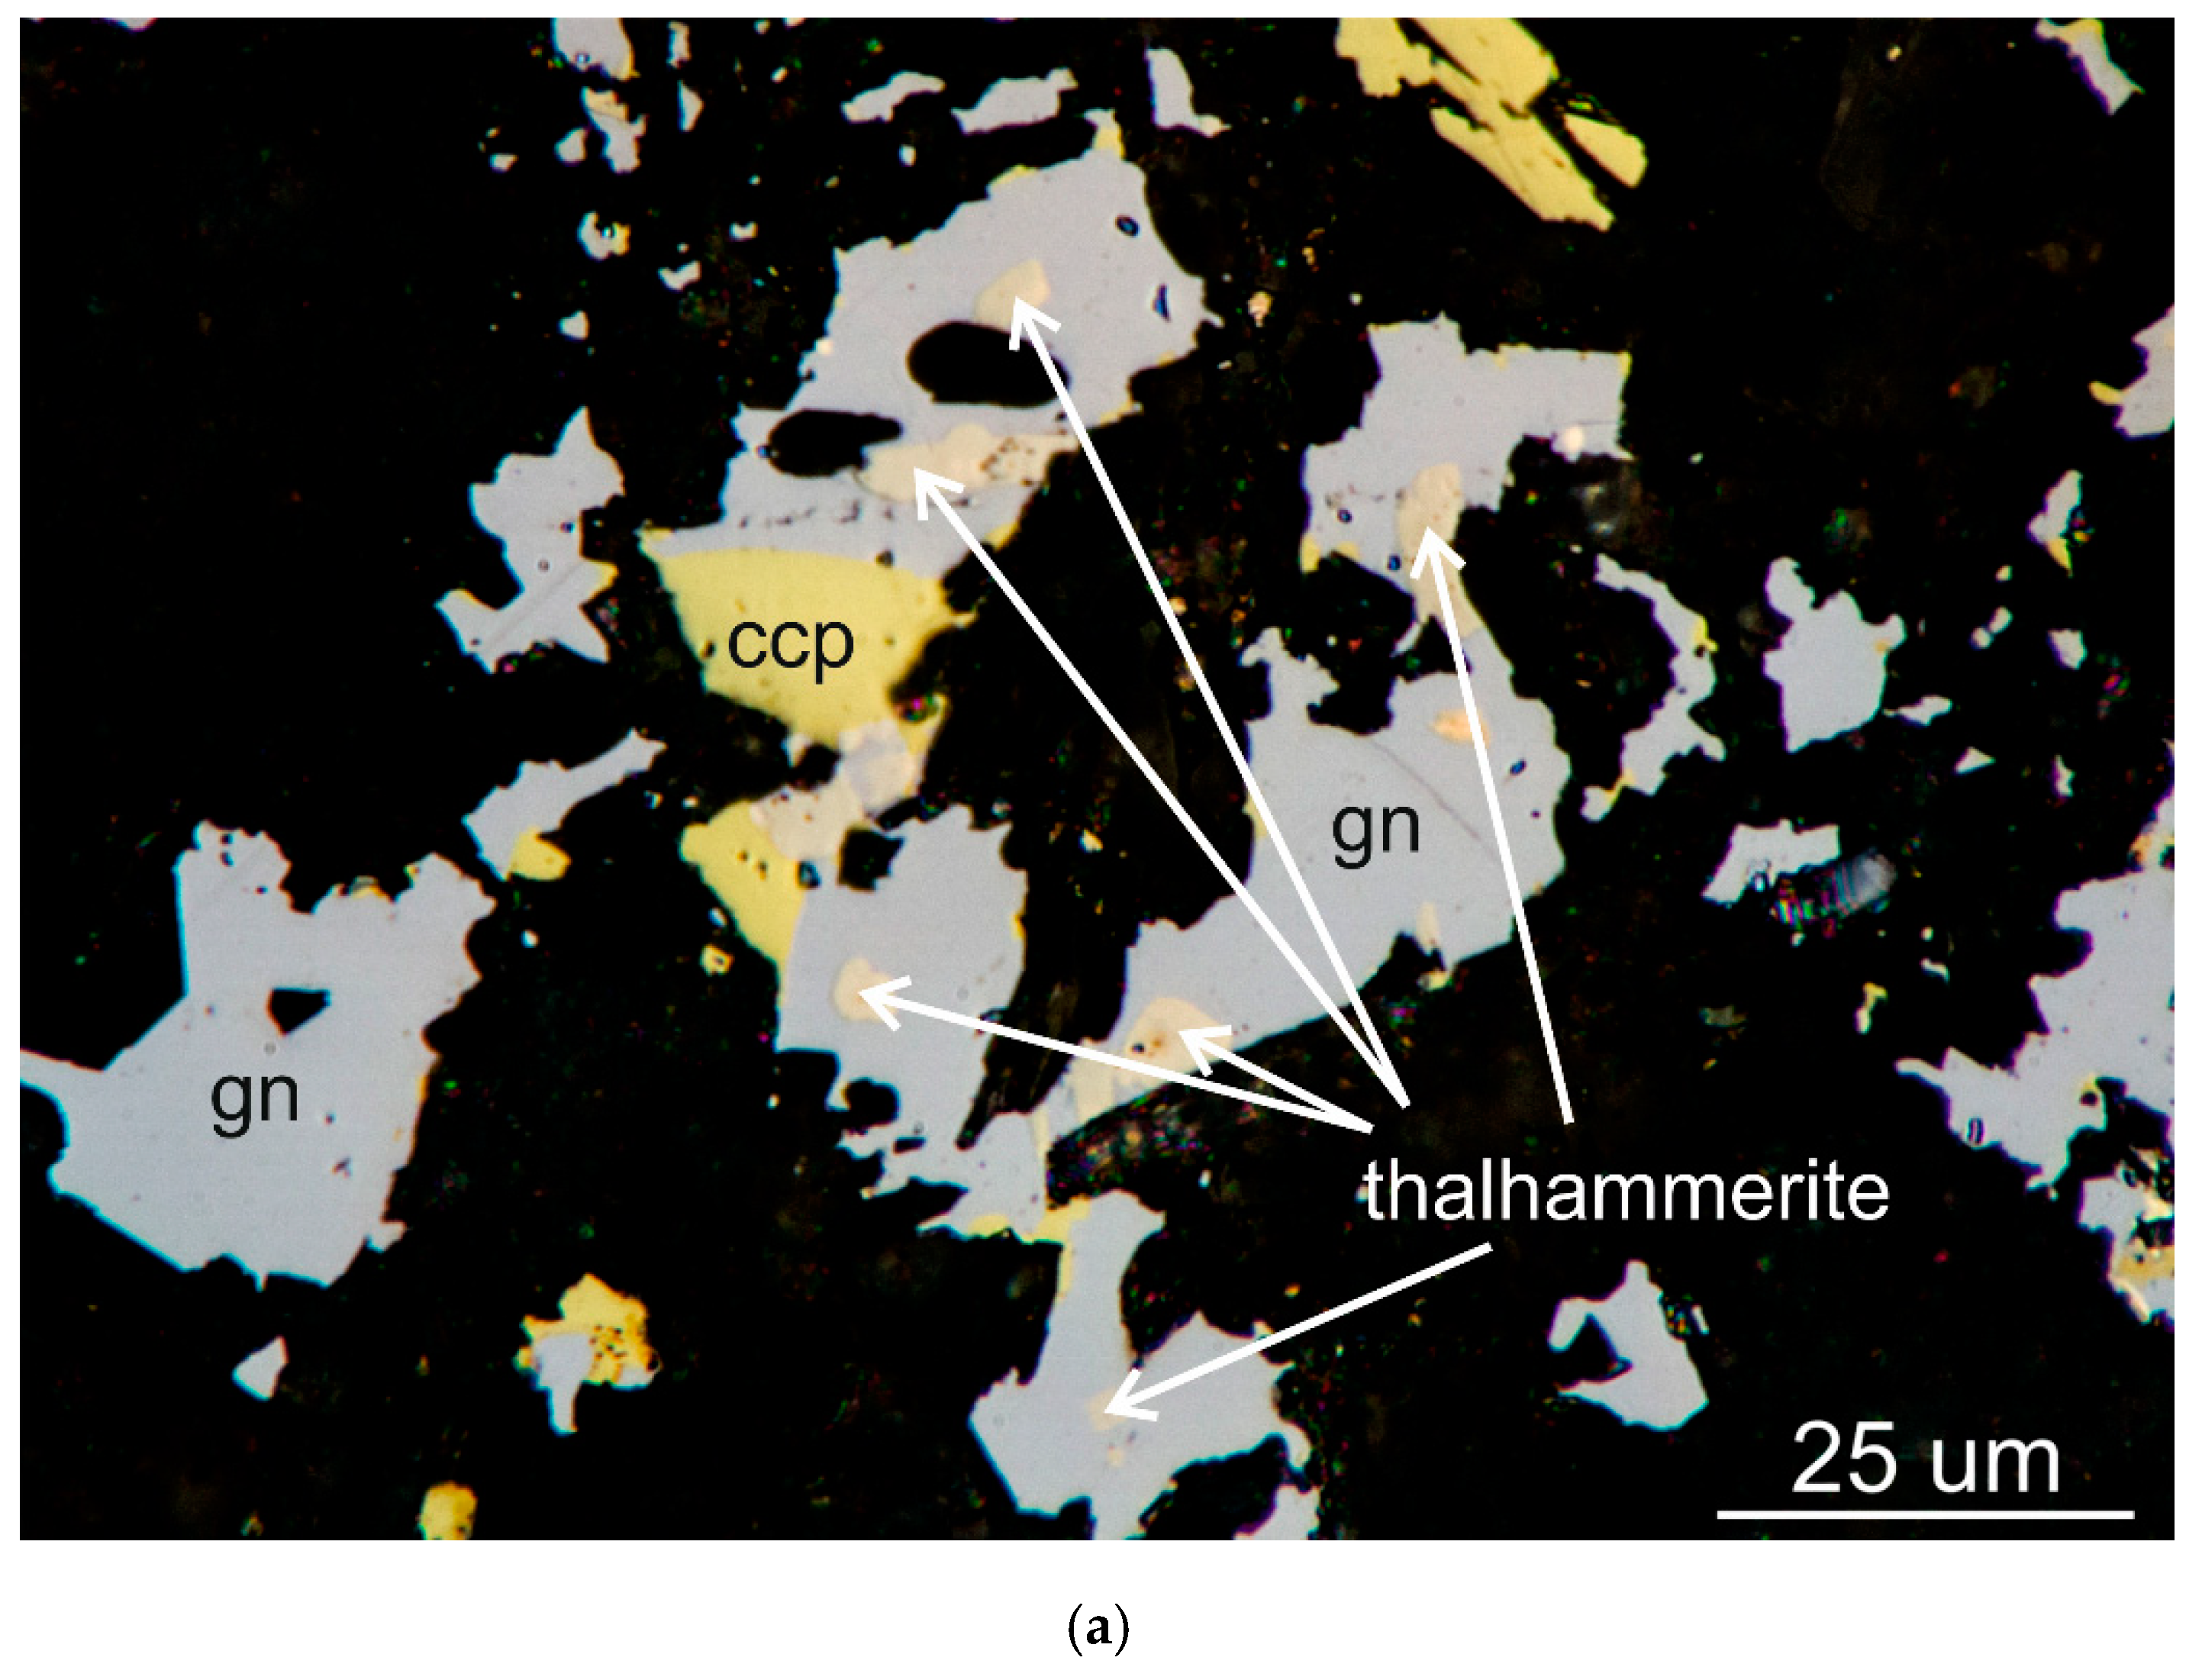
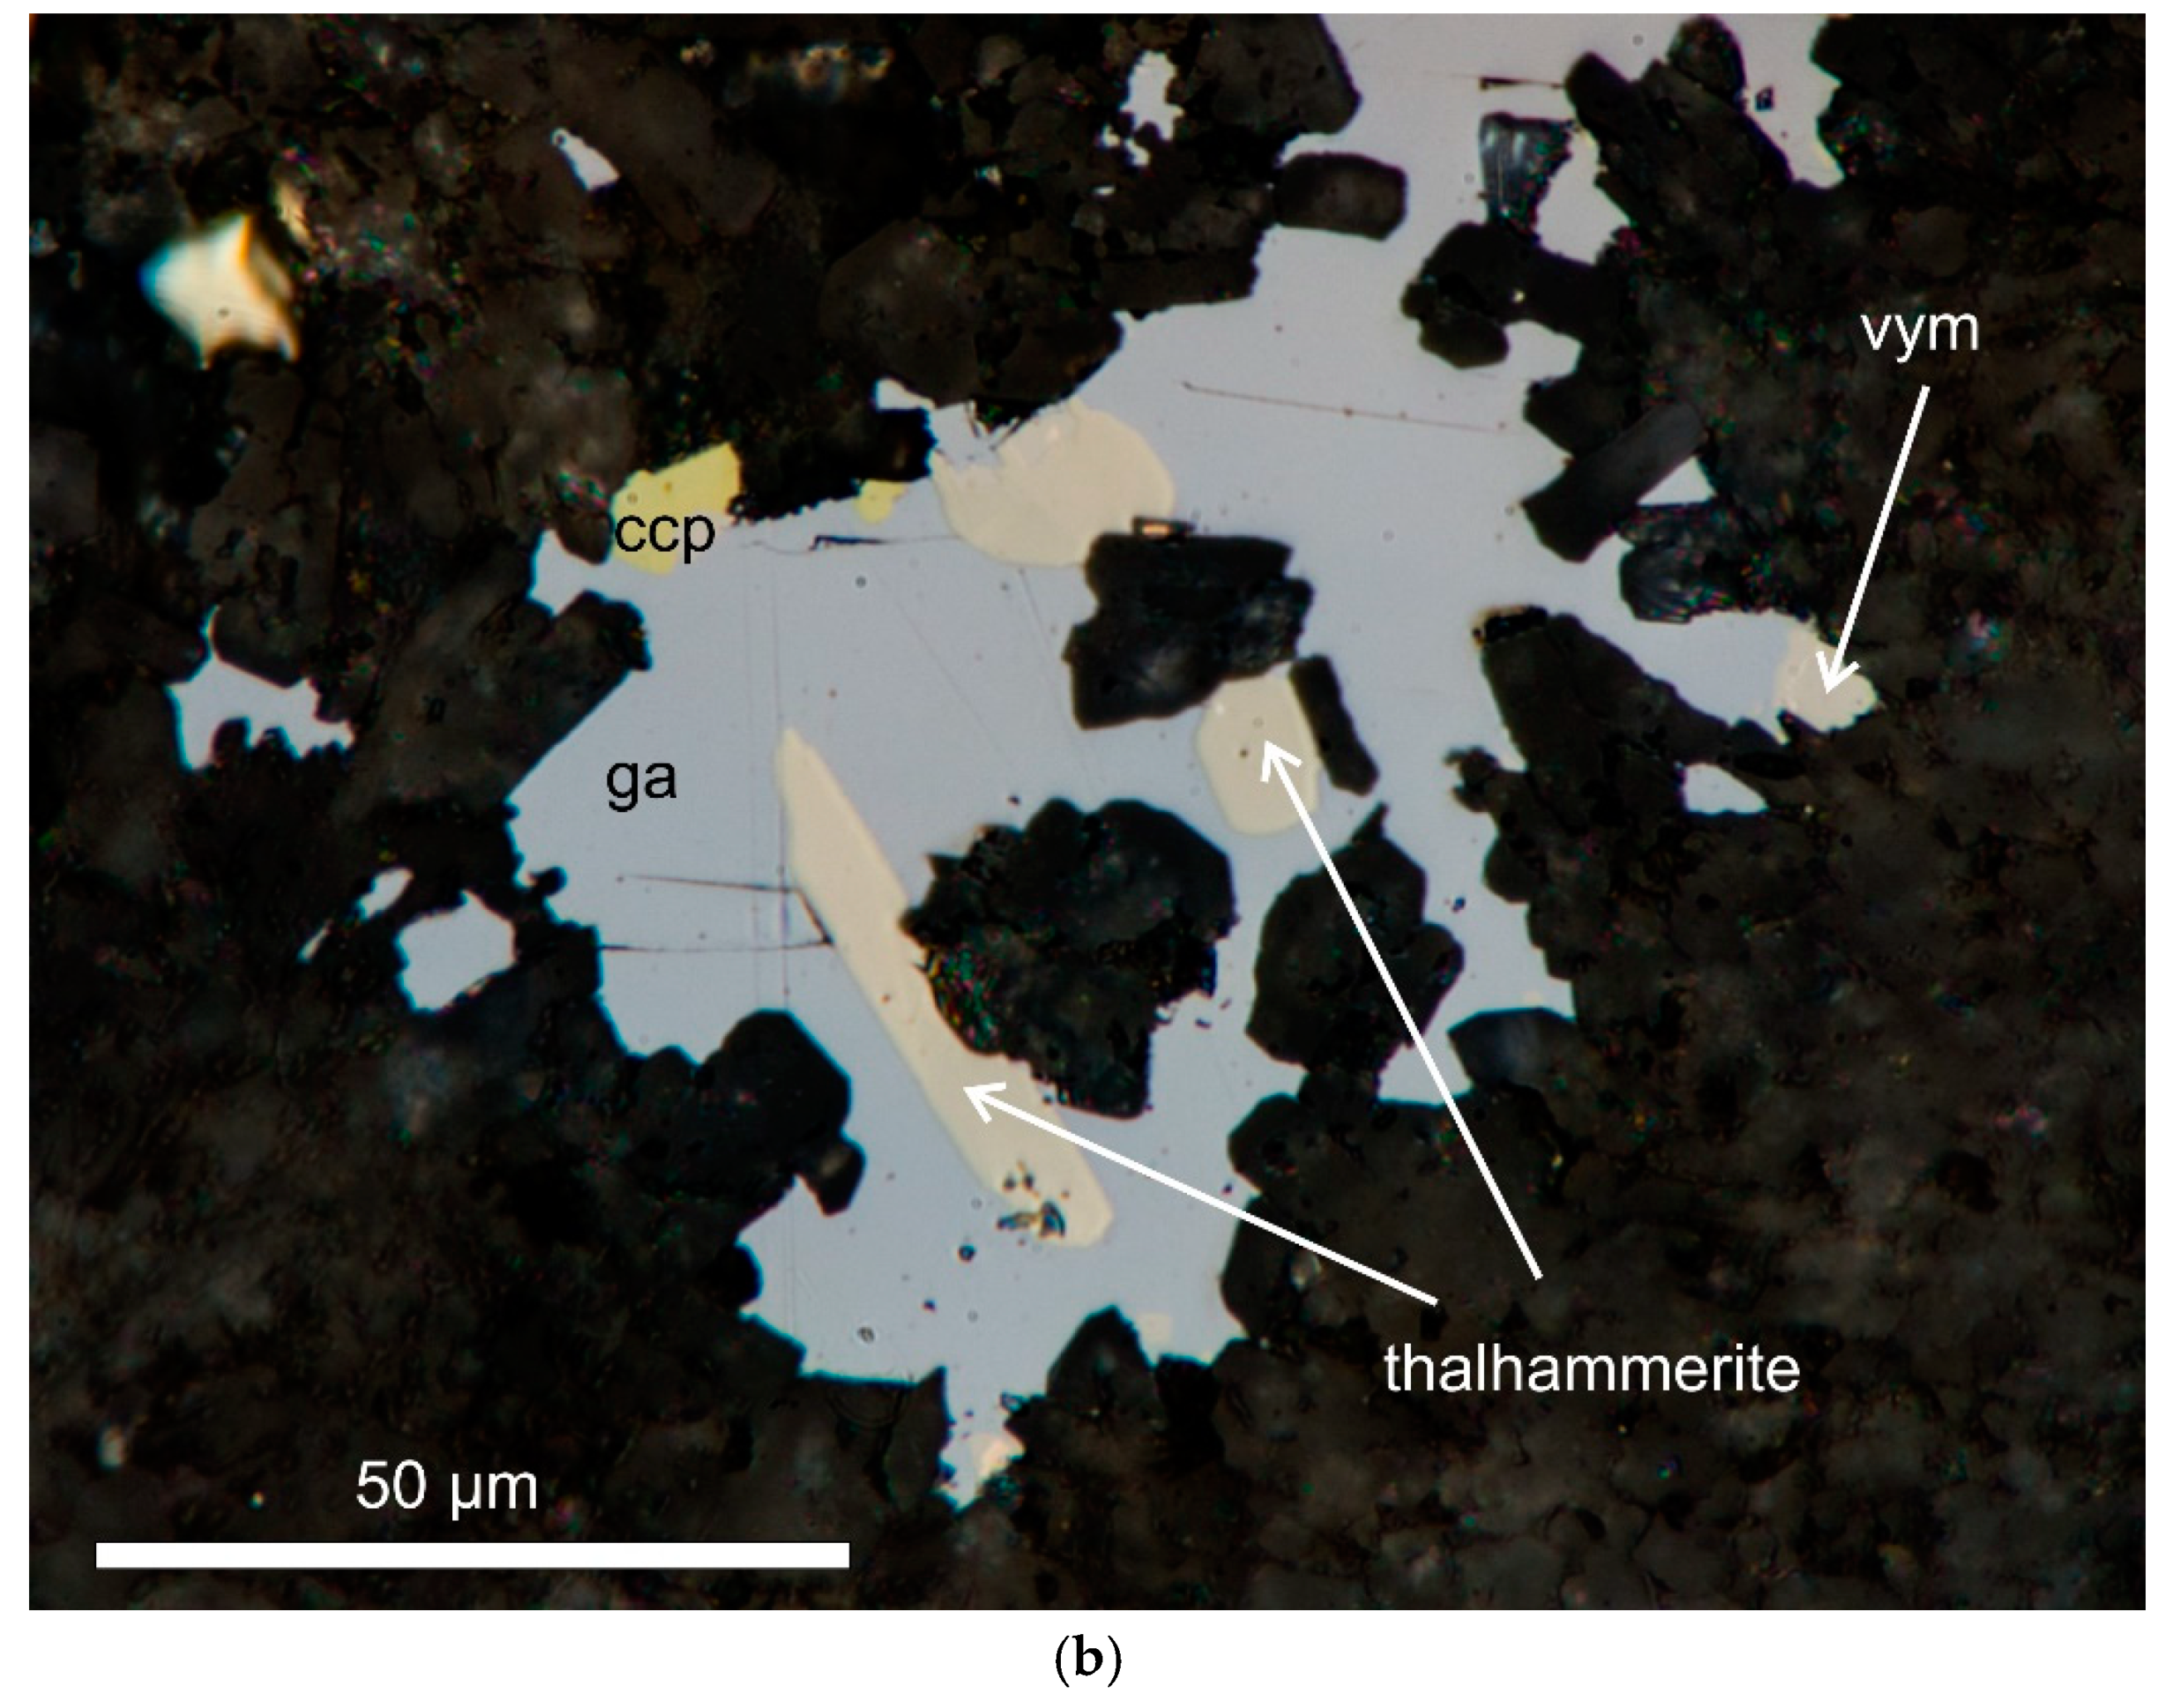
Thalhammerite forms very small inclusions (from a few μm up to about 40–50 μm) in galena, chalcopyrite (
Figure 1), and also in bornite.
The mineral occurs in aggregates (100–200 μm in size) formed by intergrowths of telargpalite, braggite, vysotskite, sopcheite, stibiopalladinite, sobolevskite, moncheite, kotulskite, malyshevite, insizwaite, acanthite, aurian silver, kravtsovite, and vymazalováite in association with galena, chalcopyrite, bornite, millerite, and pyrite.
Thalhammerite is opaque with a metallic lustre. The mineral is brittle. The density calculated on the basis of the empirical formula is 9.72 g/cm3. In plane-polarized light, thalhammerite is light yellow with weak bireflectance, weak pleochroism, in shades of slightly yellowish brown and weak anisotropy. It exhibits no internal reflections.
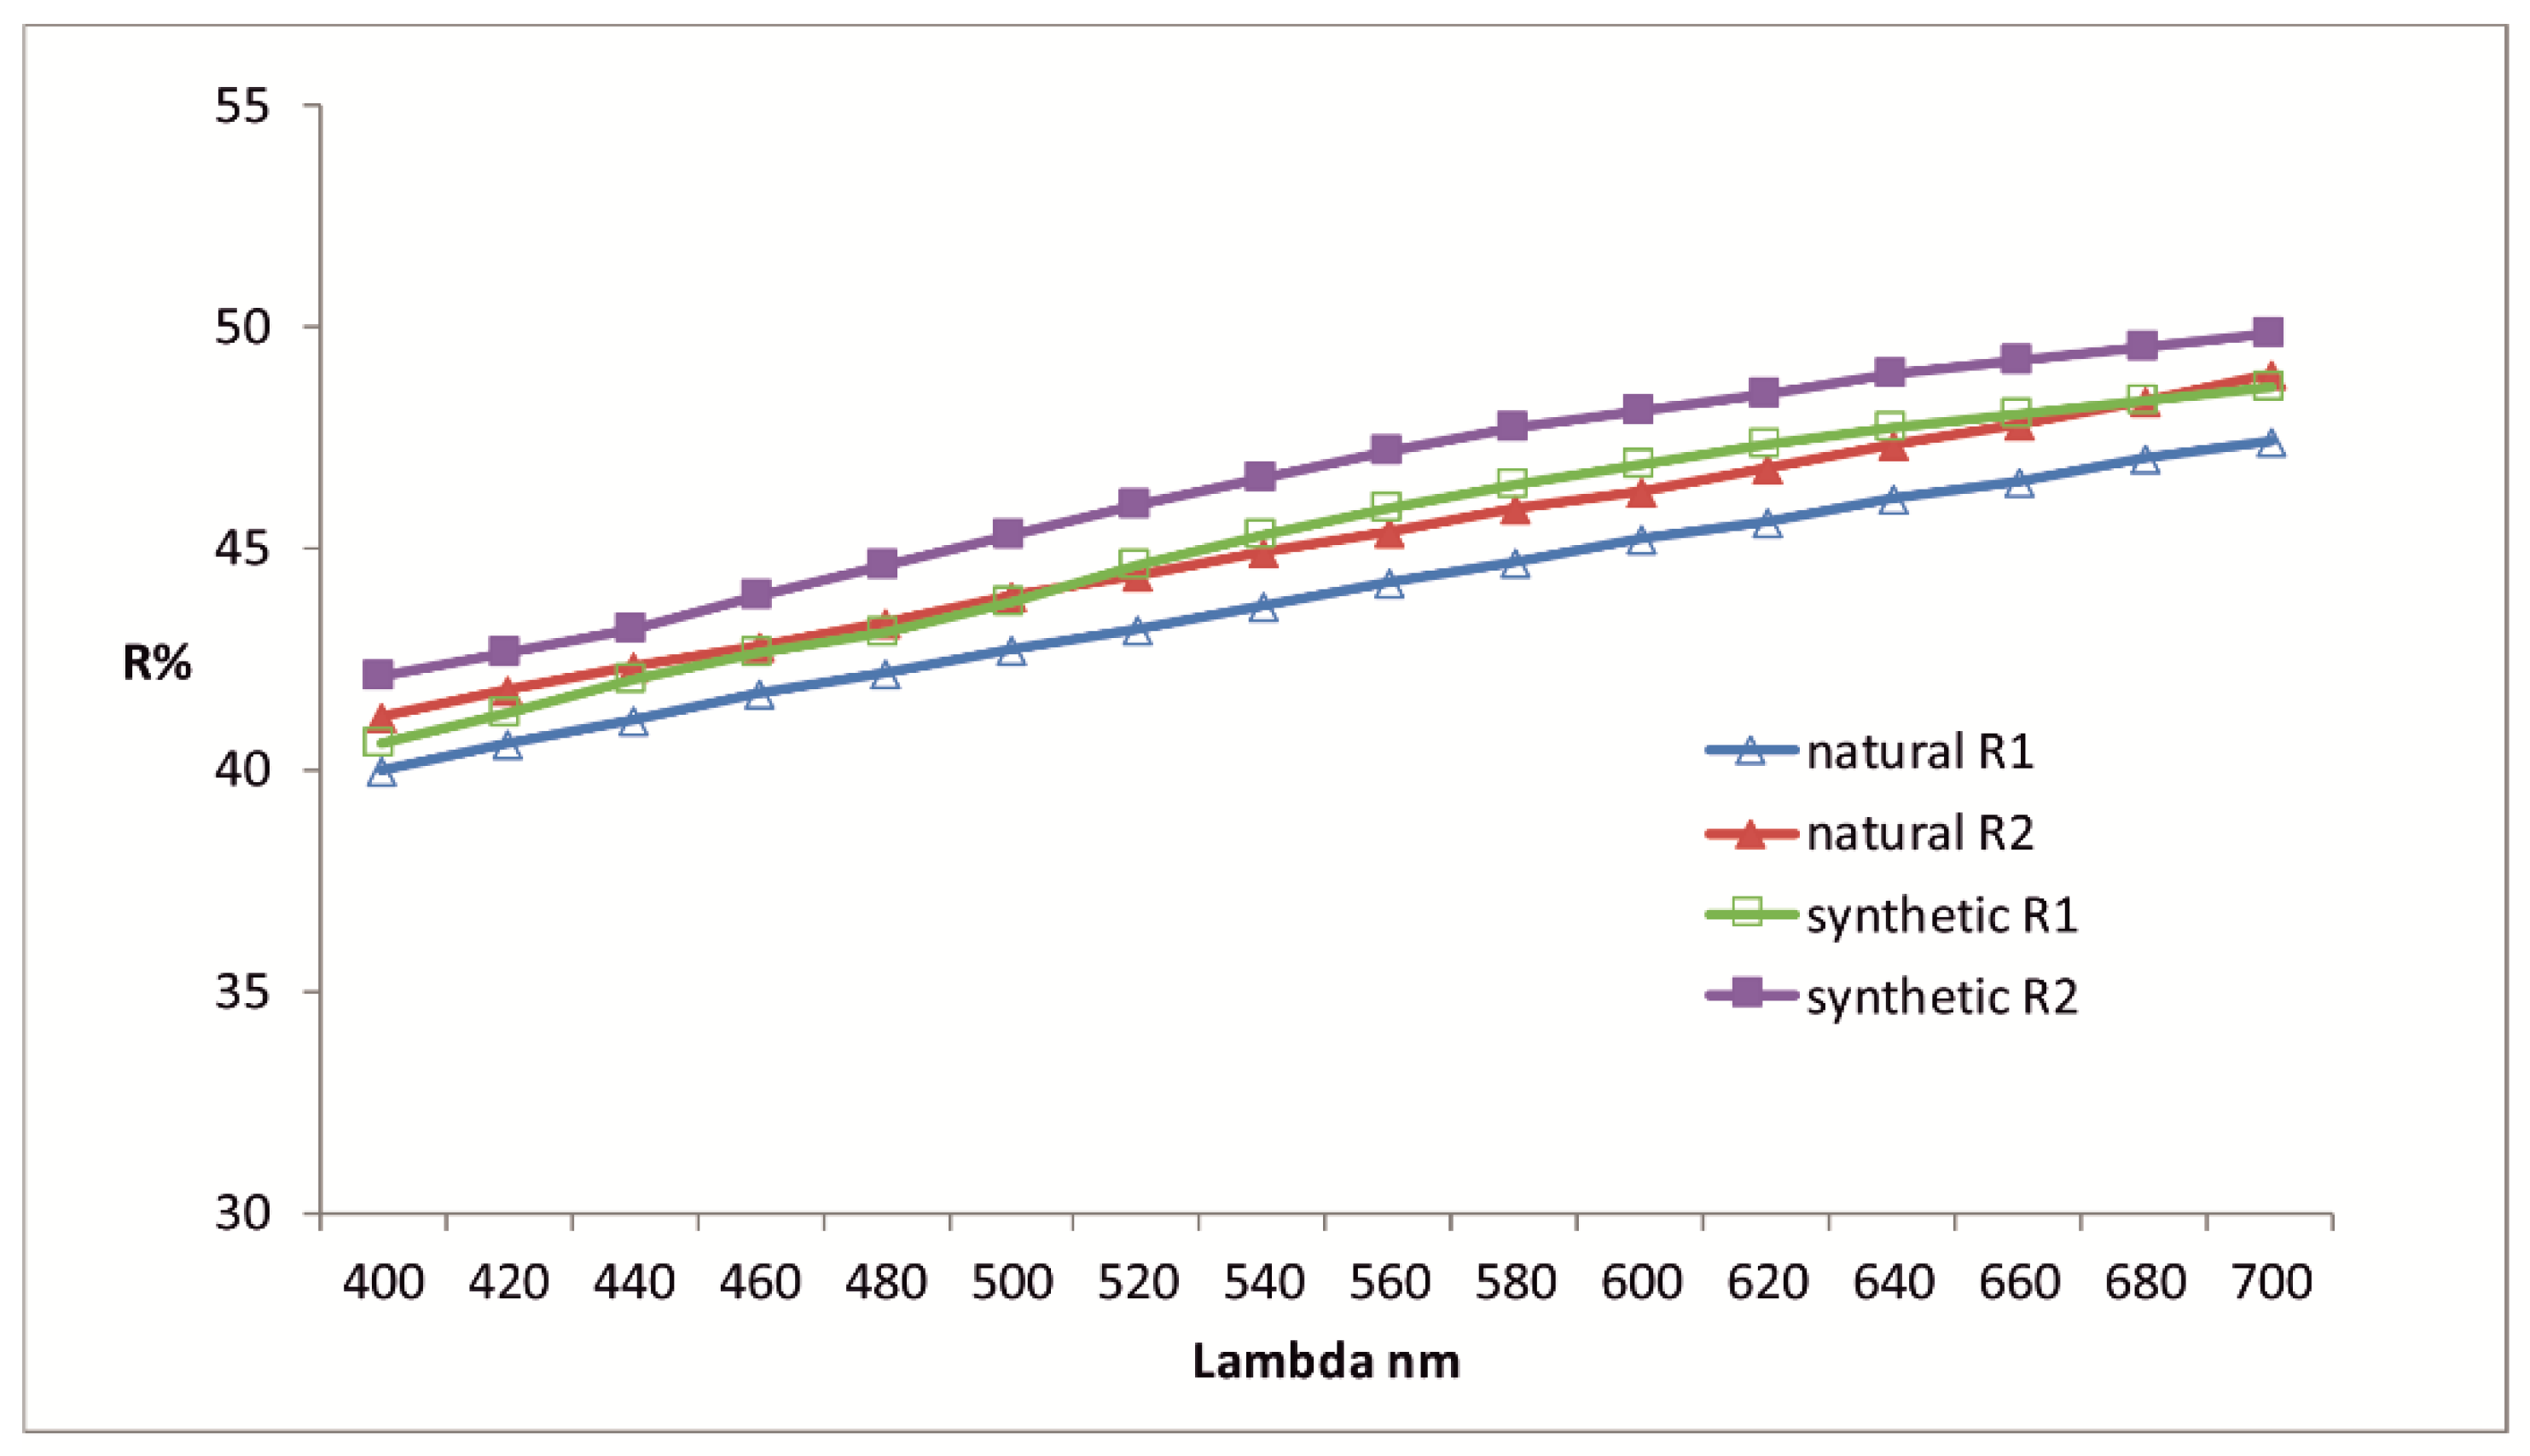
Reflectance measurements were made in air relative to a WTiC standard on both natural and synthetic thalhammerite using a J and M TIDAS diode array spectrometer attached to a Zeiss Axiotron microscope. The results are tabulated (
Table 1) and illustrated in
Figure 2.
3. Chemical Composition
Electron probe micro-analyses (EPMA) on grains of thalhammerite were obtained using a WDA Inca Wave 500 (Oxford Instruments NanoAnalysis, High Wycombe, UK) installed on an SEM Lyra 3GM (Tescan), with analytical conditions of 20 kV, 10 nA, and counting times of 30 s (on peak positions)/2 × 15 s (background on the left and right positions). The spectra were collected on PbMα, BiMα, PdLα, AgLα, SKα, and SeLα lines with standards of pure Se, Pd, Ag, Bi, synthetic PbTe, and natural FeS2. Other elements were below the detection limit.
EPMA on synthetic thalhammerite were obtained using a CAMECA SX-100 electron probe microanalyzer in wavelength-dispersive mode with an electron beam focussed to 1–2 μm.
Pure elements and ZnS were used as standards and the radiations measured were BiMα PdLα, AgLα, and SKα, with an accelerating voltage of 15 kV, and a beam current of 10 nA measured on the Faraday cup.
EPMA compared with literature data are given in
Table 2. The empirical formulae calculated on the basis of 17
apfu are Pd
8.46Ag
2.28(Bi
1.82Pb
0.32)
Σ2.14(S
4.10Se
0.02)
Σ4.12 for thalhammerite and Pd
8.91Ag
2.03Bi
2.06S
4.00 for its synthetic analogue, with the ideal formulae Pd
9Ag
2Bi
2S
4.
4. Synthetic Analogue
The small size of thalhammerite embedded in galena (bornite) prevented its extraction and isolation in an amount sufficient for the relevant crystallographic and structural investigations. Therefore, these investigations were performed on the synthetic Pd9Ag2Bi2S4.
The synthetic phase of Pd9Ag2Bi2S4 was prepared in an evacuated and sealed silica-glass tube in a horizontal furnace in the Laboratory of Experimental Mineralogy of the Czech Geological Survey in Prague. To prevent loss of material to the vapour phase during the experiment, the free space in the tube was reduced by placing a closely-fitting silica glass rod against the charge.
The temperature was measured with Pt-PtRh thermocouples and is accurate to within ±3 °C. A charge of about 300 mg was carefully weighed out from the native elements. We used, as starting chemicals, palladium (99.95%), silver (99.999%), bismuth (99.999%), and sulphur (99.999%). The starting mixture was sealed and annealed, quenched, and then ground in an agate mortar under acetone and reheated to 350 °C for 134 days. The sample was quenched by dropping the capsule in cold water.
5. X-ray Crystallography
5.1. Single-Crystal X-ray Diffraction
A small fragment of synthetic Pd
9Ag
2Bi
2S
4 was mounted on a glass fibre and examined using a Rigaku Super Nova single-crystal diffractometer with an Atlas S2 CCD detector utilizing MoKα radiation, provided by the microfocus X-ray tube and monochromatized by primary mirror optics. The ω rotational scans were used for collection of three-dimensional intensity data. From a total of 3659 reflections, 221 were classified as unique observed with
I > 3
ρ(
I). Corrections for background, Lorentz effects and polarization were applied during data reduction with the CrysAlis software. Empirical absorption correction was performed using the same software yielding
Rint = 0.034. The crystal structure was solved with a charge-flipping method using the program Superflip [
5] and subsequently refined by the full-matrix least-squares algorithm of JANA2006 program [
6]. Because of the similarity of atomic number of Pd and Ag (46 and 47, respectively), it is nearly impossible to distinguish between these atoms from single-crystal (Mo
Kα radiation) diffraction data. The refinement indicated five metallic positions, which one of them was assigned as Bi. The remaining metallic sites show multiplicities 2:8:8:4. Considering the empirical chemical composition Pd
8.91Ag
2.03Bi
2.06S
4.00 (
Z = 2) and coordination environment of the 4
e site, which was very different from the others (see structure description), the 4
e site was refined as Ag position. Next, refinement cycles included all anisotropic displacement parameters, which revealed too large a value for Pd(2) position (
Ueq(Pd2) = 0.0146 Å
2 cf. 0.0082 and 0.080 Å
2 for Pd(1) and Pd(3), respectively). Refinement of occupancy factors yielded 0.88 occupancy for the Pd(2) position; other positions were found to be fully occupied. Final refinement in the
I4/
mmm space group for 21 parameters converged smoothly to the
R = 0.0310 and
wR = 0.0815 for 221 observed reflections. Details of data collection, crystallographic data, and refinement are given in
Table 3.
Atom coordinates and displacement parameters are listed in
Table 4.
Table 5 shows selected bond lengths.
It should be noted that the refined tetragonal structure model of thalhammerite is only a substructure. As was revealed by subsequent Rietveld refinement (see below), the powder X-ray diffraction pattern of synthetic thalhammerite shows at medium and high diffraction angles a few very weak unindexed peaks and very subtle peak splitting, which cannot be fitted using the tetragonal model. Attempts to refine the structure from single-crystal data in rhombic subgroups of I4/mmm (i.e., Fmmm, Immm) led to negligible lowering of R-factors (e.g., from 0.0313 to 0.0293) with a rapid increase of the refined parameters and correlations between them. Refinements in monoclinic subgroups failed. Additionally, neither of these low-symmetry models describe all peak splitting observed in powder diffraction patterns of synthetic thalhammerite. Therefore, we proposed only the tetragonal average substructure of thalhammerite, leaving some aspects of the structure unclear.
5.2. Powder X-ray Ddiffraction
The powder XRD pattern of synthetic thalhammerite was collected in the Bragg-Brentano geometry on a Bruker D8 Advance diffractometer equipped with the LynxEye XE detector and Cu
Kα radiation. The data were collected in the range from 10° to 100° 2θ with a step size of 0.005° 2θ and 2 s counting time per step. The structure model obtained from a single-crystal XRD study of synthetic thalhammerite was used as a starting structural model in the subsequent Rietveld refinement. The FullProf program [
7] was used and the pseudo-Voigt function was used to generate the shape of the diffraction peaks. The refined parameters include those describing peak shape and width, peak asymmetry, unit-cell parameters, the occupancy parameter of the Pd(2) position, and six isotropic displacement parameters.
In total, 17 parameters were refined. No fractional coordinates were refined. The final cycles of Rietveld refinement converged to the agreement factors Rp = 0.077 and Rwp = 0.115. The refinement indicated 7 wt % Pd3Bi2S2 (I213) impurity in the investigated sample.
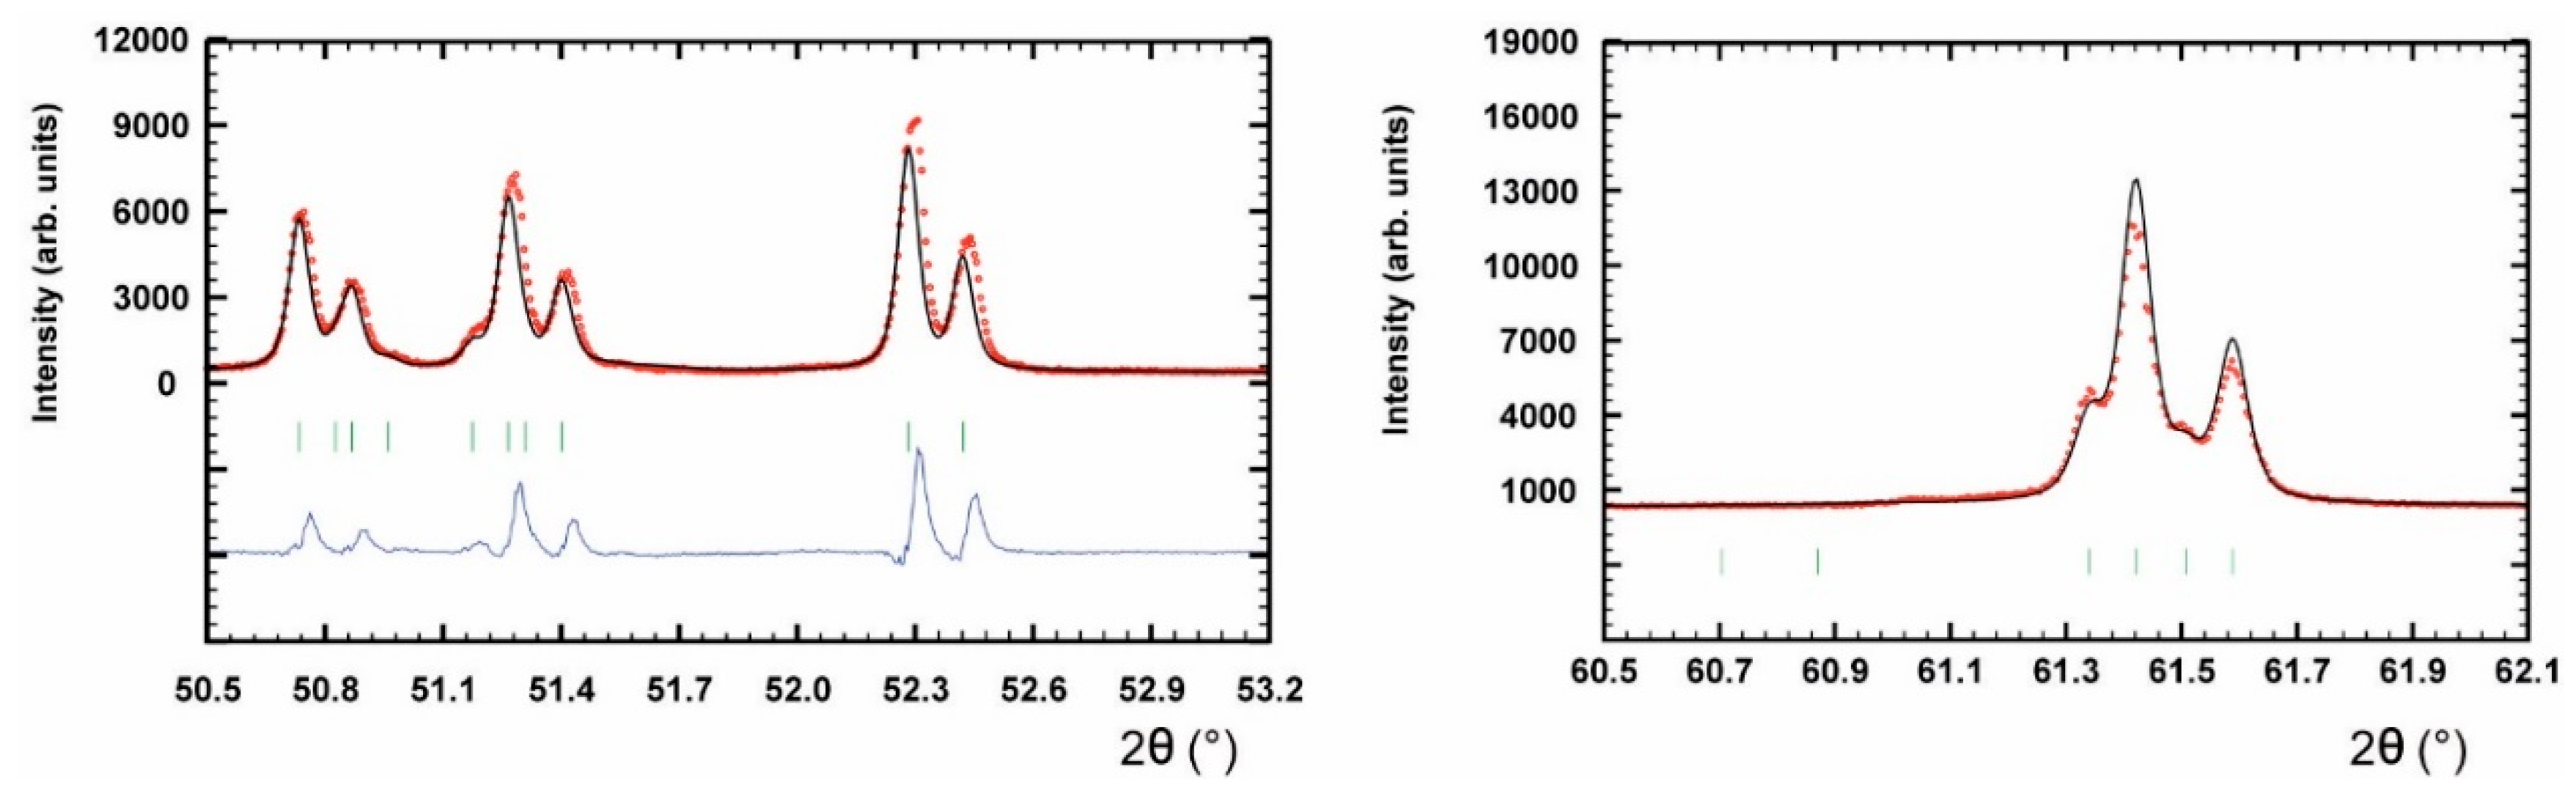
Figure 3 depicts two details of final Rietveld plot showing weak, however discernible, peak splitting at middle and high diffraction angles of 2θ (i.e., above 50°). Attempts to index all observed diffractions in the powder pattern in the large and/or lower symmetry unit-cell remained unsuccessful and, therefore, the structure refinement was limited to the tetragonal substructure.
Table 6 presents powder diffraction data for thalhammerite.
6. Structure Description
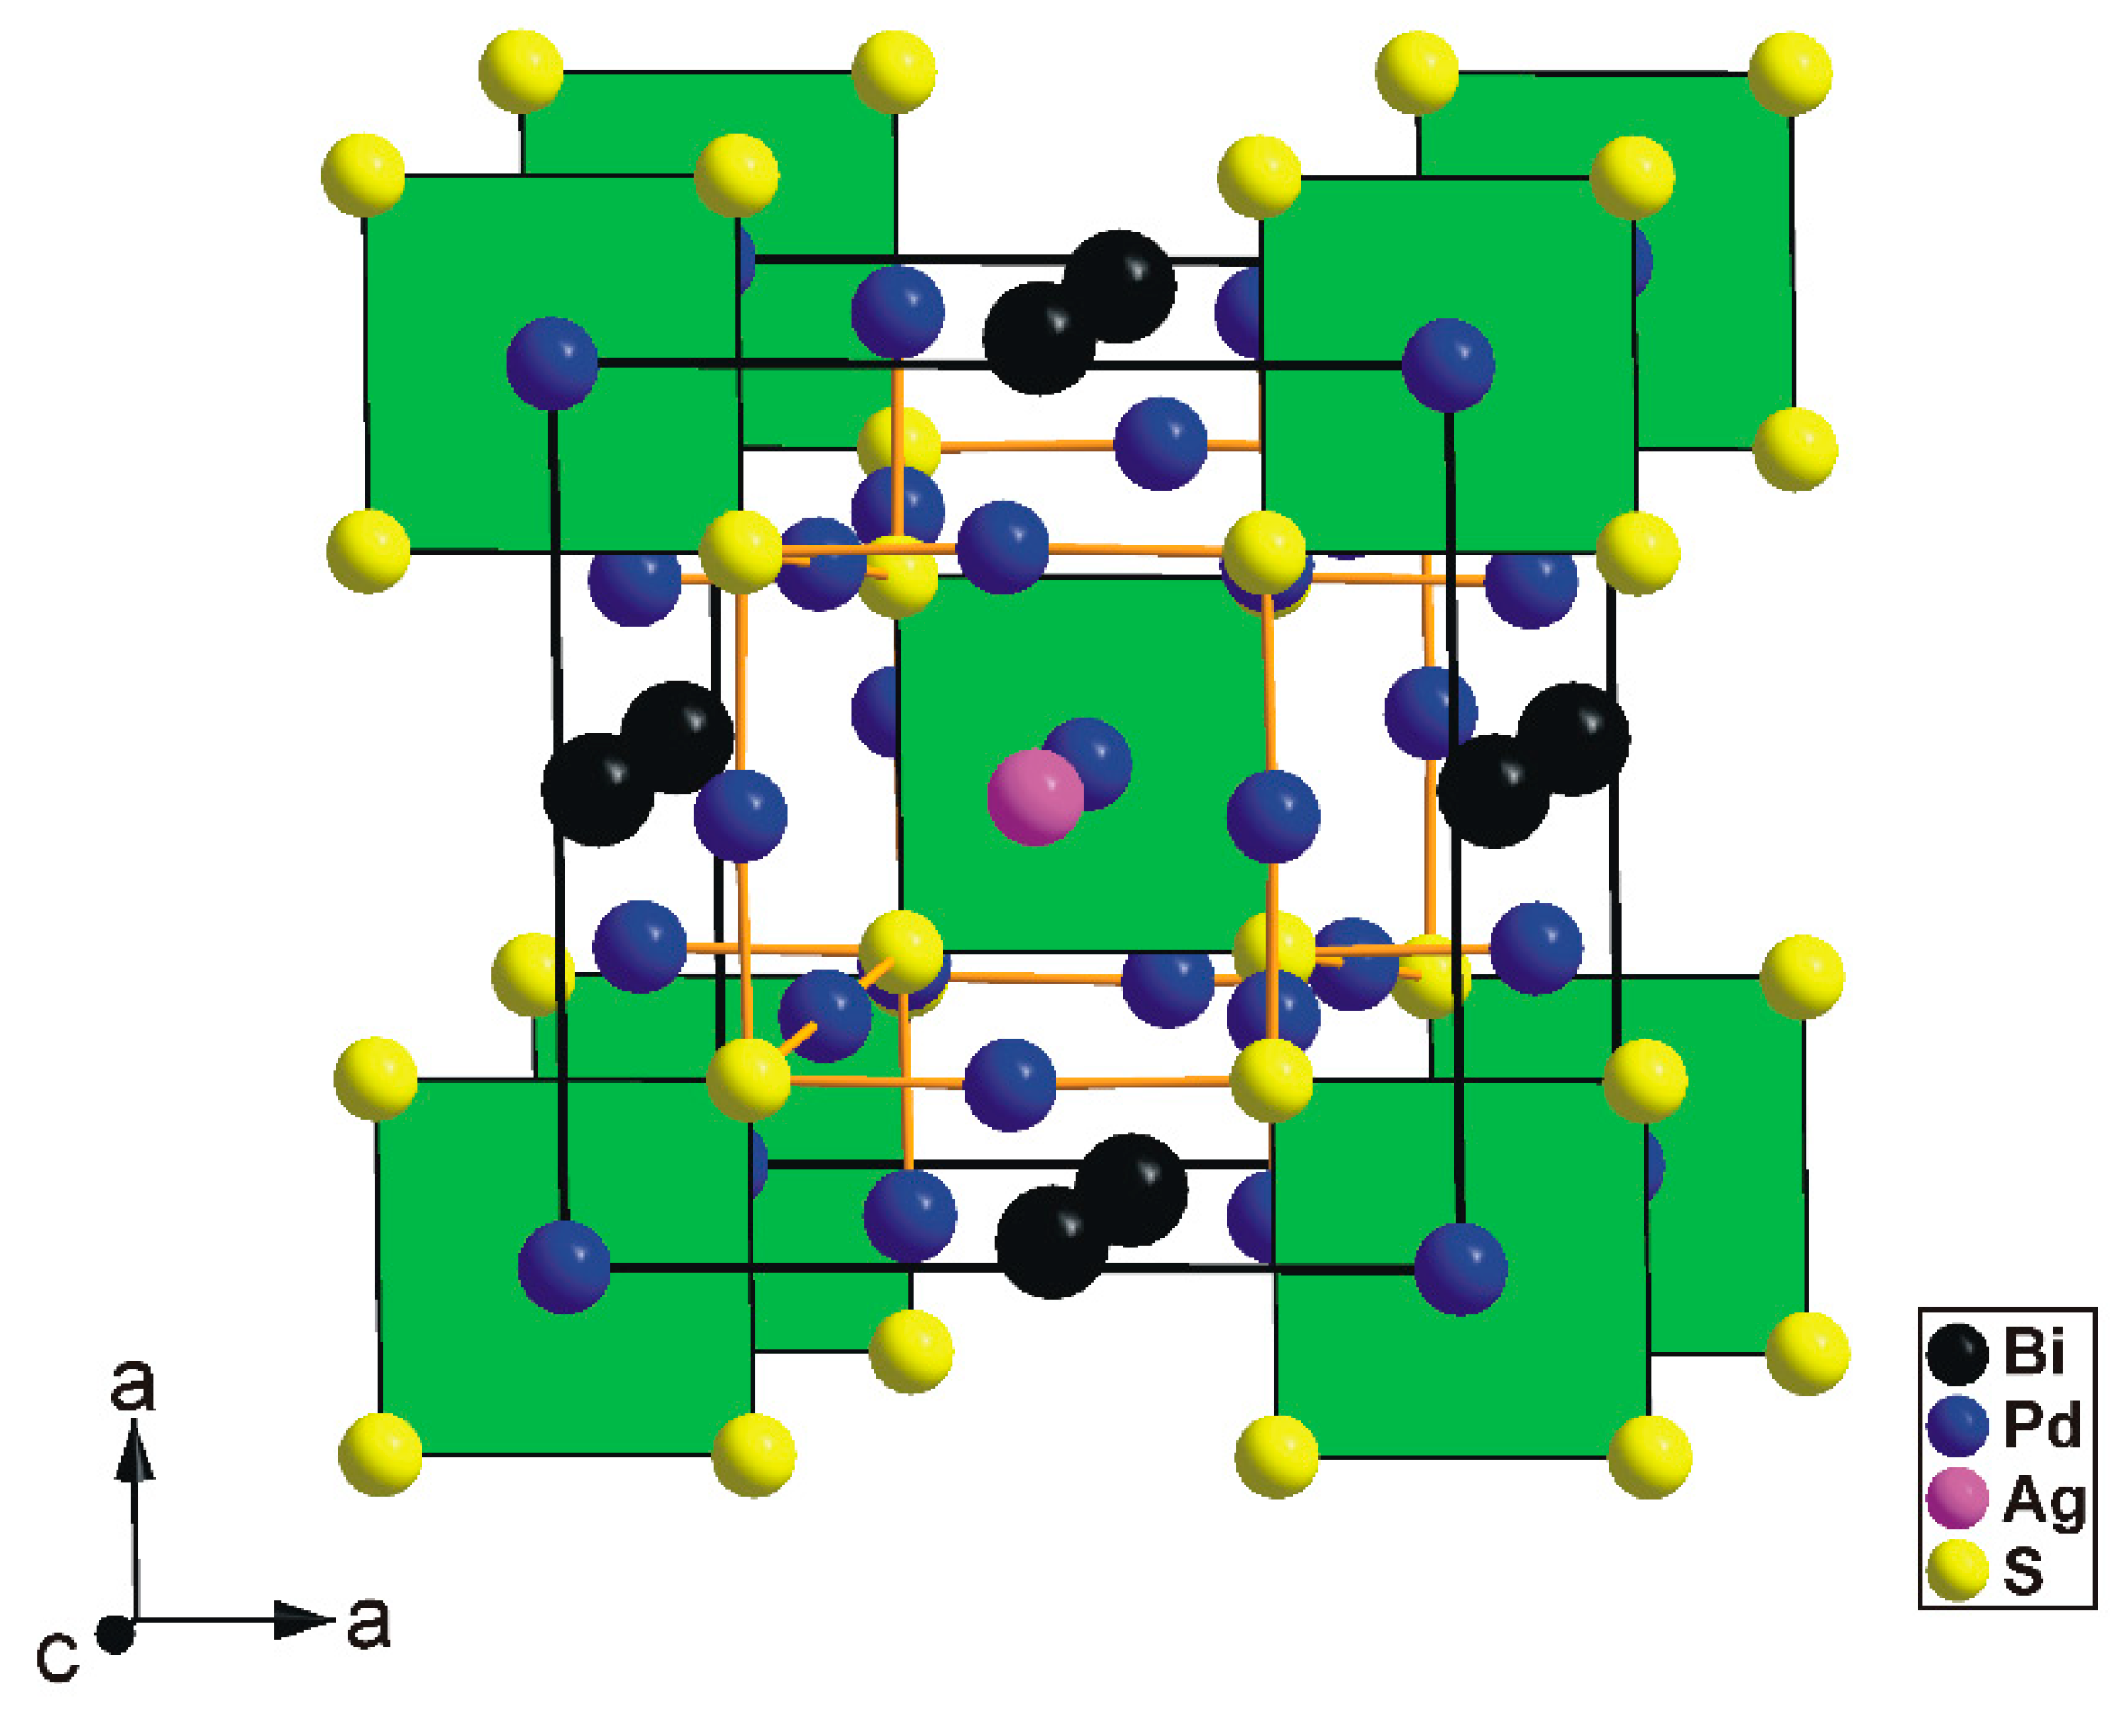
The tetragonal substructure of thalhammerite contains three Pd, one Ag, Bi, and S sites, respectively. All sites, except the Pd(2) position, were found to be fully occupied. Its crystal structure is shown in
Figure 4.
6.1. Coordination of Cations
The Pd(1) position is in the centre of regular square of S atoms with Pd(1)-S distances of 2.362(3) Å. The coordination is perfectly planar. Similar coordination was observed in vysotskite, PdS [
8], which shows similar Pd–S separation of 2.34 Å. Such coordination geometry is typical for low-spin 4
d8 Pd
2+ cation in normal sulfides with M:S ratio equal to or smaller to one [
9]. The Pd(1) coordination is further completed by two Ag atoms at 2.919(2) Å lying perpendicular to the [M(1)S
4] squares.
The Pd(2) (refined to 0.88 occupancy of Pd) and Pd(3) sites form complex polyhedron. Both Pd positions are coordinated by two S atoms at distances 2.3372(7) and 2.343(3) Å, a value very close to the Pd–S distance of 2.334(4) Å observed for the
zig-zag chains in the structure of kravtsovite, PdAg
2S [
1]. Whereas the S–Pd(2)–S group is perfectly linear, the S–Pd(3)–S shows a bonding angle of 177.9(1)°. Pd(2) is further coordinated by two Bi (2.8378(1) Å), two Ag (2.9073(4) Å), and two Pd(3) (3.0670(2) Å) atoms. Pd(3) also shows two Bi (2.8080(8) Å), two Ag (2.905(2) Å), and four Pd(3) (3.0670(2) Å) short contacts.
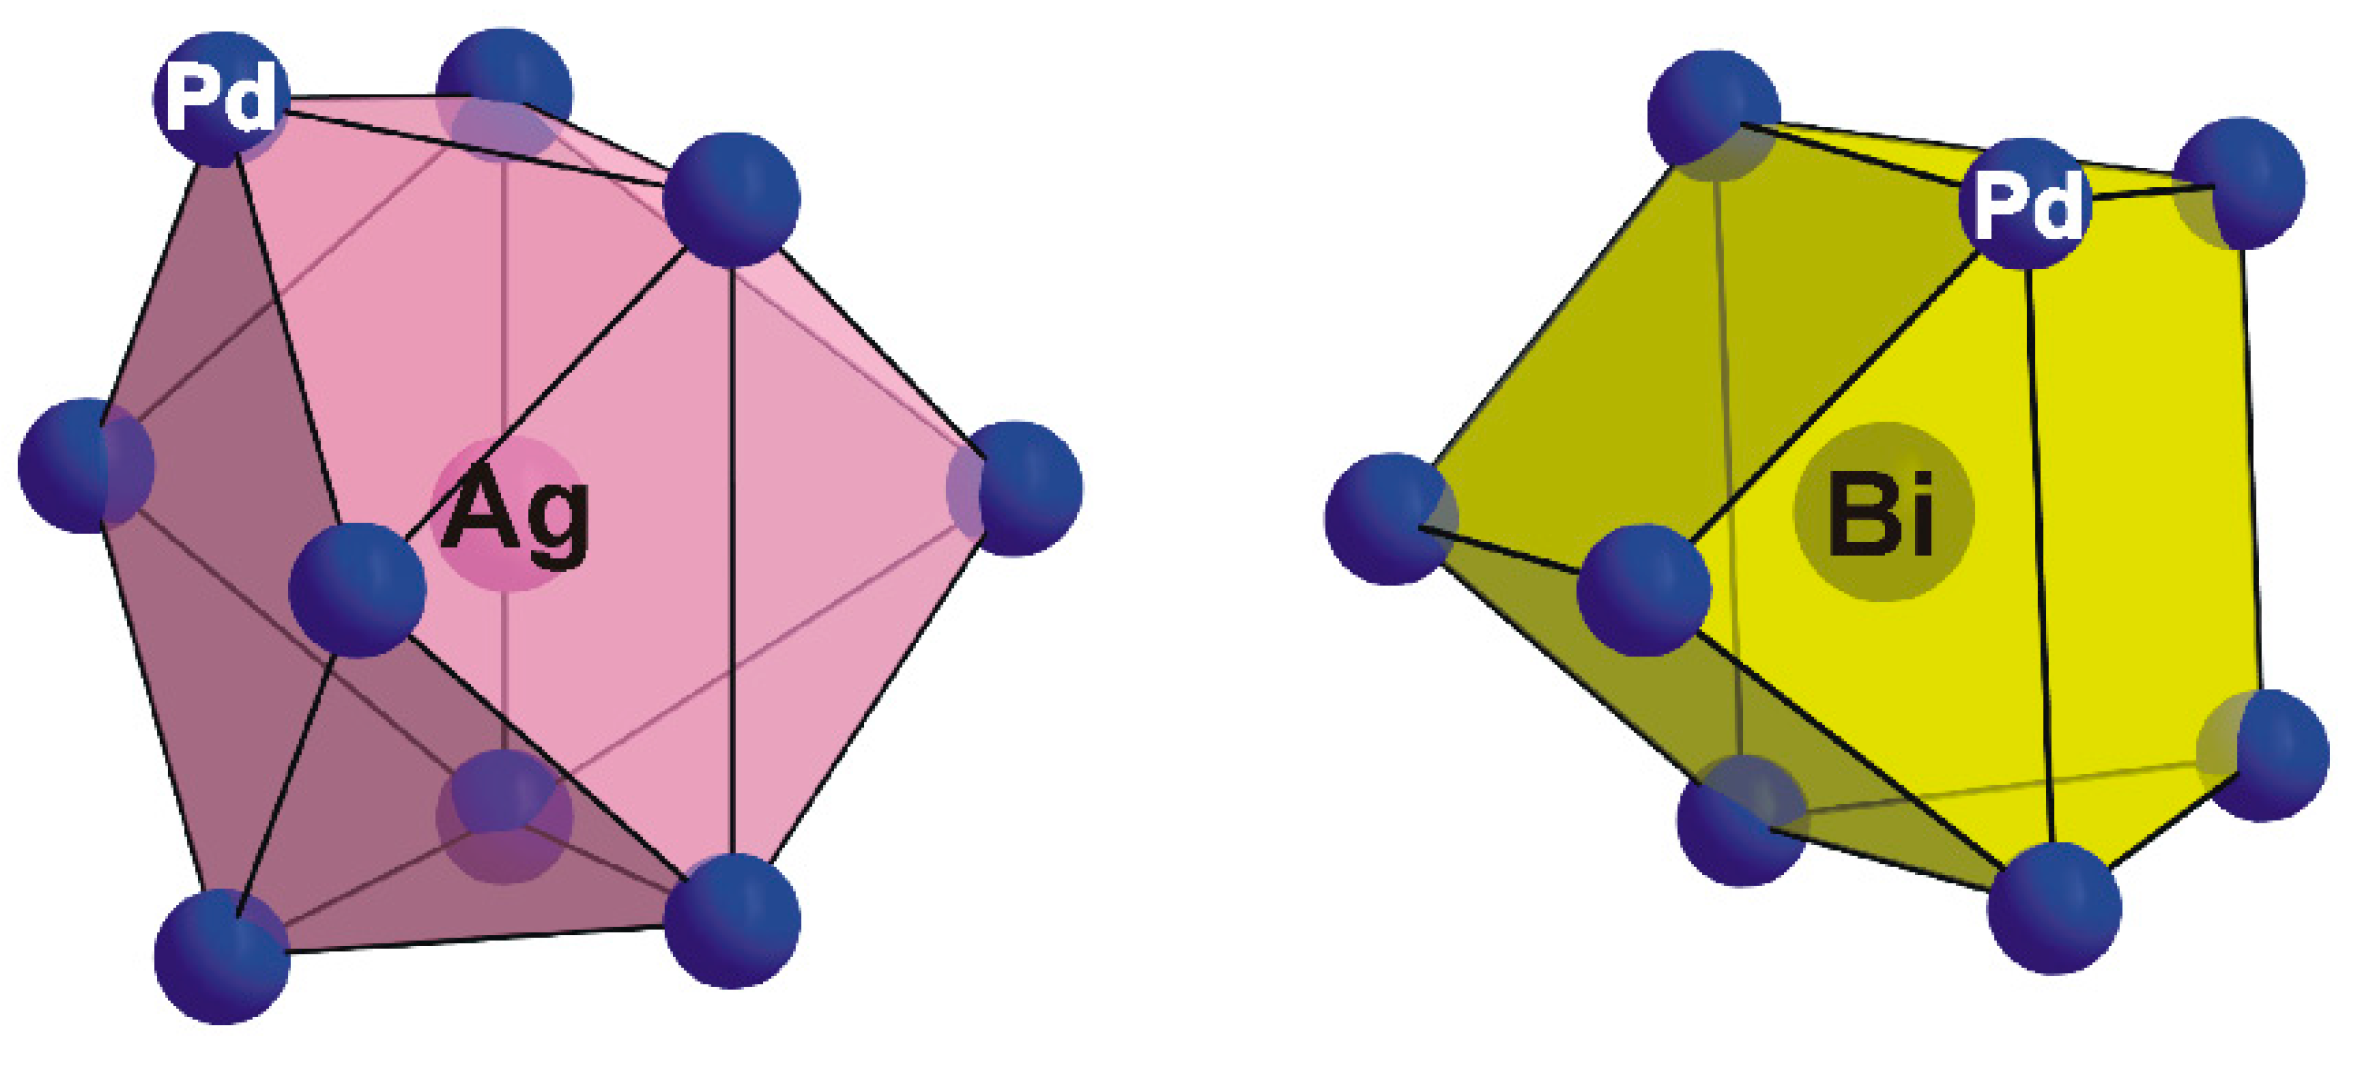
Ag site is surrounded by nine Pd atoms (
Figure 5) forming a mono-capped tetragonal antiprismatic coordination. The Ag–Pd distances are in the range of 2.905(1) Å to 2.919(2) Å, comparable to those observed in lukkulaisvaaraite (Pd–Ag: 2.891(4)–3.037(4) Å; [
10], where Ag atoms display tetragonal antiprismatic coordination.
As is shown in
Figure 5, the Bi atom is coordinated by eight Pd atoms to form a bi-capped trigonal prism with Bi–Pd bond distances ranging from 2.808(1) to 2.8378(1) Å, values slightly shorter than those observed in structure of monoclinic PdBi (2.84–2.95) Å; [
11]. There are no short (<3.5 Å) Bi–S contacts in the thalhammerite crystal structure. This contrasts with the environment of Bi in structure of chemically-related vymazalováite, Pd
3Bi
2S
2 [
2,
12], where Bi atoms show one additional S contact at 3.22(3) Å.
6.2. Modular Description
The thalhamerite crystal structure forms a three-dimensional framework. It contains features typical for intermetallic compounds (e.g., complex crystallochemical environment of metals) and, therefore, cannot be presented using a traditional cation-based coordination polyhedra approach.
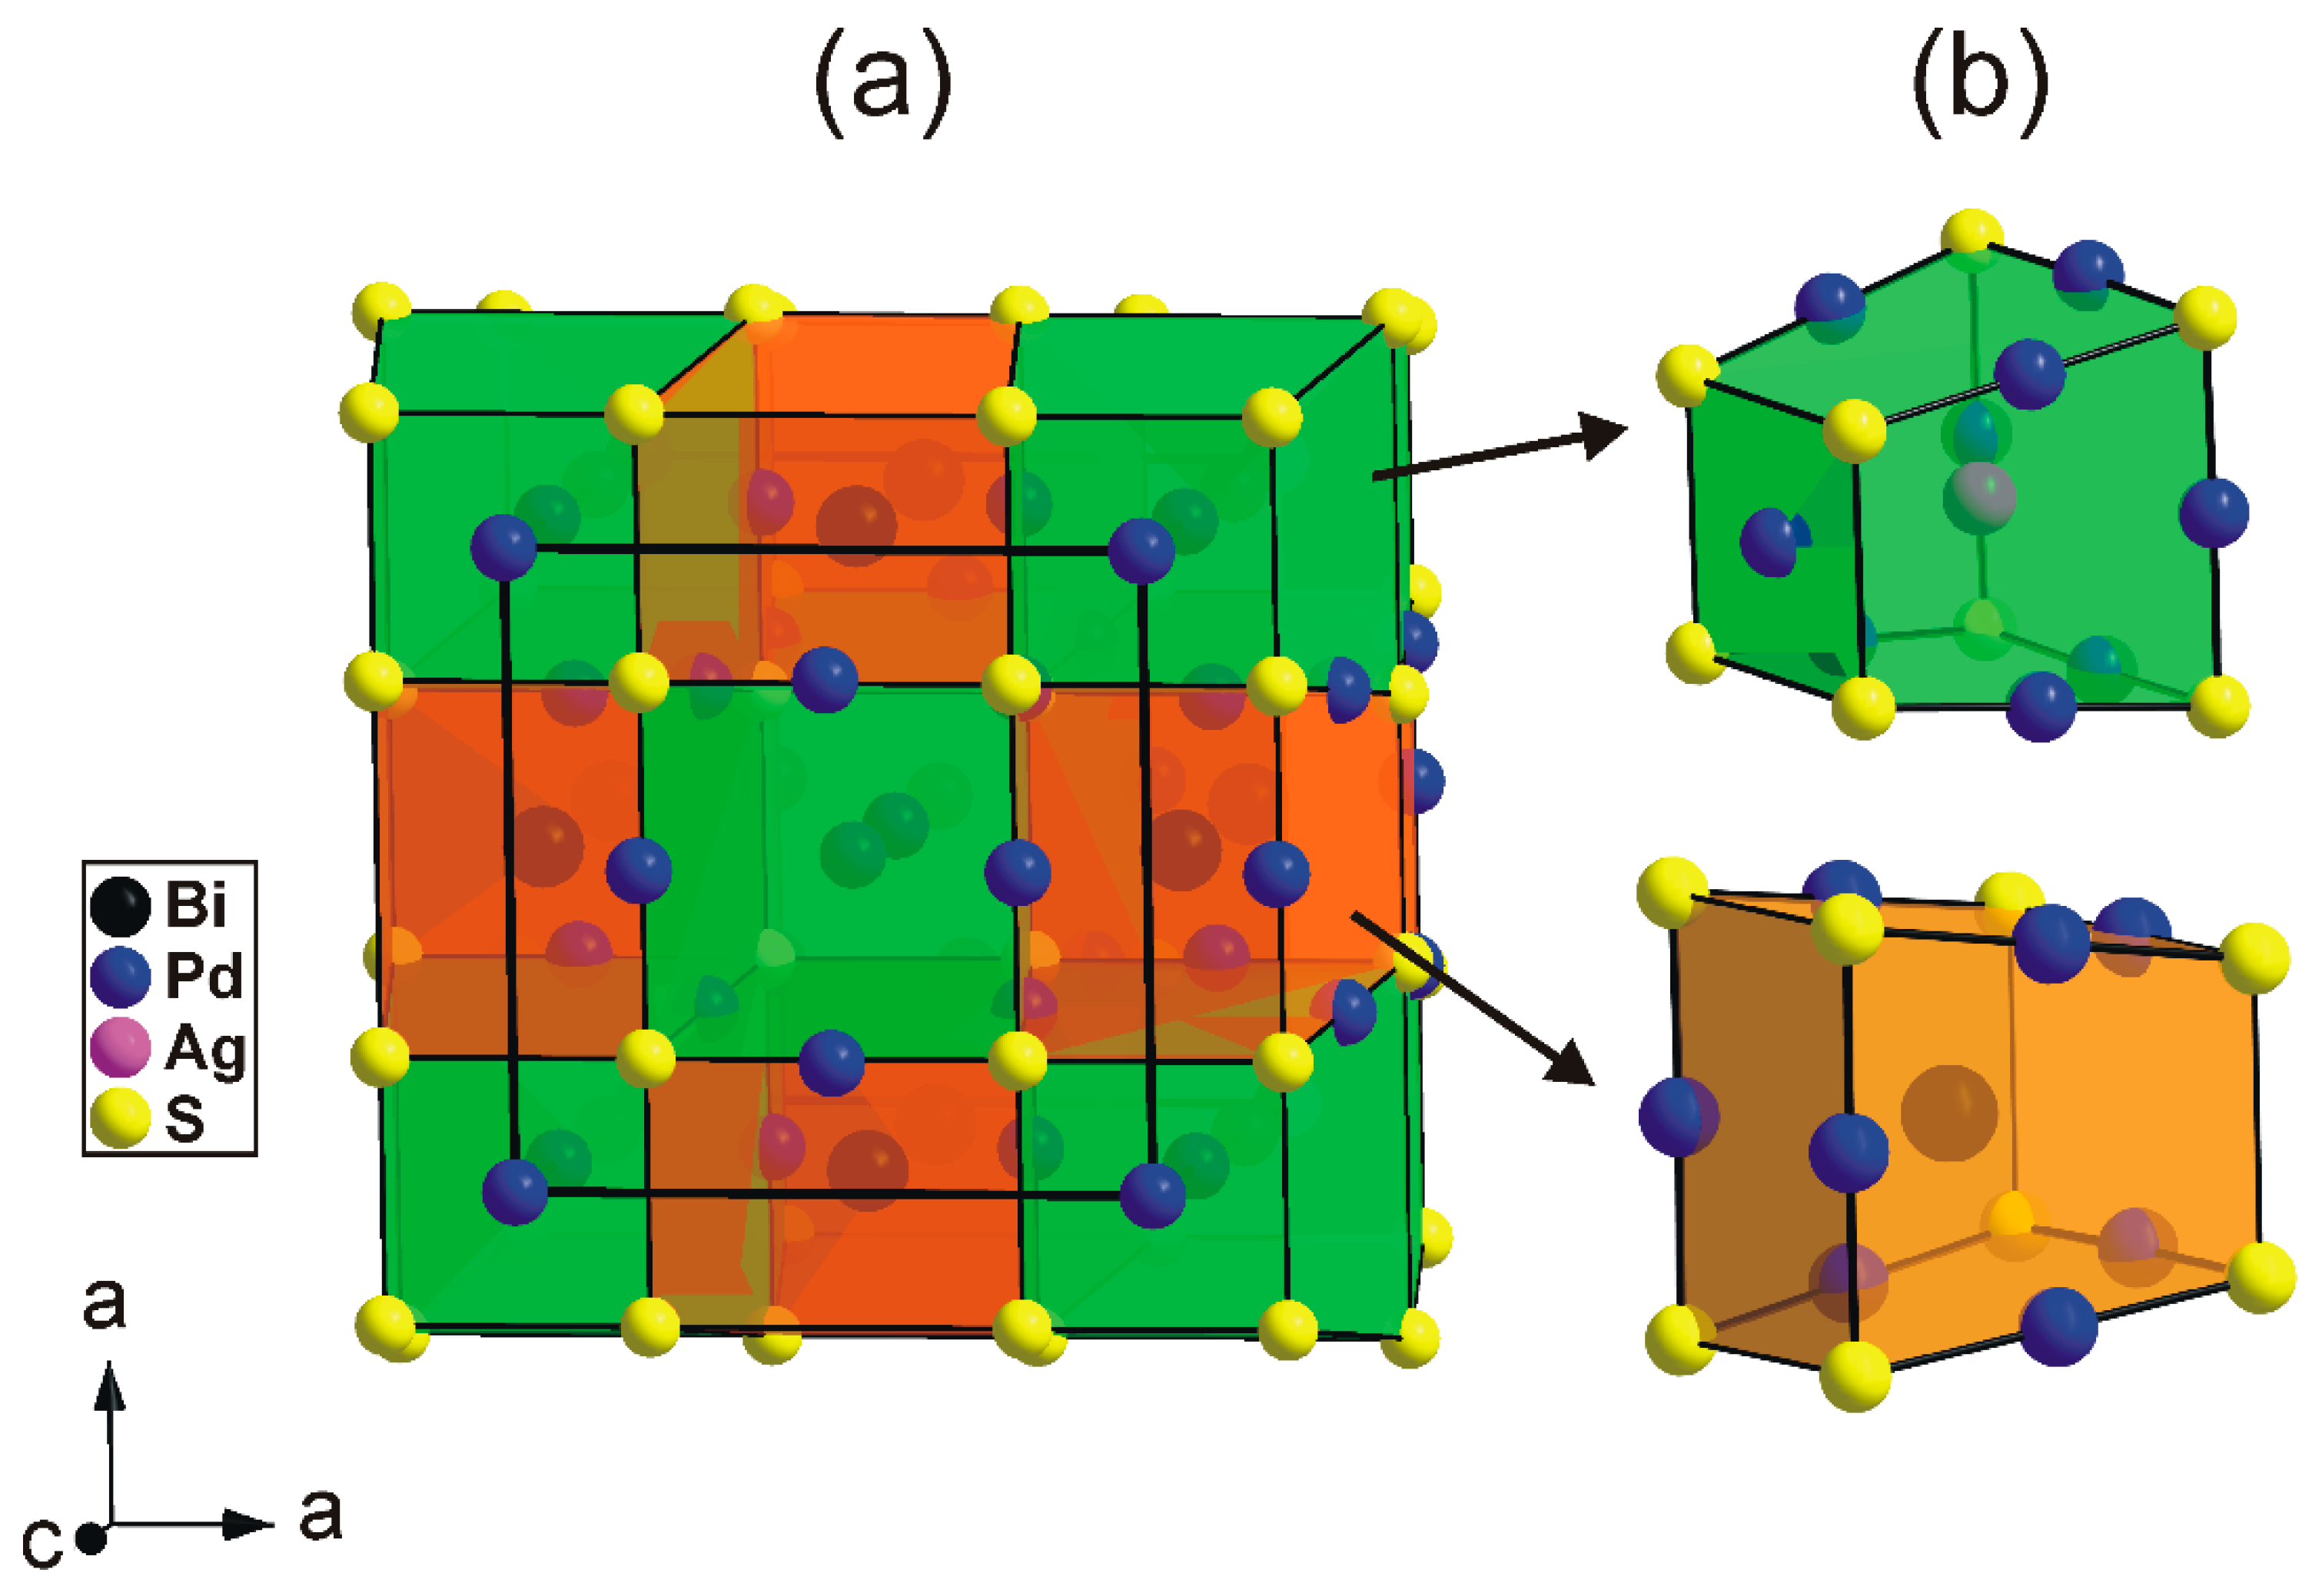
Alternatively, the structure of thalhammerite can be conveniently described as an arrangement of two types of building blocks (cuboids) having common S atoms at the corners (
Figure 6).
The first block (green in
Figure 6) contains the [PdS
4] squares forming one face of the block and Ag atoms in its centre. Pd atoms are approximately located to the midpoints of the longer S-S edges. The second block (orange in
Figure 6) contains Bi atoms in its centre. By analogy with the first block, the Pd atoms are located to the midpoints of the longer S–S edges. In the thalhammerite structure, two types of block alternate in a chess-boar fashion within the (001) plane and form chains along the c axis (
Figure 6). It should be mentioned that, neglecting the Ag and Bi atoms, the packing of the green blocks automatically generates their duals, and the orange block, vice versa.
6.3. Relation to Other Minerals
The thalhammerite structure represents a unique structure type, and no exact structural analogue is hitherto known. It is worth noting that its structure merges structure motives typical for polar chalcogenides and intermetallic compounds. The [Pd(1)S
4] square-planar coordination is a hallmark of Pd-bearing sulfides with an M:S ratio equal to, or slightly smaller than, one. Contrary to that, (almost) linear coordination of Pd by two S atoms and number of further metal-metal contacts resulting in complex coordination geometry, can be observed in sulphides with intermetallic behaviour (e.g., kravtsovite PdAg
2S, Vymazalová et al., 2017 [
1]).
Another chemically-related mineral, coldwellite, Pd
3Ag
2S (McDonald et al., 2015 [
13]), adopts a cubic β-Mn-like structure and, hence, differs substantially from that of thalhammerite.
7. Proof of Identity of Natural and Synthetic Thalhammerite
The structural identity between the synthetic Pd9Ag2Bi2S4 and the natural material was confirmed by electron back-scattering diffraction (EBSD) and Raman spectroscopy.
7.1. Electron Back-Scattering Diffraction
The structural identity between the natural material and the synthetic Pd
9Ag
2Bi
2S
4 was confirmed by EBSD. A TESCAN Lyra 3GM field emission scanning electron microscope combined with EBSD system (Oxford Instruments AztecHKL system with NordlysNano EBSD camera) was used for the measurements. The surface of natural sample was prepared for investigation by broad beam argon ion milling using Gatan PECS II system operated at 1 kV. The solid angles calculated from the patterns were compared with our structural model for Pd
9Ag
2Bi
2S
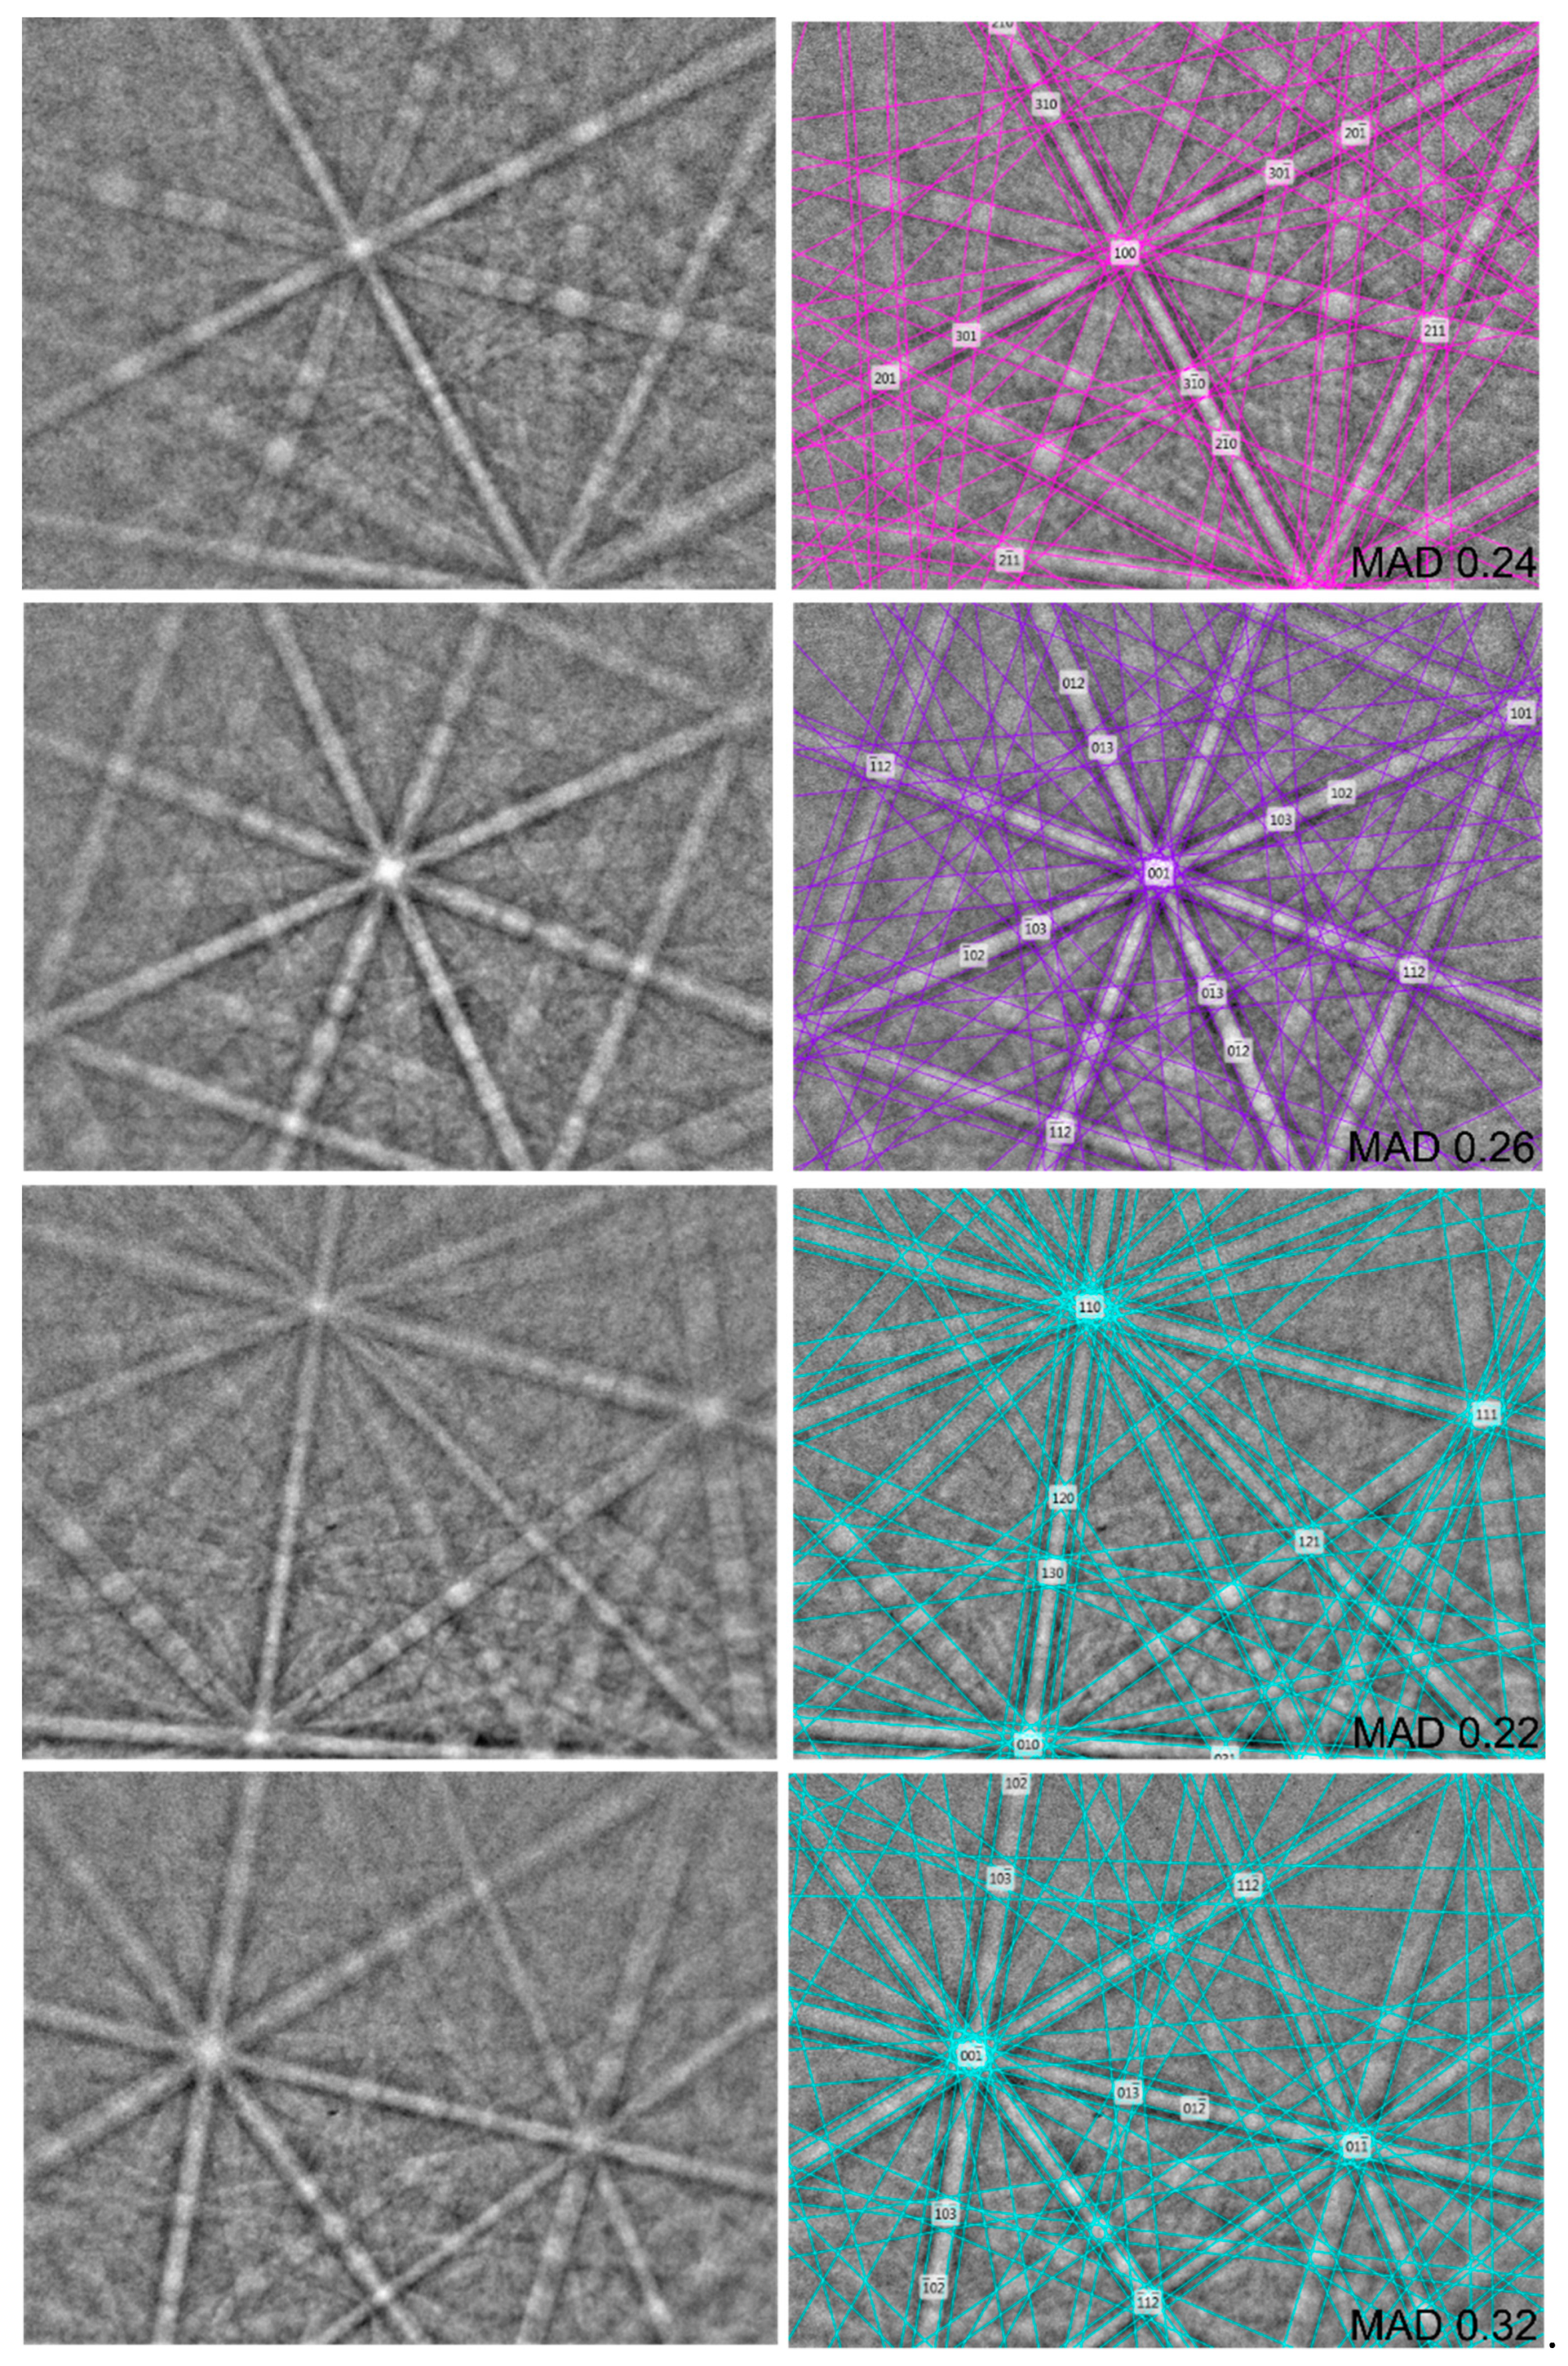
4 synthetic phase match containing 12 reflectors to index the patters. The EBSD patterns (also known as Kikuchi patterns) obtained from the natural material (>50 measurements on different spots on natural thalhammerite grains) were found to match the patterns generated from our structural model for Pd
9Ag
2Bi
2S
4 synthetic phase,
Figure 7.
The values of the mean angular deviation (MAD, i.e., goodness of fit of the solution) between the calculated and measured Kikuchi bands range between 0.22° and 0.48°. These values reveal a very good match; as long as values of mean angular deviation are less than 1°, they are considered as indicators of an acceptable fit (HKL Technology, 2004).
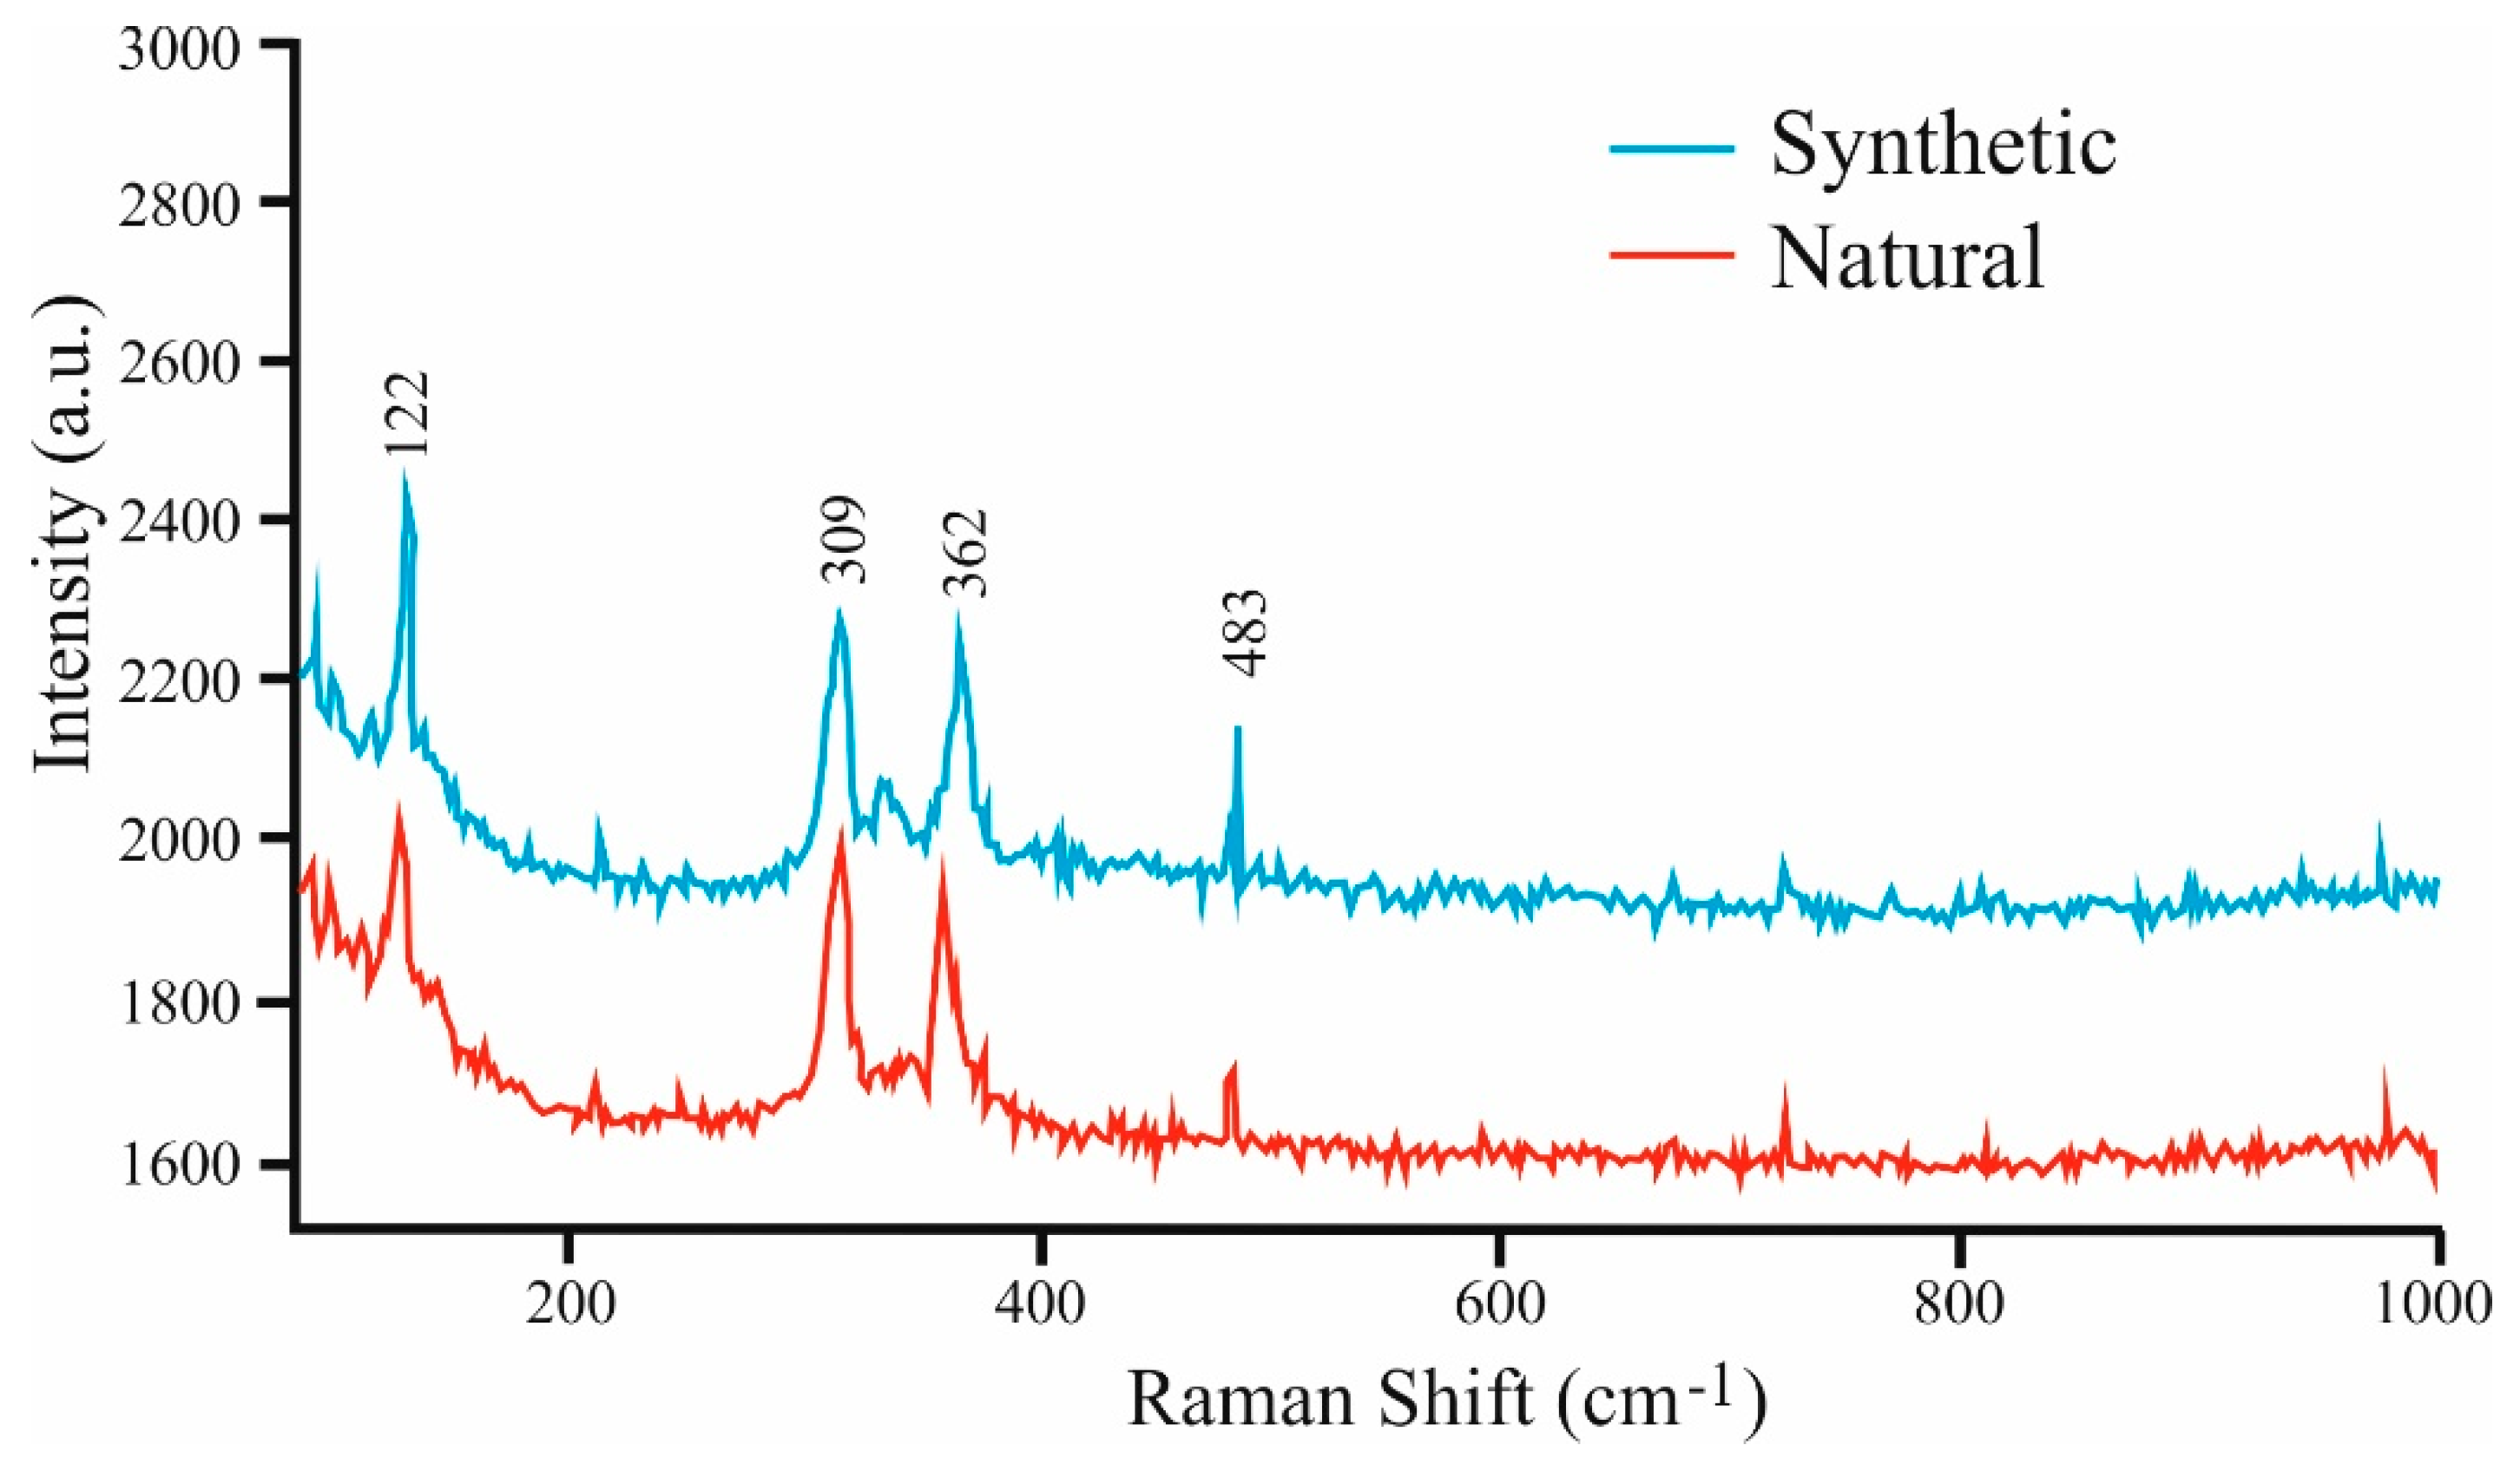
7.2. Raman Spectroscopy
The Raman spectroscopy technique was applied to verify the structural identity between the synthetic Pd
9Ag
2Bi
2S
4 and the natural material (
Figure 8).
Raman spectra were obtained using a LABRAM (ISA Jobin Yvon) instrument installed at the University of Leoben, Austria. A frequency-doubled 100 mW Nd:YAG laser with an excitation of a wavelength of λ = 532.6 nm was used. The obtained Raman spectra of natural and synthetic Pd
9Ag
2Bi
2S
4 show four discernible absorption bands at the following values: 122, 309, 362, and 483 cm
−1 (see
Figure 8).
The EBSD study, Raman spectra, chemical identity and optical properties confirmed the identity of the natural and synthetic materials and thereby legitimise the use of the synthetic phase for the complete characterization of thalhammerite.
Author Contributions
All the authors (A.V., F.L., S.F.S., V.V.K., C.J.S., J.P., F.Z., G.G. and R.B.) discussed the obtained results, evaluated the data and wrote the article together. A.V. designed the article and conceived experiments; S.F.S. provided the samples and geological background; F.L., V.V.K., J.P. obtained the crystallographic data; C.J.S. provided optical properties; F.Z., G.G. and R.B. studied thalhammerite by Raman and evaluated the chemical data. All the authors revised and edited the manuscript.
Funding
The work was supported by the Grant Agency of the Czech Republic (project no. 18-15390S to A.V.), through an internal project 331400 from the Czech Geological Survey, the Russian Foundation for Basic Research (project RFBR 18-05-70073), and C.J.S. acknowledges Natural Environment Research Council, grant NE/M010848/1, Tellurium and Selenium Cycling and Supply.
Acknowledgments
The authors acknowledge Ulf Hålenius, Chairman of the CNMNC and its members for helpful comments on the submitted data. The authors are grateful to Zuzana Korbelová (Institute of Geology AS CR, v.v.i.) for carrying out the electron microprobe analyses. We thank two anonymous reviewers and the Editorial Board members, for their comments and improvements.
Conflicts of Interest
The authors declare no conflict of interest.
References
- Vymazalová, A.; Laufek, F.; Sluzhenikin, S.F.; Stanley, C.J.; Kozlov, V.V.; Chareev, D.A.; Lukashova, M.L. Kravtsovite, PdAg2S, a new mineral from Norilsk-Talnakh deposit, Russia. Eur. J. Mineral. 2017, 29, 597–602. [Google Scholar] [CrossRef]
- Sluzhenikin, S.F.; Kozlov, V.V.; Stanley, C.J.; Lukashova, M.I.; Dicks, K. Vymazalováite, Pd3Bi2S2, a new mineral from Norilsk -Talnakh deposit, Krasnoyarskiy region, Russia. Mineral. Mag. 2018, 82, 367–373. [Google Scholar] [CrossRef]
- Sluzhenikin, S.F.; Mokhov, A.V. Gold and silver in PGE-Cu-Ni and PGE ores of the Norilsk deposit, Russia. Mineral. Depos. 2015, 50, 465–492. [Google Scholar] [CrossRef]
- Subbotin, V.V.; Gabov, D.A.; Korchagin, A.U.; Savchenko, E.E. Gold and Silver in the Composition of PGE Ores of the Fedorov-Pana Layered Intrusive Complex. Her. Kola Sci. Cent. RAS 2017, 1, 53–65. (In Russian) [Google Scholar]
- Palatinus, L.; Chapuis, G. SUPERFLIP—A computer program for the solution of crystal structures by charge flipping in arbitrary dimensions. J. Appl. Crystallogr. 2007, 41, 786–790. [Google Scholar] [CrossRef]
- Petříček, V.; Dušek, M.; Palatinus, L. Crystallographic Computing System JANA2006: General features. Z. Kristallogr. 2014, 229, 345–352. [Google Scholar] [CrossRef]
- Rodríguez-Carvajal, J. Full Prof. 2k Rietveld Profile Matching & Integrated Intensities Refinement of X-ray and/or Neutron Data (Powder and/or Single-Crystal); Laboratoire Léon Brillouin, Centre d’Etudes de Saclay: Gif-sur-Yvette, France, 2006. [Google Scholar]
- Brese, N.E.; Squattrito, P.J.; Ibers, J.A. Reinvestigation of the structure PdS. Acta Crystallogr. Sect. C 1985, C41, 1829–1830. [Google Scholar] [CrossRef]
- Dubost, V.; Balić-Žunić, T.; Makovicky, E. The crystal structure of Ni9.54Pd7.46S15. Can. Mineral. 2007, 45, 847–855. [Google Scholar] [CrossRef]
- Vymazalová, A.; Grokhovskaya, T.L.; Laufek, F.; Rassulov, V.A. Lukkulaisvaaraite, Pd14Ag2Te9, a new mineral from Lukkulaisvaara intrusion, northern Russian Karelia, Russia. Mineral. Mag. 2014, 78, 1743–1754. [Google Scholar] [CrossRef]
- Bhatt, Y.C.; Schubert, K. Kristallstruktur von PdBi.r. J. Less Common Met. 1979, 64, 17–24. [Google Scholar] [CrossRef]
- Weihrich, R.; Matar, S.F.; Eyert, V.; Rau, F.; Zabel, M.; Andratschke, M.; Anusca, I.; Bernert, T. Structure, ordering and bonding of half antiperovskites PbNi3/2S and BiNi3/2S. Prog. Solid State Chem. 2007, 35, 309–327. [Google Scholar] [CrossRef]
- McDonald, A.M.; Cabri, L.J.; Stanley, C.J.; Good, D.J.; Redpath, J.; Spratt, J. Coldwellite, Pd3Ag2S, a new mineral species from the Marathon deposit, Coldwell Complex, Ontario, Canada. Can. Mineral. 2015, 53, 845–857. [Google Scholar] [CrossRef]
Figure 1.
Digital image in reflected plane polarized light showing inclusions of thalhammerite in galena (gn) in association with (a) chalcopyrite (ccp) and (b) vymazalováite (vym).
Figure 1.
Digital image in reflected plane polarized light showing inclusions of thalhammerite in galena (gn) in association with (a) chalcopyrite (ccp) and (b) vymazalováite (vym).
Figure 2.
Reflectance data for thalhammerite compared to synthetic analogue, in air. The reflectance values (R%) are plotted versus the wavelength λ in nm.
Figure 2.
Reflectance data for thalhammerite compared to synthetic analogue, in air. The reflectance values (R%) are plotted versus the wavelength λ in nm.
Figure 3.
Details of the Rietveld profiles of synthetic thalhammerite showing the weak peak splitting, which cannot be fitted using the tetragonal cell. The observed (circles), calculated (solid), and difference profiles are shown. The vertical bars correspond to Bragg reflections.
Figure 3.
Details of the Rietveld profiles of synthetic thalhammerite showing the weak peak splitting, which cannot be fitted using the tetragonal cell. The observed (circles), calculated (solid), and difference profiles are shown. The vertical bars correspond to Bragg reflections.
Figure 4.
Crystal structure of thalhammerite showing the [PdS4] squares and Pd–S bonds. Unit-cell edges are highlighted. Details show the Rietveld profiles of synthetic thalhammerite showing the weak peak splitting, which cannot be fitted using the tetragonal cell.
Figure 4.
Crystal structure of thalhammerite showing the [PdS4] squares and Pd–S bonds. Unit-cell edges are highlighted. Details show the Rietveld profiles of synthetic thalhammerite showing the weak peak splitting, which cannot be fitted using the tetragonal cell.
Figure 5.
Coordination polyhedra of Ag (mono-capped tetragonal antiprism) and Bi (bi-capped trigonal prism) in the thalhammerite structure.
Figure 5.
Coordination polyhedra of Ag (mono-capped tetragonal antiprism) and Bi (bi-capped trigonal prism) in the thalhammerite structure.
Figure 6.
(a) Arrangement of two types of building blocks in the thalhammerite structure. (b) Detailed view showing the block containing Ag (green) and Bi (orange) atoms.
Figure 6.
(a) Arrangement of two types of building blocks in the thalhammerite structure. (b) Detailed view showing the block containing Ag (green) and Bi (orange) atoms.
Figure 7.
EBSD image of natural thalhammerite; in the right pane, the Kikuchi bands are indexed.
Figure 7.
EBSD image of natural thalhammerite; in the right pane, the Kikuchi bands are indexed.
Figure 8.
Comparison of Raman spectra in the synthetic Pd9Ag2Bi2S4 and in the natural material.
Figure 8.
Comparison of Raman spectra in the synthetic Pd9Ag2Bi2S4 and in the natural material.
Table 1.
Reflectance data for natural and synthetic thalhammerite.
Table 1.
Reflectance data for natural and synthetic thalhammerite.
| | Natural | Synthetic |
|---|
| λ (nm) | R1 (%) | R2 (%) | R1 (%) | R2 (%) |
|---|
| 400 | 40.0 | 41.2 | 40.6 | 42.1 |
| 420 | 40.6 | 41.8 | 41.3 | 42.6 |
| 440 | 41.1 | 42.3 | 42.0 | 43.2 |
| 460 | 41.7 | 42.8 | 42.6 | 43.9 |
| 470 | 41.9 | 43.0 | 42.9 | 44.3 |
| 480 | 42.2 | 43.3 | 43.1 | 44.6 |
| 500 | 42.7 | 43.9 | 43.8 | 45.3 |
| 520 | 43.2 | 44.4 | 44.6 | 46.0 |
| 540 | 43.7 | 44.9 | 45.3 | 46.6 |
| 546 | 43.9 | 45.1 | 45.6 | 46.9 |
| 560 | 44.2 | 45.4 | 45.9 | 47.2 |
| 580 | 44.7 | 45.9 | 46.4 | 47.7 |
| 589 | 44.9 | 46.1 | 46.7 | 47.9 |
| 600 | 45.2 | 46.3 | 46.9 | 48.1 |
| 620 | 45.6 | 46.8 | 47.3 | 48.5 |
| 640 | 46.1 | 47.3 | 47.7 | 48.9 |
| 650 | 46.3 | 47.5 | 47.9 | 49.1 |
| 660 | 46.5 | 47.8 | 48.0 | 49.2 |
| 680 | 47.0 | 48.3 | 48.3 | 49.5 |
| 700 | 47.4 | 48.9 | 48.6 | 49.8 |
Table 2.
Electron-microprobe analyses of natural and synthetic thalhammerite.
Table 2.
Electron-microprobe analyses of natural and synthetic thalhammerite.
| wt % | Pd | Ag | Pb | Bi | S | Se | Total |
|---|
| Thalhammerite |
| | 52.80 | 14.57 | 2.60 | 22.56 | 7.75 | 0.07 | 100.35 |
| | 53.40 | 14.29 | 3.05 | 22.09 | 7.62 | 0.03 | 100.47 |
| | 51.64 | 14.25 | 6.12 | 21.98 | 7.70 | 0.19 | 101.87 |
| average | 52.61 | 14.37 | 3.92 | 22.21 | 7.69 | 0.10 | 100.90 |
| 13/B-92 * | 53.85 | 12.51 | | 24.84 | 7.90 | | 99.1 |
| | 52.77 | 12.27 | 1.77 | 24.29 | 7.45 | 0.57 | 99.12 |
| 1/K-92 * | 53.85 | 12.8 | | 24.24 | 7.89 | | 99.01 |
| | 52.77 | 11.83 | | 25.73 | 7.99 | | 99.53 |
| | 54.08 | 12.21 | | 25.34 | 7.95 | | 101.21 |
| Synthetic Sample |
| Exp37 | 54.18 | 13.69 | | 25.02 | 7.59 | | 100.48 |
| | 54.74 | 12.91 | | 25.04 | 7.50 | | 100.19 |
| | 54.66 | 12.46 | | 25.90 | 7.39 | | 100.42 |
| | 56.14 | 12.01 | | 24.70 | 7.36 | | 100.21 |
| | 55.78 | 12.67 | | 24.27 | 7.44 | | 100.16 |
| | 55.10 | 12.75 | | 24.99 | 7.46 | | 100.29 |
| average | 55.10 | 12.75 | | 24.99 | 7.46 | | 100.30 |
Table 3.
Crystallographic data for the selected crystal of synthetic thalhammerite, Pd9Ag2Bi2S4.
Table 3.
Crystallographic data for the selected crystal of synthetic thalhammerite, Pd9Ag2Bi2S4.
| Crystal Data |
| Chemical formula (idealized) | Pd9Ag2Bi2S4 |
| Space group | I4/mmm (No. 139) |
| a [Å] | 8.0266(2) |
| c [Å] | 9.1531(2) |
| V [Å3] | 589.70(2) |
| Z | 2 |
| Crystal size (mm) | 0.034 × 0.027 × 0.013 |
| Data Collection |
| Diffractometer | SuperNova |
| Temperature (K) | 293 |
| Radiation | MoKα (0.7107 Å) |
| Theta range (°) | 5.08–27.62 |
| Reflections collected | 3659 |
| Independent reflections | 226 |
| Unique observed reflections [I > 3(σ)] | 221 |
| Index ranges | −10 < h < 10 |
| −10 < k < 10 |
| −11 < l < 11 |
| Absorption correction method | Empirical |
| Structure Refinement |
| Refinement method | Full matrix least-squares on F2 |
| Parameters/restrains/constrains | 21/0/0 |
| R, wR (obs) | 0.0310/0.0815 |
| R, wR (all) | 0.0318/0.0817 |
| Largest diff. peak and hole (e−/Å3) | 1.20/−5.20 |
Table 4.
Fractional coordinates and anisotropic displacement parameters (Å2) for synthetic thalhammerite.
Table 4.
Fractional coordinates and anisotropic displacement parameters (Å2) for synthetic thalhammerite.
| Atom | Pd(1) | Pd(2) * | Pd(3) | Ag | Bi | S |
|---|
| Wyckoff Position | 2a | 8f | 8j | 4e | 4d | 8h |
| x | 1/2 | 1/4 | 1/2 | 1/2 | 1/2 | 0.2081(4) |
| y | 1/2 | 1/4 | 0.2027(2) | 1/2 | 0 | 0.2081(4) |
| z | 1/2 | 1/4 | 0 | 0.1810(2) | 1/4 | 0 |
| U11 | 0.0069(8) | 0.0104(8) | 0.0077(7) | 0.0098(6) | 0.0090(4) | 0.0071(12) |
| U22 | 0.0069(8) | 0.0104(8) | 0.0097(7) | 0.0098(6) | 0.0090(4) | 0.0071(12) |
| U33 | 0.0109(13) | 0.0051(10) | 0.0077(7) | 0.0082(9) | 0.0079(6) | 0.012(2) |
| U12 | 0 | 0.0017(6) | 0 | 0 | 0 | −0.0018(15) |
| U13 | 0 | 0.0011(4) | 0 | 0 | 0 | 0 |
| U23 | 0 | 0.0011(4) | 0 | 0 | 0 | 0 |
| Ueq | 0.0083(6) | 0.0086(5 | 0.0084(4) | 0.0106(4) | 0.0086(3) | 0.0087(9) |
Table 5.
Selected bond distances (Å) in the thalhammerite crystal structure.
Table 5.
Selected bond distances (Å) in the thalhammerite crystal structure.
| Pd(1) | 4 × S | 2.362(3) | Ag | 4 × Pd(3) | 2.905(1) |
| | 2 × Ag | 2.919(2) | | 4 × Pd(2) | 2.9073(4) |
| Pd(2) | 2 × S | 2.3372(7) | | | |
| | 2 × Bi | 2.8378(1) | Bi1 | 4 × Pd(3) | 2.808(1) |
| | 2 × Ag | 2.9073(4) | | 4 × Pd(2) | 2.8378(1) |
| | 4 × Pd(3) | 3.0670(2) | | | |
| Pd(3) | 2 × S | 2.343(3) | | | |
| | 2 × Bi | 2.8080(8) | | | |
| | 2 × Ag | 2.905(2) | | | |
| | 4 × Pd(2) | 3.0670(2) | | | |
Table 6.
X-ray powder diffraction data of thalhammerite (CuKα radiation, Bruker D8 Advance, Bragg-Brentano geometry). Only reflections with I(obs) ≥ 1 are listed.
Table 6.
X-ray powder diffraction data of thalhammerite (CuKα radiation, Bruker D8 Advance, Bragg-Brentano geometry). Only reflections with I(obs) ≥ 1 are listed.
| I(obs) | h | k | l | d(meas) | d(calc) |
|---|
| 11 | 1 | 0 | 1 | 6.0364 | 6.0338 |
| 11 | 1 | 1 | 0 | 5.6790 | 5.6767 |
| 13 | 0 | 0 | 2 | 4.5752 | 4.5736 |
| 8 | 2 | 0 | 0 | 4.0155 | 4.0140 |
| 18 | 1 | 1 | 2 | 3.5620 | 3.5615 |
| 24 | 2 | 1 | 1 | 3.3428 | 3.3420 |
| 2 | 2 | 0 | 2 | 3.0181 | 3.0169 |
| 9 | 1 | 0 | 3 | 2.8510 | 2.8504 |
| 46 | 2 | 2 | 0 | 2.8393 | 2.8383 |
| 21 | 3 | 0 | 1 | 2.5685 | 2.5684 |
| 100 | 2 | 2 | 2 | 2.4122 | 2.4117 |
| 61 | 1 | 2 | 3 | 2.3245 | 2.3241 |
| 48 | 0 | 0 | 4 | 2.2873 | 2.2868 |
| 29 | 1 | 3 | 2 | 2.2201 | 2.2197 |
| 2 | 2 | 3 | 1 | 2.1637 | 2.1634 |
| 17 | 1 | 1 | 4 | 2.1213 | 2.1212 |
| 40 | 4 | 0 | 0 | 2.0072 | 2.0070 |
| 3 | 3 | 3 | 0 | 1.8923 | 1.8922 |
| 8 | 4 | 0 | 2 | 1.8377 | 1.8378 |
| 15 | 2 | 3 | 3 | 1.7981 | 1.7982 |
| 18 | 2 | 2 | 4 | 1.7805 | 1.7807 |
| 23 | 3 | 3 | 2 | 1.7481 | 1.7485 |
| 4 | 1 | 3 | 4 | 1.6991 | 1.6991 |
| 2 | 4 | 2 | 2 | 1.6711 | 1.6710 |
| 5 | 1 | 4 | 3 | 1.6413 | 1.6410 |
| 1 | 2 | 1 | 5 | 1.6299 | 1.6300 |
| 4 | 4 | 3 | 1 | 1.5814 | 1.5814 |
| 1 | 5 | 1 | 0 | 1.5743 | 1.5744 |
| 8 | 0 | 3 | 5 | 1.5102 | 1.5103 |
| 30 | 4 | 0 | 4 | 1.5085 | 1.5085 |
| 9 | 1 | 1 | 6 | 1.4723 | 1.4724 |
| 13 | 4 | 4 | 0 | 1.4193 | 1.4192 |
| 7 | 4 | 4 | 2 | 1.3554 | 1.3554 |
| 12 | 2 | 2 | 6 | 1.3431 | 1.3431 |
| 9 | 2 | 5 | 3 | 1.3395 | 1.3393 |
| 1 | 3 | 5 | 2 | 1.3185 | 1.3184 |
| 19 | 3 | 1 | 6 | 1.3070 | 1.3070 |
| 7 | 1 | 5 | 4 | 1.2969 | 1.2968 |
| 9 | 6 | 2 | 0 | 1.2694 | 1.2693 |
| 3 | 1 | 2 | 7 | 1.2279 | 1.2279 |
| 18 | 6 | 2 | 2 | 1.2231 | 1.2231 |
| 1 | 1 | 6 | 3 | 1.2113 | 1.2112 |
| 10 | 4 | 4 | 4 | 1.2059 | 1.2058 |
| 11 | 3 | 3 | 6 | 1.1872 | 1.1871 |
© 2018 by the authors. Licensee MDPI, Basel, Switzerland. This article is an open access article distributed under the terms and conditions of the Creative Commons Attribution (CC BY) license (http://creativecommons.org/licenses/by/4.0/).

 ,
, 


