Article

Assessment of the Mineral Resource Potential of Atlantic Ferromanganese Crusts Based on Their Growth History, Microstructure, and Texture

1
National Oceanography Centre Southampton, European Way, Southampton SO14 3ZH, UK
2
Department of Earth Sciences, Durham University, South Road, Durham DH1 3LE, UK
3
British Geological Survey, Environmental Science Centre, Keyworth, Nottingham NG12 5GG, UK
4
University of Southampton, National Oceanography Centre Southampton, European Way, Southampton SO14 3ZH, UK
*
Author to whom correspondence should be addressed.
Minerals 2018, 8(8), 327; https://doi.org/10.3390/min8080327
Submission received: 4 July 2018 / Revised: 19 July 2018 / Accepted: 27 July 2018 / Published: 30 July 2018
(This article belongs to the Special Issue Deep-Sea Minerals and Gas Hydrates)

Abstract

:
The decarbonisation of our energy supply is reliant on new technologies that are raw material intensive and will require a significant increase in the production of metals to sustain them. Ferromanganese (FeMn) crusts are seafloor precipitates, enriched in metals such as cobalt and tellurium, both of which have a predicted future demand above current production rates. In this study, we investigate the texture and composition of FeMn crusts on Tropic Seamount, a typical Atlantic guyot off the coast of western Africa, as a basis for assessing the future mineral resource potential of Atlantic Seamounts. The majority of the summit is flat and covered by FeMn crusts with average thicknesses of 3–4 cm. The crusts are characterized by two dominant textures consisting of either massive pillared growth or more chaotic, cuspate sections of FeMn oxides, with an increased proportion of detrital and organic material. The Fe, Mn, and Co contents in the FeMn oxide layers are not affected by texture. However, detrital material and bioclasts can form about 50% of cuspate areas, and the dilution effect of this entrained material considerably reduces the Fe, Mn, and Co concentrations if the bulk samples are analyzed. Whilst Tropic Seamount meets many of the prerequisites for a crust mining area, the thickness of the crusts and their average metal composition means extraction is unlikely to be viable in the near future. The ability to exploit more difficult terrains or multiple, closely spaced edifices would make economic feasibility more likely.

1. Introduction

In response to anthropogenically induced climate change, it is essential to decarbonise power generation, transportation, and industrial processes. This can be achieved by switching from high- to low-carbon energy sources, such as renewables and electric vehicles. However, these technologies and associated infrastructure require large amounts of raw materials, including some metals that have experienced rapid demand growth in recent years (e.g., cobalt, lithium, rare earth elements (REE), and tellurium). To meet this demand and ensure the security of the supply in the future, it is necessary to consider new sources for such key metals. Seafloor ferromanganese oxides, comprising both crusts and nodules, are rich in tellurium (Te) and cobalt (Co) [1,2,3,4], both of which are in high demand. Te is primarily used in photovoltaic solar cells (40%), thermoelectric production (26%), and high-strength alloys of copper, steel, and lead (34%), whilst Co is used to produce alloys for use in high-temperature environments and in the cathodes of lithium-ion batteries used in electronic devices and vehicles. Both Te and Co have been identified as economically important or critical raw minerals, predominantly because of their use in emerging technologies (American Physical Society [5], European Union [6]). Yet, even if our current production rates were doubled, we are unlikely to be able to meet the predicted demands of these industries in the near future [3,7]. Currently more than 60% of known Co resources are found in the Democratic Republic of the Congo, where guaranteed future supply depends on maintained political stability [8], while Te is mainly produced as a byproduct of Copper processing. As such, it is important that new, viable resources for these elements are found to meet global demand. Ferromanganese nodules (FeMn nodules) and crusts (FeMn crusts), rich in both Co and, in the case of crusts, Te, have been proposed by several authors (e.g., [4,9,10,11]) as a resource, as they are enriched in both Te and Co when compared with land-based deposits. FeMn crusts are also higher in REEs than many land deposits and FeMn nodules [12]. In this paper, we focus on the importance of FeMn crustal structure on their value as a resource.
Most FeMn crusts are of hydrogenetic origin and composed of Fe oxyhydroxides and Mn oxides precipitated directly from cold seawater onto exposed, sediment-free rocky substrates. The availability of Fe and Mn as dissolved cations in the water column is intimately linked to the biological activity and its impact on the surrounding dissolved oxygen levels. The low levels of oxygen saturation define the so-called oxygen minimum zone (OMZ). The low oxidizing potential allows many metals to be proportionally enriched in this layer that typically extends between 200 and 700 m beneath sea-level in the North Atlantic [13]. Seamounts, ridges, and continental platforms form topographic anomalies on the seabed, and provoke the upwelling of deep oxygenated water. Turbulent mixing between upwelling O2-rich and metal-laden waters of the OMZ forms the basic mechanism for the precipitation of Fe and Mn oxyhydroxides. Mn2+ rich waters from the OMZ mix with deeper oxygen-rich waters and oxidize Mn and other metals to form colloids that then scavenge trace metals and precipitate on hard, rocky surfaces as FeMn crusts [14]. Crusts occur throughout the oceans, predominantly on the flanks and summits of seamounts. They are believed to form only on sediment-free surfaces that are exposed to medium or high bottom currents that sweep them clear of sediments [15].
Under optimum conditions crusts may grow up to 26 cm thick, over tens of millions of years, and form at water depths of 400–7000 m, with the most cobalt-rich portions found between 800 and 2500 m water depth (e.g., [4,16]). The ability of crusts to sequester large quantities of metals from ocean water depends predominantly on the physicochemical properties of the deposit, which, alongside slow growth rates, surface charges, and the extensive surface area (325 m2/g) of the colloidal Fe and Mn phases, control the adsorption and surface redox reactions [10]. Crusts are highly texturally variable, with bands of massive, dense laminated or pillar structures and layers of lower density, chaotic cuspate textures, separated by gradational or erosional contacts [17,18]. These variations have been correlated with changes in oceanographic conditions and chemistry, although, in general, the cuspate sections are thought to contain more detrital material (e.g., [8,16,19]). FeMn crusts are particularly rich in Co (up to 2%) when compared with deep-sea nodules and land-based mineral deposits, due to their slower accumulation rates [3,20]. However, because crusts are clearly highly variable on a small scale, it is important to consider the effect that textural variation may have on the deposit grade and any implications for resource estimations.
The mining requirements for a FeMn crust covered seamount were considered by Hein et al. [16]. In this paper, the authors discussed the geological and geomorphological criteria that can be used to assess the viability of a potential mine site. They concluded that the water depth should be <2500 m and that an economically viable, 20-year mine site should cover about 260 km2, which may be spread between several edifices. They also stated that mining operations are likely to be concentrated on seamount summits due to their smoother topography, that sediment cover should ideally be less than a few meters, and that crustal thicknesses should be 3 cm or greater. If all these criteria are met, then a site is considered to be potentially economically viable. These criteria and approach are supported by Du et al. [21], who stated that a mining feasibility assessment should first define viable mining blocks and estimate characteristic values for regional coverage and thickness and then estimate the composition and distribution of minerals and the economic feasibility of extracting them.
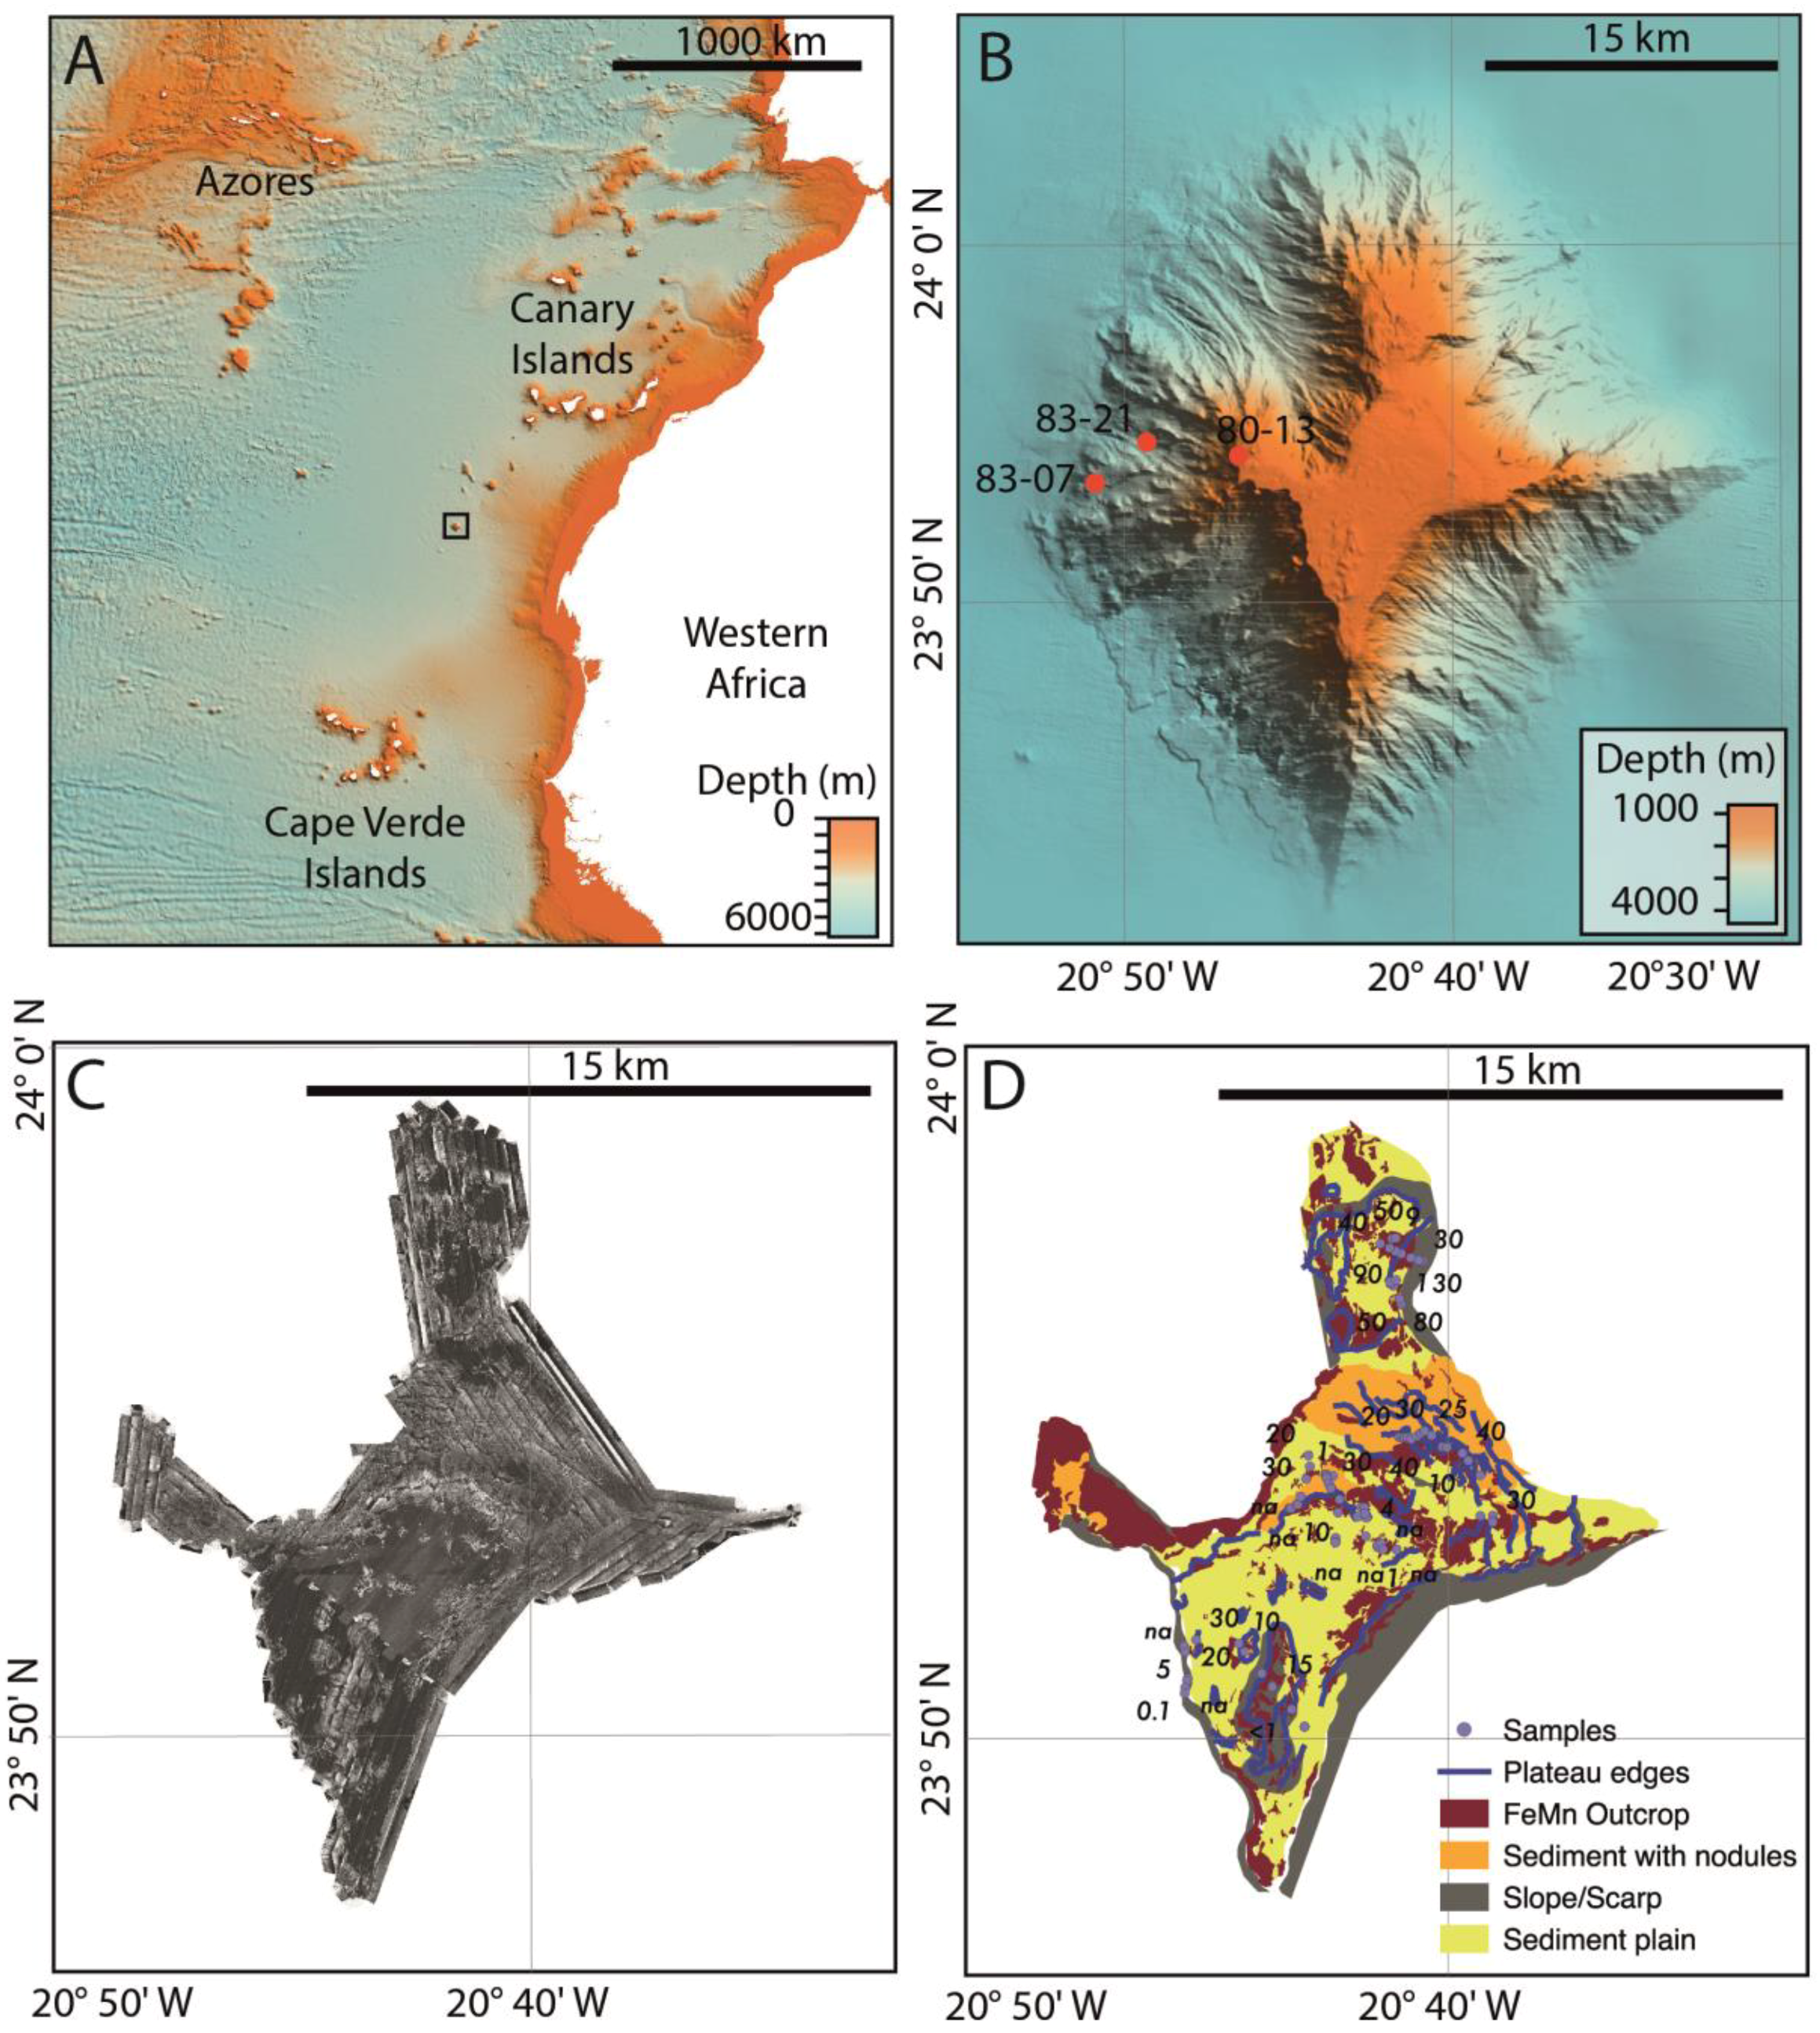
In this paper, we compare high-resolution X-ray computed tomography (XRCT) models of the crustal structure with SEM element mapping to elucidate the fine-scale structure of FeMn crusts and the effect variations have on the chemical composition. All samples analyzed were collected during cruise JC142 to Tropic Seamount in 2016. The seamount (Figure 1) is located off the passive continental margin of West Africa. K–Ar and Ar–Ar dating of volcanic rocks from Tropic Seamount suggest it was active from 119 Ma until 114 Ma, although some smaller, late-stage eruptive activity may have persisted until 60 Ma [22], since which time the volcano has subsided with the summit now at a depth of around 1100 m. While the absolute oldest possible age for FeMn crust precipitation is the age of the volcano, FeMn crust growth is thought to have been occurring for at least the last 12 Ma on sediment-free slopes and areas of the summit and 76 Ma elsewhere [23,24,25]. More recently, Marino et al. [26] identified crusts as old as 99 Ma from near the summit of Tropic Seamount. Samples collected from Tropic Seamount during cruise SO83 in 1992 reported uniform crustal growth of between 4 and 10 cm for the past 12 Ma (3.3–8.3 mm/Ma) [23] and fairly consistent element distributions, suggesting steady and constant elemental fluxes. The maximum measured bulk rock Co concentration from the SO83 samples was 0.85%. Other analyses of Tropic Seamount crusts [19] found that the FeMn crusts at Tropic Seamount were composed primarily of goethite and δ-MnO2 with minor amounts of calcite and quartz. Phosphatized samples consisting primarily of carbonate fluorapatite were also dredged off the eastern flank. Measured bulk contents were 13–28 wt% Fe, 8–22 wt% Mn, and 0–0.72 wt% Co. Growth rates estimated using the Co-chronometer were between 1.19 mm/Ma and 2.66 mm/Ma [19].

2. Materials and Methods

2.1. Cruise JC142

The data and samples were collected during expedition JC142 onboard the Royal Research Vessel James Cook in 2016. The ship bathymetry was obtained using a Kongsberg EM120 (12 kHz) multibeam echosounder (Kongsberg Gruppen, Kongsberg, Norway) and gridded at 50 m in QPS Fledermaus (Figure 1). The crustal outcrop was mapped using side-scan sonar data collected using an Edgetech 2200-M system mounted on the autonomous underwater vehicle (AUV) AutoSub6000 (The National Oceanography Centre (NOC), Southampton, UK) and visual observation from remotely operated vehicle (ROV) footage (Figure 1). The samples were collected using the ROV Isis (The National Oceanography Centre (NOC), Southampton, UK). The crusts were found on all the flanks, with the thickest measured during this campaign on the western spur (Figure 1). Three samples from different depths on this spur were selected for XRCT and SEM analysis.
The samples analyzed were JC142-83-21, a loose block collected on the western flank of the seamount at a depth of 3100 m; JC142-83-07, another loose block from a depth of 3780 m; and JC142-80-13, an in situ pavement sample collected at a depth of 1213 m. All the samples were deliberately chosen as unremarkable and hence representative of the majority of the material collected. JC142-83-21 comprises a 2–3 cm thick layer of FeMn crust precipitated onto a fractured limestone substrate (Figure 2). In the hand specimens, two different crust textures are observed, a dark, homogenous layer forming the base centimeter, which is overlain by a grainier, laminated 1–2 cm thick layer, which appears to contain beige, non-FeMn material. JC142-83-07 has the thickest crust at 10–12 cm thick, containing multiple, layers of FeMn material. JC142-80-13 has 5 cm of crust, the majority of which is fairly dark and homogenous but with at least one less homogenous-looking layer and a single <1 mm layer of phosphatized carbonate material.
Figure 2 shows the main structures observable in the hand specimens and the core locations taken from each sample. Two cores drilled parallel to the main growth direction were measured using the XRCT from the shallowest sample, JC142-80-13, across bands of variably dense textures. Four cores perpendicular to the growth were drilled in the JC142-83-21, one in the substrate, one in a massive area near the base, one in a transitional area halfway through the crust, and one in a less massive section near the top. In JC142-83-07, three cores were drilled perpendicular to the growth direction, approximately evenly spaced up the sample. A single core was drilled parallel to the growth direction to sample a relatively less massive zone, containing detrital/organic material that grades into a denser material with no visible detrital/organic material. In sample JC142-83-21, the drill sites overlap, forming a complete transect through the crust (Figure 3 and Figure 4).

2.2. X-ray Computed Tomography (XRCT) Measurements

XRCT work was performed at the Durham University X-ray computer tomography laboratory on a Zeiss XRadia-410. For analysis, 4 mm diameter cores were drilled into the material to be analyzed. Optimal resolution (4.3 microns per pixel) was obtained by collecting 3210 projections of each core, while it rotated around a central point at a maximum power of 90 kV. The reconstructions were produced using proprietary software, and the data were viewed and analyzed in Avizo version 9.2. (Thermo Fisher Scientific, Waltham, MA, USA). The data were cropped, reoriented, and repositioned relative to one another, before applying an anisotropic diffusion filter to reduce noise and make images clearer. Both the vein structures in the substrate and the FeMn growth within them, and the growth structures and layering within the main crusts were well imaged (Video S1). Further image processing was conducted to segment the images into their component parts and produce three-dimensional (3D) models of the growth structures within the crusts. These structures were sliced at 8 µm intervals, and the area covered by each pillar structure was measured to obtain the spatial statistics for each column.

2.3. SEM Energy Dispersive X-ray Spectroscopy (SEM-EDS)

Following XRCT analysis, the microcores for sample JC142-83-21 were set in resin and sliced into sections for analysis on the SEM. SEM-EDS measurements were collected at the University of Southampton Ocean and Earth Science Scanning Electron Microscope Facility using a Leo 1450VP SEM (Carl Zeiss Microscopy GmbH, Jena, Germany) and an Oxford Instruments X-Act 10 mm2 area Silicon Drift Detector (SDD) EDS Detector (Oxford Instruments plc, Abingdon, UK). The set up and processing was carried out with the AZtec Energy software system (v.3.1, Oxford Instruments, Abingdon, UK). The elemental mapping (512 × 384 pixel resolution) under high vacuum used an accelerating voltage of 30 kV with a dwell time of 36.5 ms per pixel, and at a working distance of 20 mm, the line scans used dwell times of 2.4 s per pixel but otherwise the same operating conditions. Normalized area analyses from these mapping datasets were used to achieve composition values with a detection limit of 0.1% and standard deviations of less than 0.4 wt%. The composition of an internal standard (sample JC142-113-002) measured using an ICP-MS was used to check the SEM data and was producing reliable results (Table S1). The metal concentrations here are similar to or slightly higher than the reference material.
SEM-EDS analyses were carried out on the cores drilled from JC142-83-21. They were sliced at three locations, 550 μm from the base, 3000 μm from the base, and 6800 μm from the base of cores B, C, and D, respectively (Figure 2). The element mapping focused on the distribution of Fe, Mn, and particularly Co, as these are the main metallic elements detectable in the crusts. Calcium was mapped as an indicator of bioclast (and detrital) input. Although Te is also of economic interest, the concentrations are too low to be measured by SEM. All of the weight percentages presented below are semi-quantitative; however, the concentrations are similar to those measured in the ICP-MS standard, suggesting that they can be used as a basis for estimating metal abundance.

3. Results

3.1. Structure and Growth

The summit of the seamount is very flat (slopes typically <10°) with 1–2 m high plateaus, some of which have small cliffs at their edges (Figure 1). The summit is characterized by large, flat FeMn crust pavements which extend for tens of meters with smooth and botryoidal surfaces and sedimented areas that reach depths of >0.5 m. Some areas of the summit are covered by nodule fields, which seem to be small sections of crust that have broken off platform edges and continued to precipitate FeMn oxides once deposited on the sediment. The flanks are steeper (10–50°) and mostly devoid of sediment, except on small flat areas. Smaller areas of crustal pavements are observed, again with smooth and botryoidal surface textures, as well as very common large, loose blocks. These blocks are often covered in FeMn crusts on all sides and, when cut, many reveal complicated internal structures, in which multiple smaller FeMn crust covered eroded blocks have been cemented together by later FeMn precipitation. The samples analyzed represent both these loose blocks and the summit pavements.
The XRCT images reveal that all of the samples have complex internal structures (Figure 3). The crustal growth is characterized by alternating bands of cuspate and columnar textures of variable thickness separated by erosional or gradational contacts, which are also visible in the SEM images of the cores from 83–21 (Figure 4). The massive, columnar sections are formed of dense, pillar structures with small amounts of carbonate, clay, and/or quartz between them. The columns appear to grow as cuspate layers of FeMn oxides that initiate at a single point and grow upwards and outwards over time. The first column in each individual pillared growth typically branches into multiple separate columns of FeMn, which continue to grow upwards and may further subdivide. In some areas, small (<20 µm) gaps between columns contain detrital material, suggesting that the cuspate mode of growth encouraged sediment collection around the margin of the columns. Detrital particles on the surface may initiate the growth of pillars, which then promotes this accumulation [10]. Columnar growth is commonly interrupted by bands of increased detrital/organic material, but sometimes pillars can be traced through these layers.
The other mode of growth, referred to in other publications as cuspate (e.g., [17]), has a much more chaotic, porous structure. In these areas, the FeMn oxides exist only as cuspate layers of a few 100 s µm thick, forming over the lenses of other materials. This material appears to be predominantly composed of encrusting foraminifera, with varying proportions of clay and quartz, plus carbonate at shallower water depths. The number and thickness of the foraminifera/detrital layers are variable, and the foraminifera themselves are commonly encrusted by FeMn oxide layers. Similar textures were observed in all the samples analyzed (Figure 3 and Figure 4).

3.2. SEM-EDS

SEM-EDS elemental maps were acquired from sections through cores 83-21 B, C, and D (Figure 2 and Figure 4), covering areas of both massive pillared and cuspate-textured crusts. Some examples of the mapping data are shown in Figure 5, and selected elemental transects are shown in Figure 6. Data from all scans is provided in Figure S1. In general, Co and Mn only occur in areas of FeMn crust, whilst minor Fe is detectable in both the crusts and also between the pillars and in sediment-rich zones. The bulk weight percentages of Fe, Mn, and Co vary between the two main textures identified. A scan taken from the pillared texture in the 83-21 core C at 550 µm (Figure 4, black outlined box) recorded 30 wt% Fe, 23 wt% Mn, 1 wt% Co, and 3 wt% Calcium (Ca) (a proxy for the percentage of entrained sediment). However, in the cuspate texture scanned from core D (Figure 4, black outlined box) the concentrations were 26 wt% Fe, 18 wt% Mn, 0.7 wt% Co, and almost 9 wt% Ca. The compositions of these two textures are similar to those in the other cores (Figure 4).
Some general characteristics of the FeMn crusts were noted based on the different scans. Higher concentrations of Co are observed where Mn is also enriched (e.g., Figure 5, Core B 3000 µm) as would be expected from the attraction of positively charged Co2+ to negatively charged MnO2-colloidal surfaces [14] and due to the oxidation of Co (II) to Co (III) by Mn oxide in the FeMn crusts [29]. Fe and Mn have an inverse relationship, with fluctuations in their relative concentration of typically between 2 and 5 wt% (Figure 6), and each forming 10–45 wt% of the crusts. In the majority of the areas analyzed Fe was the most abundant element, forming 19–45 wt%, followed by Mn at 12–45 wt%. There was a strong correlation between texture and bulk composition, with massive, columnar areas consistently having higher Fe and Mn concentrations than the cuspate areas. The cuspate areas also show an increase in Ca concentration, a proxy for sediment input, which reaches up to 17 wt% in some samples. The FeMn oxides do not vary significantly in composition between the different textural types.
All compositional measurements were made on dry samples. To apply these compositions to water-saturated samples, it was necessary to compare the mass of the two sample types. A representative dry sample had 89.3% of the mass of a water-saturated sample. Therefore, for the purpose of resource estimations, the element concentrations obtained from the dry samples were multiplied by 89.3% so that they could be applied to wet bulk density measurements.

4. Discussion

4.1. Texture, Growth Modes, and Environment

Whilst gradational textures are common, two main crustal textures were observed in all the samples analyzed: massive pillared areas and less dense, more chaotic cuspate zones. The environmental conditions that formed these two morphologies appear to have persisted over long periods of time (probably millions of years) in some of the areas analyzed. In others, these textures alternated, forming relatively thin bands indicative of more variable environmental conditions or influences on formation.
In common with Banakar and Hein [17], we attribute these changing textures primarily to variation in detrital and bioclast supply. The more chaotic, cuspate texture seems to have formed at the upper limit of the sediment/bioclast input, with crust formation almost terminating as it becomes covered by other material. It is notable that the predominant component of this material is foraminifera, which are encrusted directly onto the FeMn oxide surface. The shells are composed of carbonate and filled primarily with clay minerals. Additional detrital material is clay with some quartz. The presence or absence of foraminifera seems to be the main factor controlling the presence of cuspate versus more massive, pillared structures in all of the samples analyzed. This probably indicates a change in environmental conditions—perhaps an increase in the availability of nutrients or changes in the current flow rates/directions. The lack of disturbance or breakage of the actual shells suggests that this environment was relatively low energy. Marino et al. [19] observed similar textures in their Tropic Seamount samples and suggested that they are correlated with increased primary productivity as a result of upwelling at 24.5 Ma, 22−20 Ma, and 19−16 Ma. The measurements undertaken in this study lack the resolution to detect all the events identified by Marino et al. [19], although it is hard to correlate any of our samples with their observations.
The fact that rapid textural changes occur in both the loose blocks and the in situ sample suggest that they are not due to transport downslope. Instead, they indicate changes in the ocean conditions that effect the mode of growth. However, even in the uppermost layers of the samples, it is not possible to correlate cuspate and pillared horizons between samples with confidence. For example, JC142-80-13 and JC142-83-07 are dominated by more massive pillared textures near the surface, and JC142-83-21, which lies between them on the seamount, is dominated by cuspate texture. This suggests that the conditions controlling the presence or absence of foraminifera are more likely to result from localized variations in current energy or sediment cover rather than regional-scale changes in the organic or detrital input.
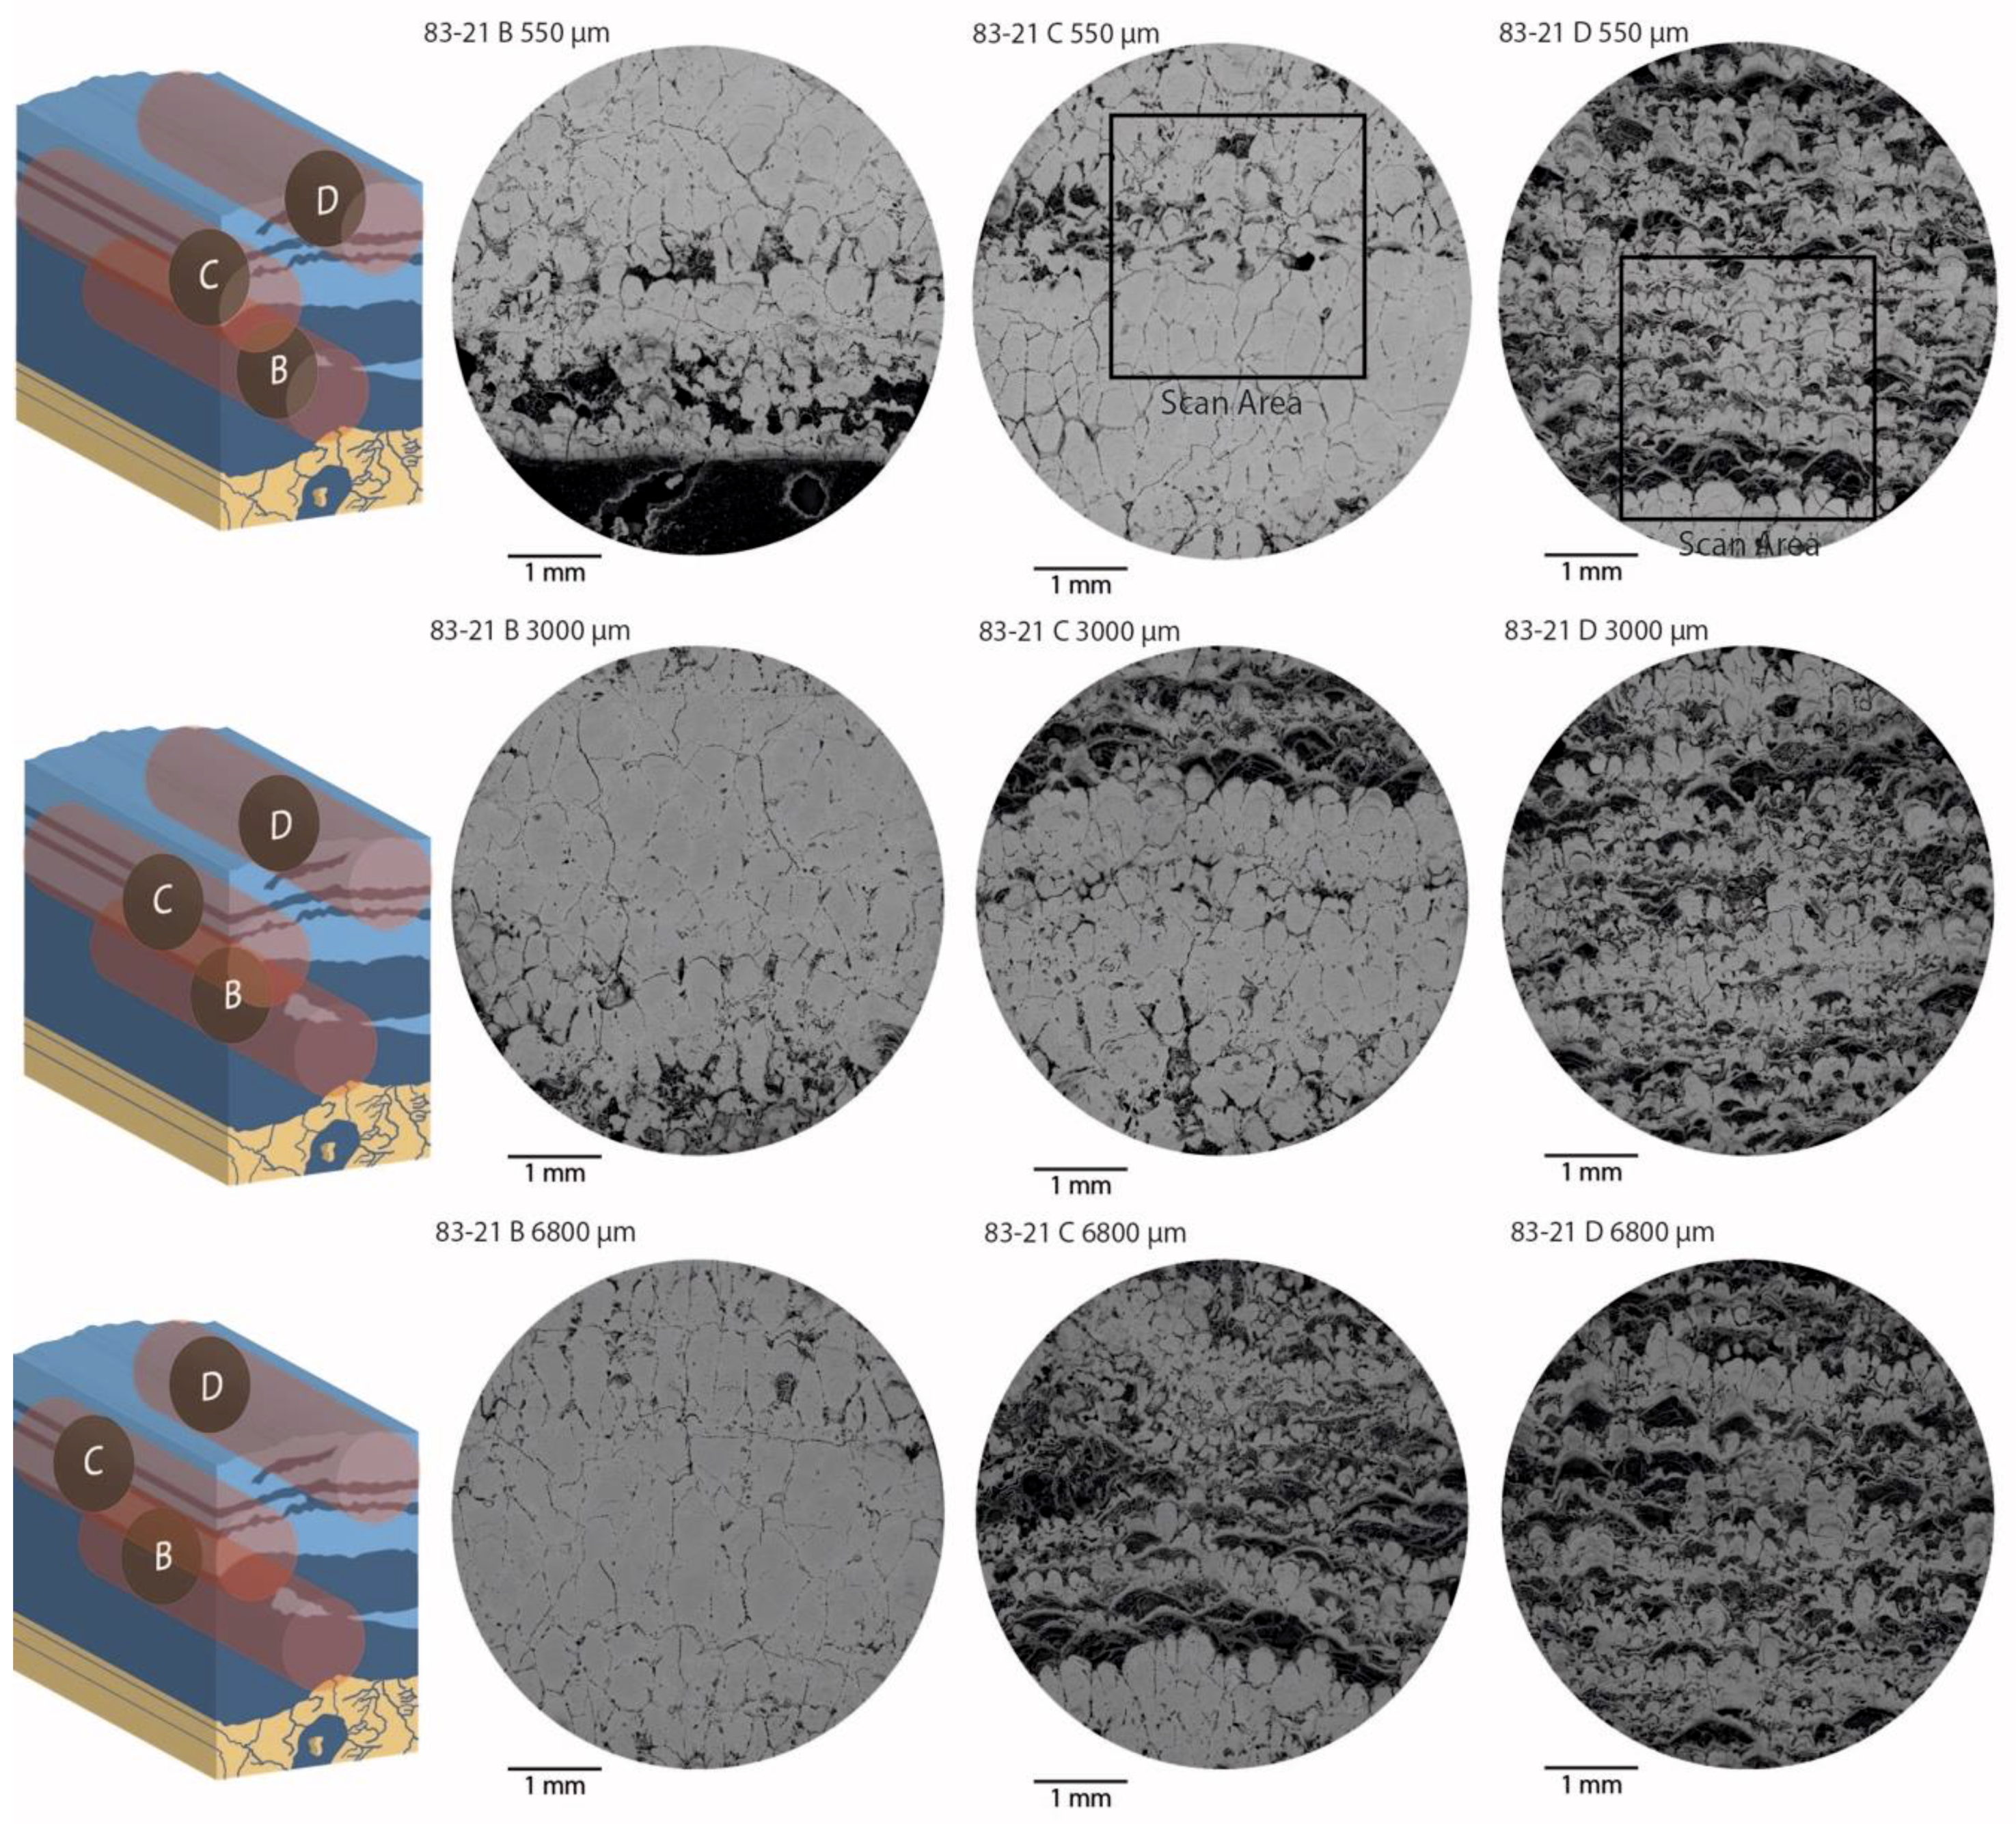
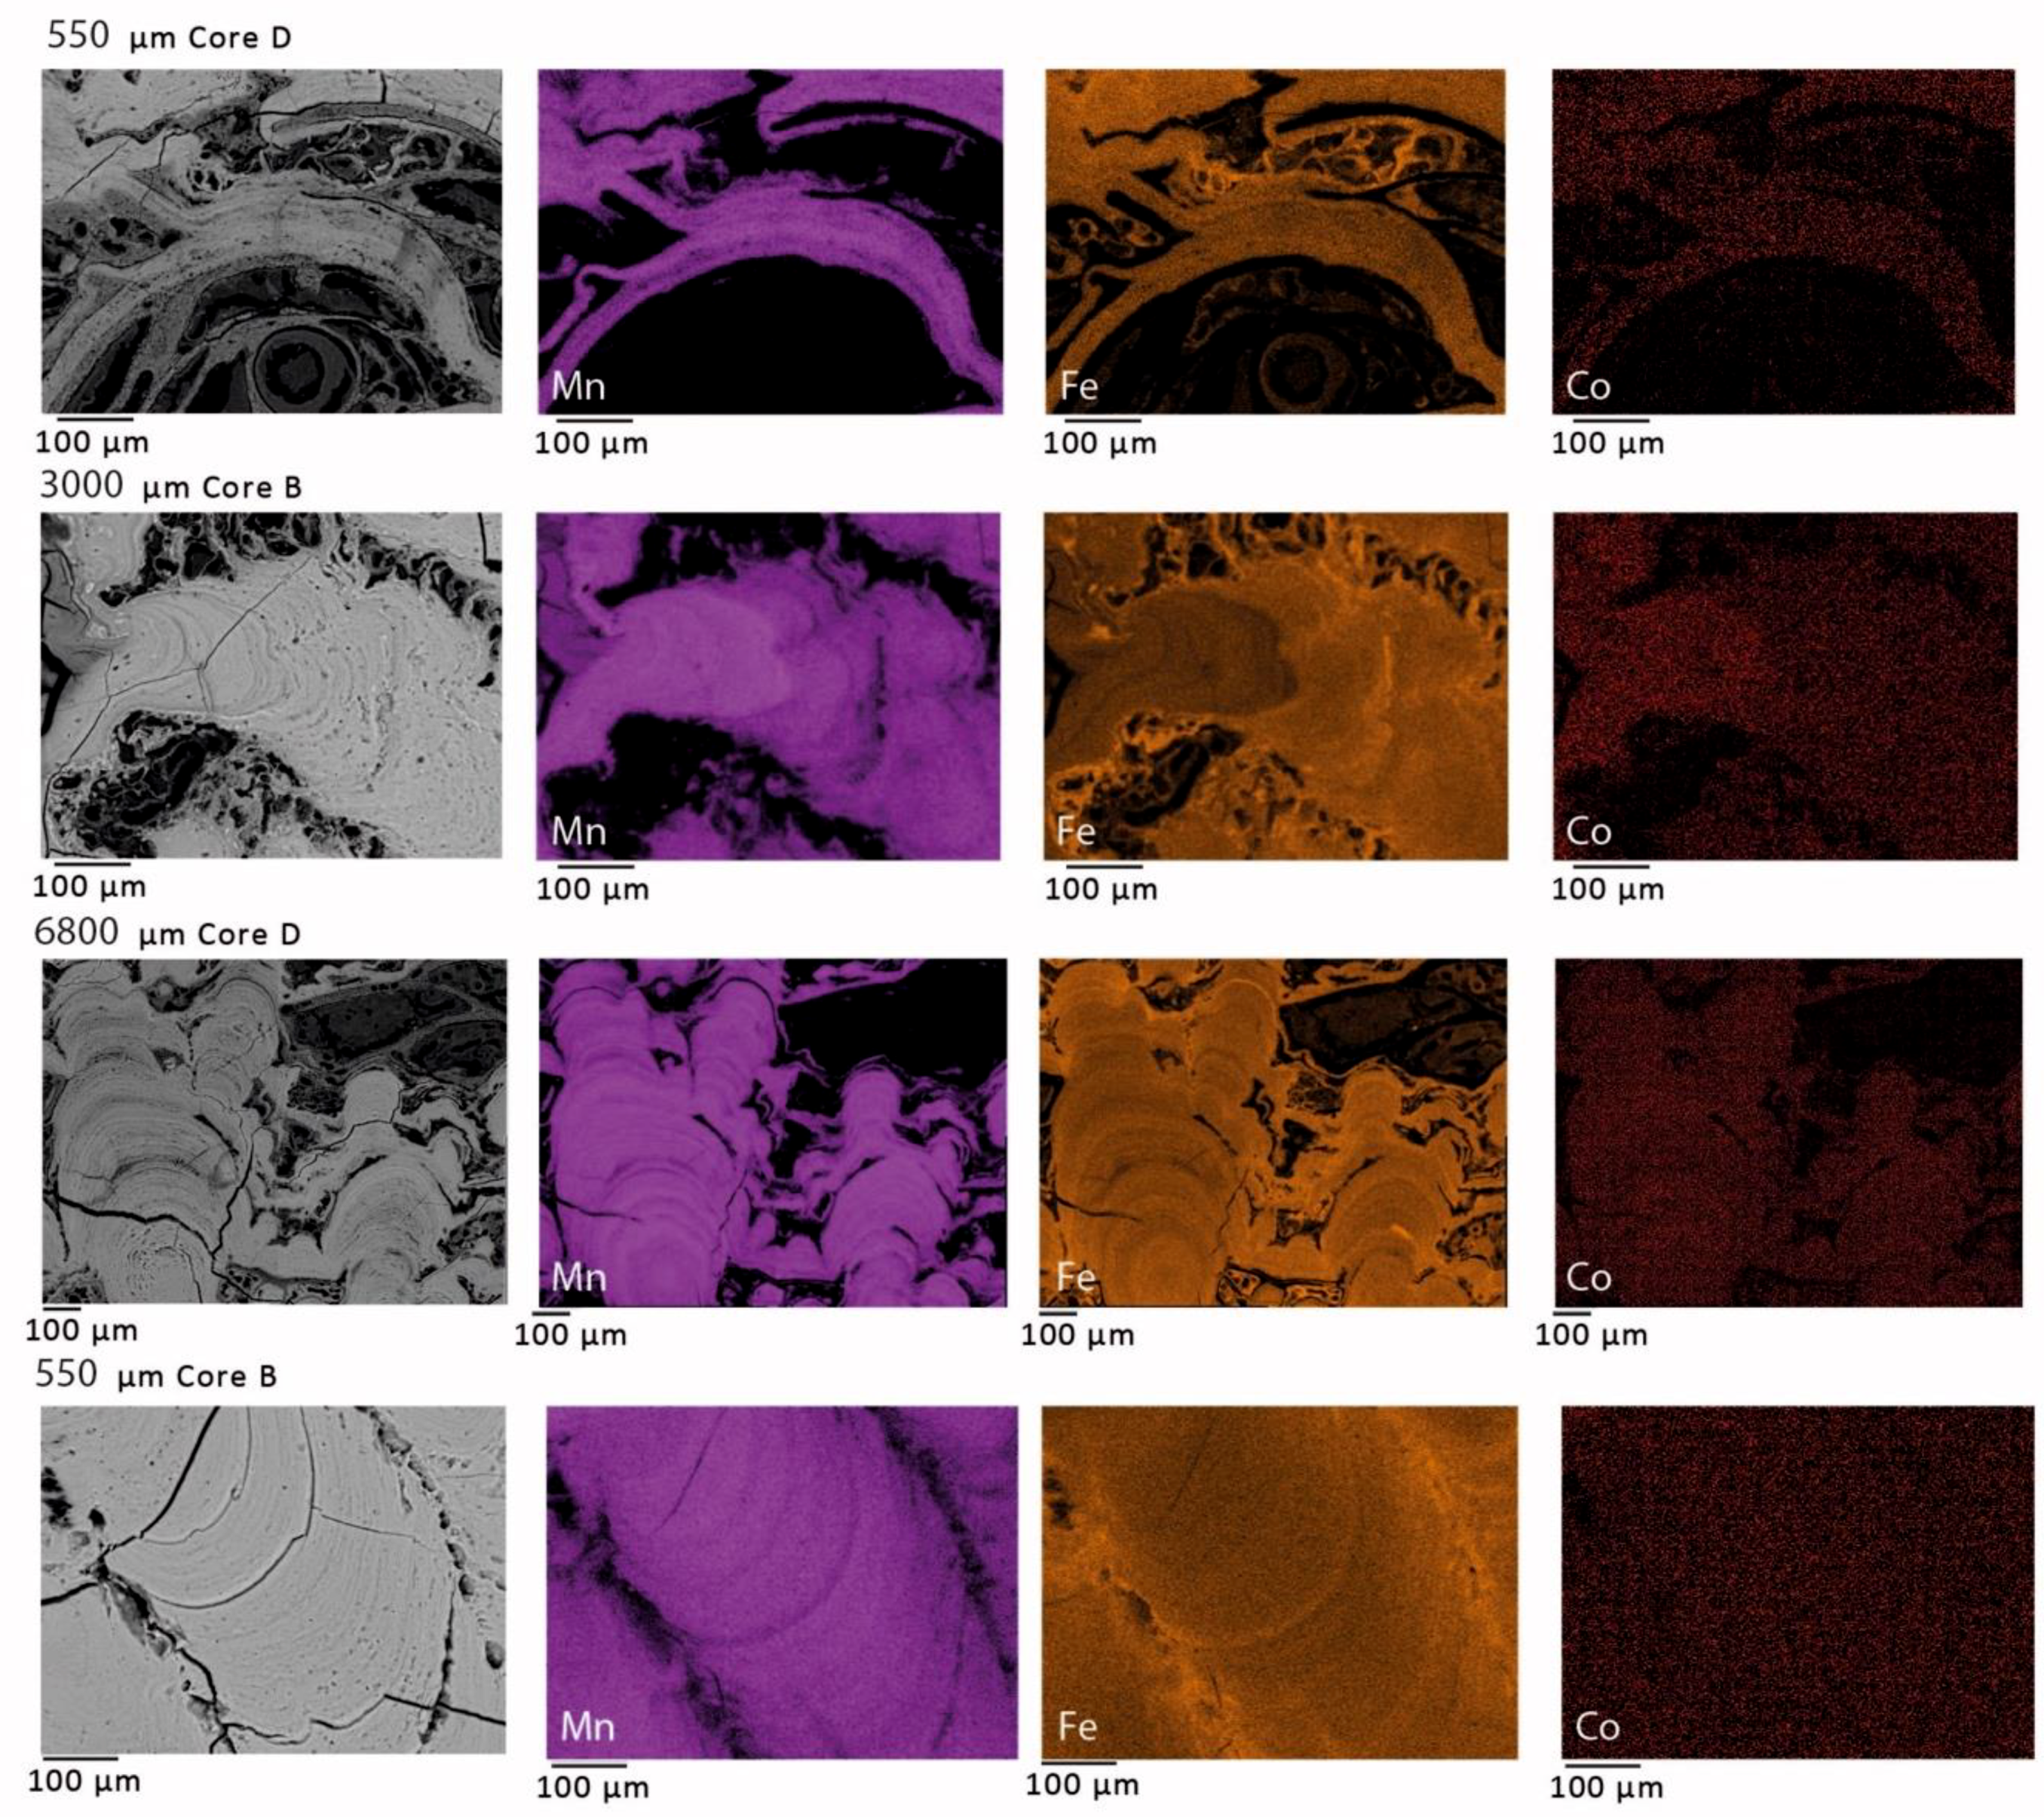
The more massive, pillared sections are largely devoid of any detrital material or foraminifera within the pillars themselves; however, some detrital material is found between the pillars, again consisting primarily of clay and quartz. These areas between the pillars also correlate with an increase in Fe (
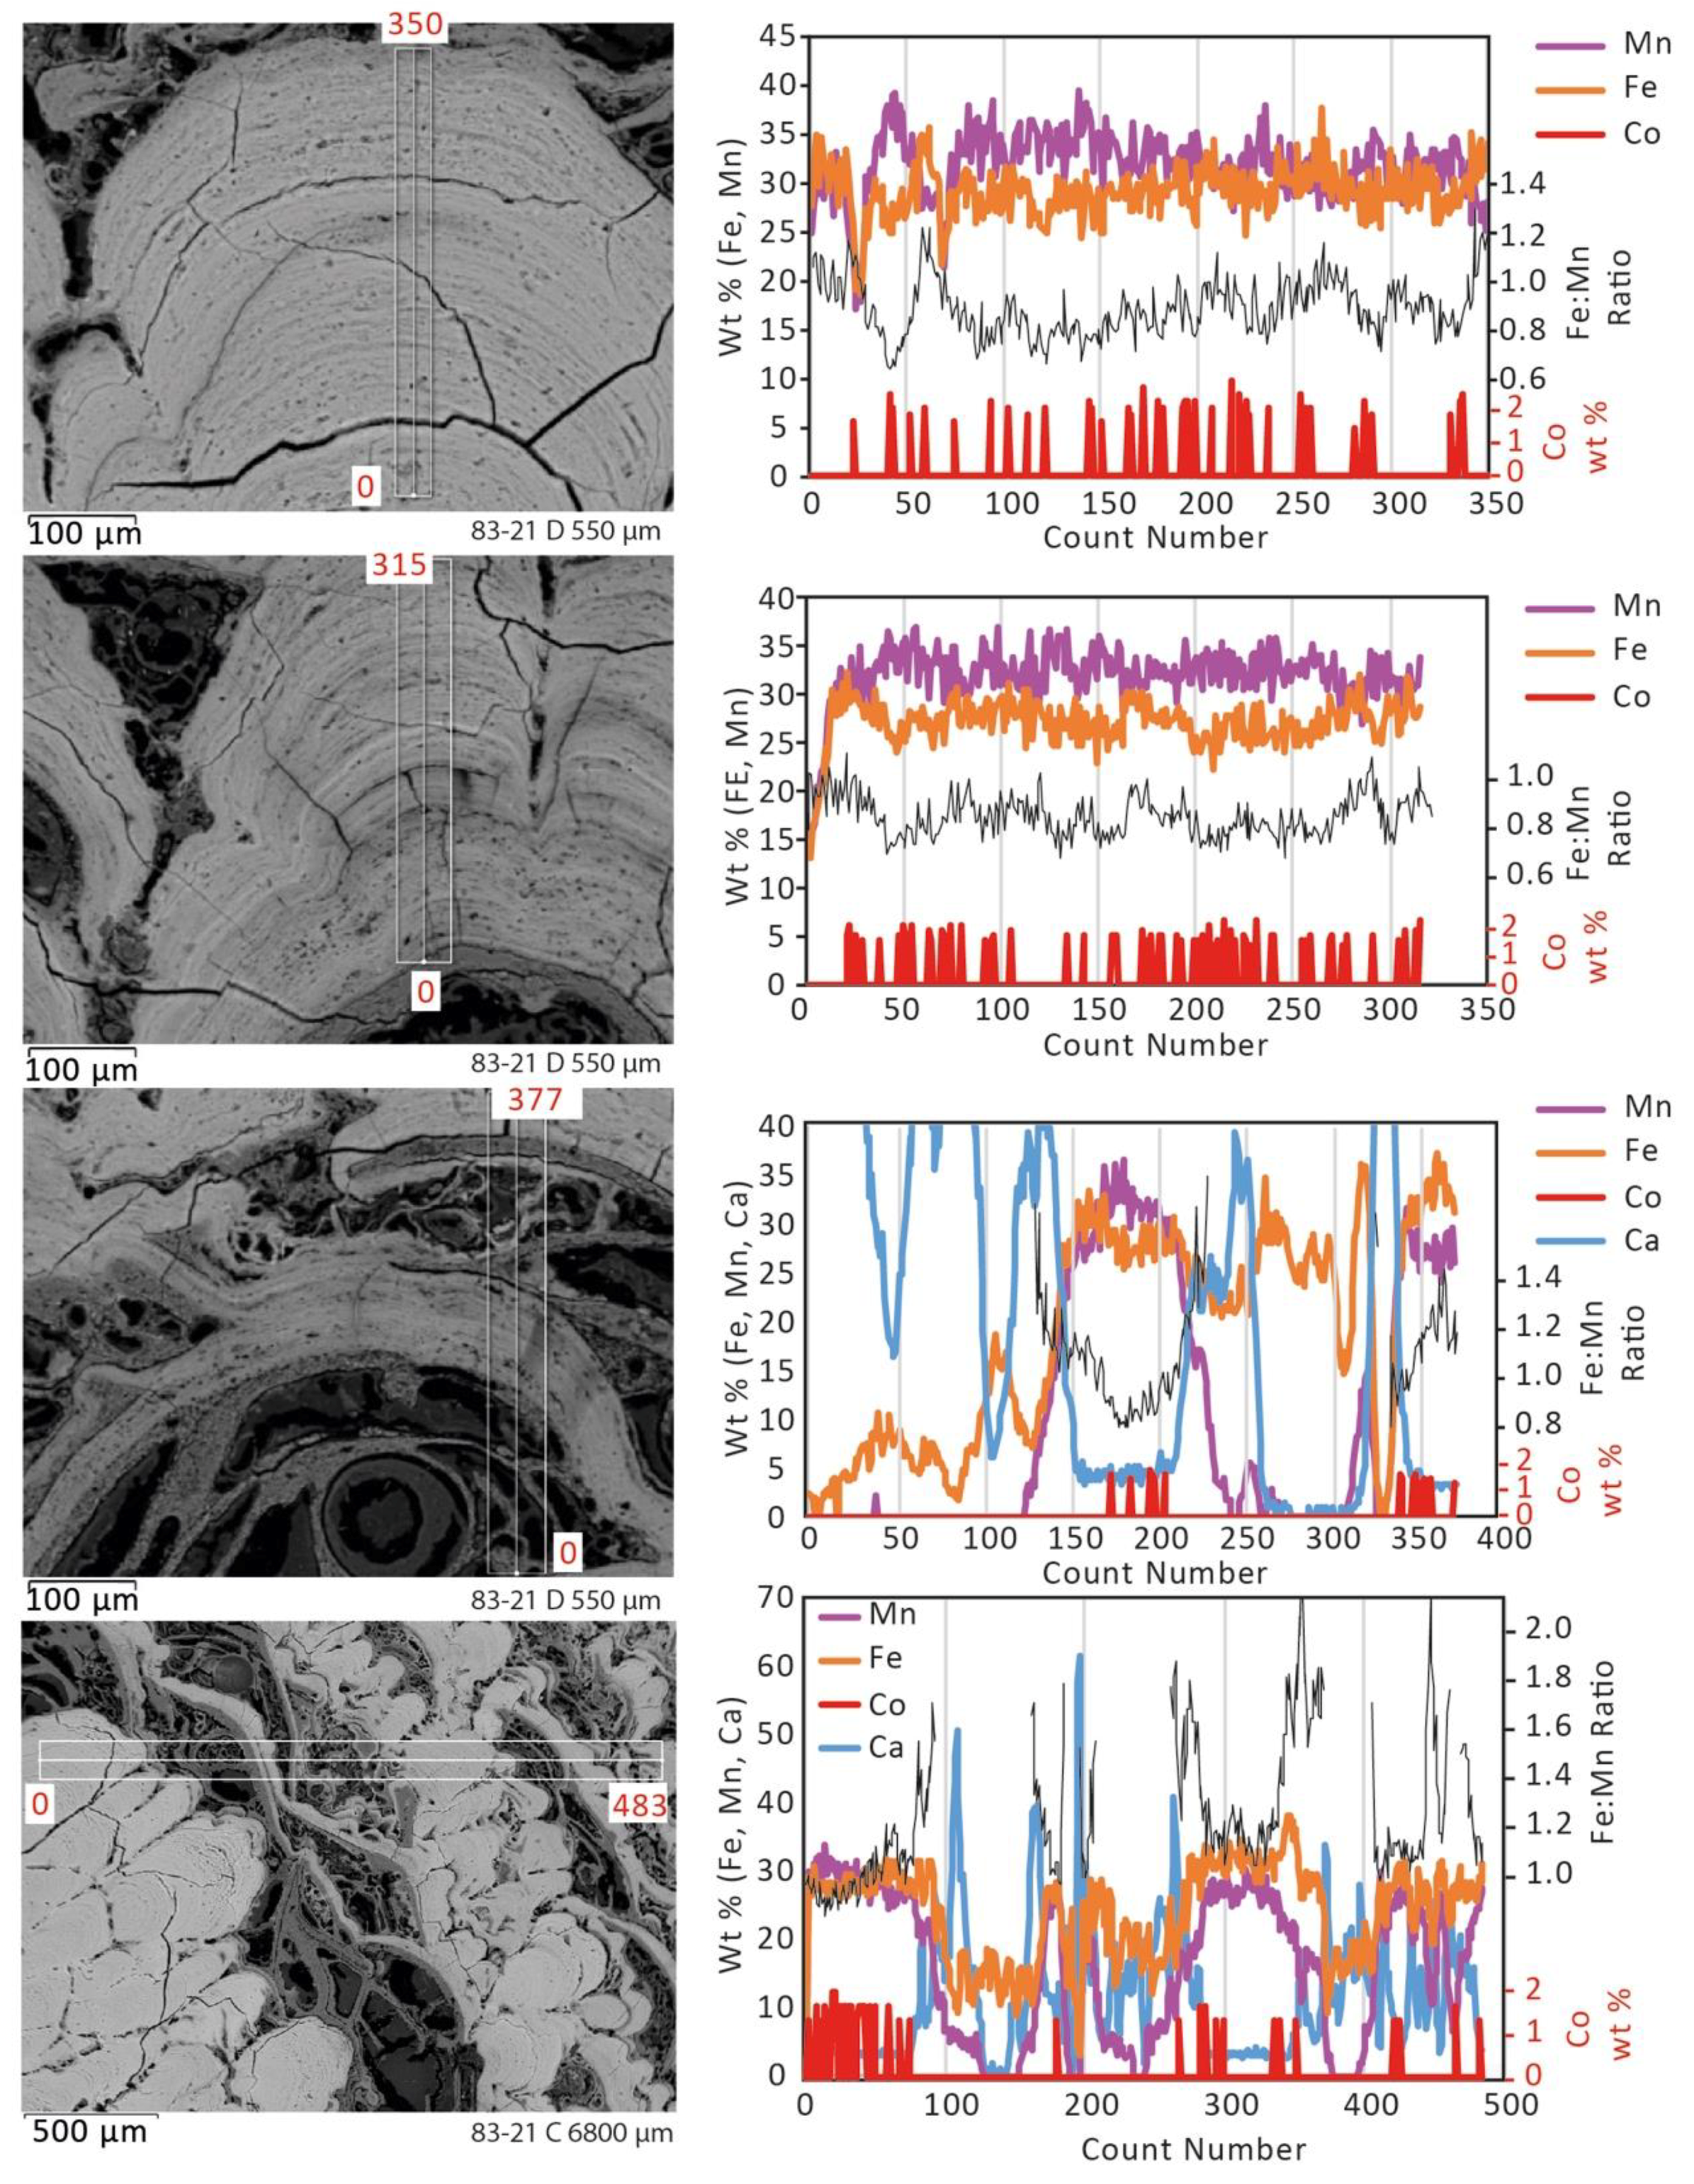
Figure 5; 550 µm Core D), possibly due to the presence of detrital material (e.g., clays). The accumulation of sedimentary material between the pillars is expected given their largely botryoidal mode of growth, where pillars are topped by a rounded, curved surface, which funnels sediments away from the central-high into the lows between developing columns. The very low level of sedimentary material here suggests that the total amount of sediment accumulation was extremely low or that current speeds over the areas from which the samples were obtained were sufficiently high to stop sediment accumulating. The Co concentrations in the FeMn oxides in both the cuspate and pillared sections are fairly consistent, suggesting that there is limited variation in the availability of Co in the surrounding seawater and that growth rates are likely to be similar. However, within a single pillar of FeMn there seem to be thin bands (<10 µm) of rapidly developed, relatively Fe-rich material and slower formed bands of relatively Mn- and Co-rich material. These changes are represented by variation in the Fe/Mn ratios (Figure 6) from 0.8–1.0 in the oxide sections.
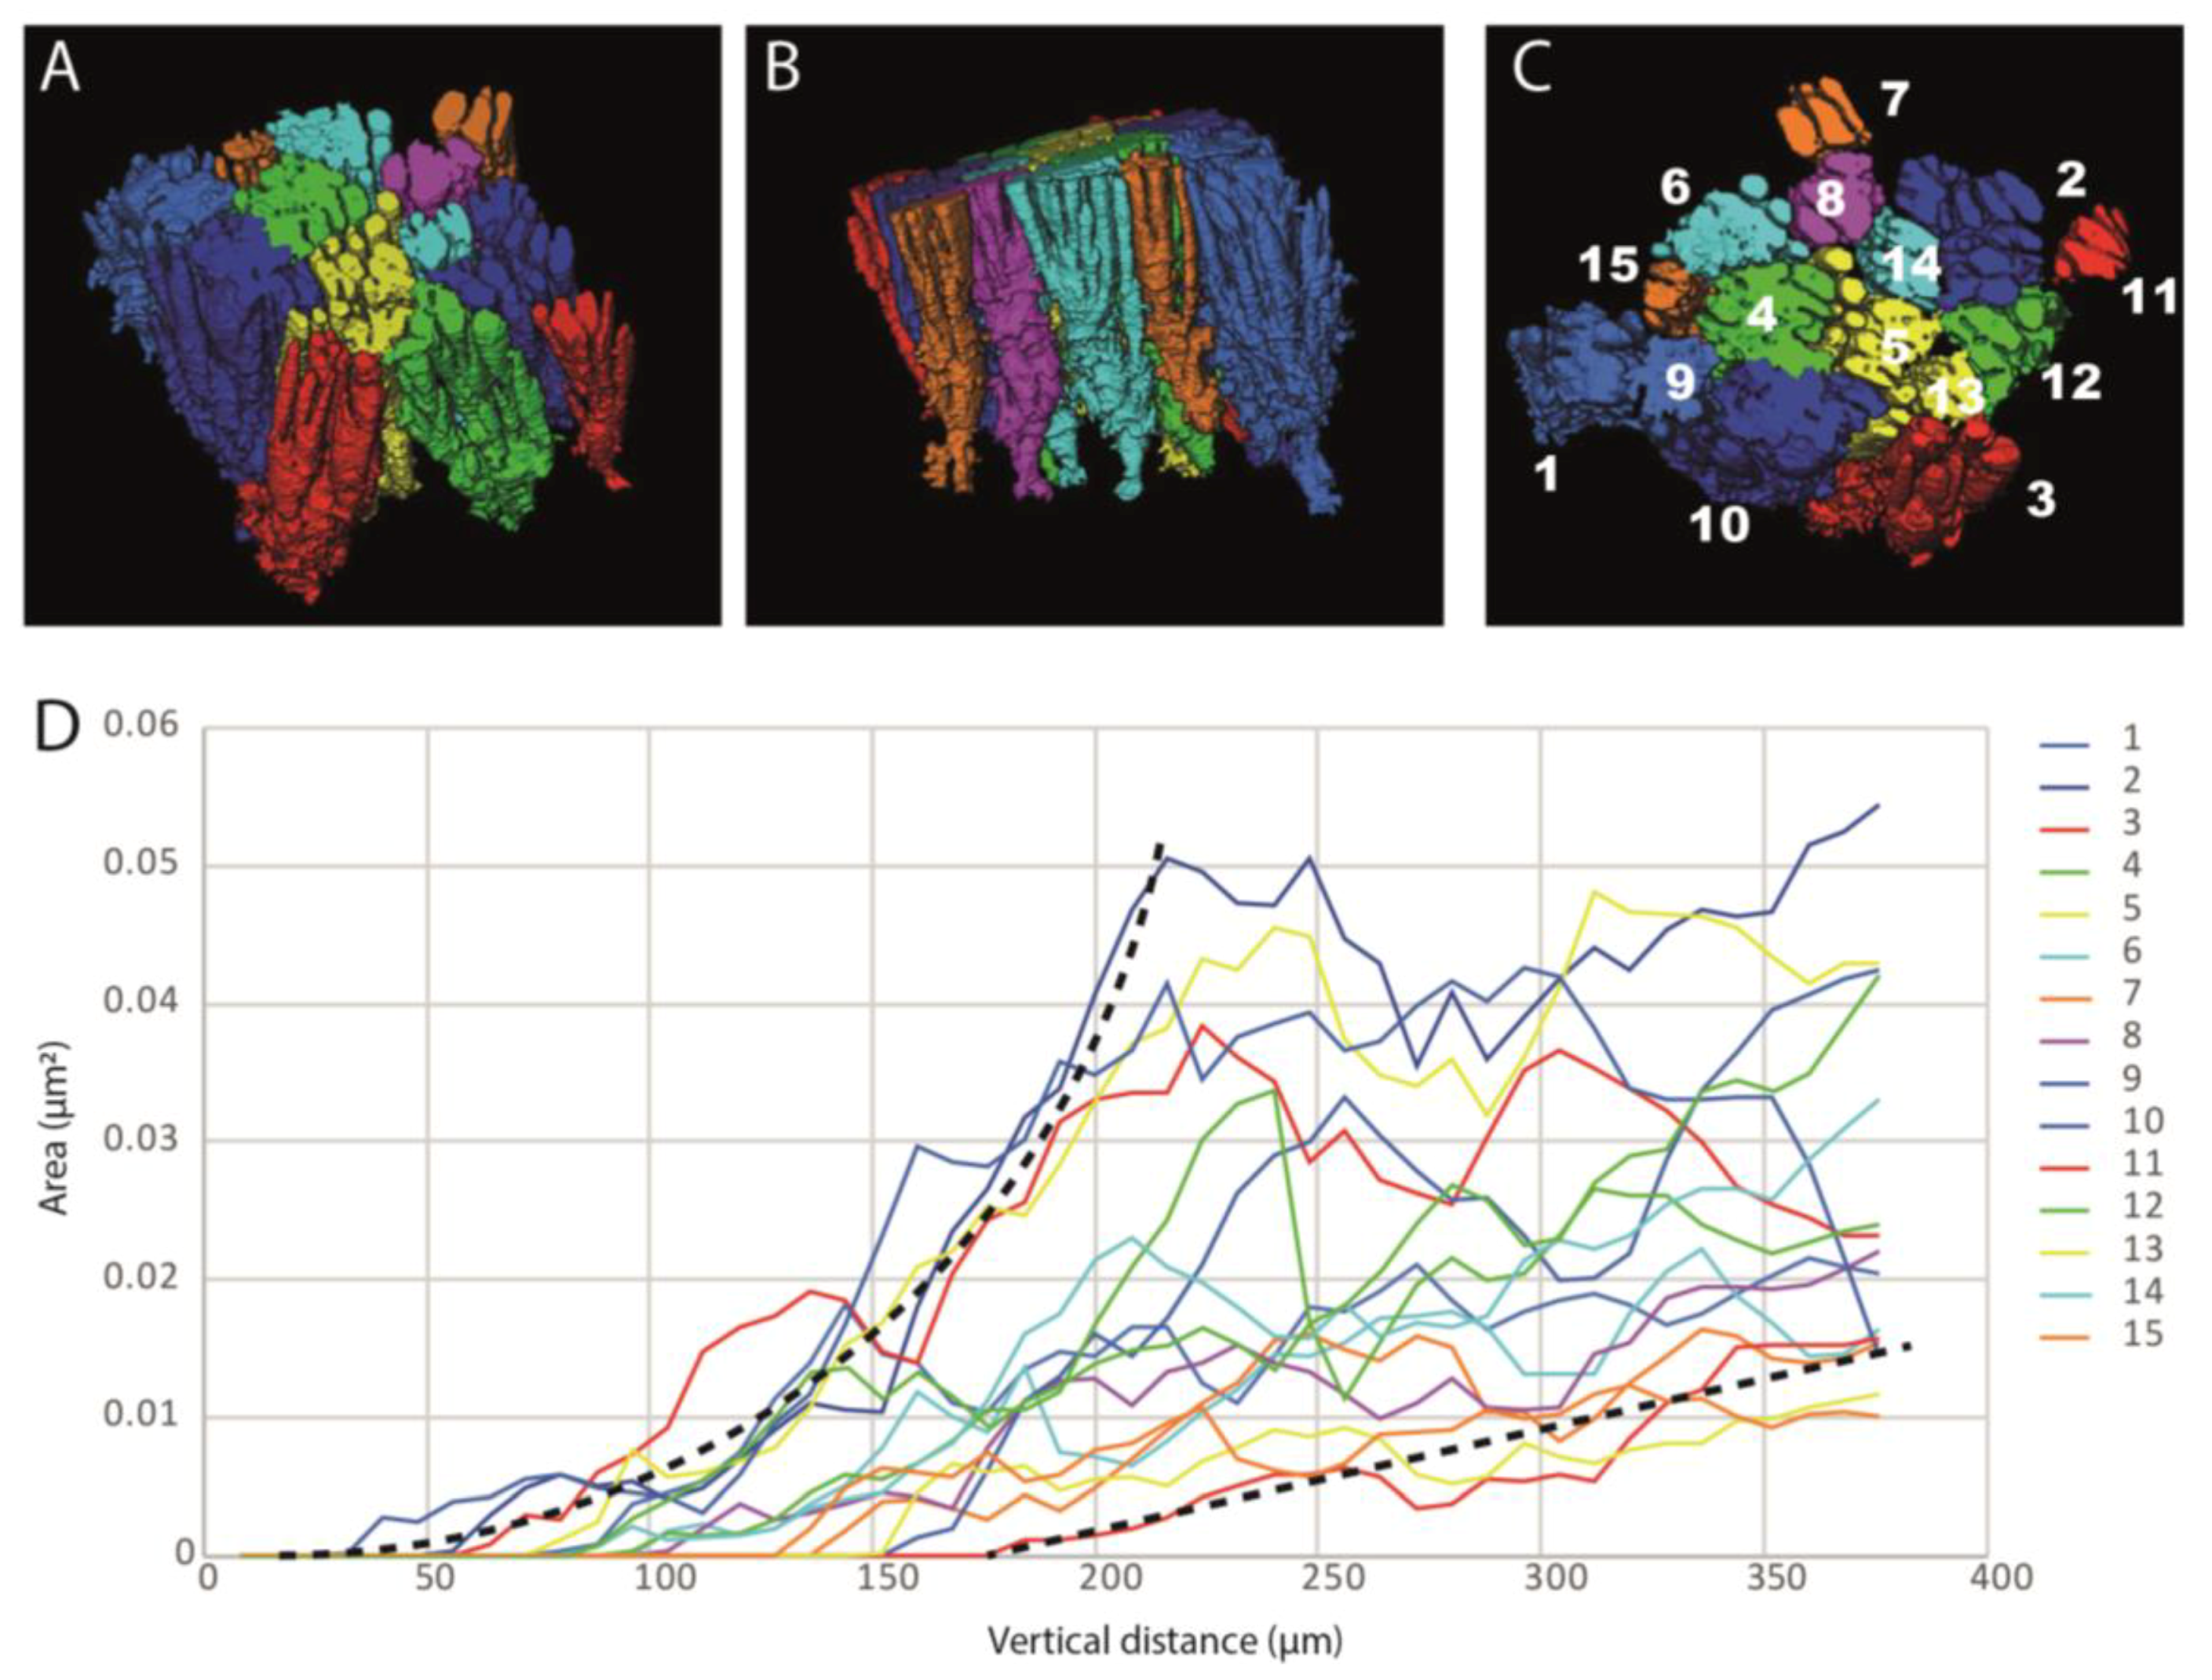
The pillared sections themselves are notable as in a two-dimensional (2D) view they appear to be fairly uniform single columns, initiating from a single point and growing perpendicular to the growth surface while spreading out laterally (e.g., Figure 4, core B). However, when examined in 3D, the pillars actually have a very complex branching form that is not visible in a single cross section (Figure 7). A single initiation point may branch into tens of separate pillar structures, which may grow up next to one another or may be separated by small amounts of detrital material. Fifteen individual pillar structures were mapped in the XRCT data from 83-21 B (Figure 7). The 3D model was sliced at 8 µm intervals, and the cross-sectional area covered by each pillar structure measured. All columns appear to initiate from a single nucleation point, but the subsequent growth rates are variable, ranging from 2–5% of the total area per 8 µm of vertical distance. This growth is not smooth, and the jumps in the total areas in Figure 7 are attributed to the initiation or termination of one or more columns. Although some of the columns (e.g., Figure 7, pillars 6 and 15) appear to continue growing for the entire measured section, others (e.g., 
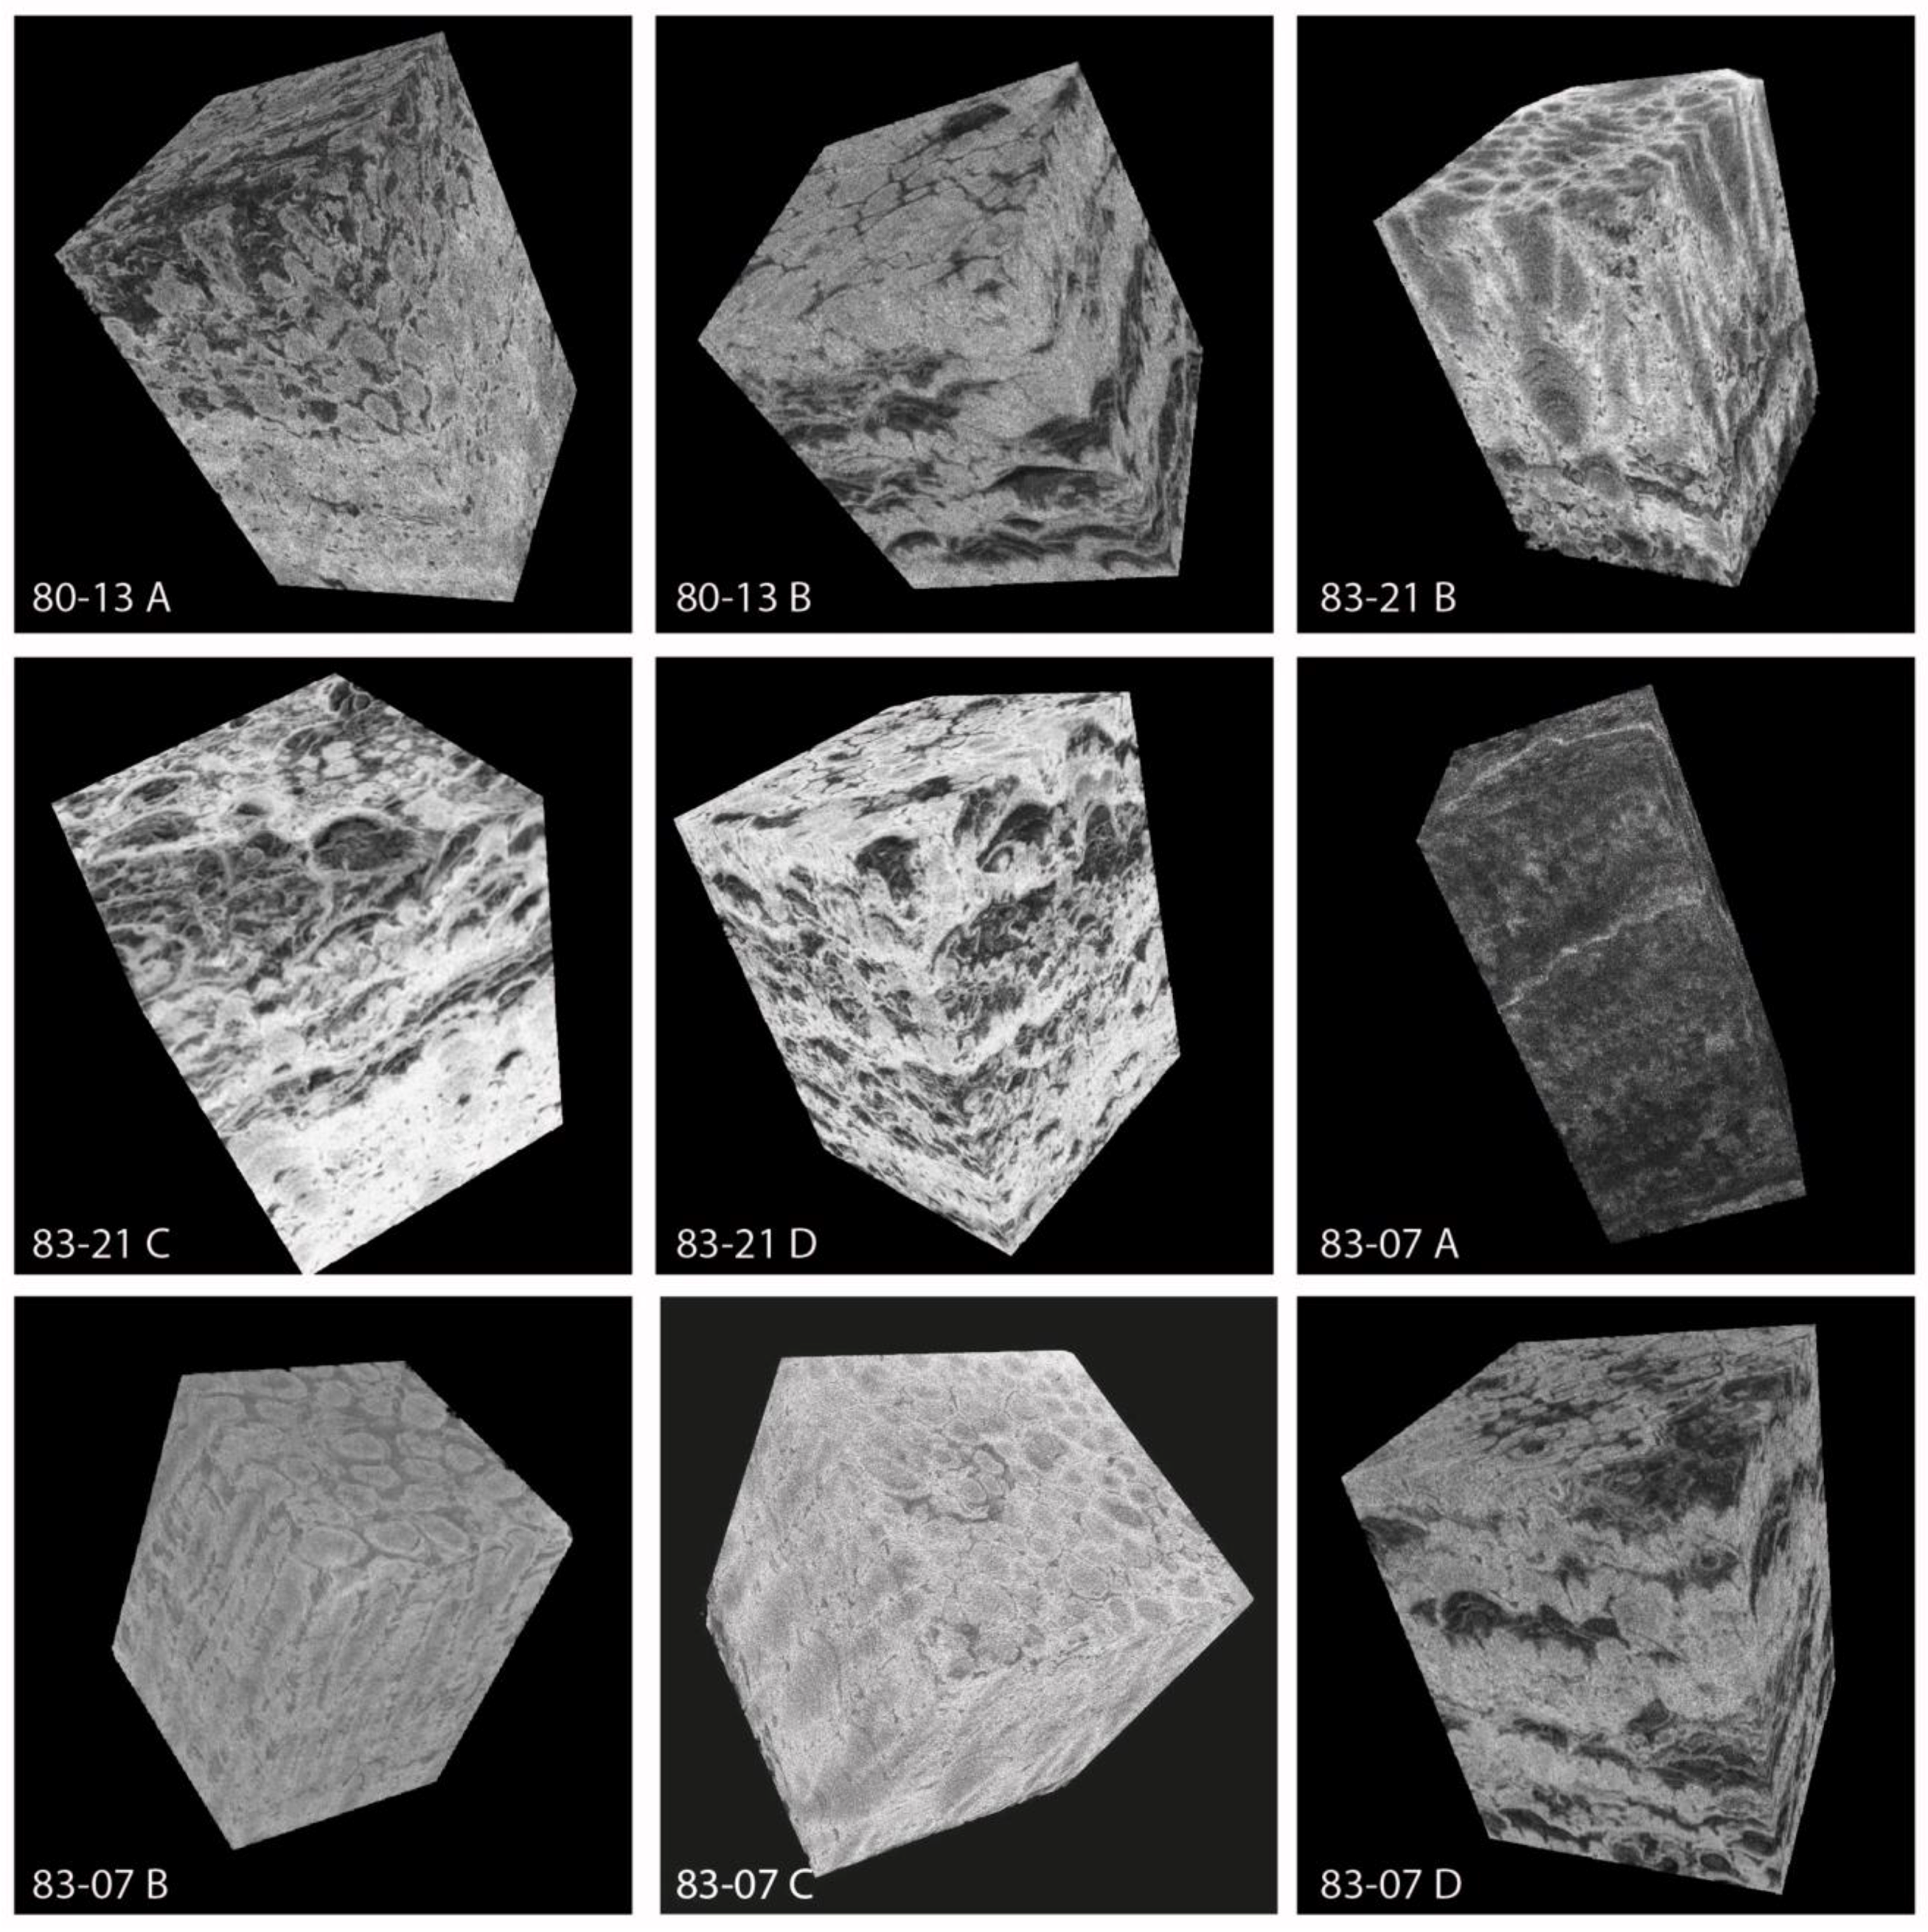
Figure 7, pillars 2, and 5) seem to reach a maximum area after about 150–250 µm of growth. The fastest developing columns seems to level off first. This may be related to space limitations, with pillars continuing to branch and expand laterally only when open space permits. The pillar structures themselves are extremely tightly packed and grow immediately next to one another. This is similar to the textures observed by SEM in both 83-21 B and 83-21 C, as well as in block diagrams from other pillared areas (Figure 3). It is significant that all the pillars in this model appear to begin branching outwards at a similar time, within about 0.1 mm of one another vertically, and after about 0.2 mm of growth. The reason for the consistent timing of the branching is unclear and could be due to changes in the environment; however, after this point, the pillar structures themselves become better defined, suggesting that this time may represent a period of optimum conditions for FeMn crust growth. There is significant variability in the number of branches developed in the pillars. Pillars with fewer branches appear to have a linear relationship between height and cross sectional area, whereas those with numerous branches (usually those with larger areas, typically that initiate earliest) appear to follow a more exponential relationship (Figure 7).
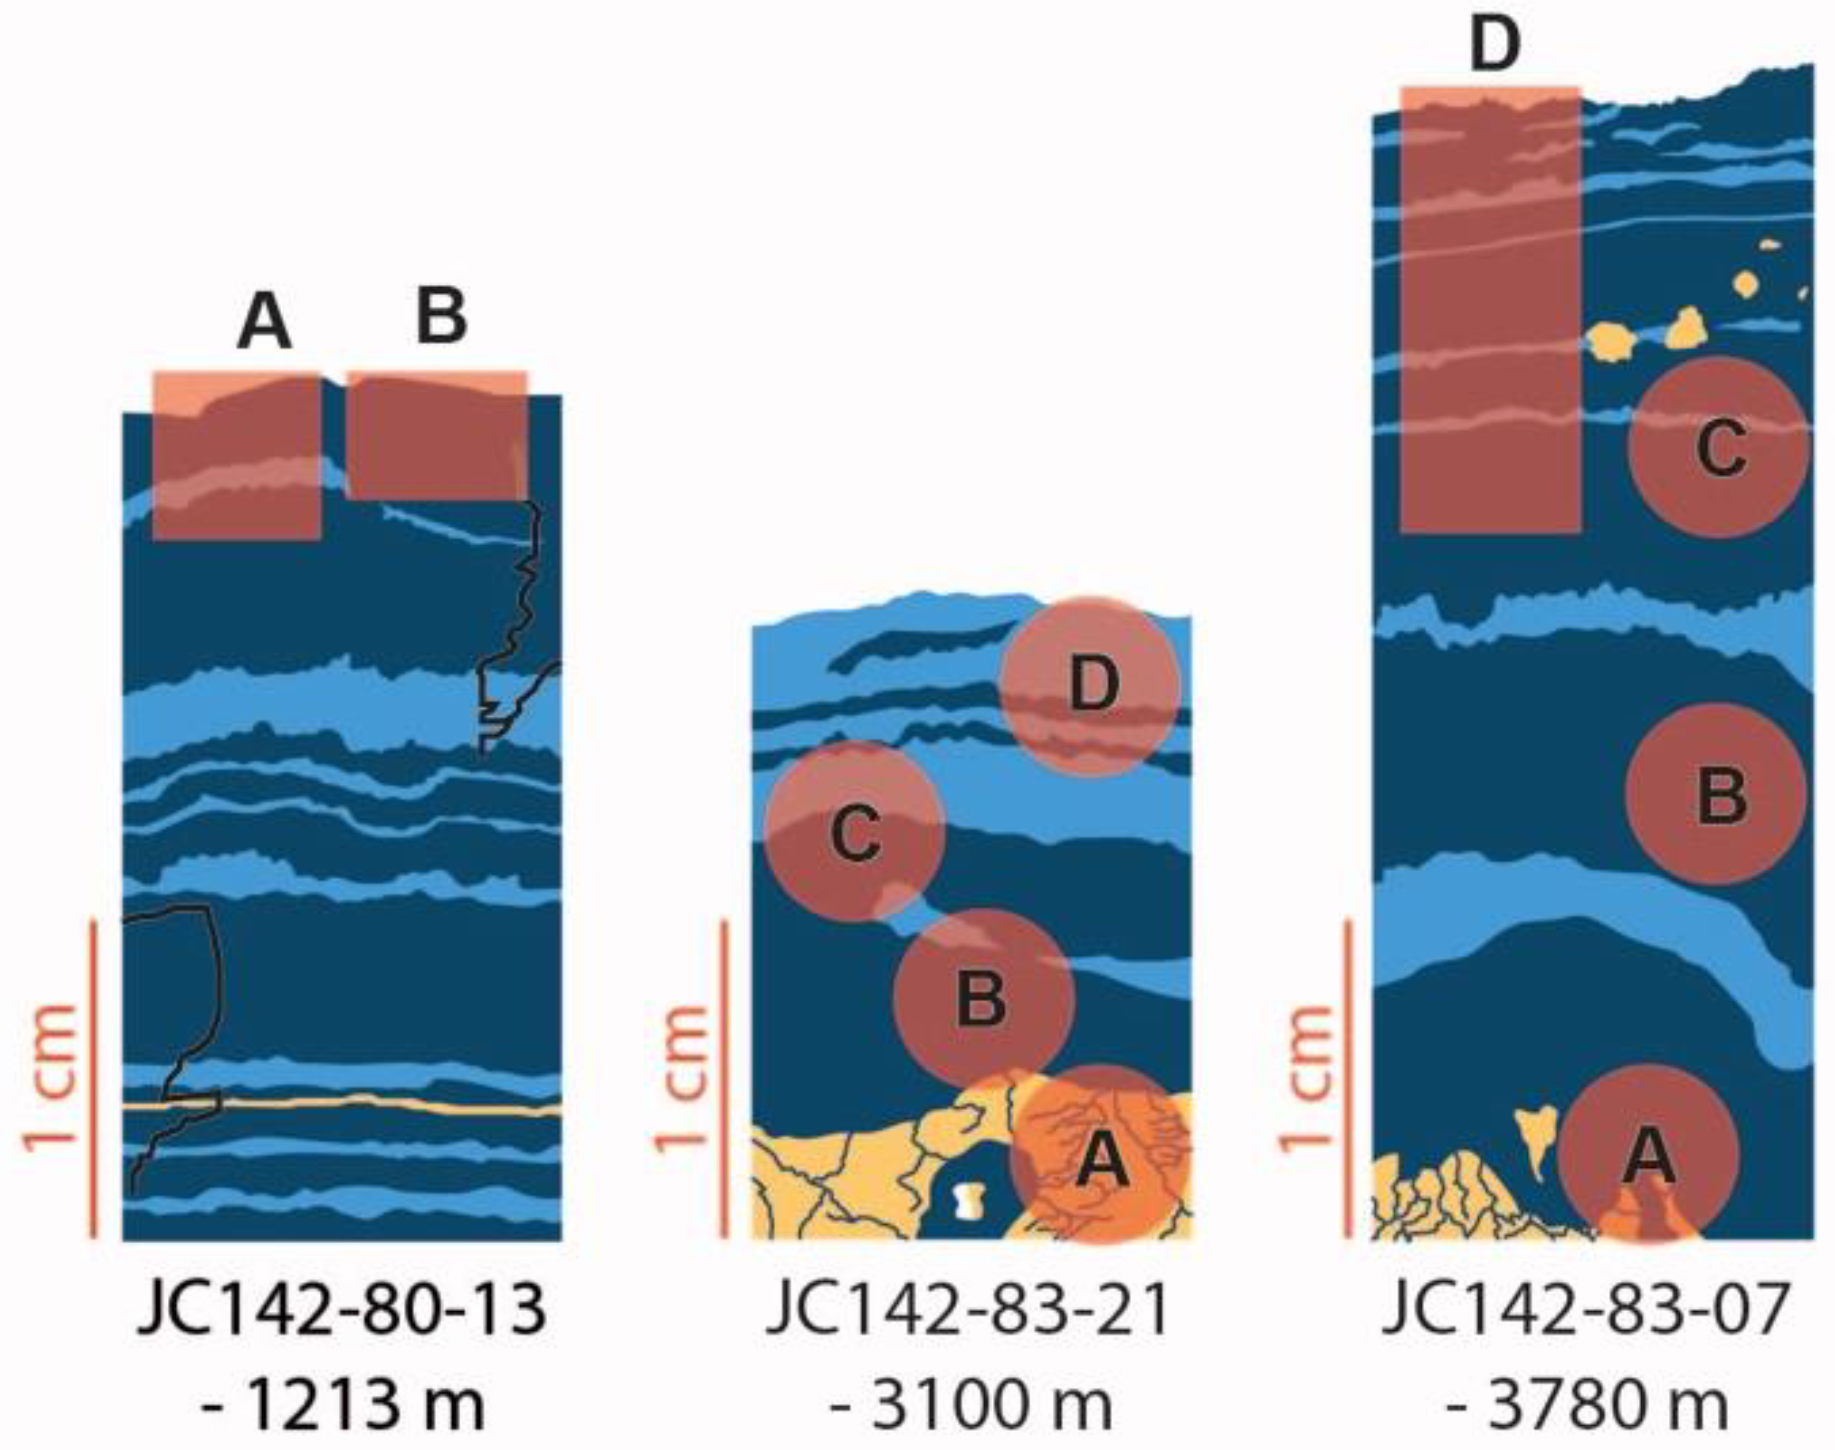
In addition to examining the interiors of the samples, the surfaces of samples 83-07 and 80-13 (the deepest and shallowest samples, respectively) were also analyzed in cores 83-07 D and 80-13 A and B (Figure 2). The surfaces of these samples vary in appearance (Figure 8). Sample 83-07 (the deepest) has an extremely botryoidal surface, typically around 0.2 mm in diameter. These are clearly connected to pillar growth structures below them and appear to represent the most recent growth surface. In contrast, the surface of sample 80-13 (shallowest) varies from smooth to mottled and cuts across pillar structures irregularly, suggesting that it represents an erosional surface. This may be significant, as it suggests that crusts on this flank, at the base of the seamount are forming, or at least not being eroded, whilst at the top they are being eroded either by particles suspended in the water or by mobile sediment packages on the summit. Larger-scale botryoidal textures seem to be a function of the surface on which the crusts are growing.

4.2. Textural Variation, Detrital Input, and Deposit Grade

The metal concentrations in the bulk FeMn crusts have a direct relationship with the textural variations observed. The densest FeMn crusts with the lowest percentage of detrital or bioclast material have the highest concentrations of Fe, Mn, and Co. The highest bulk Co contents measured were in excess of 1.5 wt% and all from pillared crusts. The lowest Co concentration were about 0.5 wt% and found in cuspate-textured areas. The average Co concentration in the areas of massive, columnar growth is 1.1 wt%, while in the chaotic cuspate areas it is 0.6 wt%. Fe concentrations are 28.2 wt% and 22.5 wt%, respectively. Mn concentrations in the columnar and cuspate-textured areas are 22.9 wt% and 15.3 wt%, respectively. As a percentage, Fe is around 20% lower in cuspate areas, Mn is 33% lower, and Co is 45% lower. The variation in Fe concentration between the different textures is smaller than that of Mn and Co as some of the detrital material is Fe-rich. The variation in Co concentration between the different textures is significant as its abundance will influence the economic viability of a deep-sea mining operation.
In areas of uniform, detritus-free FeMn oxides, this variation in metal Co content is almost absent, with typical Fe concentrations of 25–35%, Mn concentrations of 30–40%, and Co at about 1% regardless of the overall texture (Figure 6). This suggests the compositional difference observed between the two textures is primarily a function of dilution. Although this agrees with Marino et al. [19], who suggest that cuspate textures grow faster and are depleted in Mn and Co relative to the pillared sections, we propose that the oxide layers probably grow at similar rates, but the foraminifera accumulate quickly relative to a similar thickness of FeMn, increasing the overall crust thickness but not the thickness of the oxides themselves. Smaller variations in the Fe/Mn ratio in areas of relatively low Ca areas are commonly observed as a result of environmental variations in water chemistry, dust input, and bottom currents [30].
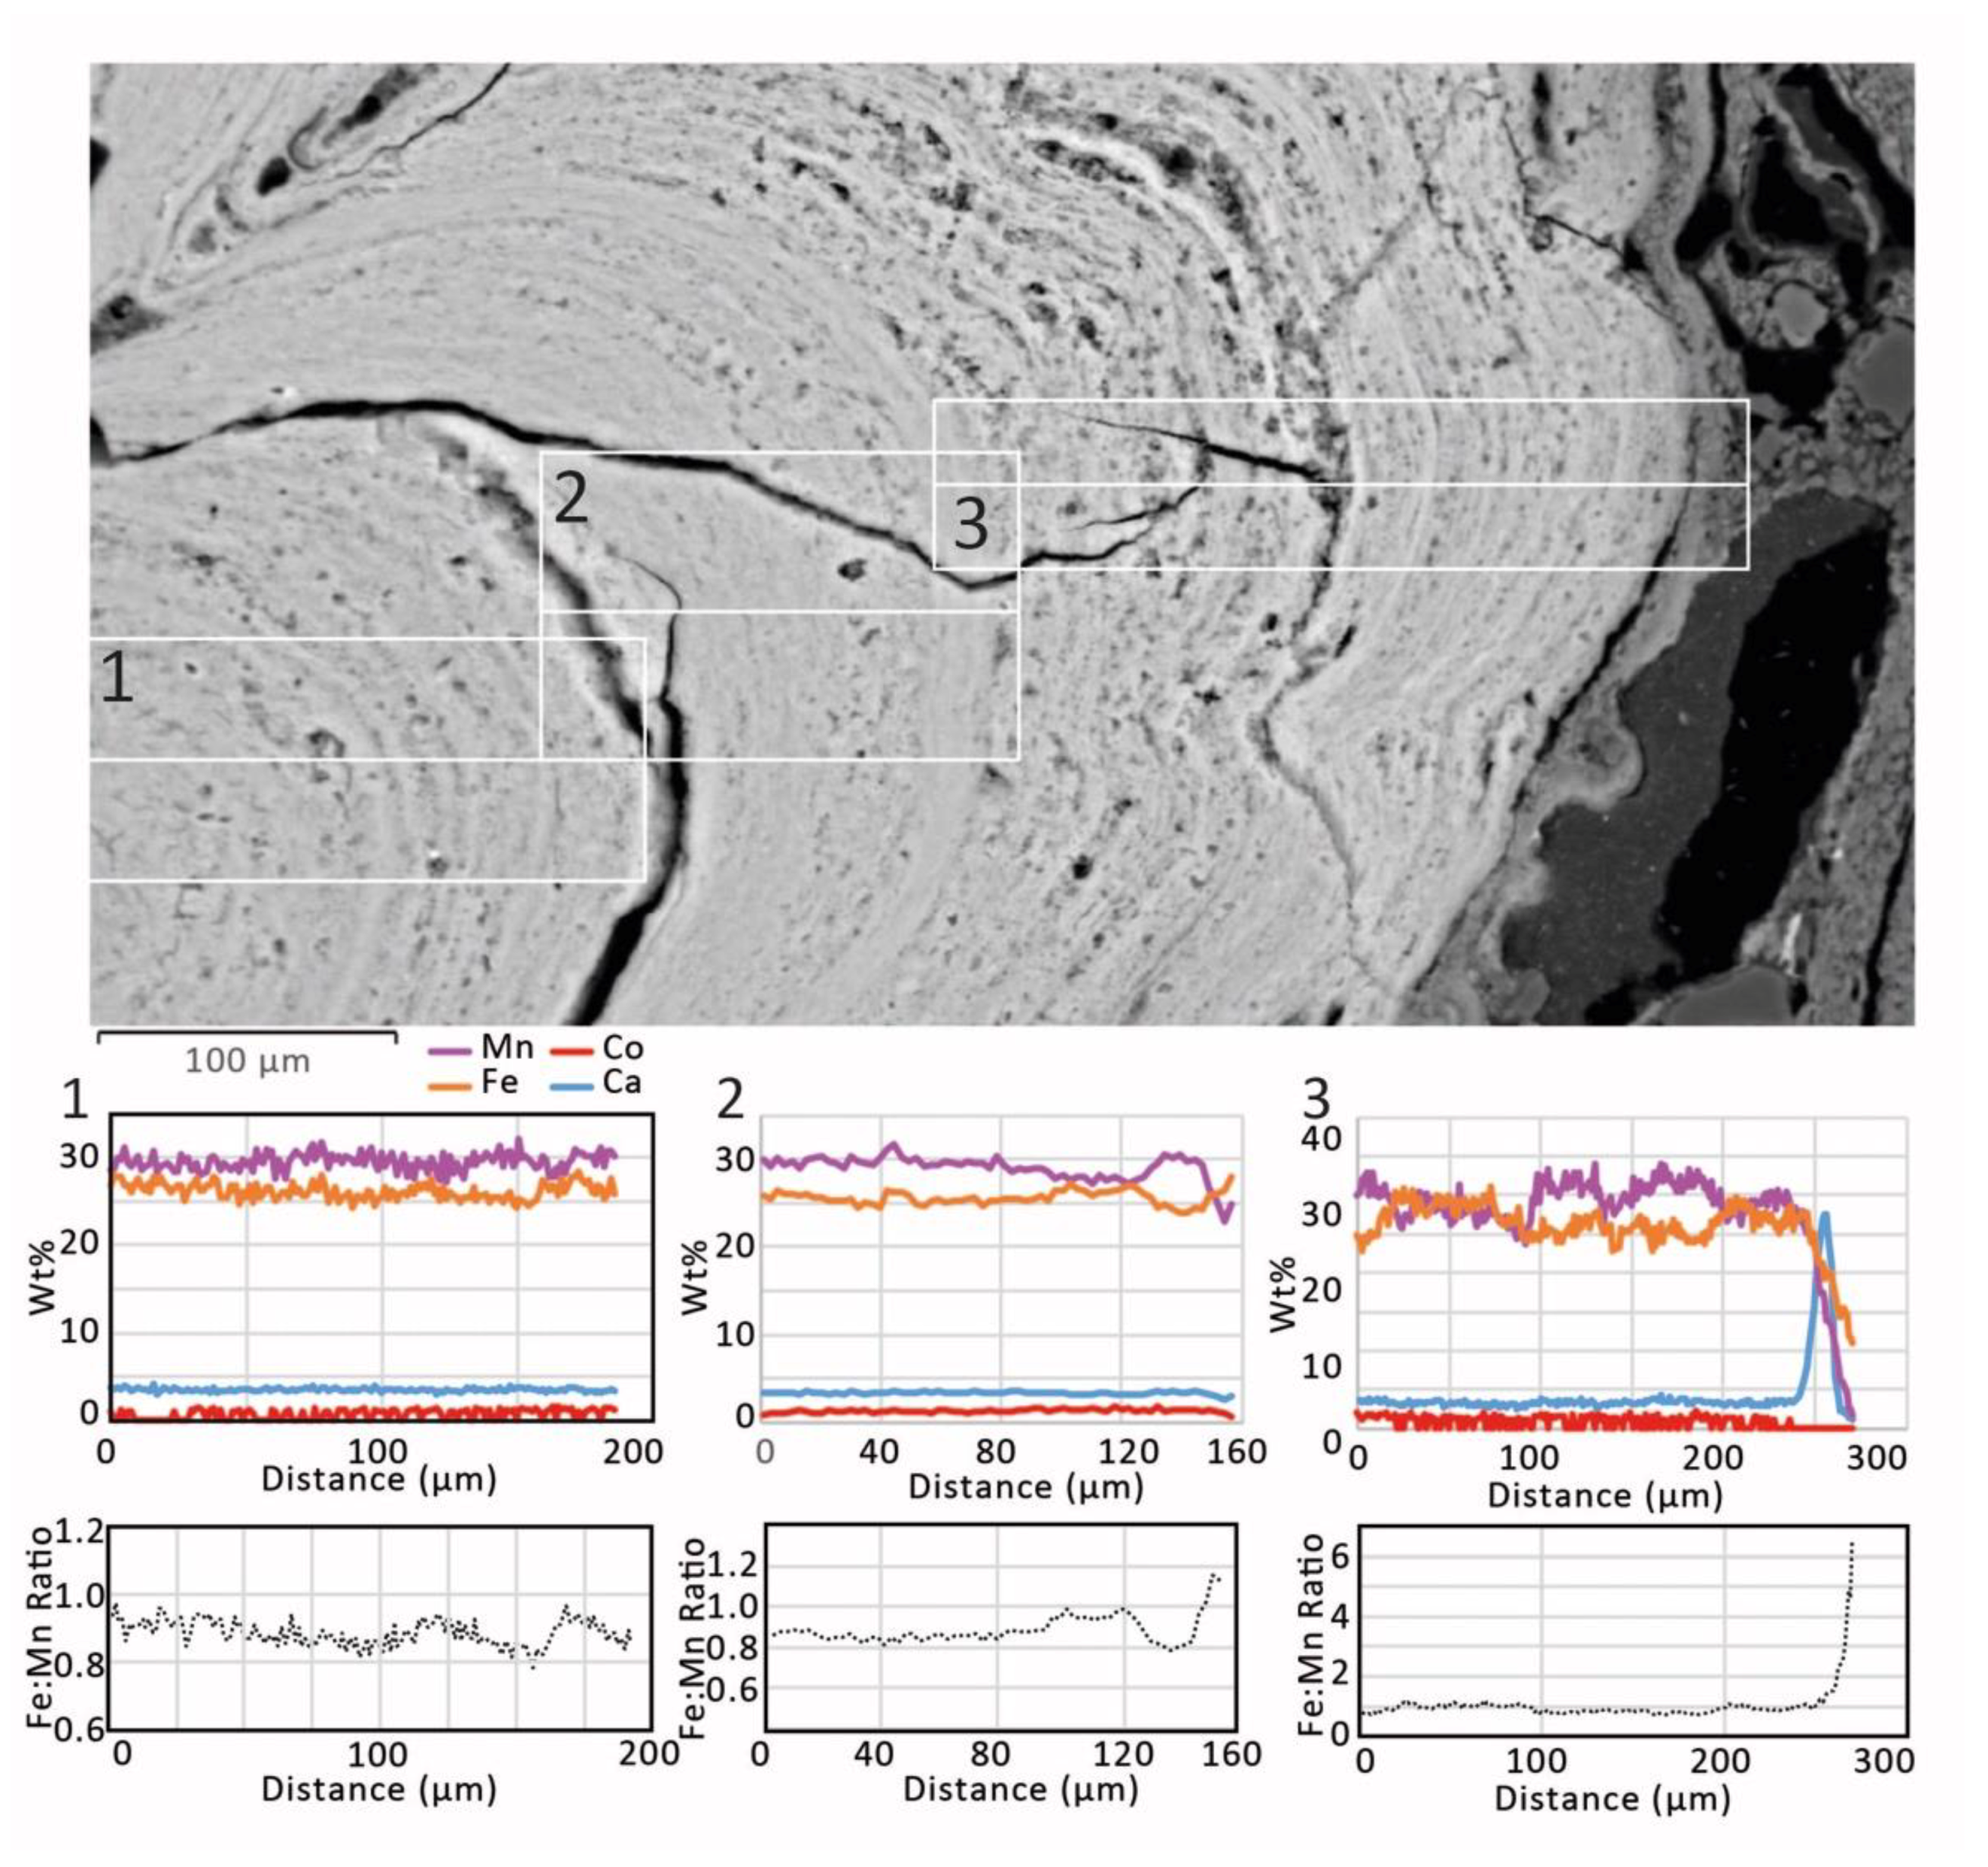
Fine-scale variations in metal composition also exist. Variations in Co concentration of about ±0.5 wt% are common, although this is also close to the error of the measurement (±0.3–0.4 wt%). However, larger variations correlate fairly closely with Mn abundance, suggesting that they are real changes. Mn and Fe vary inversely by about ±5 wt%. Within a single column, a very loose textural relationship may exist between the individual growth layers and the metal concentrations, with slightly elevated Co and Mn concentrations in layers that appear less mottled and denser (Figure 9).
No relationship in Co concentration other than its association with Mn is observed. However, Co concentration is generally close to or below the detection limit, which makes establishing trends difficult. We assume that, on the time and spatial scales we are examining, the supply of Co to the ocean is near constant, and therefore, any significant changes in Co concentration are the result of changes in the growth rate or local-scale controls on Co availability or uptake [15,20,25]. This is rare but clearly illustrated in one of the scans conducted (Figure 5, 83-21 core B 3000 µm), where a single pillar is high in Mn and Co in its initial growth phase, but after about 300 µm, the growth metal concentration decreases, possibly reflecting an increase in growth rate or a decline in the availability of Co, which corresponds with a more mottled texture in the upper section of the pillar. However, in most examples, the Co concentration remains fairly consistent throughout, indicating steady growth of the crusts.
Using the XRCT data, it is possible to accurately estimate the percentage of each sample that is FeMn oxide versus other material (Table 1). On average, the cores analyzed were around 80−85% FeMn oxides, increasing up to 93% in the pillared areas and declining to as low as 57% in the cuspate regions. Because the metals of greatest interest from an economic perspective are contained entirely within the FeMn sections, this textural difference corresponds to as much as a 36% variance in deposit grade. The proportions of cuspate versus pillared material varied widely between the samples analyzed, indicating that understanding the textural variation across a potential resource area is essential for determining its economic potential.

4.3. Theoretical Mine-Site Evaluation

Tropic Seamount has many of the characteristics of a potential FeMn mine site as described by Hein et al. [16]. It has a large, fairly flat summit (maximum relief across the summit is <40 m) at a water depth of <1100 m, a feasible water depth for exploration. At 105 km2 the summit is smaller than Hein et al. [16] suggest would be ideal to sustain a 15–20-year-long mining operation. However, the crusts on Tropic Seamount are predominantly sediment free or covered by pelagic sediments of less than a few meters, which make mining of the majority of the summit possible. The crusts on Tropic Seamount have an average thickness of 3.1 cm (range 0–16 cm). This is slightly below the 4 cm cut off proposed by Hein et al. [16] but above the 3 cm lower limit, although extracting thinner crusts is likely to be more technologically challenging than thicker deposits. The sampling itself is biased by what the ROV was able to collect, and when in situ samples were drilled, thicker crusts were generally observed, suggesting the true average thickness could be slightly higher than the measured samples suggest.
When undertaking a resource assessment, the efficiency of the potential mining operation is an important consideration. The estimates for seafloor mining efficiency vary from 30–80% [31,32,33] and are closely related to seafloor roughness and crust thickness [16]. Areas of thick sediment (measured from the multibeam backscatter) cover about 20% of the summit, meaning that up to 80% of the area is potentially mineable. At least 44% of the summit (46.2 km2) consists of terrain with a sharp-edged, brightly backscattered response (Figure 1) that when groundtruthed was FeMn crust. Hein et al. [16] estimate an area loss due to impediments to mining of 50%, thus reducing the mineable area to somewhere between 42 km2 and 23 km2.
Using a wet bulk density for crusts of 1.95 g/cm3, this equates to a total crust tonnage of 60.45 kg/m2 or 48.36 kg/m2 at 80% mining efficiency (Hein et al. [16] estimate mining efficiencies of 30–80%). In the case of Tropic Seamount, this means the summit hosts a total mineable tonnage of between 2.5 million tons (2.0 million tons at 80% efficiency, 0.75 million tons at 30%) and 1.4 million tons (1.1 million tons at 80% efficiency, 0.42 million tons at 30%). With a predicted optimum production rate of 1 million tons per year [16], the entire mineable summit could be exploited in under three years.
Therefore, with a total wet tonnage of 1.1–2.0 million tons (80% efficiency) to 0.75 to 0.42 million tons (30 % efficiency), a mixed texture sample containing 85% FeMn oxide material with an average Co concentration of around 0.89% would contain around 14.8 kg of Co per m3, yielding 8.3–15.2 thousand tons of Co (3.1–5.7 kt at 30% efficiency). If the FeMn oxides formed 93% by volume (the highest measured) of the material, this increases to 9.1–16.6 thousand tons of Co (3.4 – 6.2 kt at 30% efficiency). However, if the FeMn oxides formed only 57% (the lowest we measured) of the material, this declines to 5.6–10.2 thousand tons of Co (2.1–3.8 kt at 30% efficiency), and Mn (and, to a lesser extent, Fe) is also affected. For Mn, a typical 85% FeMn oxide sample with a concentration of 35% would yield 580 kg per m3 and 327–595 thousand tons of Mn in total (123–223 kt at 30% efficiency), declining to 219–399 thousand tons (82–150 kt at 30% efficiency) at an FeMn oxide composition of 57% and increasing to 358–651 thousand tons (134–244 kt at 30% efficiency) of Mn at an FeMn oxide composition of 93%. Mn is commonly associated with Te, another economically important metal and is therefore also of importance when evaluating a resource area. It should be noted these estimates assume that the wet density of crust, detrital, and bioclast material is the same.
At a bulk composition of 0.6–1.6%, the FeMn crusts still contain Co well in excess of the concentration of existing land-based mines, which have grades in the range of 0.05–0.4 wt% [34]. However, while the Co grades of marine FeMn deposits are considerable, the size of cobalt reserves on individual seamounts are relatively small when compared with the estimated reserves of a number of countries (e.g., both the Democratic Republic of the Congo and Australia have estimated reserves of billions of tons [35]). Furthermore, the cost of exploiting marine resources is potentially higher than those on land and at the crust thicknesses of 3–4 cm, and the Co grades typical on Tropic Seamount, a single seamount resource, are unlikely to become economically viable for extraction based solely on cobalt alone, although this might change if it were possible to exploit multiple edifices close to one another. Extremely high concentrations of other metals, for example Te, which are not reported here, could enhance the economics of a project, as could technological advances that would permit lower-cost mining and/or the mining of steep, unstable flank areas, where crustal thicknesses are sometimes higher. The Co concentrations measured in these samples seem to be comparable, or slightly higher than, those elsewhere in the North Atlantic [36] and are therefore considered representative of other Atlantic seamounts. Exceptional crustal thicknesses and/or unusually high concentrations of other economically important metals are likely to be required to make a FeMn crust extraction economically viable under the constraints proposed by Hein et al. [16], particularly at lower mining efficiencies. The estimates above assume that only the exposed summit can be mined; however, if we include areas of the flanks with a slope <20° (that may be accessible with future mining technologies), it increases the potential mineable area by 299 km2 or 285%. If this area could also be exploited, then the potential resource is much larger and is more likely to represent an economically feasible mine site. Alternatively, if crusts could be detected and exploited beneath the sediment plains, this would also increase the potential resource. When Hein et al. [16] undertook their mine site feasibility study, Co prices were 40,000 USD/ton. In contrast the Co price has recently exceeded 90,000 USD/ton, with indications it may rise further as demand for the metal continues to grow. Thus, the likelihood of these deposits becoming economically feasible to exploit in the future is increasing. The cost of refinement for each metal is also an important factor. While the increased cost of extraction means it is unlikely the FeMn crusts will be a viable resource for Mn in the near future, the high-concentration of Cobalt in such FeMn crusts is likely to yield more Co for a given cost of refinement compared with land-based resources. Additionally, research currently going on into improving the efficiency of refinement methods (e.g., [37,38]) is likely to mean reduced refinement costs in the future.
The fastest growing crusts on Tropic Seamount are those with a cuspate texture. However, these crusts also have the lowest average bulk metal concentration. Therefore, in terms of resource assessment, it is worth considering that the most metal-rich resources may not necessarily be the thickest crust deposits. As the FeMn oxide compositions in both textural types are similar, then a thinner crust composed primarily of pillared texture FeMn oxides may represent a better metal resource, although a minimum thickness is required for it to be logistically feasible to exploit.

5. Conclusions

  • As observed in FeMn crusts elsewhere, the crusts at Tropic Seamount are characterized by two main textures: a denser, pillared variant and a less dense cuspate morphological type, containing a higher proportion of entrained detrital material and a large number of encrusting foraminifera.
  • In the pillared textures, FeMn oxides represent up to 93% of the volume, but this can decline to as low as 57% in cuspate-textured areas.
  • The pillared structures are complex and with multiple branches all appearing to grow simultaneously. Branching seems to occur at approximately the same position in all of the pillars studied, suggesting that such branching represents a response to a change in environmental conditions.
  • The Fe, Mn, and Co compositions of the oxide layers are similar to the crusts regardless of overall texture. Typically, the oxide fractions from Tropic Seamount are 25–35% Fe, 30–40% Mn, and about 1% Co. This means that the difference in bulk compositions observed is principally a dilution affect, resulting from the increased proportion of the entrained material and greater porosity. Accordingly, changes in texture can reduce the metal concentration of a deposit by more than 30%.
  • Preliminary estimates of the size of the mineral resource on Tropic Seamount suggest that it is unlikely to be economically viable to extract given the constraints of the Hein et al. [16] mine site model. The main limiting factor at Tropic Seamount is that the crusts on the mineable summit area appear fairly thin and have variable textures. Such deposits may become economically viable to extract if they are found to contain anomalous concentrations of other critical metals, if the exploitation of deep-sea mineral deposits becomes cheaper in the future, if they are proximal to other mineable resources, or if it were possible to increase the size of the minable area through accessing resources on slopes with <20° with new technologies.
  • Although crust thickness is generally considered to be of primary consideration in resource assessment, thinner deposits composed of more metal-rich pillared texture material could be more attractive mining targets than thicker zones dominated by cuspate material.

Supplementary Materials

The following are available online at https://www.mdpi.com/2075-163X/8/8/327/s1, Video S1: XRCT substrate, Table S1: house reference material, and Figure S1: SEM-EDS data of all samples.

Author Contributions

Conceptualization, I.A.Y. and B.J.M.; Methodology, K.D., I.A.Y., S.A.H., T.P.L.B., and R.B.P.; Formal Analysis, I.A.Y., K.D., R.B.P., B.J.M., P.J., and S.A.H.; Data Curation, T.P.L.B.; Original Draft Preparation, I.A.Y.; Review and Editing of Manuscript, K.D., R.B.P., B.J.M., S.A.H., P.A.J.L., and P.J.; and Funding Acquisition, B.J.M., P.A.J.L., and I.A.Y.

Funding

This research was funded by the Natural Environmental Research Council (NERC, grant number NE/MO11151/1). XRCT was funded by an International Union for Geosciences (IUSG) Resourcing Future Generations Grant.

Acknowledgments

P.J. and P.A.J.L. publish with the permission of the Executive Director, British Geological Survey (UKRI). The authors thank the two anonymous reviewers for their comments, which have greatly improved the manuscript.

Conflicts of Interest

The authors declare no conflict of interest.

References

  1. Hein, J.R.; Koschinsky, A.; Halliday, A.N. Global occurrence of tellurium-rich ferromanganese crusts and a model for the enrichment of tellurium. Geochim. Cosmochim. Acta 2003, 67, 1117–1127. [Google Scholar] [CrossRef]
  2. International Seabed Authority. Cobalt Crusts. International Seabed Authority Cobalt Crusts: Kingston, Jamaica, 2008. [Google Scholar]
  3. Hein, J.R.; Conrad, T.A.; Staudigel, H. Seamount Mineral Deposits: A source of rare metals for high-technology industries. Oceanography 2010, 23, 184–189. [Google Scholar] [CrossRef]
  4. Hein, J.R.; Mizell, K.; Koschinsky, A.; Conrad, T.A. Deep-ocean mineral deposits as a source of critical metals for high- and green-technology applications: Comparison with land-based resources. Ore Geol. Rev. 2013, 51, 1–14. [Google Scholar] [CrossRef]
  5. American Physical Society. Energy Critical Elements: Securing Materials for Emerging Technologies. Available online: https://www.aps.org/policy/reports/popa-reports/upload/elementsreport.pdf (accessed on 4 July 2018).
  6. Deloitte Sustainability; British Geological Survey; Bureau de Recherches Géologiques et Minières; Netherlands Organisation for Applied Scientific Research. Study on the Review of the List of Critical Raw Materials: Criticality Assessments; Publications Office of the European Union: Luxembourg, 2017. [CrossRef]
  7. Nansai, K.; Nakajima, K.; Kagawa, S.; Kondo, Y.; Suh, S.; Shigetomi, Y.; Oshita, Y. Global Flows of Critical Metals Necessary for Low-Carbon Technologies: The Case of Neodymium, Cobalt, and Platinum. Environ. Sci. Technol. 2014, 48, 1391–1400. [Google Scholar] [CrossRef] [PubMed]
  8. Nassar, N.T.; Graedel, T.E.; Harper, E.M. By-product metals are technologically essential but have problematic supply. Sci. Adv. 2015, 1, e1400180. [Google Scholar] [CrossRef] [PubMed]
  9. Manheim, F.T. Marine Cobalt Resources. Science 1986, 232, 600–608. [Google Scholar] [CrossRef] [PubMed]
  10. Hein, J.R.; Koschinsky, A.; Bau, M.; Manheim, F.T.; Kang, J.; Roberts, L. Cobalt-Rich Ferromanganese Crusts in the Pacific. In Handbook of Marine Mineral Deposits; Cronan, D.S., Ed.; CRC Press: Boca Raton, FL, USA, 1999; p. 407. [Google Scholar]
  11. Clark, A.; Johnson, C.; Chinn, P. Assessment of Cobalt-Rich Manganese Crusts in the Hawaiian, Johnston and Palmyra Islands’ Exclusive Economic Zones. Nat. Resour. Forum 1984, 8, 163–174. [Google Scholar] [CrossRef]
  12. Aplin, A.C. Rare earth element geochemistry of Central Pacific ferromanganese encrustations. Earth Planet. Sci. Lett. 1984, 71, 13–22. [Google Scholar] [CrossRef]
  13. Karstensen, J.; Stramma, L.; Visbeck, M. Oxygen minimum zones in the eastern tropical Atlantic and Pacific oceans. Prog. Oceanogr. 2008, 77, 331–350. [Google Scholar] [CrossRef] [Green Version]
  14. Koschinsky, A.; Halbach, P. Sequential leaching of marine ferromanganese precipitates: Genetic implications. Geochim. Cosmochim. Acta 1995, 59, 5113–5132. [Google Scholar] [CrossRef]
  15. Halbach, P.; Giovanoli, R.; von Borstel, D. Geochemical processes controlling the relationship between Co, Mn, and Fe in early diagenetic deep-sea nodules. Earth Planet. Sci. Lett. 1982, 60, 226–236. [Google Scholar] [CrossRef]
  16. Hein, J.R.; Conrad, T.A.; Dunham, R.E. Seamount characteristics and mine-site model applied to exploration- and mining-lease-block selection for cobalt-rich ferromanganese crusts. Mar. Geores. Geotechnol. 2009, 27, 160–176. [Google Scholar] [CrossRef]
  17. Banakar, V.K.; Hein, J.R. Growth response of a deep-water ferromanganese crust to evolution of the Neogene Indian Ocean. Mar. Geol. 2000, 162, 529–540. [Google Scholar] [CrossRef]
  18. Hein, J.R.; Bohrson, W.A.; Schulz, M.S.; Noble, M.; Clague, D.A. Variations in the Fine-Scale Composition of a Central Pacific Ferromanganese Crust: Paleoceanographic Implications. Paleoceanography 1992, 7, 63–77. [Google Scholar] [CrossRef]
  19. Marino, E.; González, F.J.; Somoza, L.; Lunar, R.; Ortega, L.; Vázquez, J.T.; Reyes, J.; Bellido, E. Strategic and rare elements in Cretaceous-Cenozoic cobalt-rich ferromanganese crusts from seamounts in the Canary Island Seamount Province (northeastern tropical Atlantic). Ore Geol. Rev. 2017, 87, 41–61. [Google Scholar] [CrossRef]
  20. Puteanus, D.; Halbach, P. Correlation of Co concentration and growth rate-A method for age determination of ferromanganese crusts. Chem. Geol. 1988, 69, 73–85. [Google Scholar] [CrossRef]
  21. Du, D.; Ren, X.; Yan, S.; Shi, X.; Liu, Y.; He, G. An integrated method for the quantitative evaluation of mineral resources of cobalt-rich crusts on seamounts. Ore Geol. Rev. 2017, 84, 174–184. [Google Scholar] [CrossRef]
  22. Van den Bogaard, P. The origin of the Canary Island Seamount Province-New ages of old seamounts. Sci. Rep. 2013, 3, 1–7. [Google Scholar] [CrossRef] [PubMed] [Green Version]
  23. Koschinsky, A.; van Gerven, M.; Halbach, P. First investigations of massive ferromanganese crusts in the N.E. Atlantic in comparison to hydrogenetic Pacific occurrences. Mar. Geores. Geotechnol. 1995, 13, 375–391. [Google Scholar] [CrossRef]
  24. Koschinsky, A.; Halbach, P.; Hein, J.R.; Mangini, A. Ferromanganese crusts as indicators for paleoceanographic events in the NE Atlantic. Geol. Rundsch. 1996, 85, 567–576. [Google Scholar] [CrossRef]
  25. Manheim, F.T.; Lane-Boswick, C.M. Cobalt in ferromanganese crusts as a monitor of hydrothermal discharge on the Pacific Ocean floor. Nature 1988, 335, 59–62. [Google Scholar] [CrossRef]
  26. Marino, E.; Javier Gonzales, F.; Lunar, R.; Reyes, J.; Medialdea, T.; Castillo-Carrion, M.; Bellido, E.; Somoza, L. High-Resolution Analysis of Critical Minerals and Elements in Fe–Mn Crusts from the Canary Island Seamount Province (Atlantic Ocean). Minerals 2018, 8, 285. [Google Scholar] [CrossRef]
  27. Becker, J.J.; Sandwell, D.T.; Smith, W.H.F.; Braud, J.; Binder, B.; Depner, J.; Fabre, D.; Factor, J.; Ingalls, S.; Kim, S.-H.; et al. Global Bathymetry and Elevation Data at 30 Arc Seconds Resolution: SRTM30_PLUS. Mar. Geod. 2009, 32, 355–371. [Google Scholar] [CrossRef]
  28. QGIS Development Team. QGIS Geographic Information System. Open Source Geospatial Foundation Project. 2018. Available online: https://www.qgis.org/en/site/ (accessed on 4 July 2018).
  29. Takahashi, Y.; Manceau, A.; Geoffroy, N.; Marcus, M.A.; Usui, A. Chemical and structural control of the partitioning of Co, Ce, and Pb in marine ferromanganese oxides. Geochim. Cosmochim. Acta 2007, 71, 984–1008. [Google Scholar] [CrossRef]
  30. Takematsu, N.T.; Sato, Y.; Okabe, S. Factors Controlling the Chemical Composition of Marine Manganese Nodules and Crusts: a Review and Synthesis. Mar. Chem. 1989, 26, 41–56. [Google Scholar] [CrossRef]
  31. Hein, J.R. Prospecting and exploration for cobalt-rich ferromanganese crusts deposits in the Area. In Proceedings of the International Seabed Authority’s Workshop on Mining Cobalt-Rich Ferromanganese Crusts and Polymetallic Sulphides Deposits: Technological and Economic Considerations, Kingston, Jamaica, 31 July–4 August 2006; pp. 102–124. [Google Scholar]
  32. Morgan, C. Mining development scenario summary (cobalt-rich ferromanganese crusts deposits). In Proceedings of the International Seabed Authority’s Workshop on Mining Cobalt-Rich Ferromanganese Crusts and Polymetallic Sulphides Deposits: Technological and Economic Considerations, Kingston, Jamaica, 31 July–4 August 2006; pp. 131–207. [Google Scholar]
  33. Yang, S. A Suggested Consideration to the Draft Regulation on Prospecting and Exploration for Cobalt-rich Ferromaganese Crusts (The size, Block and number for Exloration). In Proceedings of the International Seabed Authority’s Workshop on Mining Cobalt-Rich Ferromanganese Crusts and Polymetallic Sulphides Deposits: Technological and Economic Considerations, Kingston, Jamaica, 31 July–4 August 2006; pp. 125–130. [Google Scholar]
  34. British Geological Survey. Cobalt. 2009. Available online: https://www.bgs.ac.uk/downloads/start.cfm?id=1400 (accessed on 4 July 2018).
  35. United States Geological Survey. Mineral Commodity Summaries-Cobalt. 2017. Available online: https://minerals.usgs.gov/minerals/pubs/commodity/cobalt/mcs-2017-cobal.pdf (accessed on 4 July 2018).
  36. Muiños, S.B.; Hein, J.R.; Frank, M.; Monteiro, J.H.; Gaspar, L.; Conrad, T.; Pereira, H.G.; Abrantes, F. Deep-sea Fe-Mn Crusts from the Northeast Atlantic Ocean: Composition and Resource Considerations. Mar. Geores. Geotechnol. 2013, 31, 40–70. [Google Scholar] [CrossRef]
  37. Ohara, H.; Asano, S.; Tan, T.; Takano, M. Aqueous Cobalt Chloride Solution Refinement Method. U.S. Patent US20180134577 A1, 17 May 2018. [Google Scholar]
  38. Estrada, S.O.; Huerta-Aguilar, C.A.; Pandiyan, T.; Corea, M.; Reyes-Domínguez, I.A.; Tavizon, G. Tuning of the magnetic response in cobalt ferrite CoxFe3-xO4 by varying the Fe2+ to Co2+ molar ratios: Rietveld refinement and DFT structural analysis. J. Alloys Compd. 2017, 695, 2706–2716. [Google Scholar] [CrossRef]
Figure 1. (A) Regional setting. Bathymetry data is taken from GEBCO [27]. The black square shows the location of panel B; (B) EM120 data collected off Tropic Seamount, gridded at 50 m, overlaid on the GEBCO background. The three sample locations are shown with red dots; (C) autonomous underwater vehicle (AUV) side-scan sonar data collected by the AutoSUB6000. Pixel size is 2 m, bright colors represent areas of high backscatter; (D) Simplified geological map of the summit from side-scan sonar, bathymetry, and remotely operated vehicle (ROV) groundtruthing. The numbers represent crustal thicknesses measured on samples collected during the ROV dives in mm. na is given where there was no FeMn material on the sample. The FeMn crustal outcrop is mapped in maroon. Nodules were generally sparse in the areas where they were found and are not included in the calculations. The map was produced using QGIS 3 [28].
Minerals 08 00327 g001
Figure 2. Simplified schematic diagrams of the hand specimens from which the samples were taken, showing the textural variations visible and the locations of the X-ray computed tomography (XRCT) cores drilled in each sample. The dark blue represents dense, pillared areas in the hand specimens, while the lighter blue represents more chaotic, cuspate texture, as visible in the hand specimens. The yellow areas are carbonate basement.
Minerals 08 00327 g002
Figure 3. Block diagrams from all the samples analyzed, excluding 83-21 A, which was purely drilled into carbonate basement. The block diagrams are all between 3 and 4 mm across and show good examples of pillar (83-07 B, 83-07 C, 83-21 B) and cuspate (80-13 B, 83-21 D, 83-07 D) texture, as well as some samples with mixtures of both textures. The greyscale is individual to each sample and was set to maximize visible contrast in the samples themselves.
Minerals 08 00327 g003
Figure 4. Cross sections through all cores 83-21 B, C, and D made using the SEM. All cores are 4 mm across. The black squares on 83-21 C and 83-21 D show the areas used to measure bulk composition using SEM energy dispersive X-ray spectroscopy (SEM-EDS). Again, good examples of pillared and cuspate textures are visible, as well as erosional (83-21 B 3000 µm) and gradational (83-21 C 6800 µm) contacts between them. The block diagrams show their position relative to the sample and each other.
Minerals 08 00327 g004
Figure 5. Example SEM-EDS analyses of some characteristic textures and features showing the distribution of Mn, Fe, and Co within them. Brighter colors equal higher concentrations. Mn and Co are found only within the FeMn crusts, while Fe can also be found in some of the detrital material.
Minerals 08 00327 g005
Figure 6. Compositional variations in Mn, Fe, and Co (and Ca) along transects measured with SEM-EDS. The white boxes indicate the area analyzed. The black dashed lines are Fe/Mn ratios and correspond to the scale on the right-hand side of the graphs. Fe and Mn can be seen to vary inversely with each other, while Mn and Co are only found in areas of the FeMn crust. Importantly, the Fe, Mn, and Co concentrations do not vary much between the crusts found in the different textures. In the lowermost scan through the cuspate textures, the Ca spikes correlate inversely with the presence of Mn and Co.
Minerals 08 00327 g006
Figure 7. Maps showing the structure of 16 individual pillar growths in sample 83-21 B from three different views. The vertical scale is 0.4 mm. The pillars are much more complex than they appear in a two-dimensional (2D) view, with multiple, three-dimensional (3D) branching structures (A). This branching seems to occur at roughly the same time (B) and grow independently upwards and outwards, filling space (C). The graph (D) shows how the cross-sectional area of the pillars changes upwards. Some samples seem to reach a maximum and then roughly maintain this area, while others grow more steadily, as indicated by the black dashed lines.
Minerals 08 00327 g007
Figure 8. Block diagrams of the three samples drilled parallel to the growth direction and imaging a top surface. The growth surface in 83-07 D is clearly different from the rougher and more mottled surfaces in both the samples drilled from 80-13. In 83-07, the small botryoids can be seen to connect to pillar growths beneath them, while in the 80-13 samples, the surface cross cuts any subsurface structure, suggesting that it is erosional.
Minerals 08 00327 g008
Figure 9. Compositional variations in Mn, Fe, and Co (and Ca) along transects measured with SEM-EDS and their Fe/Mn ratios. The white boxes indicate the area analyzed. The smoother profiles in line 2 are due to a slightly wider analysis area. Lines are run from left to right.
Minerals 08 00327 g009
Table 1. Crust volume as a percentage of the total for all the samples measured except 83-21 A and 83-07 A, which were through the substrate. The pillared samples contain much more FeMn crust as a percentage of their volume than did the cuspate samples.
CoreTextureCrust Volume (mm3)Detrital/Pore-space Volume (mm3)Total Volume (mm3)Crust%
8307BPillared0.77170.05620.828093.21
8307CPillared0.65140.11370.765185.14
8307DCuspate0.91510.27851.193676.67
8013AMixed0.53320.10780.640983.19
8013BMixed0.46970.05920.528988.81
8321BPillared0.35000.02850.378592.47
8321CMixed2.05400.53502.589079.34
8321DCuspate0.24810.18450.432757.35
8321ALimestone substrate××××
8307APredominantly limestone substrate××××

