1. Introduction
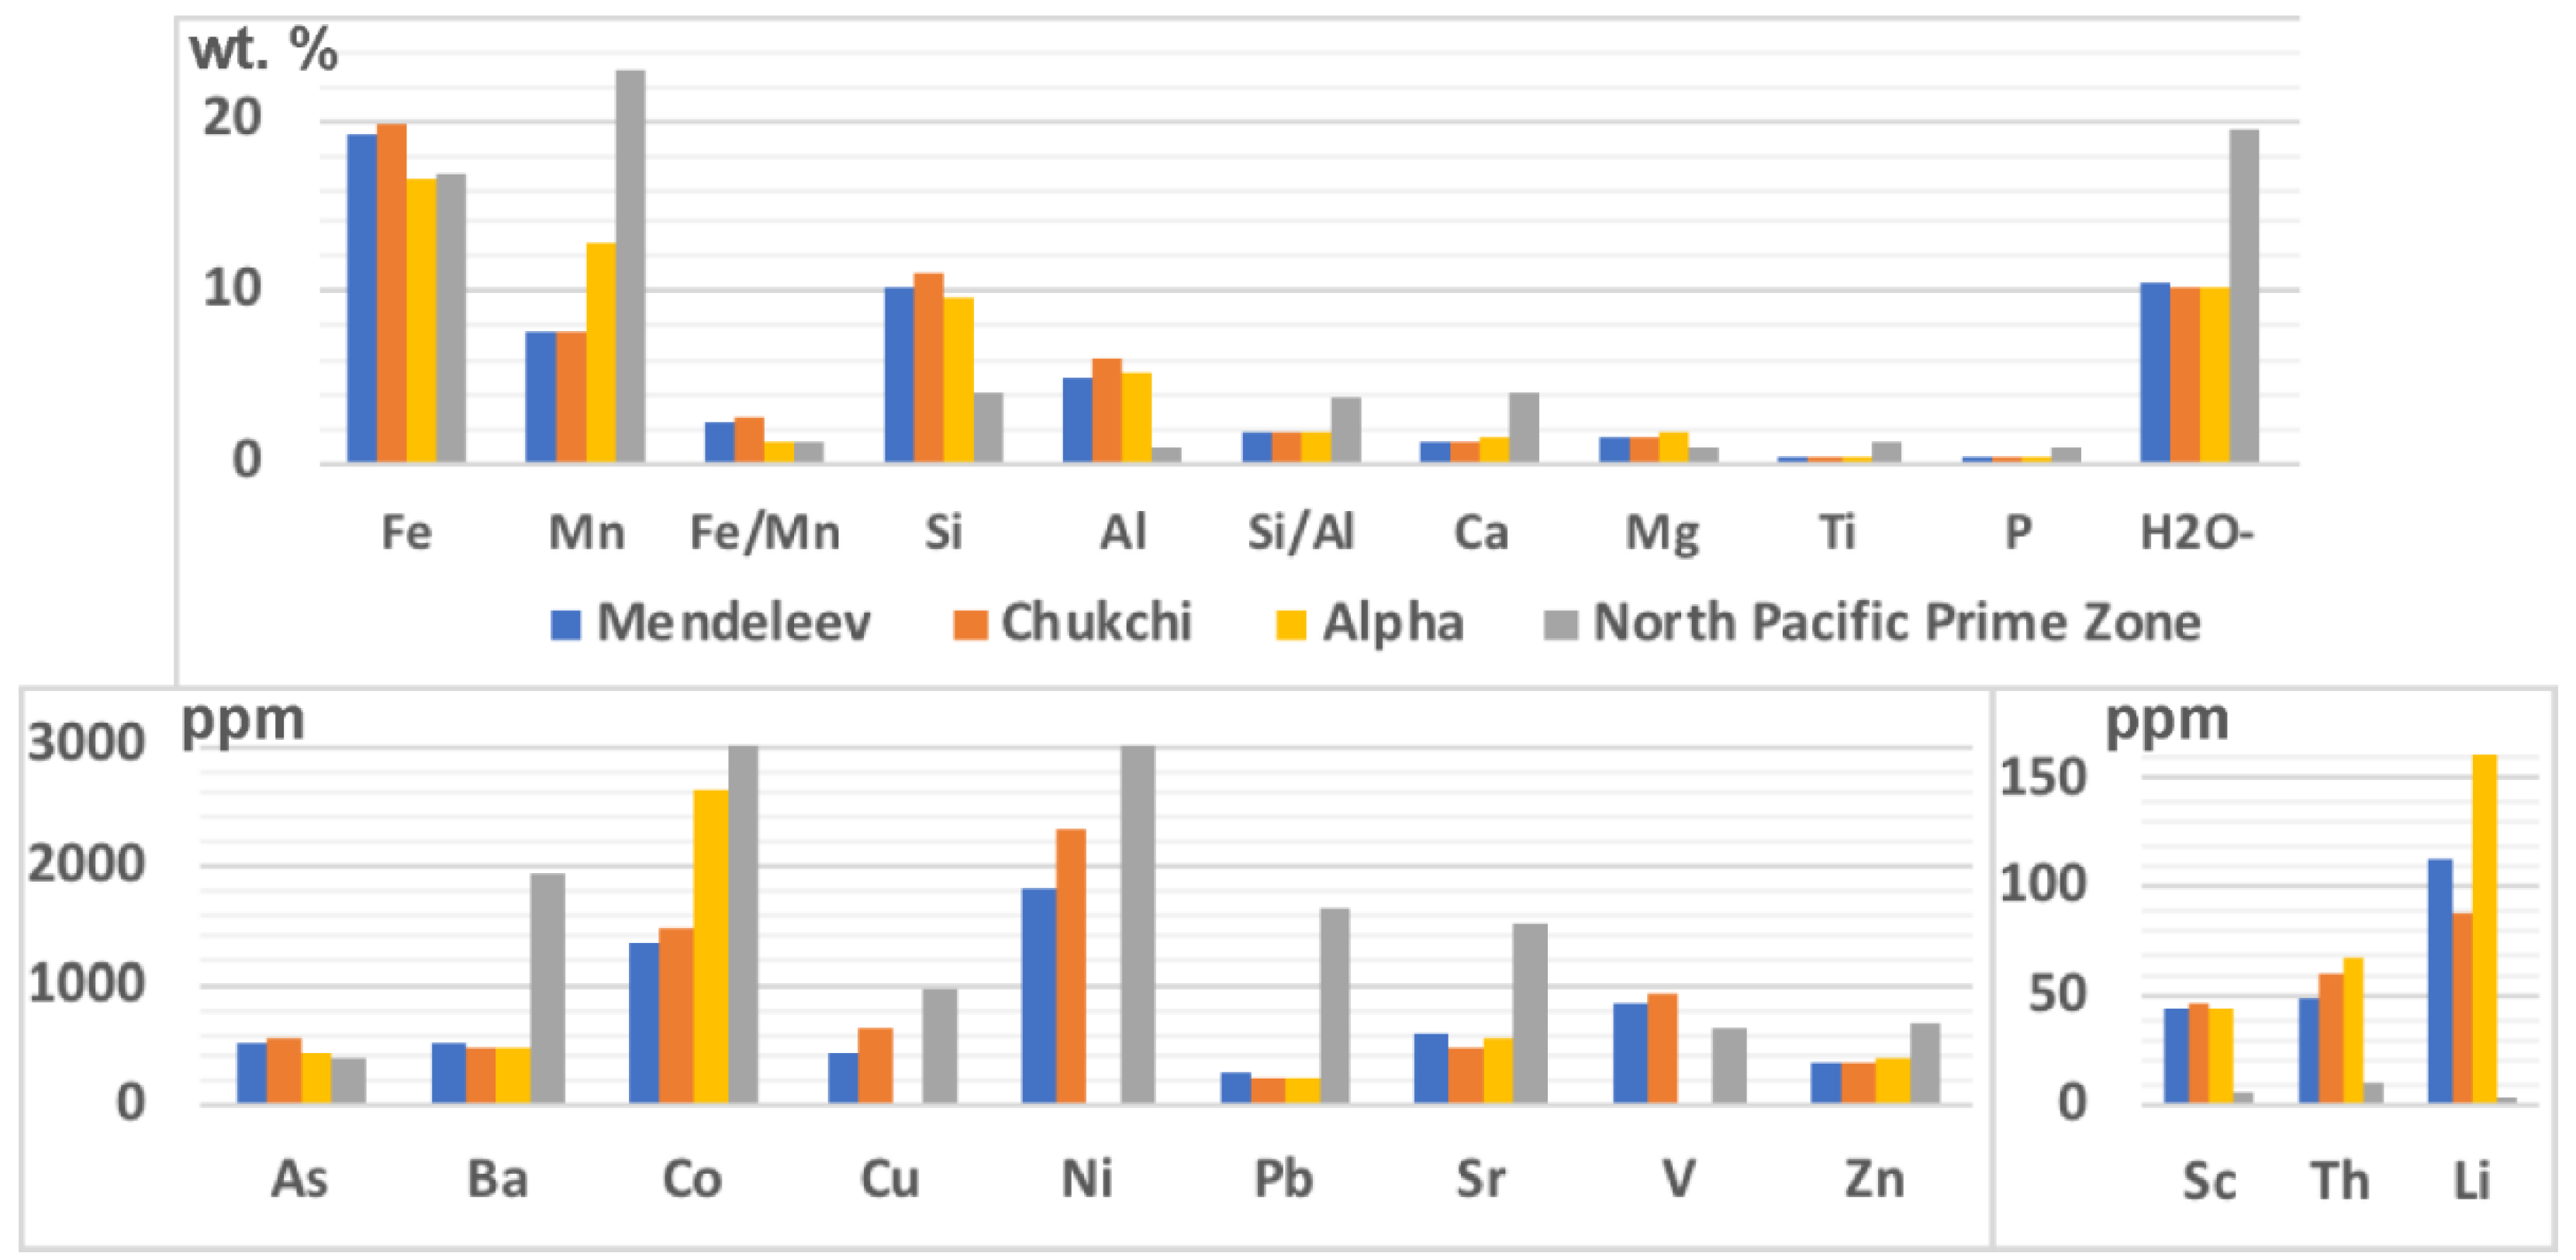
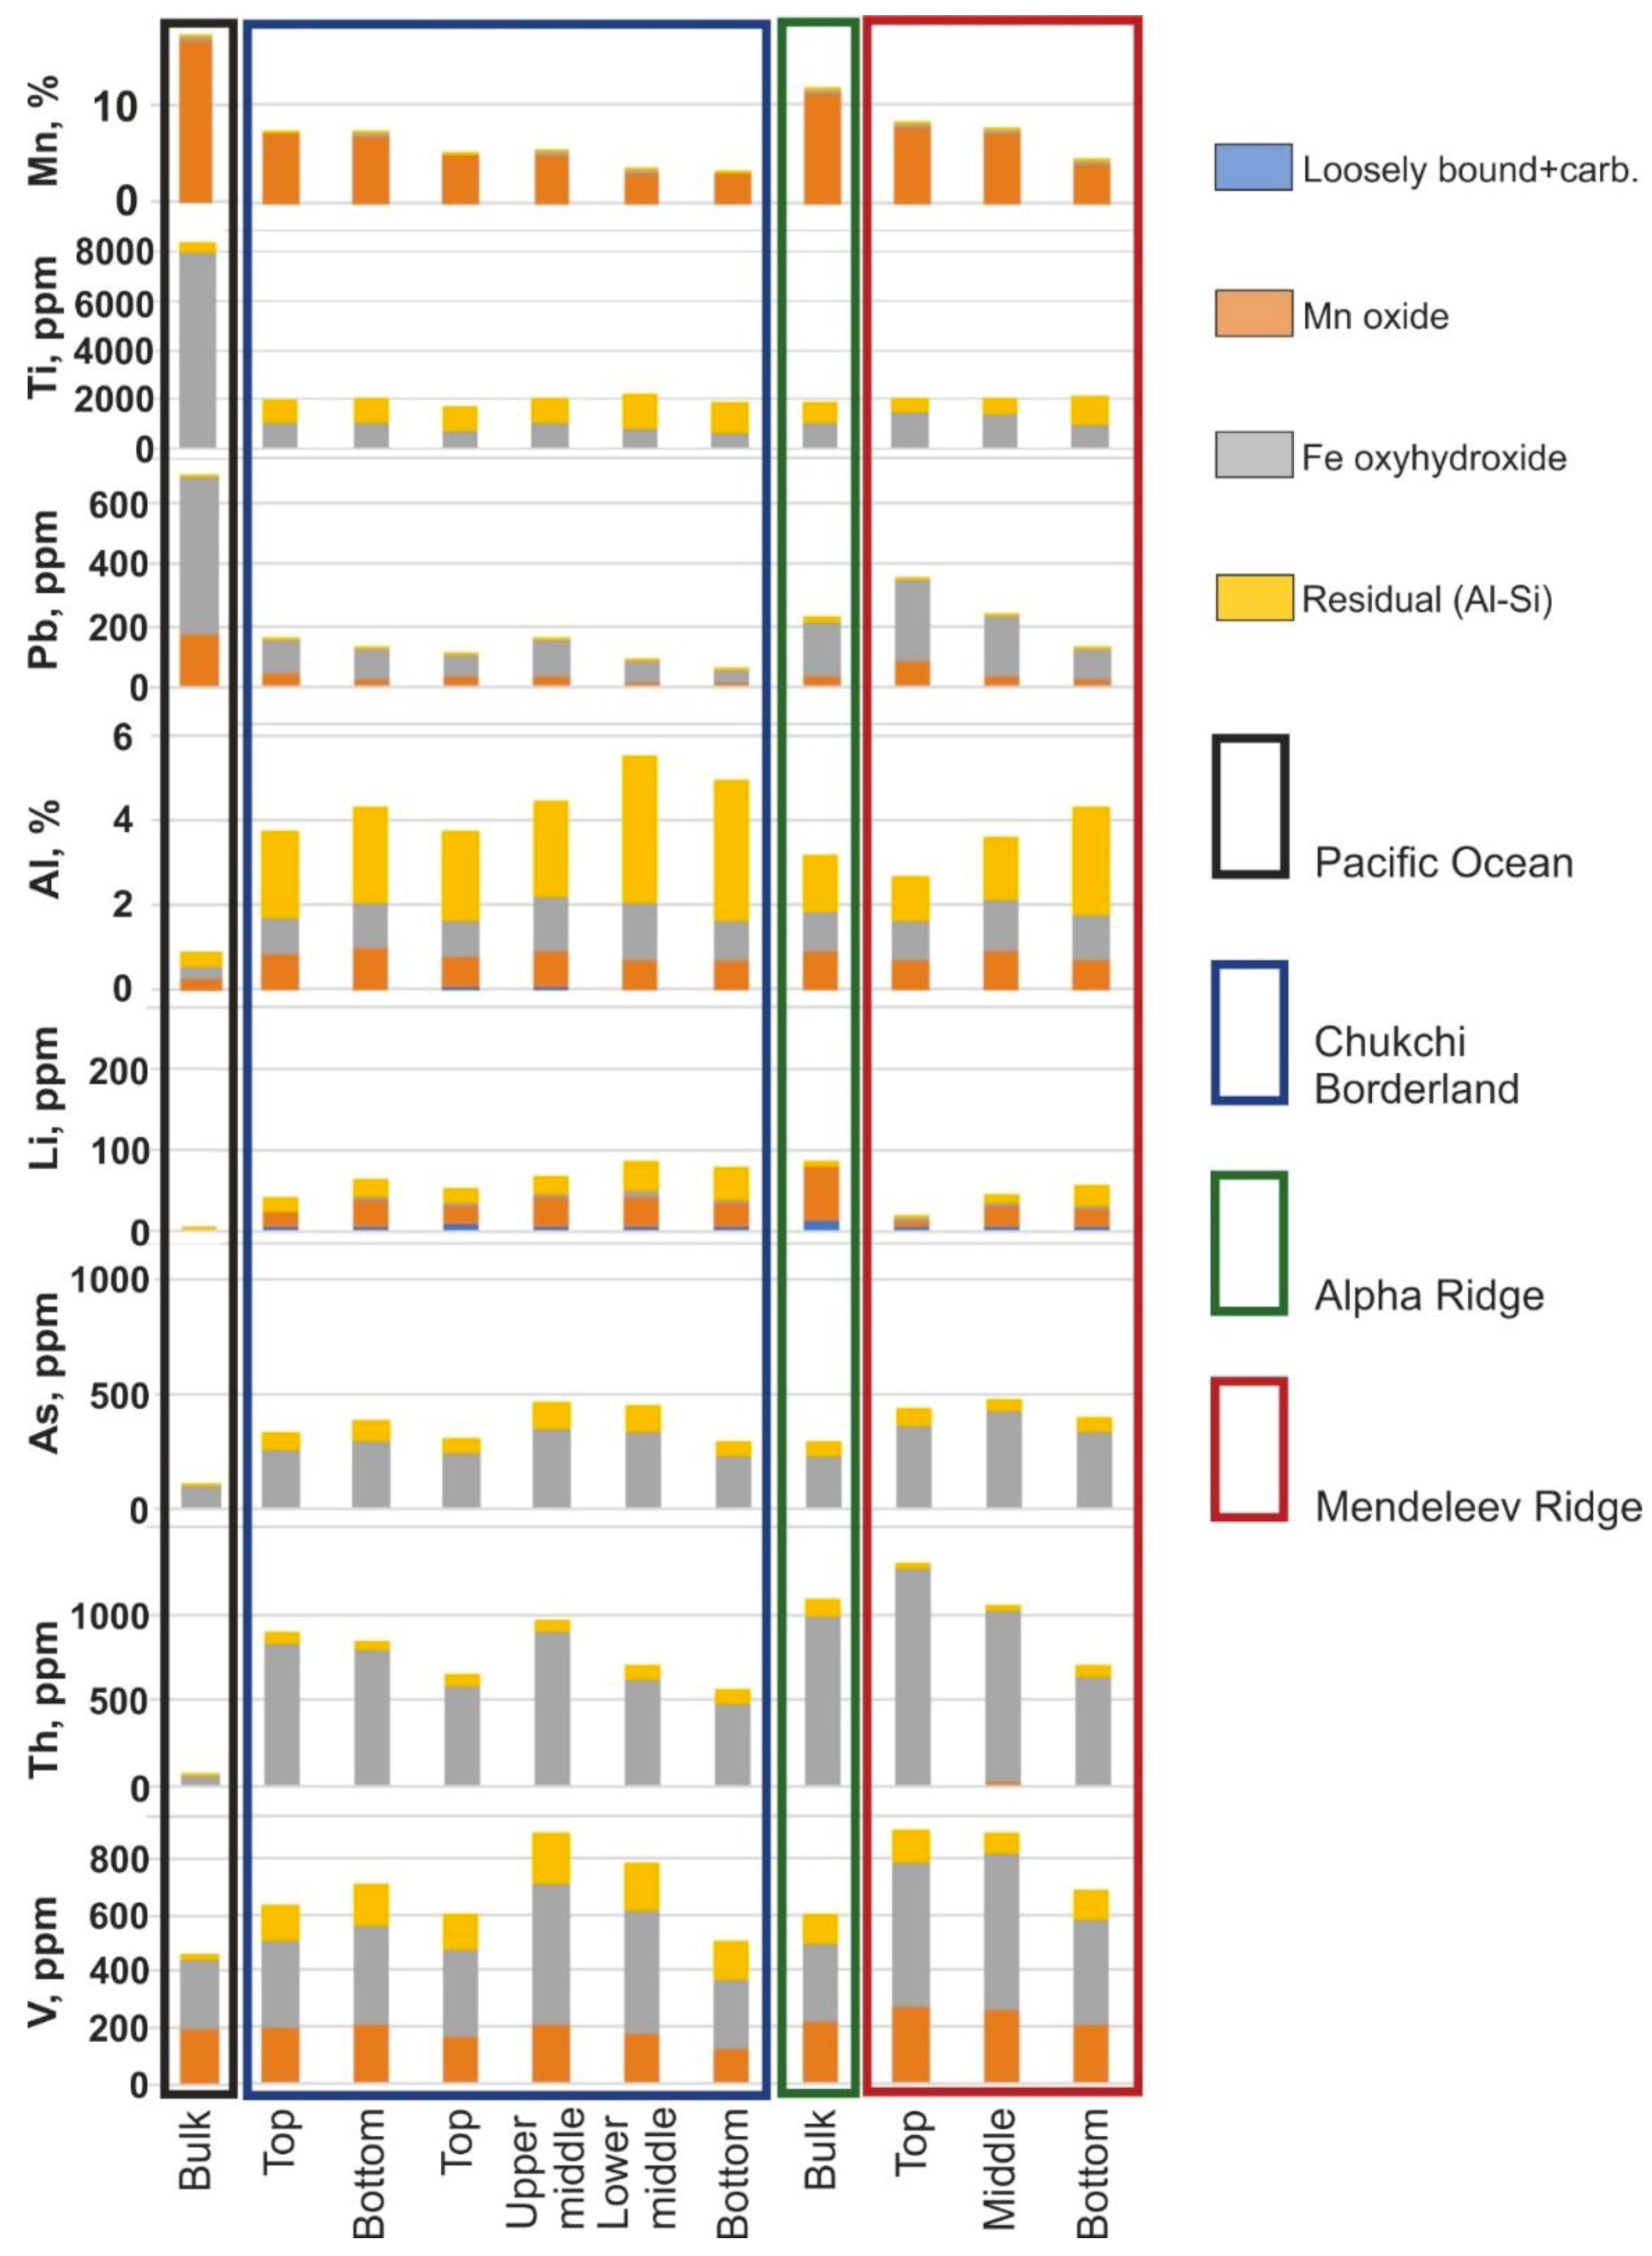
Arctic Ocean hydrogenetic ferromanganese (FeMn) crusts from Mendeleev Ridge are similar to those from the Chukchi Borderland and Alpha Ridge based on morphology and chemical composition. The FeMn crusts are characterized by two- to four-layered stratigraphy without depositional-erosional hiatuses based on textural analysis. By contrast, the chemical compositions of Arctic crusts differ significantly from hydrogenetic crusts of the Pacific Prime Crust Zone (PCZ) [
1], such as high Fe/Mn ratios (average 2.6 versus 1.3), low Si/Al ratios (1.8 versus 4.0), lower Mn, Ca, Ti, P, Ba, Co, Cu, Ni, Pb, Sr, and Zn contents, and higher Si, Al, Mg, As, Li, V, Sc, and Th contents (
Figure 1); also, locally high concentrations of Hg (up to 215 ppb) occur in the Arctic crusts compared with the deep-ocean crusts from elsewhere in the global Ocean [
2].
As a rule, global FeMn crusts consist of four phases: Manganese oxides, iron oxyhydroxides, aluminosilicates, and primary and residual biogenic phases [
4]. Typically, the Mn and Fe phases are epitaxially intergrown, are hydrogenetic, and reflect ocean bottom-water chemistry; the aluminosilicate phase contains detrital minerals such as quartz, feldspar, and clay minerals.
Based on the Arctic FeMn crust mineral and chemical compositions and growth rates, formation was dominated by three main processes: Precipitation of FeMn oxyhydroxides from ambient ocean water, sorption of metals by those Fe and Mn phases, and fluctuating but large inputs of terrigenous debris [
2,
5].
Interelement statistical correlations of bulk crust compositions offer a first-order interpretation as to which mineral phase trace elements might be associated with, however this technique can produce ambiguous results for elements enriched in more than one phase [
6]. Here, we study element distributions through crust stratigraphic sections and element phase association using several complementary techniques. Interelement correlations and phase associations are presented using chemical spot-analyses from scanning electron microscope-Energy Dispersive Spectrometry (SEM-EDS) and microprobe analyses. The distribution of elements through the stratigraphic sections was also determined using laser ablation inductively coupled plasma mass spectrometry (LA-ICP-MS) and sequential leaching, a widely employed method of element phase association that dissolves mineral phases of different stability step-by-step.
2. Materials and Methods
Element associations and crust phases were determined using several methods such as LA-ICP-MS, SEM-EDS, and microprobe analyses on polished sections, and sequential leaching experiments using powdered samples.
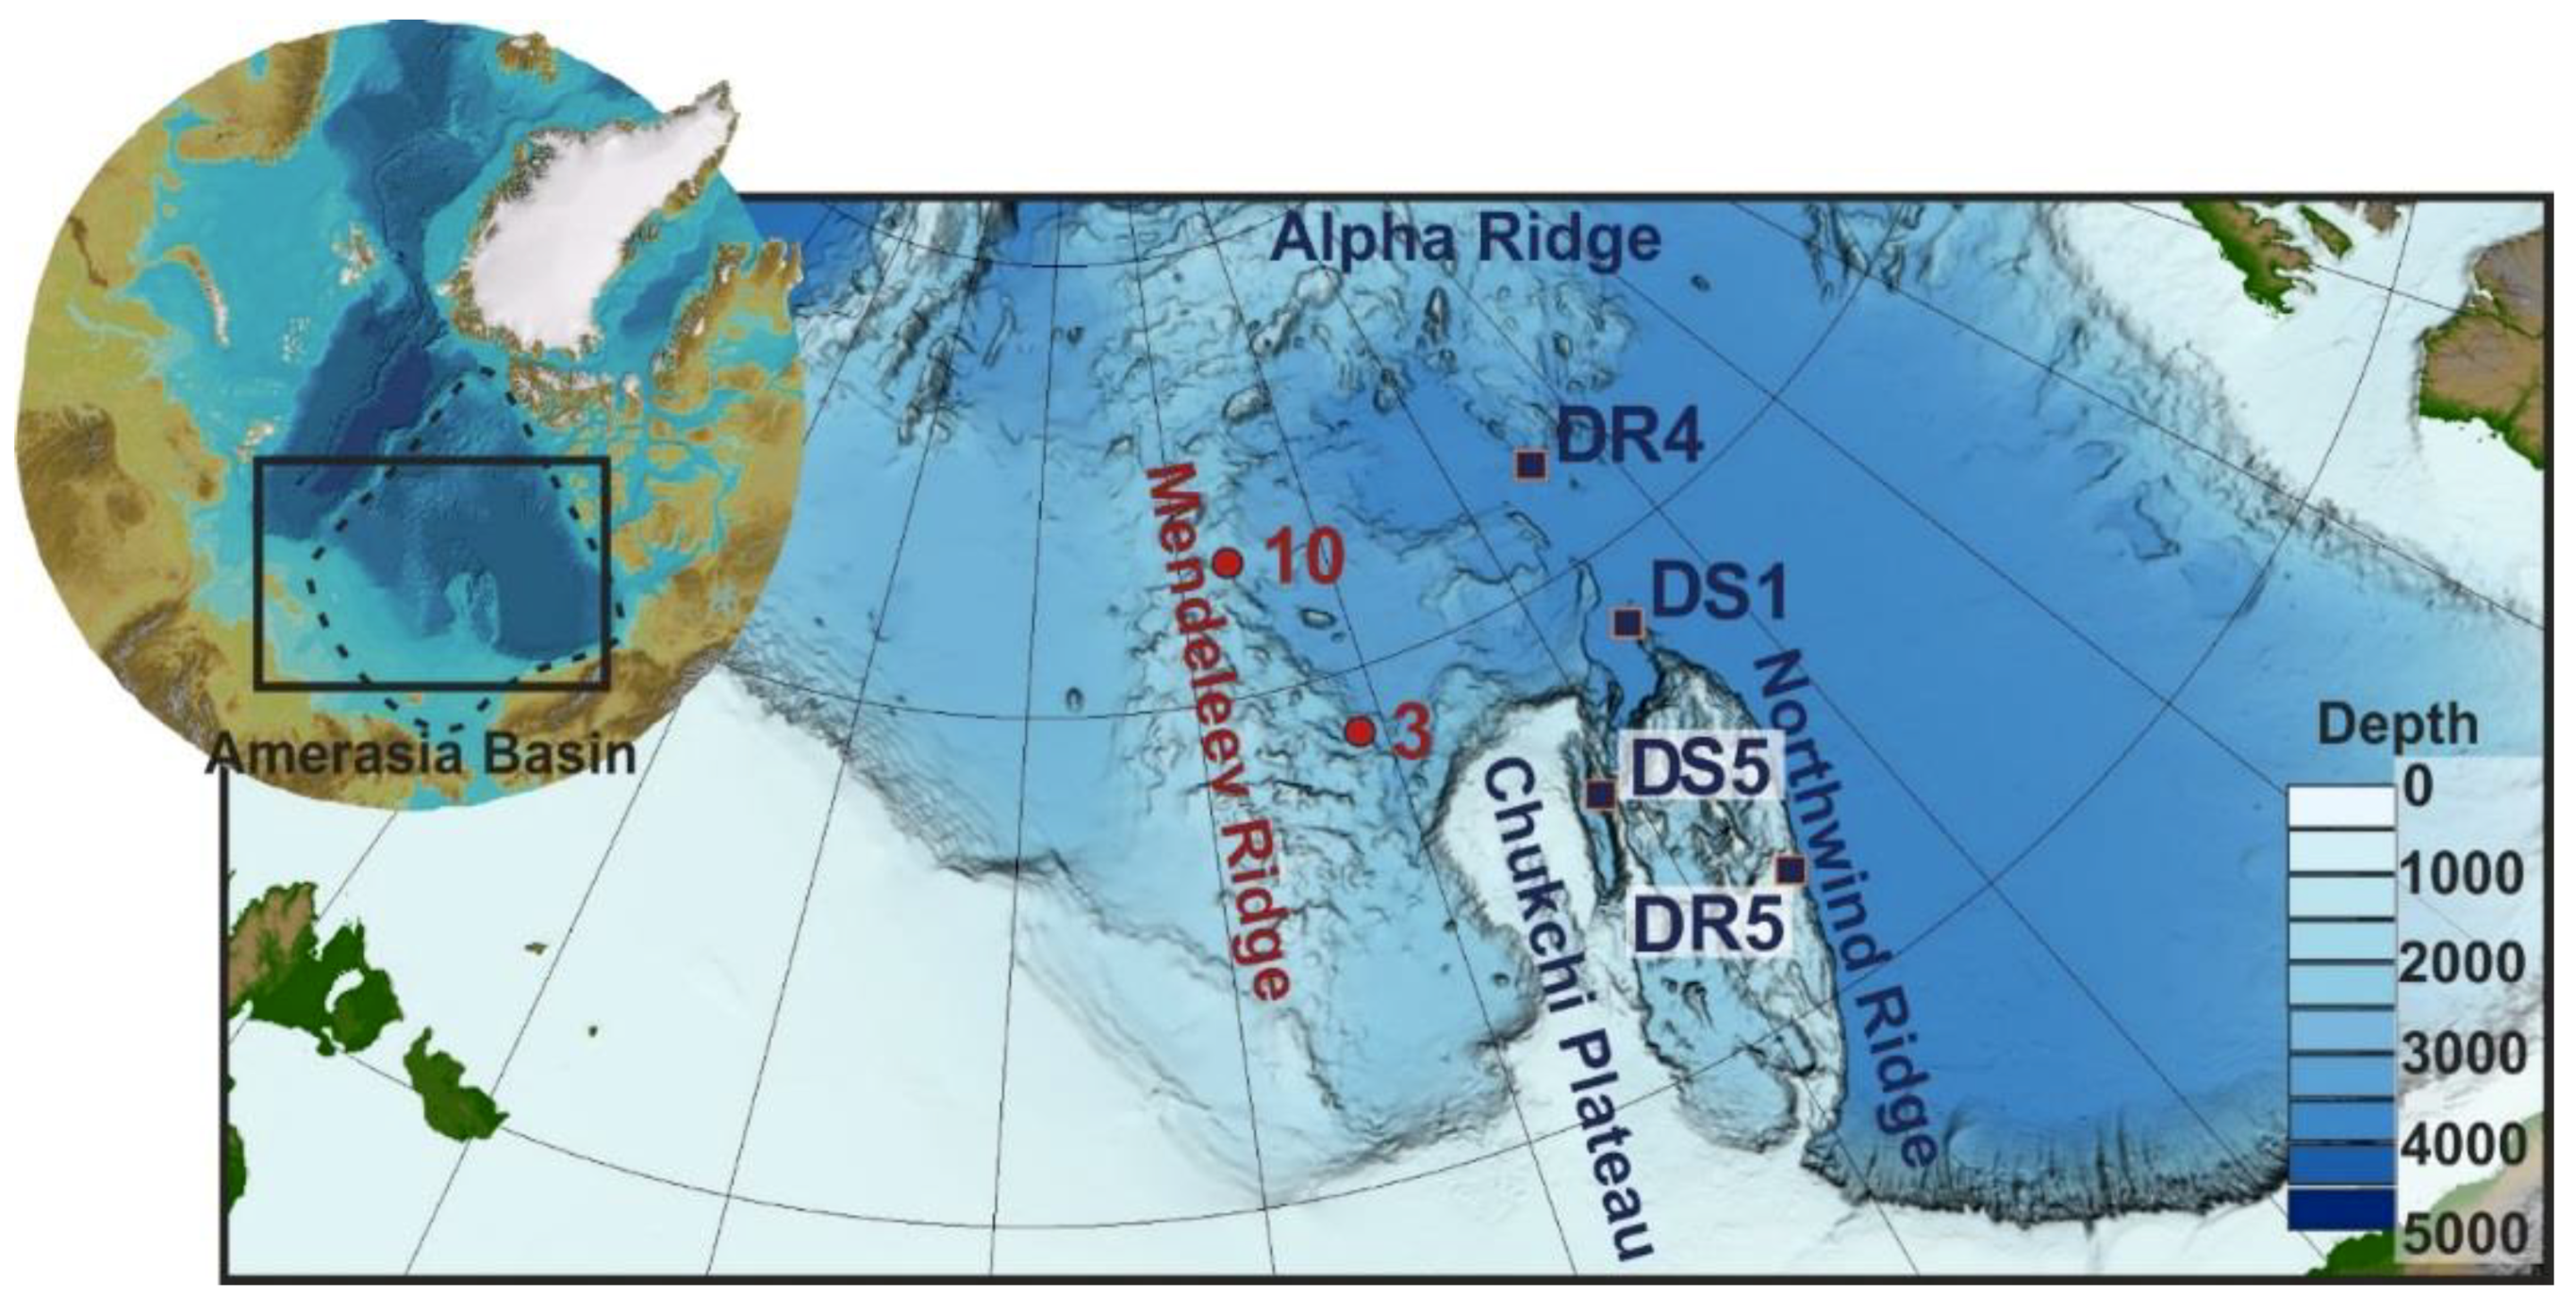
Three representative layered crusts collected from southern Mendeleev Ridge (dredge site 3,
Figure 2) were selected to study the distribution of elements by LA-ICP-MS (Hercules Laboratory, Evora University; operator Pedro Barrulas). The LA-ICP-MS analysis were performed using an Agilent 8800 ICP-MS Trip Quad coupled to a CETAC LSX-213 G2+ laser ablation system. The equipment was calibrated prior to the analysis using NIST 612. Elemental fractionation was monitored using
238U/
232Th (1.05) and oxide formation was evaluated using the
248ThO/
232Th ratio (<0.28%). For the present study, LA-ICP-MS was used for element mapping of the selected crusts samples. The instrument conditions are described in
Table 1.
Element mapping of the crust samples was performed importing all the raw data obtained in intensities (counts per second) from the ICP-MS Agilent MassHunter software (Agilent Technologies, Santa Clara, CA, USA) as a single file into the iQuant2® software and converting it to elemental maps. In order to avoid contaminations from the surface for both quantification and element mapping analysis, the samples were pre-ablated and then analyzed.
Three samples from the same site were studied using SEM (Hitachi S-3400 N, 20 kV accelerating voltage during SEM operations) with an energy dispersive X-ray spectrometer (EDS) (Oxford X-Max 20; Geomodel Center, St. Petersburg State University, operator Vladimir Shilovskich); spectra were obtained with the following beam settings: 20 kV accelerating voltage, and 2 and 10 nA beam current for EDS, and four samples were analyzed by variable pressure SEM coupled with a X-ray spectrometer (VP-SEM-EDS HITACHI 3700N with BRUKER Xflash 5010SDD X-ray spectrometer; Hercules Laboratory, Evora University; operator Luis Dias [
5]).
The Pearson correlation coefficient was used to calculate coefficient matrices for spot-analyzed chemical data, which is a measure of the strength of linear dependence between two variables. Statistical significance will be specified at either a 99% or 95% confidence level (CL). Q-mode factor analysis was used to examine element relationships and to identify common groups of elements referred to as factors, and calculations were run in Statistica software. Factors were derived from orthogonal rotations of principal component eigenvectors using the Varimax method [
7].
Six hydrogenetic FeMn crusts recovered from Mendeleev and Alpha Ridges and Chukchi Borderland in the Amerasia Basin were obtained from Russian (Arktika 2012 [
8]) and USA (HLY0805, HLY0905, HLY1202) research cruises. The six bulk crusts as well as layers from those bulk crusts were chosen for the sequential leaching experiments based on morphology, genesis, and water depth (
Figure 2;
Table 2). For comparison, two Pacific hydrogenetic crusts were included in the sequential leaching experiment, crust (D07-33) from the Tuvalu area, central-west Pacific Ocean, and mean values of three upper non-phosphatized layers of a crust from Govorov Guyot, west Pacific Magellan Seamounts (
Table 2).
Sequential leaching is a technique to group elements with their host mineral phase or with a group of minerals. It consists of four steps, as described by Koschinsky and Halbach [
4]. (1) Exchangeable cations and calcium carbonates: 1 g of powdered sample was stirred with 1 M acetic acid/Na acetate buffer (pH 5); (2) Easily reducible fraction: The residue of leach 1 was stirred with 0.1 M hydroxylamine hydrochloride solution (pH 2); (3) Moderately reducible fraction: 0.2 M oxalic acid/ammonia oxalate buffer (pH 3.5) was added to the solid residue of step 2; (4) Residual fraction: The residue from step 3 was digested in Teflon bombs in a microwave, using a mixture of 48% HF and 65% HNO
3 (proportion 2/1) and dried; then 25% HCl was added and dried again. All steps were carried out twice. Hydrogen peroxide was used to dissolve organic matter.
Sequential leaching experiments were carried out in the laboratory at the USGS, Pacific Coastal and Marine Science Center, except for the Govorov Guyot crust, which was carried out in the laboratory of the Far-East Geological Institute in Vladivostok, Russia by P. Mikhailik. Al, As, Ba, Ca, Cd, Co, Cr, Cs, Cu, Fe, K, Li, Mg, Mn, Ni, Pb, Ti, Th U, V, Zn, and Y were measured in the four phases from 13 samples using an ICP-MS PerkinElmer NexION 300Q (USGS, Menlo Park, operators N. Konstantinova and A. Gartman). For each element, the sum of the amounts released by leaching steps 1- 4 was compared with the bulk analysis data to check recovery, which was between 80% and 120%. Additionally, sequential leaching results of Arctic crusts were compared with literature data presented by Koschinsky and Hein [
9] for central Pacific non-phosphatized crust layers.
3. Results
3.1. LA-ICP-MS Chemistry
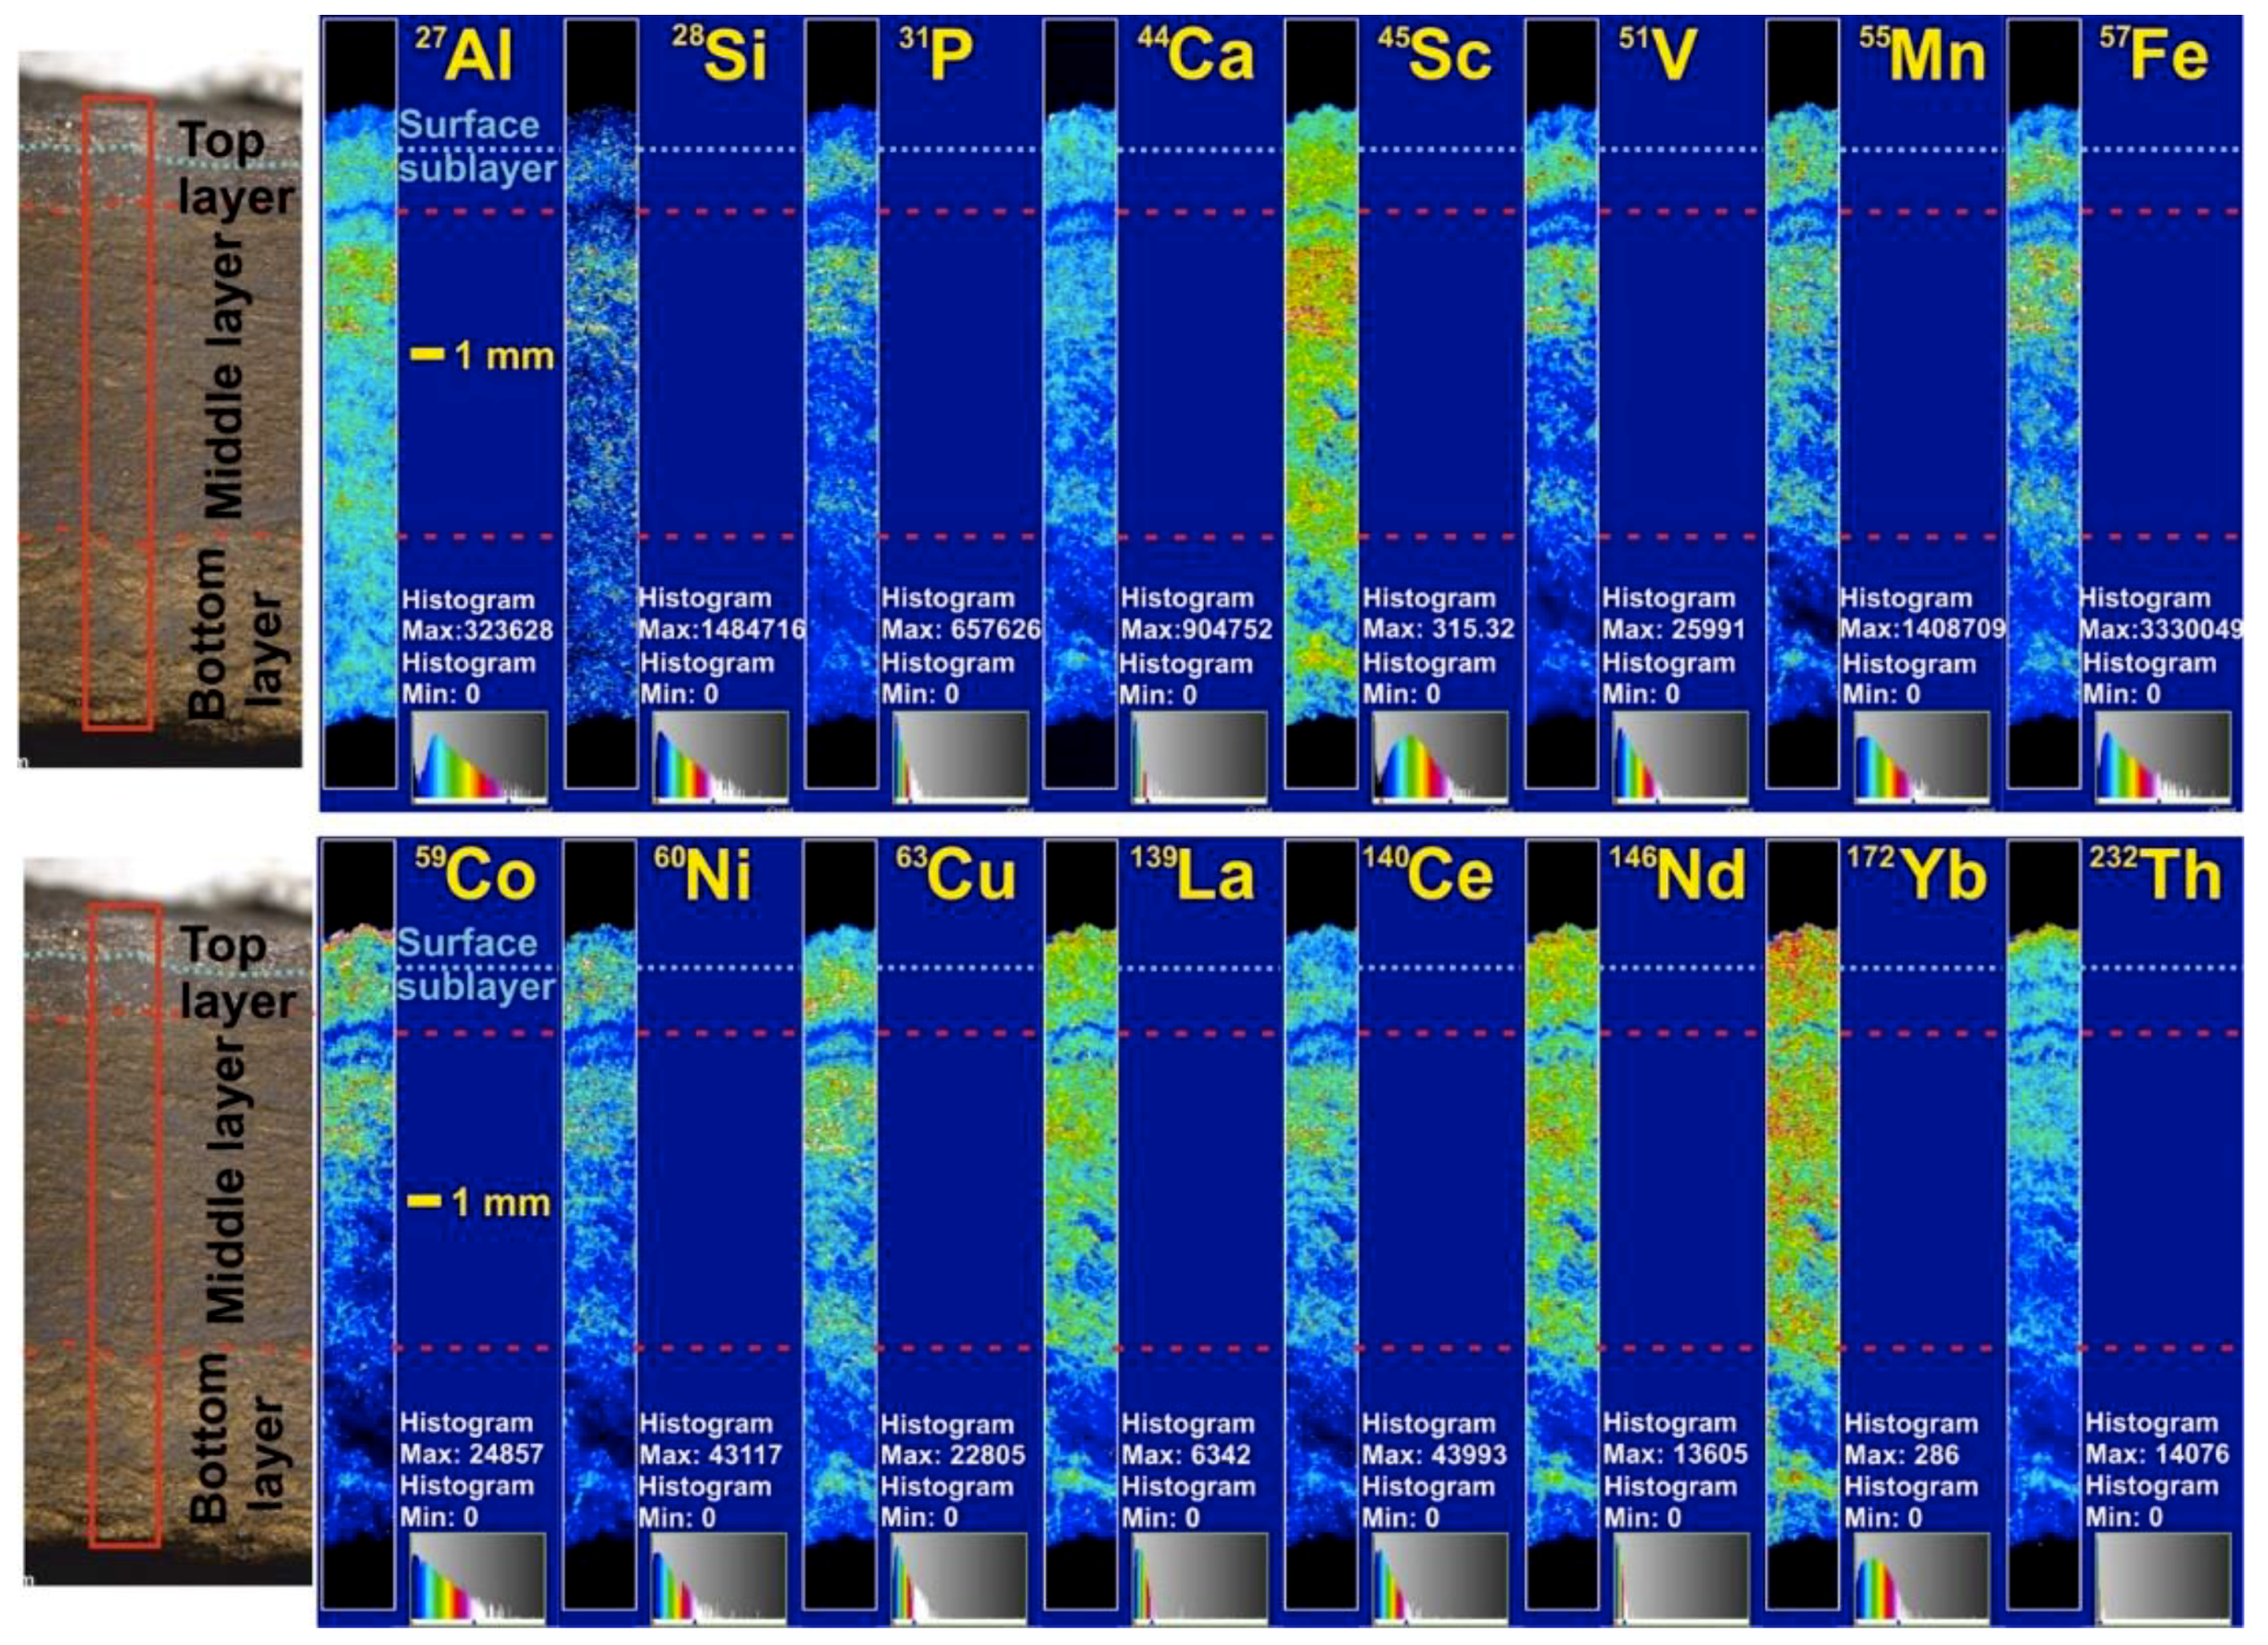
LA-ICP-MS results allow for the generation of maps of the distributions of Al, Si, P, Ca, Sc, V, Mn, Fe, Co, Ni, Cu, La, Ce, Nd, Yb, and Th through the Mendeleev crust 648 stratigraphic section (
Figure 3).
The LA-ICP-MS data are influenced by the texture of the crusts that have high porosity, specific surface area, and detrital contents, and are highly friable, characteristics that vary for each layer type. This indicates that in general, the element distributions are similar in the stratigraphic layers of the Arctic crusts, especially for the lower part of the stratigraphic section. However, the uppermost 1 mm sublayer of the top layer (surface) has a markedly different distribution of some elements, probably due to its higher density, which can be divided into three groups:
1. Elements with their highest contents in the uppermost 1 mm surface sublayer include Co, Th, La, Nd, and Yb.
2. Elements with their lowest concentrations in the surface sublayer: Al, Si, P, Sc, V, Fe, Ni, Cu, and Ce.
3. Ca and Mn do not have significant variations along the stratigraphic section and are characterized by high contents in the surface sublayer, but not maxima.
3.2. Chemical Spot Analyses
SEM-EDS and microprobe results define three mineral associations in the crusts from Mendeleev Ridge, differing in chemical composition and morphology: FeMn mineral association, Fe mineral association, and detrital mineral association.
The FeMn mineral association is the typical matrix for hydrogenetic crusts, consisting of manganese oxide-rich and iron oxyhydroxide-rich laminae [
10,
11]. In Arctic crusts this mineral association is characterized by columnar and colloform structures (
Figure 4). The average Fe/Mn ratio is 1.01, which is typical for hydrogenetic crusts from the Pacific Ocean [
12]. On the scale of laminae, Fe/Mn ratios vary over a small range, from 0.75 to 1.27, reflecting the ratio of manganese- to iron-rich laminae (
Figure 4C).
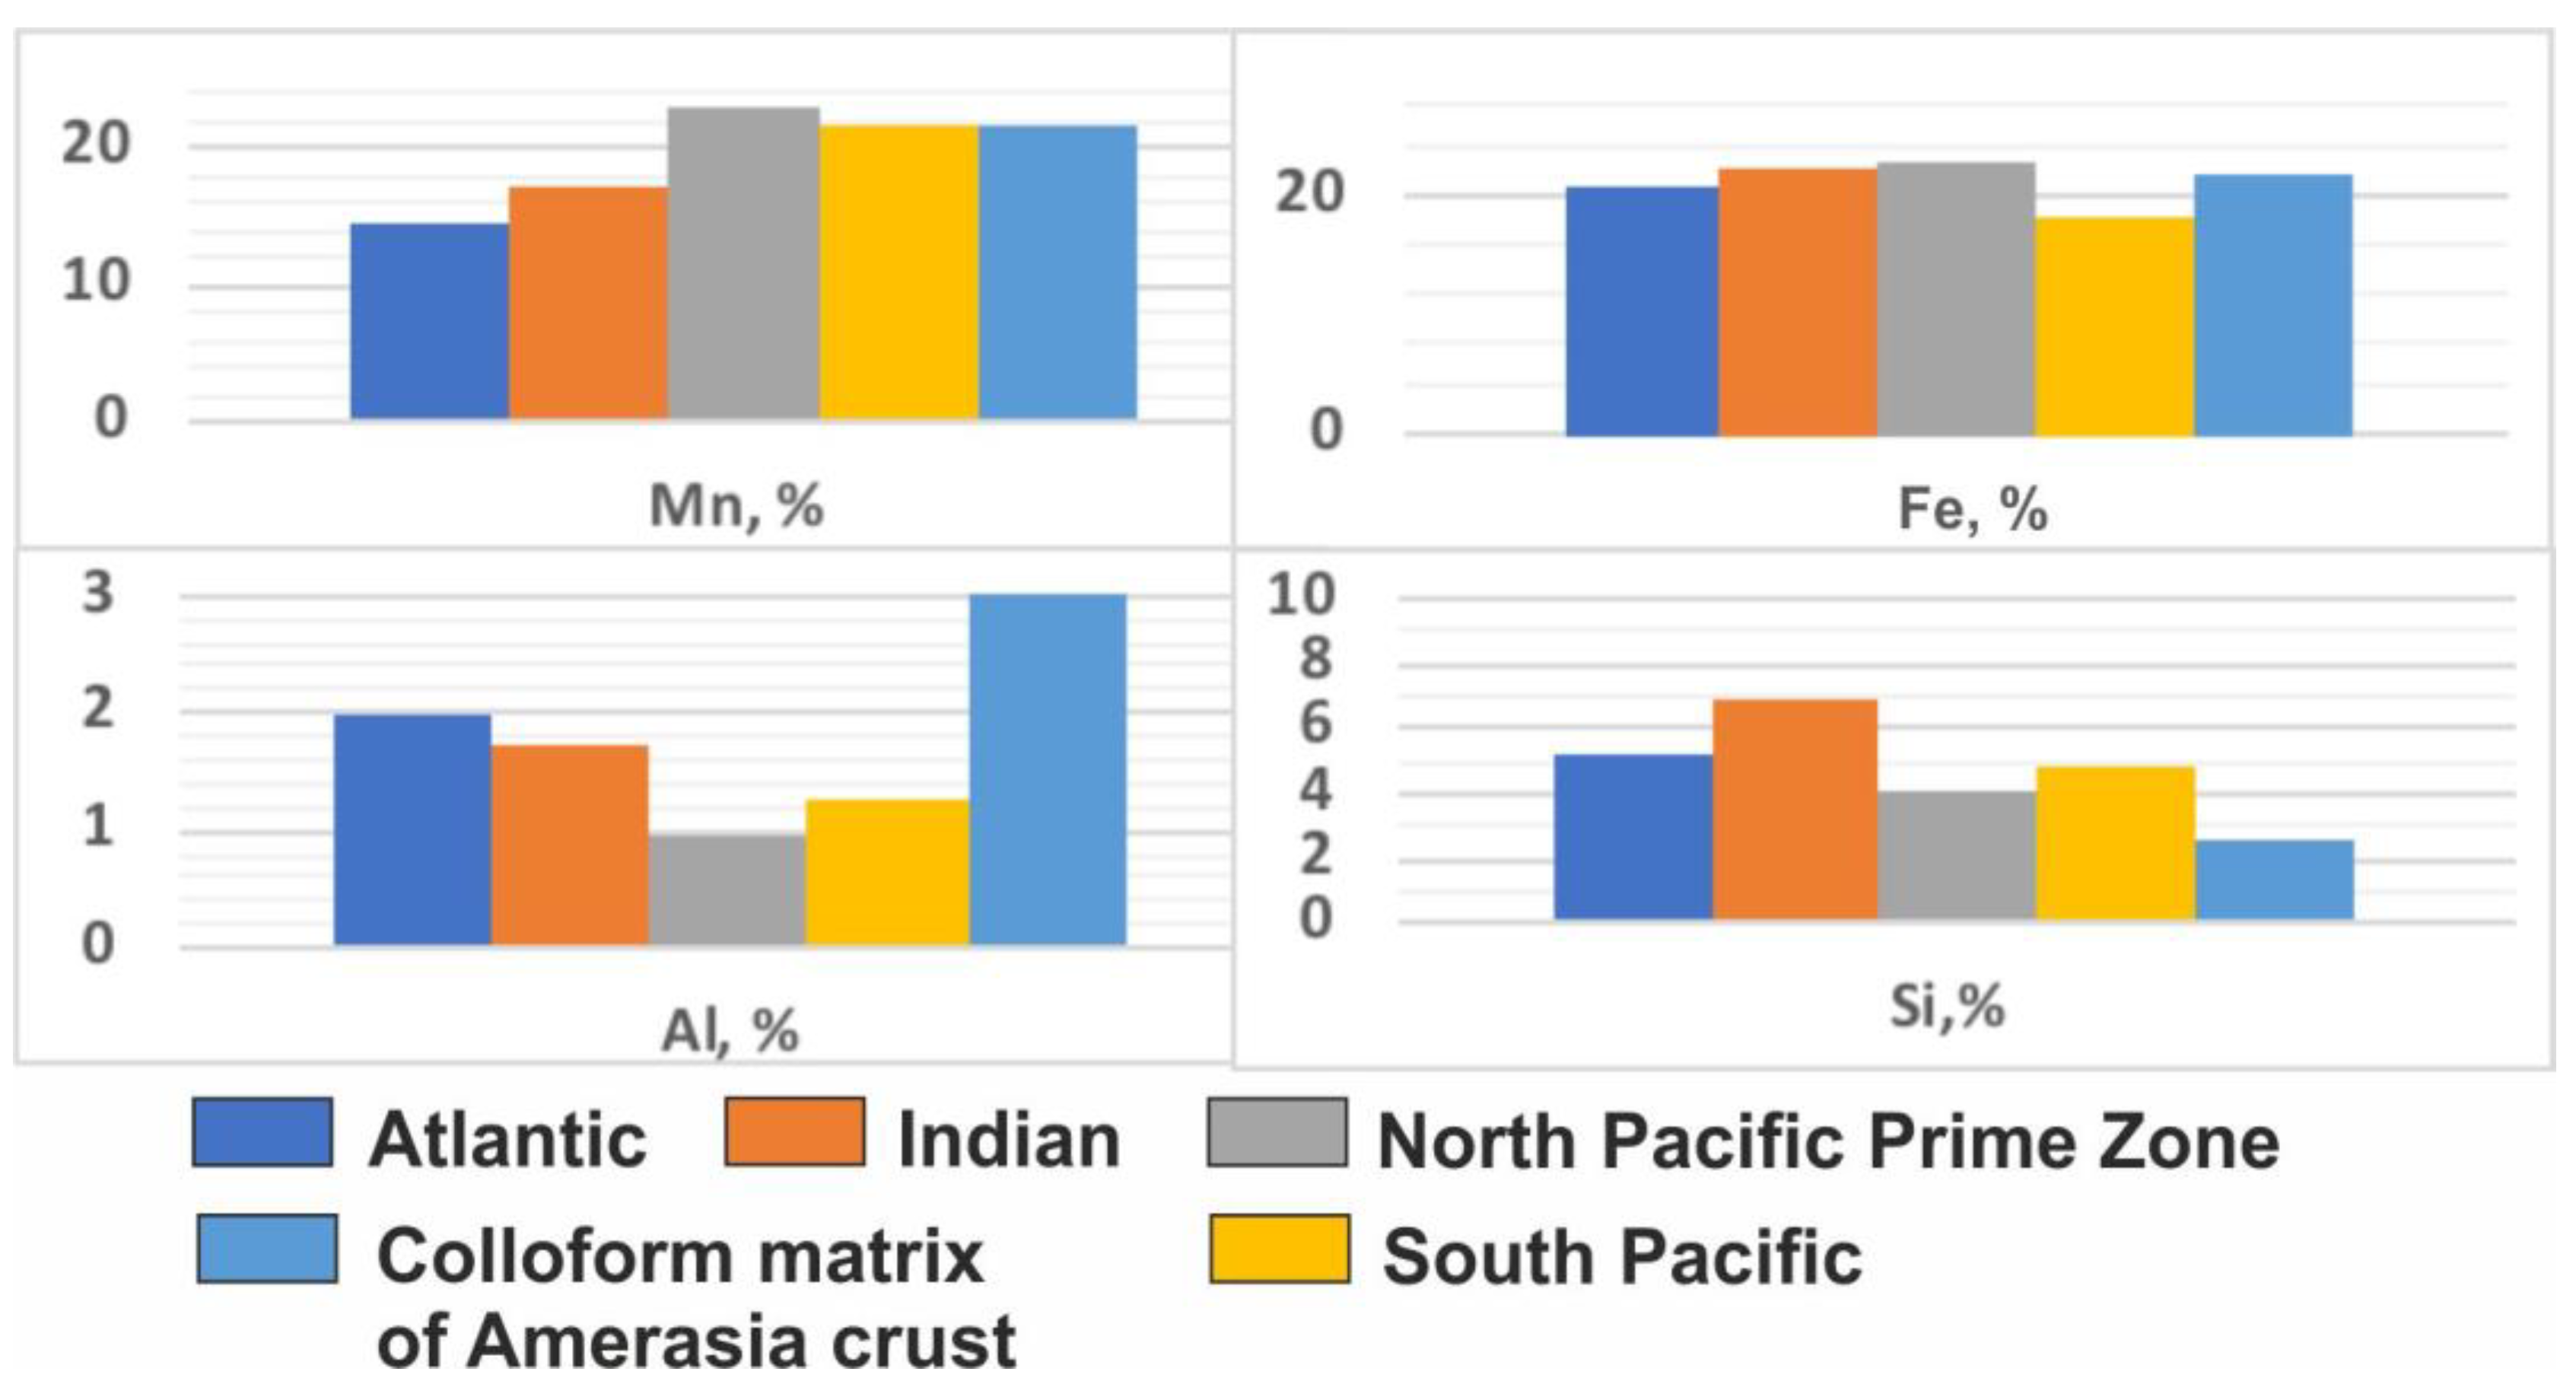
Arctic ocean crusts from all three locations studied, the Mendeleev Ridge, Alpha Ridge, and Chukchi Borderland exhibit uniquely high detrital contents compared to other deep-ocean crusts, and as a result comparative chemical differences with crusts from elsewhere are controlled by the detritus. For example, mean Al content of Arctic crust matrix minerals exceeds that of Pacific crusts by 2 times and of the Indian and Atlantic crusts by 1.5 times, which results from very fine-grained detritus associated with the matrix minerals. A better comparison for hydrogenetic contributions can be achieved by using the FeMn mineral matrix associations for the Arctic crusts. The average Mn and Fe contents for the FeMn mineral association of Mendeleev Ridge crusts are mostly similar to hydrogenetic crusts from other oceans (
Figure 5,
Table 3).
The FeMn mineral association consists of intergrowths of Mn oxide and Fe oxyhydroxide. Mn shows positive correlations with Ni, Ca, Mg, S, and Na; Fe correlates with P, Cl, and Si. The correlation coefficient for Mn and Fe in spot samples is −0.75 (
Table S1), which reflects for the most part the redox favored temporal accumulation of either Mn or Fe oxides. The Fe–Mn correlation coefficient for all bulk samples is +0.53 which integrates data for all Fe- and Mn-rich laminae and detrital material [
5].
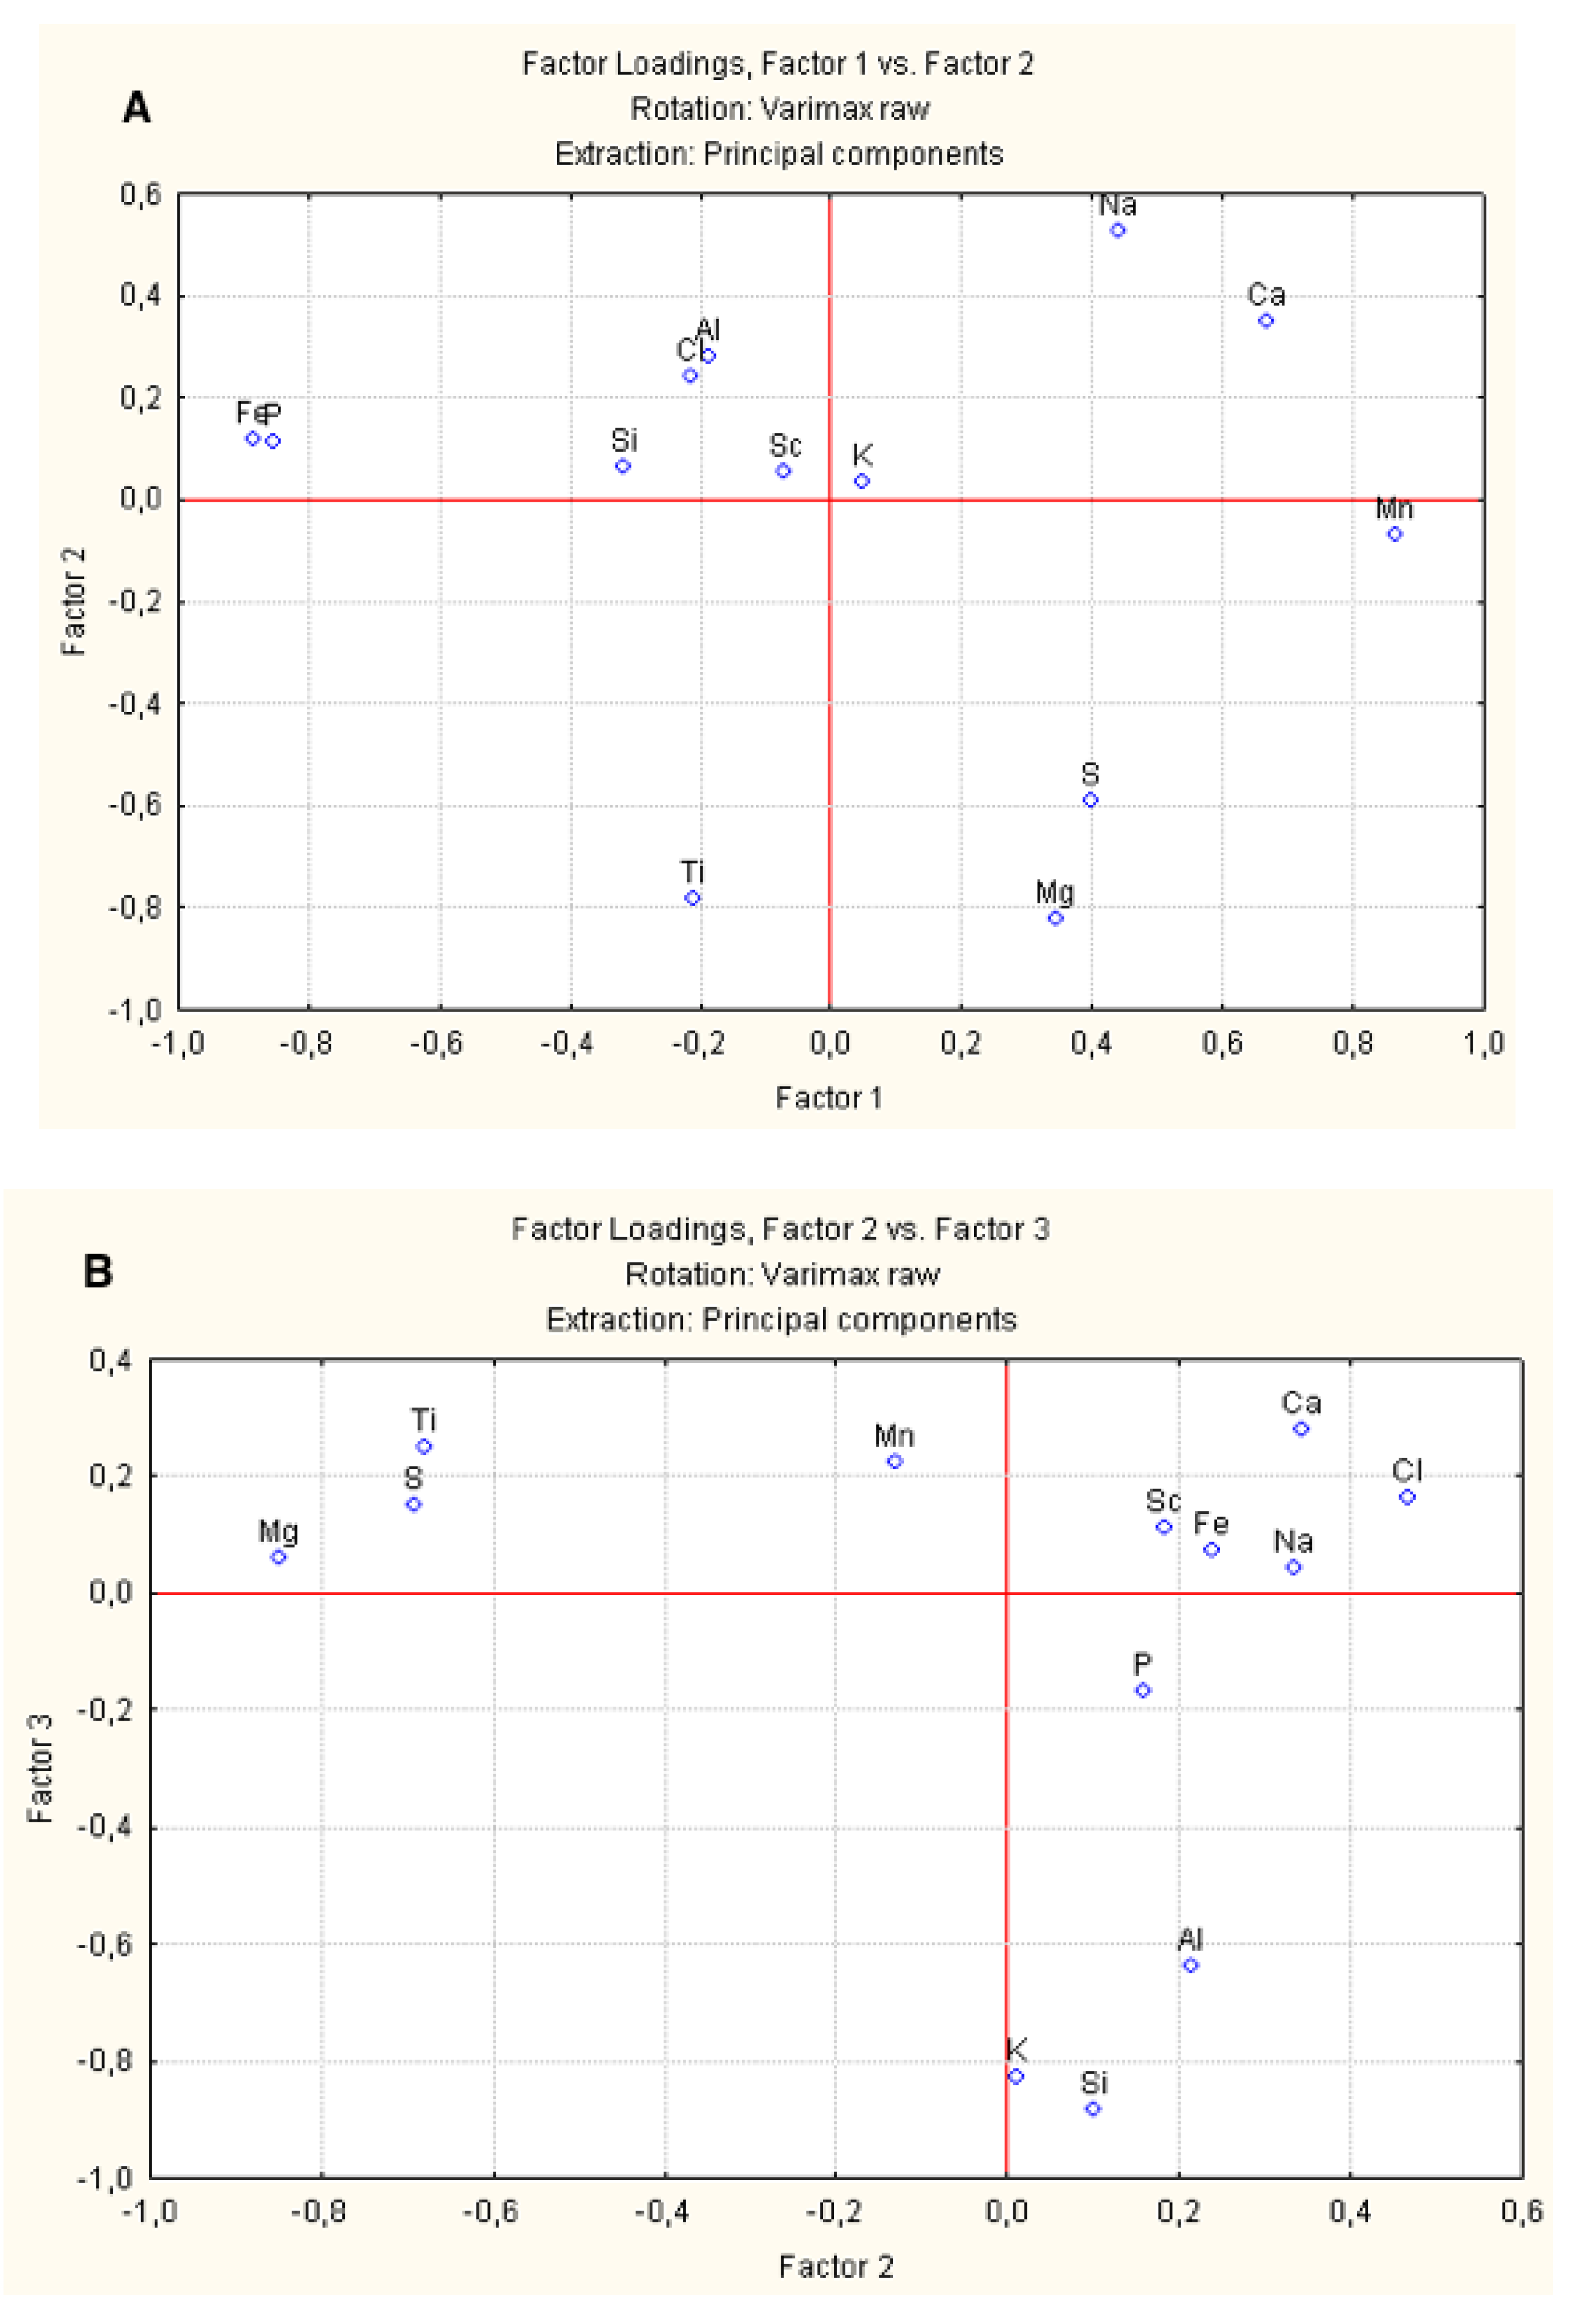
Using spot sample data, factor loading diagrams were constructed for three factors (
Table 4). Factor I identifies two groups: the Mn group, which includes Ca, Na, S, and Mg and the Fe group, which includes P, Si, Cl, Ti, and Al. The factor reflects the structure of the FeMn mineral association, the intergrowth of Fe and Mn oxides and hydroxides. According to sequential leaching data, Koschinsky and Halbach [
4] found that about 80% of the P is associated with Fe hydroxides and about 20% of the Ca with Mn oxides, the rest of the Ca being associated with carbonates, which were excluded from our sample by avoiding them in point selections during SEM-EDS analysis. Factor 2 and Factor 3 might reflect different types of detritus such as Na–Ca–Al–Cl and probably biogenic material such as the Mg–Ti–S group. Based on Factor 3, the group of Si-K-Al elements reflect the presence of detrital aluminosilicates and the Sc–Ca–Ti–Mn–Cl–S group is attributed to specific minerals in the detritus, and some of the major elements in sea water (
Figure 6).
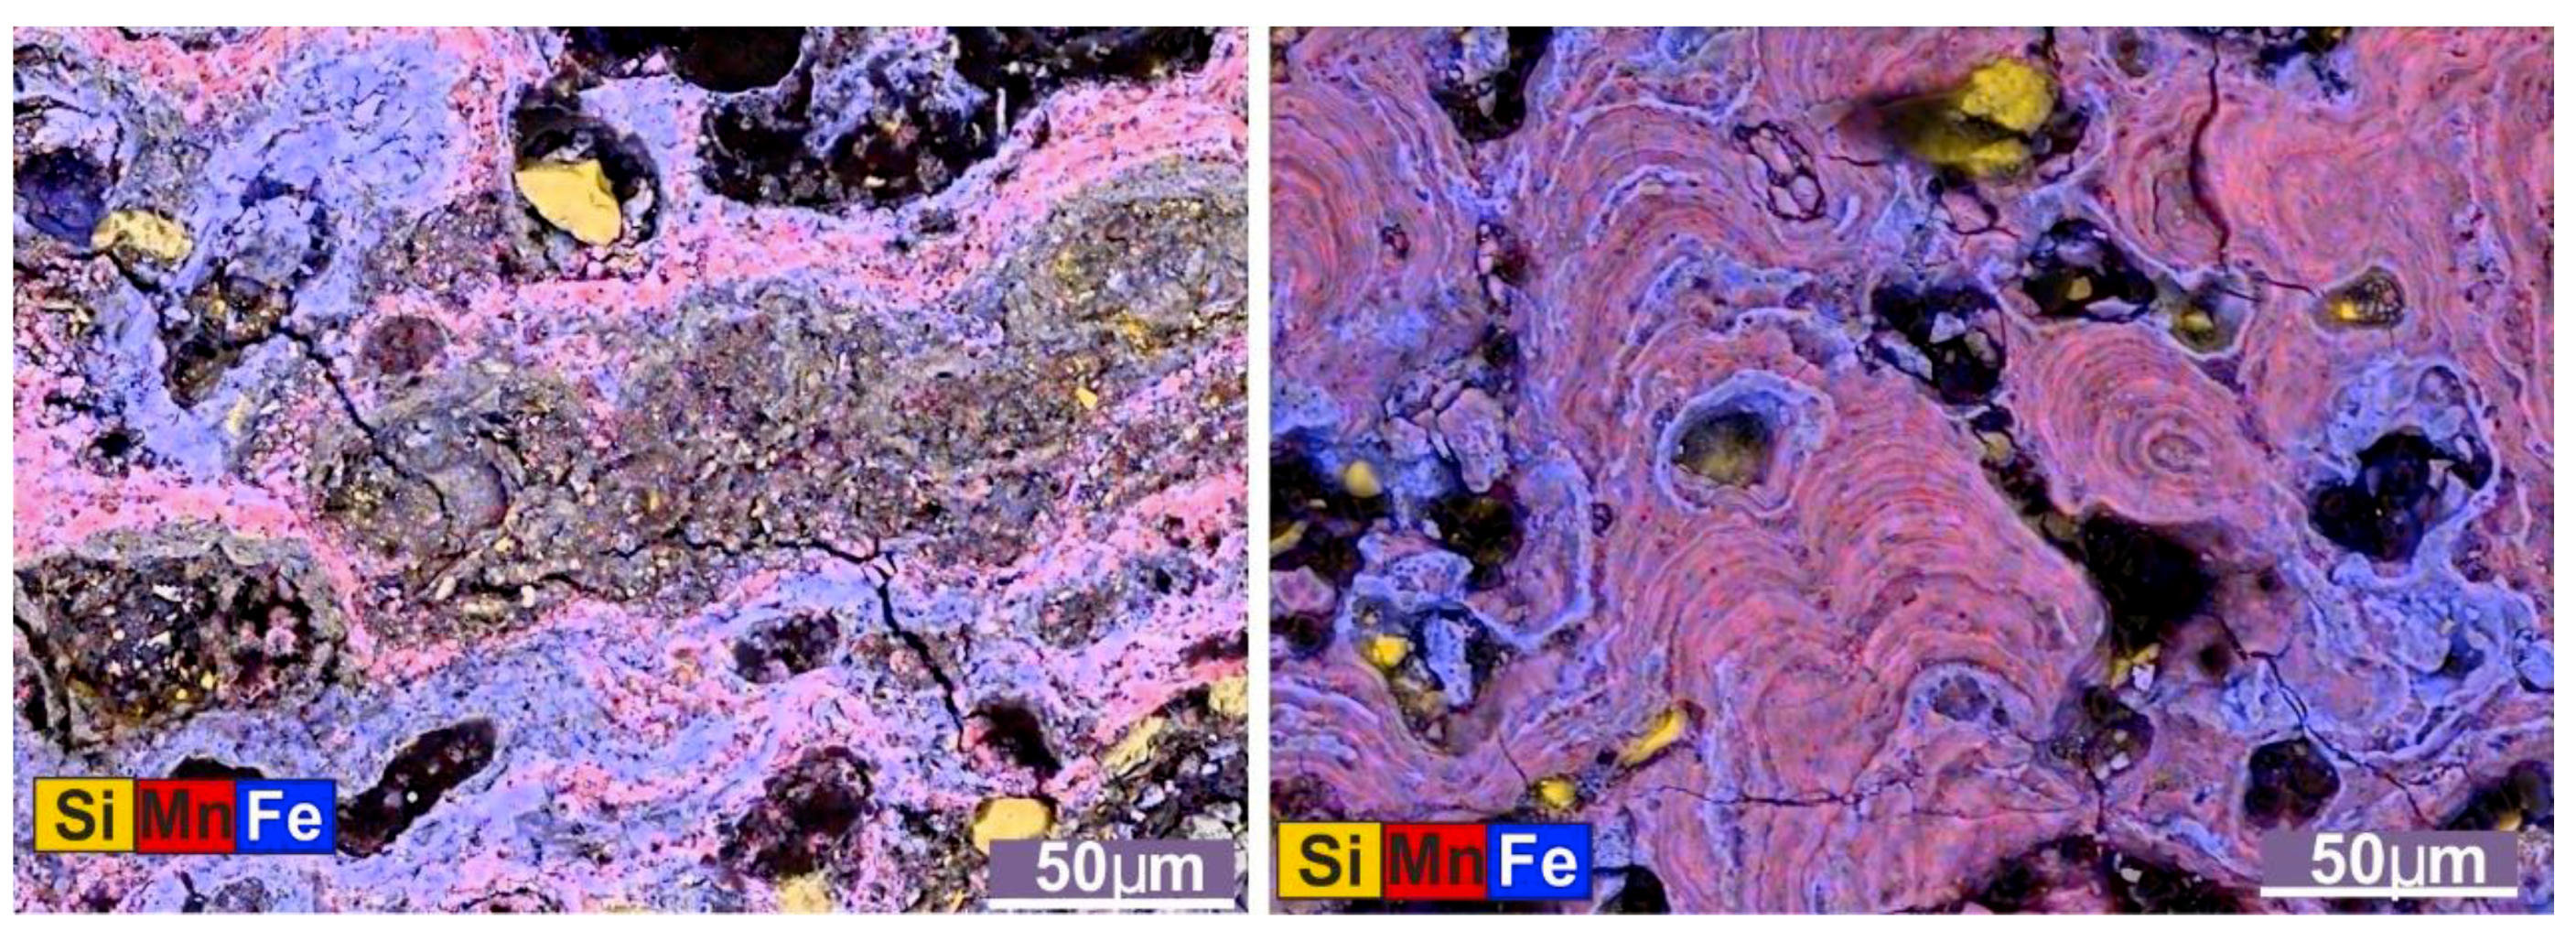
Iron mineral association. The iron mineral association was identified based on SEM images that exhibited a predominantly Fe composition. Generally, it occurs as rims around grains and therefore borders pore space and cracks, including voids created by the dissolution of plankton tests, usually foraminifers (
Figure 7 and
Figure S1). This iron oxide contains small amounts of Al, Si, Mn, Mg, Na, and P (
Table 5).
The correlation matrix for the iron mineral association shows that Fe has a significant positive correlation only with vanadium and significant negative correlations with Mg, Al, and Mn at the 95% CL (
Table S3).
The
detrital mineral association consists of sand-sized to micrometer-sized particles differing in roundness and composition that are associated with various genetic types of rocks [
2,
5]. The predominant detrital minerals in the crusts, characterized by different grain sizes, are quartz, feldspar, and apatite (up to 2 mm), and barite, ilmenite, zircon, monazite, rutile, baddeleyite, and chromite up to 0.1 mm. As a rule, the grains are angular; well-rounded minerals are not common [
2,
5].
3.3. Sequential Leaching
Samples were weighted before every leaching stage to determine leach phase mass percentages and losses in the course of the experiment (
Table S4). Losses ranged from 1.7 to 6.1% of the original sample weight. Phase 1, easily leachable (L1), comprises 3.3 to 24.2% of the total weight of the Arctic crusts, similar to Pacific crusts [
9]. The mean percent mass of leach 2 (L2), the Mn phase, is 26% for the Arctic crusts while the Pacific Ocean crusts show a much higher value of 44%. The mean percent mass of leach 3 (L3), the Fe phase, is 25%, and the remaining residual phase (L4) is 30% for Arctic Ocean crusts and 29% and 7% respectively for the Pacific Ocean crusts.
Twenty-three elements were measured in the four phases from the 13 crust samples. The elements were divided into six groups depending on their speciation and behavior in seawater (
Table 6) [
4,
9,
13,
14]. Based on the electrochemical model using pH of zero point of charge (pH
zpc), the surface charge of a solid phase under deep-ocean conditions (pH around 8.0) can be determined. The pH
pzc of vernadite is 2.8 [
15] and the pH
pzc of amorphous iron oxyhydroxide in freshwater is about 8.5 [
16]; thus a slightly positive charge is characteristic for the surface of amorphous FeOOH and strong negative charge for surface for MnO
2. Additionally, FeOOH may sorb neutral complexes in ocean water due to formation of chemical covalent bounds [
17].
Based on previous studies, elements of the first and second groups sorb mainly onto the Mn phase, which occur in ocean water as predominantly positively charged cations and carbonate complexes [
9]. The third and the fourth group elements associate mainly with the Fe phase but also in part with the Mn oxides. The letter two groups are represented by negatively charged complexes and occur in the Fe phase.
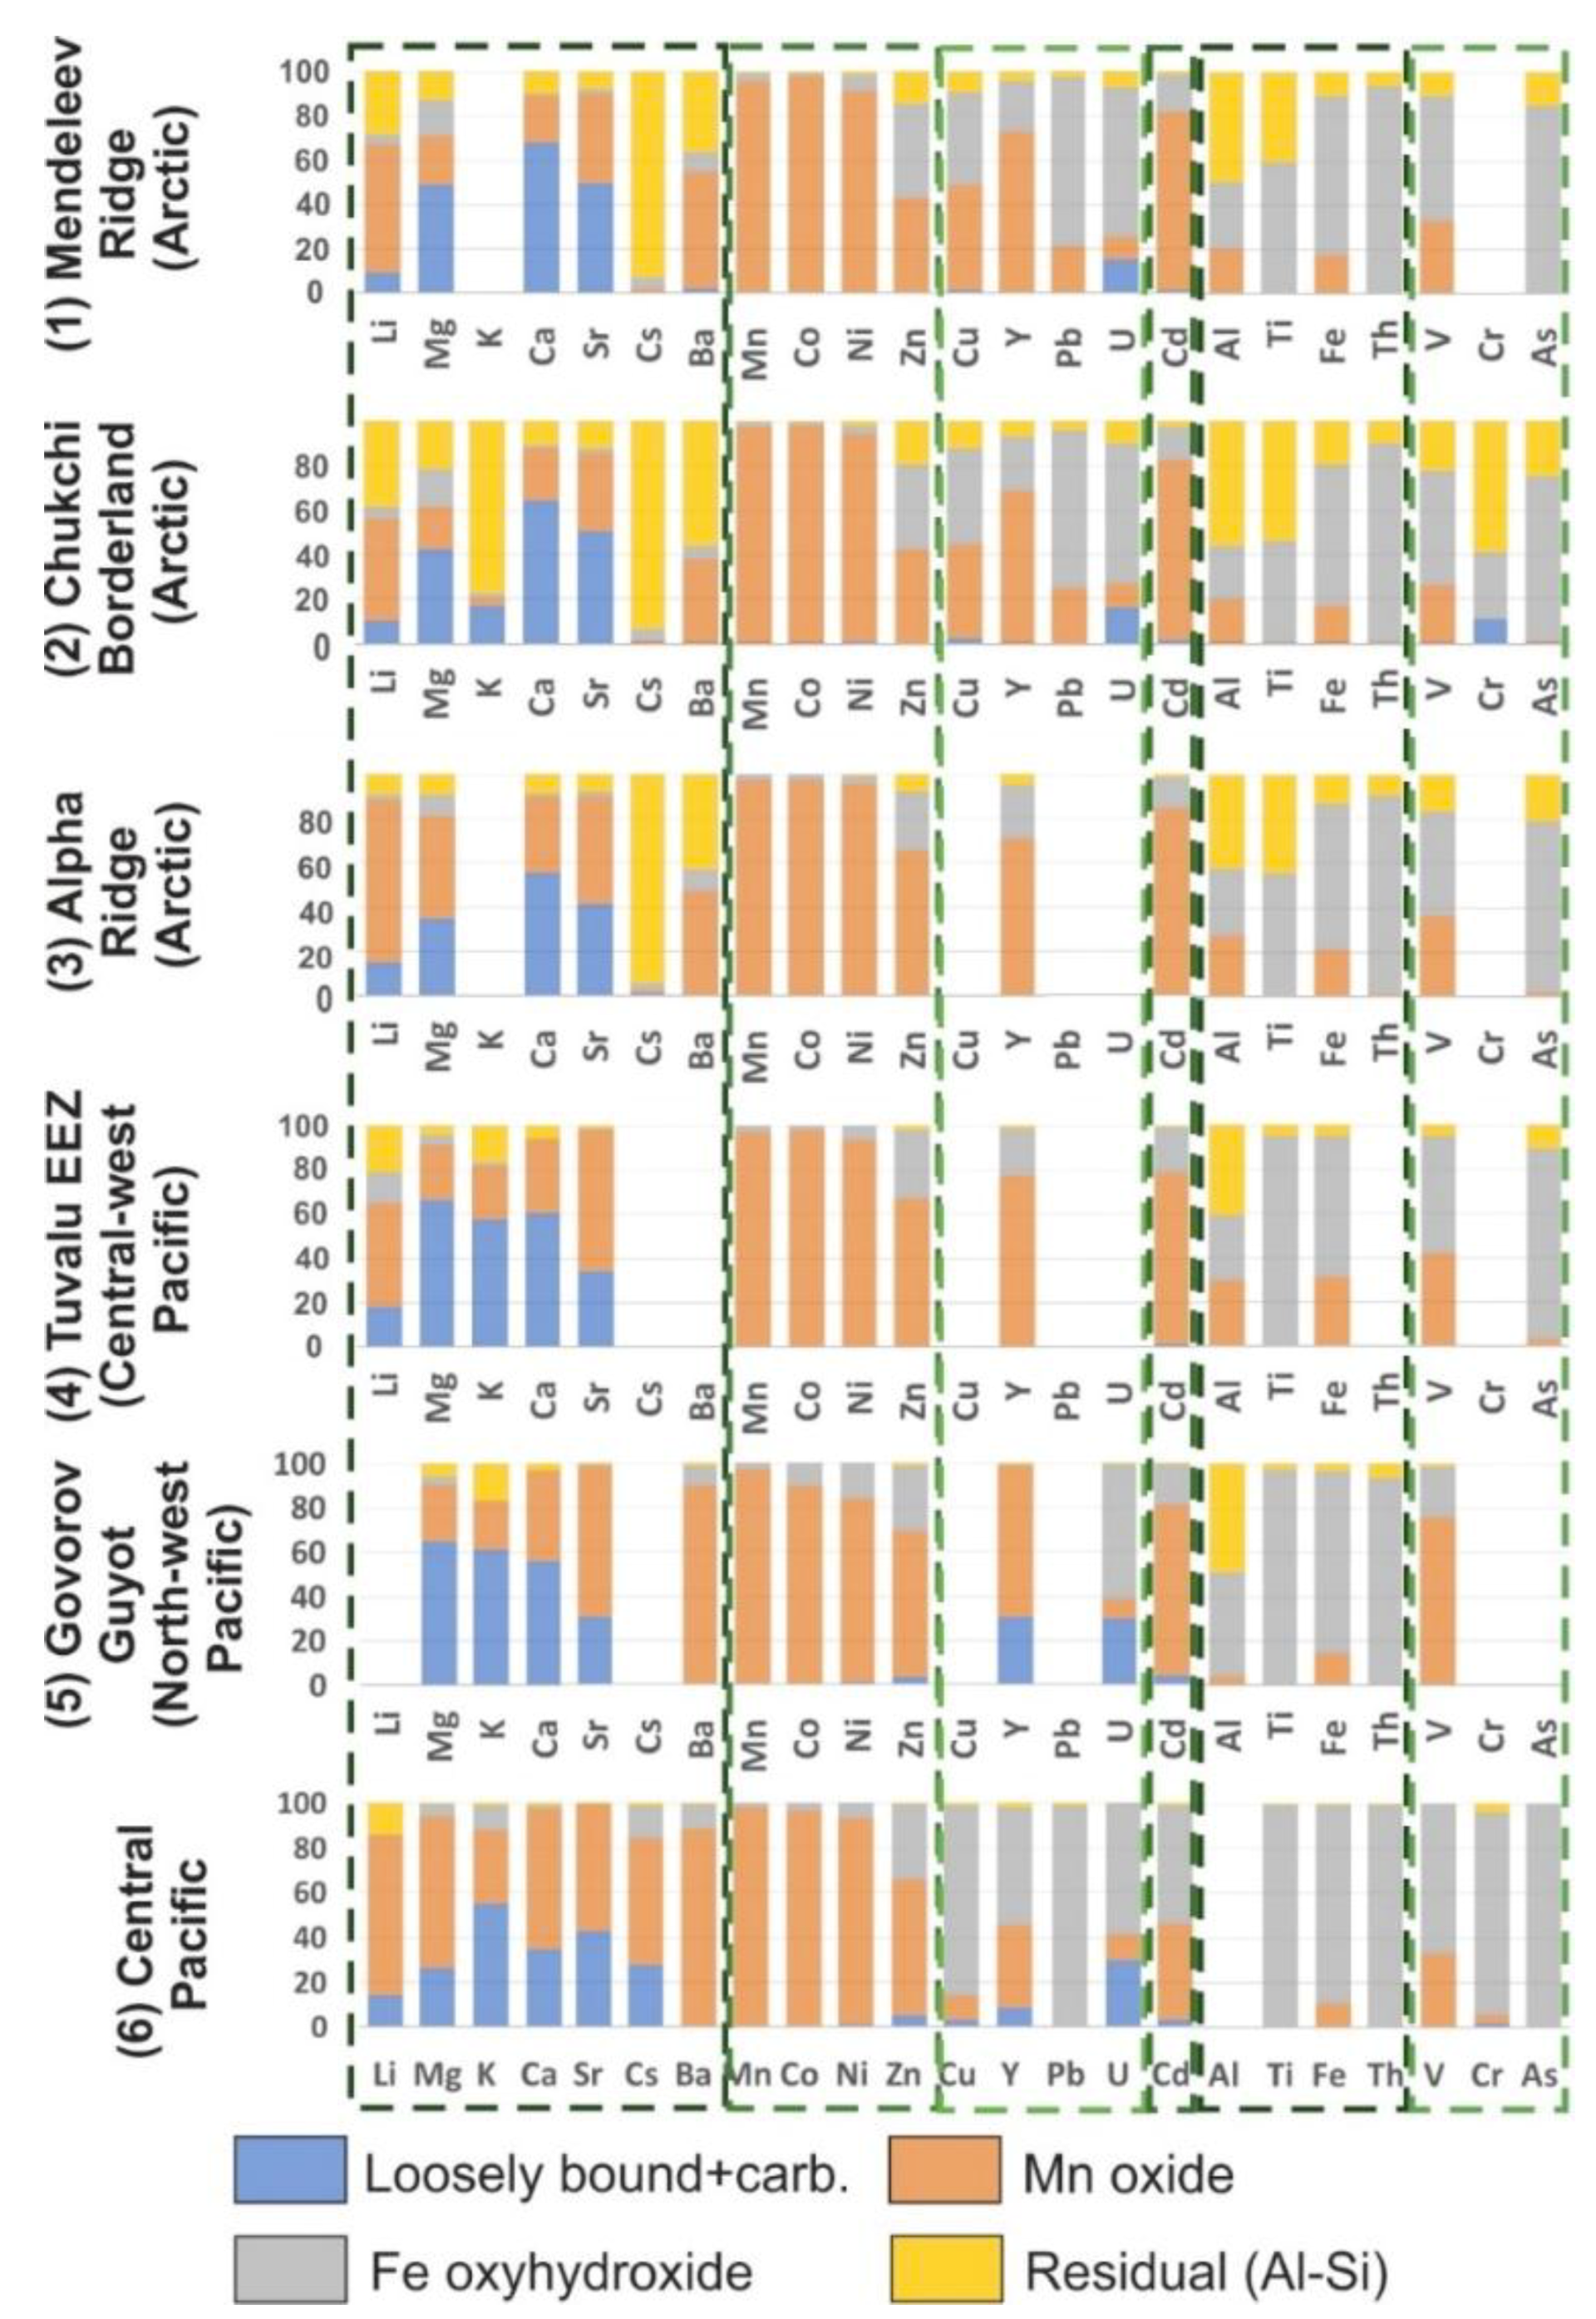
Mean element contents in the four leaches of the Mendeleev Ridge (1), Chukchi Borderland (2), and Alpha Ridge (3) are presented in
Figure 8. To compare our results with well-studied FeMn crust deposits, we leached two Pacific Ocean crusts (4) (Tuvalu area) and (5) Govorov Guyot crust; and data for (6) is a non-phosphatized crust layer from the central Pacific [
9]. Mean element associations in the four sequential leaches for only the MnO
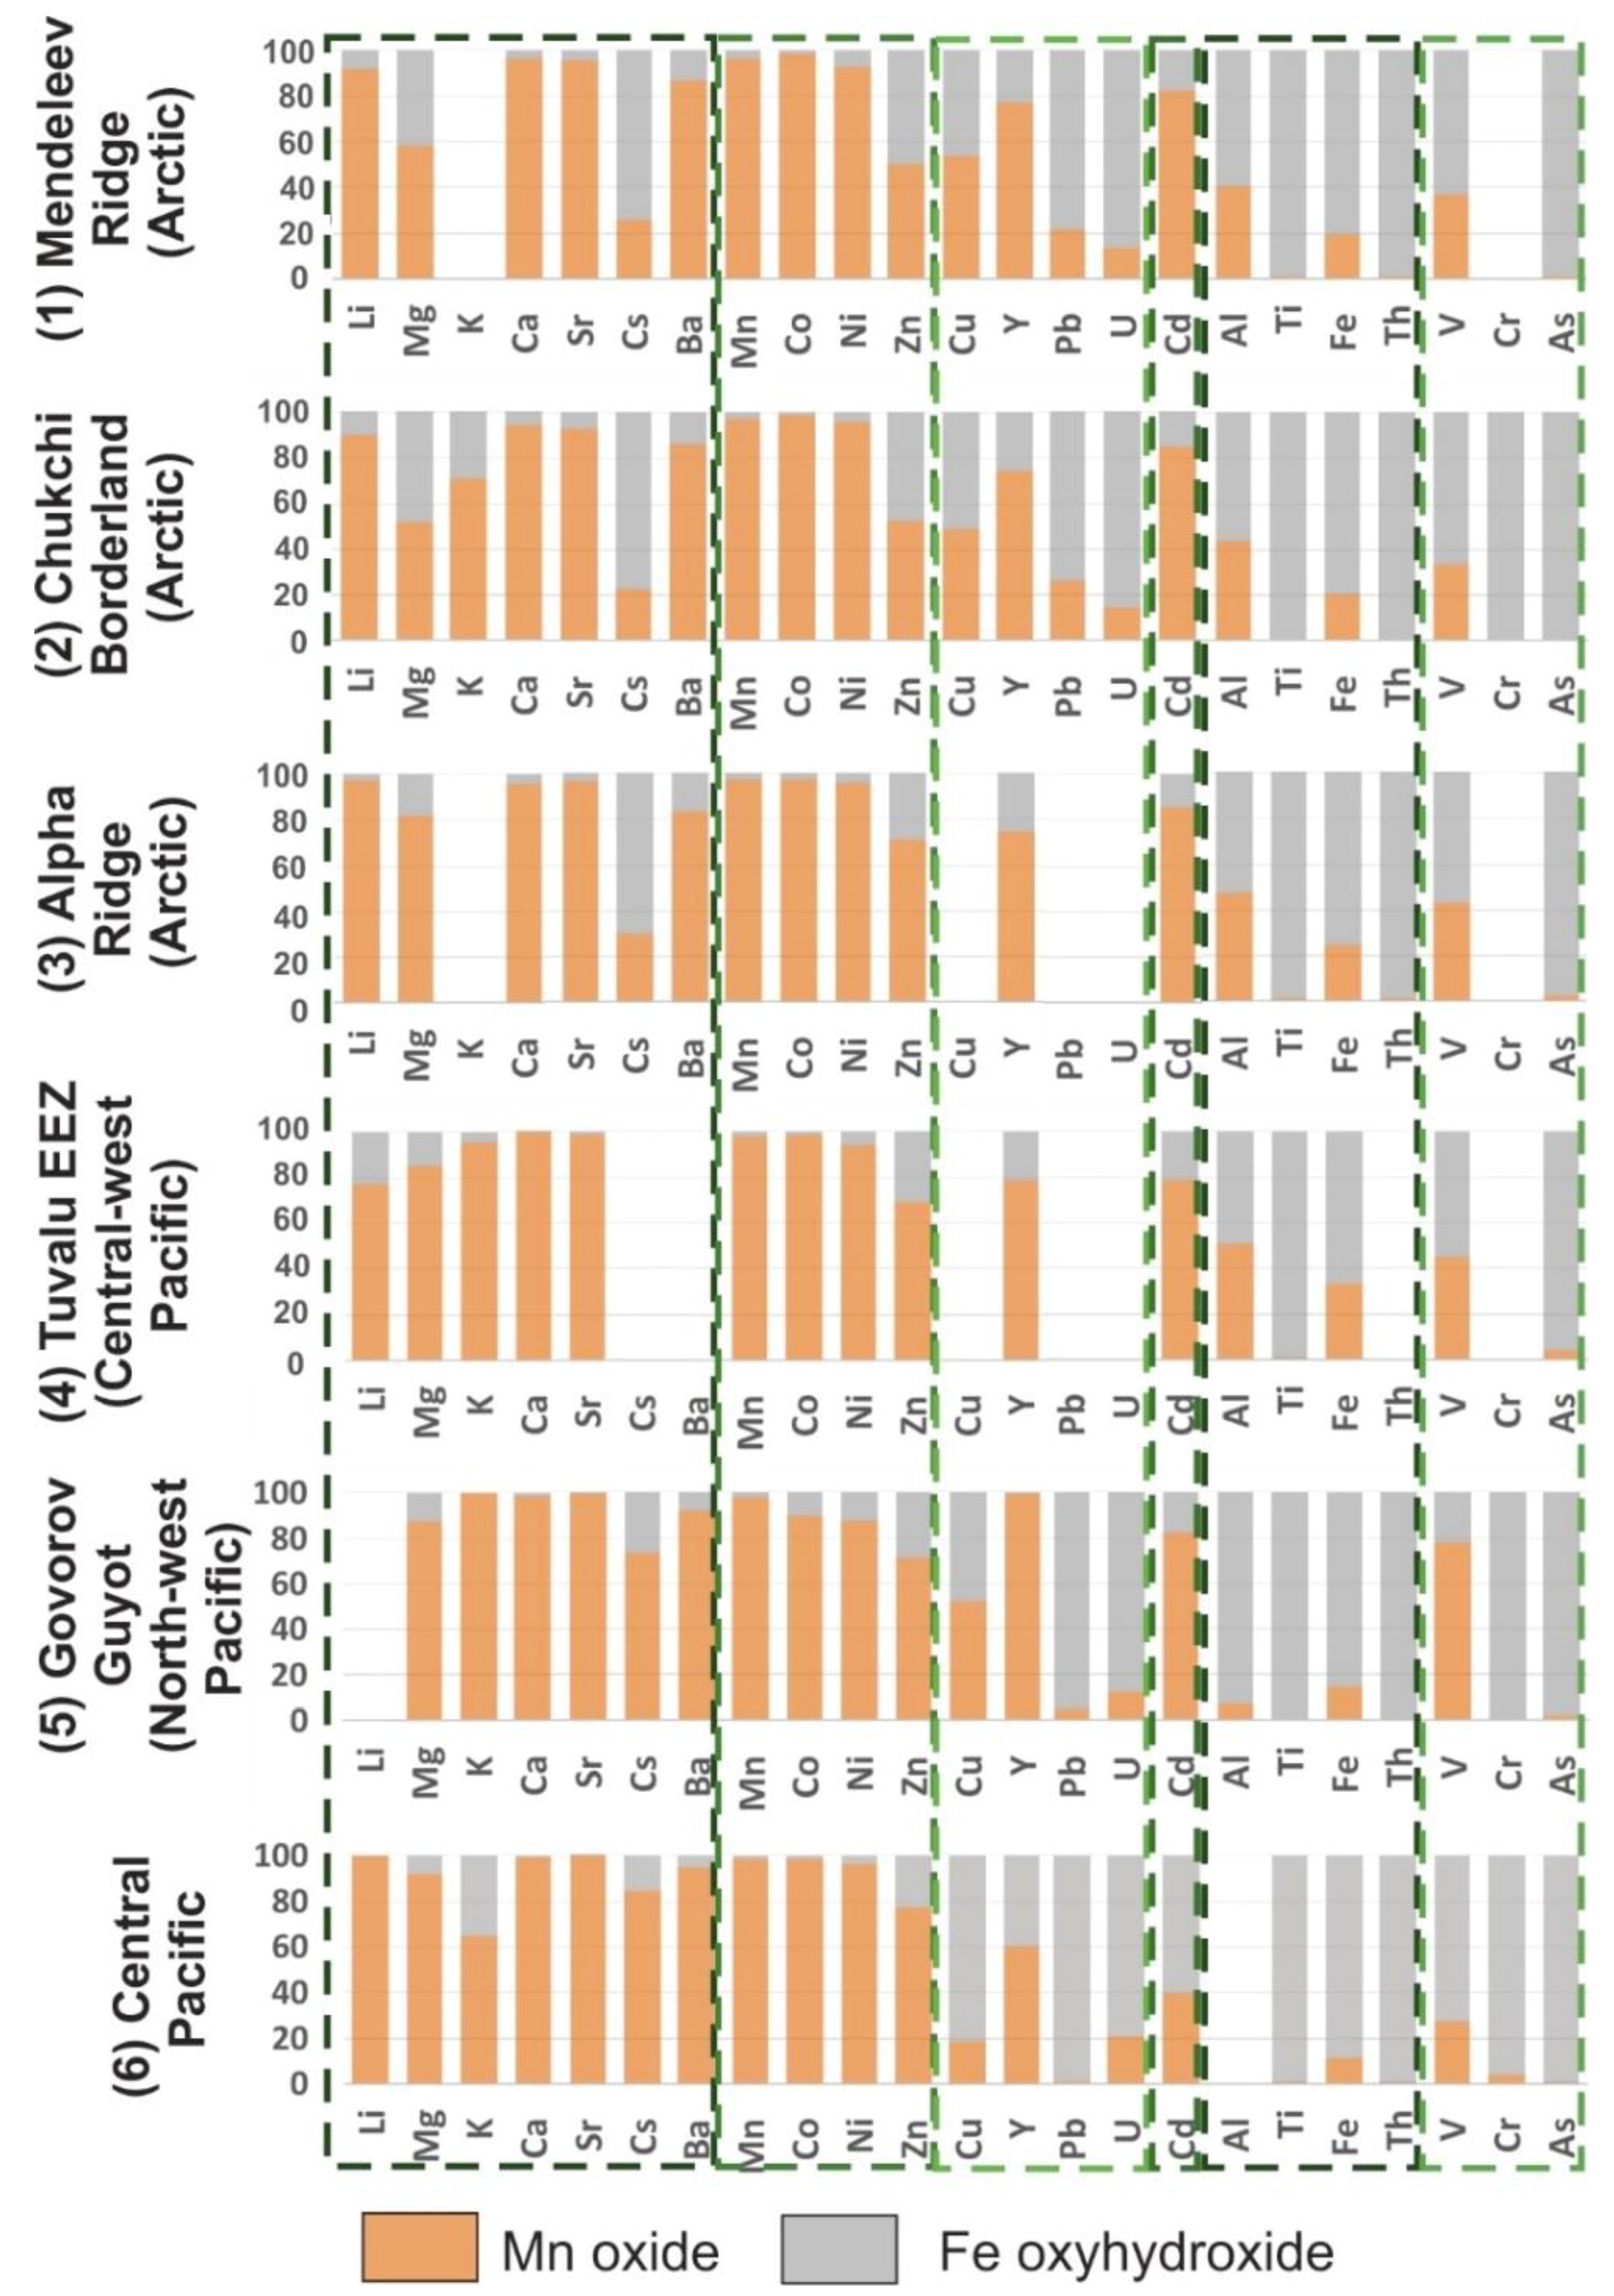
2 (L2) and FeOOH (L3) are in
Figure 9, and the complete set of sequential leaching results for the 13 samples are in the
Supplementary Materials (Table S5).
4. Discussion
Here, we integrate the results of the different experiments and analyses to understand the element distribution in the various FeMn crust phases and through the stratigraphic sections. LA-ICP-MS data through the stratigraphic sections show the top layer identified texturally has two sublayers (
Figure 3). The upper sublayer (surface) is characterized by maximum contents of Co, Th, and REE (except Ce), which include elements that sorb to either the Fe or Mn phase. However, Fe distribution differs from Th and has low contents for the surface sublayer. Our sequential leaching results show that about 98% of the Co is associated with the Mn oxides and about 91% of the Th with the Fe oxyhydroxides (
Figure 8 and
Figure 9). Thus, this temporal variability likely reflects changes in the seawater composition for those elements at the time of adsorption, and perhaps also the presence of variable amounts of Th-organic carbon export with time [
18]. The Th maximum content in the crusts surface sublayer was not observed in all the crusts, which indicates that local geological and oceanographic variations influenced Th behavior, such as pH, flux of organic matter, redox conditions, or variable rates of weathering of detritus [
2]. Sorption of Th ions to particle surfaces is strongly pH dependent, with cations generally showing increasing sorption with increasing pH, and anions showing increasing sorption with decreasing pH [
15]. Studies focused on organic ligand complexation of Th in natural waters in general indicate that Th forms strong complexes with humic acids [
19,
20,
21,
22]. Murphy [
23] used laboratory experiments to demonstrate that in the presence of humic acids Th(IV) sorption to hematite was greatly enhanced [
24]. Therefore, humic-like substances may play a role in Th cycling in the Arctic Ocean, e.g., [
25,
26].
Ce distribution is not similar to the other REE. Ce has different redox characteristics from the other REE under typical deep-ocean conditions and oxidizes after its sorption at the metal (hydr)oxide surface [
27,
28].
To understand the chemical and mineral compositions and element phase associations, it is important to model processes that occurred during sorption and also during secondary processes. The spot analyses found the iron mineral association, which formed rim cement on detritus and replaced carbonate tests. However, additional research is required to understand the impact of secondary changes on element associations and mineral and element concentrations in the Arctic FeMn crusts.
Processes related to the propensity for FeOOH to nucleate around detritus in the Arctic crusts, and in crusts elsewhere, are poorly known [
2]. Weathering products of the detrital grains, many of which contain Fe or Fe-bearing minerals, may have produced surfaces particularly conducive to Fe-hydroxide precipitation either through providing nuclei for precipitation or phases that catalyzed the reaction. Much of the detritus was composed of calcite fossil tests, especially foraminifers, which were dissolved and replaced by iron hydroxides on a fine scale (
Figure S1, Table S2). The surface of these foraminifera may be conducive to FeOOH precipitation because of the microtextures and microenvironments characteristic of foraminifera tests, and through the formation of metastable Fe phases during the replacement process. Alternatively, microbial films may have formed around the detrital grains, which then promoted precipitation of Fe(III) oxides, e.g., [
29]. The precipitated Fe hydroxide may then have been transformed to hematite-goethite through dehydration-maturation and recrystallization processes.
Hygroscopic water contents in the Arctic Ocean crusts is about half of what it is for crusts from other areas, presumably due to the lower specific surface area in Arctic crusts and large size of pores (
Figure 1). Large pores allow bottom water to slowly move through the crust pore system. Seawater containing Fe nanoparticles, perhaps transported via the “Fe-shuttle” from shelves by seaward currents [
30], might have supplied additional Fe that precipitated as rim cement, presumably ferrihydrite [Fe
3+4–5(OH,O)
12], creating some of the microlaminations noted to occur in the cements.
The high Fe/Mn ratios that characterize the Arctic Ocean FeMn crusts is discussed by Hein et al. [
2]. The high Fe/Mn ratios can be explained by the large fluvial input to the expansive continental shelves surrounding the Arctic Ocean, and element release through redox cycling in the sediments, which is the main source of the dissolved Fe. Furthermore, the water column oxygen minimum zone, enriched in dissolved Mn, is narrow and shallow in the Arctic Ocean, thereby being a key contributor to low Mn contents and high Fe/Mn ratios [
2].
4.1. Comparison of Crusts from Three Areas in the Amerasia Basin
In general, crusts from Mendeleev Ridge and Chukchi Borderland have similar element distributions, however, some elements show small differences (
Figure 8 and
Figure 9;
Table 7). Due to the higher detritus content of Chukchi crusts, there are higher element contents in the L4 aluminosilicate residual phase for most elements, especially Li, Mg, Ba, Zn, Al, Ti, Fe, Th, and As compared with other Arctic crusts (
Table 7). Some Mg, Al, Fe, Ba, and Li are housed in crust detritus in feldspar and mica minerals that occur in all the Arctic crusts [
2,
5]. Element distributions between the two hydrogenetic phases (MnO
2, L2 and FeOOH, L3) for crusts from Mendeleev Ridge and Chukchi Borderland are identical reflecting a uniform bottom-water chemistry for most elements in the Amerasia Basin.
The Alpha Ridge crust shows a somewhat different leaching distribution. The L4 aluminosilicate phase element contents of the Alpha Ridge crust are much less than for crusts from the other two locations, especially for Li, Mg, Zn, Al, Ti, Fe, and V (
Figure 8;
Table 7). Furthermore, element contents are generally higher in the Alpha Ridge MnO
2 L2 compared to crusts from the other Arctic areas (
Table 7). These differences in element distribution and detritus patterns reflect changes in local hydrological regimes, transportation mechanism and pathways, and sources of the detrital material in the Amerasia region. For example, Alpha Ridge is located father from the large Siberian continental shelves with huge fluvial input and element release from sediments through redox cycling. All these factors have a stronger influence for Mendeleev Ridge and Chukchi Borderland crusts than at Alpha Ridge. This is also noted by the Fe/Mn ratio of the Alpha crust, which is more similar to crusts from the Pacific Prime Crust Zone (
Figure 1).
4.2. Arctic and Pacific Oceans FeMn Crust Comparison
The sequential leaching experiments clearly show differences and similarities of phase element distributions for Amerasia Basin crusts, compared with Pacific crusts, and through time. The difference between Arctic and Pacific crusts will be discussed based on the element groups presented in
Table 6. As a whole, the element phase distributions in three crusts from the Pacific (Tuvalu area, Govorov Guyot, and Central Pacific) are similar to each other, except for differences in some alkali and alkaline earth metals and Y, Cd, and V, which might reflect the variable ratios of inorganic speciation and contributions from metal-organic complexes of the elements in ocean water from different regions of the Pacific Ocean (
Figure 8).
4.3. Alkali and Alkaline Earth Metals
This group of elements exhibits the most significant differences among the six groups of elements in distribution in the Arctic and Pacific crusts. However, a considerable fraction of these elements occurs in L1 of crusts from both oceans, represented by weakly bound hydrated cations and carbonates. The prominence of the residual L4 phase is uniquely high in the Arctic crusts and about 33% of the Li resides in that phase in the Arctic crusts while the west and central Pacific crusts have 21% and 14% Li in L4 respectively. But the Li distribution between the Mn and Fe phases are similar for all the crusts. Similar patterns in all the crusts are common for other members of the group such as K, Ca, Sr, and Ba. The distribution of Mg and Cs between the Mn and Fe phases shows a predominance for the L2 Mn-oxide leach for all the Pacific crusts, whereas the abundance of Cs and Mg is greatest in L3 Fe-oxyhydroxide leach in the Arctic crusts. Because of the different ocean-water composition and redox state where Arctic crusts formed [
2], different element complexes or ratios of element complexes may explain the differences.
4.4. Heavy Metals with Mixed Cationic Speciation
The phase distribution of elements in the Arctic Ocean crusts is generally similar to the Pacific samples. On average, 96% of the Mn and Co leach with the L2 Mn phase in Arctic crusts, consistent with the Pacific crust results. A difference is noted for the Zn distribution, with up to 20% in the Arctic crusts occurring in the L4 residual detritus, while the residual L4 phase of the Pacific crusts does not exceed 2% Zn. Inorganic Zn speciation in ocean water occurs as positively charged Zn
2+, ZnCl
+, and ZnOH
+ and as the neutral ZnCO
03 and ZnSO
0 [
9], although the majority of Zn in ocean water is organically complexed [
31]. Zn distribution between the Mn and Fe phases shows equal amounts in each phase from Mendeleev and Chukchi crusts, whereas approximately 71% is with the L2 Mn-phase leach of the Alpha Ridge and average Pacific crusts (
Figure 9). The Mn/Fe ratio of Mendeleev and Chukchi crusts are much higher than for Alpha Ridge and Pacific crusts, 2.6 versus 1.3. Thus, the higher amount of Zn in the Fe phase of Mendeleev and Chukchi crusts reflects higher FeOOH contents relative to MnO
2.
4.5. Metals Dominated by Carbonate Speciation
Like the alkali and alkaline earth metals, a large contribution of elements in leach L4 (
Figure 8) is noted for the Arctic crusts compared with Pacific crusts. It is also noteworthy that the residual L4 phase in the Chukchi crusts is generally higher than in the Mendeleev and Alpha ridges crusts, which is consistent with the location of the Chukchi crusts closest to the continental margin and the Mackenzie River outflow.
Inorganic copper in ocean water is dominated by Cu
2+ (20%) and CuCO
30 (80%) [
32]. Cu in the Chukchi and Mendeleev crusts occurs in the same amounts in the Mn and Fe phases, differing from the central Pacific crusts, where it occurs predominantly in the L3 Fe phase (85%). This may indicate a greater availability of Cu
2+ for sorption on the Mn phase in the Arctic crusts (
Figure 9) and variations in Cu-organic complexes in the oceans. Organic complexation of Cu in seawater is recognized to be an important determinant of its chemical and biological reactivity [
33]; and Cu may be strongly complexed with organic matter to water depths as great as 3000 m [
34].
In the Arctic crusts, Y is mainly associated with the Mn phase (~73%), due to its presence in seawater as YCO
3+ [
9] and up to 20% of the Y is sorbed by the Fe phase through the acquisition of negatively charged Y(CO
3)
2− Crusts from different areas of the central Pacific Ocean show different Y distributions in the L3 Fe and L2 Mn leaches, 52% versus 37% respectively (
Figure 8).
Pb in the Pacific crusts is predominantly associated with the L3 Fe phase and the Arctic crusts show about 73% in that phase and 22% of the Pb associated with the L2 Mn oxide. This may reflect the variations in the ratios of carbonate and chloro complexes in ocean water.
U occurs in seawater as different negatively charged complexes, UO
2(CO
3)
22−, UO
2(CO
3)
34– and UO
2(CO
3)
2(HO
2)
3− [
35] indicating that it should sorb mainly onto the Fe phase, which is consistent with our results for the Arctic and Pacific crusts. U occurs in the L1 easily soluble phase as well. Up to 10% of the U is supplied by the detritus in the Arctic crusts in comparison with Pacific crusts where L4 contains less than 1% U.
4.6. Metals forming Neutral or Negatively Charged Chloro Complexes
Cd occurs in seawater as CdCl
20, CdCl
+, and CdCl
3− [
9]. Cd in central Pacific crusts typically occurs in both the Fe and Mn phases, 43% and 52% respectively, because of its varied speciation [
9]. However, about 81% of Cd in the Arctic crusts is associated with L2 Mn phase. This relationship is interesting because of the high Fe/Mn ratios in Arctic crusts, which may indicate that the CdCl
+ speciation is favored in the deep Arctic Ocean. Cd is sorbed predominantly by the Mn phase in both northwest and central-west Pacific crusts as well.
4.7. Metals Dominated by Hydroxide Speciation
Al has a similar phase distribution for all Arctic crusts and the Pacific Tuvalu crust, mostly associated with the L4 residual detritus (40–56%), and about equal amounts in the Mn and Fe phases (
Figure 9).
Other metals dominated by hydroxide speciation, such as Ti, Fe, and Th, are more enriched in the L4 residual aluminosilicate phase for Arctic crusts compared to Pacific crusts. For example, only 4% of the Ti in the Pacific crusts is present in the residual phase (L4) while for the Arctic crusts Ti in L4 averages 48%. Koschinsky and Hein [
9] suggested that Ti distribution between the Fe (L3) and residual (L4) phases may reflect crust genesis, such that the hydrogenetic component is marked by Ti in the Fe phase, while hydrothermal and diagenetic components would increase Ti in the residual phase. However, the high Ti associated with the detritus (L4) in the Arctic crusts is inherent in the nature of the detrital minerals, which differ significantly from those found in Pacific Ocean crusts; hydrothermal and diagenetic components apparently do not to occur in the Arctic crusts [
2,
5]. Except for the residual L4 phase, Ti occurs only in the L3 Fe phase because of its speciation in seawater as Ti(OH)
4 and TiO(OH)
2, and its chemical similarity with Fe. In contrast, 97% of Ti occurs in the L3 Fe phase for all the Pacific crusts.
In Arctic crusts, Fe occurs mostly in the L3 Fe phase, but up to 19% in the L4 detritus and up to 20% in L2 Mn phase, typically as Fe-vernadite. The Pacific crusts Mn phase contains about 12% of the Fe and residual phase up to 4% of the Fe.
Inorganic Th is speciated in seawater dominantly as Th(OH)40 hence it sorbs on the Fe phase; 90% is in the L3 leach for the Arctic and Pacific crusts. About 10% of the Th in Arctic crusts is in the L4 detritus. However, the Th content in the Arctic crusts is five times higher than it is in the Pacific crusts, suggesting Th enrichment is not only due to high contents of detrital material, but also by its adsorption in crusts with high Fe/Mn ratios.
4.8. Elements Forming Oxyanions
Elements dominated by negatively charged complexes are typically sorbed on the Fe phase, thus Arctic and Pacific crusts have predominantly similar oxyanion distribution between the Mn and Fe phases (
Figure 9). However, due to the much higher L4 detrital component in the Arctic crusts, there is also much stronger oxyanion enrichment in L4 in Arctic crusts than in the Pacific crusts.
Dissolved, redox-sensitive V in ocean water occurs predominantly as HVO
42− [
36] although it can take other anionic and neutral forms and therefore is sorbed mainly on the Fe phase; small but unquantified amounts of cationic complexes also occur in seawater, e.g., [
37]. All the Arctic and Pacific crusts show a mean of ~30% of the V in the L2 Mn leach, except the Govorov Seamount crust, where V was leached mainly (75%) with the Mn phase. For an additional comparison, a crust from the NE Atlantic Ocean shows 22% of the V with the Mn phase (L2), and 77% with Fe (L3) [
9]. The cause of such variable amounts (22–75%) of V with the Mn oxide is unknown. High V in L2 implies a lower oxidation potential of the fluid during precipitation of the crust. More reduced fluids can reflect higher productivity in surface waters, or circulation of reduced fluids in the seamounts that reflect hydrothermal circulation created during a rejuvenation stage volcanism, or release of pressurized fluids during tectonic events [
38,
39,
40], including at Govorov Guyot [
41]. Productivity as a cause of high V is supported by high V in L2 (71% of the V) in phosphatized crusts formed during suboxic paleoceanographic events [
9]. Higher productivity may also have promoted formation of metal-organic complexes that favored sorption on the Mn oxide. On the other hand, hydrothermal Mn oxides formed from reduced fluids in the North Fiji Basin show 79–82% of the V with the Mn oxide L2; those deposits have very low Fe contents [
9]. In all these cases, the events would have likely been short lived compared to the growth rates typical of crusts and would have influenced the composition of only extant laminae formation, <1–2 mm, perhaps longer for a series of productivity cycles. A further possibility is variable co-precipitation of V with the Mn oxides, which would avoid the conflict of particle surface charge and sorbed ion charge being the same, such as was proposed for Te, e.g., [
42].
Up to 59% of the Cr in the Arctic crusts occurs in the L4 detrital material, a marked difference compared to the central Pacific crusts where 89% of Cr occurs in the L3 Fe phase and less than 2% in the L4 residual phase. In addition, Arctic crusts contain approximately 11% of the Cr in the L1 easily soluble phase, which has not been observed for Pacific crusts. The remaining part was leached with L3 Fe hydroxides (L3) in the Arctic crusts, probably acquired from ocean water as CrO
32− speciation [
43].
About 15% of As from the Mendeleev crusts, 20% from Alpha crusts, and 24% from the Chukchi crusts are associated with the L4 residual phase and the rest in the L3 Fe phase, while 99% of As in the Pacific crusts occurs in the L3 Fe phase [
9], again reflecting the large detritus component in the Arctic crusts.
4.9. Temporal Differences
The temporal differences in element distributions in layers of Amerasia Basin hydrogenetic crusts, along with comparisons with the Pacific crusts, are shown in
Figure 10. The Mn, Co, and Ni contents in the Pacific crusts are much higher than in the Arctic crusts (
Figure 1), however, the phase distributions of Mn, Co, and Ni are the same for the crusts, therefore only the Mn pattern is presented as being representative (
Figure 10). The increase of Mn concentration with time is observed in trends for all the Arctic crusts. Mn, Co, and Ni phase distributions are identical for crusts from different oceans and for different Arctic crust layers, dominated by acquisition by the Mn phase.
Ti and Pb contents are relatively low throughout the Arctic crusts compared to Pacific crusts (
Figure 1 and
Figure 10). For both Arctic and global crusts, Ti concentrations change little in different crust layers. Pb contents in layers increase dramatically with time in the Mendeleev Ridge crusts (
Figure 10), however this is not the case with Chukchi Borderland samples, for which the phase distribution does not vary, being distributed between the Mn (~23%) and Fe phases (~74%).
Elements marked by high contents in the Arctic crusts (Al, Li, As, Th, V) are shown in
Figure 10. Al and Li contents decrease up section (with time) from the bottom layer (oldest) due to a decrease of detritus (L4). However, all leaches (L1–4) of the Arctic crusts exhibit higher Al and Li concentrations than those of Pacific crusts. The high Li concentration observed for a nodule sample (10/1) from Mendeleev Ridge is typical for nodules with a diagenetic component [
11].
Arsenic and Th occur in the Fe and residual phases (L3, 4). Arsenic contents increase from the bottom layer to the middle layer, where it reaches its maximum content (
Figure 10). Th maximum content increased with time, sorbed predominantly by L3 Fe phase, rather than in the residual L4 detritus. Vanadium does not show a characteristic distribution in the layers and occurs in three phases showing differences mostly in the Fe phase with time.
Previous studies showed that the total detritus extracted by leaching for the Arctic crust layers show a maximum content in the bottom layers, the minimum typically in the middle layer, and intermediate content in the top layer [
44], which is consistent with total Si contents [
2,
5]. Total Al contents decrease continuously with time, showing variations in the ratio of Si-rich to Al-rich detritus. In addition, the middle layer has a much smaller amount of detritus grains larger than 0.2 mm [
44].
Thus, based on the total element content and the phase distribution in each layer, we suggest that the most significant factors associated with chemical differences in the crust layers are change in the mineralogy and total content of detrital material, which relate to the supply and the sources of the detritus and reflect different hydrological regimes with time [
44].
The total content of elements predominantly sorbed by the hydrogenetic Mn phases (Mn, Co, and partially V) increased with time due to the detrital content decreasing and the Mn content increasing with time (
Figure 10). Pb, As, Th, and V, elements mostly associated with Fe phase, change with the Fe content; the Arctic crusts show the maximum Fe content in the middle layers [
2,
5]. Exceptions exist for Th and Pb in Mendeleev Ridge crusts, which show maximums in the upper layer, consistent with LA-ICP-MS results displaying the highest Th content in the surface sublayer (
Figure 3). Pb distribution requires additional studies, but appears to have a similar distribution with Th. The total content of elements delivered by detritus (like Al, Li) decreased with time (
Figure 10), although Ti had a different behavior, with no variation in total content with time, but changed in phase distribution with time reflecting decreasing detritus supply and increasing sorption on the iron phase.
5. Conclusions
FeMn crusts from the Amerasia Basin of the Arctic Ocean have similar chemical compositions but differ from hydrogenetic deep-ocean crusts from the Pacific Ocean by having relatively high Fe/Mn and low Si/Al ratios, and enrichments of As, Li, V, Sc, and Th, as well as lower contents of sorbed water. Also, a relatively pure Fe-rich cement was determined using SEM-EDS, which is unique to Arctic crusts. It occurs as rims around detrital grains, as well as replaces the organic relicts and consists predominantly of Fe-hydroxides. This interesting mineral association warrants further study into its genesis and effect on trace metal distributions.
One of the most significant features that controlled the layered structure of the Arctic crusts is the high detritus component, which originated from different sources and changed with time [
2,
5]. The residual L4 leach detritus of the Arctic crusts has higher contents of most elements analyzed than does L4 for the Pacific crusts. The Chukchi crusts display the greatest influence of L4 detritus among the Arctic crusts.
Elements have similar distributions between the hydrogenetic Mn and Fe phases in all the Arctic and Pacific crusts. Based on the sequential leaching experiments, elements that are enriched in the Arctic crusts (As, Th, V, and Li) are characterized by higher contents in the residual L4 phase in comparison with the Pacific crusts. However, the main phases that host these elements are the Fe and Mn (L2, 3) phases. Thus, 18% of As and 10% of Th are housed by the detritus with the remainder associated with the Fe hydroxides (L3). Vanadium occurs in three main phases: 30% in Mn-oxide phase (L2), 50% in Fe-hydroxide phase (L3), and 20% in residual aluminosilicate phase (L4). Li occurs 50% in the Mn phase and 30% in the residual detritus (L4). The maximum Li content occurs in a nodule from the northern part of Mendeleev Ridge, where Mn oxides host about 80% of the Li; this may reflect a diagenetic input. These data indicate that the main phases of element associations are hydrogenetic, like the Mn phase for Li and the Fe phase for As, Th, and V. It follows that higher concentrations of Li, As, Th, and V must occur in the dissolved and particulate phases in bottom waters where the Arctic crusts grow, which has been shown to be the case for Sc in these same Arctic crusts (Hein et al., 2017).

 ,
, 


