Distribution and Characteristics of Nanotubular Halloysites in the Thach Khoan Area, Phu Tho, Vietnam

 ,
,
Abstract
1. Introduction
2. Materials and Methods
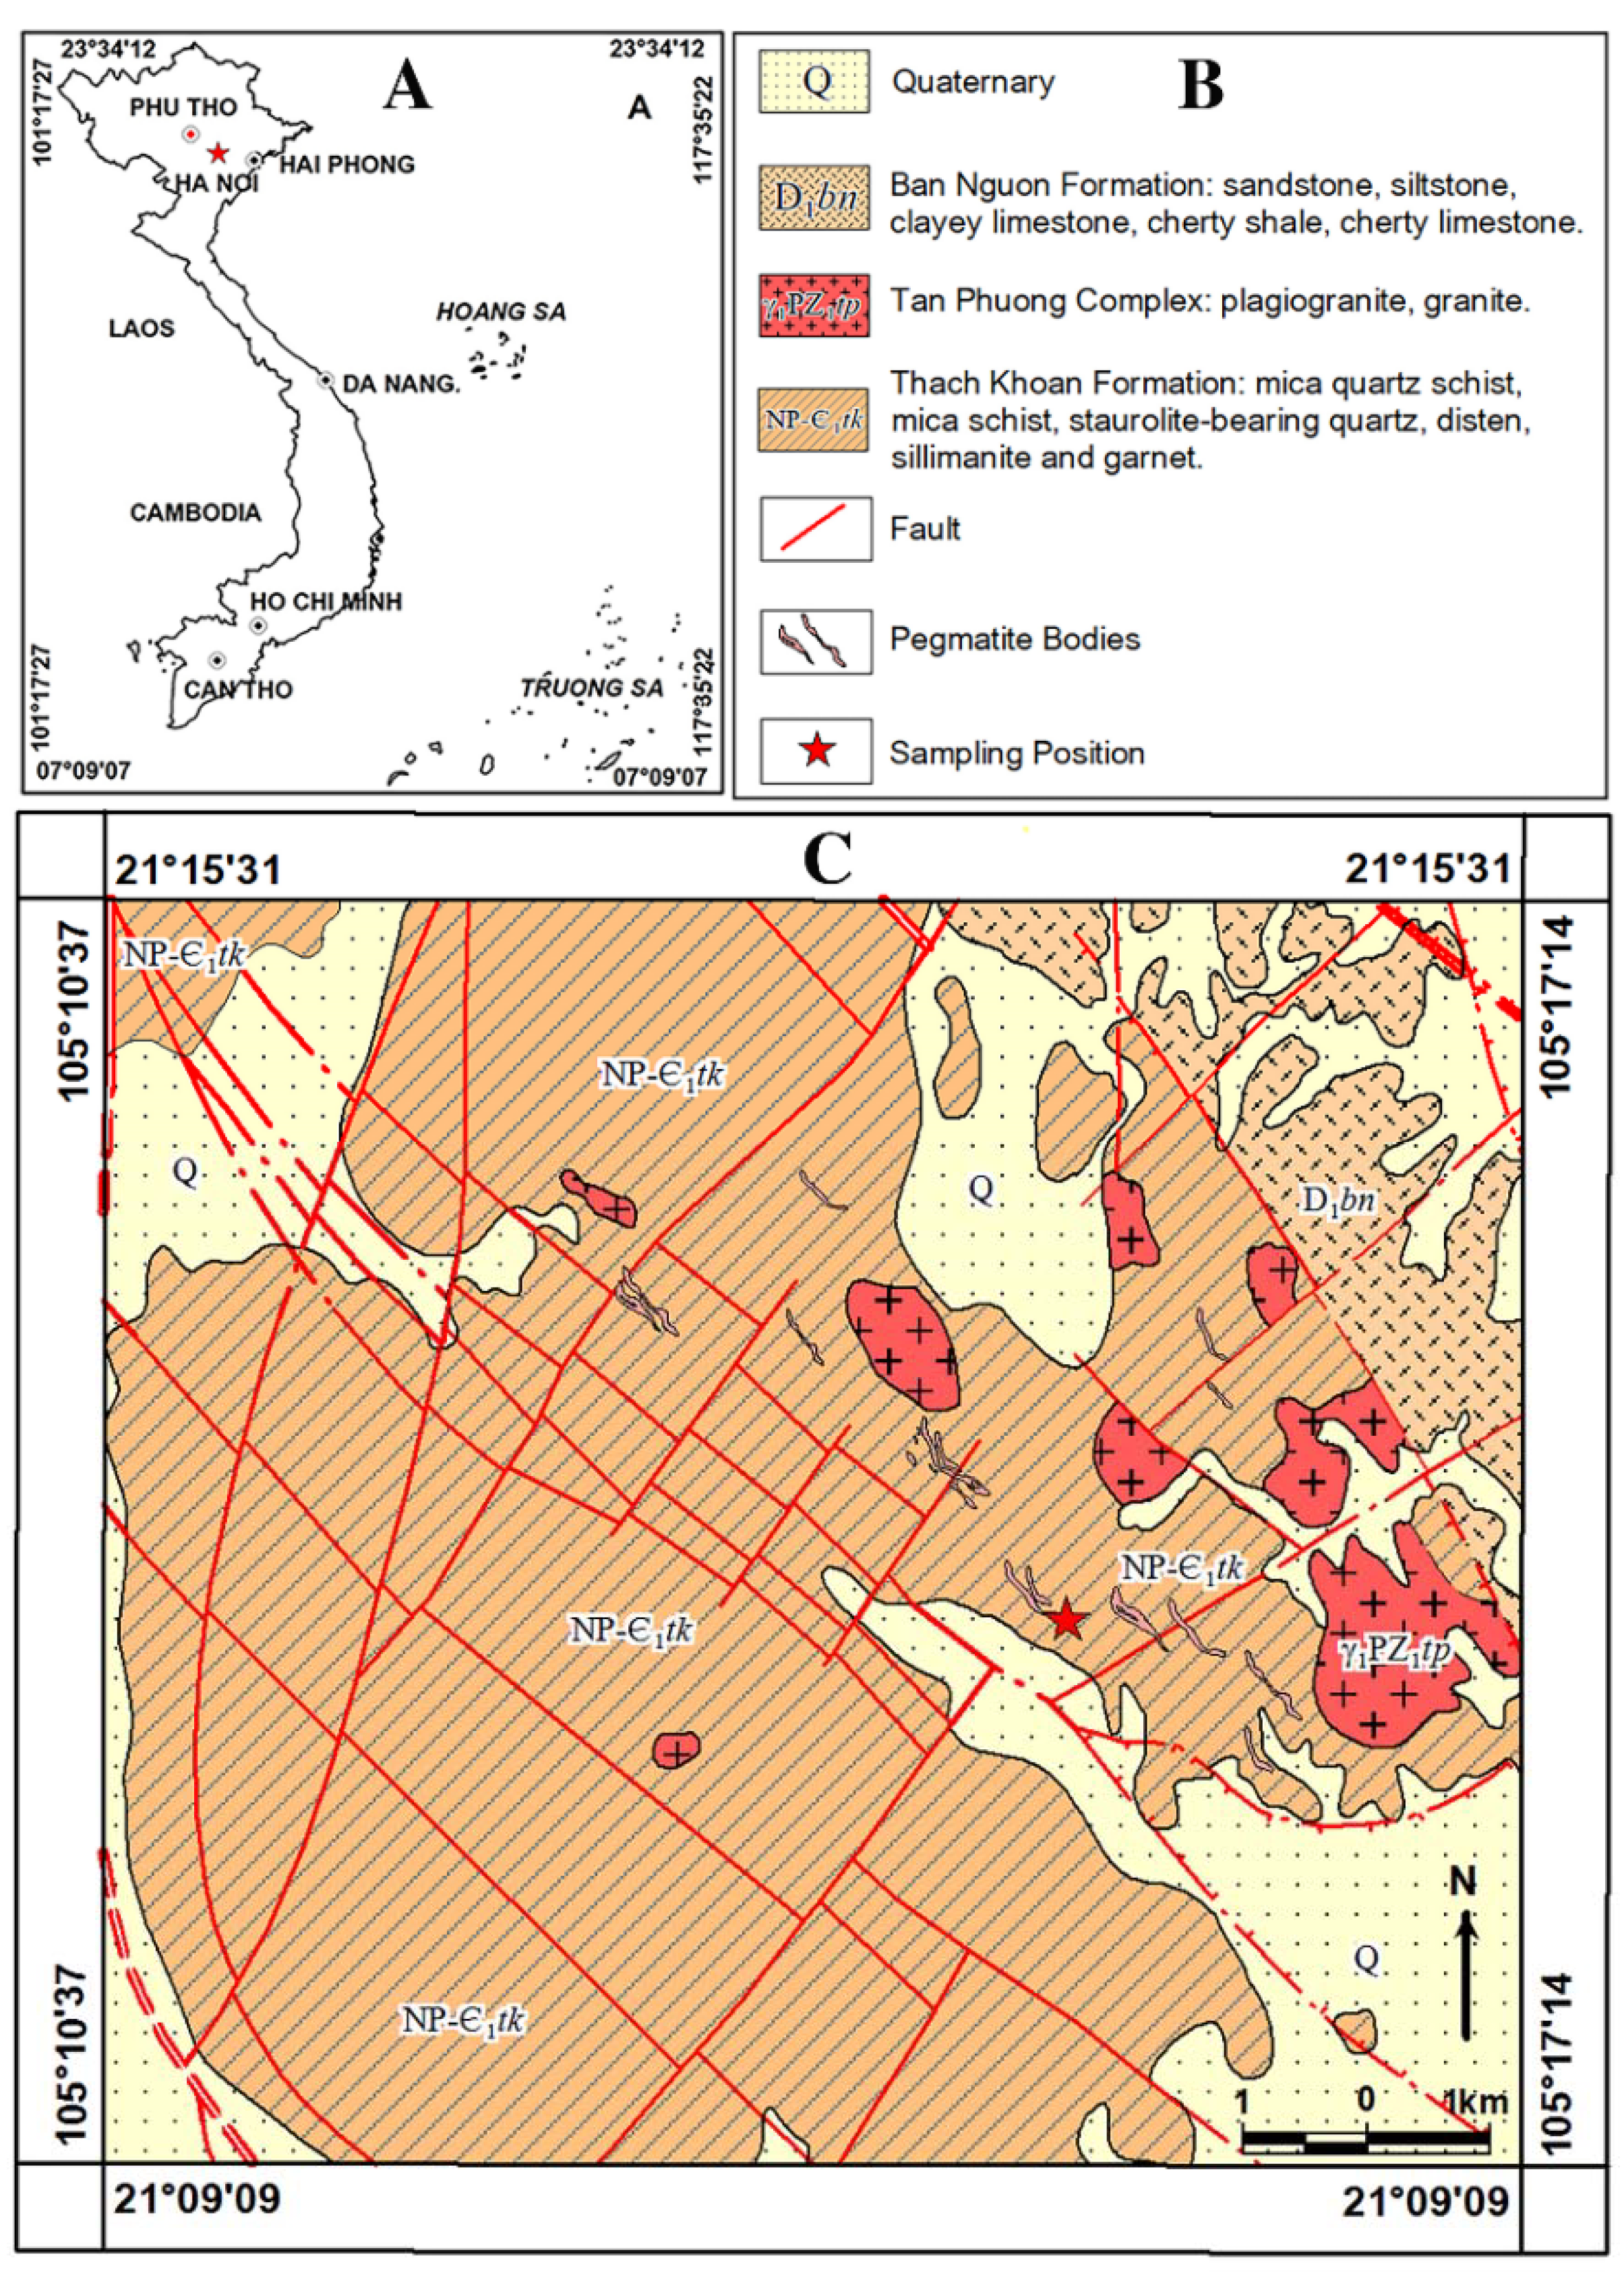
2.1. General Geological Setting of Study Area
2.2. Samples
2.3. Characterization
3. Results and Discussion
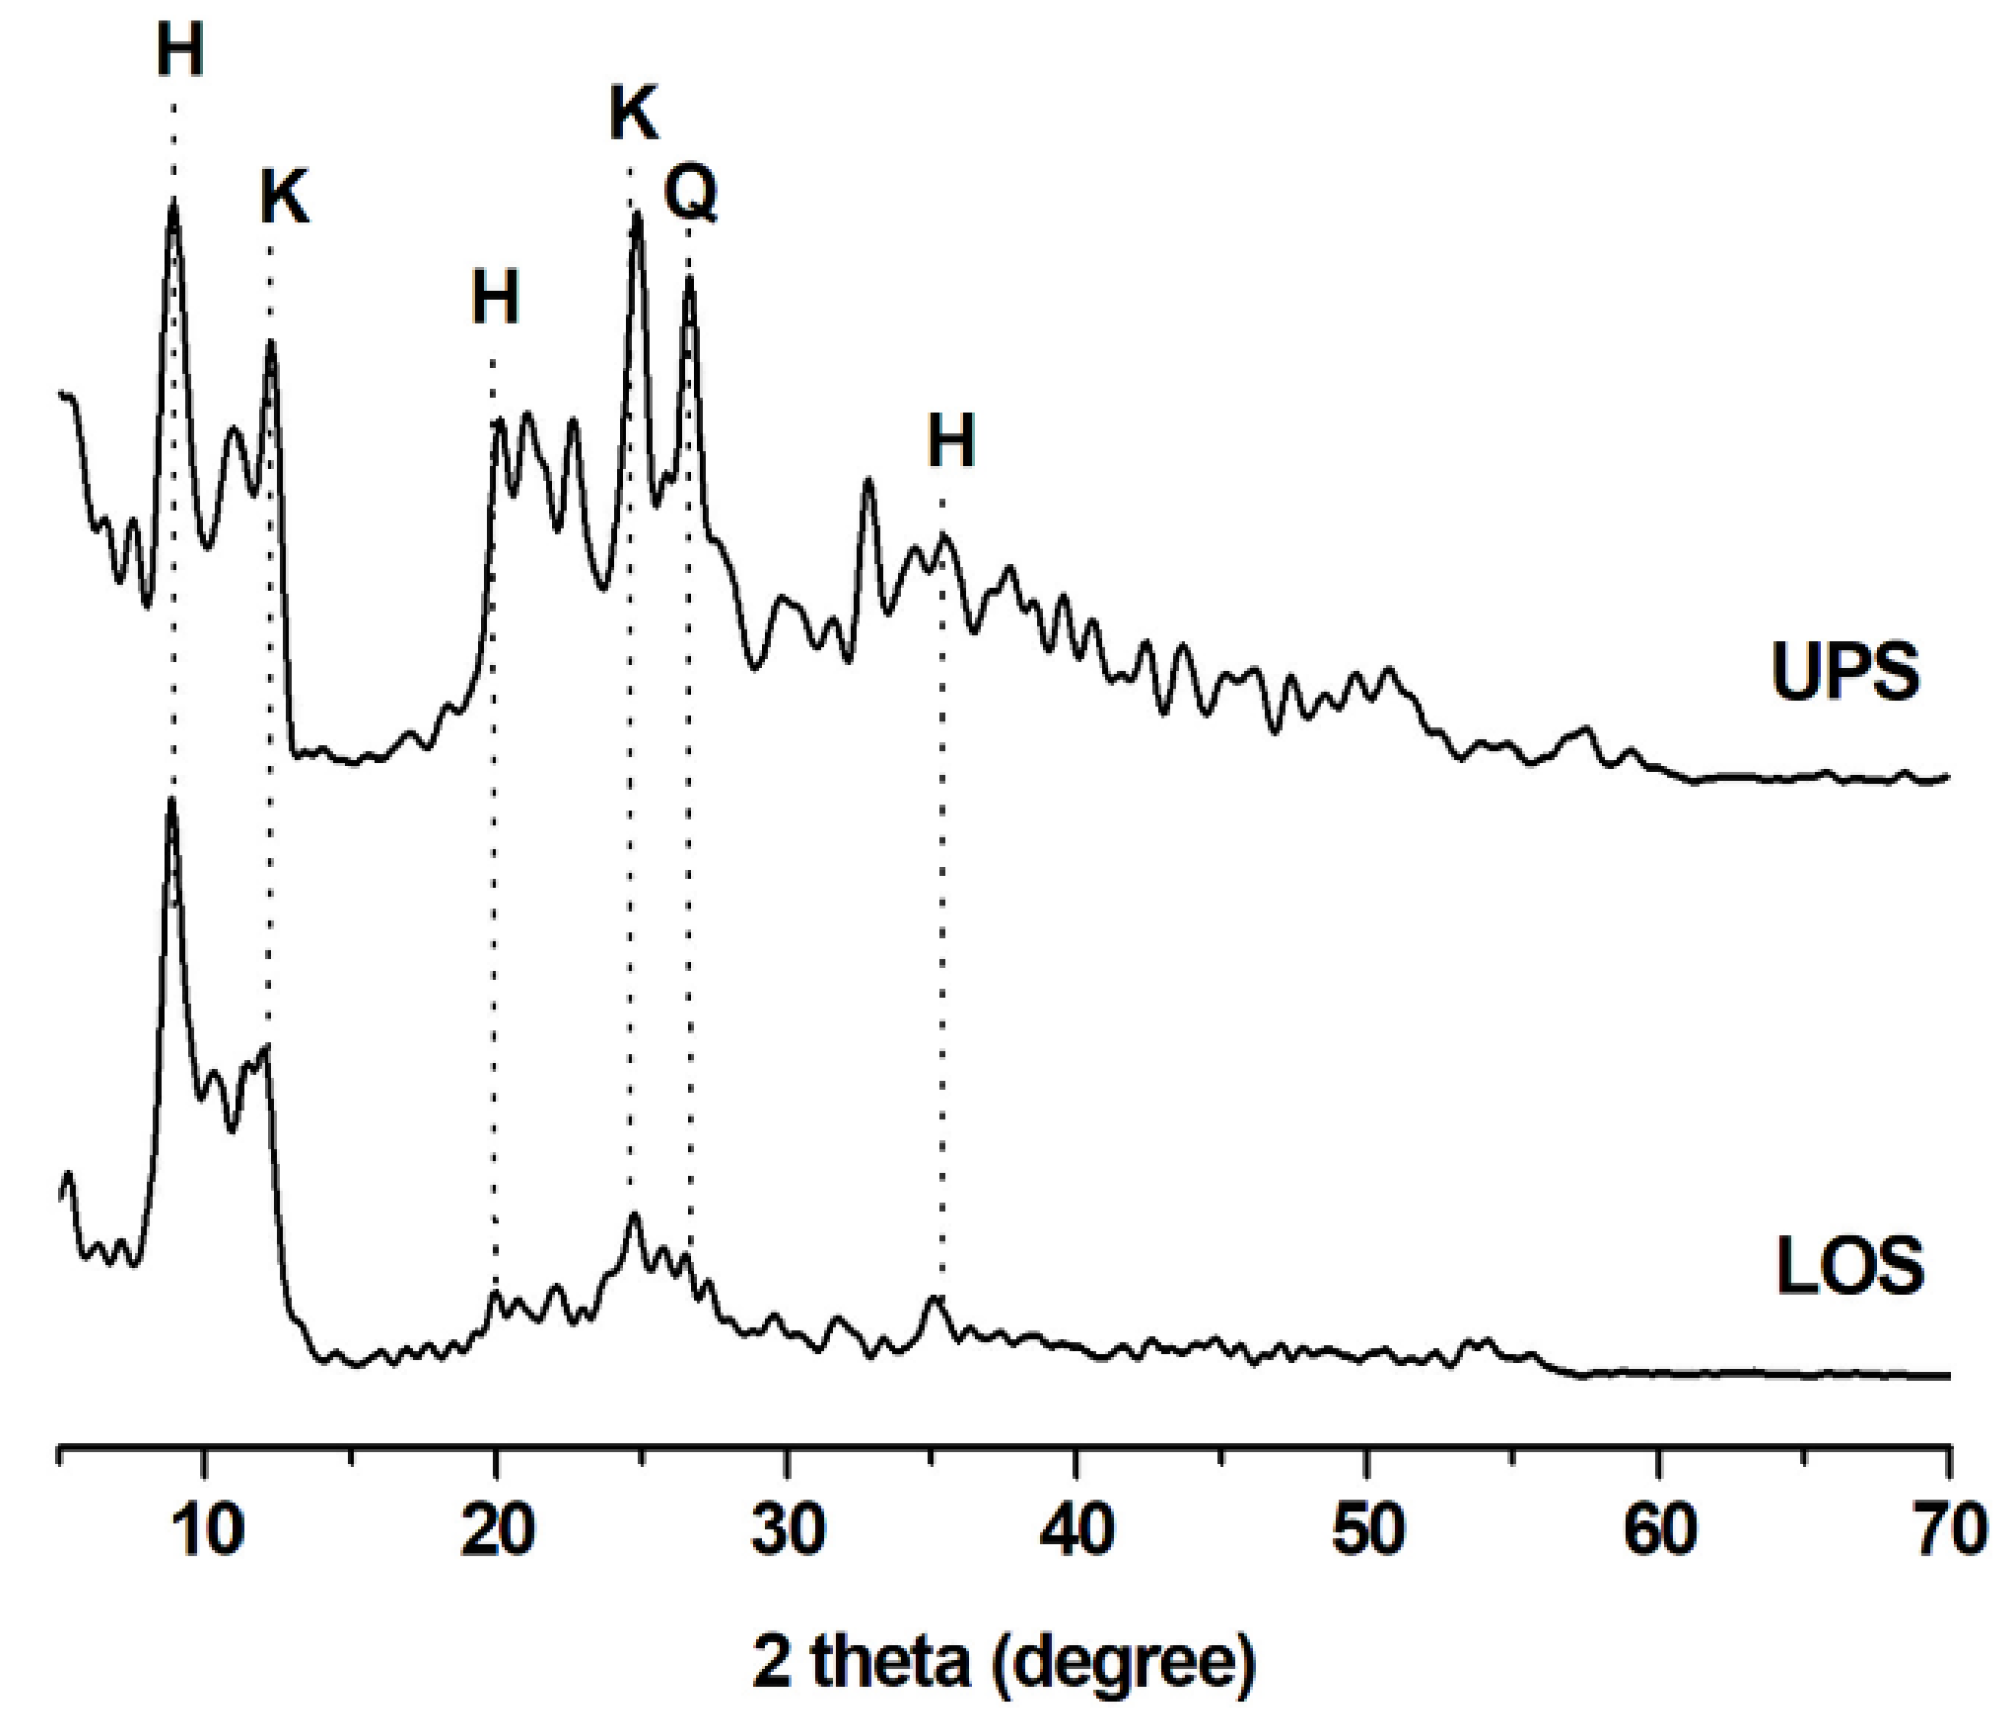
3.1. XRD Analysis
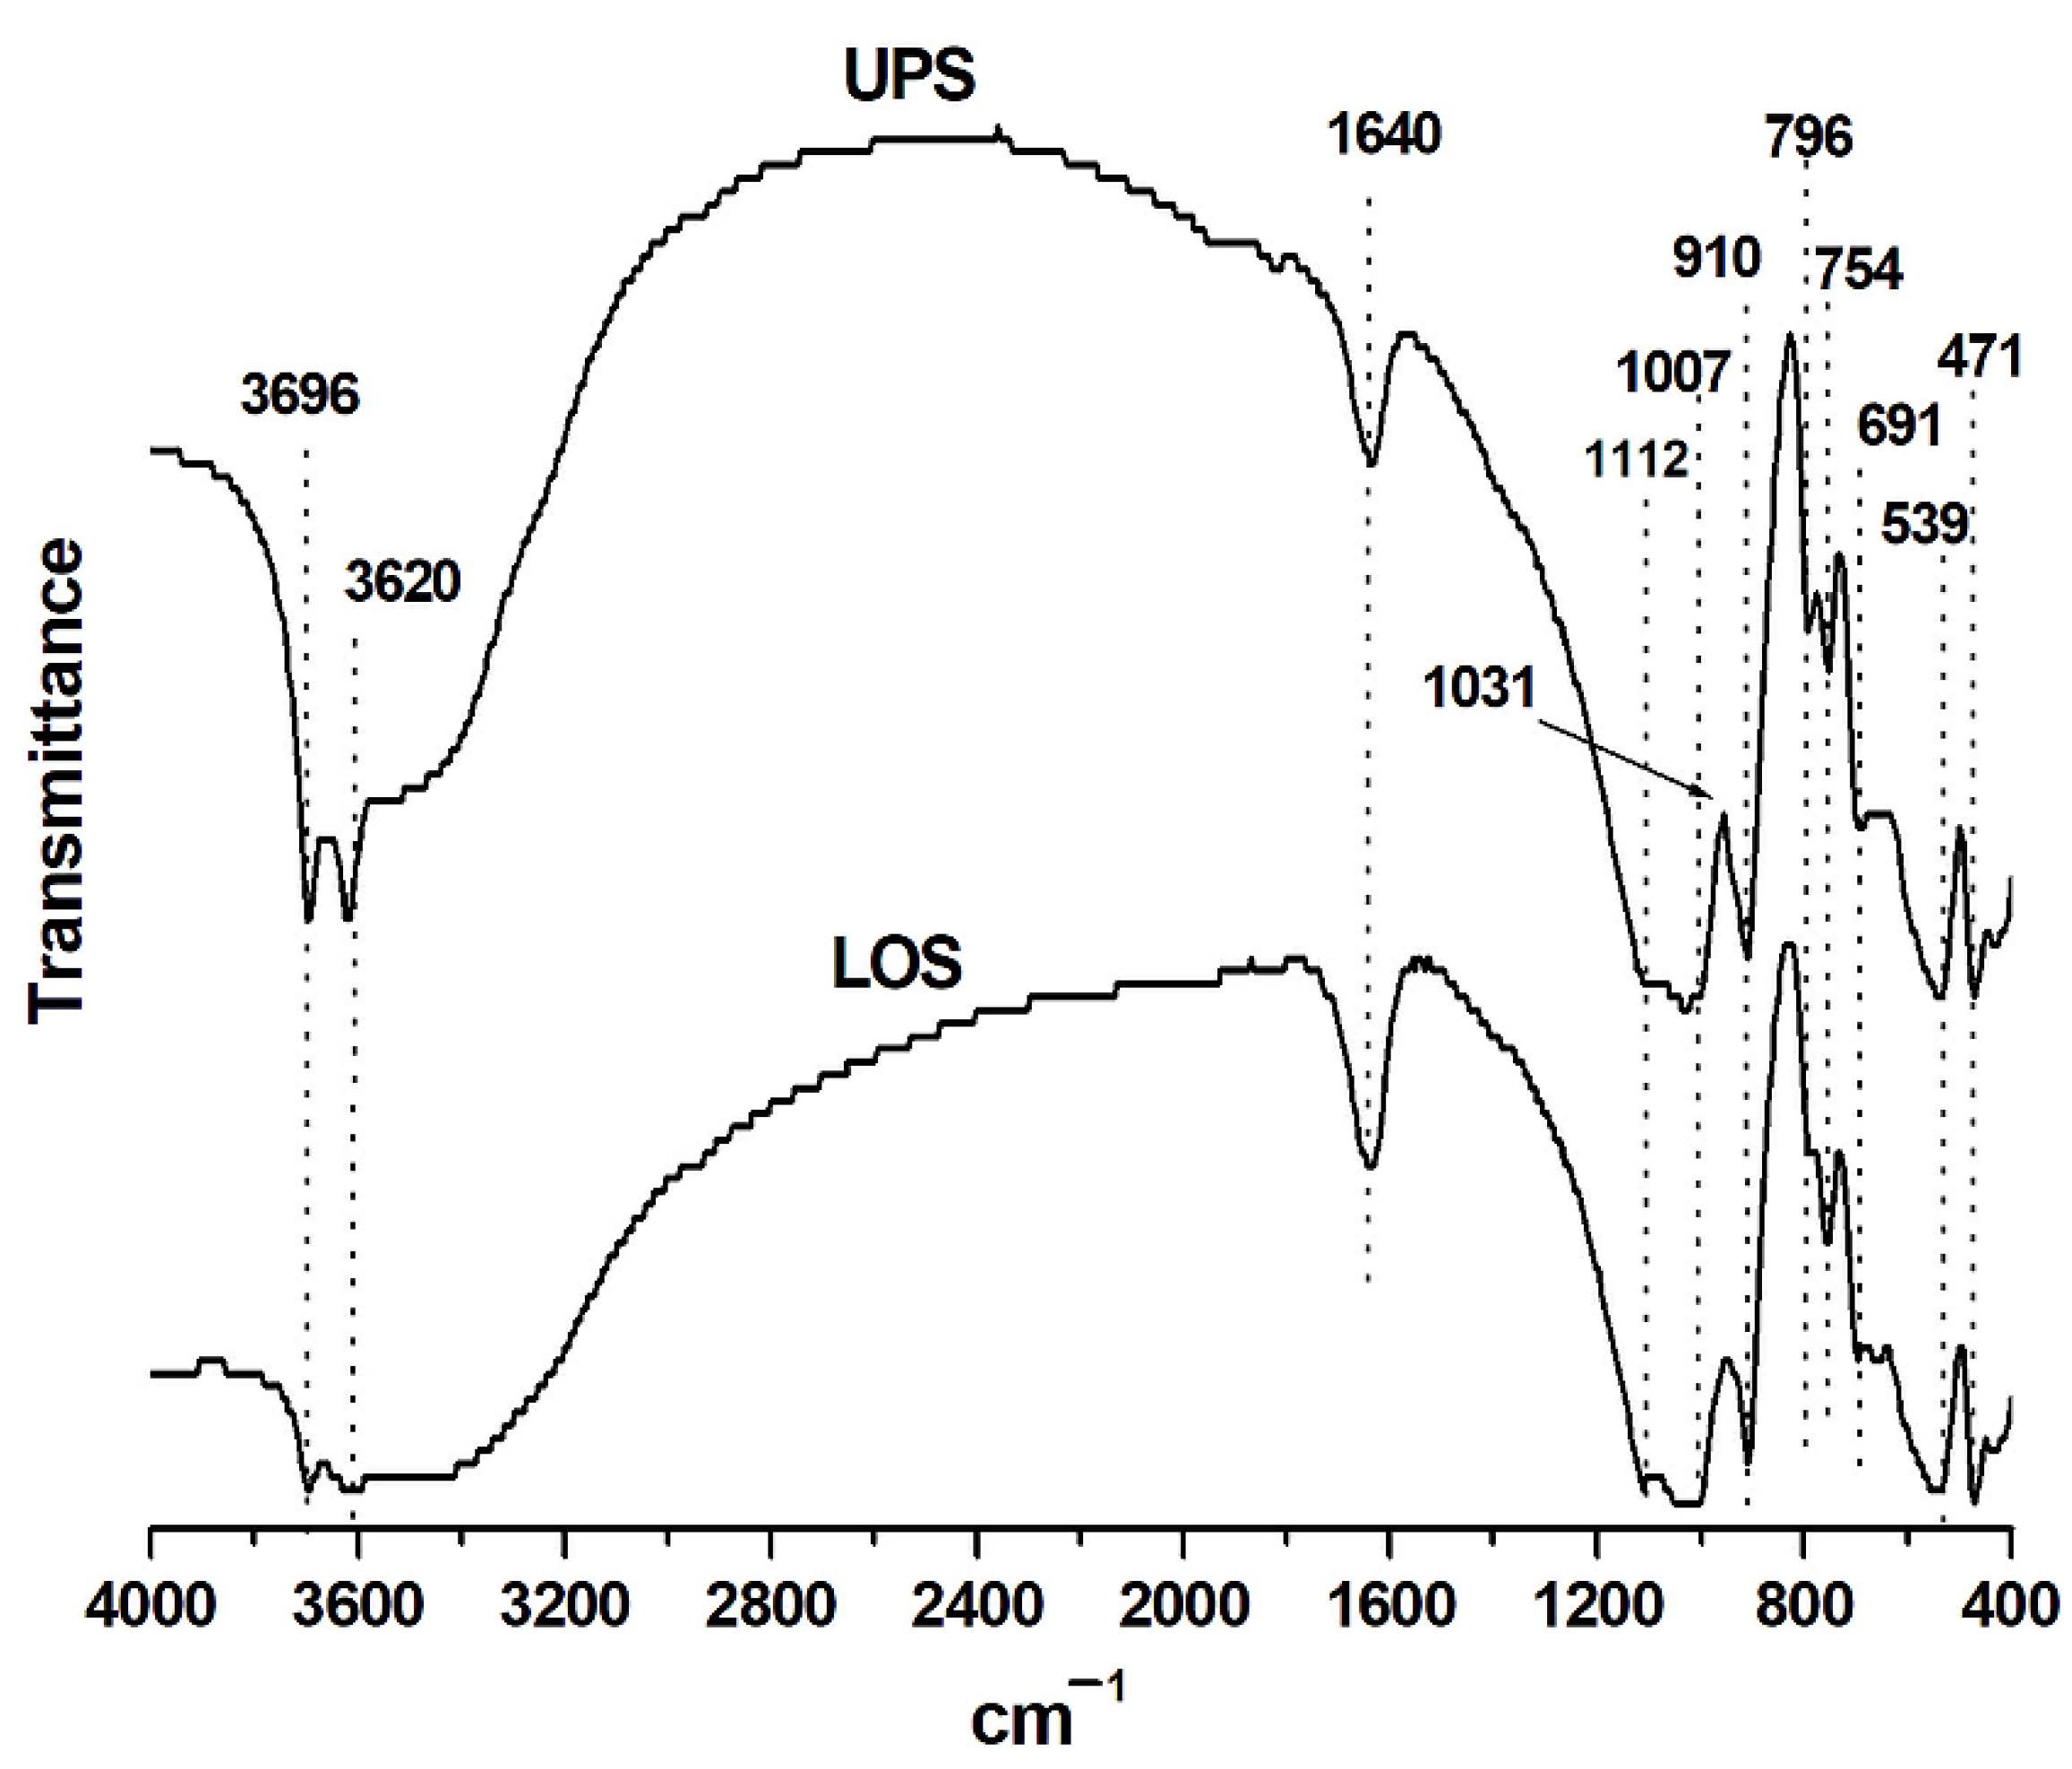
3.2. FT-IR Analysis
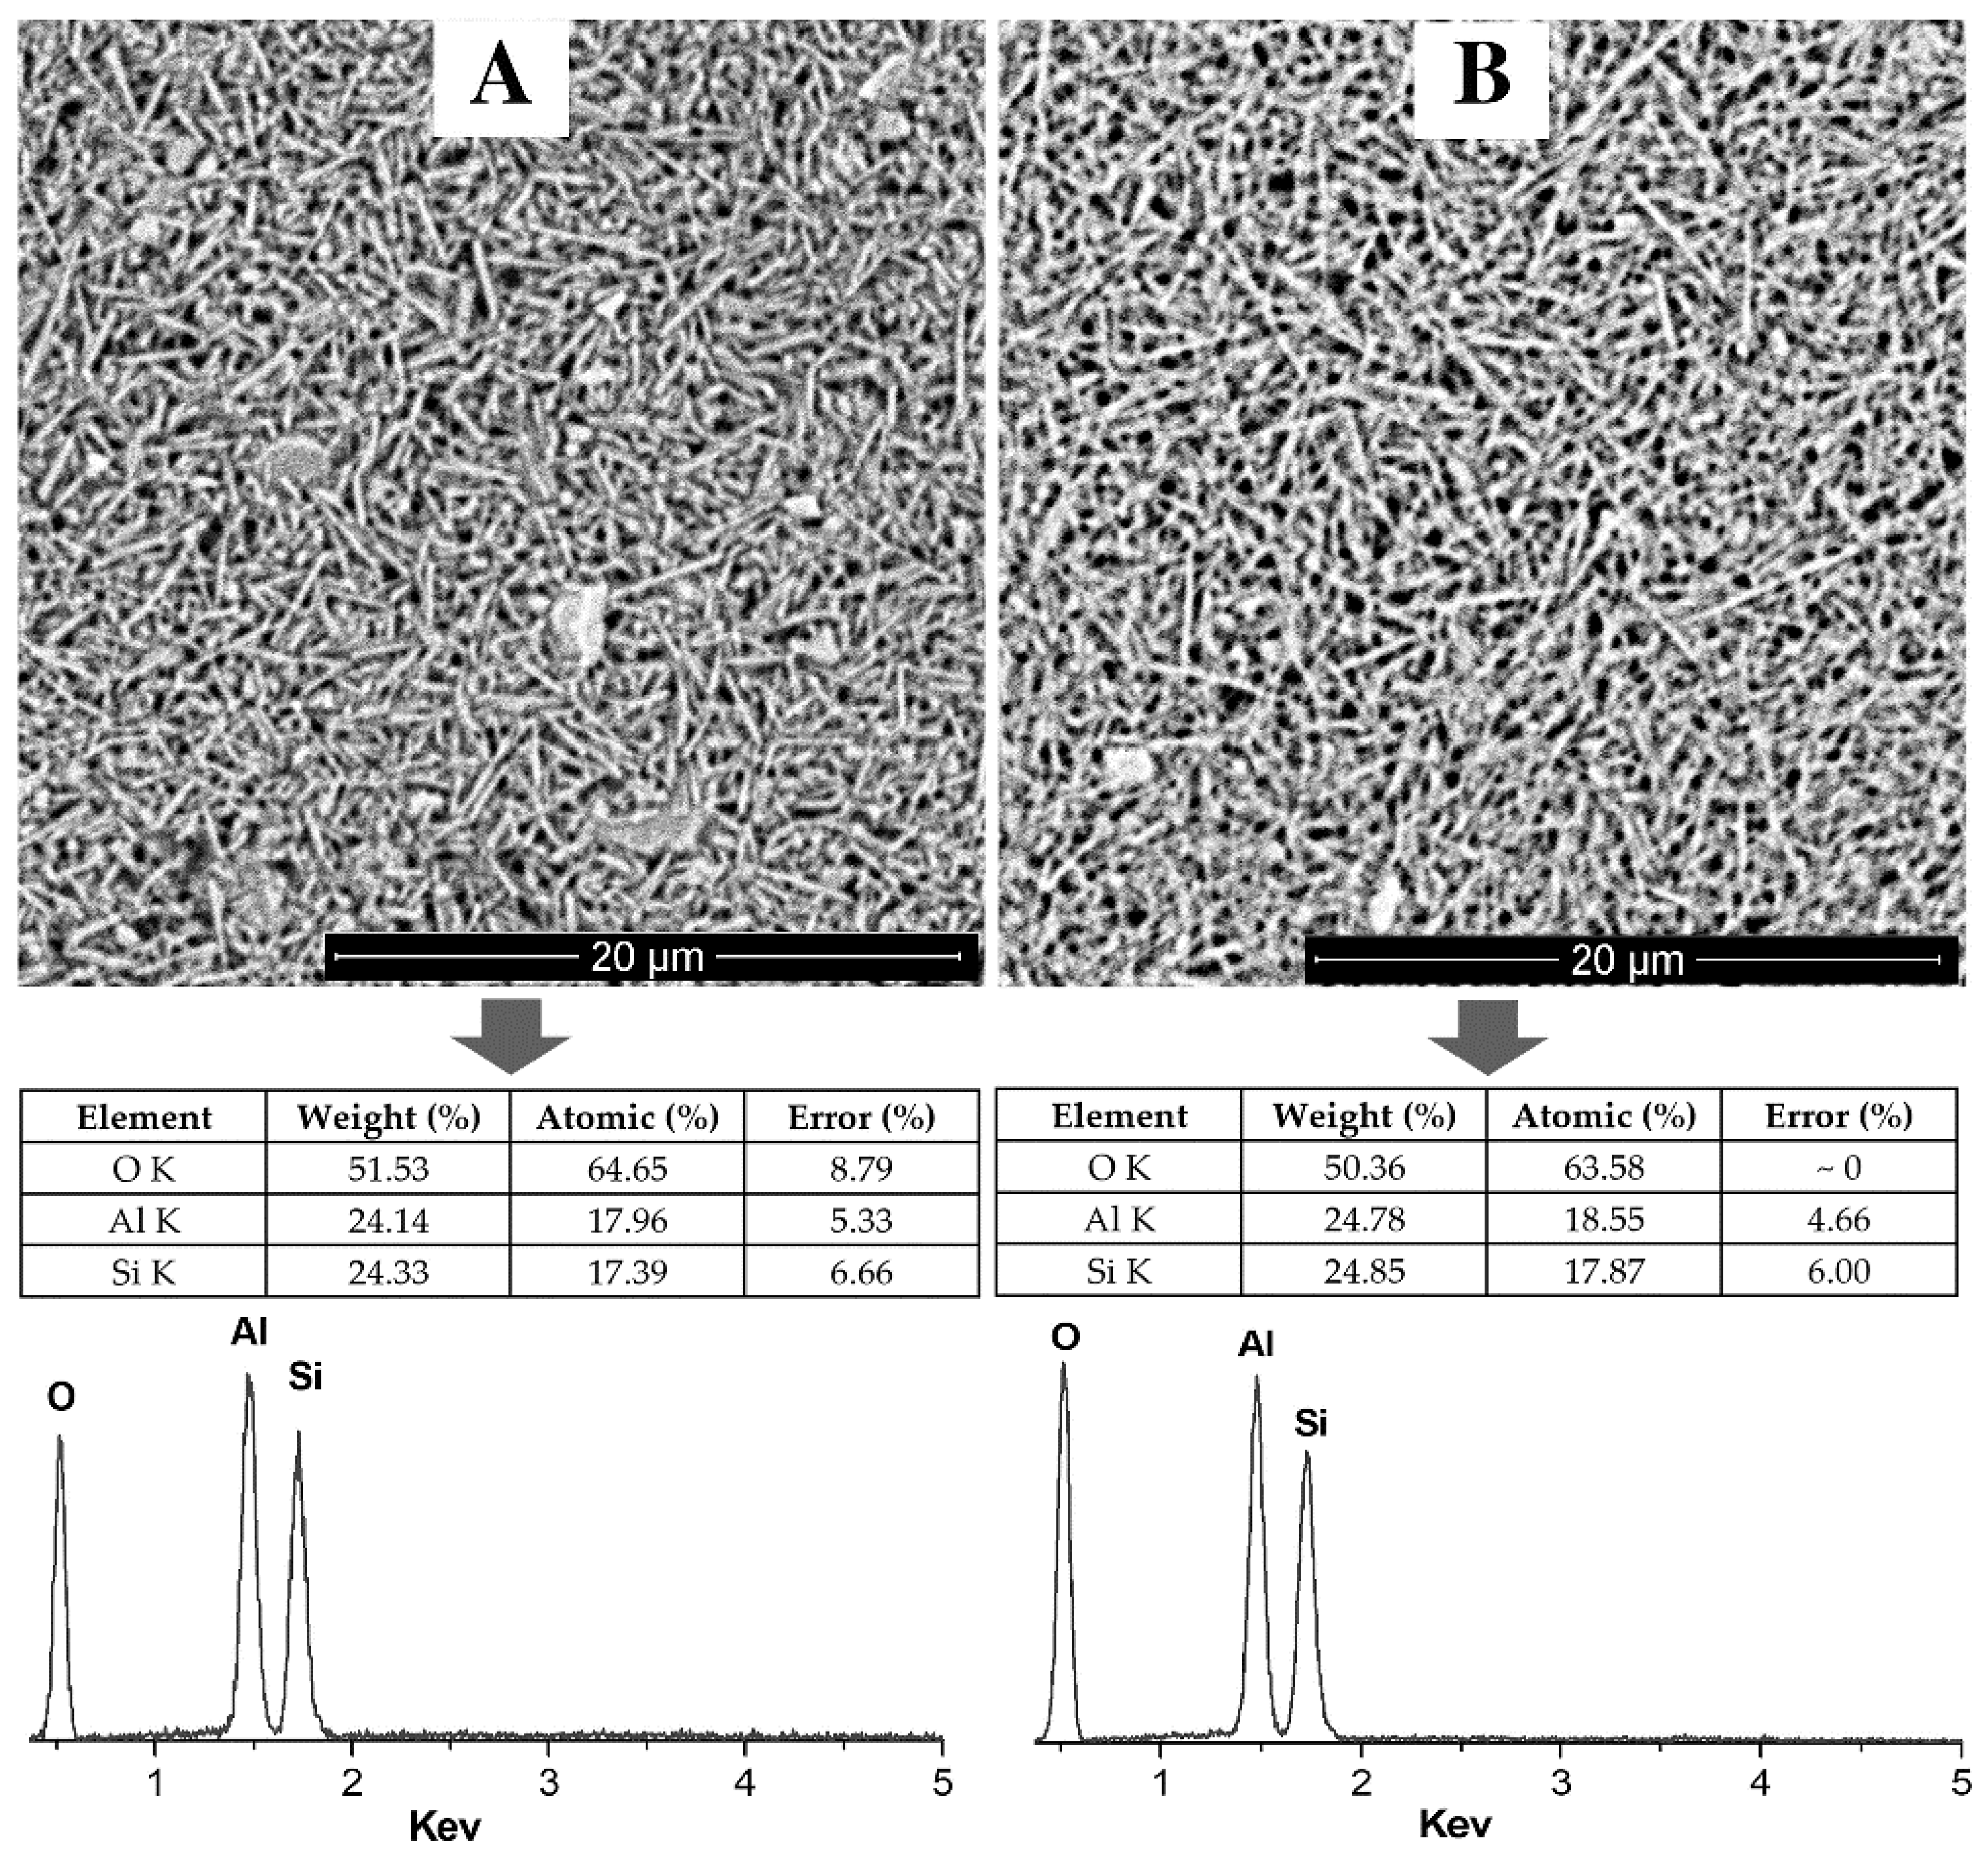
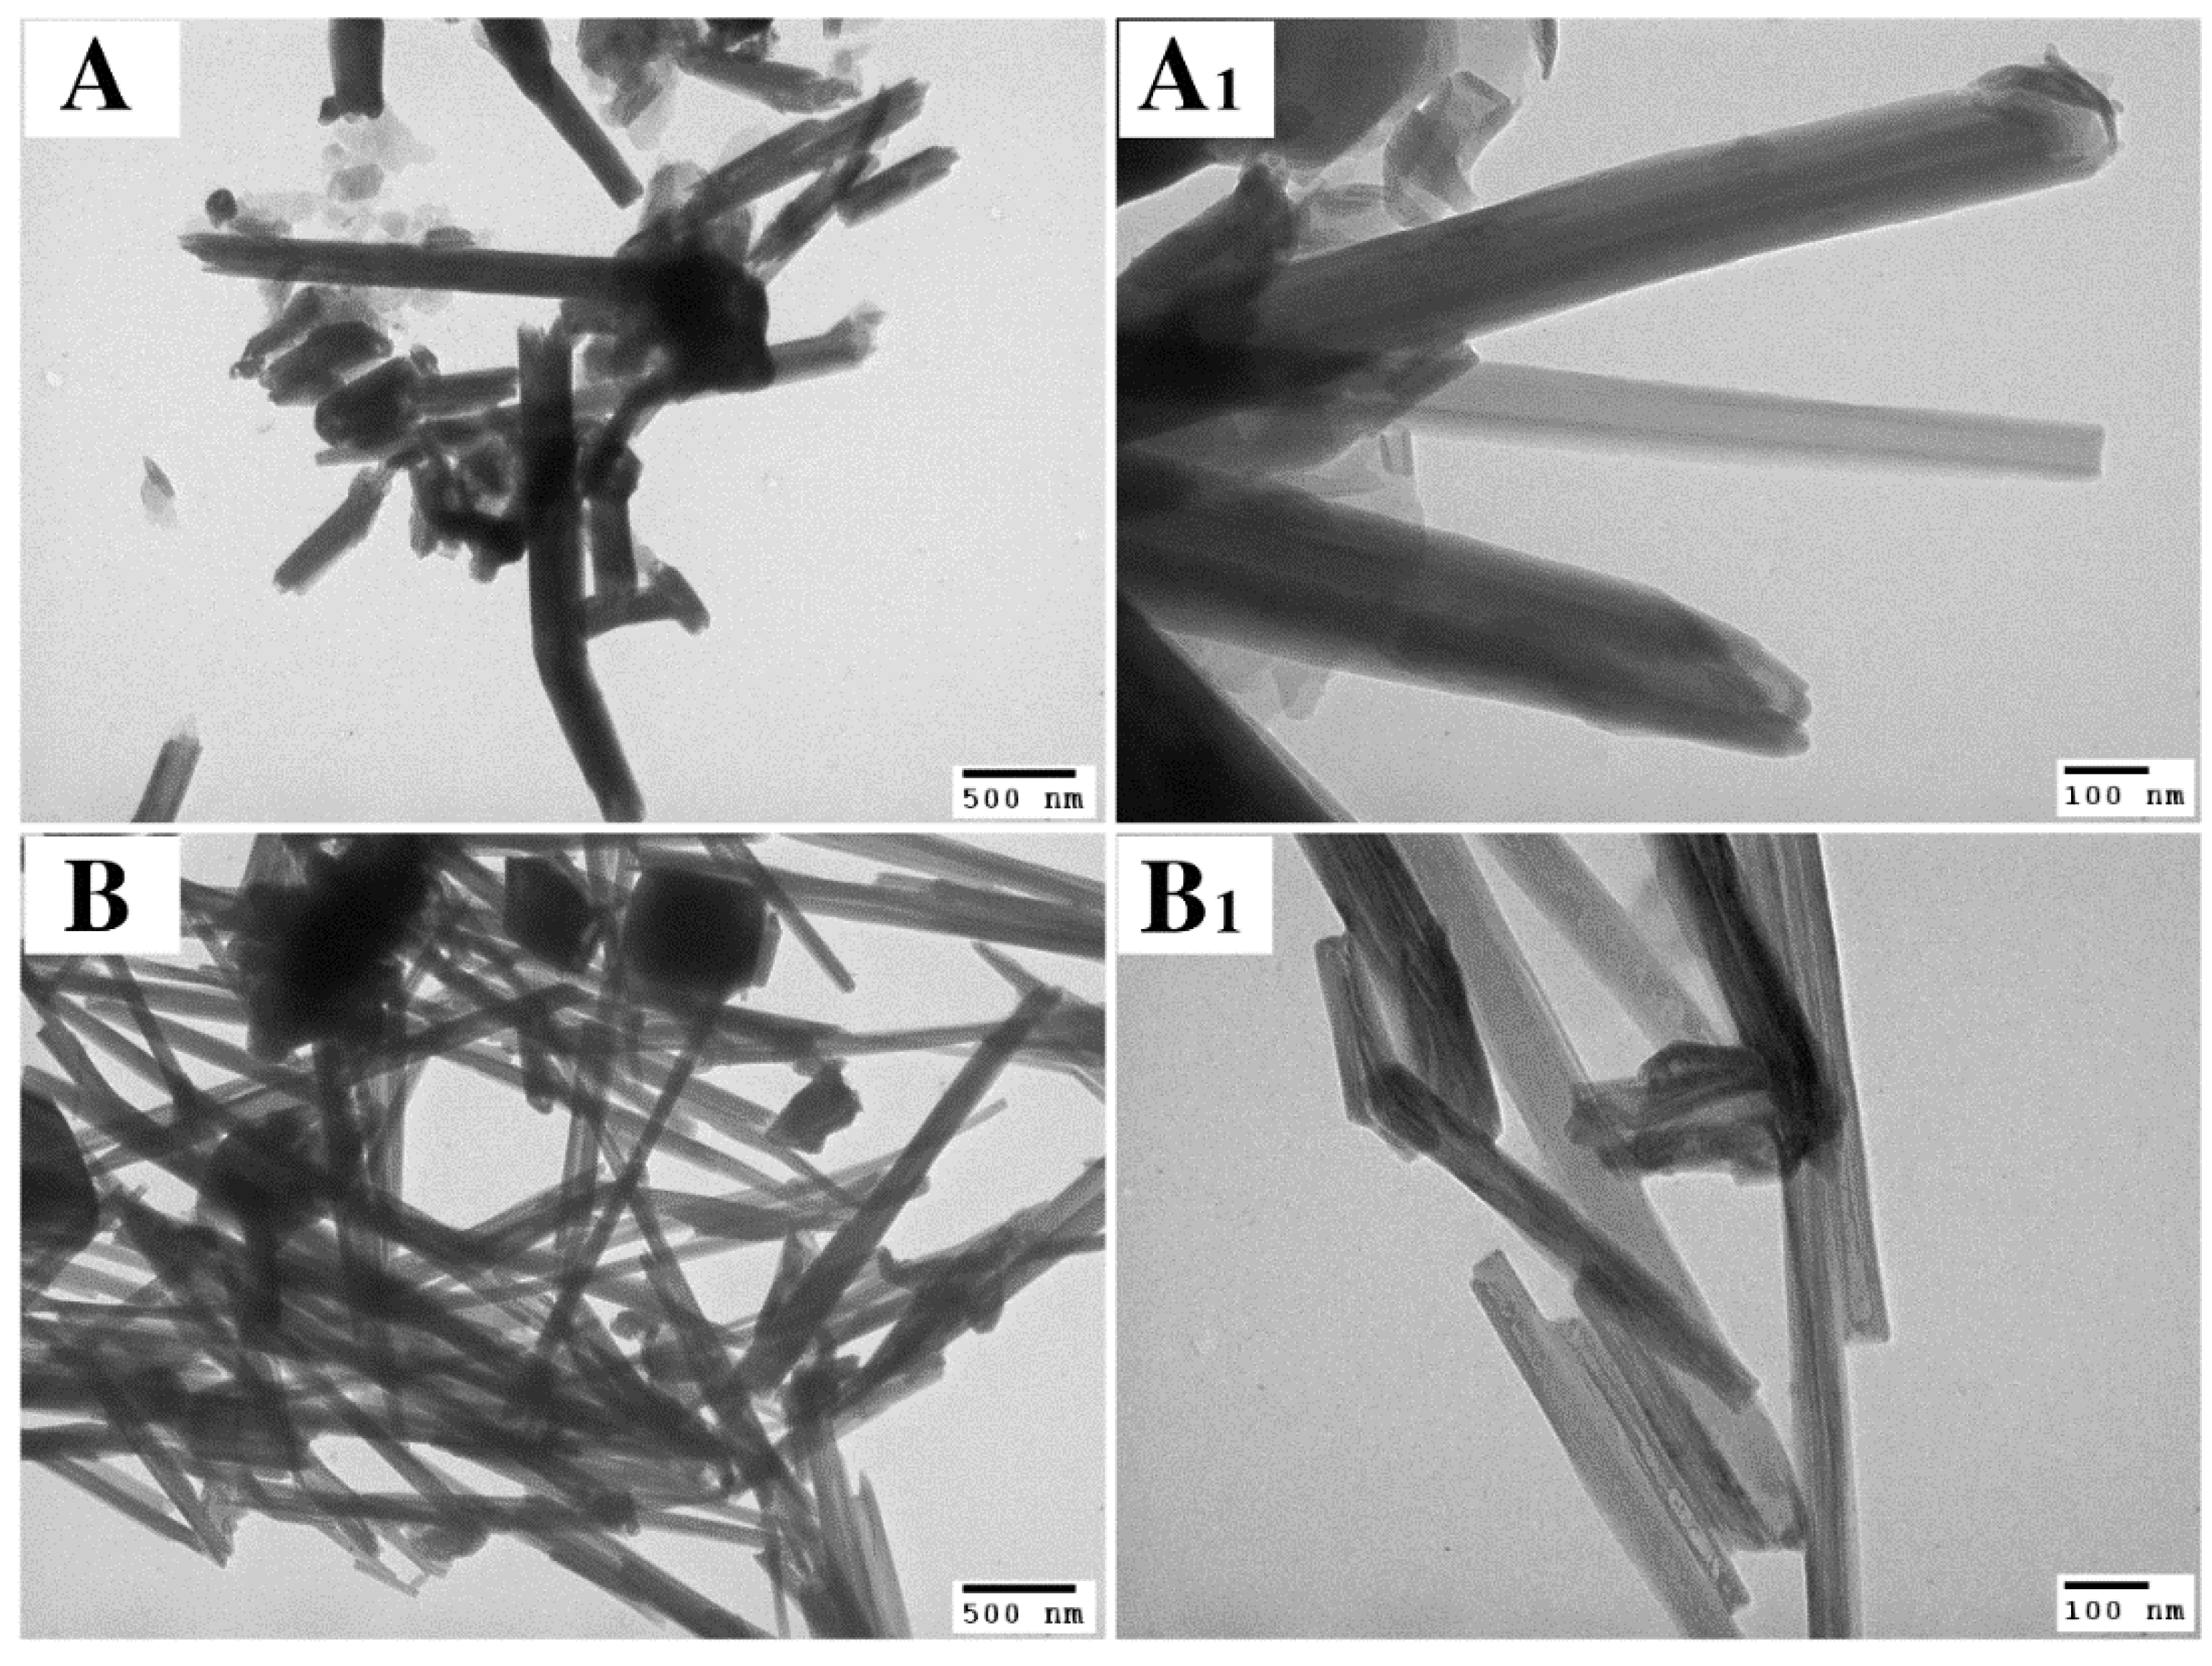
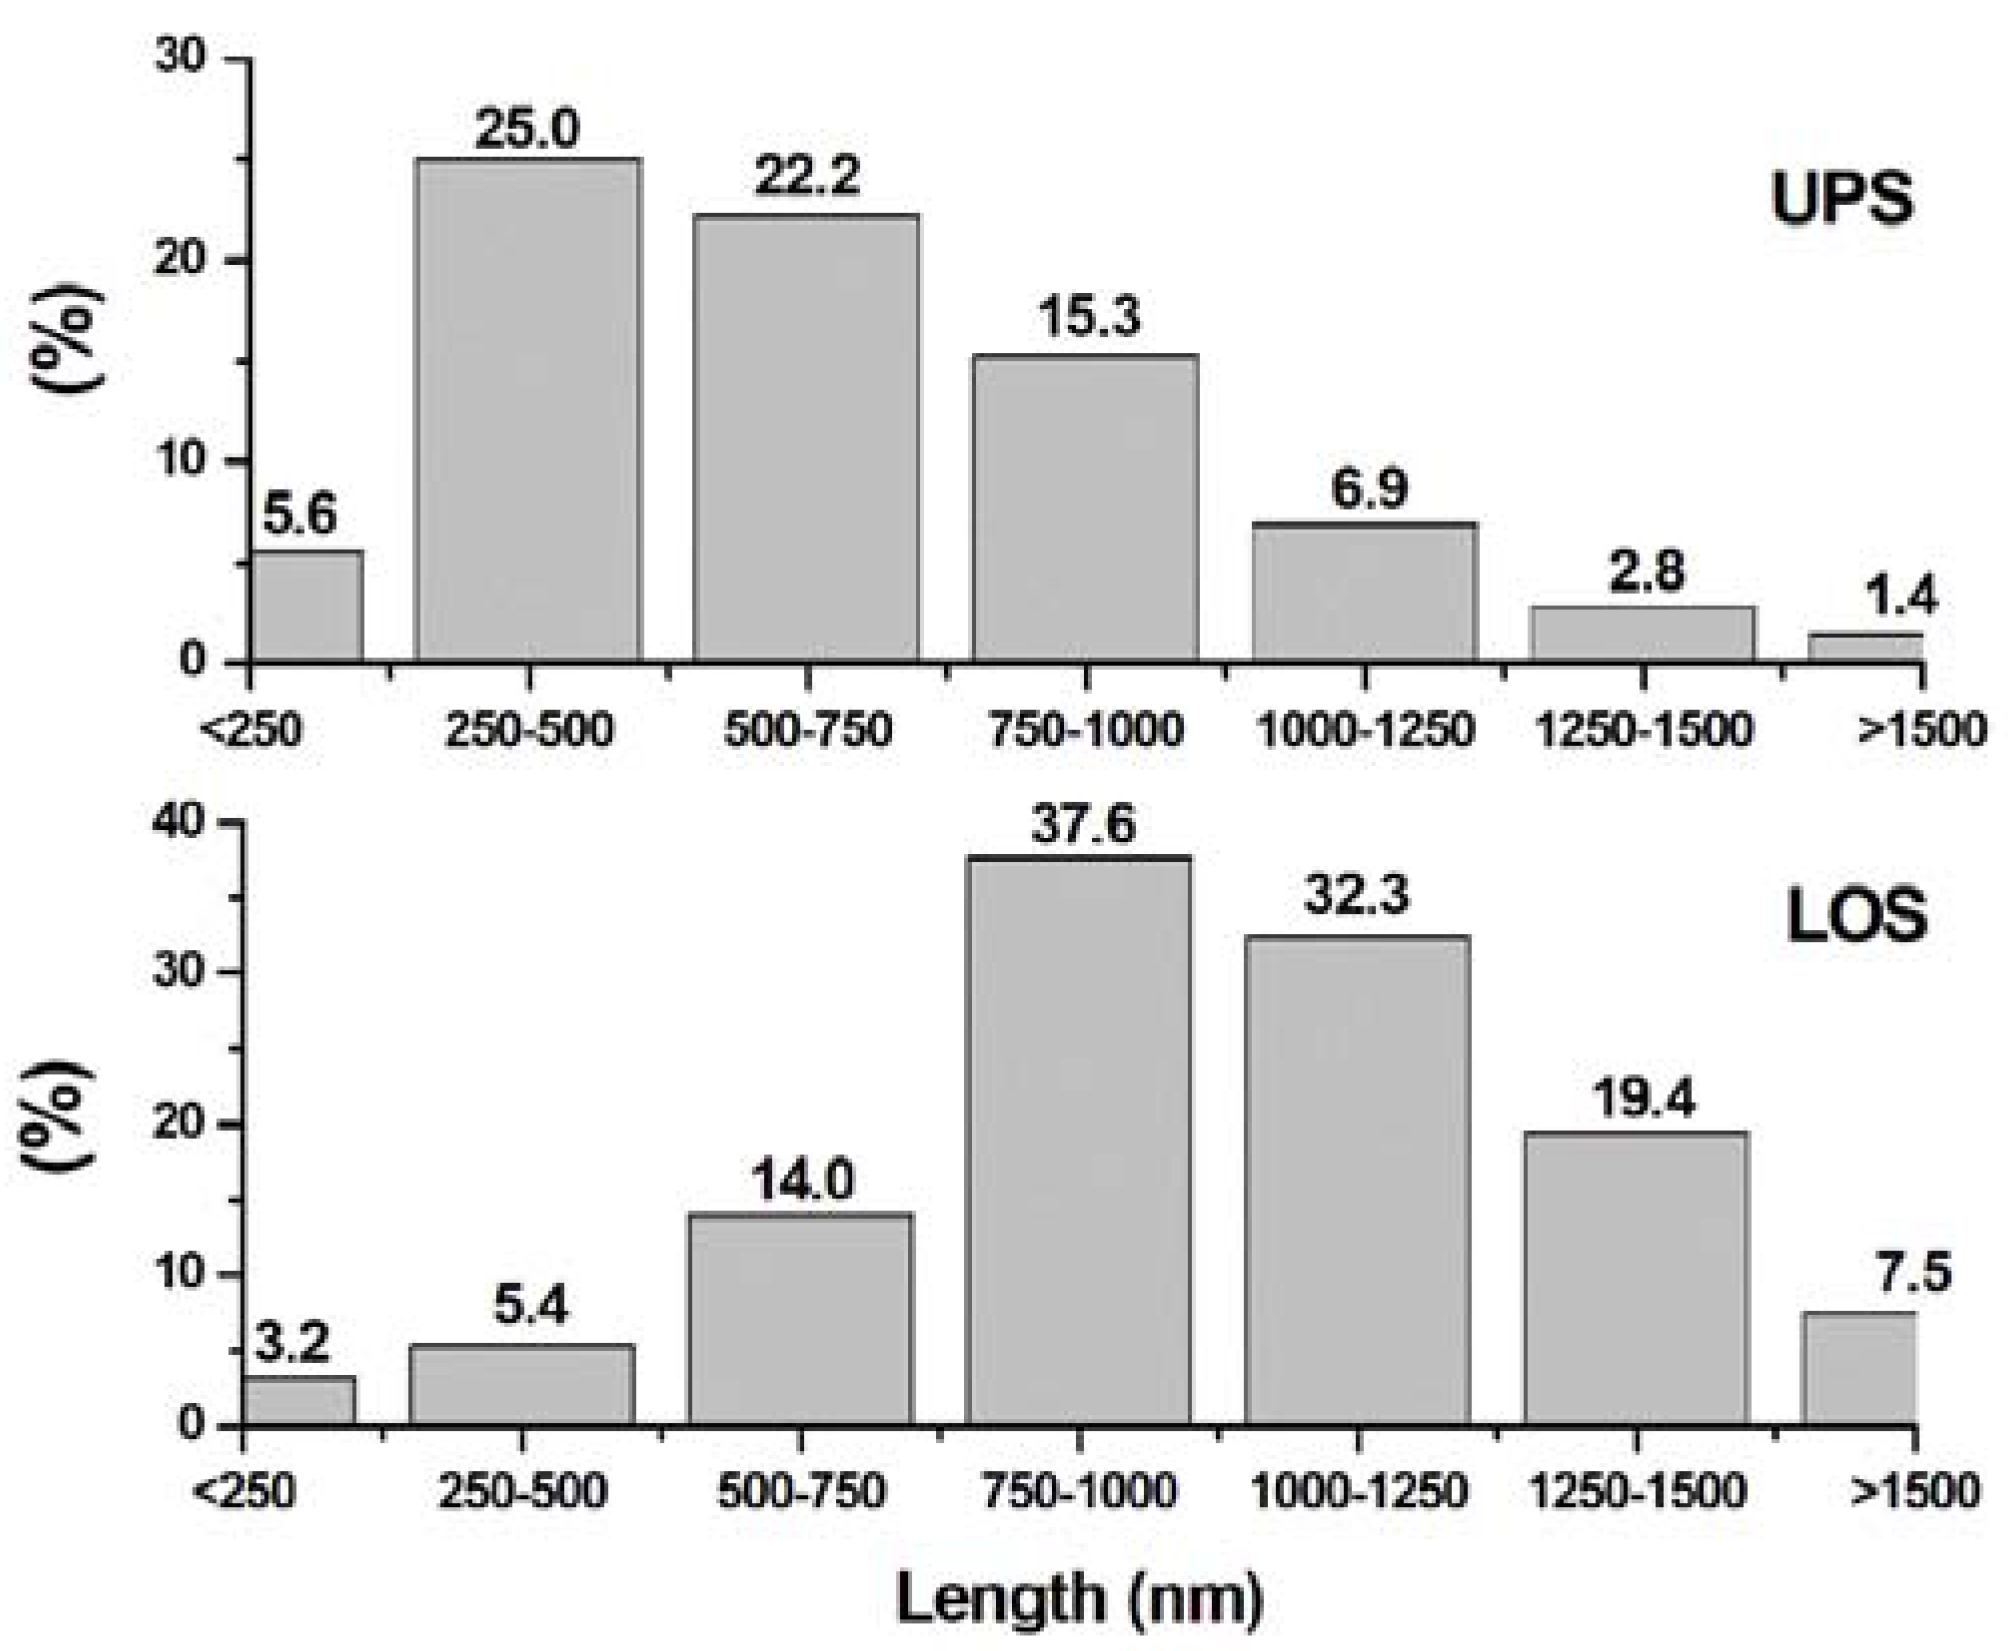
3.3. Electron Microscopy Analysis
3.4. Thermal Analysis
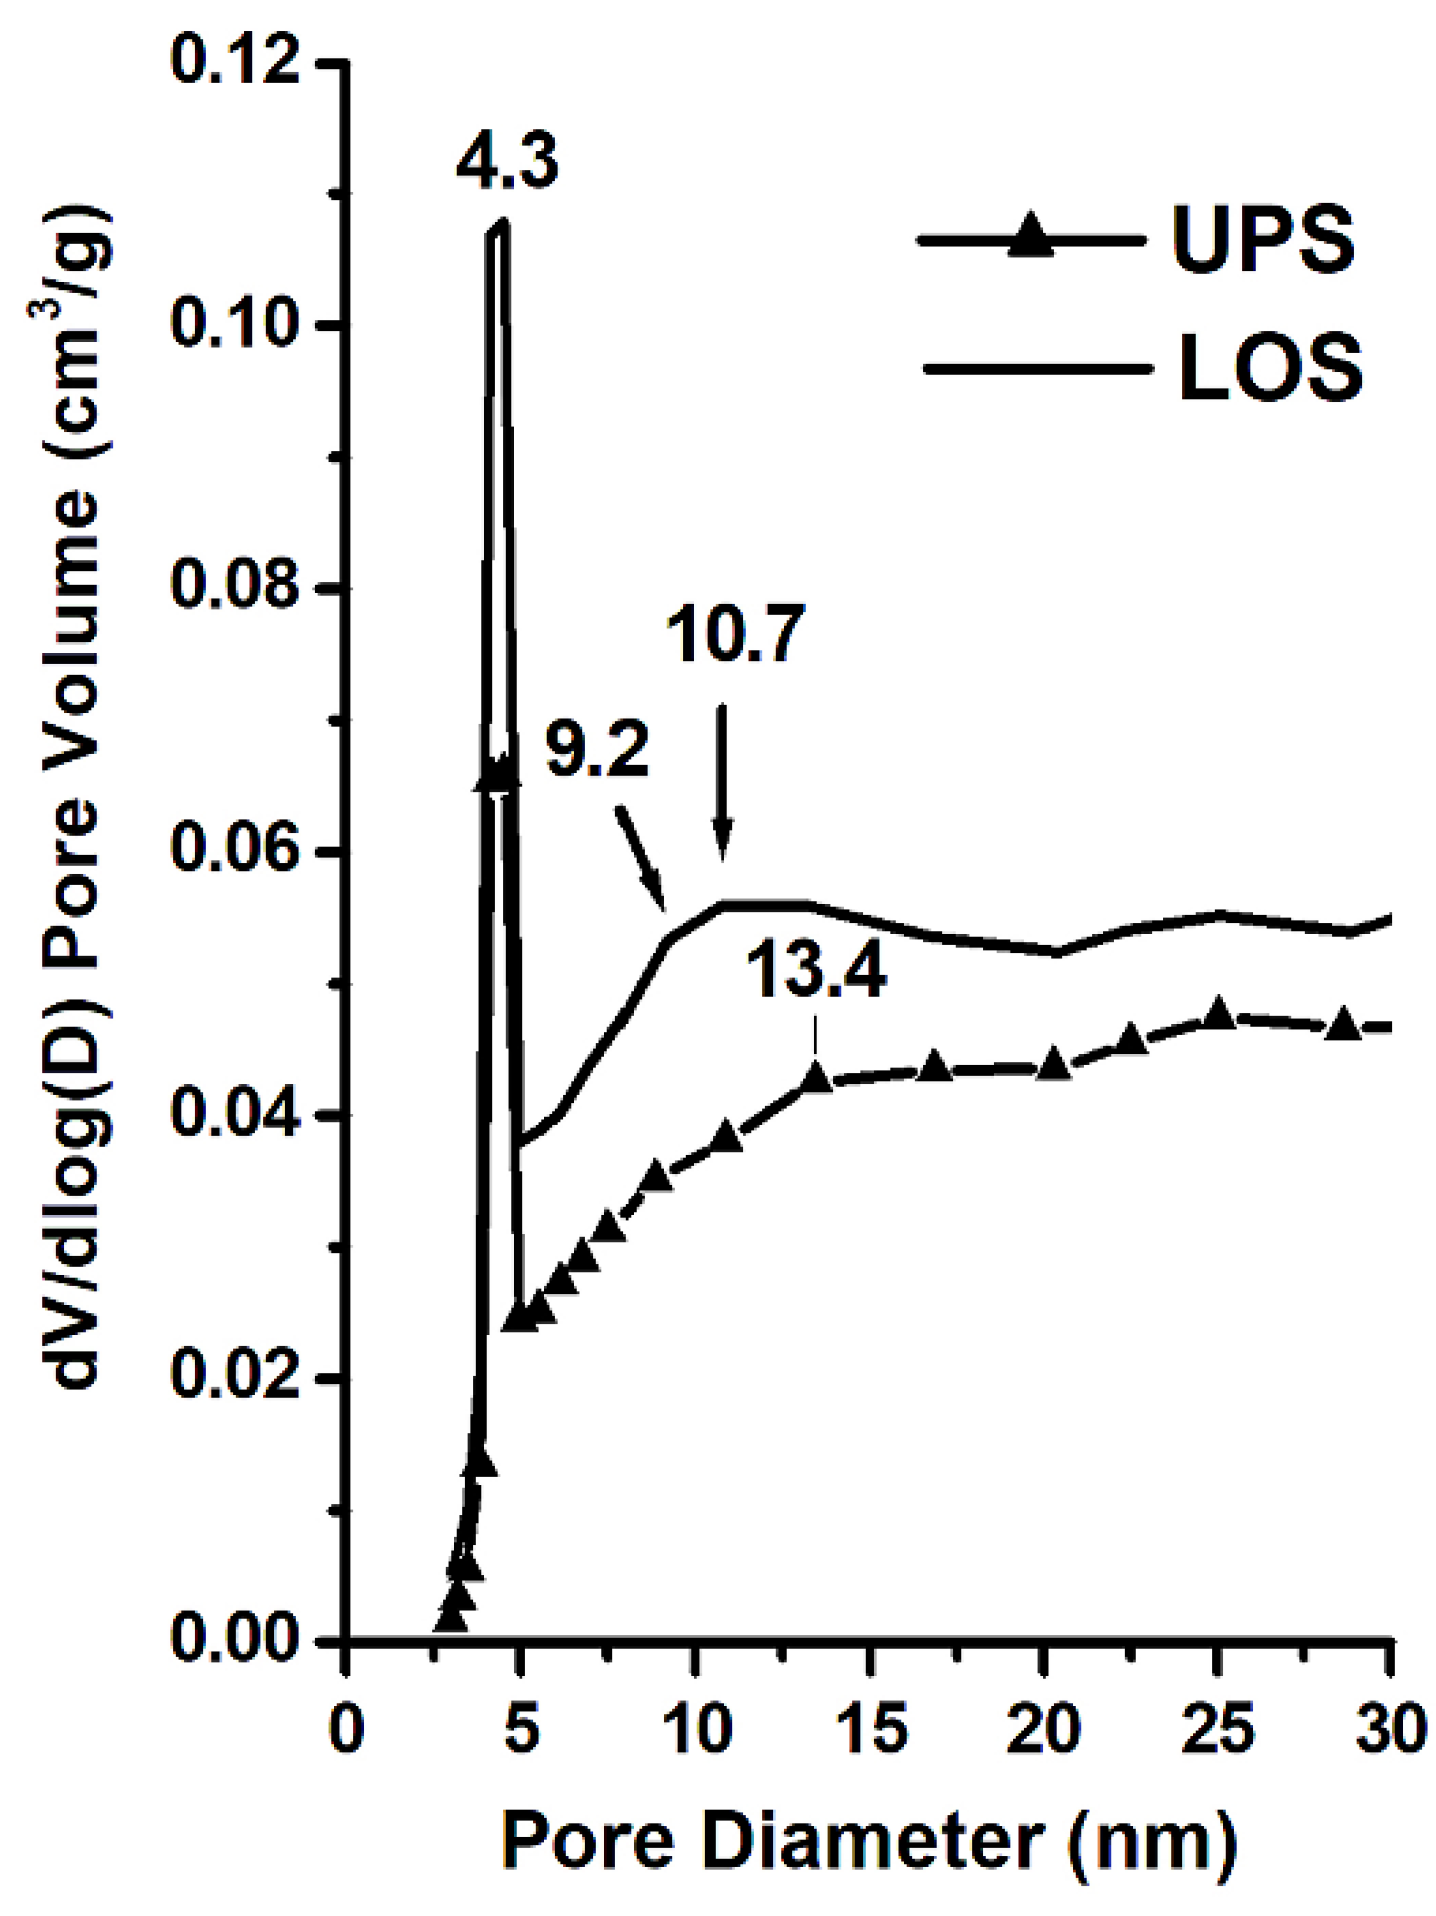
3.5. Surface Area and Pore Size
4. Conclusions
Author Contributions
Funding
Conflicts of Interest
References
- Berthier, P. Analyse de l’halloysite. Ann. Chim. Phys. 1826, 32, 332–335. [Google Scholar]
- Alexander, L.T.; Faust, G.T.; Hendricks, S.B.; Insley, H.; McMurdie, H.F. Relationship of the clay minerals halloysite and endellite. Am. Mineral. 1943, 28, 1–18. [Google Scholar]
- Churchman, G.J.; Carr, R.M. Stability fields of hydration states of a halloysite. Am. Mineral. 1972, 57, 914–992. [Google Scholar]
- Churchman, G.J.; Carr, R.M. The definition and nomenclature of halloysites. Clays Clay Miner. 1975, 23, 382–388. [Google Scholar] [CrossRef]
- Joussein, E.; Petit, S.; Churchman, G.J.; Theng, B.K.G.; Righi, D.; Delvaux, B. Halloysite clay minerals—A review. Clay Miner. 2005, 40, 383–426. [Google Scholar] [CrossRef]
- Wada, S.I.; Mizota, C. Iron-rich halloysite (10 Å) with crumpled lamellar morphology from Hokkaido, Japan. Clays Clay Miner. 1982, 30, 315–317. [Google Scholar] [CrossRef]
- Guimaraes, L.; Enyashin, A.N.; Seifert, G.; Duarte, H.A. Structural, electronic, and mechanical properties of single-walled halloysite nanotube models. J. Phys. Chem. C 2010, 114, 11358–11363. [Google Scholar] [CrossRef]
- Du, M.; Guo, B.; Jia, D. Newly emerging applications of halloysite nanotubes: A review. Polym. Int. 2010, 59, 574–582. [Google Scholar] [CrossRef]
- Bates, T.F.; Hildebrand, F.A.; Swineford, A. Morphology and structure of endellite and halloysite. Am. Miner. 1950, 35, 463–484. [Google Scholar]
- Chao, C.; Liu, J.; Wang, J.; Zhang, Y.; Zhang, B.; Zhang, Y.; Xiang, X.; Chen, R. Surface modification of halloysite nanotubes with dopamine for enzyme immobilization. ACS Appl. Mater. Interfaces 2013, 5, 10559–10564. [Google Scholar] [CrossRef] [PubMed]
- Wilson, I.; Keeling, J. Global occurrence, geology and characteristics of tubular halloysite deposits. Clay Miner. 2016, 51, 309–324. [Google Scholar] [CrossRef]
- Adamo, P.; Violante, P.; Wilson, M.J. Tubular and spheroidal halloysite in pyroclastic deposits in the area of the Roccamonfina volcano (Southern Italy). Geoderma 2001, 99, 295–316. [Google Scholar] [CrossRef]
- Singer, A.; Zarei, M.; Lange, F.M.; Stahr, K. Halloysite characteristics and formation in the northern Golan Heights. Geoderma 2004, 123, 279–295. [Google Scholar] [CrossRef]
- Ece, Ö.I.; Schroeder, P.A. Clay mineralogy and chemistry of halloysite and alunite deposits in the Turplu area, Balikesir, Turkey. Clays Clay Miner. 2007, 55, 18–35. [Google Scholar] [CrossRef]
- Churchman, G.J.; Pontifex, I.R.; McClure, S.G. Factors influencing the formation and characteristics of halloysites or kaolinites in granitic and tuffaceous saprolites in Hong Kong. Clays Clay Miner. 2010, 58, 220–237. [Google Scholar] [CrossRef]
- García, F.J.; Sergio, G.R.; Andreas, K.; Armin, R. Study of natural halloysite from the Dragon Mine, Utah (USA). Z. Anorg. Allg. Chem. 2010, 635, 790–795. [Google Scholar] [CrossRef]
- Bordeepong, S.; Bhongsuwan, D.; Pungrassam, T.; Bhongsuwan, T. Characterization of halloysite from Thung Yai district, Nakon Si Thammarat Province, in southern Thailand. Songklanakarin J. Sci. Technol. 2011, 33, 599–607. [Google Scholar]
- Saklar, S.; Ağrili, H.; Zimitoğlu, O.; Bașara, B.; Kaan, U. The characterisation studies of the northwest Anatolian halloysites/kaolinites. Miner. Res. Explor. Bull. 2012, 145, 48–61. [Google Scholar]
- Ouyang, J.; Mu, D.; Zhang, Y.; Yang, H. Mineralogy and Physico-Chemical Data of Two Newly Discovered Halloysite in China and Their Contrasts with Some Typical Minerals. Minerals 2018, 8, 108. [Google Scholar] [CrossRef]
- Brathwaite, R.L.; Christie, A.B.; Faure, K.; Townsend, M.G.; Terlesk, S. Origin of the Matauri Bay halloysite deposit, Northland, New Zealand. Miner. Depos. 2012, 47, 897–910. [Google Scholar] [CrossRef]
- Kildale, M.B.; Thomas, R.C. Geology of the halloysite deposit at the Dragon Mine. In Geology of the East Tintic Mountains and Ore Deposits of the Tintic Mining Districts; Guidebook to the Geology of Utah, 12; Cook, D.R., Ed.; Utah Geological Society: Cedar City, UT, USA, 1957; pp. 94–96. [Google Scholar]
- Churchman, G.J.; Theng, B.K.G. Interactions of halloysites with amides: Mineralogical factors affecting complex formation. Clay Miner. 1984, 19, 161–175. [Google Scholar] [CrossRef]
- Keeling, J.L.; Pasbakhsh, P. Halloysite mineral nanotubes: Geology, properties and applied research. MESA J. 2015, 77, 20–25. [Google Scholar]
- Hillier, S.; Brydson, R.; Delbos, E.; Fraser, T.; Gray, N.; Pendlowski, H.; Phillips, I.; Robertson, J.; Wilson, I. Correlations among the mineralogical and physical properties of halloysite nanotubes (HNTS). Clay Miner. 2016, 51, 325–350. [Google Scholar] [CrossRef]
- Churchman, G.J.; Pasbakhsh, P.; Lowe, D.J.; Theng, B.K.G. Unique but diverse: Some observations on the formation, structure and morphology of halloysite. Clay Miner. 2016, 51, 395–416. [Google Scholar] [CrossRef]
- Lvov, Y.; Abdullayev, E. Functional Polymer-Clay Nanotube Composites with Sustained Release of Chemical Agents. Prog. Polym. Sci. 2013, 38, 1690–1719. [Google Scholar] [CrossRef]
- Liu, M.; Jia, Z.; Jia, D.; Zhou, C. Recent advance in research on halloysite nanotubes-polymer nanocomposite. Prog. Polym. Sci. 2014, 39, 1498–1525. [Google Scholar] [CrossRef]
- Kilislioglu, A.; Bilgin, B. Adsorption of uranium on halloysite. Radiochim. Acta 2002, 90, 155–160. [Google Scholar] [CrossRef]
- Yu, L.; Wang, H.; Zhang, Y.; Zhang, B.; Liu, J. Recent advances in halloysite nanotube derived composites for water treatment. Environ. Sci. Nano 2016, 3, 28–44. [Google Scholar] [CrossRef]
- Ouyang, J.; Zhao, Z.; Zhang, Y.; Yang, H. Textual properties and catalytic performances of halloysite hybrid CeO2-ZrO2 nanoparticles. J. Colloid Interface Sci. 2017, 505, 430–436. [Google Scholar] [CrossRef] [PubMed]
- Li, Z.; Liu, L.; González, A.J.; Wang, D. Bioinspired polydopamine-induced assembly of ultrafine Fe(OH)3 nanoparticles on halloysite toward highly efficient fire retardancy of epoxy resin via an action of interfacial catalysis. Polym. Chem. 2017, 8, 3926–3936. [Google Scholar] [CrossRef]
- Mo, J.; Ma, W.; Zhang, W.; Yuan, J. Structure and properties of carbon intercalated halloysite and its organosilicone hybrid film with low dielectric constant. Mater. Des. 2017, 128, 56–63. [Google Scholar] [CrossRef]
- Cavallaro, G.; Danilushkina, A.A.; Evtugyn, V.G.; Lazzara, G.; Milioto, S.; Parisi, F.; Rozhina, E.V.; Fakhrullin, R.F. Halloysite nanotubes: Controlled access and release by smart gates. Nanomaterials 2017, 7, 199. [Google Scholar] [CrossRef] [PubMed]
- Yuan, P.; Tan, D.; Annabi-Bergaya, F. Properties and applications of halloysite nanotubes: Recent research advances and future prospects. Appl. Clay Sci. 2015, 112–113, 75–93. [Google Scholar] [CrossRef]
- Makaremi, M.; Pasbakhsh, P.; Cavallaro, G.; Lazzara, G.; Aw, Y.K.; Lee, S.M.; Milioto, S. Effect of morphology and size of halloysite nanotubes on functional pectin bionanocomposites for food packaging applications. ACS Appl. Mater. Interfaces 2017, 9, 17476–17488. [Google Scholar] [CrossRef] [PubMed]
- Zheng, T.; Ni, X. Loading the polyol carbonization agent into clay nanotubes for the preparation of environmentally stable UV-cured epoxy materials. J. Appl. Polym. Sci. 2017, 134, 45045. [Google Scholar] [CrossRef]
- Pasbakhsh, P.; Churchman, G.J.; Keeling, J.L. Characterisation of properties of various halloysites relevant to their use as nanotubes and microfibre fillers. Appl. Clay Sci. 2013, 74, 47–57. [Google Scholar] [CrossRef]
- Nguyen, T.D.; Nguyen, P. Geological characteristics and quality of kaolin, feldspar in Thach Khoan area, Thanh Son, Phu Tho. J. Min. Geol. Sci. Technol. 2006, 15, 65–70. (In Vietnamese) [Google Scholar]
- Fritz, B.; Clement, A.; Amal, Y.; Noguera, C. Simulation of the nucleation and growth of simple clay minerals in weathering processes: The NANOKIN code. Geochim. Cosmochim. Acta 2009, 73, 1340–1358. [Google Scholar] [CrossRef]
- Churchman, G.J.; Lowe, D.J. Alteration formation and occurrence of minerals in soils. In Handbook of Soil Science: Properties and Processes, 2nd ed.; Huang, P.M., Li, Y., Summer, M.E., Eds.; CRC Press: Boca Raton, FL, USA, 2012; Volume 1, pp. 20.1–20.72. ISBN 9781439803059. [Google Scholar]
- Inoue, A.; Utada, M.; Hatta, T. Halloysite-to-kaolinite transformation by dissolution and recrystallization during weathering of crystalline rocks. Clay Miner. 2012, 47, 373–390. [Google Scholar] [CrossRef]
- Bobos, I. Kaolinite to halloysite-7 Å transformation in the kaolin deposit of São Vicente de Pereira, Portugal. Clays Clay Miner. 2001, 49, 596–607. [Google Scholar] [CrossRef]
- Frost, R.L.; Krist, J.; Horvath, E.; Kloprogge, J.T. Rehydration and phase changes of potassium acetate-intercalated halloysite at 298K. J. Colloid Interface Sci. 2000, 226, 318–327. [Google Scholar] [CrossRef]
- Li, Y.; Zhang, Y.; Zhang, Y.F.; Liu, M.; Zhang, F.; Wang, L. Thermal behavior analysis of halloysite selected from Inner Mongolia Autonomous region in China. J. Ther. Anal. Calorim. 2017, 129, 1333–1339. [Google Scholar] [CrossRef]
- Kang, H.; Liu, X.; Zhang, S.; Li, J. Functionalization of halloysite nanotubes (HNTs) via mussel-inspired surface modification and silane grafting for HNTs/soy protein isolate nanocomposite film preparation. RSC Adv. 2017, 7, 24140–24148. [Google Scholar] [CrossRef]
- Tzounis, L.; Herlekar, S.; Tzounis, A.; Charisiou, N.D.; Goula, M.; Stamm, M. Halloysite Nanotubes Noncovalently Functionalised with SDS Anionic Surfactant and PS-b-P4VP Block Copolymer for Their Effective Dispersion in Polystyrene as UV-Blocking Nanocomposite Films. J. Nanomater. 2017, 2017, 1–11. [Google Scholar] [CrossRef] [PubMed]
- Sun, P.; Liu, G.; Lv, D.; Dong, X.; Wub, J.; Wanga, D. Effective activation of halloysite nanotubes by piranha solution for amine modification via silane coupling chemistry. RSC Adv. 2015, 5, 52916–52925. [Google Scholar] [CrossRef]
- Lun, H.; Ouyang, J.; Yang, H. Natural halloysite nanotubes modified as an aspirin carrier. RSC Adv. 2014, 4, 44197–44202. [Google Scholar] [CrossRef]
- Churchman, G.J.; Davy, T.J.; Aylmore, L.A.G.; Gilkes, R.J.; Self, P.G. Characteristics of fine pores in some halloysites. Clay Miner. 1995, 30, 89–98. [Google Scholar] [CrossRef]


| Sample | SBET (m2/g) | Sads of Pores (1.70–300.0 nm Diameter) (m2/g) | Sdes of Pores (1.70–300.0 nm Diameter) (m2/g) | Vads of Pores (1.70–300.0 nm Diameter) (cm3/g) | Average Pore Size (nm) | SBET − Sads (m2/g) | Sdes − SBET (m2/g) |
|---|---|---|---|---|---|---|---|
| UPS | 15.7434 | 15.361 | 19.2166 | 0.072904 | 18.9837 | 0.3824 | 3.4732 |
| LOS | 22.0211 | 22.350 | 27.9054 | 0.095144 | 17.0281 | −0.3289 | 5.8843 |
© 2018 by the authors. Licensee MDPI, Basel, Switzerland. This article is an open access article distributed under the terms and conditions of the Creative Commons Attribution (CC BY) license (http://creativecommons.org/licenses/by/4.0/).
Share and Cite
Bac, B.H.; Dung, N.T.; Khang, L.Q.; Hung, K.T.; Lam, N.V.; An, D.M.; Son, P.V.; Anh, T.T.V.; Chuong, D.V.; Tinh, B.T. Distribution and Characteristics of Nanotubular Halloysites in the Thach Khoan Area, Phu Tho, Vietnam. Minerals 2018, 8, 290. https://doi.org/10.3390/min8070290
Bac BH, Dung NT, Khang LQ, Hung KT, Lam NV, An DM, Son PV, Anh TTV, Chuong DV, Tinh BT. Distribution and Characteristics of Nanotubular Halloysites in the Thach Khoan Area, Phu Tho, Vietnam. Minerals. 2018; 8(7):290. https://doi.org/10.3390/min8070290
Chicago/Turabian StyleBac, Bui Hoang, Nguyen Tien Dung, Luong Quang Khang, Khuong The Hung, Nguyen Van Lam, Do Manh An, Phan Viet Son, Tran Thi Van Anh, Doan Van Chuong, and Bui Thanh Tinh. 2018. "Distribution and Characteristics of Nanotubular Halloysites in the Thach Khoan Area, Phu Tho, Vietnam" Minerals 8, no. 7: 290. https://doi.org/10.3390/min8070290
APA StyleBac, B. H., Dung, N. T., Khang, L. Q., Hung, K. T., Lam, N. V., An, D. M., Son, P. V., Anh, T. T. V., Chuong, D. V., & Tinh, B. T. (2018). Distribution and Characteristics of Nanotubular Halloysites in the Thach Khoan Area, Phu Tho, Vietnam. Minerals, 8(7), 290. https://doi.org/10.3390/min8070290