Article

Experimental Investigation of Evolution of Pore Structure in Longmaxi Marine Shale Using an Anhydrous Pyrolysis Technique

1
School of Energy Resource, China University of Geosciences (Beijing), Beijing 100083, China
2
Key Laboratory of Marine Reservoir Evolution and Hydrocarbon Enrichment Mechanism, Ministry of Education, Beijing 100083, China
3
Key Laboratory of Strategy Evaluation for Shale Gas, Ministry of Land and Resources, Beijing 100083, China
4
Beijing Dadi high-tech geological exploration CO., Ltd., Beijing 100083, China
*
Author to whom correspondence should be addressed.
Minerals 2018, 8(6), 226; https://doi.org/10.3390/min8060226
Submission received: 25 April 2018 / Revised: 15 May 2018 / Accepted: 25 May 2018 / Published: 26 May 2018

Abstract

:
To better understanding the evolutionary characteristics of pore structure in marine shale with high thermal maturity, a natural Longmaxi marine shale sample from south China with a high equivalent vitrinite reflectance value (Ro = 2.03%) was selected to conduct an anhydrous pyrolysis experiment (500–750 °C), and six artificial shale samples (pyrolysis products) spanning a maturity range from Ro = 2.47% to 4.87% were obtained. Experimental procedures included mercury intrusion, nitrogen adsorption, and carbon dioxide adsorption, and were used to characterize the pore structure. In addition, fractal theory was applied to analyze the heterogeneous pore structure. The results showed that this sample suite had large differences in macropore, mesopore, and micropore volume (PV), as well as specific surface area (SSA) and pore size distributions (PSD), at different temperatures. Micropore, mesopore, and macropore content increased, from being unheated to 600 °C, which caused the pore structure to become more complex. The content of small diameter pores (micropores and fine mesopores, <10 nm) decreased and pores with large diameters (large mesopores and macropores, >10 nm) slightly increased from 600 to 750 °C. Fractal analysis showed that larger pore sizes had more complicated pore structure in this stage. The variance in pore structure for samples during pyrolysis was related to the further transformation of organic matter and PSD rearrangement. According to the data in this study, two stages were proposed for the pore evolution for marine shale with high thermal maturity.

1. Introduction

Inspired by the success of the exploration and development of shale gas in North America [1], China began to study shale gas in 2005 and has made great breakthroughs in recent years, especially for marine shale gas in south China [2]. The marine shale from south China is characterized by large thickness, high total organic carbon (TOC) content, high brittle minerals content, and high thermal maturity [3,4]. High thermal maturity is a major feature of marine shale in south China (vitrinite reflectance (Ro) values typically range between 2.0 and 4.5%), which is much higher than shale from North America (Ro values are commonly 1–2.5%) [5]. Many studies have argued that high thermal maturity is a major risk for further exploration of marine shale gas in the Yangtze Platform of south China [6]. Pore structure, adsorbed capacity, shale gas components are all influenced by thermal maturity [7,8,9,10,11]. Thermal maturity is one of the major controlling factors that affect the pore structure in shale, and shale pore systems are critical for storing and releasing hydrocarbon gas and determining the productivity of shale gas from low permeability and unconventional reservoirs [12,13]. Therefore, the influence of thermal maturity on pore structure has attracted more attention in recent years.
Curtis used SEM (scanning electron microscopy) to qualitatively describe pore evolutionary characteristics from 0.51%Ro to 6.36%Ro and suggested that OM (organic matter) pores are not developed when the Ro is less than 0.9%. In addition, secondary OM pores disappeared in a 6.36%Ro sample [14]. Obviously, SEM techniques cannot quantify pore structure parameters and SEM images may not represent the samples at a given thermal maturity, so no conclusive differences in pore structure during maturation were obtained from their studies. Mastalerz et al. selected five natural shale samples that ranged in maturity from 0.35 to 1.41% to quantitatively characterize the evolutionary characteristics of pore structure based on mercury intrusion and gas adsorption, and proposed a model [15]. There were two shortcomings in their study: (1) Pore evolution of higher maturity was not addressed in their work and (2) although the five natural shale samples had different Ro values, the quartz, clay, and TOC content were also different. Therefore, the interference of shale components for pore evolution could not be ruled out. Sun et al. and Bai et al. used hydrous pyrolysis to investigate the evolution of porosity for oil-shale samples and divided the formation and development of pore structure into three stages corresponding to OM evolution [16,17]. Chen and Xiao selected a suite of Upper Permian low maturity shale samples to conduct anhydrous pyrolysis, and investigated the evolution of micropores and mesopores [18]. There were clear differences between oil-shale, Upper Permian shale, and marine shale such as the kerogen type and mineral composition [19], and therefore they may have had a different pore evolution pattern through maturation. Pore evolution characteristics of shale in the Longmaxi Formation from south China were investigated by Liu et al. [20], and the effects of TOC, thermal maturity, diagenesis and tectonism on shale porosity were also discussed. Based on the effects of thermal maturity on shale porosity evolution, three stages for pore evolution of Longmaxi shale were proposed [20]. However, the evolutionary characteristics of micropore, mesopore, and macropore specific surface area (SSA), as well as pore volume (PV) and pore size distributions (PSD) were not further addressed in their work. In this study, therefore, a suite of natural Silurian Longmaxi marine shale samples was collected from south China and six artificial shale samples across a maturation gradient were obtained using anhydrous pyrolysis. Pore structure was characterized using mercury intrusion, nitrogen (N2) adsorption, and carbon dioxide (CO2) adsorption. In addition, fractal theory was applied to analyze the heterogeneous pore structure. The evolutionary characteristics of pores in marine shale with high thermal maturity were then described.

2. Samples and Methods

In order to conduct the anhydrous pyrolysis experiment, one block marine shale sample from the Longmaxi Formation in south China was selected. This shale sample was collected from an outcrop but there was no sign of weathering or oxidation, and detailed information on this initial sample is described in Section 3.1.
The anhydrous pyrolysis experiment was conducted at the State Key Laboratory of Organic Geochemistry in the Chinese Academy of Sciences, and the experimental apparatus and process can be found in reference [18]. In this study, the preset temperature interval was 50 °C and it ranged from 500 to 750 °C. Therefore, the initial sample was divided into six sections and each shale sample was prepared to have a height of 2.5 cm and a cylindrical shape with a diameter of 2.5 cm. Every heating run was performed on a new batch of samples. Then six artificial shale samples (pyrolysis products) and the initial sample were tested using gas physisorption (N2 and CO2) and mercury intrusion to characterize the pore structure. The methods used in this study were the same as in our previous studies [5,21,22] which described in detail the experimental apparatus and process, and they are not discussed further in this paper.

3. Results and Discussion

3.1. Mineral Composition and Organic Geochemistry

The Ro value of the initial sample M-0 was 2.03%, which corresponded to the high over-mature stage, and the TOC content was 3.84%, indicating that the shale had fair to good source potential [23]. The primary kerogen type was type I according to the type index (TI) and carbon stable isotope values (Table 1). Previous studies have also suggested the kerogen type of Longmaxi shale was mainly type I, followed by type II1 [4,24]. Quartz was the dominant in the sample up to 62.5%, followed by clay minerals. Illite was the major clay mineral type up to 82%, followed by Illite/Smectite (Table 2).
Table 3 shows the Ro values of the samples at the preset temperatures. Ro values increased with increasing temperature with an approximately linear correlation and ranged from 2.47% to 4.87%, which corresponded to the highly over-mature stage. A temperature and time index model and the widely used EASY%Ro model have been proposed by Waples and Sweeney, respectively, which characterize the relationships between thermal maturity, temperature, and time [25,26]. Therefore, the Ro values obtained from the simulation temperatures can be used to represent the shale sample maturity. Chen and Xiao also used an anhydrous pyrolysis experiment to characterize the evolutionary characteristics of shale pores [18]. The preset temperature in their study was similar to that of our study and the Ro values obtained from the preset temperatures were also similar.

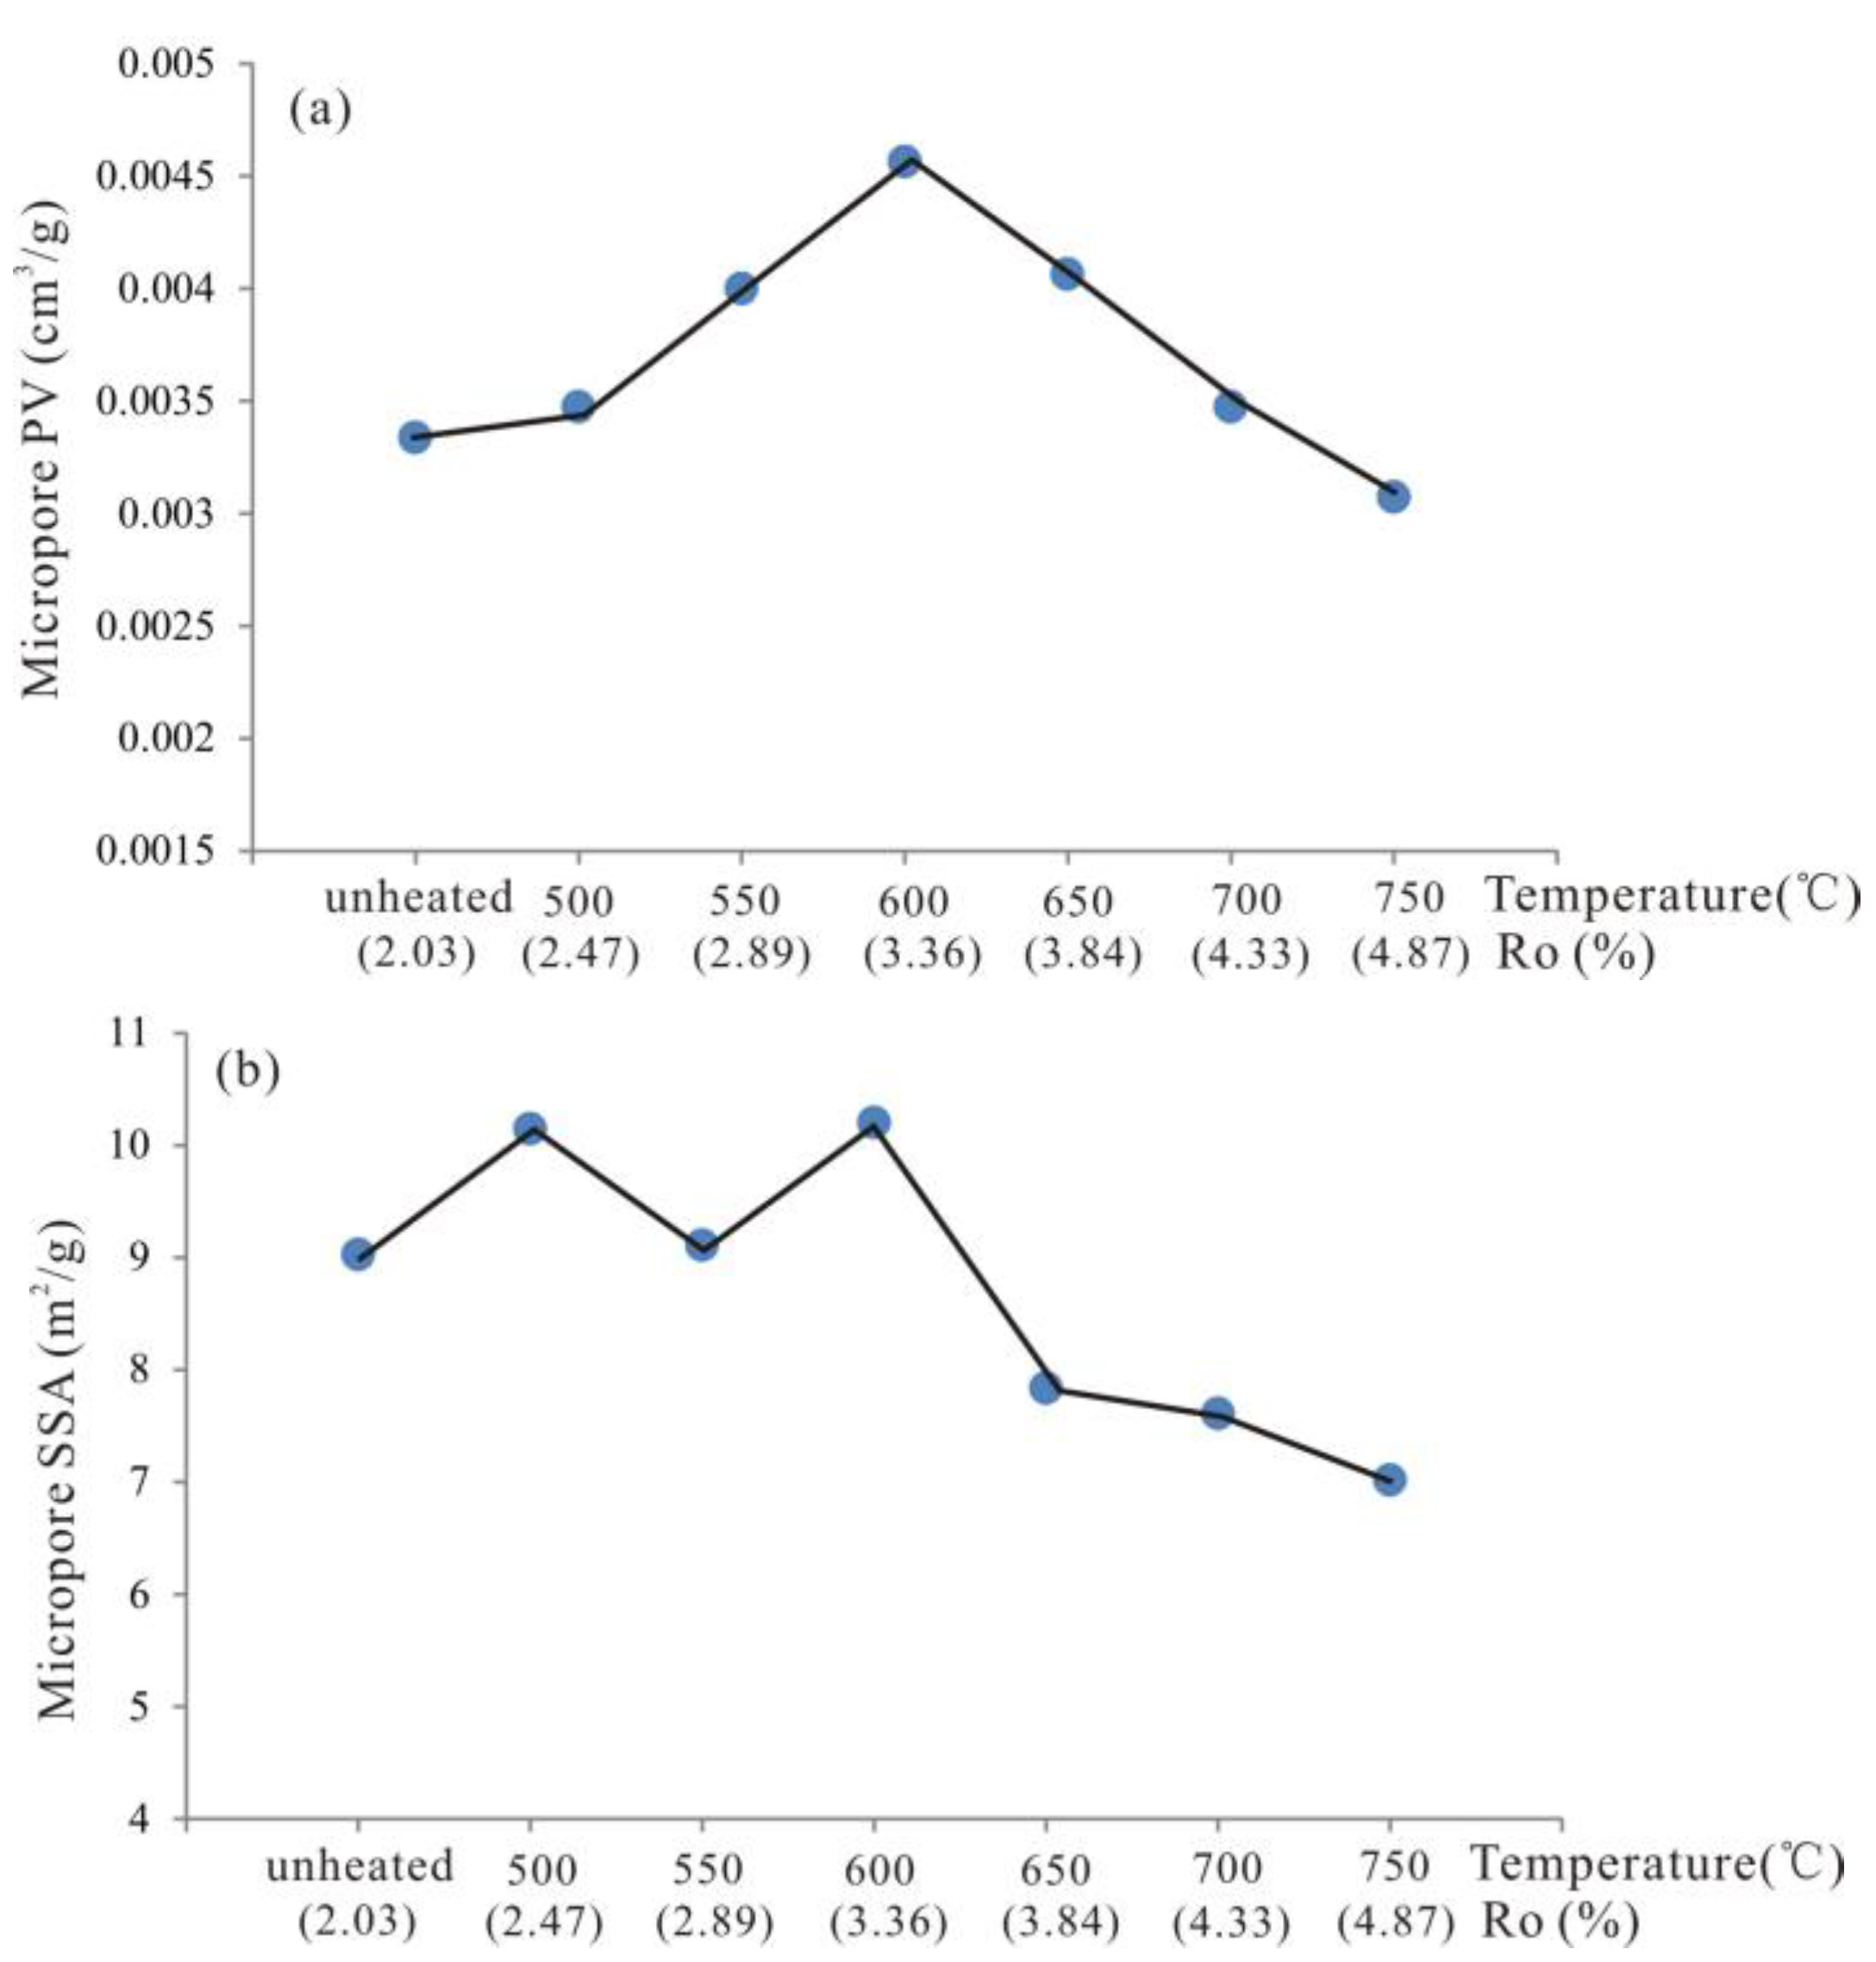
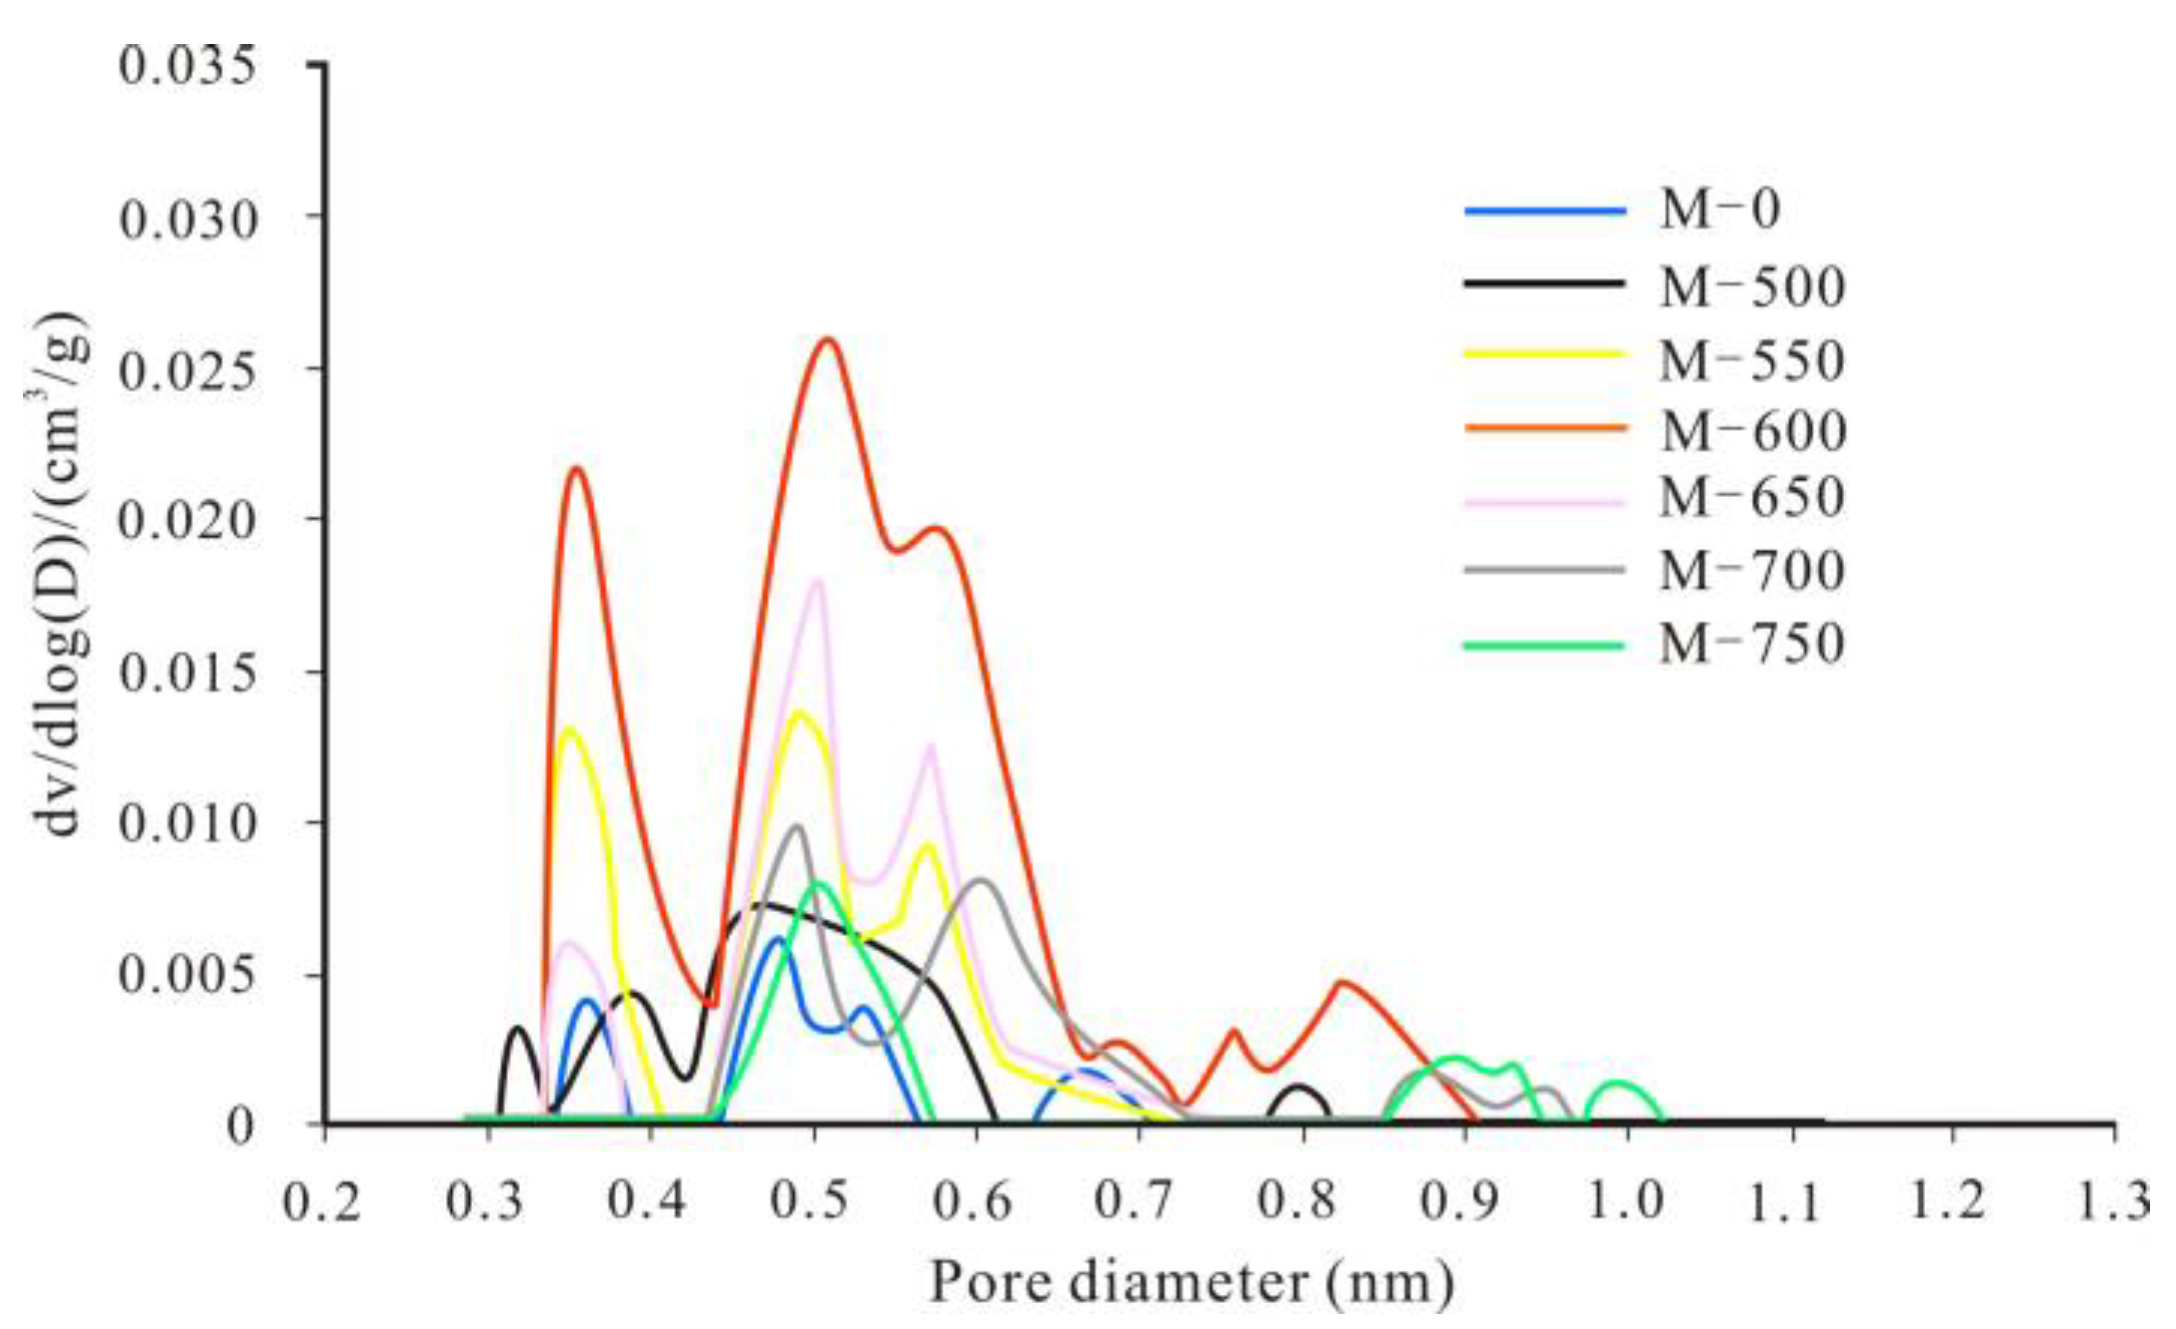
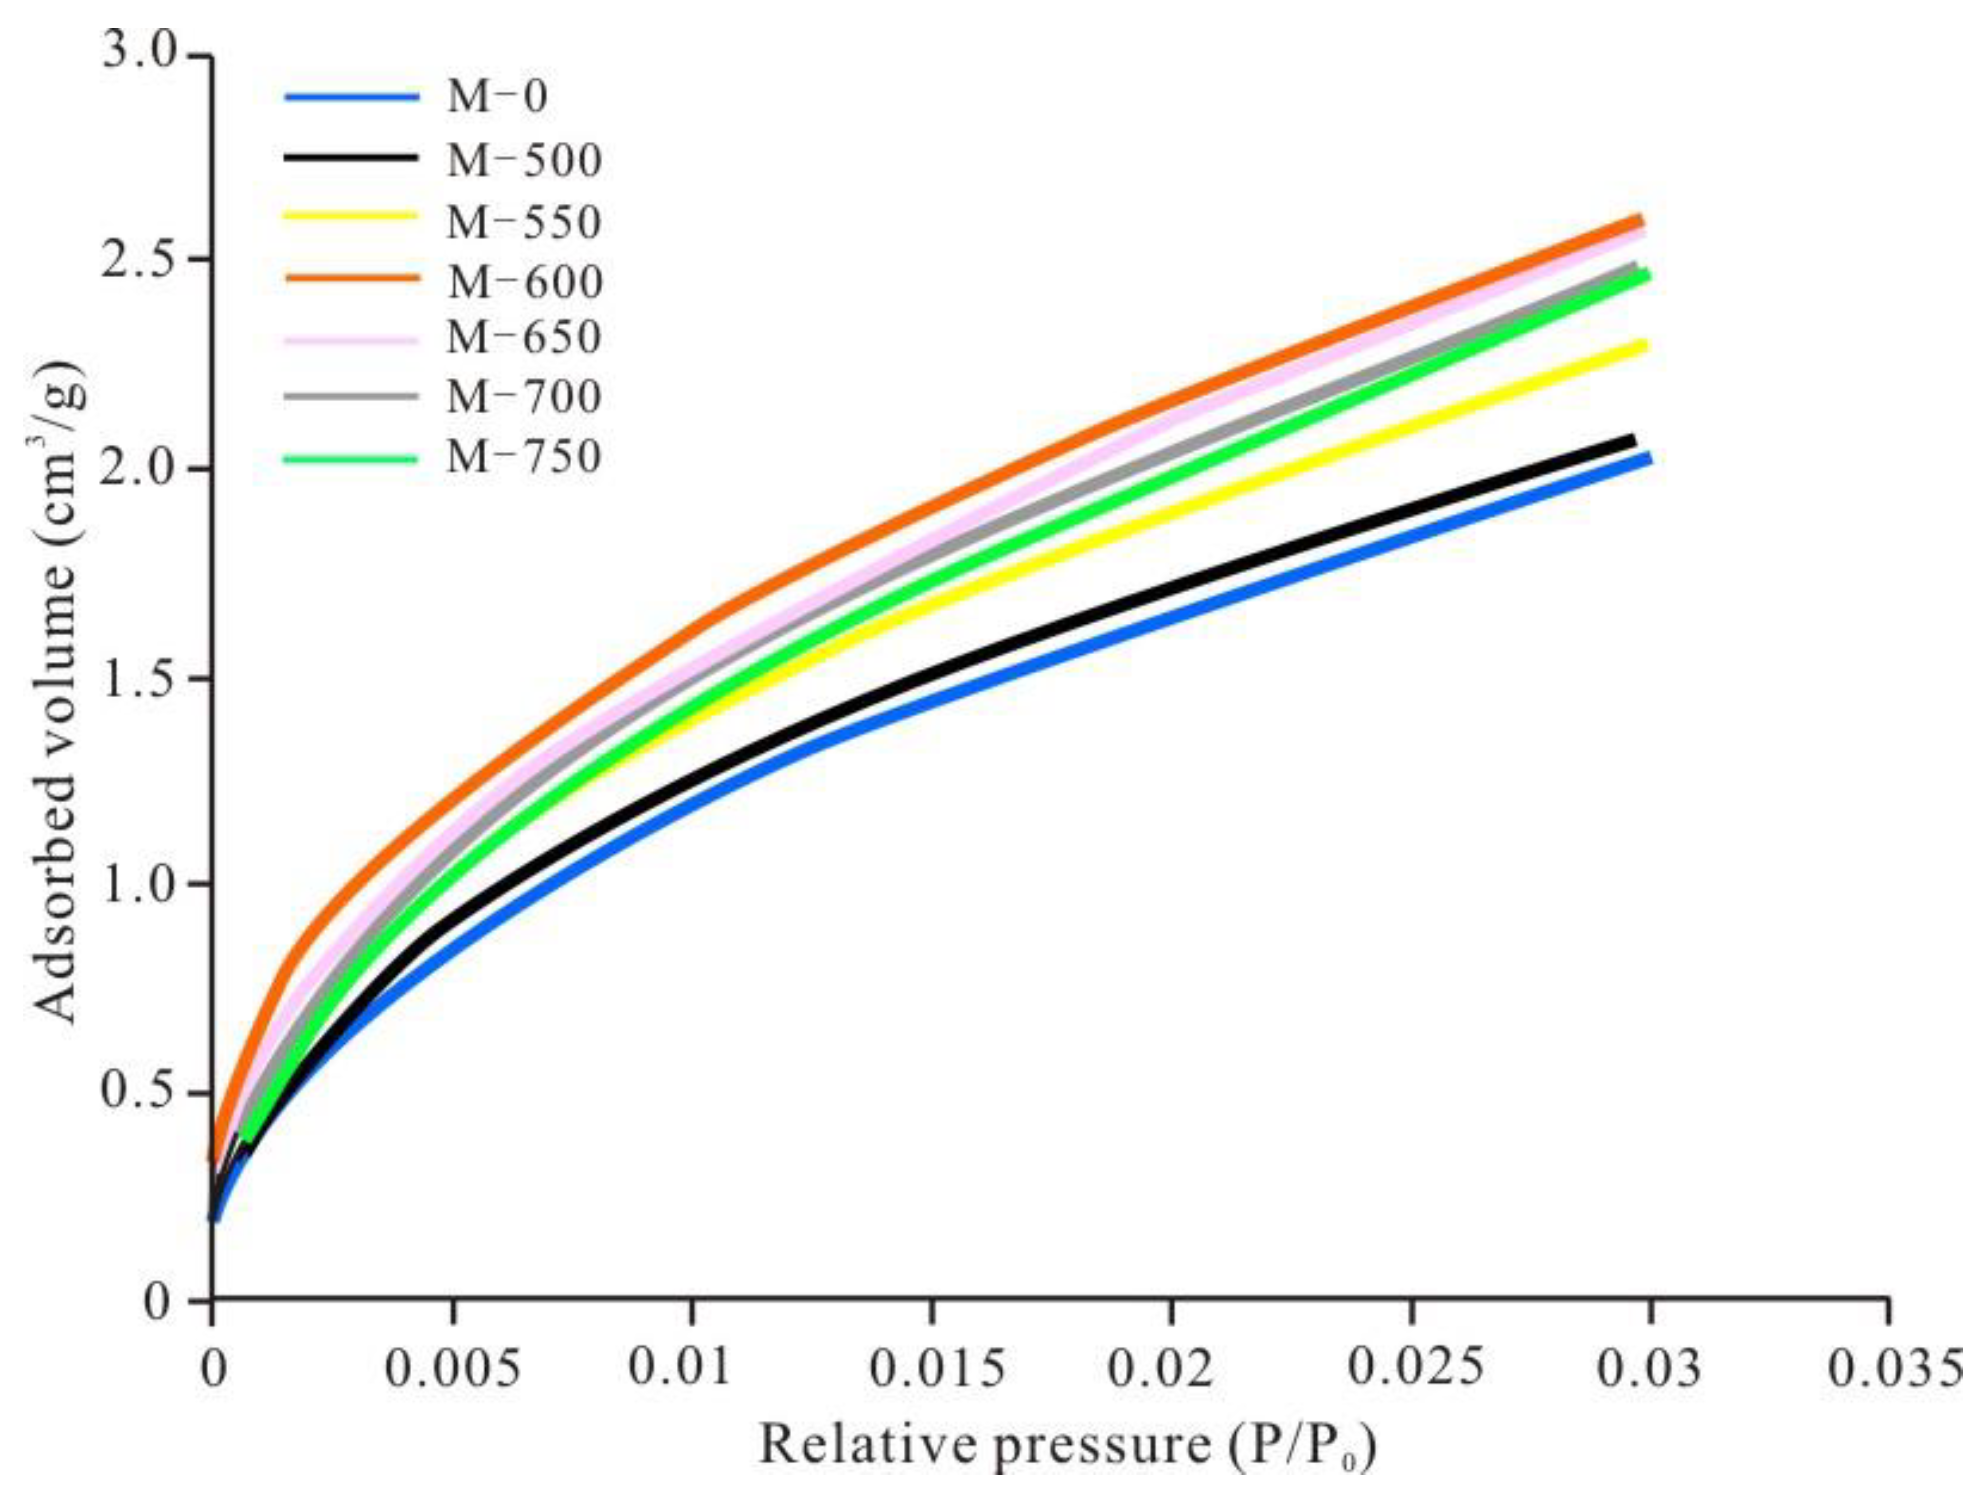
3.2. Evolutionary Characteristics of Micropores

The micropore characteristics were quantified using a CO2 adsorption experiment [15,21]. According to the International Union of Pure and Applied Chemistry (IUPAC) classification, the CO2 isotherms of this sample suite were close to type I. Sample M-600 (Ro = 3.36%) adsorbed the most CO2 volume and sample M-0 adsorbed the least (Figure 1). The adsorbed CO2 volume increased with increasing temperature up to 600 °C and then decreased as temperature continued to increase to 750 °C. This tendency is consistent with micropore PV and SSA.
The micropore PV and SSA increased with increasing temperature to a maximum value at 600 °C, and micropore PV and SSA decreased toward the highest maturity sample M-750 (Ro = 4.87%) (Figure 2). The evolutionary characteristics of micropores do not follow a linear increasing trend as suggested by previous studies [29] and there was a reduction in micropore content above 600 °C. There was also a reduction in shale porosity in the oil window as indicated by many previous studies [30,31], and the primary reason was pore blocking by liquid hydrocarbon [32]. Then, there was a rapid increase in pore content after the oil window due to OM cracking, which formed a large number of pores, and the OM pores were mostly micropores and fine mesopores [5,21]. Therefore, the increasing micropore SSA and PV below 600 °C may be attributed to further OM cracking. Chen and Xiao also suggested OM still can gradually evolve into pore development before Ro = 3.50% [18]. As temperature increased further (after 600 °C in this study), however, the OM had almost no ability for hydrocarbon generation to form pores and a further increase of aromatic fused ring condensation led to graphitization and resulted in a decrease in micropore content.
Micropore PSD of this sample suite changed somewhat from unheated to 750 °C, although there were several volumetric maxima in all shale samples with pore sizes ranging from 0.2 to 1.1 nm (Figure 3). Samples M-0, M-500, M-550, and M-600 had three clear volumetric maxima at 0.35, 0.5, and 0.58 nm, except for sample M-600, which had another peak at 0.85 nm. Samples M-650, M-700, and M-750 had three different volumetric maxima at 0.5, 0.6, and 0.9 nm. This bimodal distribution of micropore characteristics before and after 600 °C indicated that the shale lost some of the smaller micropores but generated some large micropores. This increase in large micropores and a decrease in micropore PV indicated decreasing quantities of micropores after 600 °C.

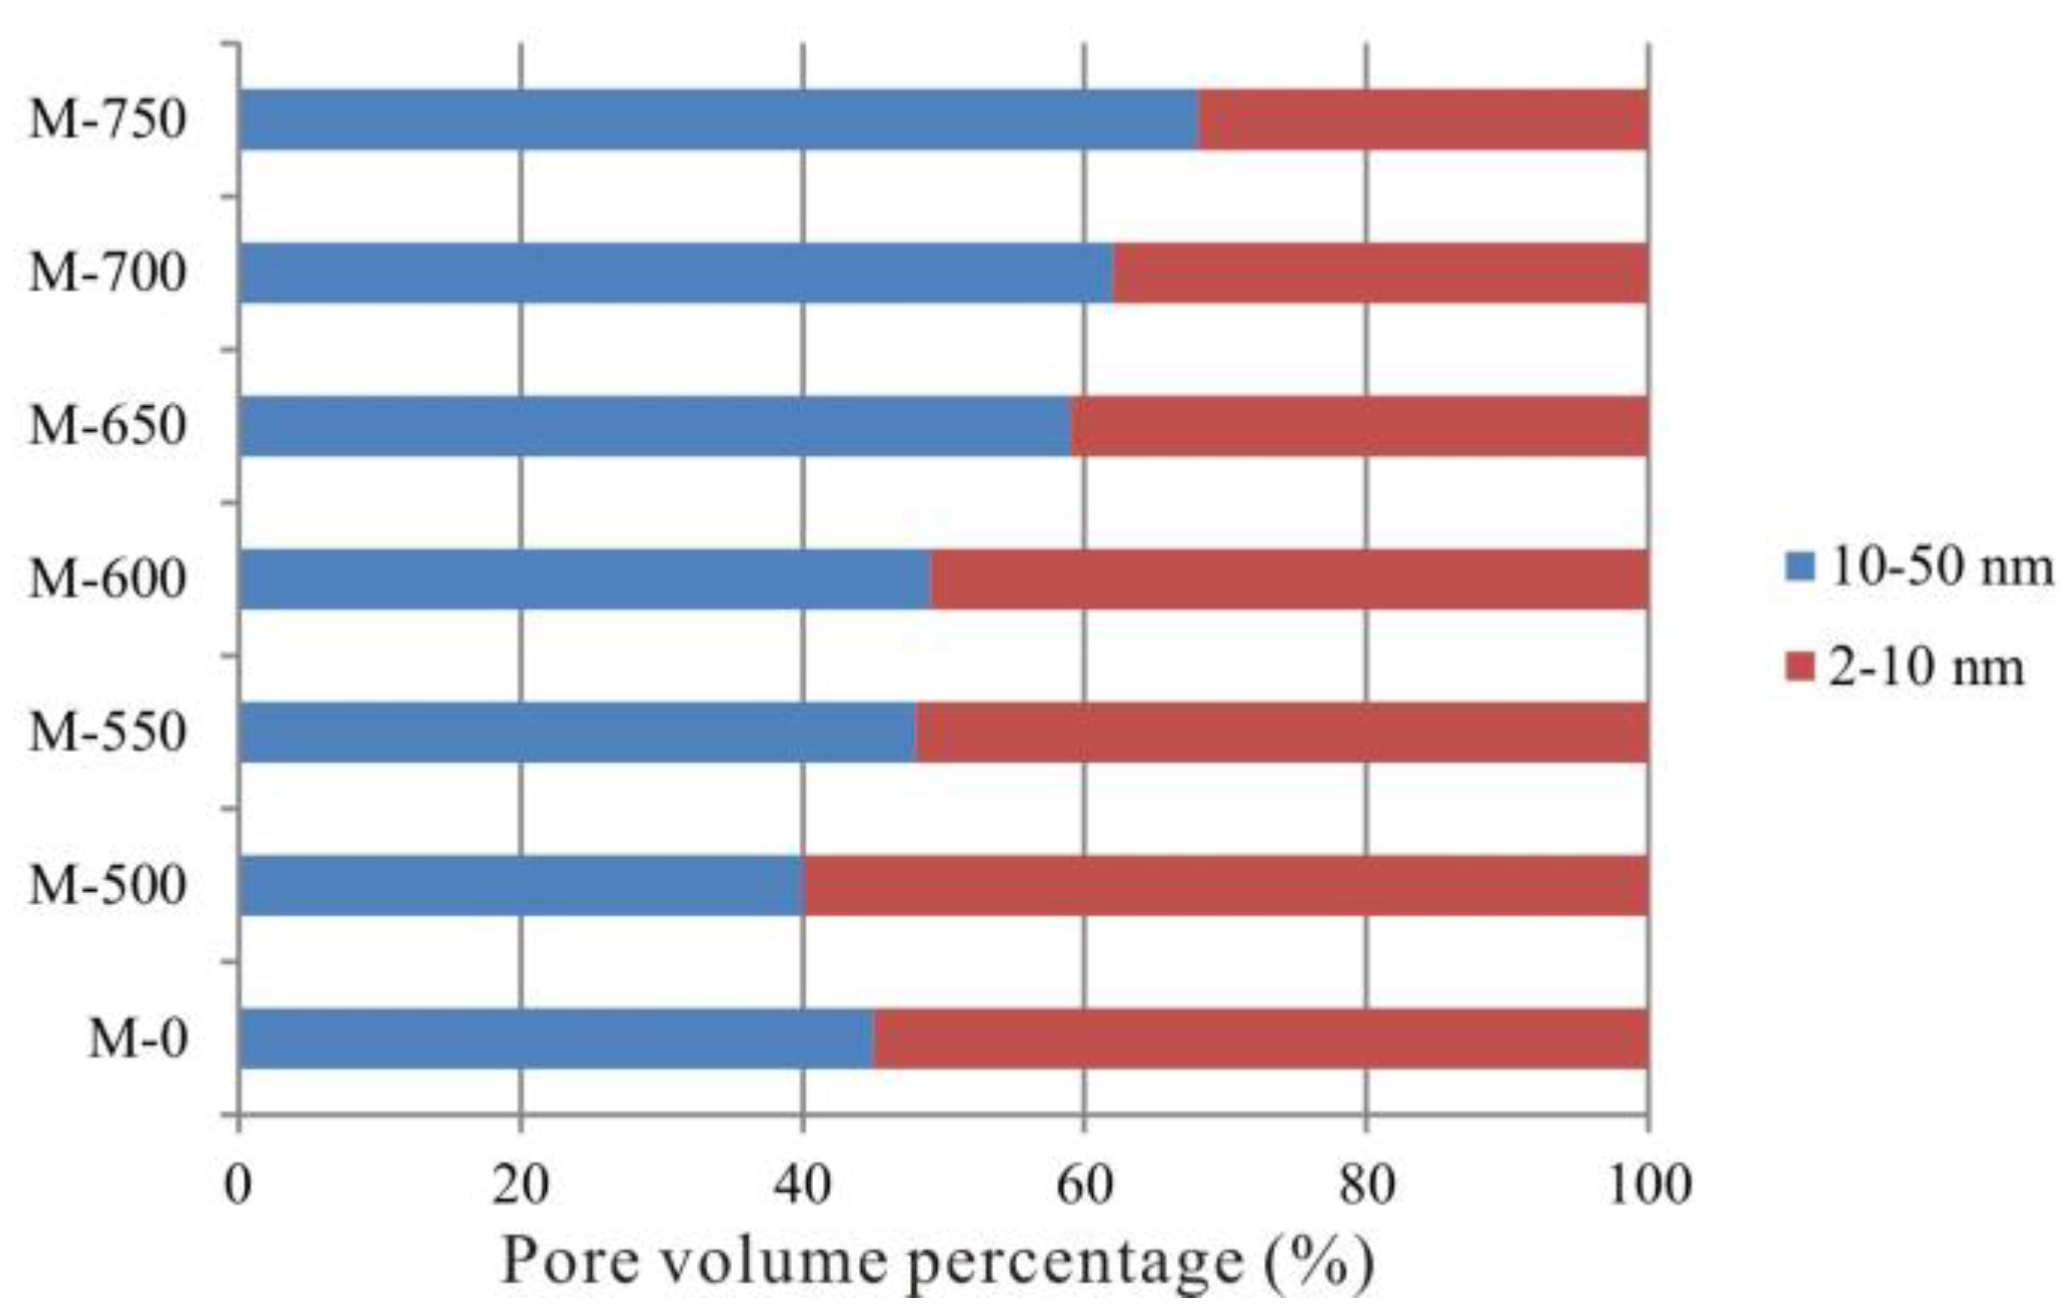
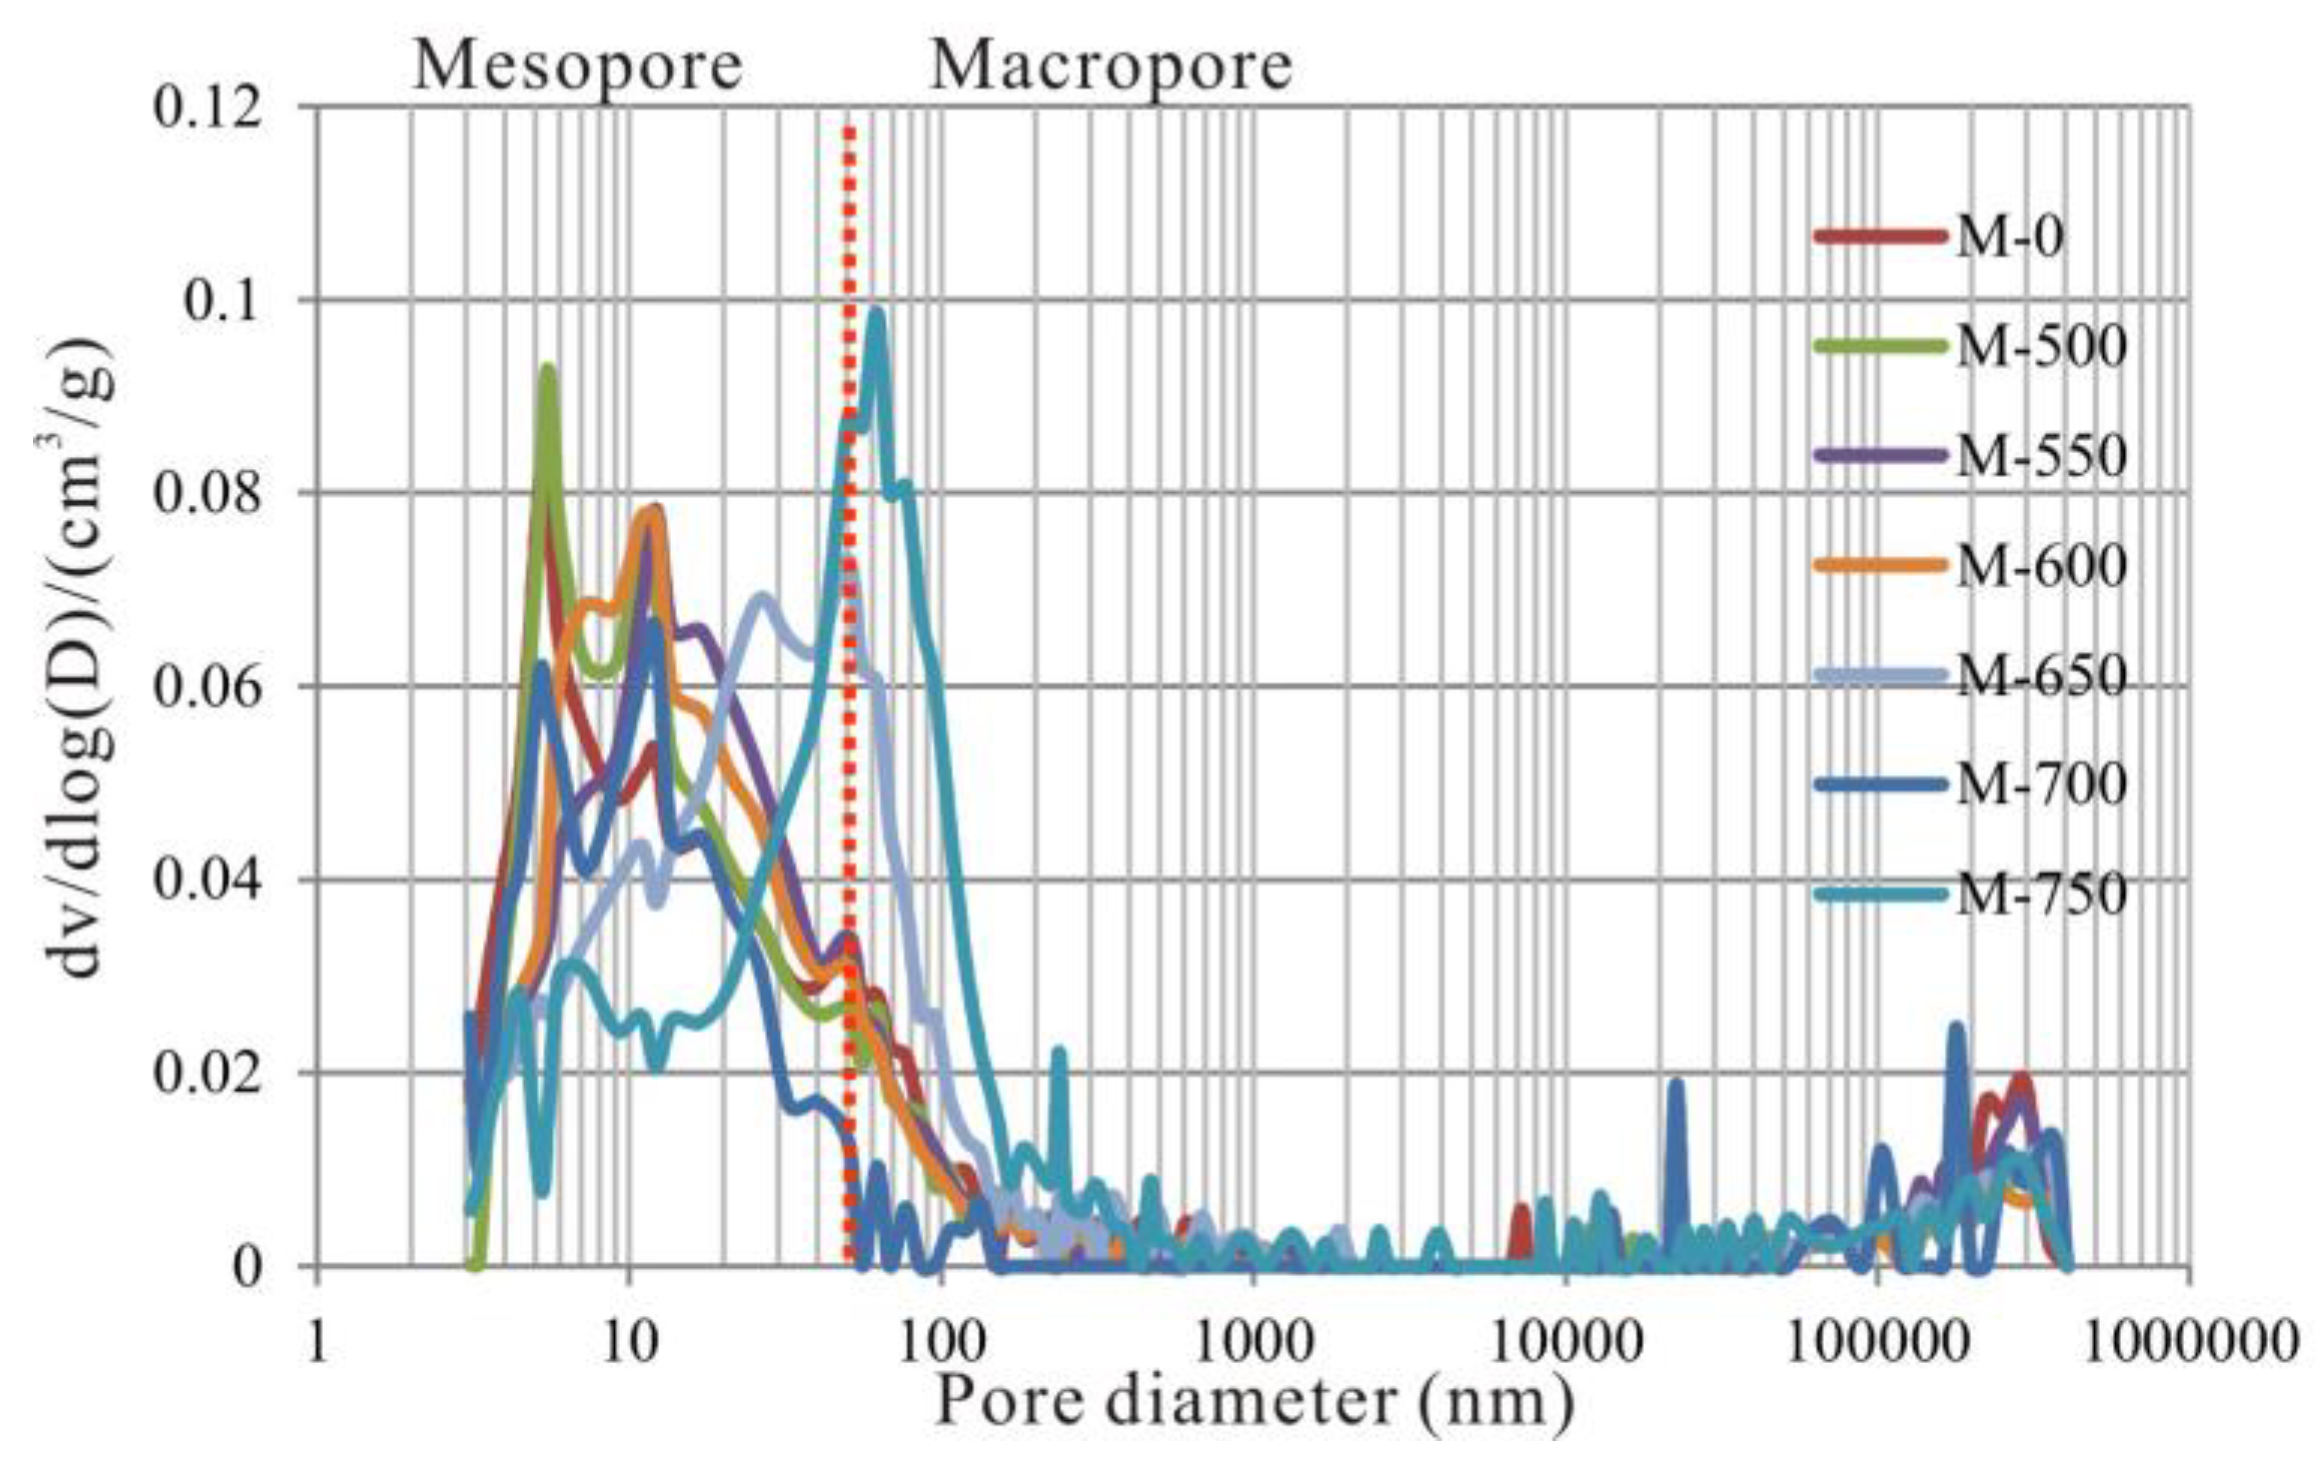
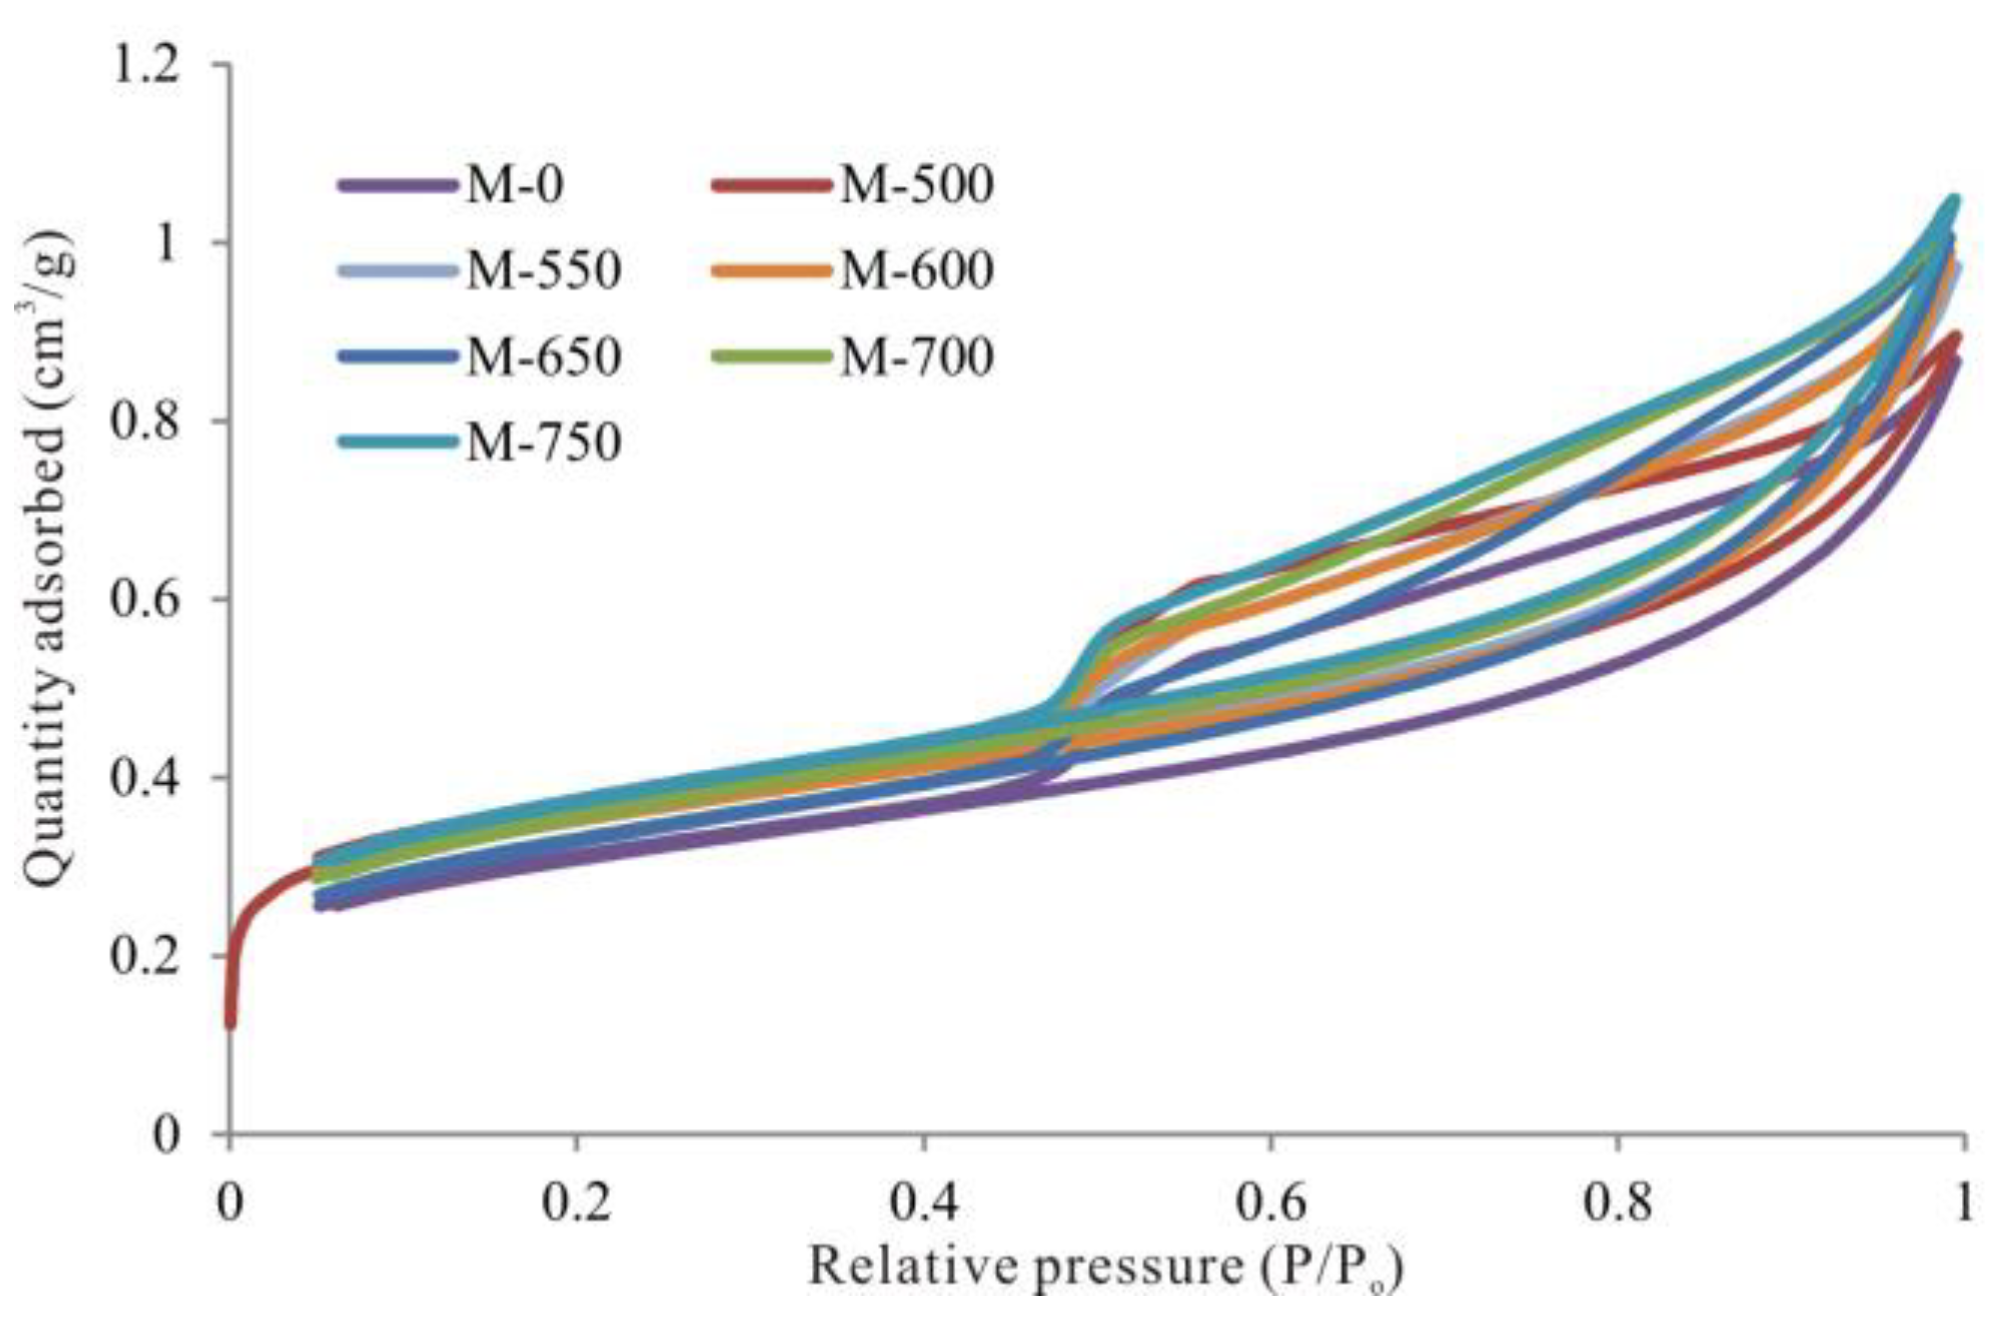
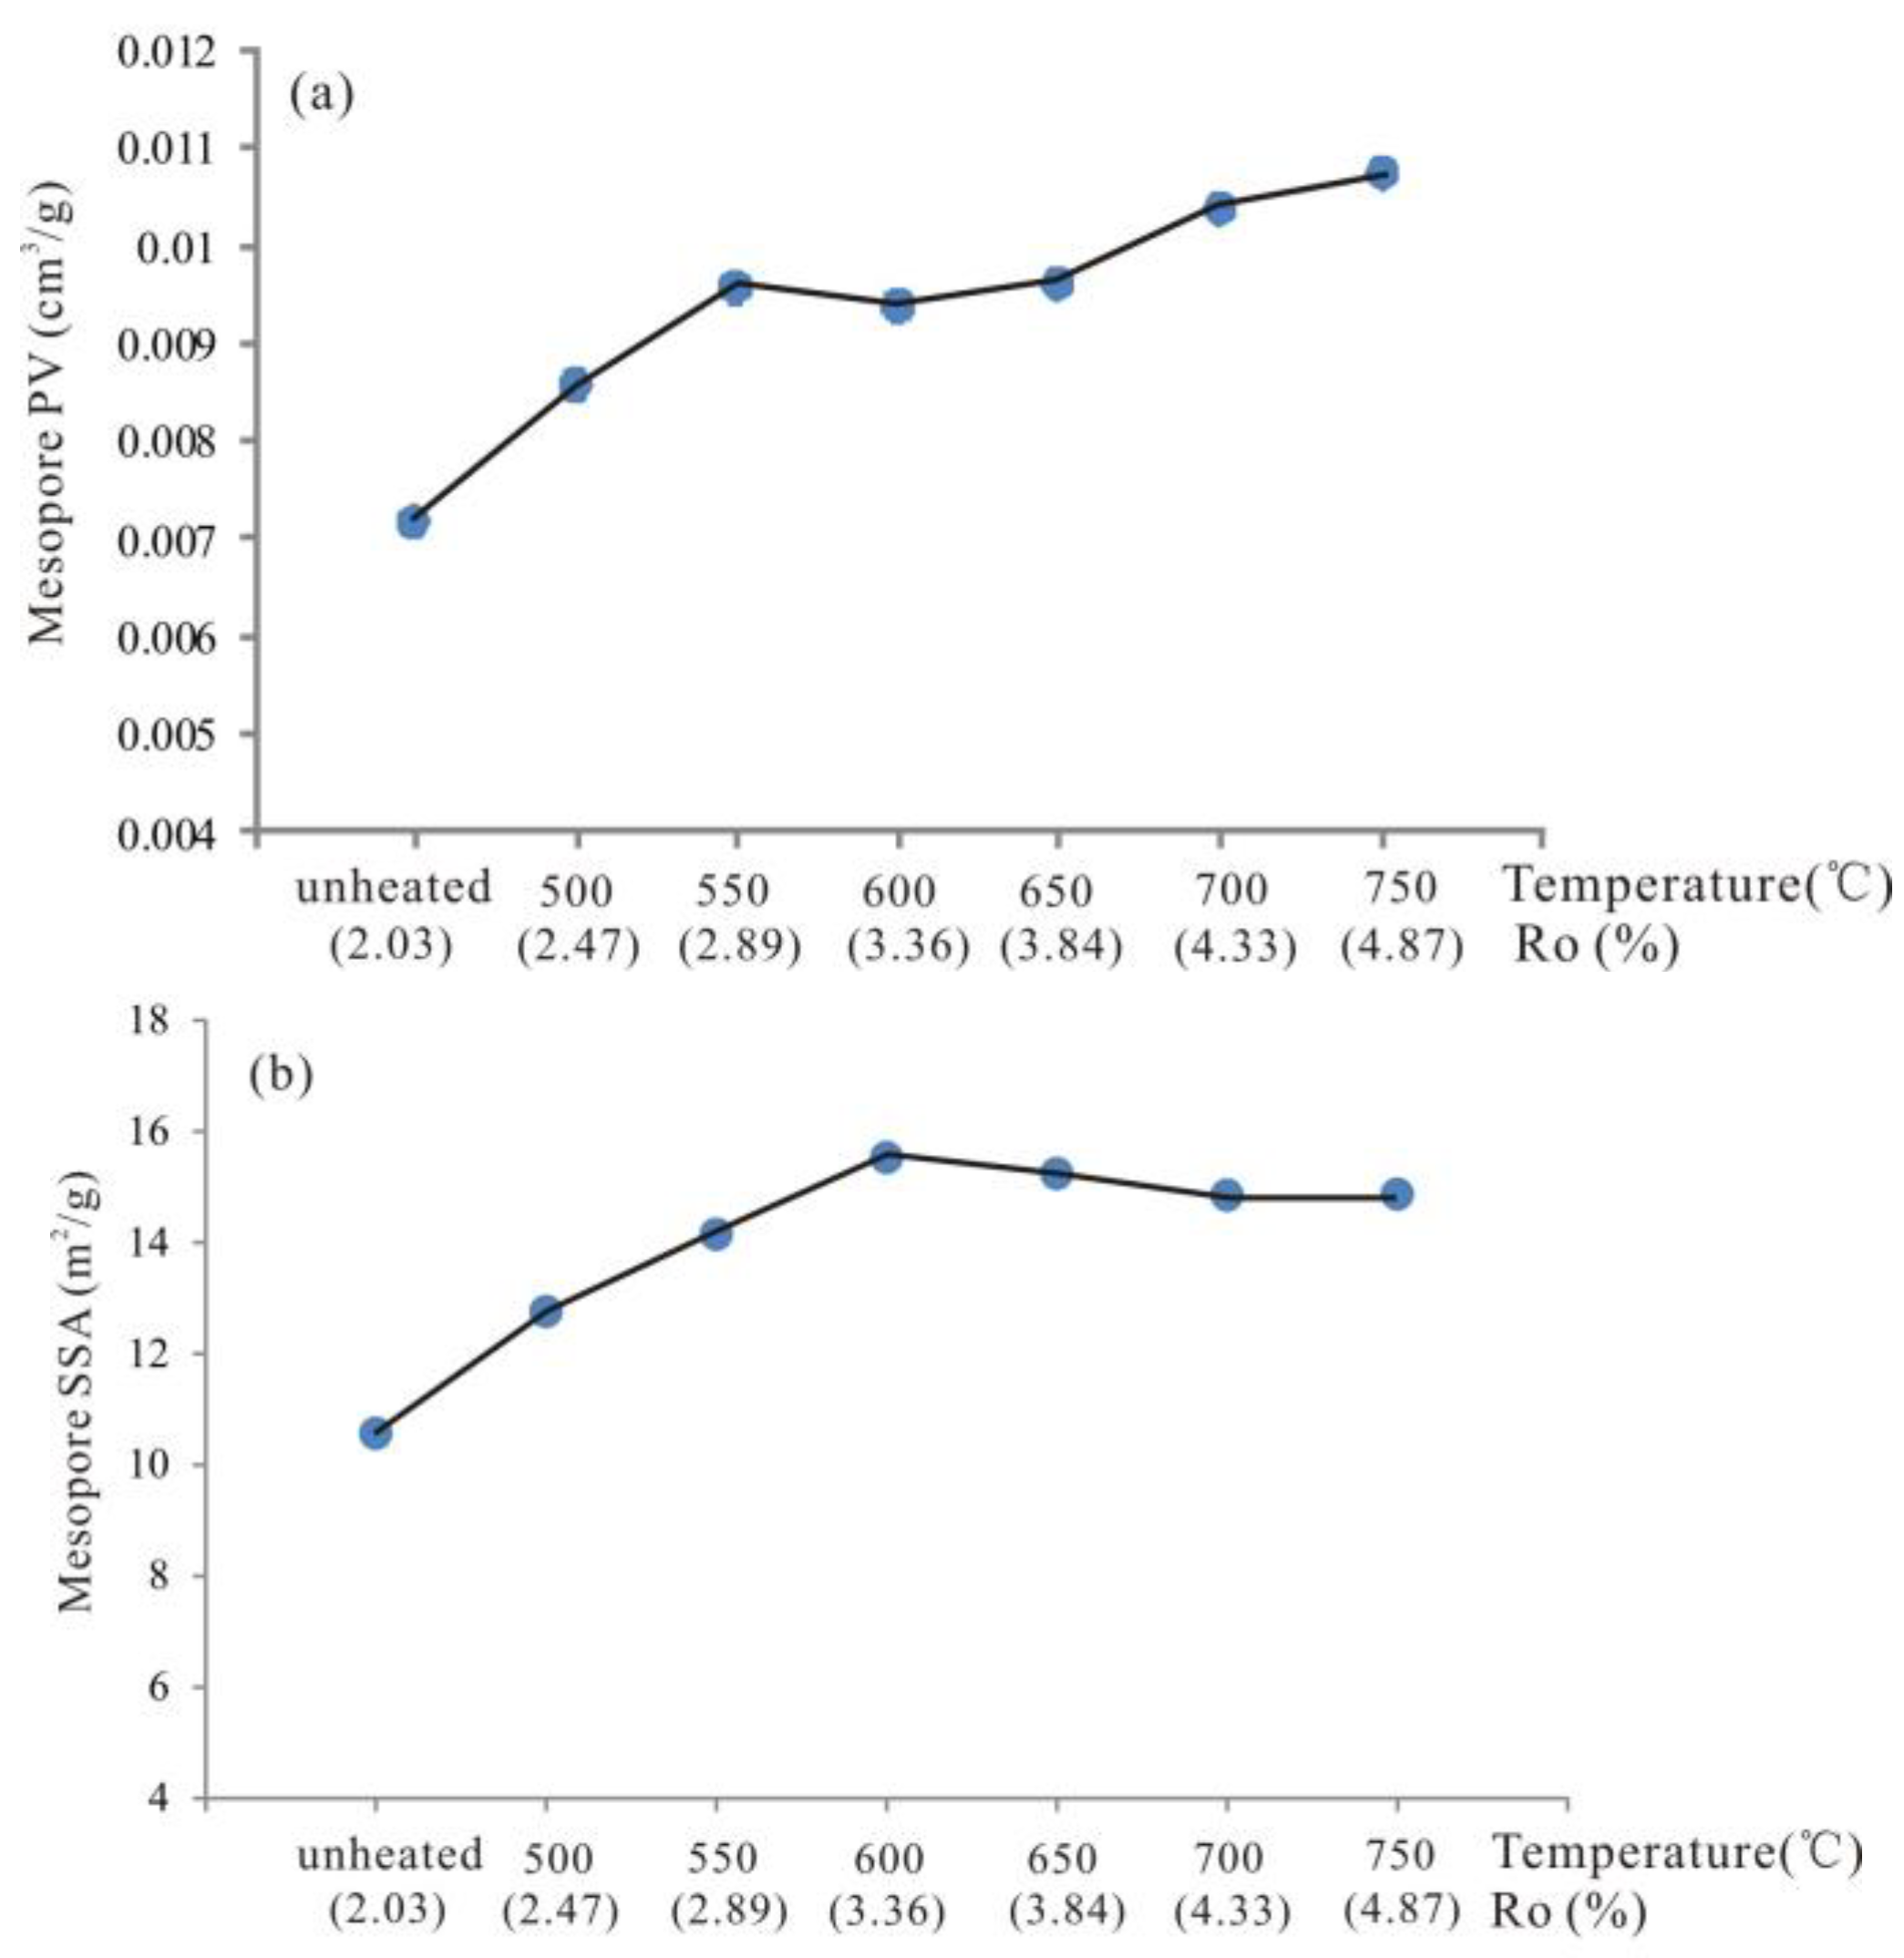
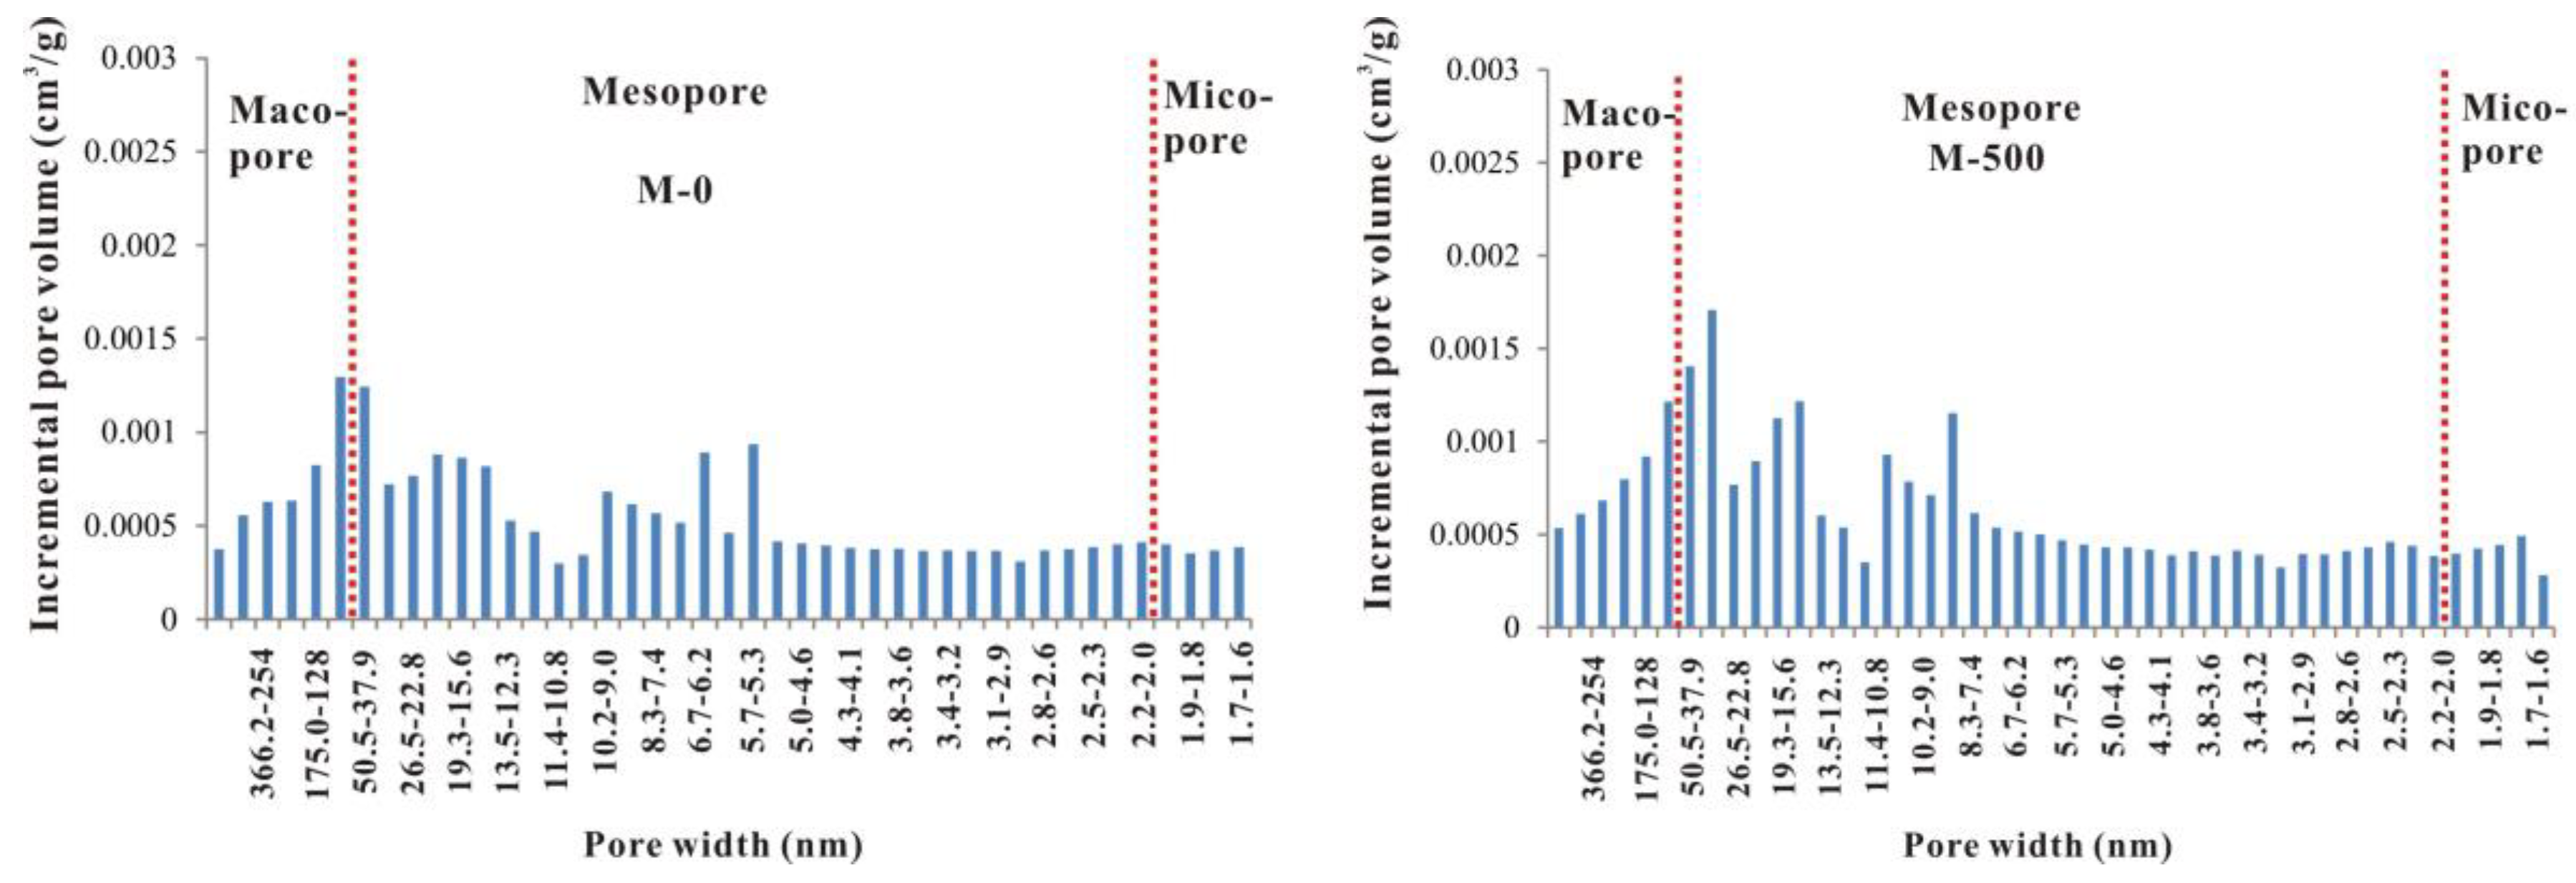
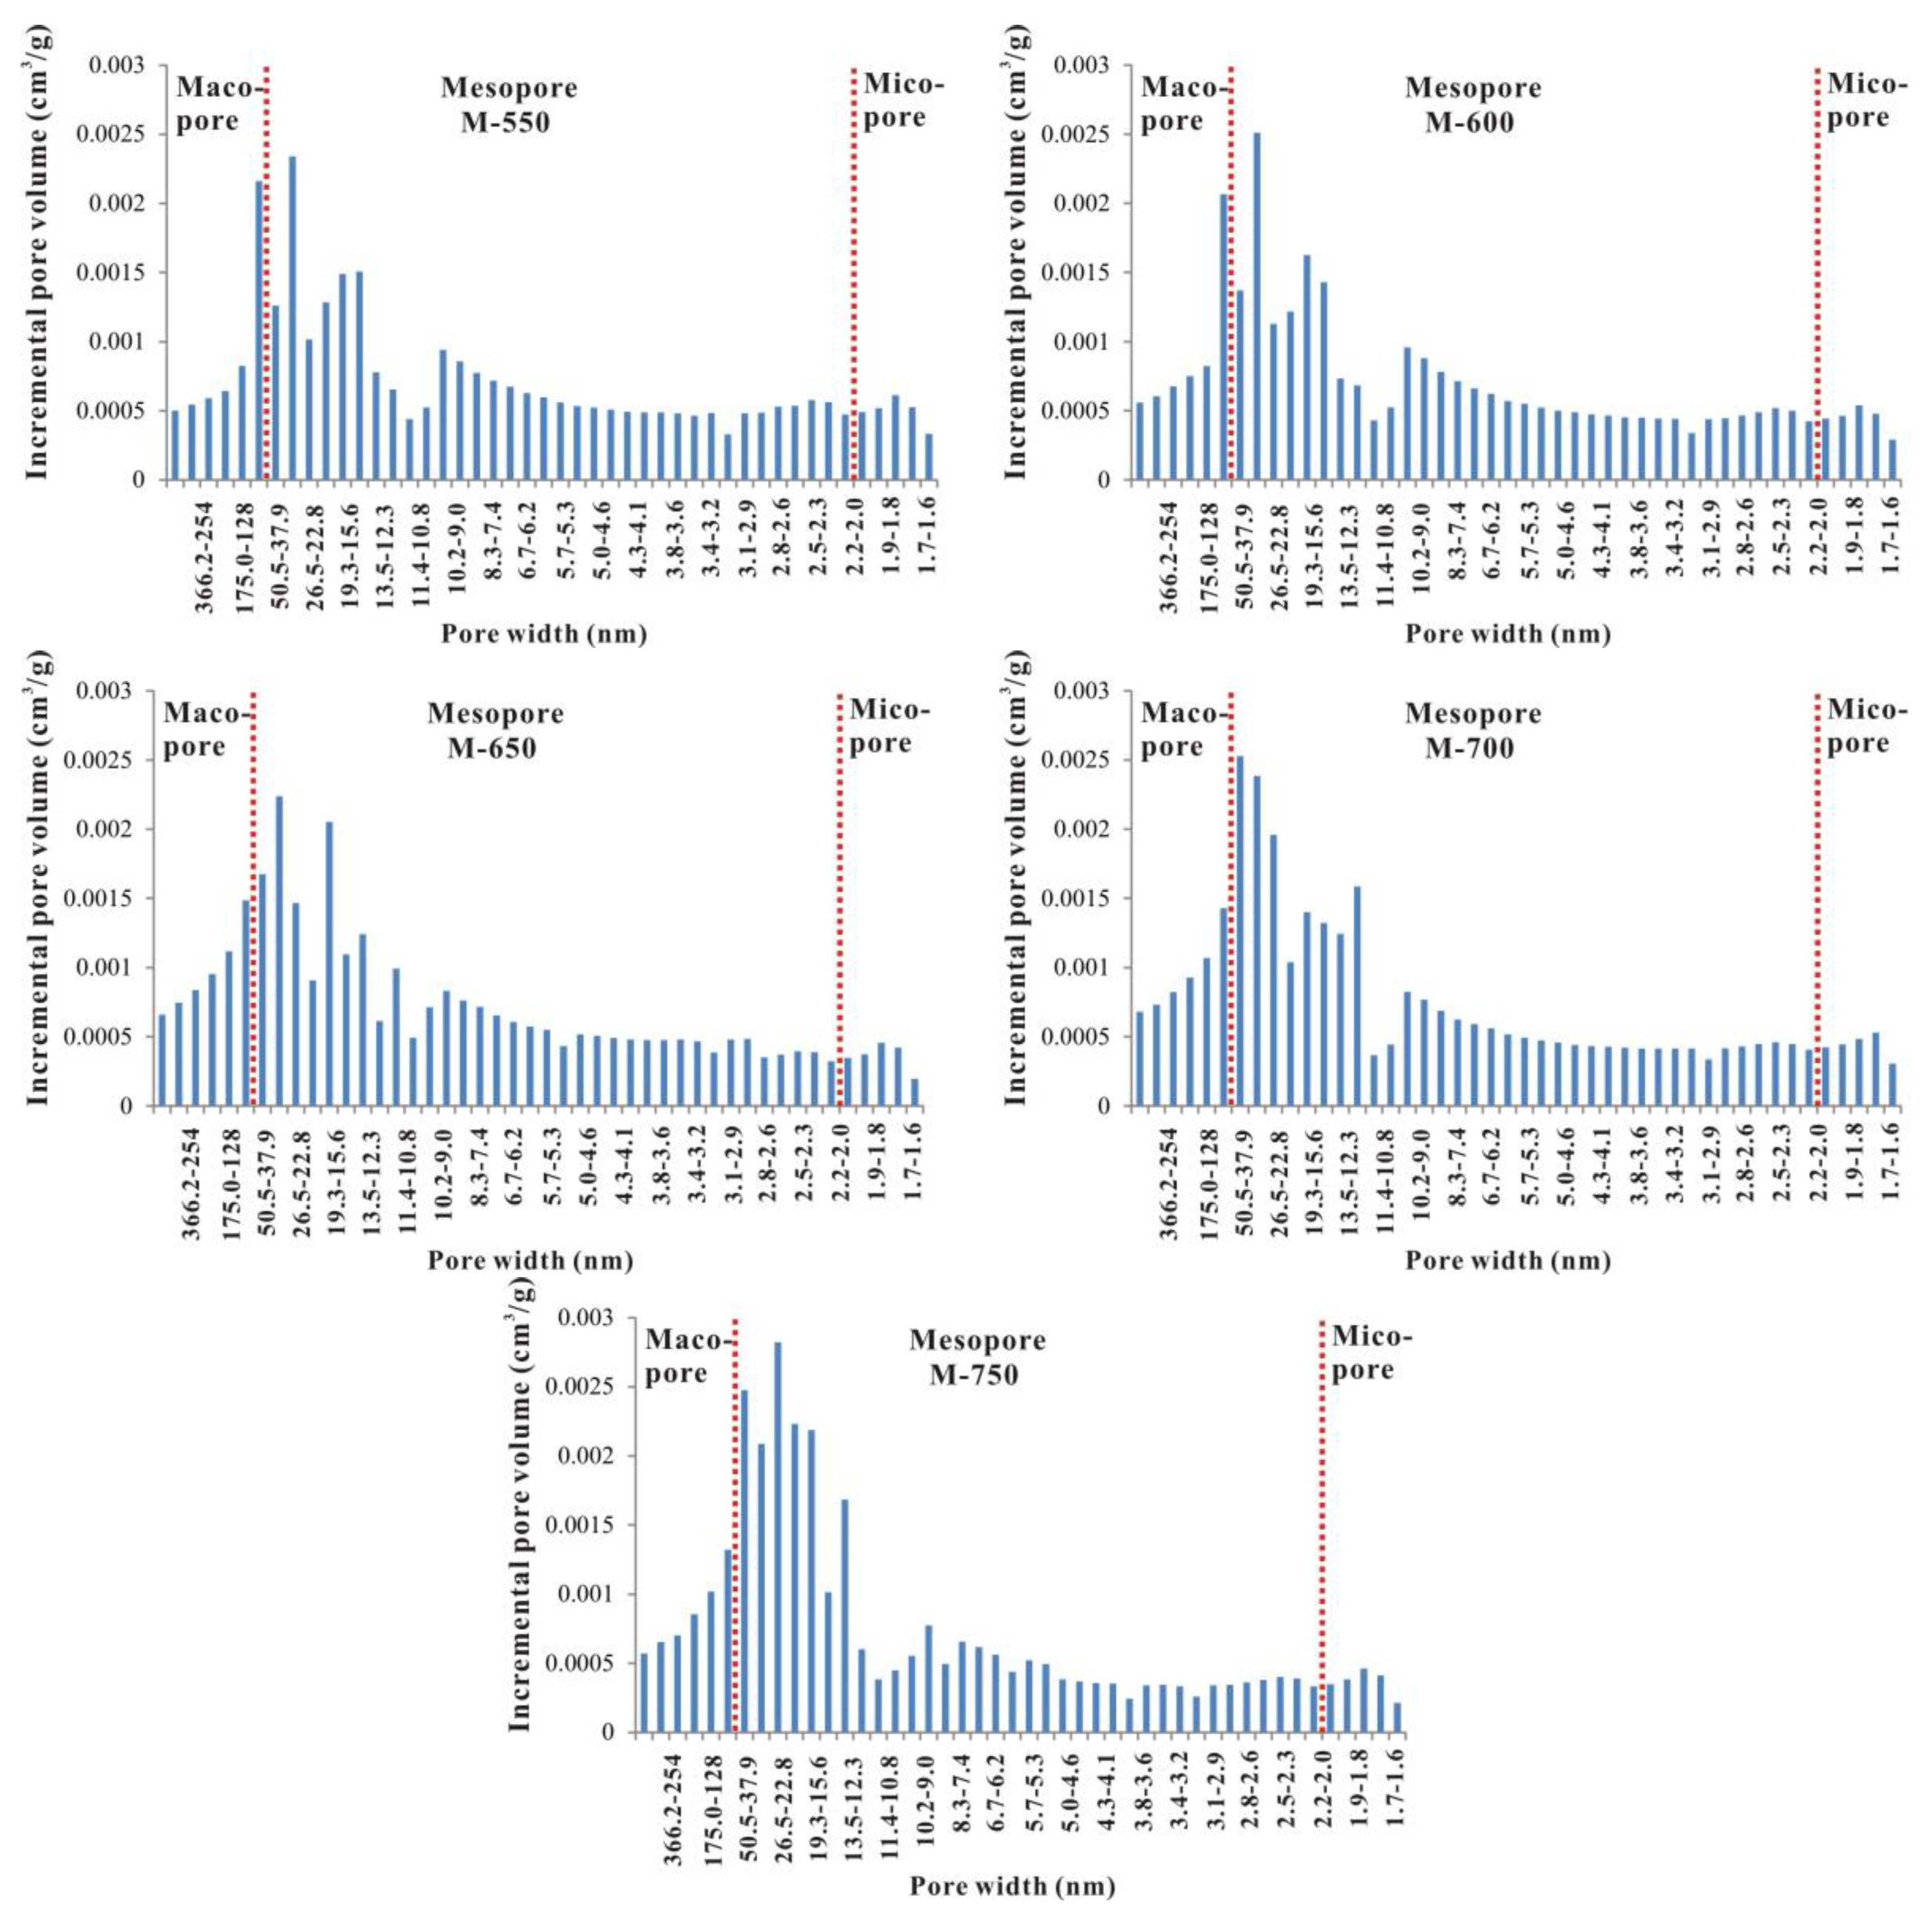
3.3. Evolutionary Characteristics of Mesopores

The mesopore characteristics were quantified using a N2 adsorption experiment [15,21]. N2 isotherms for this sample suite were close to the type VI isotherm, featuring a noticeable hysteresis loop in all samples (Figure 4). The hysteresis loop was due to capillary condensation taking place in mesopore structures in general [20,33]. The shape of the hysteresis loop was between types H2 and H3, indicating that silt-shaped and inkbottle-shaped pores were the primary pore types according to the IUPAC interpretation. The adsorbed nitrogen amount did not follow the amount of adsorbed CO2. Sample M-750 adsorbed the most N2 volume and sample M-0 adsorbed the least. Mesopore PV increased with increasing temperature (Figure 5a), whereas mesopore SSA increased with increasing temperature up to 600 °C and then decreased beyond 600 °C (Figure 5b).
The reason for the different evolutionary characteristics of mesopore PV and SSA may have been due to mesopore PSD rearrangement (Figure 6 and Figure 7). As shown in Figure 6, PV values of mesopores 2–50 nm in size increased with increasing temperature from unheated to 600 °C, whereas PV values of mesopores 10–50 nm in size continued to gradually increase with temperature from 600 to 750 °C but the PV for mesopores 2–10 nm in size slightly decreased. Mesopores of 2–10 nm in size contributed most to the mesopore PV for samples M-0, M-500, M-550, and M-600, whereas mesopores of 10–50 nm in size contributed most to the mesopore PV for samples M-650, M-700, and M-750 (Figure 7). Note that pores with large diameters contributed more to PV than SSA, so the decreasing mesopore SSA and increasing PV from 600 to 750 °C may have been due to the transformation of mesopores with small diameters to those with large diameters. In addition, mesopore PSD may also explain why there was a stronger positive relationship between mesopore SSA and temperatures up to 600 °C than for PV. We believe increasing mesopore SSA and PV from unheated to 600 °C may have also been due to further OM cracking.

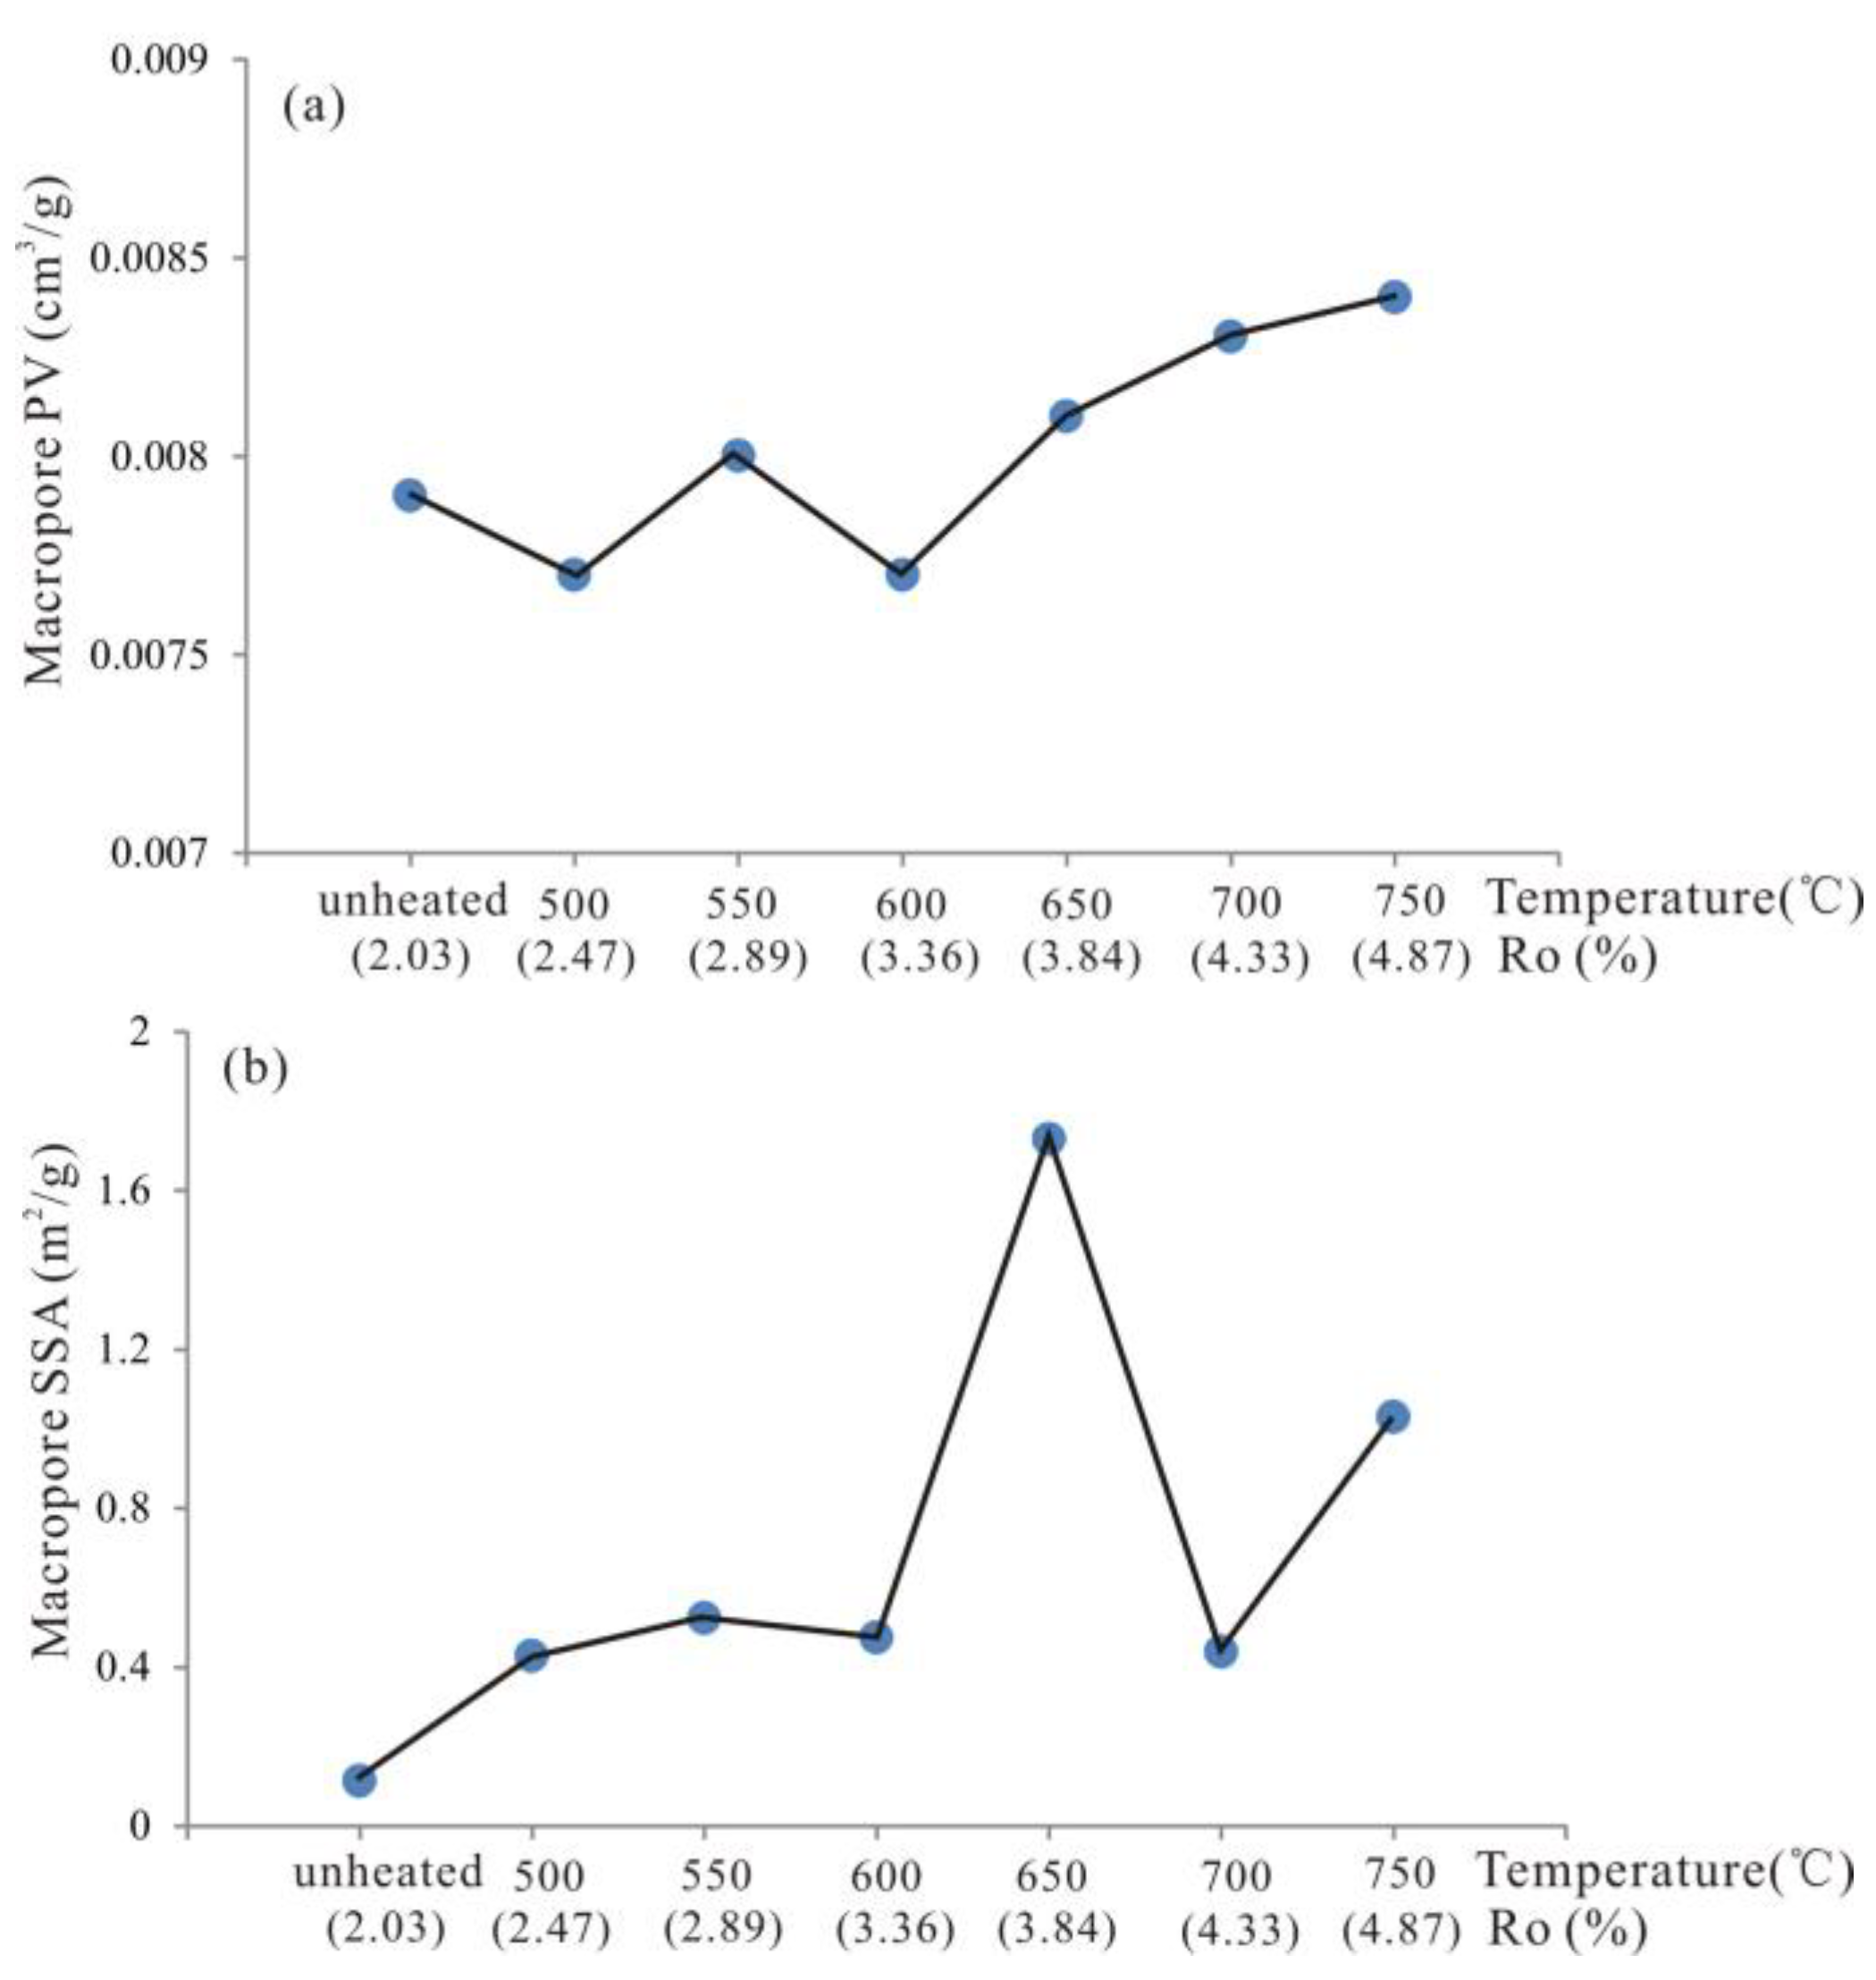
3.4. Evolutionary Characteristics of Macropores

The macropore characteristics were quantified using mercury intrusion [15,21]. The seven samples at different temperatures had similar mercury injection and ejection curves, which were characterized by a wide hysteresis loop. This indicated that a large amount of mercury was still trapped in the pores and there was low pore interconnection at various pyrolysis temperatures. The mercury injection volume had no regular pattern from sample M-0 to M-600, whereas there was a slightly increasing injection volume from sample M-600 to M-750 (Figure 8). This pattern was consistent with macropore PV. The macropore PV changed a little from unheated to 600 °C and there was a slight increase from 600 to 750 °C (Figure 9a). As discussed above, micropore and mesopore PV gradually increased from unheated to 600 °C due to further OM cracking, and previous studies have proposed that an increase in shale pore content during maturation is mostly associated with changes in OM. However, there was almost no change for macropore PV from unheated to 600 °C, indicating that the decomposition of OM had little influence on the development of macropores. The pores associated with OM were mostly small in diameter, which has been observed in many previous studies of natural shale samples [34,35]. The increase in macropore PV from 600 to 750 °C may have been due to the transformation of micropores and mesopores to macropores. Chen and Xiao suggested that pore diameter would enlarge at Ro values above 3.50% [18], and therefore the increase of macropore PV has two possibilities: Expansion of the macropore size or transformation of pores from small to large diameters. In general, pore diameter had a negative correlation with SSA [36], and therefore macropores provided little SSA and the macropore SSA had no regular pattern at various pyrolysis temperatures (Figure 9b).
Macropore PSD is shown in Figure 10. Macropore had not developed in this sample suite and almost no macropores ranging from 100 nm to 10 μm were detected. Only samples M-650 and M-750 peaked at around 70 nm. There are two reasons why macropores may not have developed in shale with high thermal maturity: (1) The Ro value of the initial sample was 2.03%, which indicated that the shale was buried at a depth greater than 4000 m [37], leading to a reduction in macropores due to compaction [15]; (2) the new formed pores had small diameters and were mostly associated with OM.

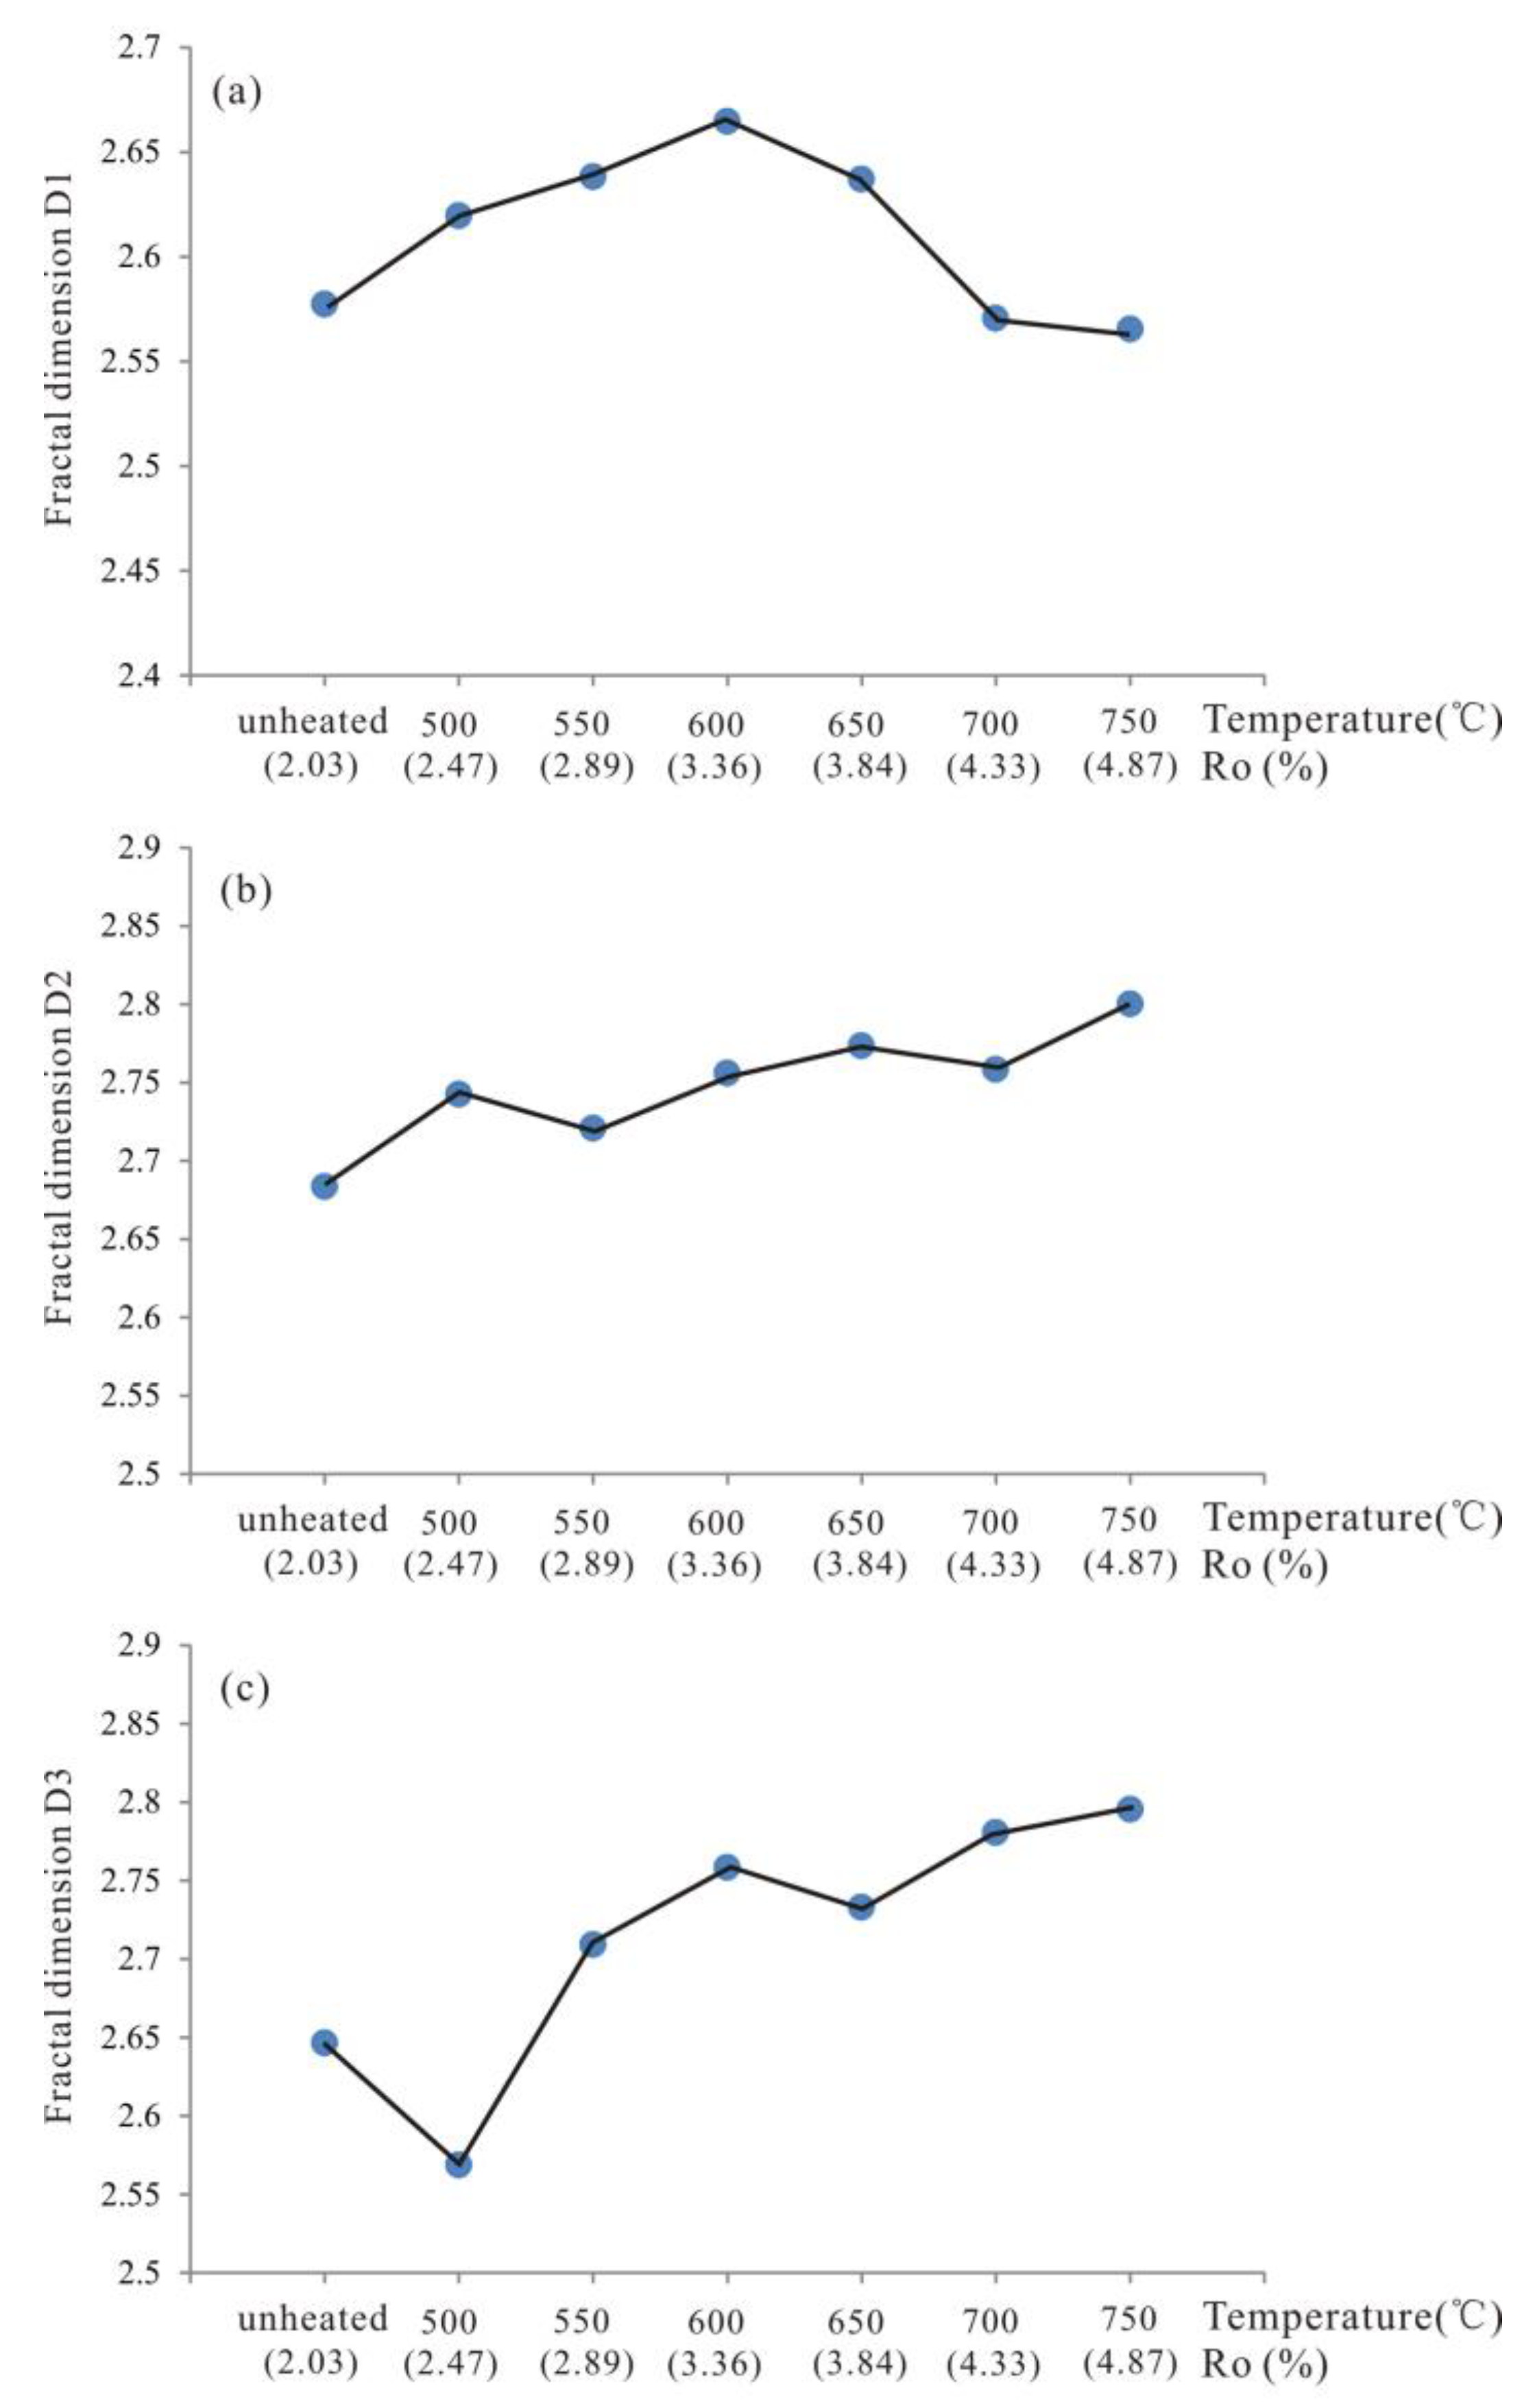
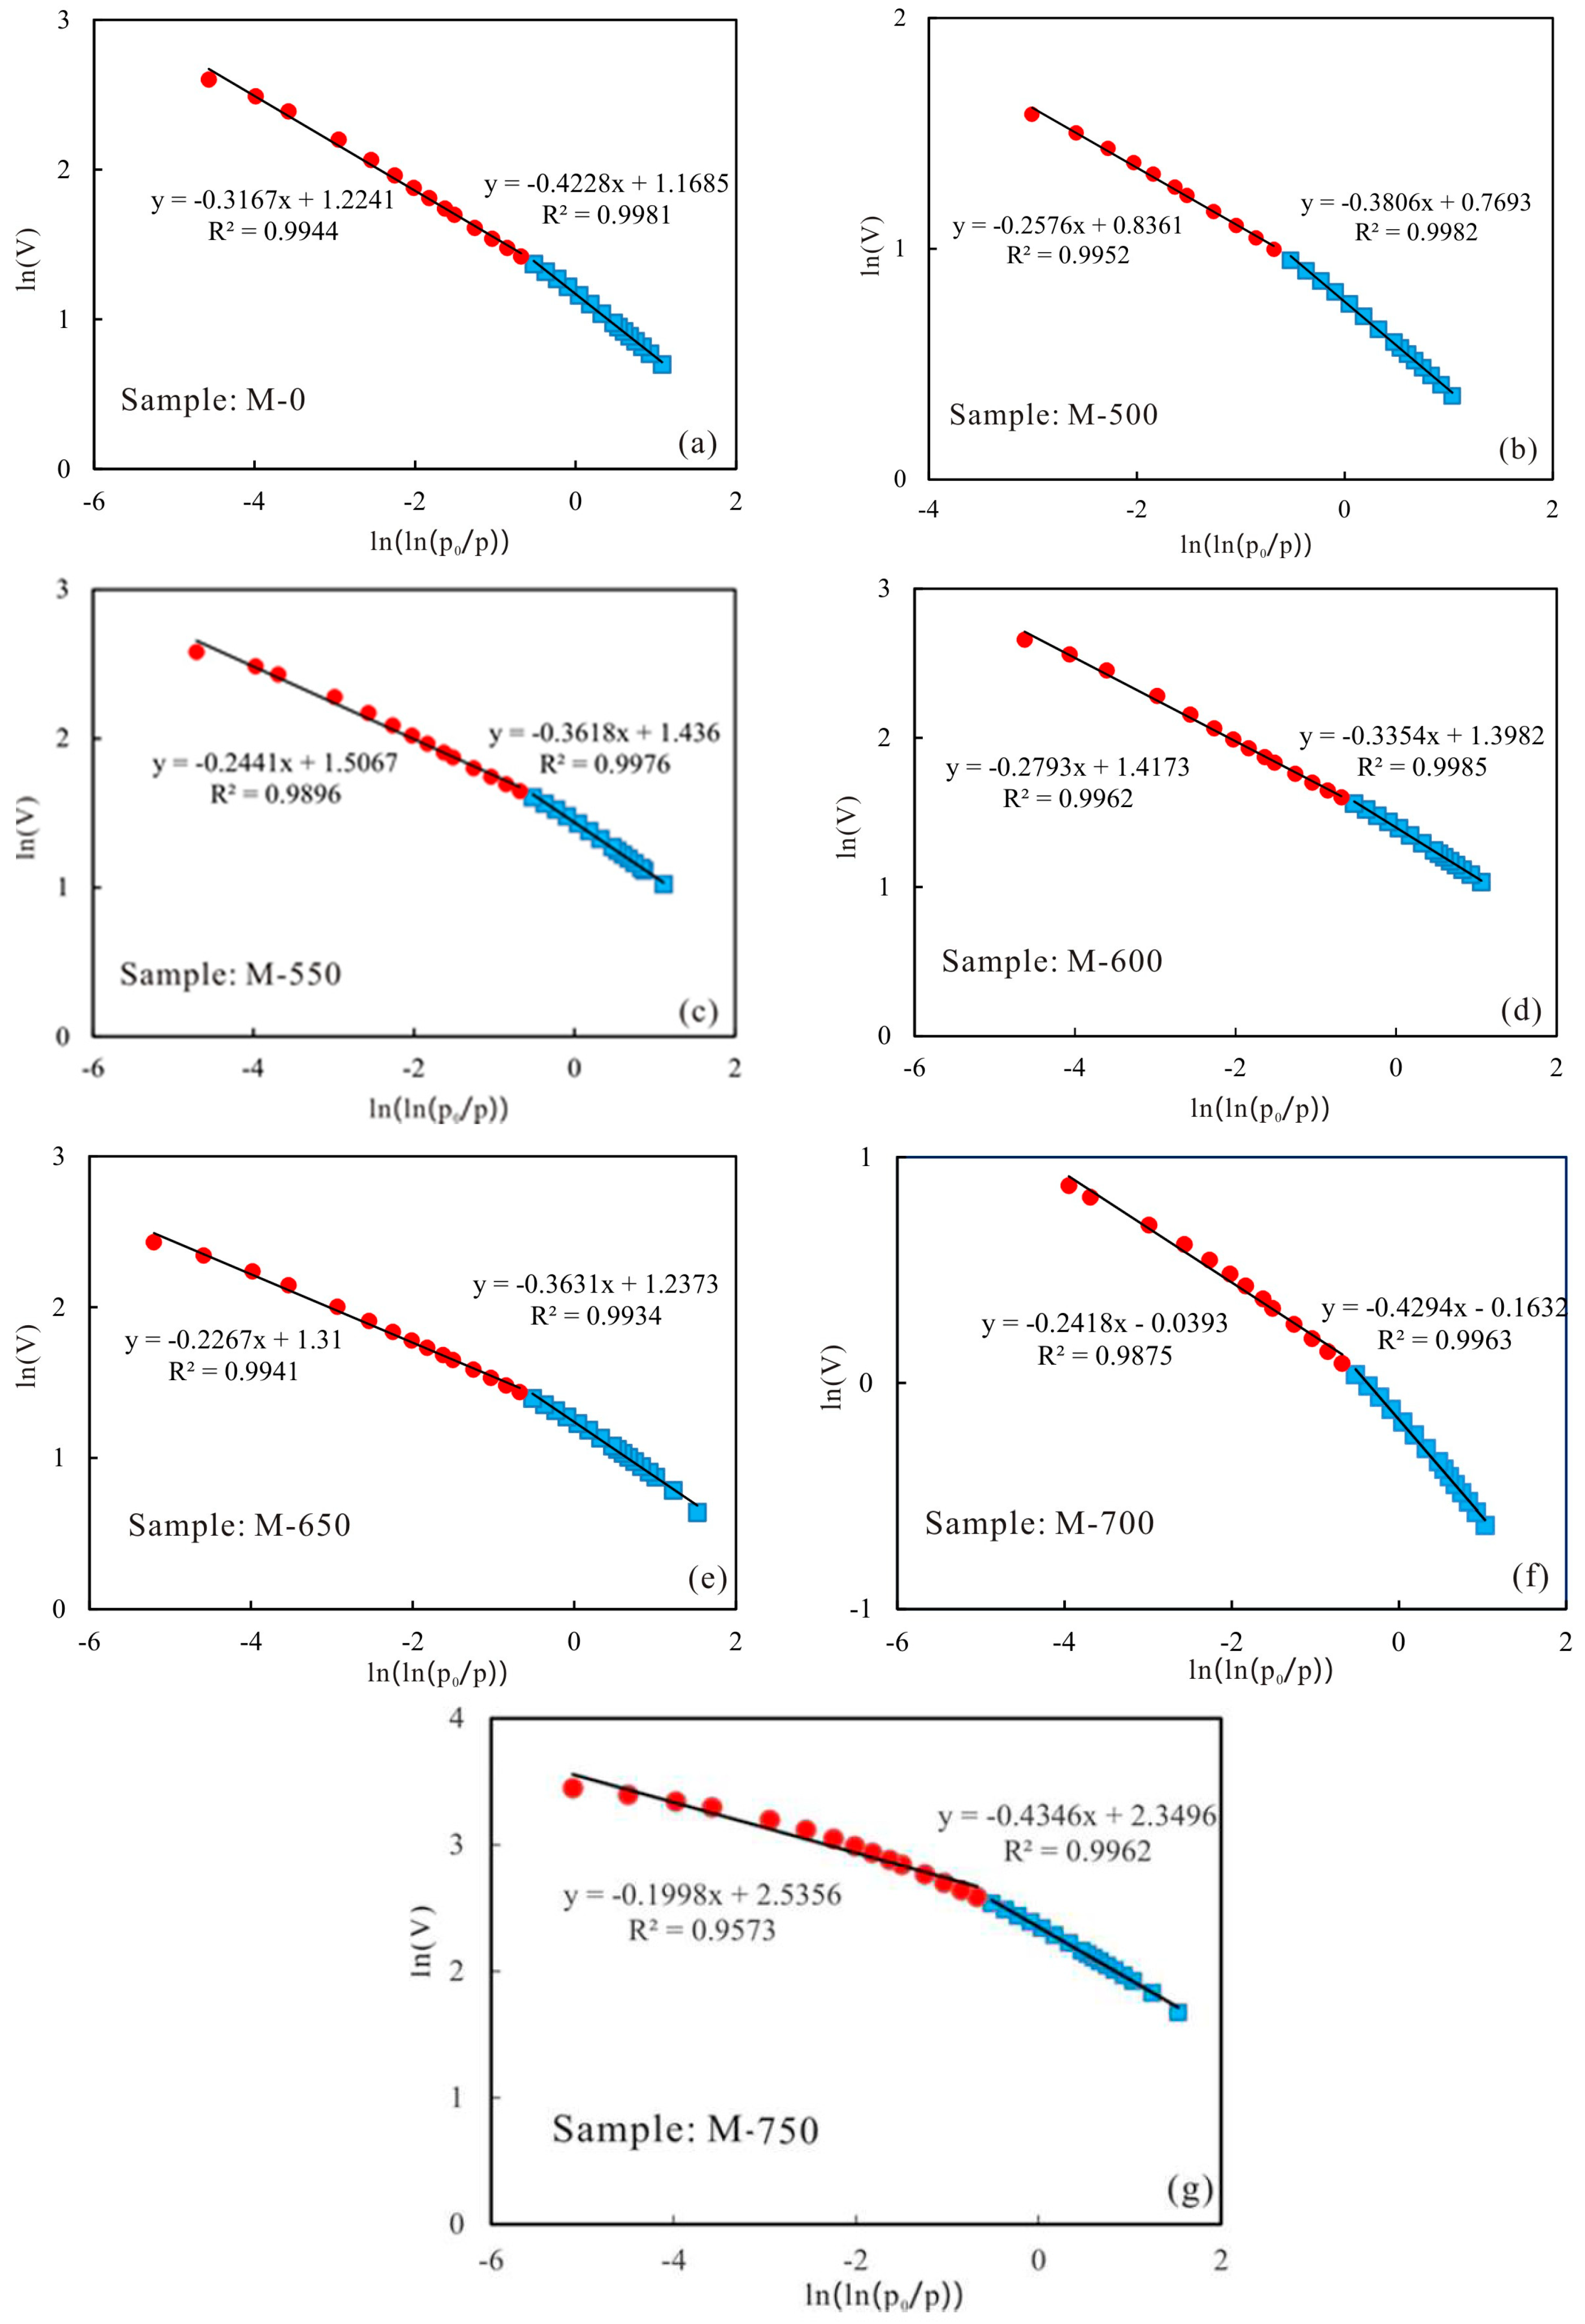
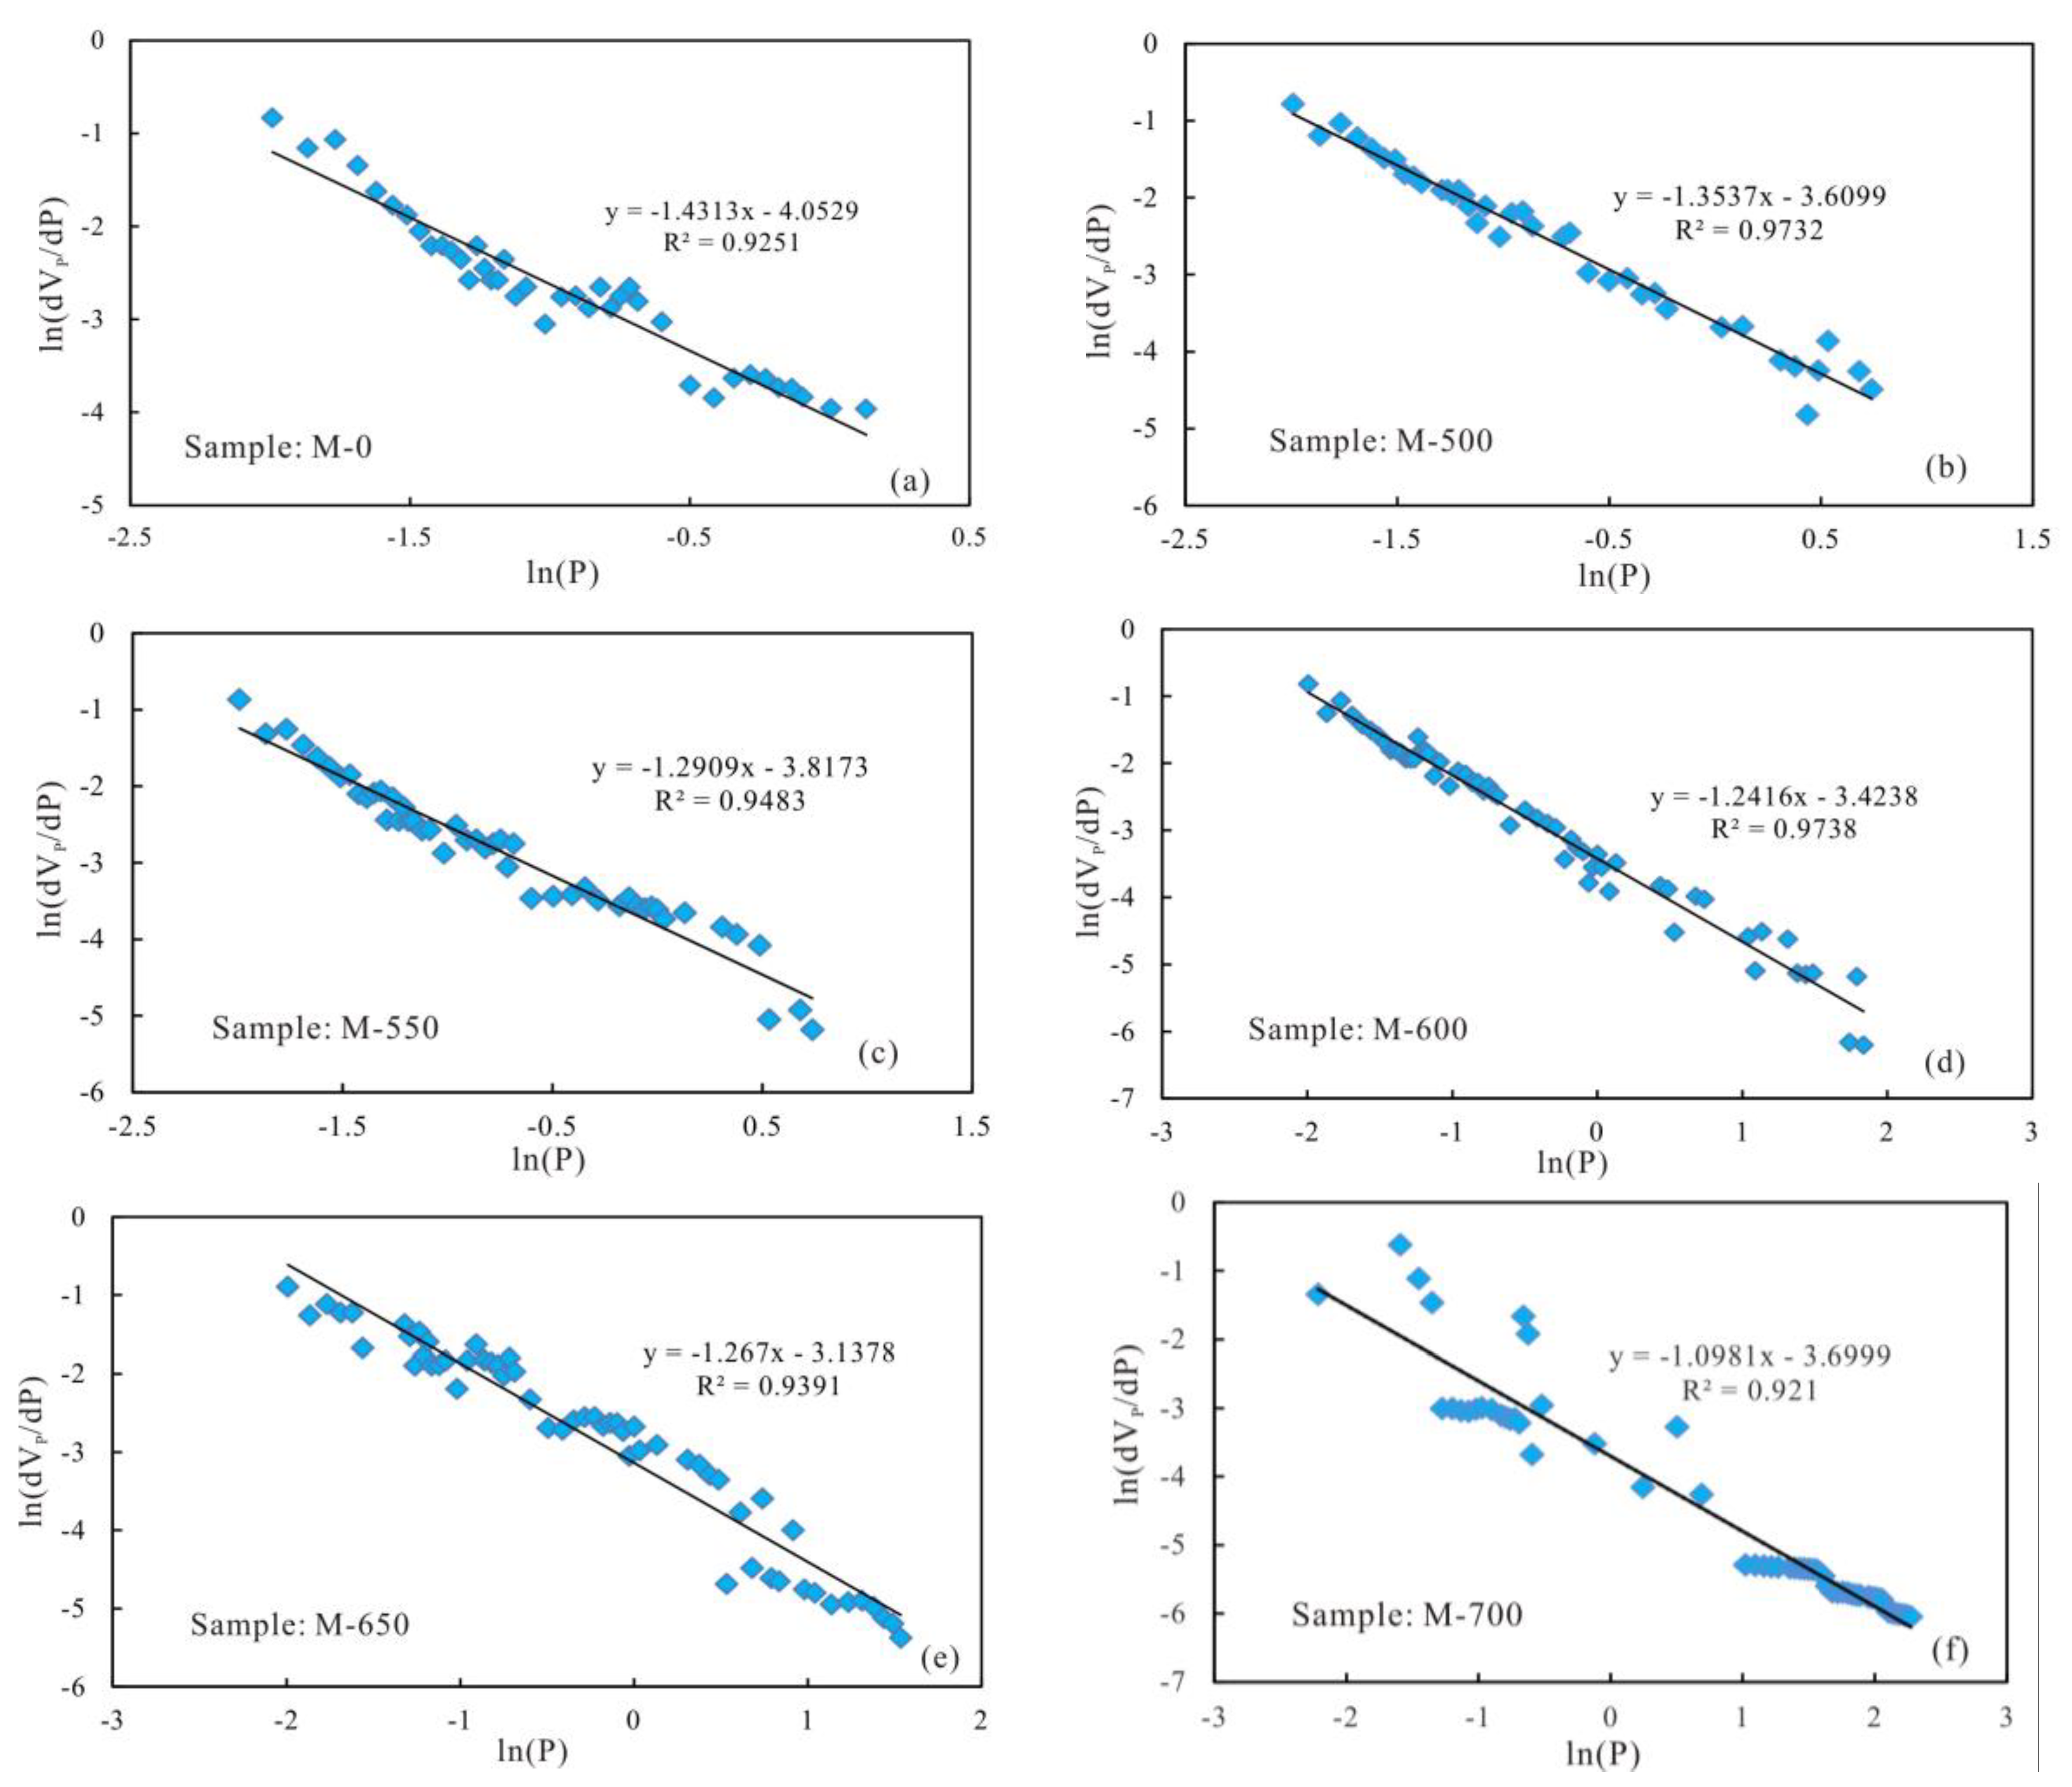
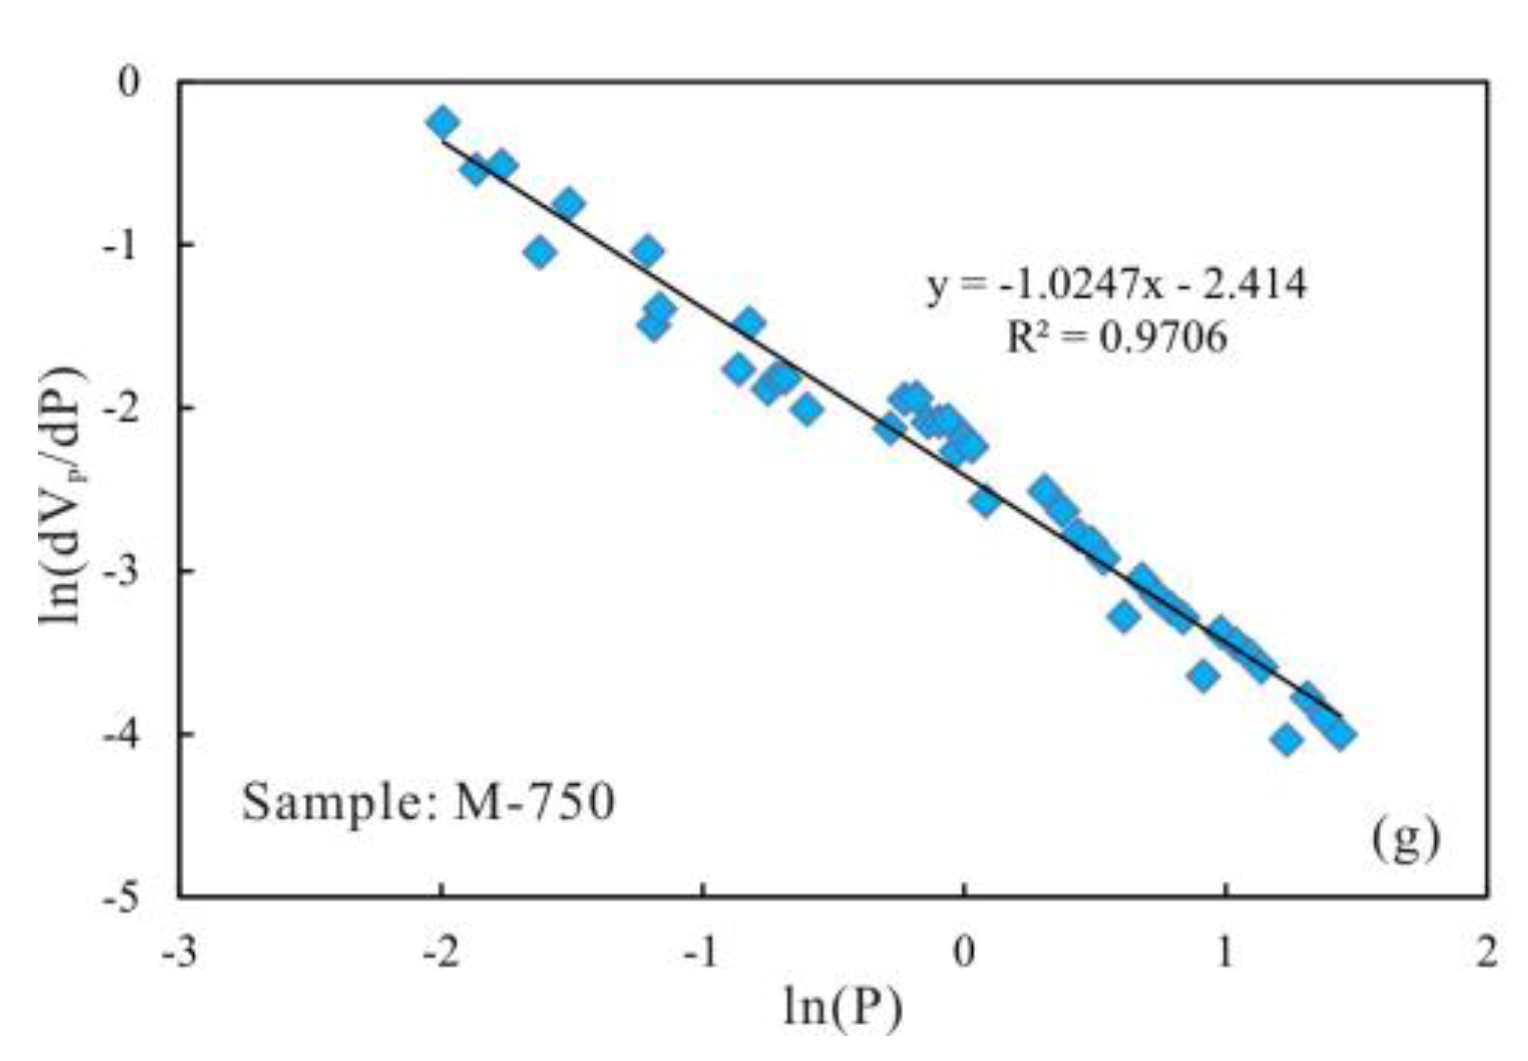
3.5. Fractal Dimension of Pore Structure

Shale pore structure heterogeneity can account for gas-storage capacity [38]. Fractal theory is a common and reliable method to quantitatively describe the heterogeneous pore structure of a material such as shale gas reservoirs [38,39,40]. The fractal dimension (D) is defined as an intrinsic characteristic of shale internal pore structure and fractal dimension has been shown to be a key parameter to represent the heterogeneity of pore structure [39,40]. In general, the fractal dimension values range between 2 and 3, and the larger the fractal dimension value, the more complex the pore structure [39,40]. In this study, fractal dimensions of micropores and mesopores were calculated using a Frenkel–Halsey–Hill (FHH) model based on the N2 adsorption isotherm [5], and the fractal dimensions of macropores were calculated using the model developed by Pfeifer and Avnir [41], which is based on mercury intrusion data [17,42]. The formulas for calculating the fractal dimensions of micropores, mesopores (Equation (1)), and macropores (Equation (2)) can be described as follows:
ln(V) = C + (D − 3) × ln(ln(P0/P));
ln(dVP/dP) = (D − 4) × ln(P)
In Equation (1), V (cm3/g) is the volume of adsorbed gas, P (MPa) is the equilibrium pressure, P0 (MPa) is the saturated vapor pressure, C is a characteristic constant, and D is the fractal dimension; in Equation (2), VP is the cumulative intrusion volume in cm3/g at a given mercury pressure P, and D is the fractal dimension.
All plots had strong correlations, indicating that the shale samples were all highly fractal at different temperatures (Figure 11 and Figure 12). The models used in this study were therefore appropriate for analyzing pore structure heterogeneity of the shale at different maturity levels. The FHH plots for the sample suite are shown in Figure 11, and two different linear segments around a relative pressure (P/P0) of 0–0.55 and 0.55–1 can be observed with good fit (correlation coefficients >0.95). A boundary relative pressure of 0.55 MPa was observed between a straight-line segment at a low relative pressure range and a straight line segment at a high relative pressure range, and the pores were divided into less than 4.5 nm and 4.5–50 nm in size according to the Kelvin equation [12,33,42]. Pore fractal dimensions of less than 4.5 nm (D1) and 4.5–50 nm (D2) were obtained (Table 4). The mercury injection pressure can be up to 215 MPa (31,175 psi) in the sample cell, indicating that pores approximately 6 nm in size can be filled with mercury based on Washburn equation. Therefore, pressure values in the range of 0–25 MPa were selected to calculate pore fractal dimension of greater than 50 nm (macropores) [42,43]. Linear segments with good fit (>0.90) were observed and the fractal dimension of macropores (D3) was obtained (Figure 12). Fractal dimensions D2 and D3 were similar, with mean values of 2.74 and 2.71, respectively. Fractal dimension D1 was much lower than D2 and D3 with a mean of 2.61, indicating that the heterogeneity of the small pores (pore diameter less than 4.5 nm) was weaker than the heterogeneity of the large pores (pore diameter greater than 4.5 nm) in the shale samples. Tang et al. [42] studied high-maturity shale from the Silurian Longmaxi formation in the southeastern Sichuan Basin, and fractal dimensions D1, D2, and D3 were 2.79, 2.71 and 2.83 respectively, higher than our results for the high over-mature samples.
The fractal dimension D1 increased with increasing temperature up to 600 °C, and then decreased with increasing temperature up to 750 °C. Fractal dimensions D2 and D3 have similar trends and increased with increasing temperature (Figure 13). Fractal dimensions D1, D2, and D3 all increased as temperature increased up to 600 °C. Shale gas was primarily created from OM during this stage (Ro = 2.0–3.5%) and a large, intricate nanopore network was formed [18] that led to complex pore structure, resulting in increasing fractal dimensions. From 600 to 750 °C, the decrease in fractal dimension D1 was due to the reduced micropore content, which made the micropore structure more homogeneous. For fractal dimensions D2 and D3, although the mesopore and macropore PV increased slightly, the new formed pores were primarily polyhedral and angular in shape, which was confirmed by N2 adsorption isotherms and mercury injection and ejection curves (Figure 4 and Figure 8). In addition, as discussed above, the newly formed large diameter pores were mostly a combination of micropores and mesopores, which easily form complex pore shapes. This led to more heterogeneous mesopore and macropore structure and higher values for D2 and D3. Liu et al. and Yang et al. also suggested that the pores with large diameters have more complex pore structure and higher fractal dimensions [36,44].

3.6. Evolution Mechanism of Pore Structure during Pyrolysis

PV, SSA, and PSD changed during pyrolysis, which indicated that the pore-related variances were primarily controlled by the temperatures (thermal maturity). This demonstrated a complex evolution of pore structure from unheated to 750 °C (Ro = 2.03–4.87%). According to our results in this study, the pore evolution could be roughly divided into two stages where the transition temperature was 600 °C (Ro = 3.36%):
(1)
From unheated to 600 °C, micropore, mesopore and macropore PV values increased with increasing temperature, especially for the micropores and fine mesopores (2–10 nm). The increase of pore content can be attributed to further OM transformation. Mastalerz et al. revealed that there were still a lot of pores filled by liquid hydrocarbon in over-mature shale because of a marked increase in pore volume after extraction by dichloromethane [15]. Previous studies have also suggested that the remaining gas generation potential of OM in over-mature shale is still considerable [18], indicating that OM can still continue to break bonds and crack to form shale gas. Therefore, further OM transformation can unblock pre-existing pores and create new pores, resulting in pore volume increases.
(2)
From 600 to 750 °C, the number of pores with small diameter was reduced and pores with large diameter slightly increased. After 600 °C, OM was carbonized and the OM structure became more orderly and inorganic minerals also decomposed, which led to widening diameter in small pores (for example, through coalescence of adjacent pores), resulting in a reduction in micropores and fine mesopores, and an increase in macropores and large mesopores. Bai et al. also revealed that pore diameter enlarged and small pores transformed to large pores when the simulation temperature was above 600 °C [17]. In fact, however, macropores and large mesopores may be difficult to preserve under geological conditions in this stage due to post-compaction.
The proposed pattern of pore evolution in marine shale with high thermal maturity during pyrolysis is a general model based on our results. Both chemical and mechanical processes may be factors that influence pore evolution under geological conditions, so further research is needed on pore evolution in marine shale with high thermal maturity, combined with substantial natural shale samples.

4. Conclusions

(1)
The preset temperature and Ro values of the synthetic Longmaxi marine shale samples (pyrolysis product) had a good linear relationship, and pore structure parameters changed during pyrolysis, indicating the temperature can represent maturity and promote the evolution of pore structure in the samples.
(2)
Micropore are the most developed from unheated to 600 °C and then the micropore content decreased from 600 to 750 °C. The evolutionary characteristics of mesopore and macropore PV are different from that of SSA. Mesopore and macropore PV increased with increasing temperature, whereas mesopore SSA decreased from 600 to 750 °C. Fractal dimensions of the shale samples increased from unheated to 600 °C, indicating that the pore structure became more heterogeneous at higher maturity levels. From 600 to 750 °C, fractal analysis showed that larger pore sizes meant more complicated pore structure.
(3)
The evolution of pore structure in marine shale with high thermal maturity could be divided into two stages. (1) The increase in micropore, mesopore, and macropore content during the transition from unheated to 600 °C was associated with the further transformation of OM into hydrocarbons; (2) the decrease in small diameter pores (<10 nm) and increase in large diameter pores volumes (>10 nm) caused a rearrangement in PSD from 600 to 750 °C, which was associated with the expansion of micropores, mesopores, and macropores.

Author Contributions

Z.X., J.H., S.T. and J.W. conceived and designed the experiments; H.X., Z.Z. and Y.X. performed the experiments; Z.X. and J.W. wrote and revised the paper.

Acknowledgments

This work was financially supported by National Science and Technology Major Project of China (Grant No. 2017ZX05035001-003) and scientific research project of the Land and Resources Department in Hunan Province (Grant No. 2015-01).

Conflicts of Interest

The authors declare no conflict of interest.

References

  1. Milliken, K.L.; Rudnicki, M.; Awwiller, D.N.; Zhang, T.W. Organic matter-hosted pore system, marcellus formation (Devonian), Pennsylvania. AAPG Bull. 2013, 97, 177–200. [Google Scholar] [CrossRef]
  2. Zou, C.N.; Dong, D.Z.; Wang, Y.M.; Li, X.J.; Huang, J.L.; Wang, S.F.; Guan, Q.Z.; Zhang, C.C.; Wang, H.Y.; Liu, H.L.; et al. Shale gas in China: Characteristics, challenges and prospects (II). Petro. Explor. Dev. 2015, 42, 753–767. [Google Scholar] [CrossRef]
  3. Hu, J.G.; Tang, S.H.; Zhang, S.H. Investigation of pore structure and fractal characteristics of the Lower Silurian Longmaxi shales in western Hunan and Hubei Provinces in China. J. Nat. Gas. Sci. Eng. 2016, 28, 522–535. [Google Scholar] [CrossRef]
  4. Wan, Y.; Tang, S.H.; Pan, Z.J. Evaluation of the shale gas potential of the lower Silurian Longmaxi Formation in northwest Hunan Province, China. Mar. Petrol. Geol. 2017, 79, 159–175. [Google Scholar] [CrossRef]
  5. Xi, Z.D.; Tang, S.H.; Wang, J.; Yi, J.J.; Guo, Y.Y.; Wang, K.F. Pore Structure and Fractal Characteristics of Niutitang Shale from China. Minerals 2018, 8, 163. [Google Scholar] [CrossRef]
  6. Zhao, W.Z.; Li, J.Z.; Yang, T.; Wang, S.F.; Huang, J.L. Geological difference and its significance of marine shale gases in South China. Petrol. Explor. Dev. 2016, 43, 547–559. [Google Scholar] [CrossRef]
  7. Loucks, R.G.; Reed, R.M.; Ruppel, S.C.; Jarvie, D.M. Morphology, genesis, and distribution of nanometer-scale pores in siliceous mudstones of the Mississippian Barnett shale. J. Sediment. Res. 2009, 79, 848–861. [Google Scholar] [CrossRef]
  8. Loucks, R.G.; Reed, R.M.; Ruppel, S.C.; Hammes, U. Spectrum of pore types and networks in mudrocks and a descriptive classification for matrix-related mudrock pores. AAPG Bull. 2012, 96, 1071–1098. [Google Scholar] [CrossRef]
  9. Zhang, T.W.; Ellis, G.S.; Rupple, S.C.; Milliken, K.; Yang, R. Effect of organic matter type and thermal maturity on methane adsorption in shale-gas systems. Org. Geochem. 2012, 47, 120–131. [Google Scholar] [CrossRef]
  10. Ross, D.J.K.; Bustin, R.M. Characterizing the shale gas resource potential of Devonian-Mississippian strata in the Western Canada sedimentary basin: Application of an integrated formation evaluation. AAPG Bull. 2008, 92, 87–125. [Google Scholar] [CrossRef]
  11. Ross, D.J.K.; Bustin, R.M. The importance of shale composition and pore structure upon gas storage potential of shale gas reservoirs. Mar. Pet. Geol. 2009, 26, 916–927. [Google Scholar] [CrossRef]
  12. Xi, Z.D.; Tang, S.H.; Zhang, S.H.; Li, J. Nano-Scale Pore Structure of Marine-Continental Transitional Shale from Liulin Area, the Eastern Margin of Ordos Basin, China. J. Nanosci. Nanotechno. 2017, 17, 6109–6123. [Google Scholar] [CrossRef]
  13. Clackson, C.R.; Haghshenas, B.; Ghanizadeh, A.; Qanbari, F.; Williams-Kovacs, J.D.; Riazi, N.; Debuhr, C.; Deglint, H.J. Nanopores to megafractures: Current challenges and methods for shale gas reservoir and hydraulic fracture characterization. J. Nat. Gas. Sci. Eng. 2016, 31, 612–657. [Google Scholar] [CrossRef]
  14. Curtis, M.E.; Cardott, B.J.; Sondergeld, C.H.; Rai, C.S. Development of organic porosity in the Woodford Shale with increasing thermal maturity. Int. J. Coal Geol. 2012, 103, 26–31. [Google Scholar] [CrossRef]
  15. Mastalerz, M.; Schimmelmann, A.; Drobniak, A.; Chen, Y.Y. Porosity of Devonian and Mississippian New Albany Shale across a maturation gradient: Insights from organic petrology, gas adsorption, and mercury intrusion. AAPG Bull. 2013, 97, 1621–1643. [Google Scholar] [CrossRef]
  16. Sun, L.N.; Tuo, J.C.; Zhang, M.F.; Wu, C.J.; Wang, Z.X.; Zheng, Y.W. Formation and development of the pore structure in Chang 7 member oil-shale from Ordos Basin during organic matter evolution induced by hydrous pyrolysis. Fuel 2018, 158, 549–557. [Google Scholar] [CrossRef]
  17. Bai, F.T.; Sun, Y.H.; Liu, Y.M.; Guo, M.Y. Evaluation of the porous structure of Huadian oil shale during pyrolysis using multiple approaches. Fuel 2017, 187, 1–8. [Google Scholar] [CrossRef]
  18. Chen, J.; Xiao, X. Evolution of nanoporosity in organic-rich shales during thermal maturation. Fuel 2014, 129, 173–181. [Google Scholar] [CrossRef]
  19. Jiang, S.; Tang, X.L.; Cai, D.S.; Xue, G.; He, Z.L.; Long, S.X.; Peng, Y.M.; Gao, B.; Xu, Z.Y.; Dahdah, N. Comparison of marine, transitional, and lacustrine shales: A case study from the Sichuan Basin in China. J. Petrol. Sci. Eng. 2017, 150, 334–347. [Google Scholar] [CrossRef]
  20. Liu, W.P.; Liu, J.; Cai, M.L.; Luo, C.; Shi, X.W.; Zhang, J. Pore evolution characteristic of shale in the Longmaxi Formation, Sichuan Basin. Pet. Res. 2017, 2, 291–300. [Google Scholar] [CrossRef]
  21. Xi, Z.D.; Tang, S.H.; Zhang, S.H.; Sun, K. Pore structure characteristics of marine–continental transitional shale: A case study in the Qinshui Basin, China. Energy Fuels 2017, 31, 7854–7866. [Google Scholar] [CrossRef]
  22. Li, J.; Tang, S.H.; Zhang, S.H.; Xi, Z.D.; Yang, N.; Yang, G.Q.; Li, L.; Li, Y.P. Paleo-environmental conditions of the Early Cambrian Niutitang Formation in the Fenggang area, the southwestern margin of the Yangtze Platform, southern China: Evidence from major elements, trace elements and other proxies. J. Asian Earth Sci. 2018, 159, 81–97. [Google Scholar] [CrossRef]
  23. Hunt, J.M. Petroleum Geochemistry and Geology; W.H. Freeman and Company: New York, NY, USA, 1996; p. 743. [Google Scholar]
  24. Tuo, J.C.; Wu, C.J.; Zhang, M.F. Organic matter properties and shale gas potential of Paleozoic shales in Sichuan Basin, China. J. Nat. Gas. Sci. Eng. 2015, 28, 434–446. [Google Scholar] [CrossRef]
  25. Waples, D.W. Time and temperature in petroleum formation: Application of Lopatin’s method to petroleum exploration. AAPG Bull. 1980, 64, 916–926. [Google Scholar]
  26. Sweeney, J.J.; Burnham, A.K. Evaluation of a simple model of vitrinite reflectance based on chemical kinetics. AAPG Bull. 1990, 74, 1559–1570. [Google Scholar]
  27. Dang, W.; Zhang, J.C.; Tang, X.; Chen, Q.; Han, S.B.; Li, Z.M.; Du, X.R.; Wei, X.L.; Zhang, M.Q.; Liu, J.; et al. Shale gas potential of Lower Permian marine-continental transitional black shales in the Southern North China Basin, central China: Characterization of organic geochemistry. J. Nat. Gas. Sci. Eng. 2016, 28, 639–650. [Google Scholar] [CrossRef]
  28. Stahl, W.J.; Wollanke, G.; Boigk, H. Carbon and nitrogen isotope data of Upper Carboniferous and Rotliegend natural gases from North Germany and their relationship to the maturity of the organic source material. In Proceedings of the 7th International Meeting on Organic Geochemistry Advances in Organic Geochemistry, Madrid, Spain, 16–19 September 1975; pp. 539–560. [Google Scholar]
  29. Chalmers, G.R.L.; Bustin, R.M. Geologicalevaluation of Halfway-Doig-Montney hybrid gas shale-tight gas reservoir, northeastern British Columbia. Mar. Petro. Geo. 2012, 38, 53–72. [Google Scholar] [CrossRef]
  30. Bu, H.J.; Ju, Y.W.; Tan, J.Q.; Wang, G.C.; Li, X.S. Fractal characteristics of pores in non-marine shales from the Huainan coalfield, eastern China. J. Nat. Gas. Sci. Eng. 2015, 24, 166–177. [Google Scholar] [CrossRef]
  31. Jiang, F.J.; Chen, D.; Chen, J.; Li, Q.W.; Liu, Y.; Shao, X.H.; Hu, T.; Dai, J.X. Fractal Analysis of Shale Pore Structure of Continental Gas Shale Reservoir in the Ordos Basin, NW China. Energy Fuels 2016, 30, 4676–4689. [Google Scholar] [CrossRef]
  32. Valenza, J.J.; Drenzek, N.; Marques, F.; Pagels, M.; Mastalerz, M. Geochemical controls on shale microstructure. Geology 2013, 41, 611–614. [Google Scholar] [CrossRef]
  33. Groen, J.C.; Peffer, L.A.A.; Perez-Ramírez, J. Pore size determination in modified micro- and mesoporous materials. Pitfalls and limitations in gas adsorption data analysis. Microporous Mesoporous Mater. 2003, 60, 1–17. [Google Scholar] [CrossRef]
  34. Yang, R.; Hao, F.; He, S.; He, C.C.; Guo, X.S.; Yi, J.Z.; Hu, H.Y.; Zhang, S.W.; Hu, Q.H. Experimental investigations on the geometry and connectivity of pore space in organic-rich Wufeng and Longmaxi shales. Mar. Pet. Geol. 2017, 84, 225–242. [Google Scholar] [CrossRef]
  35. Wang, Y.; Wang, L.H.; Wang, J.Q.; Jiang, Z.; Jin, C.; Wang, Y.F. Characterization of organic matter pores in typical marine and terrestrial shales, China. J. Nat. Gas Sci. Eng. 2018, 49, 56–65. [Google Scholar] [CrossRef]
  36. Liu, X.J.; Xiong, J.; Liang, L.X. Investigation of pore structure and fractal characteristics of organic-rich Yanchang formation shale in central China by nitrogen adsorption/desorption analysis. J. Nat. Gas Sci. Eng. 2015, 22, 62–72. [Google Scholar] [CrossRef]
  37. Hao, F.; Zou, H.Y.; Lu, Y.C. Mechanisms of shale gas storage: Implications for shale gas exploration in China. AAPG Bull. 2013, 97, 1325–1346. [Google Scholar] [CrossRef]
  38. Mishra, S.; Mendhe, V.A.; Varma, A.K.; Kamble, A.D.; Sharma, S.; Bannerjee, M.; Kalpana, M.S. Influence of organic and inorganic content on fractal dimensions of Barakar and Barren Measures shale gas reservoirs of Raniganj basin, India. J. Nat. Gas Sci. Eng. 2018, 49, 393–409. [Google Scholar] [CrossRef]
  39. Yao, Y.B.; Liu, D.M.; Tang, D.Z.; Tang, S.H.; Huang, W.H. Fractal characterization of adsorption-pores of coals from North China: An investigation on CH4 adsorption capacity of coals. Int. J. Coal Geol. 2008, 73, 27–42. [Google Scholar] [CrossRef]
  40. Yao, Y.B.; Liu, D.M.; Tang, D.Z.; Tang, S.H.; Huang, W.H.; Liu, Z.; Che, Y. Fractal characterization of seepage-pores of coals from China: An investigation on permeability of coals. Comput. Geosci. 2009, 35, 1159–1166. [Google Scholar] [CrossRef]
  41. Pfeifer, P.; Avnir, D. Chemistry in noninteger dimensions between 2 and 3, I: Fractal theory of heterogeneous surface. J. Chem. Phys. 1983, 79, 3558–3565. [Google Scholar] [CrossRef]
  42. Tang, X.L.; Jiang, Z.X.; Li, Z.; Gao, Z.Y.; Bai, Y.Q.; Zhao, S.; Feng, J. The effect of the variation in material composition on the heterogeneous pore structure of high-maturity shale of the Silurian Longmaxi formation in the southeastern Sichuan Basin, China. J. Nat. Gas Sci. Eng. 2015, 23, 464–473. [Google Scholar] [CrossRef]
  43. Zhang, S.H.; Tang, S.H.; Zhang, J.P.; Pan, Z.J. Pore structure characteristics of China sapropelic coal and their development influence factors. J. Nat. Gas Sci. Eng. 2018, 53, 370–384. [Google Scholar] [CrossRef]
  44. Yang, F.; Ning, Z.F.; Liu, H. Fractal characteristics of shales from a shale gas reservoir in the Sichuan Basin, China. Fuel 2014, 115, 378–384. [Google Scholar] [CrossRef]
Figure 1. Low-pressure CO2 adsorption isotherms of the shale samples at different temperatures.
Minerals 08 00226 g001
Figure 2. (a) Relationships between micropore pore volume (PV) and temperature (%Ro), (b) relationships between micropore specific surface area (SSA) and temperature (%Ro).
Minerals 08 00226 g002
Figure 3. Pore size distribution (PSD) derived from CO2 adsorption for the shale samples at different temperatures.
Minerals 08 00226 g003
Figure 4. N2 adsorption isotherms for samples at different temperatures.
Minerals 08 00226 g004
Figure 5. (a) Relationships between mesopore PV and temperature (%Ro), (b) relationships between mesopore SSA and temperature (%Ro).
Minerals 08 00226 g005
Figure 6. Pore size distribution derived from N2 adsorption for the shale samples at different temperatures.
Minerals 08 00226 g006aMinerals 08 00226 g006b
Figure 7. Percentage of mesopore PV for shale samples at different temperatures.
Minerals 08 00226 g007
Figure 8. Mercury injection and ejection curves of the shale samples, derived from mercury intrusion.
Minerals 08 00226 g008
Figure 9. (a) Relationships between macropore PV and temperature (%Ro), (b) relationships between macropore SSA and temperature (%Ro).
Minerals 08 00226 g009
Figure 10. PSD derived from mercury intrusion for the shale samples at different temperatures.
Minerals 08 00226 g010
Figure 11. Plots of ln(V) vs ln(ln(P0/P)) reconstructed from the N2 adsorption isotherms: (a) The initial sample M-0, (b) sample M-500, (c) sample M-550, (d) sample M-600, (e) sample M-650, (f) sample M-700, (g) sample M-750.
Minerals 08 00226 g011
Figure 12. Fractal calculation results with ln(dVP/dP) vs. ln(P) obtained by mercury intrusion: (a) The initial sample M-0, (b) sample M-500, (c) sample M-550, (d) sample M-600, (e) sample M-650, (f) sample M-700, (g) sample M-750.
Minerals 08 00226 g012aMinerals 08 00226 g012b
Figure 13. (a) Relationships between fractal dimension D1 and temperature (%Ro), (b) relationships between fractal dimension D2 and temperature (%Ro), and (c) relationships between fractal dimension D3 and temperature (%Ro).
Minerals 08 00226 g013
Table 1. The initial shale sample information and geochemical data.
Sample IDFormationAgeRo (%)TOC (%)Amorphinite (%)Vitrinite (%)Inertinite (%)TIδ13CPDB (‰)OM Type (%)
M-0LongmaxiSilurian2.033.84925385.25−30.7I
Note: TI = 100 × %sapropelinite + 50 × %liptinite + (−75) × %virtrinite + (−100) × %inertinite, and TI > 80, <80–40, <40–0 and <0 indicate Type I, Type II1, Type II2 and Type III, respectively [27]. Type I, δ13CPDB ranged from −35‰ to −30‰; Type II1, −30‰ to −27.5‰; Type II2, δ13CPDB −27.5‰ to −25‰; Type III, δ13CPDB was greater than −25‰ [28].
Table 2. Mineral compositions of the initial shale sample.
Sample IDMineral Composition (%)Clay (%)
QuartzFeldsparCalciteClayIlliteIllite/SmectiteChlorite
M-062.57.3/30.282153
Table 3. Vitrinite reflectance values of shale samples at different simulation temperatures.
Sample IDTemperature (°C)Ro (%)Sample IDTemperature (°C)Ro (%)
M-5005002.47M-6506503.84
M-5505502.89M-7007004.33
M-6006003.36M-7507504.87
Note: M-500, 550, 600, 650, 700 and 750 represent the different simulation temperature samples; M-0 represents the initial sample.
Table 4. Fractal dimensions obtained from N2 physisorption and mercury intrusion of the shale samples with different temperatures.
Sample IDLess Than 4.5 nm in Diameter4.5–50 nm in DiameterGreater Than 50 nm in Diameter
D1R2D2R2D3R2
M-02.57720.99812.68330.99442.64630.9251
M-5002.61940.99822.74240.99522.56870.9732
M-5502.63820.99762.72070.98962.70910.9483
M-6002.66460.99852.75590.99622.75840.9738
M-6502.63690.99342.77330.99412.7330.9391
M-7002.57060.99632.75820.98752.78060.921
M-7502.56540.99622.80020.95732.79530.9706

