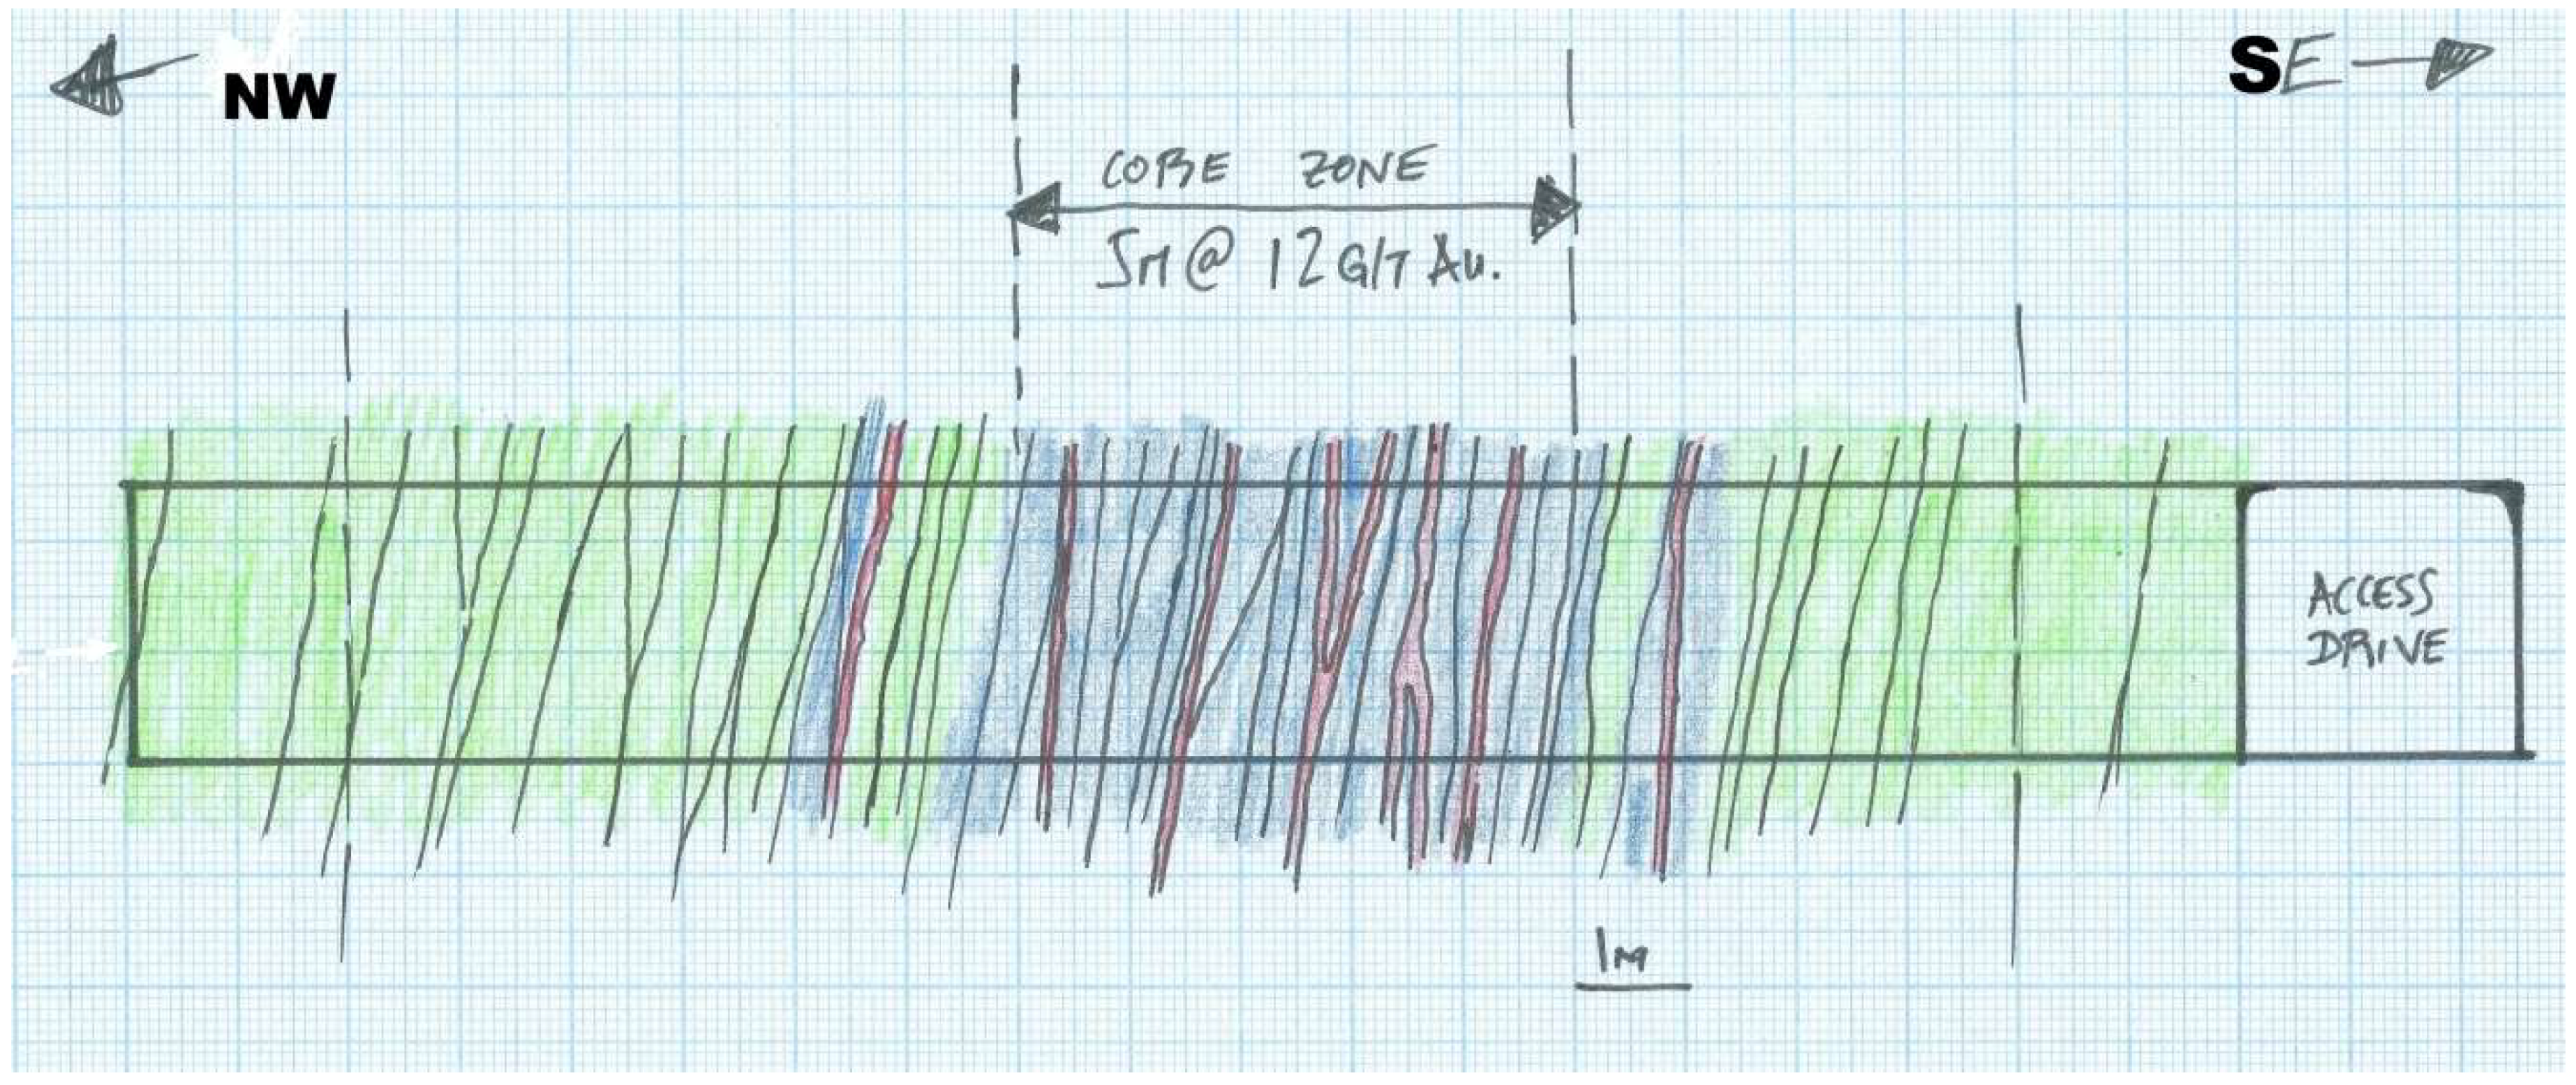
Figure 1.
Original geological field sketch of cross-cut #2 through the SVZ (XC.2; see
Figure 2) NE wall. Green: weak to moderate silicification; and Blue: strong silicification. Grades from wall channel samples.
Figure 1.
Original geological field sketch of cross-cut #2 through the SVZ (XC.2; see
Figure 2) NE wall. Green: weak to moderate silicification; and Blue: strong silicification. Grades from wall channel samples.
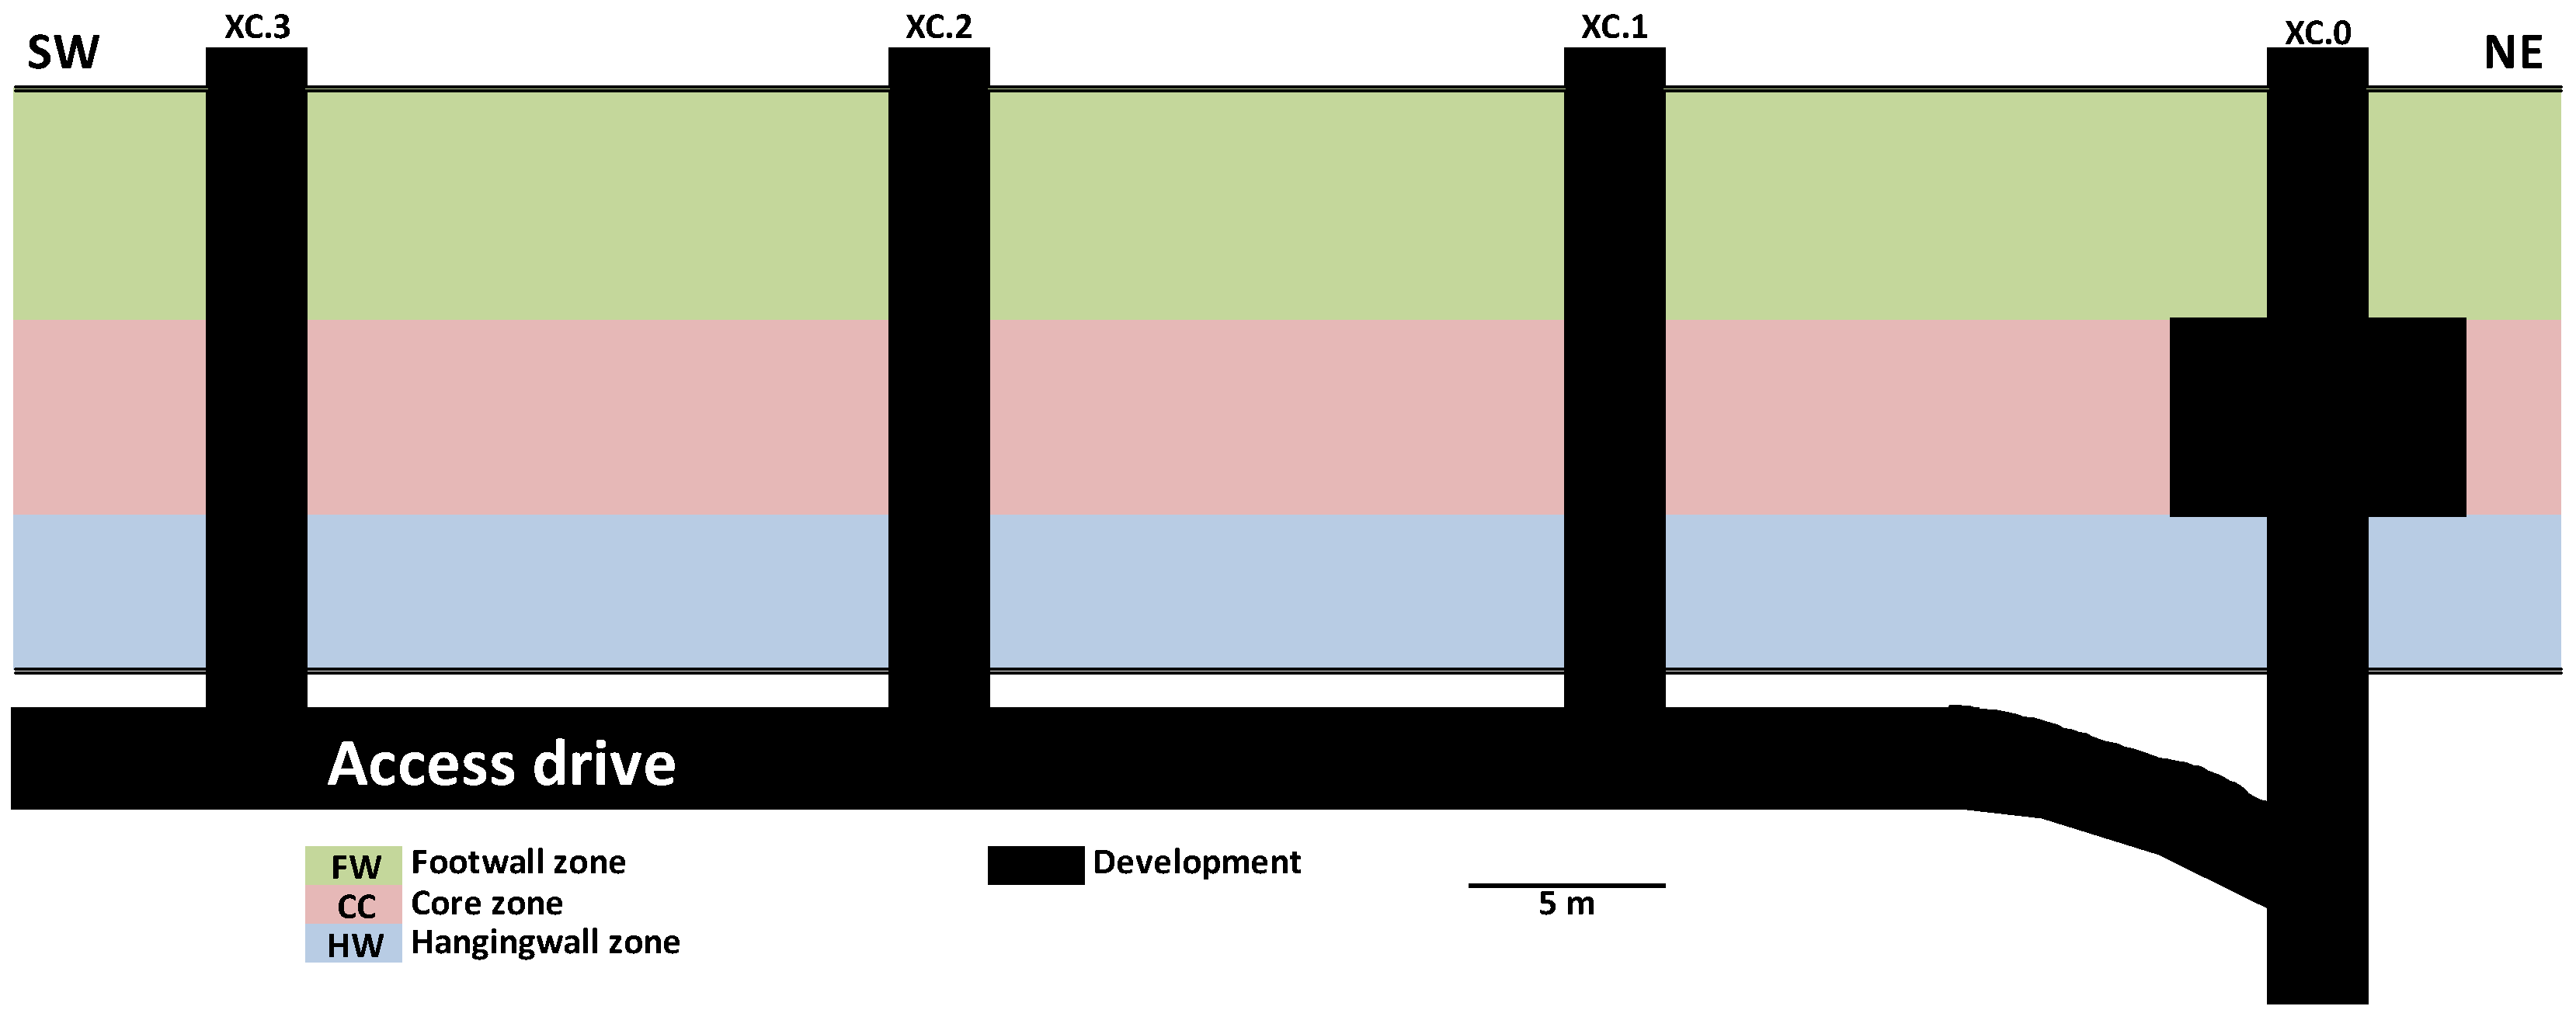
Figure 2.
Plan of underground exploratory development within the SVZ.
Figure 2.
Plan of underground exploratory development within the SVZ.
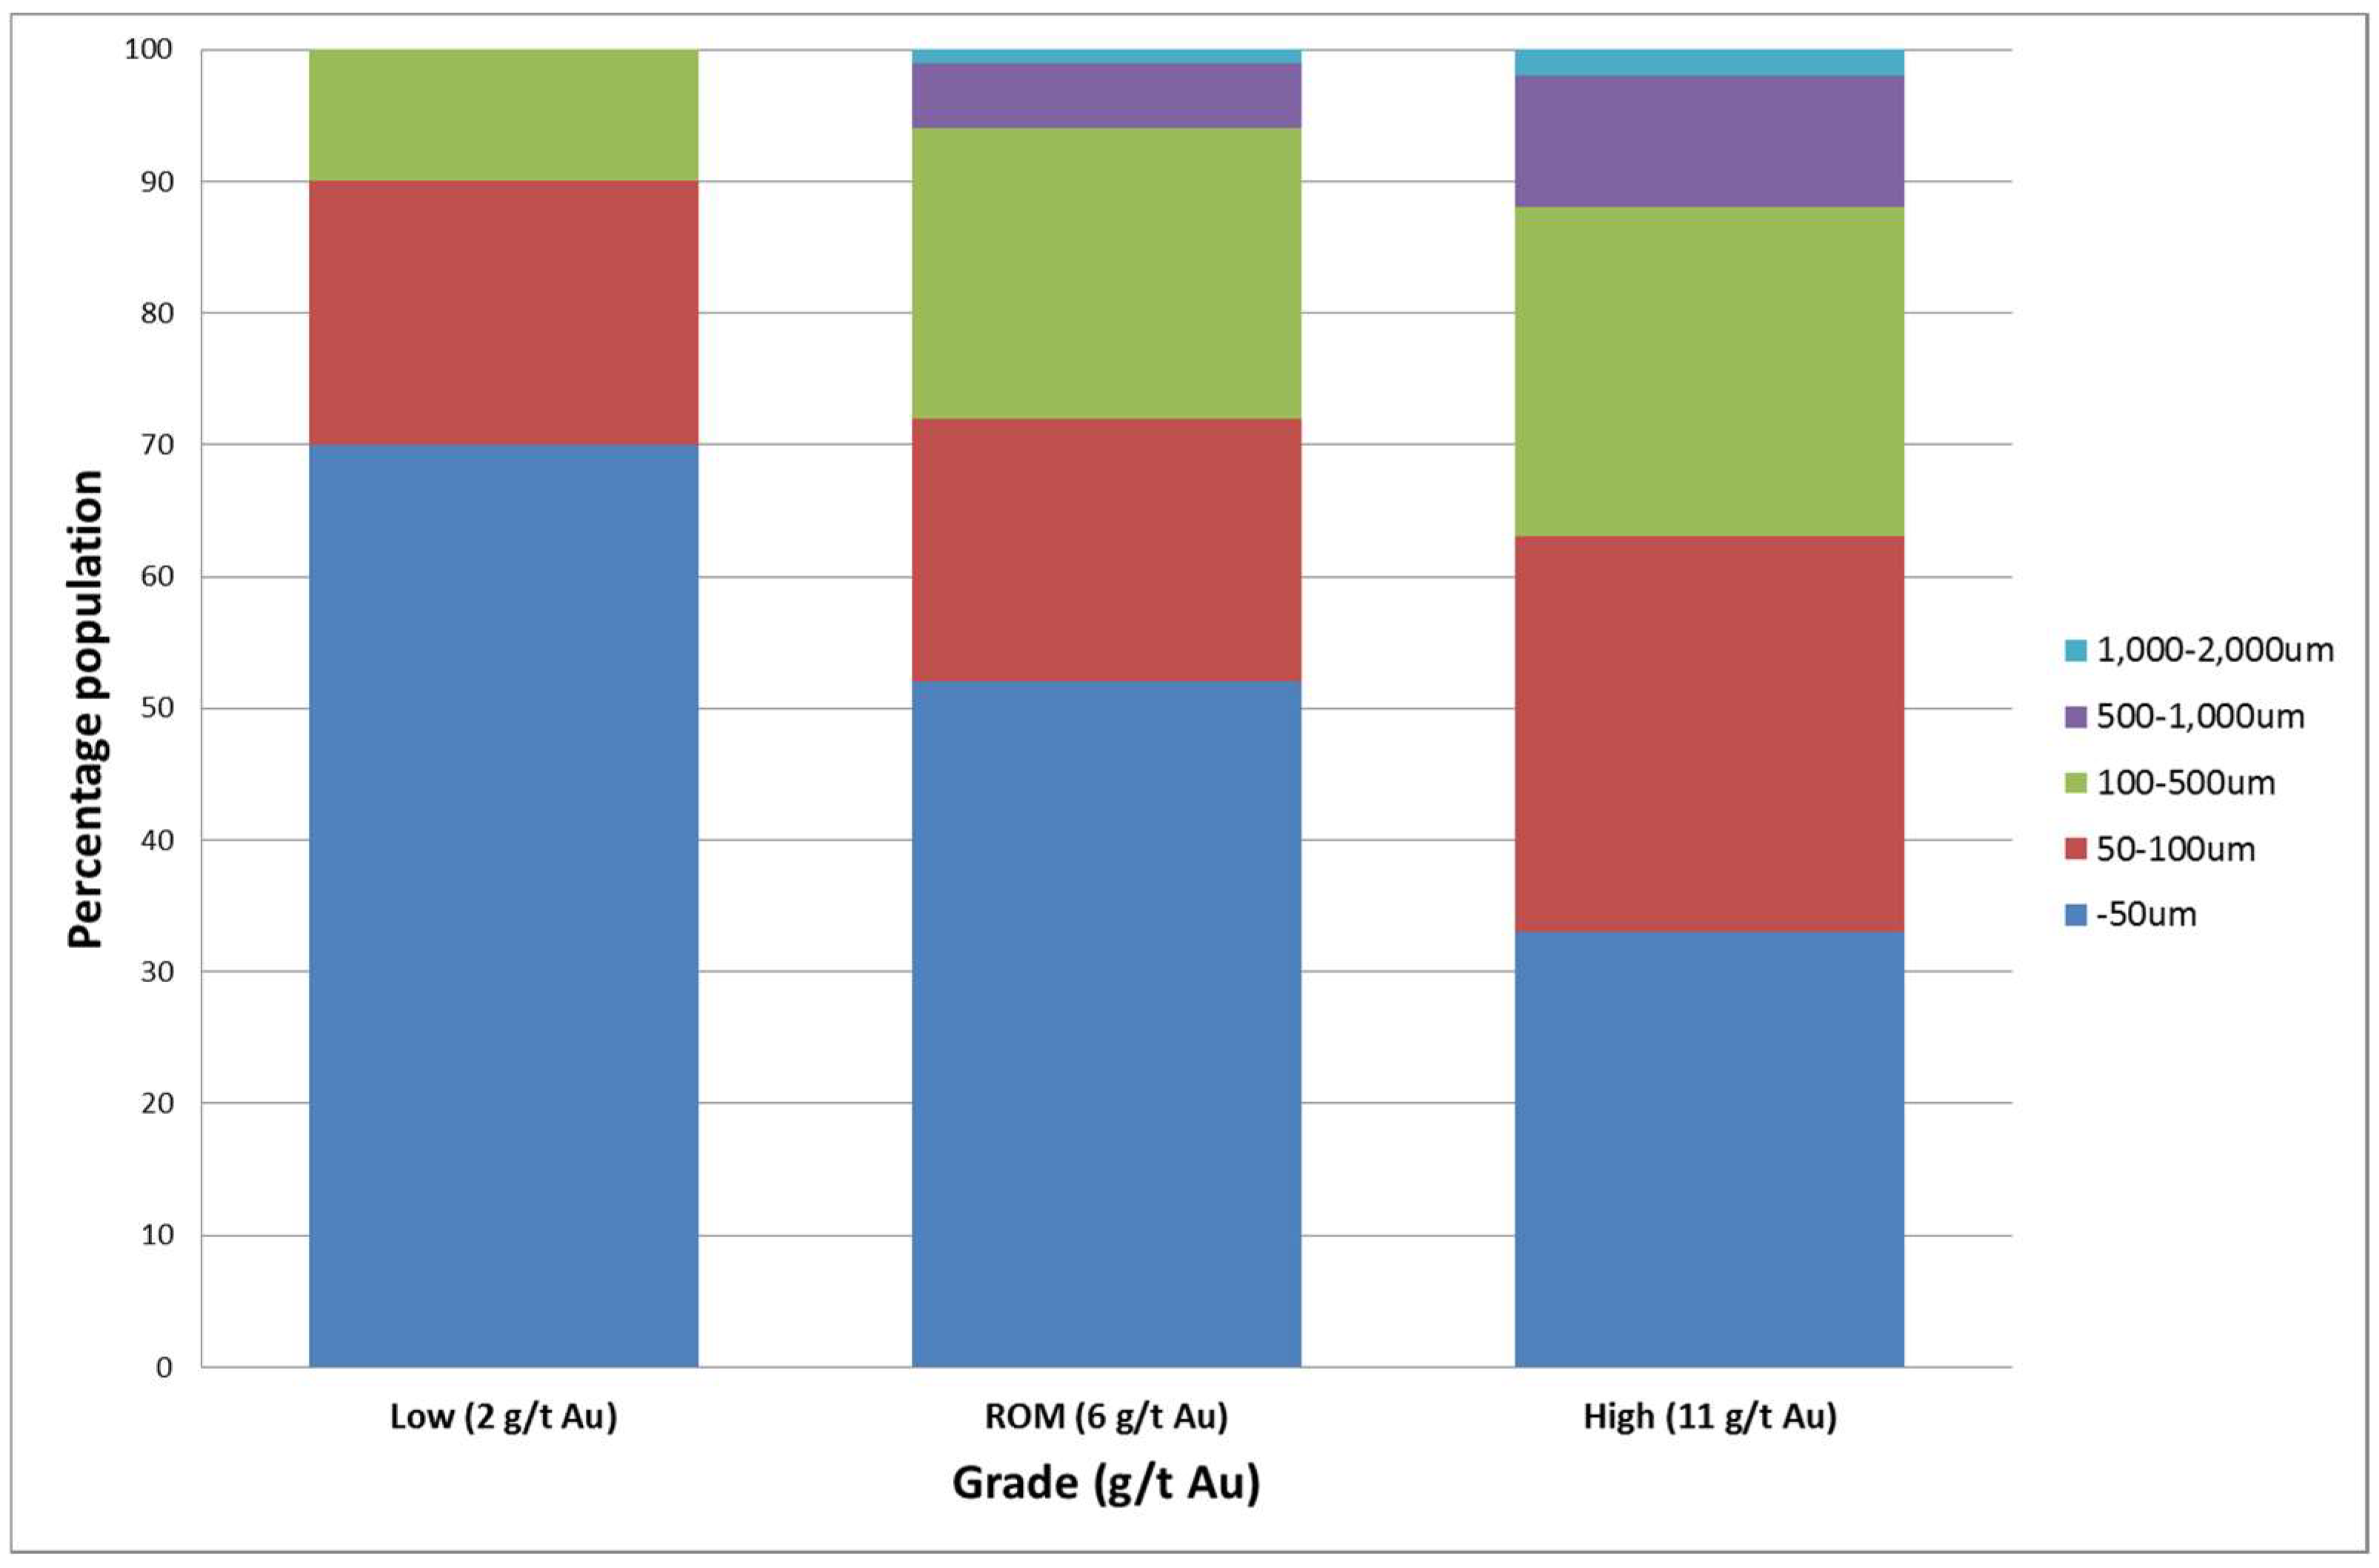
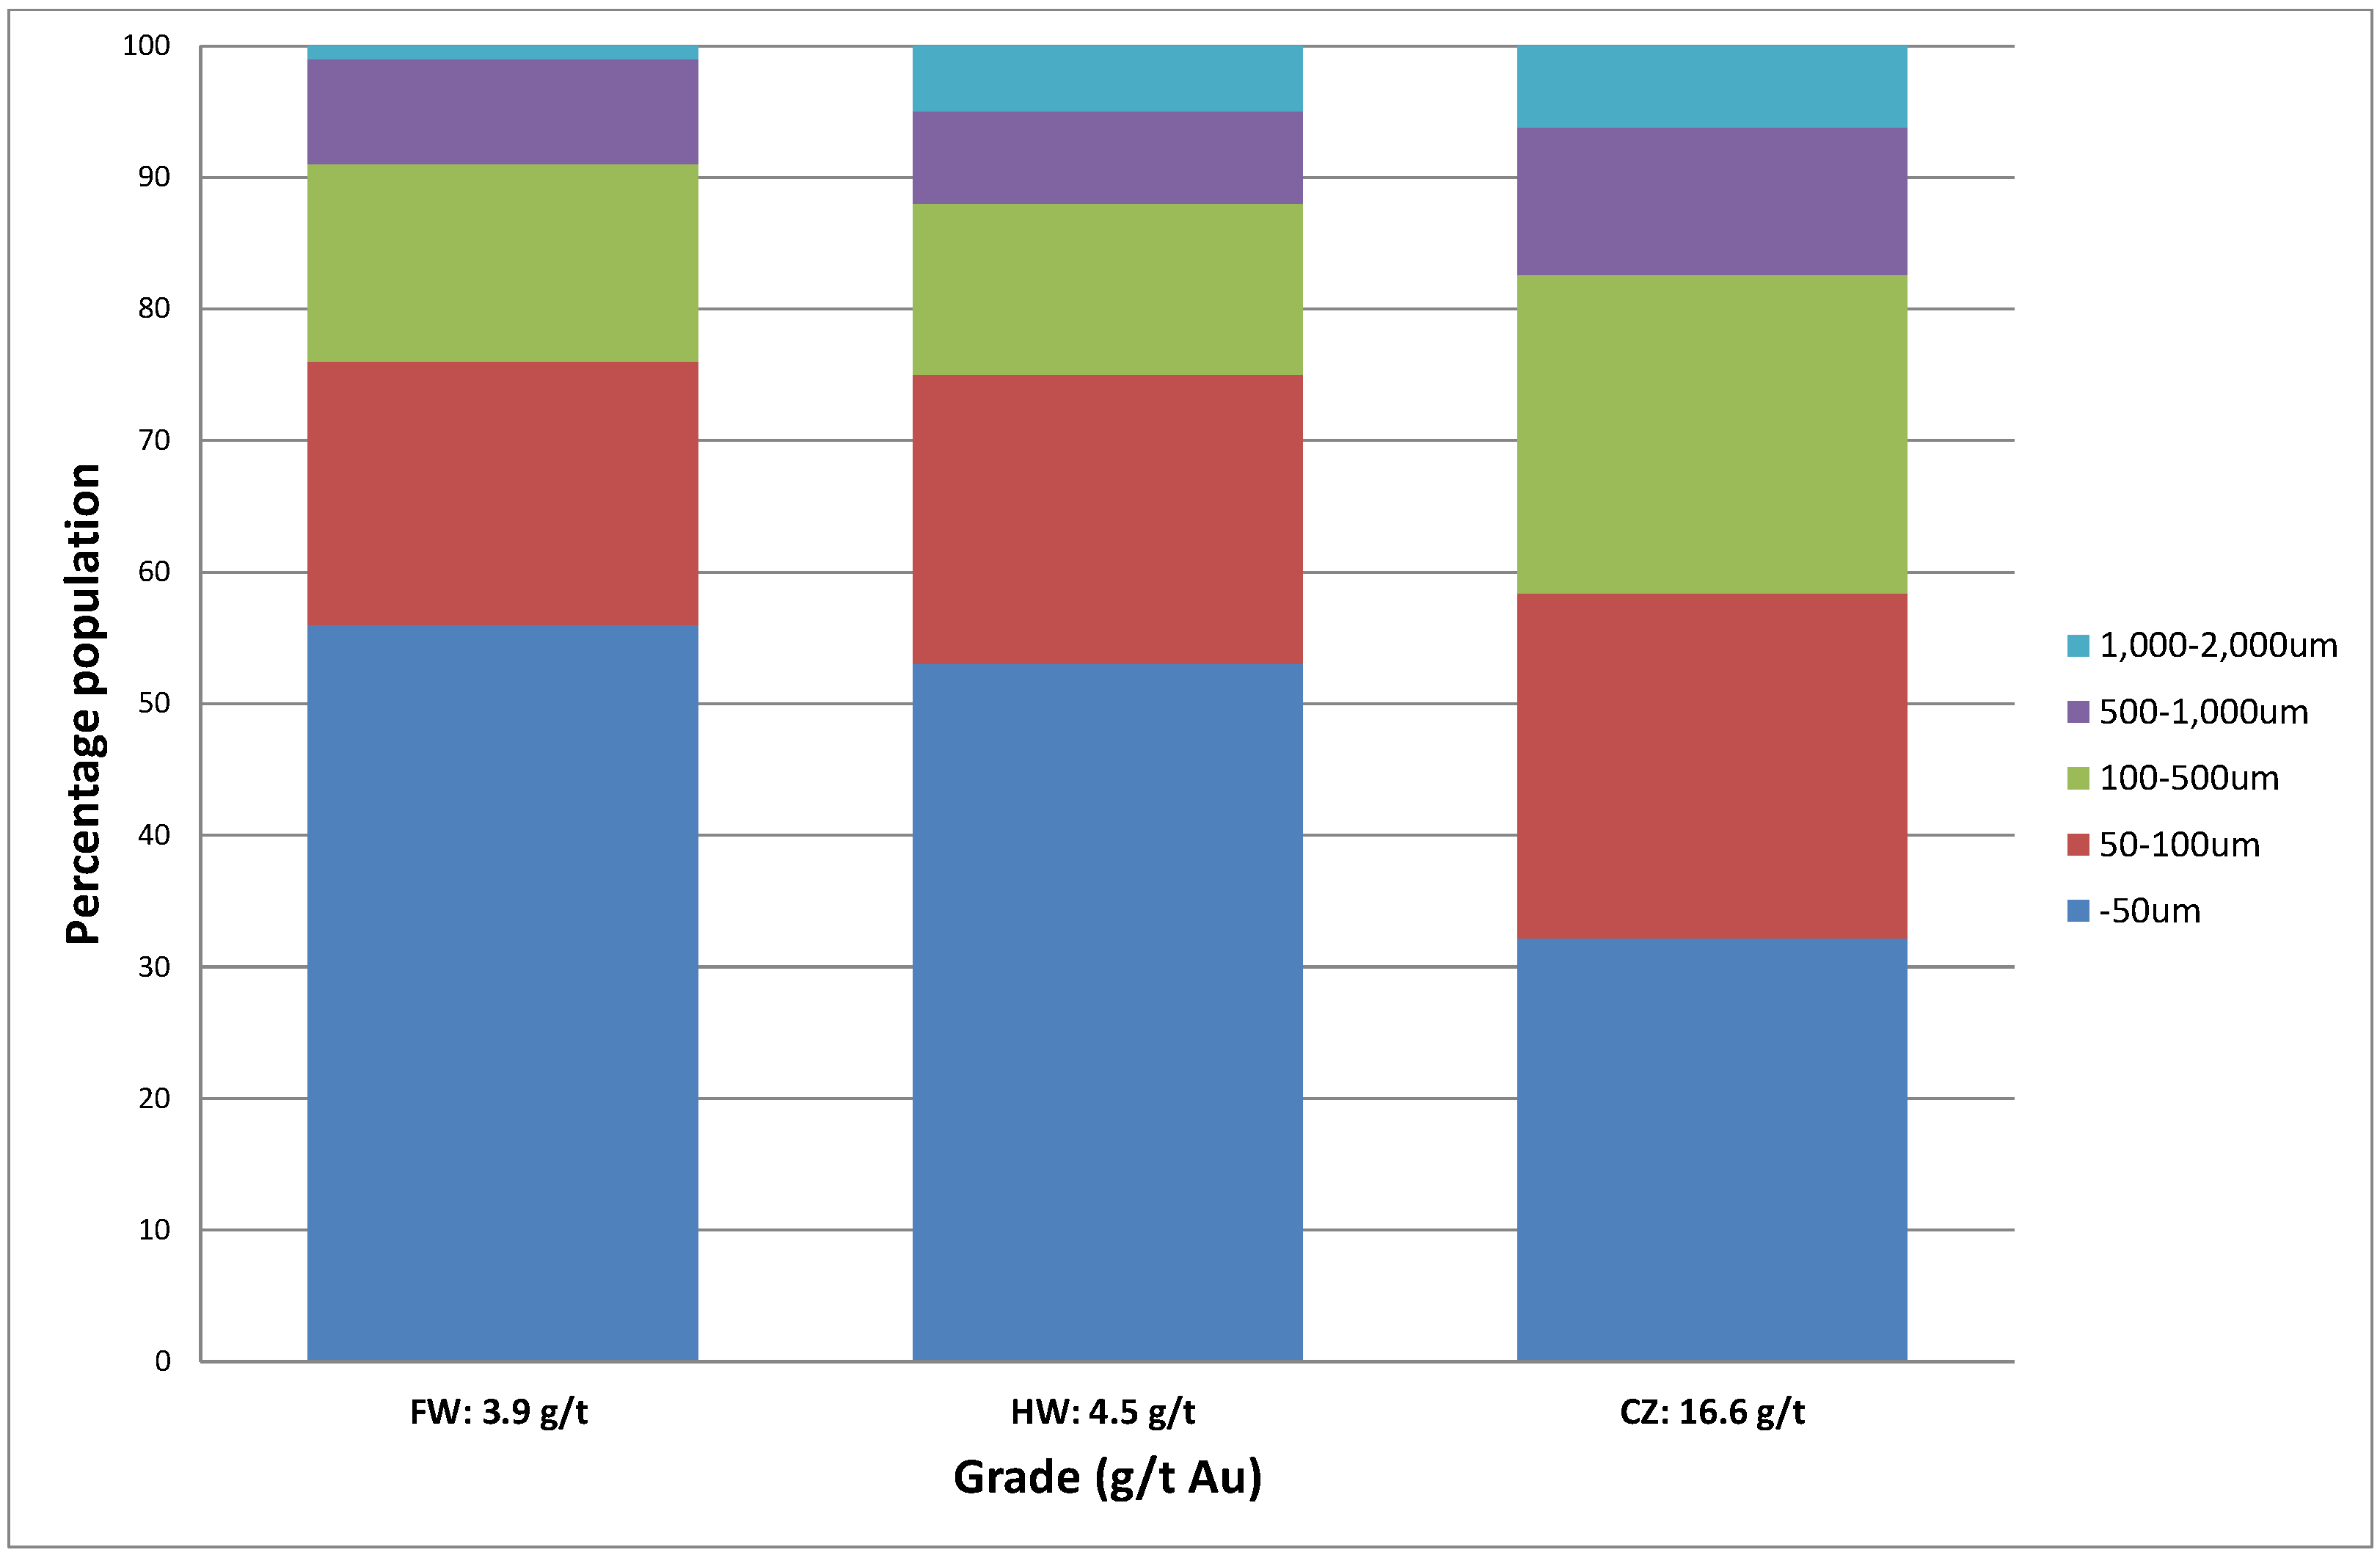
Figure 3.
Percentage gold particle distribution by mass for SVZ grade domains.
Figure 3.
Percentage gold particle distribution by mass for SVZ grade domains.
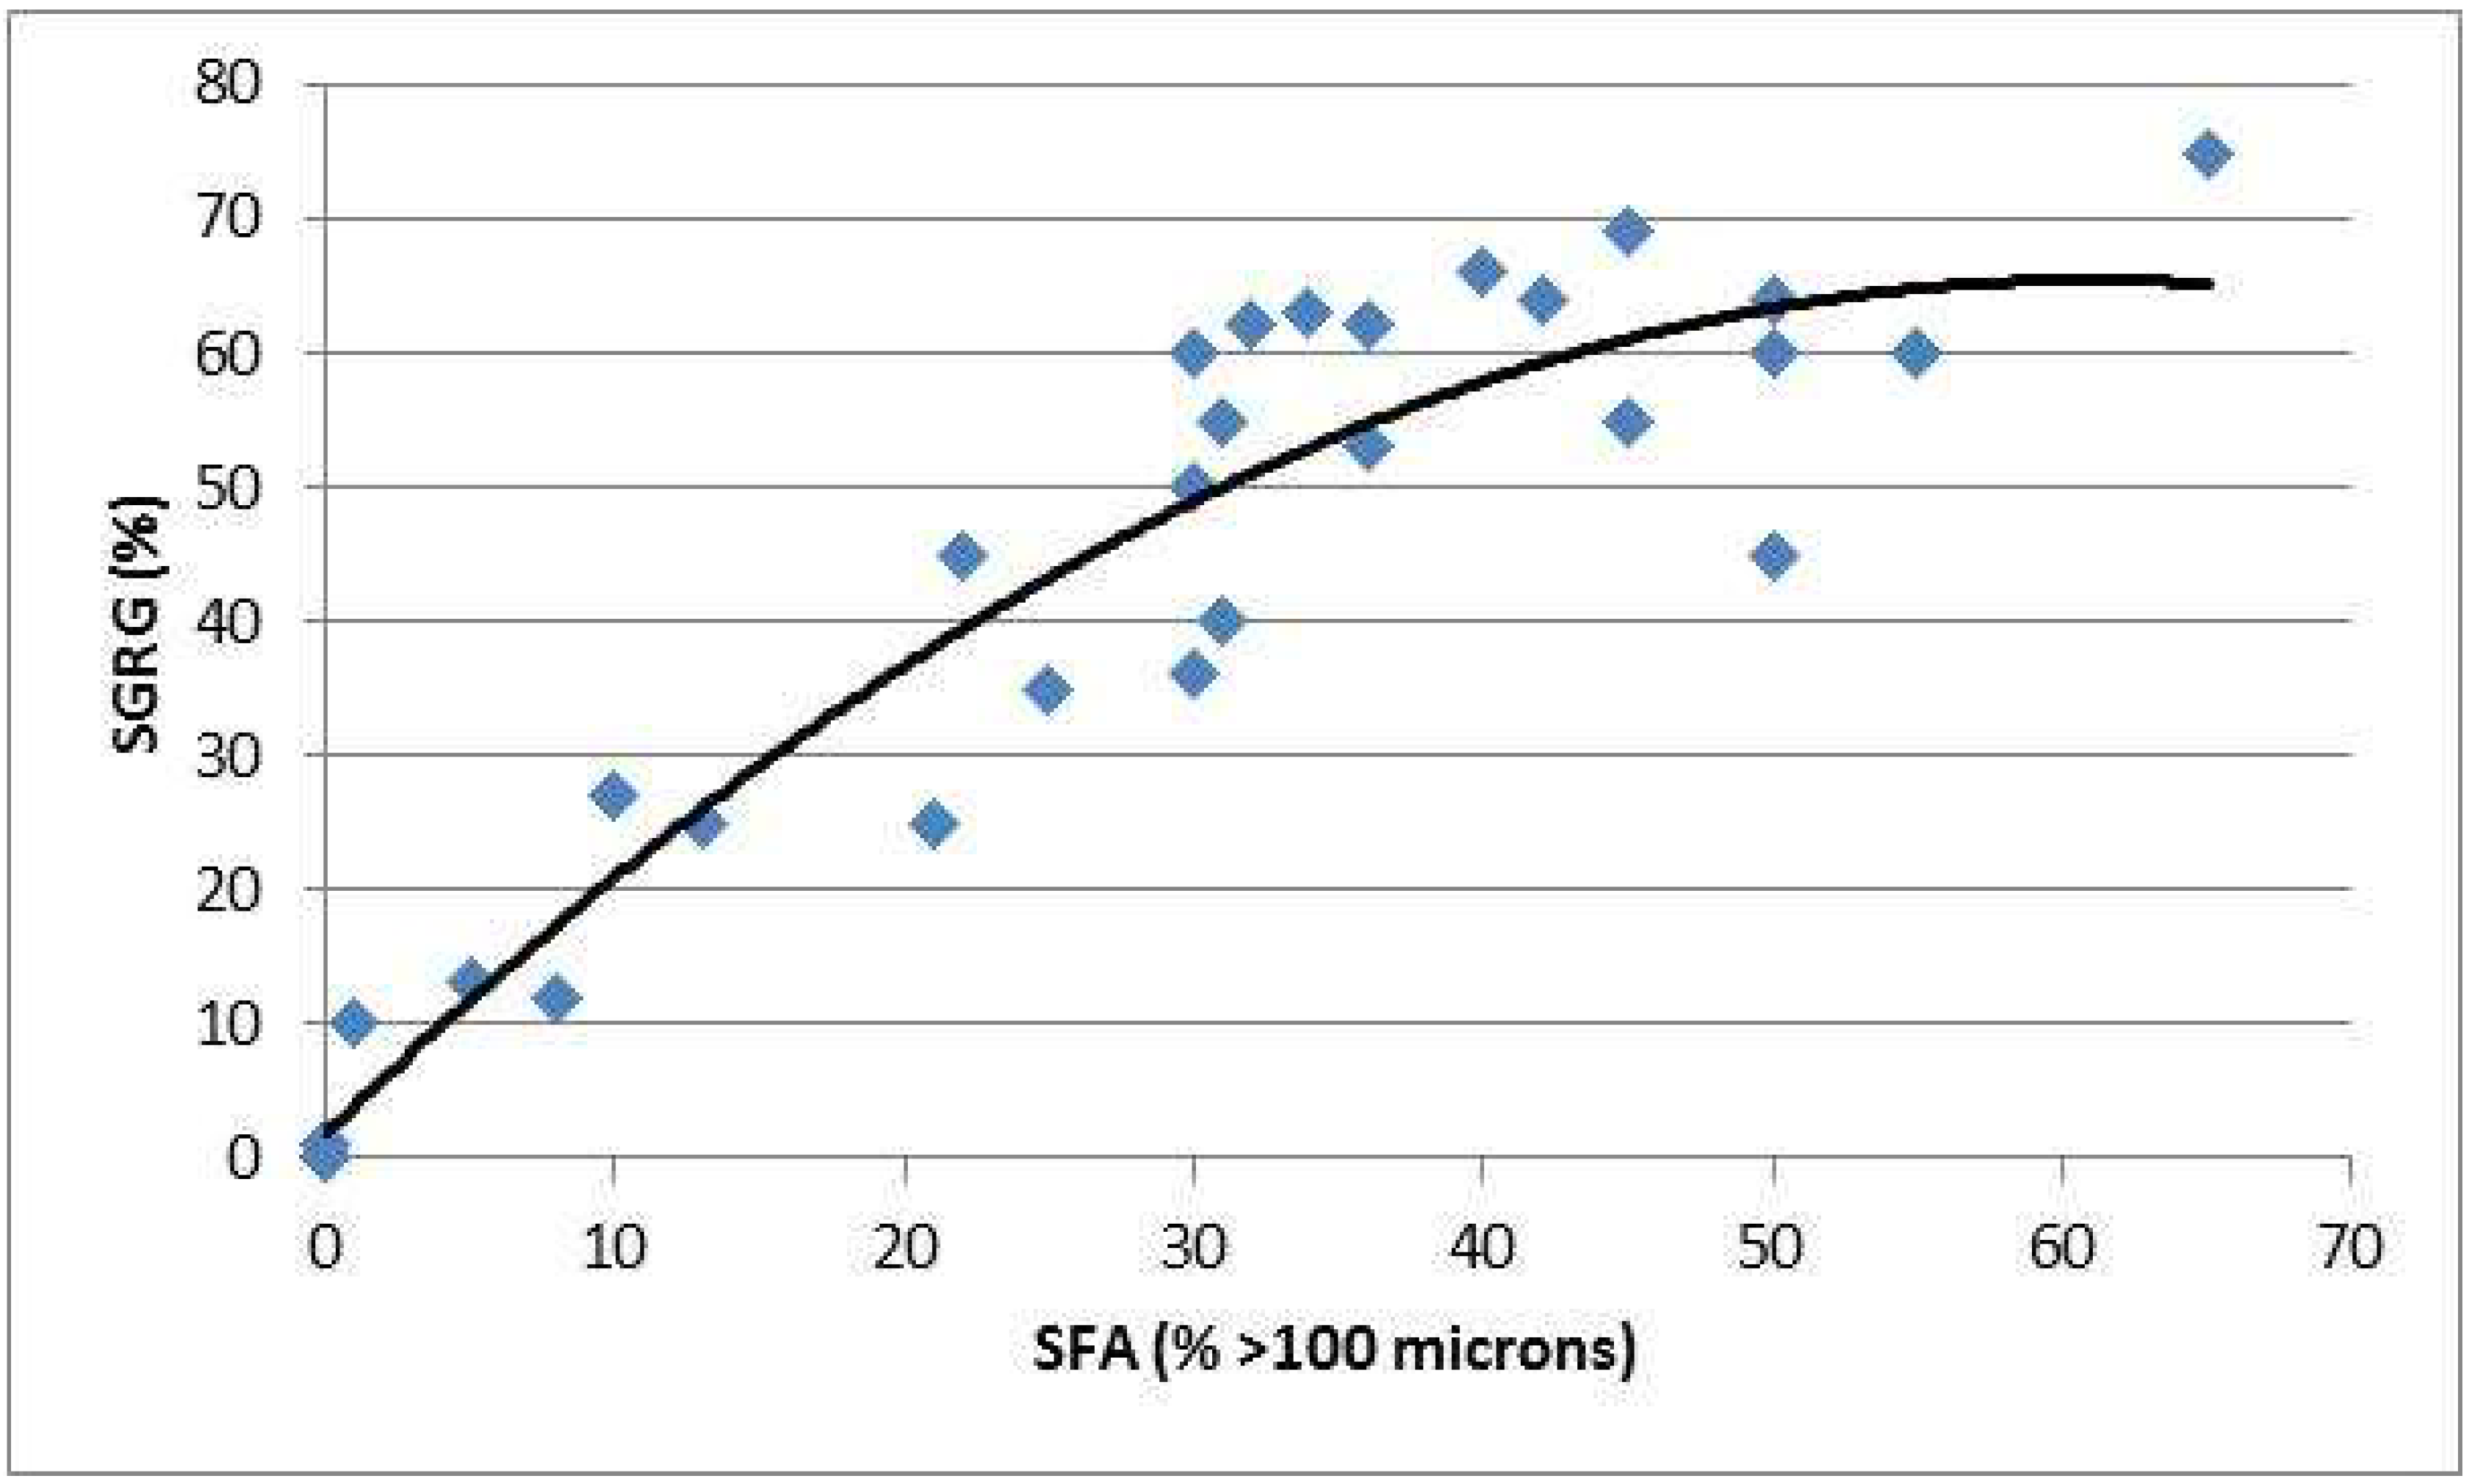
Figure 4.
Relationship between single-stage GRG (SGRG) and screen fire assay (SFA) coarse gold values in the SVZ.
Figure 4.
Relationship between single-stage GRG (SGRG) and screen fire assay (SFA) coarse gold values in the SVZ.
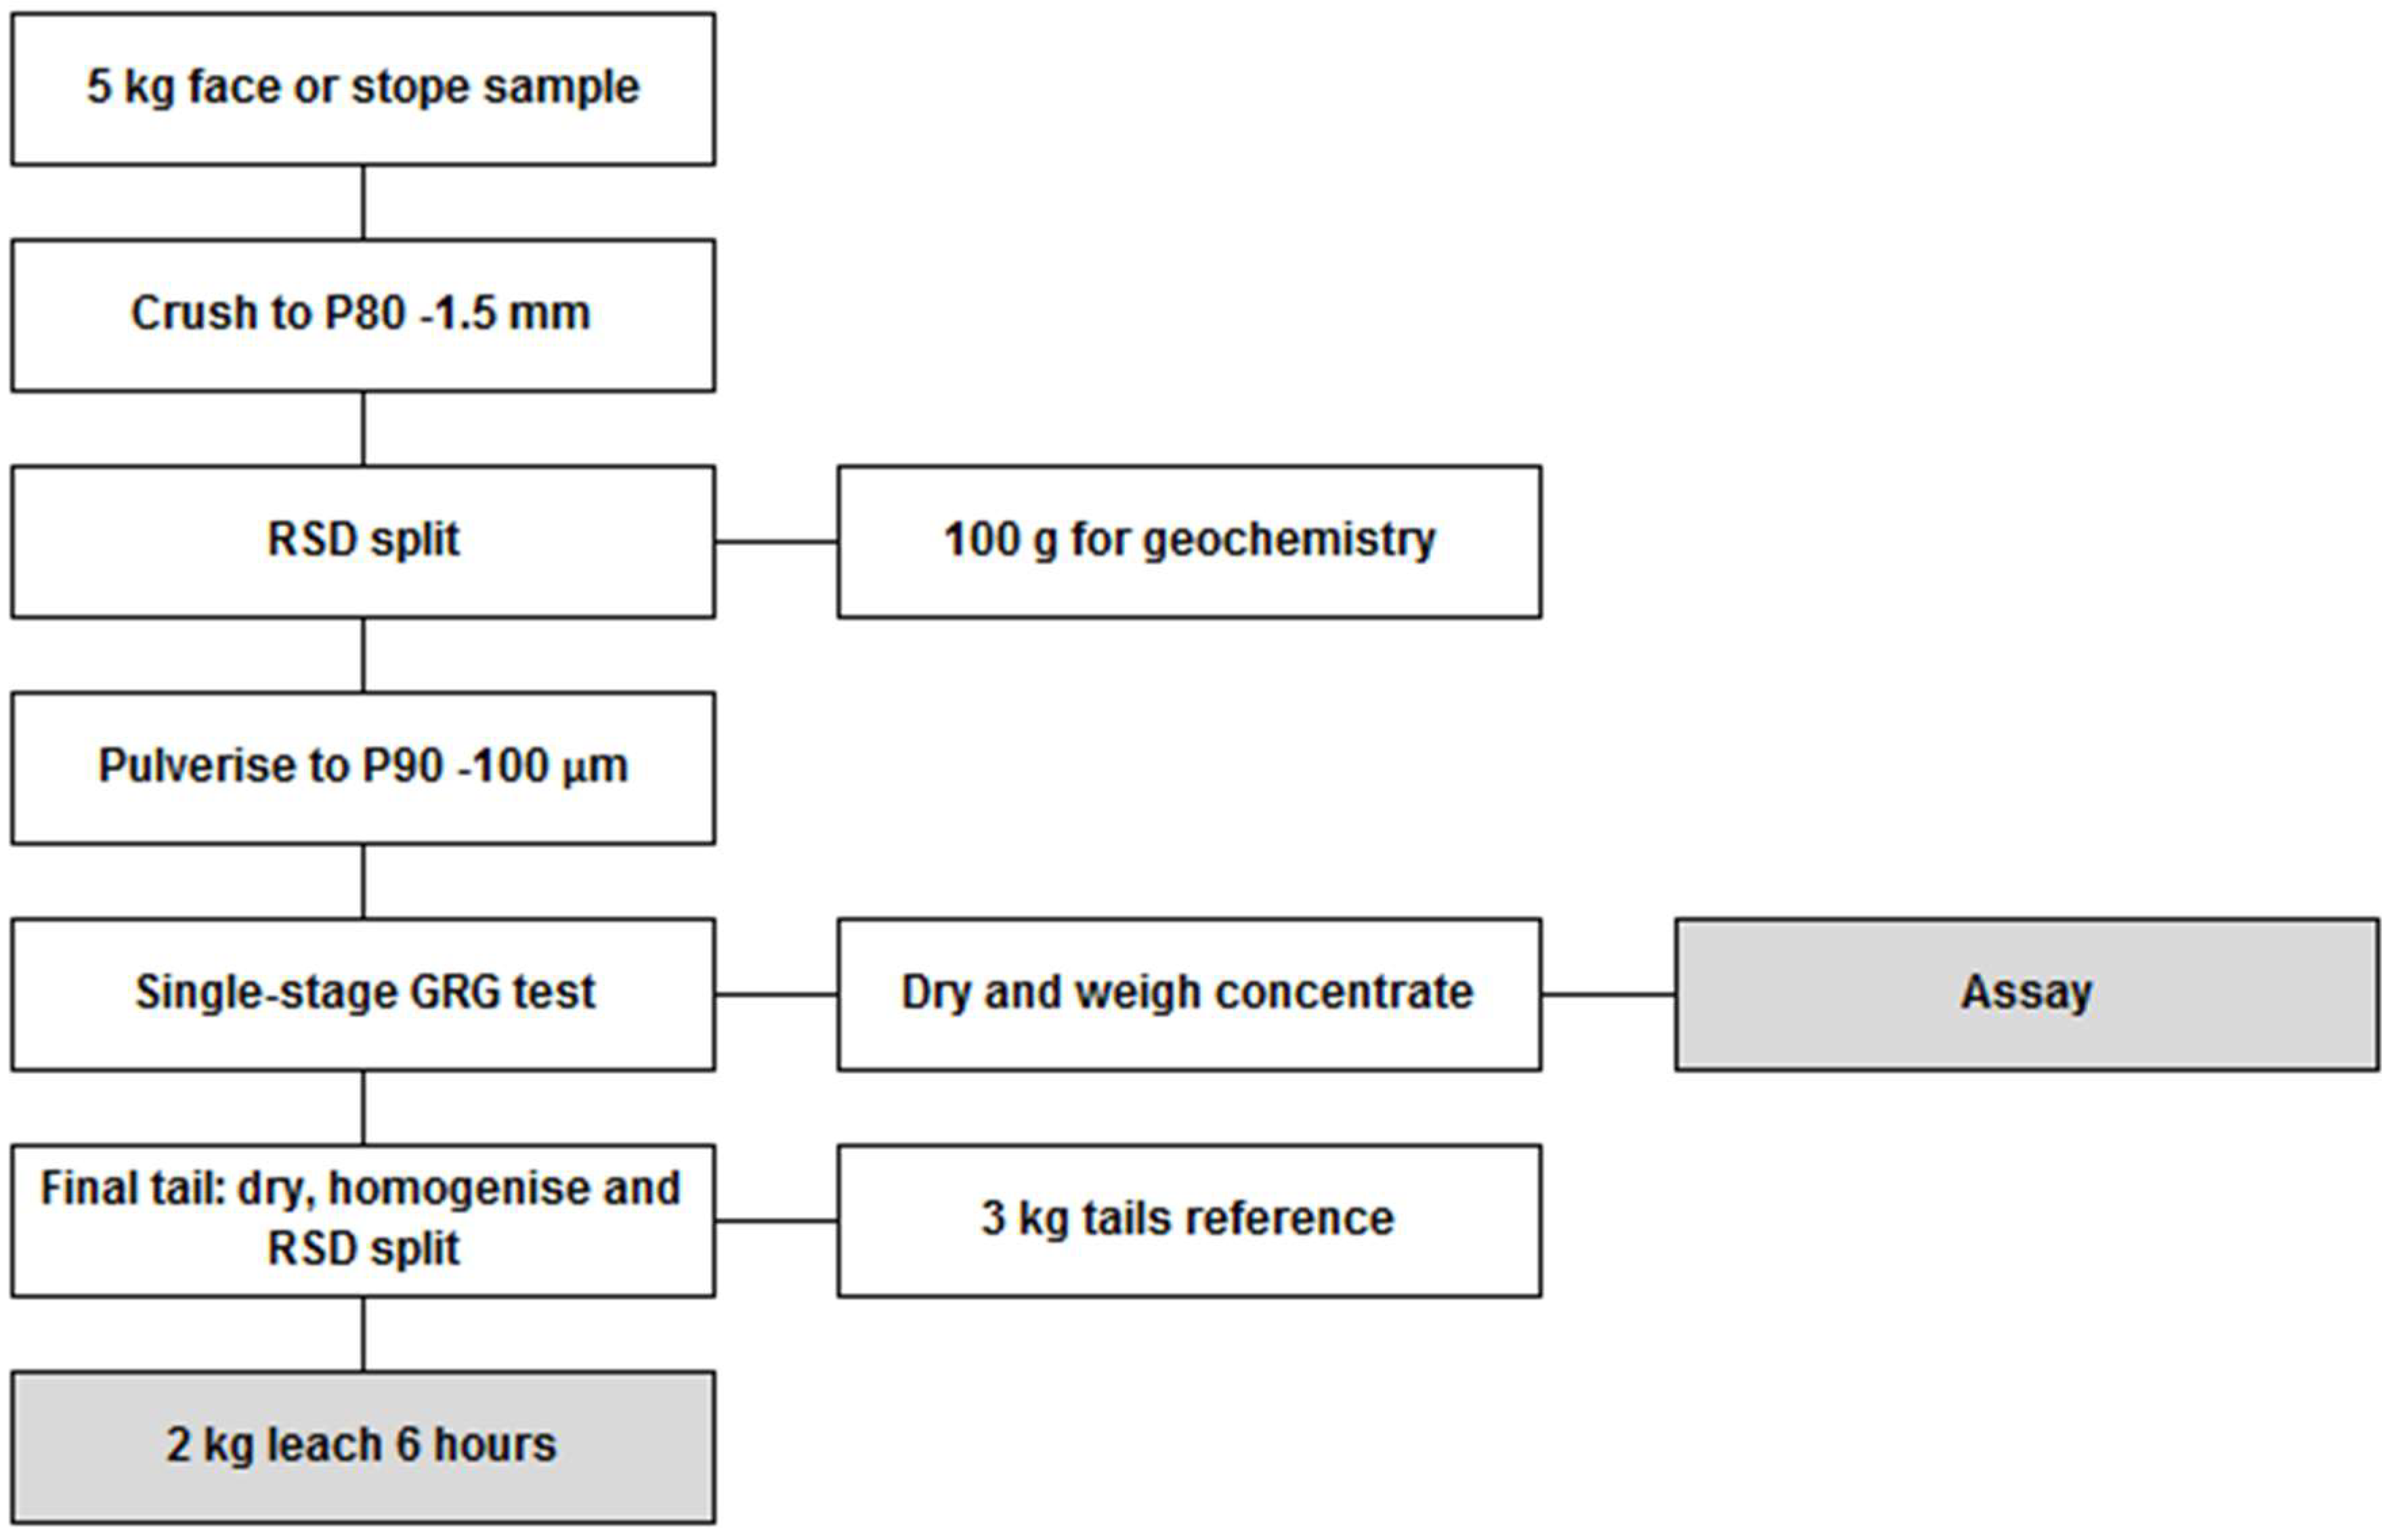
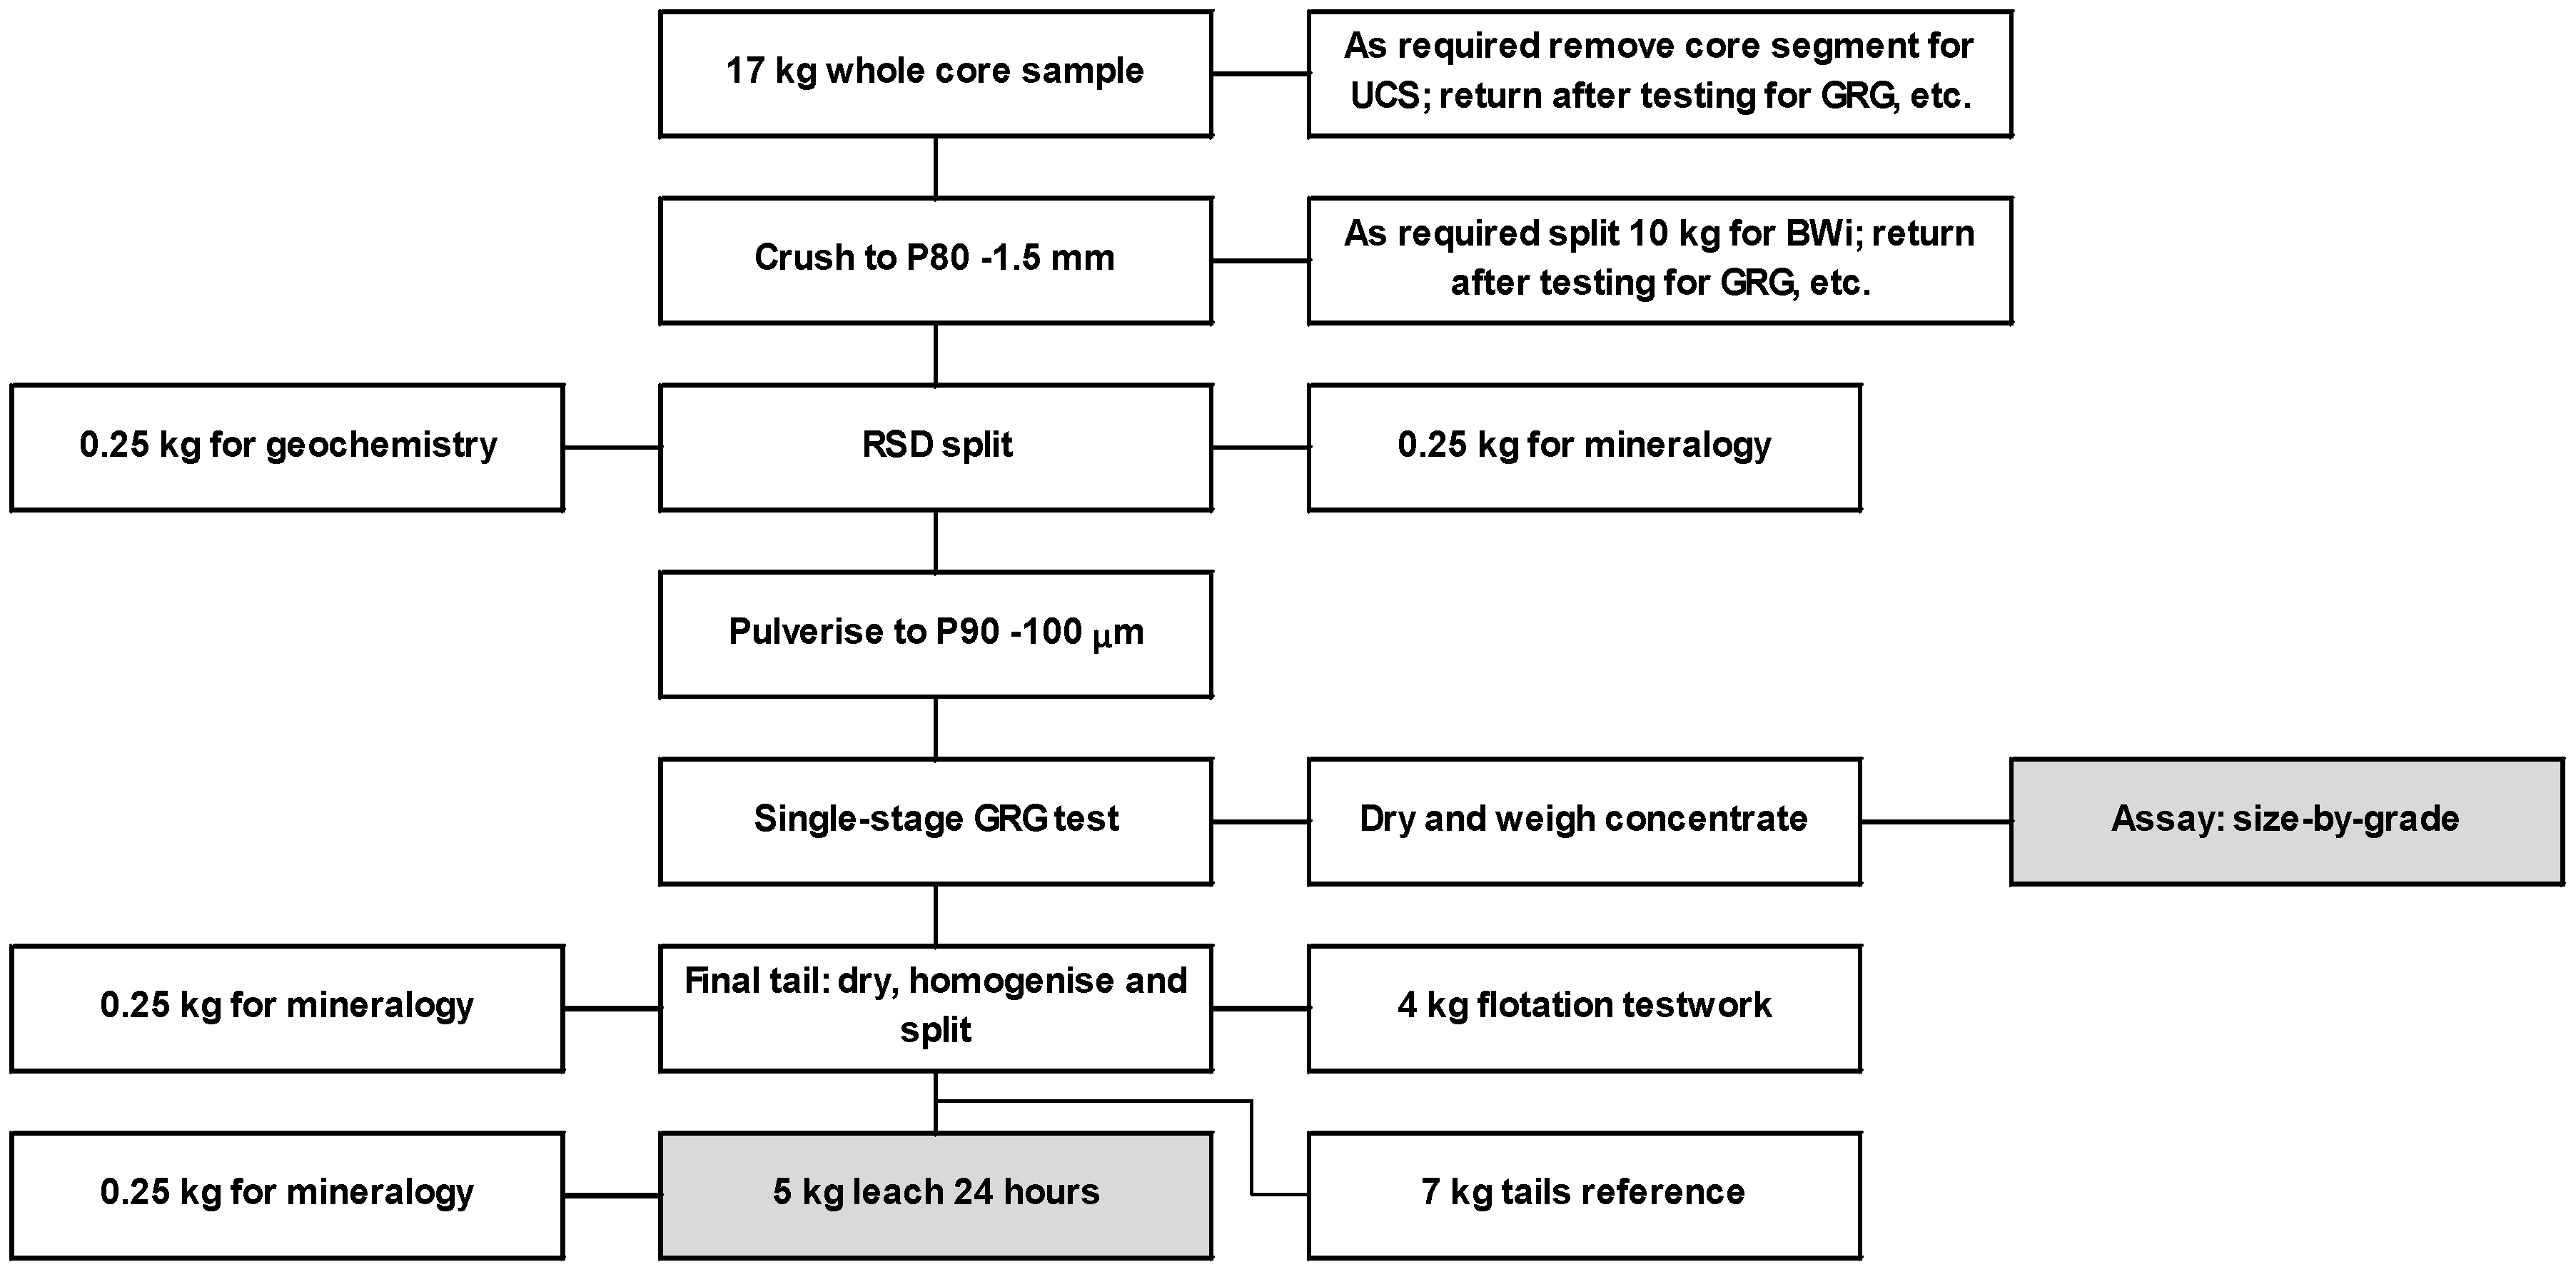
Figure 5.
Geometallurgical testwork flow-sheet for drill core and underground samples. The GRG test concentrate grade and tails leach grade (grey shaded boxes) are recombined to provide a head grade for the sample. UCS: uniaxial compressive strength; BWi: Bond ball mill work index; RSD: rotary sample divider.
Figure 6.
Percentage gold particle distribution (by mass) for SVZ mineralisation domains based on bulk sample processing.
Figure 6.
Percentage gold particle distribution (by mass) for SVZ mineralisation domains based on bulk sample processing.
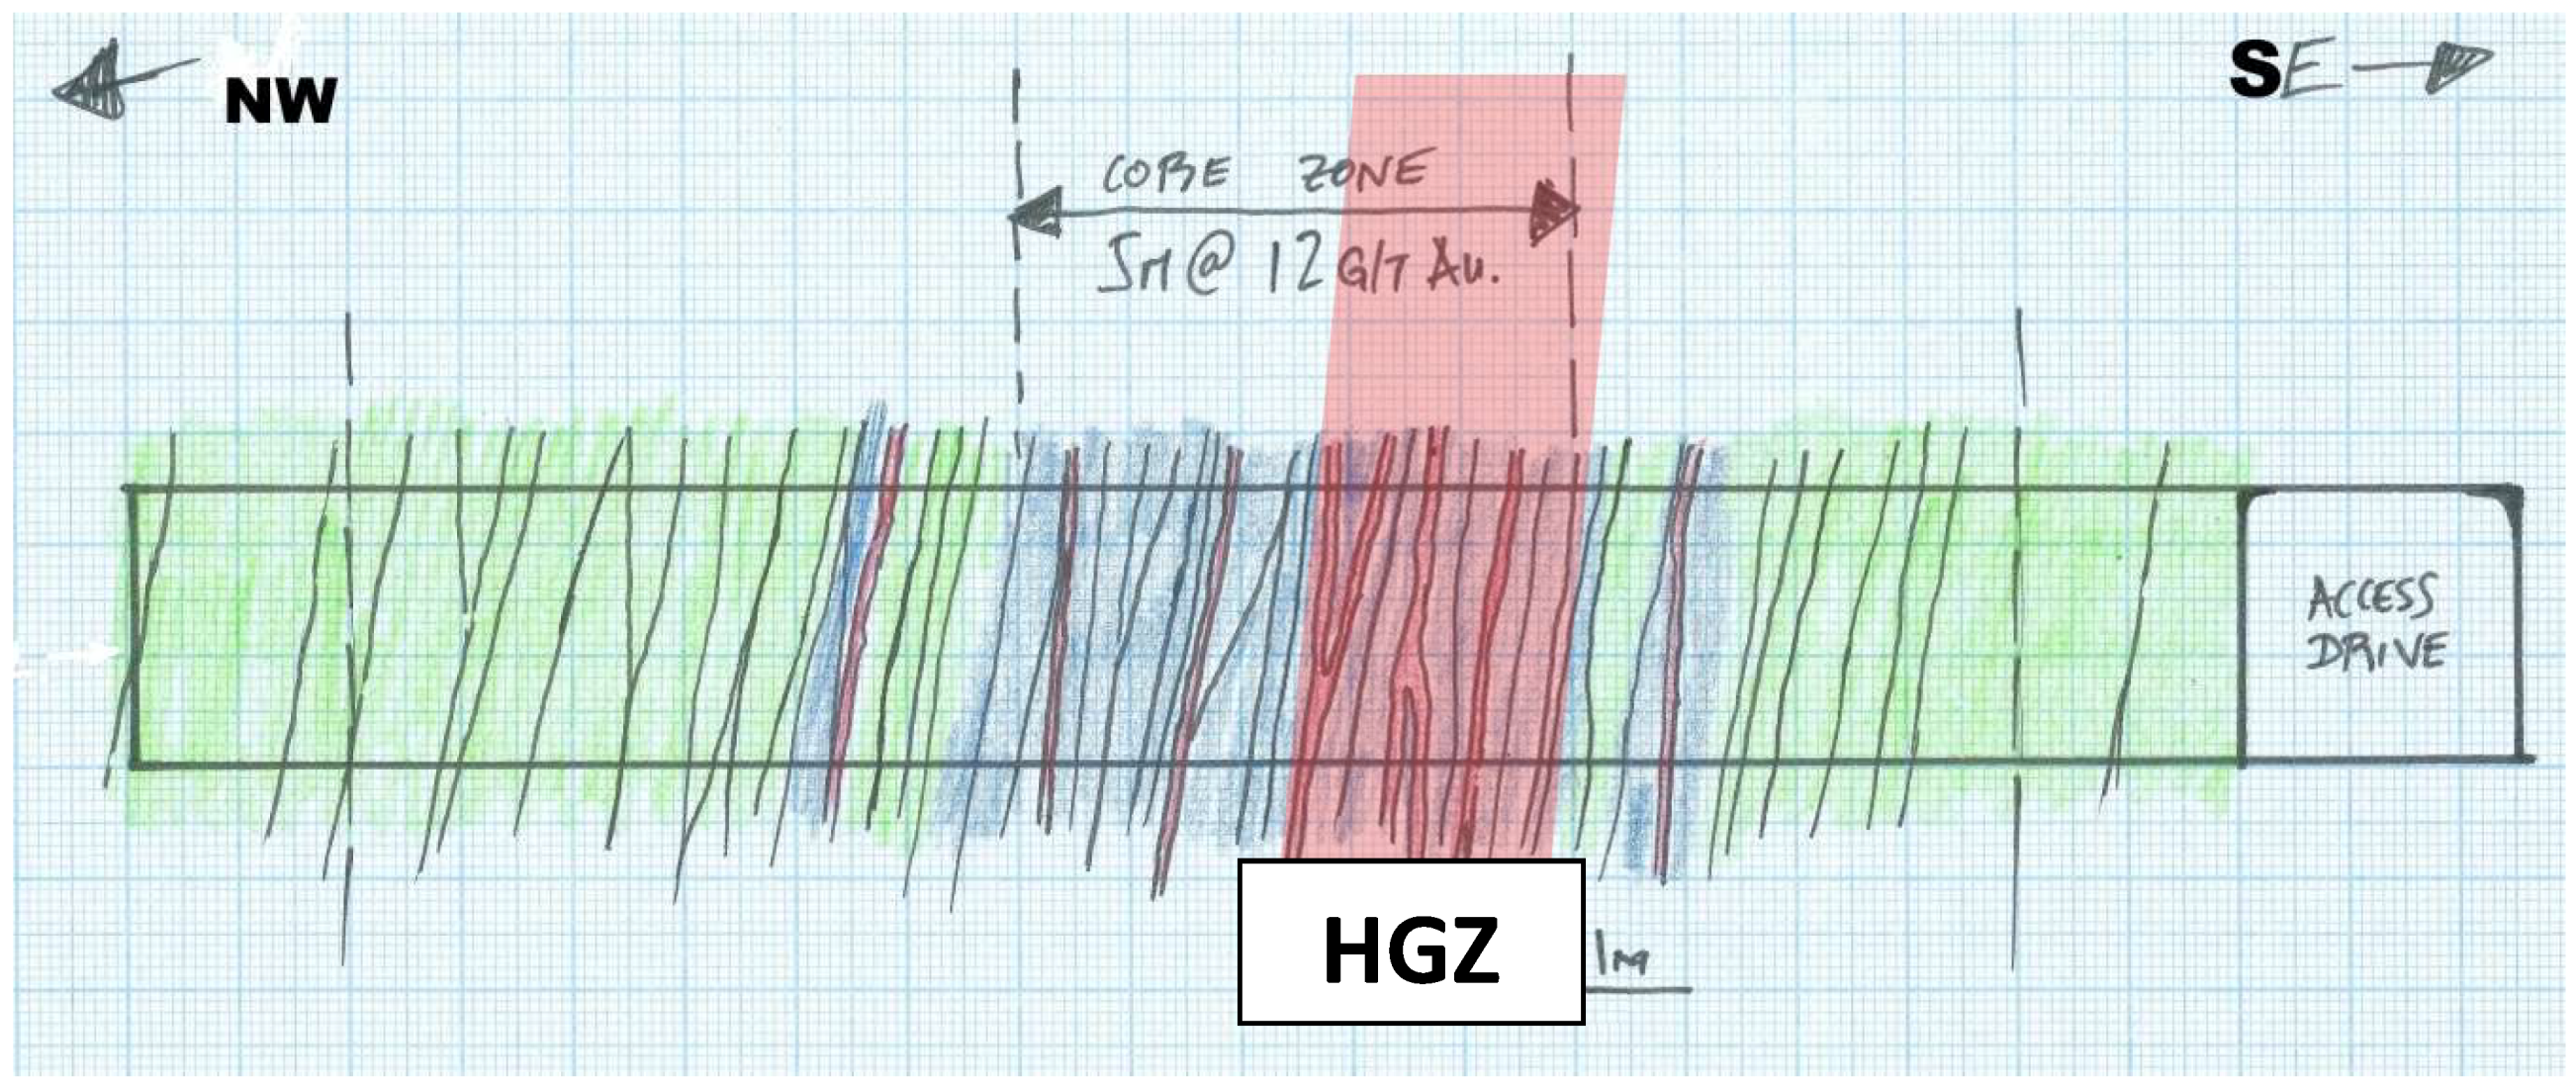
Figure 7.
HGZ (2.6 m width at 19.1 g/t Au) identified within the CZ. Geological field sketch of cross-cut #2 (XC.2;
Figure 2) NE wall. Green: weak to moderate silicification; and Blue: strong silicification.
Figure 7.
HGZ (2.6 m width at 19.1 g/t Au) identified within the CZ. Geological field sketch of cross-cut #2 (XC.2;
Figure 2) NE wall. Green: weak to moderate silicification; and Blue: strong silicification.
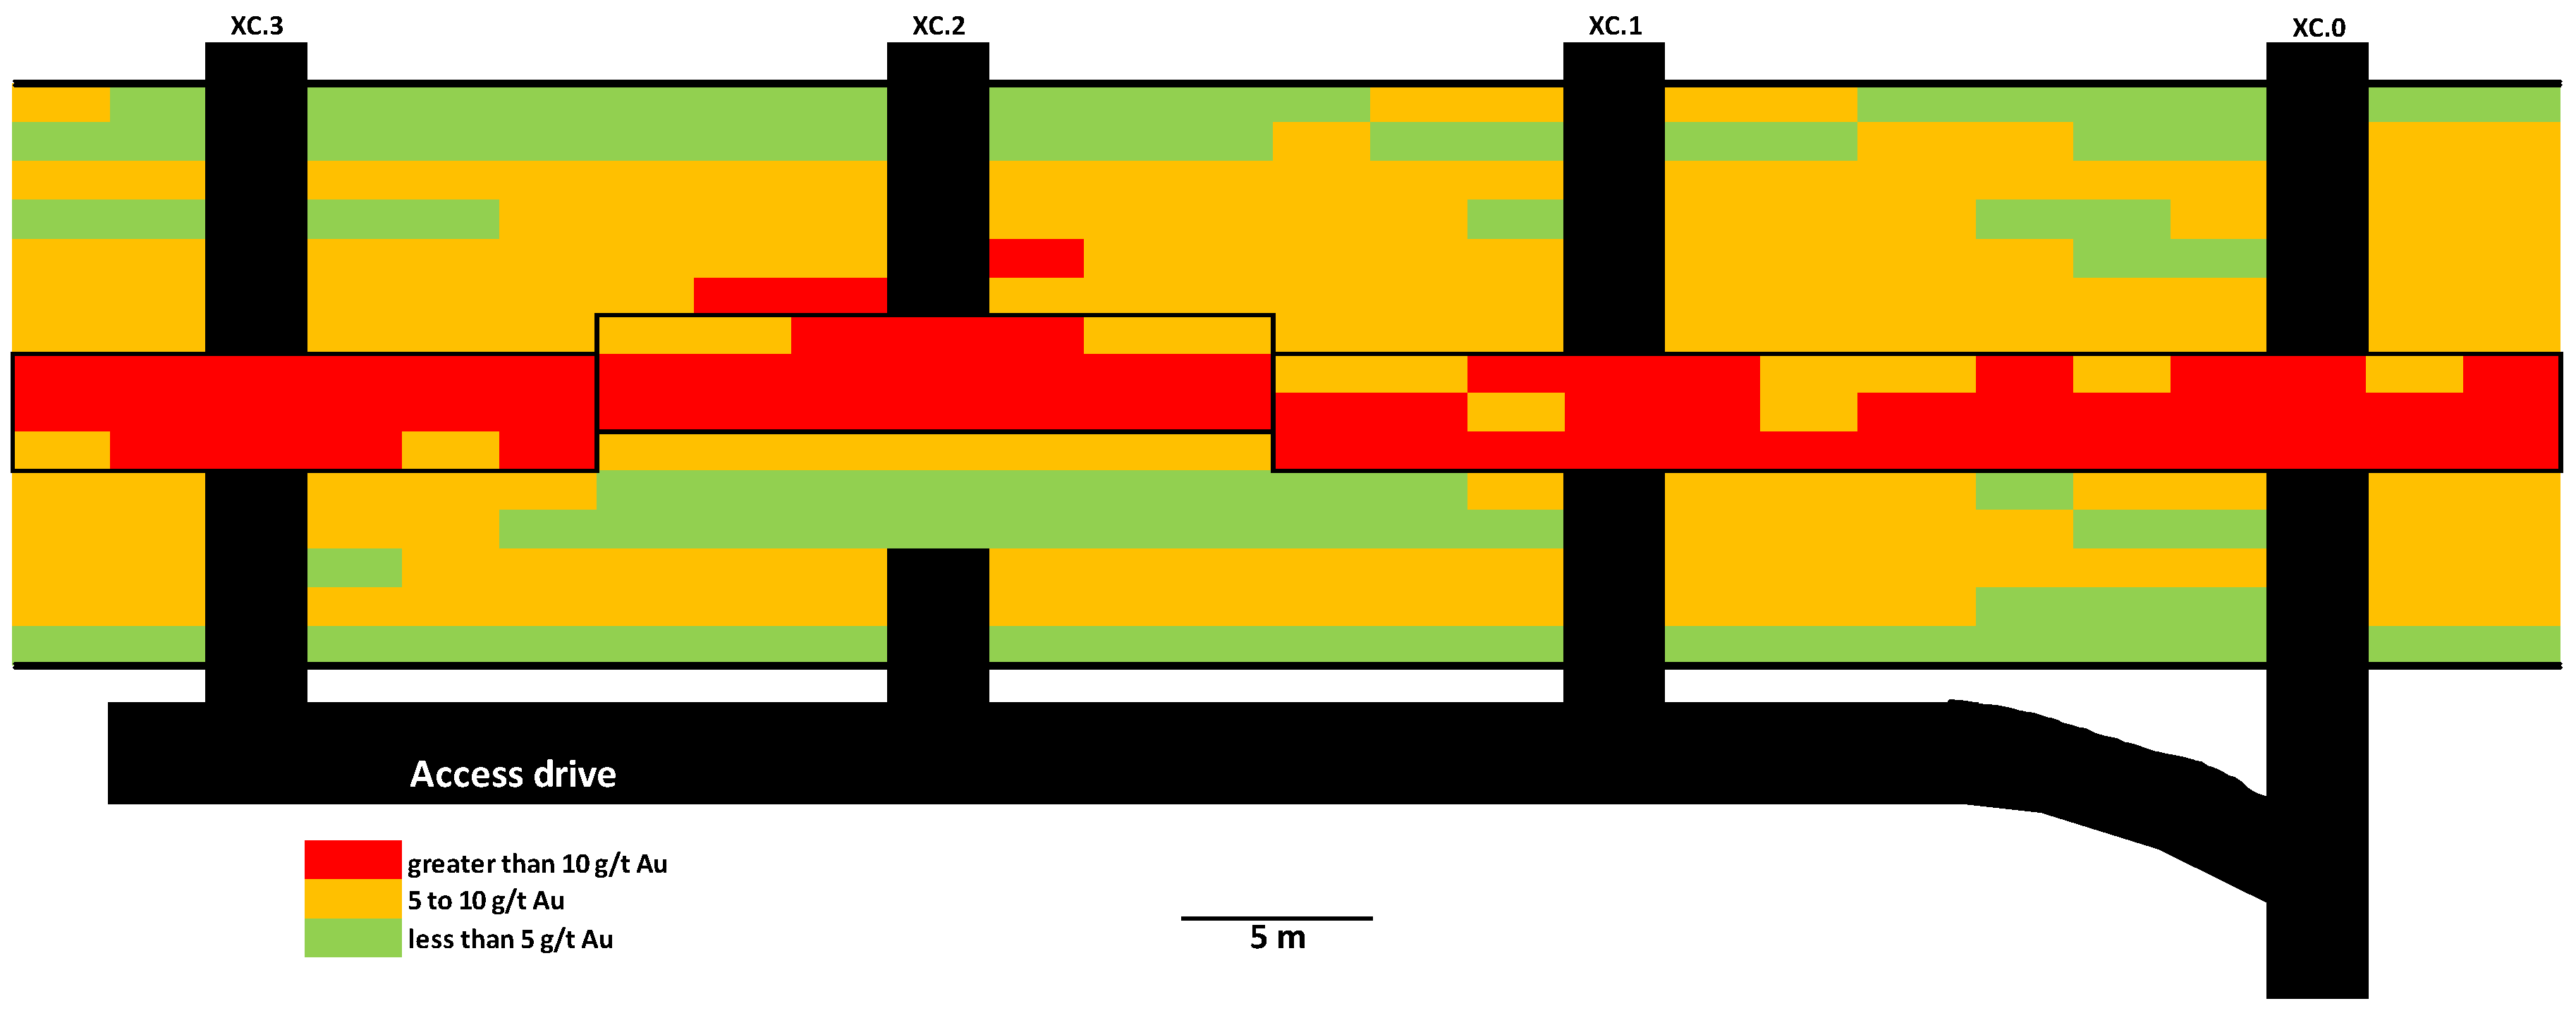
Figure 8.
High-resolution grade-control model by CS showing HGZ amenable to narrow vein mining. Trial stope focussed on areas defined by black outlines.
Figure 8.
High-resolution grade-control model by CS showing HGZ amenable to narrow vein mining. Trial stope focussed on areas defined by black outlines.
Figure 9.
Flow sheet for ore control samples. The GRG test concentrate grade and tails leach grade (grey shaded boxes) are recombined to provide a head grade for the sample.
Figure 9.
Flow sheet for ore control samples. The GRG test concentrate grade and tails leach grade (grey shaded boxes) are recombined to provide a head grade for the sample.
Table 1.
Summary of ore characterisation testwork results in the SVZ.
Table 1.
Summary of ore characterisation testwork results in the SVZ.
| Master Sample | Head Grade (g/t Au) | GRG (%) | Leach Recovery (%) | Total GRG and Leach Recovery (%) | Gold >100 µm | d95Au (µm) |
|---|
| MC.1 | 2.3 | 14 | 67 | 81 | 15% | 150 |
| MC.3 | 5.8 | 56 | 33 | 89 | 40% | 650 |
| MC.2 | 10.9 | 67 | 27 | 94 | 49% | 1100 |
| All | 6.3 | 57 | 34 | 91 | 42% | 680 |
Table 2.
Optimal sample mass required to achieve theoretical “field” precision of ±20% at the 90% confidence limits for different grade-liberation diameter scenarios within the SVZ.
Table 2.
Optimal sample mass required to achieve theoretical “field” precision of ±20% at the 90% confidence limits for different grade-liberation diameter scenarios within the SVZ.
| Grade Type | Grade (g/t Au) | d95Au (µm) | Optimum Sample Mass (kg) | Sampling Constant—K (g/cm1.5) |
|---|
| High 1 | 11 | 1100 | 185 | 5700 |
| Run of mine (ROM) 2 | 6 | 650 | 70 | 5300 |
| Low 3 | 2 | 150 | 3 | 1800 |
Table 3.
Summary of QAQC applied during the geometallurgical drilling programme.
Table 3.
Summary of QAQC applied during the geometallurgical drilling programme.
| Action/Activity | Responsibility | Action | Performance Expectation |
|---|
| Core logging and sampling | Project | Internal peer review of all photographs and logs against the core | Compliance to core logging protocol. Nominal expectation of 95% compliance |
| Core verification | Third party peer review and verification of all core, photographs, logs and samples |
| Sample security | Project | Core trays in secure storage | Must occur for all core/each and every sample |
| All samples placed and transported in self-locking plastic pails |
| Completion of chain of custody paperwork |
| Third party supervision of collection and dispatch process |
| Field duplicates | - | None taken due to whole core sample/assay | - |
| Coarse duplicates | - | None taken due to whole core sample/assay | - |
| Pulp duplicates | Laboratory | LeachWELL tails duplicates (5 kg) at rate of 1 in 20 | Duplicate sample grade within 90% ±10% HARD |
| Certified reference material (CRM) | Project and laboratory | Four CRMs applied ranging low to high grade. Used for LeachWELL determination on GRG tails. CRMs (0.2 kg) leached with fire assay on tail. Rate of 1 in 15 | 2δ–3δ (“warning”) re-assay 25% of batch |
| >3δ (“action”) re-assay 100% of batch |
| Standards (In-house) | Laboratory | Used to monitor GRG test/Knelson concentrator efficiency. Fifteen kilograms of blank fine-crushed rock dosed with a known quantity of coarse gold. Inserted at 1 in 20 | 90% of samples to be within ±20% of expected grade (e.g., >80% recovery) |
| Blanks | Project and laboratory | Blanks granitic material, 50 assays gave grade <0.01 g/t Au | Blank assay <0.1 g/t Au |
| 15 kg blank material processed through entire protocol at rate of 1 in 20 |
| 15 kg blank placed after sample with visible gold and processed through entire protocol |
| 2 kg blank material leached at a rate of 1 in 20 |
| Barren flushes of Knelson unit | Laboratory | 2 kg of barren sand flushed the Knelson concentrator after each sample | Less than 1% gold loss in blank assay compared to primary sample head grade |
| Knelson concentrator cleaning sand assayed by LeachWELL at 1 in 10. |
| If visible gold reported in sample, cleaning sand automatically LeachWELL |
| Umpire | Laboratory | Duplicate tails samples submitted to an external laboratory for LeachWELL at a rate of 1 in 25 | Duplicate sample grade within 90% ±10% HARD |
| Laboratory audit | Project | Weekly audits during the programme by project staff. Monthly audits by an independent third party | Full compliance of all procedures |
Table 4.
Summary of data collected during the geometallurgical drilling programme.
Table 4.
Summary of data collected during the geometallurgical drilling programme.
| Key Orebody Knowledge | Data Collection | Data Statistics/Number of Tests/Samples |
|---|
| Rock type | Geological and structure logs | All core logged and photographed wet and dry |
| Core photography |
| Geochemistry and mineralogy | Handheld X-ray fluorescence | Approximately 1000 m core scanned |
| Total sulphur | 340 |
| Base metals | 340 12 elements |
| Optical and automated mineralogy | 340 |
| Rock mass properties | Fracture logging and core recovery | All core geotechnically logged |
| EQUOtip | Reading points every 20 cm |
| Bulk density | 205 ore/50 waste |
| Uniaxial compressive strength | 48 ore/15 waste |
| Comminution | Bond ball mill work index | 48 ore/8 waste |
| Metallurgical recovery | GRG (primary sample) | 340 |
| Leach (tailings sub-sample) | 340 |
| Flotation (tailings sub-sample) | 105 |
| Grade | Gold grade | 340 back-calculated head grades |
Table 5.
Summary of data from the geometallurgical drilling programme across the SVZ.
Table 5.
Summary of data from the geometallurgical drilling programme across the SVZ.
| Data Type | Metric | Summary of Results | Comment |
|---|
| Mineralogy | - | Sheeted veins: gold dominantly free in quartz veins, with some pyrite-hosted gold |
| Geochemistry | - | Very low (<<0.1 ppm) Hg, As, Bi and Sb |
| Key base metals include Fe, Pb and Zn which correlate with pyrite, galena and sphalerite |
| Gold recovery | GRG | Data range: 65% | Overall shows dominance of GRG; generally 80% > 40% GRG. When GRG drops, then finer gold is locked in sulphide which is recovered by leaching |
| Mean: 51% |
| RSV: 71% |
| Leach | Data range: 61% |
| Mean: 35% |
| RSV: 64% |
| Gold grade | Grade | Data range: 158.7 g/t Au | Variability of gold grade across the deposit. RSV for population lower than previous half core sampling by fire assay (360%) |
| Mean: 3.3 g/t Au |
| RSV: 120% |
Table 6.
Summary of geometallurgical drilling programme QAQC programme results.
Table 6.
Summary of geometallurgical drilling programme QAQC programme results.
| Action/Activity | Responsibility | Performance Expectation | Actual Performance |
|---|
| Core logging and sampling | Project | Compliance to core logging protocol. Nominal expectation of 95% compliance | Minor logging issues noted during peer review, which were corrected prior to sampling |
| Core verification |
| Sample security | Project | Must occur for all core/each and every sample | No security breaches. No seals broken or samples lost |
| Pulp duplicates | Laboratory | Duplicate sample grade within 90% ± 5% HARD | 91% ± 10% HARD |
| Certified reference material (CRM) | Project | 2δ–3δ (“warning”) | 92% within 2δ; 5% within 2δ–3δ; 3% above 3δ |
| >3δ (“action”) | Relative bias within ±9% |
| Standards (In-house) | Laboratory | 90% of samples to be within ±20% of expected grade (e.g., >80% recovery) | 93% within ±20% |
| Blanks | Project—sample blanks | Blank assay <0.1 g/t Au | 98% <0.1 g/t Au |
| Laboratory—Leach blanks | 2% 0.1-0.3 g/t Au |
| Barren flushes of Knelson unit | Laboratory | Less than 1% gold loss in blank assay compared to sample head grade | 100% <1% gold loss |
| Umpire | Laboratory | Duplicate sample grade within 90% ± 10% HARD | 95% ± 10% HARD |
| Laboratory audit | Project | Full compliance across procedures | A number of minor issues were noted. None deemed material. All matters corrected |
Table 7.
Risk review of geometallurgical drilling programme sampling, testwork and assay, after [
8].
Table 7.
Risk review of geometallurgical drilling programme sampling, testwork and assay, after [
8].
| Key Parameter | Comment | Dominant TOS Error | Risk Rating |
|---|
| 1 | Spatial distribution and number of samples | 20 m by 20 m (locally to 10 m by 10 m) drilling grid yielding 436 variability composites | - | Low |
| 2 | Sample mass | Multiple 17 kg 2-m whole-core samples | - | Low |
| Composite mass across the SVZ ranges between 85 kg to 120 kg dependent upon SVZ width and core intersection angle |
| 3 | Degree of domaining | Domains sampled across FW, CZ and HW | - | Low |
| 4 | Collection and handling | All samples collected according to protocols written to comply with TOS | - | Low |
| All samples sealed prior to transportation |
| 5 | Transport and security | Chain of custody procedures in place | - | Low |
| All samples secured into locked container for transportation |
| 6 | Preparation | Full sample crushed and pulverised | - | Low |
| All equipment cleaned between samples |
| 7 | Testwork (incl. QAQC) | Full sample through Knelson concentrator | - | Low |
| Compliant QAQC (Table 6), with documentation across sample collection, preparation and testwork |
| Rigorous cleaning of laboratory equipment |
| Accredited laboratory |
| 8 | Assay (incl. QAQC) | Compliant QAQC (Table 6), with full documentation across sample collection, preparation and assaying | - | Low |
| Rigorous cleaning of laboratory equipment |
| Accredited laboratory |
| 9 | Validation | Geometallurgical drilling programme resource estimate validated by bulk sampling programme, including 5 t composite and five 5 t pilot samples, followed by 1330 t trial process lot | - | Low |
| Sample representivity (1)–(5) | Low |
| Testwork quality (6)–(8) | Low |
| Fit-for-purpose rating (1)–(9) | Low |
Table 8.
Summary of bulk sampling programme stages and tonnes treated from the SVZ.
Table 8.
Summary of bulk sampling programme stages and tonnes treated from the SVZ.
| Bulk Sampling Stage | Activity | Total Mass Treated |
|---|
| I | Fifty 100 kg sub-samples split from lot of 855 t for laboratory testing | 5 t |
| II | Five 5 t sub-samples split from lot of 850 t for laboratory pilot testing | 25 t |
| III | Thirteen batches for trial plant processing | 1262 t |
Table 9.
Development tonnes (t) mined across cross-cut and SVZ mineralisation domain.
Table 9.
Development tonnes (t) mined across cross-cut and SVZ mineralisation domain.
| Domain | XC.0 | XC.1 | XC.2 | XC.3 | Total |
|---|
| FW | 114 | 110 | 117 | 115 | 456 |
| CZ | 95 | 97 | 93 | 94 | 379 |
| HW | 72 | 76 | 75 | 72 | 295 |
| Total | 281 | 283 | 285 | 281 | 1330 |
Table 10.
Plant head grades (g/t Au) for SVZ mineralisation domains across development.
Table 10.
Plant head grades (g/t Au) for SVZ mineralisation domains across development.
| Domain | XC.0 | XC.1 | XC.2 | XC.3 | Mean |
|---|
| FW | 5.0 | 3.5 | 5.6 | 3.1 | 4.3 |
| CZ | 26.1 | 16.5 | 19.3 | 13.7 | 18.9 |
| HW | 4.2 | 6.5 | 5.6 | 5.3 | 5.4 |
| FW + HW | Tonnage weighted grade | 4.7 |
| All | Tonnage weighted grade | 9.5 |
Table 11.
Gold recovery by SVZ mineralisation domain.
Table 11.
Gold recovery by SVZ mineralisation domain.
| Domain | Head Grade (g/t Au) | GRG (%) | Leach (%) | Total Recovery (%) |
|---|
| FW | 4.3 | 27 | 63 | 90 |
| CZ | 18.9 | 66 | 28 | 94 |
| HW | 5.4 | 31 | 61 | 92 |
| All | 9.5 | 45 | 47 | 92 |
Table 12.
Summary of bulk sampling programme QAQC.
Table 12.
Summary of bulk sampling programme QAQC.
| Bulk Sampling Stage | Testwork Scale | QA Activities | Insertion Rate | QC Metrics |
|---|
| I | Bench: 50 × 100 kg | Equipment cleaning via barren flushes (20 kg) | Between all | - |
| Blank sample processing (25 kg) | 1 in 5 | Blanks <0.1 g/t Au |
| All subsequent laboratory assay apply standard QA including blanks, CRMs and pulp duplicates (where possible) | Generally 1 in 10 | Standard expectation (see Table 3) |
| II | Pilot: 5 × 5 t | Equipment cleaning via barren flushes (500 kg) | Between all | - |
| Blank sample processing (1.5 t) | 3 processed | Blanks <0.1 g/t Au |
| All subsequent laboratory assay apply standard QA including blanks, CRMs and pulp duplicates (where possible) | Generally 1 in 10 | Standard expectation (see Table 3) |
| III | Plant: 13 × 72–117 t batches | Equipment cleaning via barren flushes (500 kg) | Between all | - |
| Blank sample processing (5 t) | 10 processed | Blanks <0.1 g/t Au |
| All subsequent laboratory assay apply standard QA including blanks, CRMs and pulp duplicates (where possible) | Generally 1 in 10 | Standard expectation (see Table 3) |
Table 13.
Percentage gold particle distribution (by mass) for SVZ mineralisation domains.
Table 13.
Percentage gold particle distribution (by mass) for SVZ mineralisation domains.
| Domain | −50 µm | 50–100 µm | 100–500 µm | 500–1000 µm | 1000–2000 µm | 2000–3000 µm |
|---|
| FW | 56 | 20 | 15 | 8 | 1 | 0 |
| CZ | 32 | 26 | 24 | 11 | 6 | 1 |
| HW | 53 | 22 | 13 | 7 | 5 | 0 |
Table 14.
Sampling characteristics by SVZ mineralisation domain based on bulk sample processing.
Table 14.
Sampling characteristics by SVZ mineralisation domain based on bulk sample processing.
| Domain | Grade (g/t Au) | Percent > 100 µm | d95Au (µm) | K (g/cm1.5) | Max. Particle Size (µm) | Opt. Sample Mass (kg) |
|---|
| FW | 4.3 | 24 | 800 | 12,700 | 1000 | 185 |
| HW | 5.4 | 25 | 950 | 13,000 | 1300 | 245 |
| CZ | 18.9 | 42 | 1300 | 5900 | 2000 | 180 |
| All | 9.5 | 32 | 1000 | 8000 | 2000 | 160 |
Table 15.
Estimated tonnages and grade versus achieved values for bulk sampling programme across the SVZ. Bulk sample location and details given in
Figure 2.
Table 15.
Estimated tonnages and grade versus achieved values for bulk sampling programme across the SVZ. Bulk sample location and details given in
Figure 2.
| Estimate | Estimation Type | Estimation Block Size 4 | Input Data | Tonnes (t) | Grade (g/t Au) | % Difference |
|---|
| Development horizon 1 | CS | 4 × 4 × 2 m | All drilling (to 10 m by 10 m) | 6750 | 8.8 | −7 |
| Mined development (XC.0–3) 2 | CS | 4 × 4 × 2 m | All drilling (to 10 m by 10 m) | 1330 5 | 10.6 | +11 |
| Development horizon 1 | OK | 12 × 12 × 2 m | Geometallurgical programme drilling (20 m by 20 m) | 6750 | 7.1 | −25 |
| Development horizon 1 | OK | 15 × 15 × 2 m | Pre-geometallurgical drilling programme (30–40 m by 30–40 m) | 6750 | 6.4 | −33 |
| Actual plant 3 | All of bulk sample | 1300 t 6 | 9.5 | - |
Table 16.
Estimated gold recovery and achieved values in the SVZ.
Table 16.
Estimated gold recovery and achieved values in the SVZ.
| Estimate | Tonnes (t) | Grade (g/t Au) | Est. GRG Recovery (%) | Est. Leach Recovery (%) | Est. Total Recovery (%) |
|---|
| Development horizon | 6750 | 8.8 | 49 | 41 | 90 |
| Mined development (XC.0–3) | 1330 | 10.6 | 52 | 42 | 94 |
| Actual plant | 1300 | 9.5 | 45 | 47 | 92 |
Table 17.
Grade and gold recovery values for bulk sampling programme Phases I to II compared to development estimate.
Table 17.
Grade and gold recovery values for bulk sampling programme Phases I to II compared to development estimate.
| Pilot Stage | Tonnage | Grade (g/t Au) | Grade RSV (%) | GRG (%) | Leach (%) | Total Recovery (%) |
|---|
| I | 50 × 100 kg (5 t) | 6.2 | 85 | 37 | 42 | 79 |
| II | 5 × 5 t (25 t) | 8.2 | 49 | 48 | 42 | 90 |
| III (plant) | 1300 t | 9.5 | - | 45 | 47 | 92 |
| CS estimate | 1330 t | 10.6 | - | 52 | 42 | 94 |
Table 18.
Summary of sample type and mass, and FSE and RSV for different stages of SVZ evaluation.
Table 18.
Summary of sample type and mass, and FSE and RSV for different stages of SVZ evaluation.
| Project Stage | Sample | Individual Sample Mass | Total Field Sample Mass | Number of Assays or Tests | Assay/Test Mass | Total Assay/Test Mass | FSE (%) | RSV (%) |
|---|
| Orig. drilling (pre-geomet) | 1 m half HQ | 3.7 kg | 1.55 t | 412 | 30 g | 12.4 kg | ±54 | 360 |
| OCS | Saw-cut channels | 240 kg | 720 kg | 3 | 120 kg | 360 kg | ±14 | 105 4 |
| PFS | Saw-cut 2 m channels | 17 kg | 1.02 t | 60 | 16 kg | 960 kg | 0 3 | 145 |
| PFS | Chip 2 m channels | 5 kg | 300 kg | 60 | 5 kg | 300 kg | 0 3 | 296 |
| Geomet drilling | 2 m full HQ | 17 kg | 5.8 t | 436 | 16.5 kg | 7.2 t | ±3 | 120 |
| PFS: BS-I | Bulk lot | 100 kg | 855 t | 50 | 100 kg | 5 t | ±31 1 | 85 |
| ±4 2 |
| PFS: BS-II | Bulk lot | 5 t | 850 t | 5 | 5 t | 25 t | ±5 1 | 49 4 |
| ±2 2 |
| PFS: BS-III | Bulk: FW | 115 t | 450 t | 4 | 115 t | 450 t | 0 3 | 31 4 |
| PFS: BS-III | Bulk: CZ | 142 t | 555 t | 6 | 142 t | 555 t | 0 3 | 27 4 |
| PFS: BS-III | Bulk: mHW | 76 t | 295 t | 4 | 76 t | 295 t | 0 3 | 25 4 |
| PFS: Plant | Bulk: Dev XC.0–3 | 285 t | 285 t | 4 | 285 t | 1330 t | 0 3 | 17 4 |
Table 19.
Summary of sample type and support with FSE, RSV and nugget effect. All data from the SVZ.
Table 19.
Summary of sample type and support with FSE, RSV and nugget effect. All data from the SVZ.
| Project Stage | Sample Type | Assay Protocol | Support (kg/m) | FSE (%) | RSV (%) | Nugget Effect (%) |
|---|
| Geomet drilling | 2 m full HQ | Geomet protocol 3 | 8.5 | ±6 1 | 120 | 53 |
| PFS | Saw-cut 2 m channels | Geomet protocol 3 | 8.0 | 0 2 | 145 | 59 |
| Orig. drilling (pre-geomet) | 1 m half HQ | Fire assay | 3.7 | ±54 | 360 | 87 |
| (Comp. to 2 m) | (7.4) | (±45) | (277) | (71) |
Table 20.
Comparison between estimates and actual reconciled trial stope head grade and tonnage.
Table 20.
Comparison between estimates and actual reconciled trial stope head grade and tonnage.
| Estimate Type | Input | No. Samples in Panel | Tonnes (t) (Diluted) | Grade (g/t Au) (Diluted) | % Difference to Actual |
|---|
| Ordinary kriging | 20 m by 20 m geomet drilling | 6 | 2200 | 17.6 | −14 |
| Ordinary kriging | 10 m by 10 m geomet infill drilling | 11 | 2200 | 22.6 | +10 |
| Mean | 2 m by 2 m stope channel samples | 85 1 | 2140 | 31.6 (uncut) | +54 |
| 22.9 (cut) | +12 |
| Mean | Plant head samples | 250 | 500 kg | 27.8 (uncut) | +36 |
| 24.2 (cut) | +18 |
| Actual trial stope | Process plant | - | 1815 | 20.5 | - |
Table 21.
Percentage gold particle distribution (by mass) for 20.5 g/t Au HGZ mineralisation.
Table 21.
Percentage gold particle distribution (by mass) for 20.5 g/t Au HGZ mineralisation.
| −50 µm (Est.) | 50–100 µm | 100–500 µm | 500–1000 µm | 1000–2000 µm | 2000–3000 µm | d95Au (µm) | Max. Particle Size (µm) | Ms Opt. (kg) |
|---|
| 29% | 18% | 29% | 13% | 9% | 2% | 1700 | 2500 | 200 |
Table 22.
Analysis of duplicate sampling data.
Table 22.
Analysis of duplicate sampling data.
| Type | Description | Number | Error Type | Split FSE at ROM Grade | Component Relative Error |
|---|
| Field | Channel samples 2 × 8 kg collected next to each other | 20 | Sampling | - | ±51% |
| Coarse | 2 × 4 kg taken after crushing to 1.5 mm | 20 | Preparation | ±22% | ±18% |
| GRG concentrate (pulp) | 2 × split of concentrate for 30 g fire assay | 30 | Analytical | <±5% | ±4% |
| Tailings (pulp) | 2 × 4 kg taken after pulverising to −100 µm for LeachWELL | 30 | Analytical | ±1% | ±7% |
| Total | ±55% |
Table 23.
Summary of half year production reconciliation of selective mining the HGZ.
Table 23.
Summary of half year production reconciliation of selective mining the HGZ.
| Estimate/Actual Mined | Reserve Physicals | | Monthly Variability Range Across Period |
|---|
| Tonnes (t) | Grade (g/t Au) | Contained Ounces (Au) | Recovered Ounces (Au) | Tonnes (t) | Grade (g/t Au) | Ounces (Au) |
|---|
| Estimate (plan) | 32,500 | 23.7 | 24,770 | 16,595 (Rec: 67%) | - | - | - |
| Actual | 33,150 | 23.0 | 24,520 | 18,145 (Rec: 74%) | ±5% | −20% to +18% | −18% to +24% |
| Actual/estimate (%) | 102% | 97% | 99% | 109% | ±5% | ±20% | ±25% |
Table 24.
Summary of sample processing locations, activity and turn-around times.
Table 24.
Summary of sample processing locations, activity and turn-around times.
| Sample Type | On-Site Activity | Off-Site Activity | Timing |
|---|
| Geomet core (Figure 5) | Dry, crush, pulverise, Knelson GRG, concentrate cleaning and fire assay | Comminution tests, all geochemistry and mineralogy, flotation testing and LeachWELL tails | Head grade within 5 days |
| All results within 21 days |
| Ore control (Figure 9) | Dry, crush, pulverise, Knelson GRG, concentrate cleaning and fire assay, and LeachWELL tails | Sulphur, lead and zinc analysis | Preliminary grade from GRG concentrate weight within 2–3 h |
| Second preliminary grade from GRG concentrate fire assay within 3–5 h |
| Head grade within 9 h |
| Sulphur and base metal assays within 3 days |
| Plant tailings | Hourly composites dry and pulverise | Sulphur, lead and zinc analysis | All assays within 24 h |
| LeachWELL assay |
Table 25.
Geometallurgical programme block model inputs and outputs.
Table 25.
Geometallurgical programme block model inputs and outputs.
| Data Input (Units) | Primary Model | Secondary Model |
|---|
| Grade (g/t Au) | Grade | GRG recovery |
| GRG recovery (%) | GRG recovered grade |
| Sulphur (%) | Sulphur | Sulphide Density |
| Iron (%) | Iron |
| Lead (%) | Lead |
| Zinc (%) | Zinc |
| Density (t/m3) | Density | - |
| EQUOtip | Hardness | Throughput |
| Rock quality designation | Rock quality designation |
Table 26.
Example of stope panel data at the ore control model stage and post-mining reconciliation.
Table 26.
Example of stope panel data at the ore control model stage and post-mining reconciliation.
| Parameter | Panel Estimate | Range | Reconciled Actual |
|---|
| Tonnage | 7360 t | - | 7655 t |
| Width | 2.25 m | 2.00–2.45 g/t Au | 2.30 m |
| Grade | 22.7 g/t Au | 19.9–26.3 g/t Au | 24.6 g/t Au |
| GRG recovery | 70% | 95–75% | 76% |
| Sulphide | 4% | 2–6% | 5% |
| Density | 2.97 t/m3 | 2.85–3.20 t/m3 | 3.10 t/m3 |
| Hardness | Hard | Hard-very hard | Hard |
| RQD | Excellent | Good-excellent | Good-excellent |
Table 27.
Comparison between bulk-mine ore zone and selective narrow-vein ore zone.
Table 27.
Comparison between bulk-mine ore zone and selective narrow-vein ore zone.
| Mining Scenario/Ore Type | Minable Width (m) | Grade (g/t Au) | Core RSV (Nugget Effect) | % >100 µm | d95Au (µm) | K (g/cm1.5) | Ms Opt. (kg) | Ms Opt. Per m (kg/m) | GRG (%) | Gold Deportment |
|---|
| Bulk stoping | 10–15 | 6–10 | 120% | 30 | 650 | 5300 | 70 | 5–7 | 30–40 | Free gold, finer gold within pyrite |
| FW, CZ and HW | (53%) | Coarse gold, with more fine gold |
| Narrow vein stoping | 2–3 | 20–24 | 138% | 55 | 1700 | 6600 | 200 | 67–100 | 60–75 | Free gold |
| HGZ | (66%) | Coarse gold, with less fine gold |
Table 28.
Vein paragenetic sequence within the SVZ and mineralogical and metallurgical characteristics.
Table 28.
Vein paragenetic sequence within the SVZ and mineralogical and metallurgical characteristics.
| Type/Paragenetic Sequence | Occurrence in SVZ Domain | Structure Type | Width | Mineralogy | Gold Type/Host | Gold Particle Size | Metallurgy |
|---|
| Wall rocks | FW, CZ and HW | Wallrock alteration within SVZ | 8–11 m (excluding veins) | Disseminated pyrite (0–5% py) | Free gold | Fine gold, <150 µm | Leach |
| Pyrite |
| SV-I (early) | FW, CZ and HW | Steep-dipping sheeted veins | <1–5 cm | Pyrite, trace galena, sphalerite and chalcopyrite (0–5% py) | Free gold | Some coarse, up to 0.25 mm | GRG (up to 30%) +leach |
| Pyrite |
| SV-II | Principally CZ | Steep-dipping sheeted veins. Different strike (±5–10°) to SV-I; crosscut SV-I | <1–10 cm | Pyrite, trace galena, sphalerite and chalcopyrite (0–5% py) | Free gold | Some coarse, up to 0.5 mm | GRG (up to 30%) + leach |
| Pyrite |
| CV | HGZ | Steep-dipping composite veins, crosscut SV-I and -II | 10–35 cm | Pyrite, trace galena and sphalerite (0–10% py) | Free gold | Coarse up to 2.5 mm | GRG (up to 80%) |
| Quartz |
| Pyrite |
| LV (late) | Principally cuts CZ | Flat-dipping veins. Cut all SV | 0.25–1 m | Sulphide-rich; pyrite (25–100% py) | Free gold | Minor coarse <0.2 mm | Leach |
| Pyrite |


