Article

Mid-Infrared Spectroscopic Assessment of Plasticity Characteristics of Clay Soils

1
Department of Physics, Rostov State Transport University, Narodnogo Opolcheniya Sq., Rostov-on-Don 344038, Russia
2
UMR 6087 Laboratoire PEC, Université du Maine, F-72000 Le Mans, France
*
Author to whom correspondence should be addressed.
Minerals 2018, 8(5), 184; https://doi.org/10.3390/min8050184
Submission received: 3 March 2018 / Revised: 5 April 2018 / Accepted: 25 April 2018 / Published: 28 April 2018

Abstract

:
This work presents a method to determine the plasticity of clay soils using Fourier transform mid-infrared (FT-MIR) spectroscopy. Samples of mono- and polymineral soils of varying water contents are studied. The FT-MIR results are compared with the results obtained from standard Russian and international methods for the plasticity range. The correlation between the consistency of clay soils, when displaying their plastic properties, and the position of the Si–O stretching band in the FT-MIR spectra is established. The possibility of, and interest in, determining the plasticity characteristics of clay soils using mid-infrared spectroscopy is demonstrated: it yields effectively higher precision results compared to standard test methods. It is shown that the method of IR spectroscopy allows the fixing of the start and the completion of the series of “phase transitions” of the soil in the plastic and liquid state. The significant effect of the concentration of non-clay minerals on the Si–O ν line is that a moisture content curve is noticed, which may help to predict the clay content of the soil without undertaking XRD analysis.

1. Introduction

Plasticity is one of the key indicators most widely used in the classification of clay soils and in determining their properties [1]. This characteristic largely determines many technological processes of constructing geotechnical structures as well as the manufacture of ceramic products [2].
In engineering and geological studies, it is a common practice to use as plasticity indicators the values of water content that correspond to the transition of soils from the solid state to the plastic state (plastic limit—PL) and from the plastic state to the liquid state (liquid limit—LL). The interval of moisture content between the plastic and liquid limits gives the plasticity index (PI), which is used as an indicator in soil classification. The plasticity characteristics are used to analyze the engineering and geological conditions of the construction site with conclusions about the suitability of soils composing the compressible thickness at the base of the foundations. The plastic and liquid-plastic states of the soil make it unsuitable for construction purposes. If the total moisture capacity of the soil exceeds its moisture content at the yield point, this indicates that the soil is not suitable for construction purposes with potential flooding of the area [1]. Plasticity enables the possibility of molding for various ceramic materials and products. In particular, for the production of building ceramic products, moderately plastic clays are usually used. Low-plastic clays are poorly formed, and clays crack during drying and require the use of lean additives [2].
The methods for the determination of plasticity characteristics of soils are regulated in the Russian Federation by the state standard GOST 5180 [3]. According to this standard, the moisture at the liquid limit (WL) corresponds to the condition that the respective soil paste allows dipping for a balance cone of a certain size and mass. In the international standard ISO/TS 17892-12 [4], the cone is also used, but it has different parameters and dipping depths; the standard ASTM D-4318 [5] uses the Casagrande apparatus and associated routine. The latter method is based on the determination of the correlation between the moisture of a soil sample and the number of concussions required of a cup with the soil paste against the brass base to the lengthwise v-shaped cut made in the soil paste. The amounts of fractions for analysis are also different for different methods. As for the measurements of the lower plastic limit, under current standards, they are performed with identical procedures; by the Russian state standard GOST 5180 [3], the value of the moisture at the plastic limit (WP) is determined as the water content at which the soil paste, being rolled into a cylinder, loses its connectedness and falls into separate fragments of certain size. The difference in the methods for measuring the WP and PL values is only in the amount of the analyzed fraction and in the admission of using a special device to roll the soil paste into a cylinder.
The existing routines for evaluating soil plasticity described above are based on traditional methods (GOST 5180 [3], ISO/TS 17892-12 [4], ASTM D-4318 [5]) and are labor-intensive. They are also characterized by low reliability of the results obtained, and are not always objective due to the changeability of soils and the ambiguity of procedures. For example, the disadvantage of the standard methods for determining the plastic limit stems from the high labor-intensiveness of manifold manual rolling of analyzed soils into cylinders and the low reliability of the results, since it is impossible to ensure precise control over the measurement of rolled cylinder sizes. Thus, one experimenter’s results might not match exactly that of others. Experimenters may indeed roll the soils with the application of different forces, and this fact highlights the subjective character of the obtained values of PL (or WP). Additionally, the surface and the inner parts of a sample rolled into a cylinder can have different water contents, and this can lead to mistakes in determining the plastic limit. The use of special devices to roll soils into cylinders often gives lower values of the plastic limit as compared to manual rolling. When determining the liquid limit, the reliability of results is significantly influenced by the speed of dipping the balance cone into soil paste. The balance cone falling onto a soil paste sample has an impact-type effect on it, which can increase the resulting value of the liquid limit, especially for clays with high water content at liquid limit. In addition, it is quite difficult to meet the condition of cone dipping (e.g., to the depth of 10 mm for 5 s) as it is prescribed in the procedure. The disadvantage of the method is also the need to choose the moisture of soil, which enables satisfying a prescribed condition of soil transition to liquid state by preparing an uncertain number of samples. A specific feature of the Casagrande method is its labor-intensiveness, the dependence of the results on human factor caused by the impossibility of ensuring equal force and speed when shaking the cup with the soil sample, and the long time needed for measurements, which is also caused by the necessity to prepare an uncertain number of samples until the desired soil consistency meeting the method’s demands is reached.
Besides the standard methods for the determination of clay soil plasticity that are traditionally used in engineering studies, there are also other instrumental methods using different types of rheometers [6,7], penetrometers [8,9,10], as well as methods based on measuring the relation between applied force and the resultant deformation [11,12,13]. These methods are explicitly described and analyzed in recent reviews by Andrade et al. (2011) [7] and Haigh and Vardanega (2014) [14]. These methods are based on a phenomenological concept of the nature of plasticity, and they often give contradictory results. When comparing plasticity constants obtained by different methods for the same clay, one cannot always obtain identical results. Nevertheless, these methods ensure, beside plasticity characteristics, measuring of such important parameters as the elasticity modulus, peak strain, breaking strength, and can also be used for practical purposes keeping in mind the type of the analyzed material (ceramic raw materials, soils etc.) and the objectives of studies.
The principal disadvantage of the currently used methods based on empirical correlations [14,15,16] comes from the fact that the equations for the relationship of PL and LL with certain physical parameters are statistical in character. Consequently, these empirical correlations cannot be extended to clay soils of diverse composition and genesis where the plasticity of clays is considerably dependent on their mineral, chemical and granulometric composition [17,18,19,20,21].
The existing standard methods for the determination of clay soil plasticity have been widely used for a long time. However, in view of the disadvantages mentioned above, they cannot be relied on as the only characterisation tool. It is therefore necessary to develop new precise methods for the objective evaluation of the clay soil plasticity. Such approaches can be developed on the basis of modern advanced physical methods to study the structural characteristics of clay soil materials and their phase compositions.
In the studies of the interaction of the clay particles with water molecules, preference should be given to experimental methods which do not require a vacuum environment because this could lead to changes of the initially attributed value of the sample moisture. One such method is Fourier transform infrared spectroscopy (FTIR) in the mid-infrared region (MIR) which analyzes the radiation in the range of 3–50 µm. Note that the penetration depths into a sample run characteristically from 0.1 λ to several λ for such radiation. In contrast, kaolinite particles vary in size from 0.1 to 20 µm [22], and smectite particles vary in size from 0.1 to 2 µm, such that the average particle size is about 0.5 µm [23,24]. Thus the method of infrared (IR) spectroscopy allows investigating the processes in several layers of clay particles. The energy and the intensity of the IR spectrum lines depend on the properties of the atomic groups that form the structure of the clay particles. The variation of these spectral values with changes of the sample moisture can be a measure of the interaction of the absorbed water molecules with the surfaces, and therefore, a measure of the variation of the interaction between the clay particles themselves.
The infrared spectroscopy method in near- and mid-infrared regions has appeared to be an effective, quick and relatively cheap instrument for analyzing and predicting soil properties [25,26]. In particular, numerous studies have revealed that infrared spectroscopy can be applied as a non-destructive method enabling simultaneous assessment of several soil compositional constituents and soil quality attributes. Assessment can be done with acceptable accuracy and within a short period of time [27,28]. There are papers displaying the possibility of applying MIR spectroscopy to predict hydraulic properties [29]. A number of authors have revealed that MIR spectroscopy can hold promise when determining and predicting physical properties of soils that are interrelated with surface area and solid composition such as texture, clay content, specific surface area and air-dry moisture content [30,31]. Minasny et al. (2008) [32] exposed that MIR spectroscopy can predict soil physical and mechanical properties that are characterized by surface and solid composition, such as particle-size distribution. In the same paper, the authors revealed with the help of MIR that physical and mechanical properties can be related back to the fundamental soil properties such as clay content, carbon content, cation exchange capacity and bulk density. Kariuki et al. (2003) [33] discovered a correlation between the asymmetry of spectral absorption features at 1400 and 2200 nm and cation exchange capacity and soil activity (plasticity index/clay content). Waruru et al. (2014) [34] utilized near-infrared spectroscopy together with PLS (partial least squares regression) to rapidly estimate key soil engineering properties, including cation exchange capacity, swelling ability parameter, shrinkage factor and plasticity. Nevertheless, this approach implies a combination of spectroscopy with PLS using a number of calibration libraries.
The most discussable issues formation mechanism and the elaboration of an effective and accurate method of determining plasticity limits for civil engineering. This paper considers the possibility of the application of mid-infrared spectroscopy for revealing the mechanism of plasticity formation and determining the criteria of structural phase transition of soils into solid, plastic and fluid states.
Infrared spectroscopy is a versatile physical-chemical method which is applied for studies of structural features of various organic and inorganic compounds. In particular, this method allows us to investigate the behavior of the Si–O stretching oscillation of tetrahedral layer of the clay minerals crystal lattice as a function of water content. [35]. IR spectroscopy enables us to obtain information on relative positions of molecules within a very short period of time, as well as to evaluate the nature of interactions between them. This issue is of fundamental importance in studies of structural and phase properties of various rock-forming clay minerals. This is the reason for using it in this work.

2. Materials and Methods

2.1. Samples

We studied different soil samples including those of clay minerals of different types. As a monomineral sample (M1), we have chosen one of the most common rock-forming clay minerals—kaolinite (Glukhivtsi deposit, Kozyatyn area of Vinnitska region, Ukraine).
To study the influence of the mineral composition of clay soils on their plasticity characteristics, we studied polymineral clay soils taken from the objects of the North-Caucasian railway track facilities, a branch of the JSC “Russian Railways”: railway embankment at the 56th km of Likhaya-Morozovskaya track section (M2), landslide slope at the 1919th km of Lazarevskaya–Chemitokvadzhe track section (M3—surface deposit soil, M4—main bottom soil), railway embankment at the 1206th km at Kiziterinka station (M5), clay for technical application from Millerovo deposit (M6). The choice of the number of samples and their compositions is conditioned by their wide occurrence in nature and their intensive use in the construction of railway roadbeds in the south of Russia. To clarify the character of the interaction between water and polymineral samples in the process of hydration, we also studied a 1:1 combination of kaolinite and the soil taken from the Millerovo deposit (M7).

2.2. X-ray Diffraction (XRD) Analysis

The mineral composition of the soil samples was determined by X-ray diffraction using the diffractometer Ultima-IV by Rigaku Corporation, Tokyo, Japan (Operator: V.V. Krupskaya, Belov Laboratory of Mineral Cristallochemistry, Institute of Ore Deposits, Petrography, Mineralogy and Geochemistry, Russian Academy of Science). The measurements are carried out under normal conditions in Bragg geometry using Cu Kα radiation, a graphite monochromator, and nickel filter, under the operational mode of 40 kV–40 mA. The non-oriented bulk samples were run in the 3–65° 2θ interval with a step size of 0.02° 2θ and a counting time of 2 s per step. The <2 μm grain-size fractions were separated by settling an aqueous suspension the samples and oriented slides were prepared by the pipette-on-slide method. Oriented samples were analyzed under three different conditions: in air-dry condition, after calcinations at 550 °C, and after saturation with ethylene glycol during 24 h in a desiccator. The saturation with ethylene glycol and heating treatment are employed to identify the minerals of the smectite group in the samples. The use of this technique makes it possible to clearly determine the occurrence of minerals of this group due to their ability to yield intra-crystalline swelling.
Clay minerals are identified from diagnostic hkl reflections of the XRD patterns of oriented samples. Non-clay minerals are identified from diffraction data of a randomly oriented aggregate of the bulk sample using the ICDD PDF-2 database and Jade 6.5 software, MDI, Livermore, CA, USA. Quantitative phase analysis (QXRD) was performed using the method for full-profile processing of XRD patterns from non-oriented samples and RockJock software, U.S. Geological Survey, Reston, VA, USA [36]. The X-ray diffraction intensities extracted from the XRD files using Jade software have been entered into the RockJock program and the mineral composition has been calculated. RockJock determines the quantitative content of the minerals in powdered samples by comparing the integrated reflection intensities of individual minerals with the intensities for pure standard minerals and an internal standard (corundum). Well-crystallized zincite (ZnO—10%) has been used for a corundum. Introduction of an internal standard is a necessary step when studying amorphous and poorly crystallized phases. This method, which is a modification of the Rietveld method [37,38] and RIR method [39,40], has shown good results in quantitative analysis of multicomponent mineral samples and natural combinations [41,42].

2.3. FT-MIR Spectroscopic Analysis

The IR spectroscopic analysis is carried out with an FTIR spectrometer ALPHA, Bruker Corporation, Billerica, MA, USA, using the attenuated total reflectance (ATR) technique. The examined samples are preliminarily crumbled in a porcelain mortar and passed through a 1 mm. The IR spectra are recorded in the middle infrared range, from 500 to 4000 cm−1 using OPUS software, Bruker, Billerica, MA, USA. The natural surface of the samples placed on the ZnSe crystal is studied for a contact area of 19.6 mm2. For each measurement used, three samples were studied independently. The recording mode was characterized by a 2 cm−1 resolution and 25 scans for each spectrum. These recording parameters was chosen as a reasonable compromise, they effectively allowed both the study of the spectra fine structure and the preservation of given water contents in the sample in the course of measurement.
Soil samples of a given desired moisture content were prepared by adding appropriate amounts of water into preliminarily dried samples, followed by mechanical mixing so that soil moisture was distributed uniformly in a hermetic container. To achieve repeatability of the result and to reduce the impact of random errors, a sample of the specified humidity was prepared three times. The procedure for measuring the IR spectra was carried out independently for each prepared sample immediately after placing the sample on the surface of the measuring crystal plate of the spectrometer. Three measurements were taken on each sample. Each portion of the test sample was loaded into the instrument for measurements once. The final result of the measurement was taken as the arithmetic mean of three parallel determinations performed under repeatability conditions.
The relative measurement errors were respectively 2.5% for the intensity of spectral lines and 1.5% for their positions, over the entire range of the wavenumbers.

2.4. Plasticity Measurements

The plasticity characteristics of the analyzed soil samples are determined according to standard procedures described in GOST 5180 [3], ISO/TS 17892-12 [4], and ASTM D-4318 [5].

3. Results

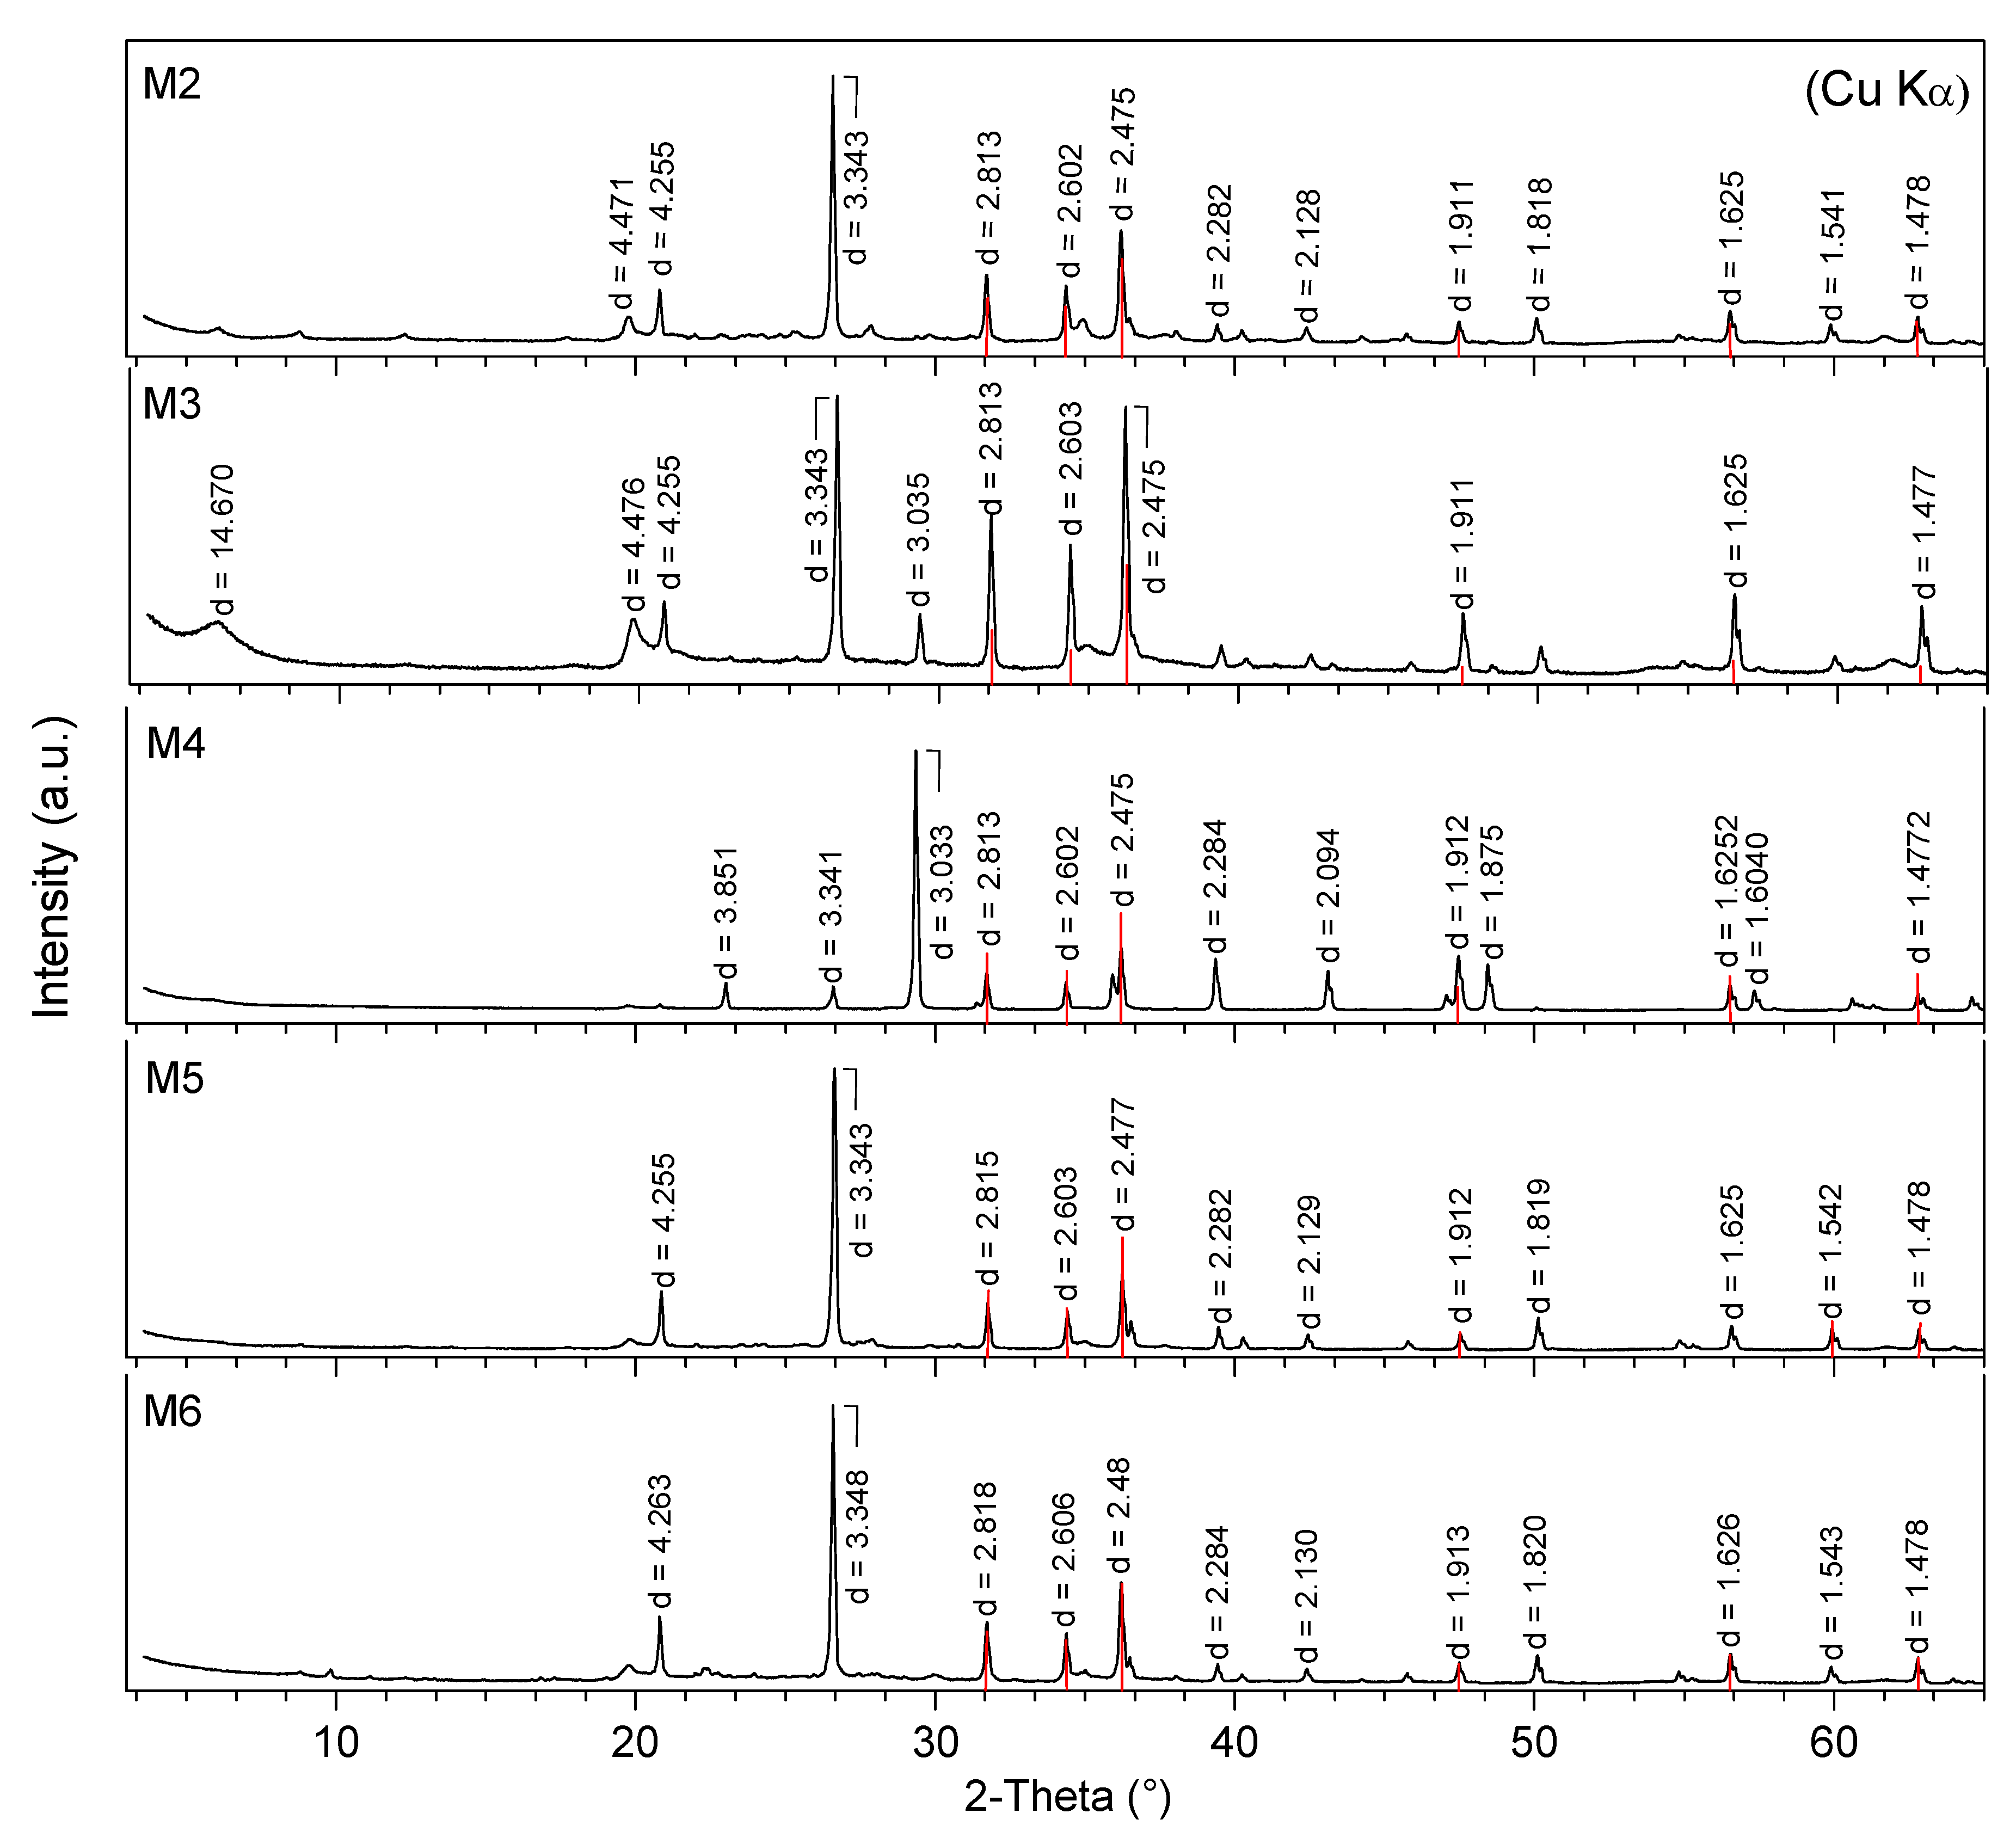
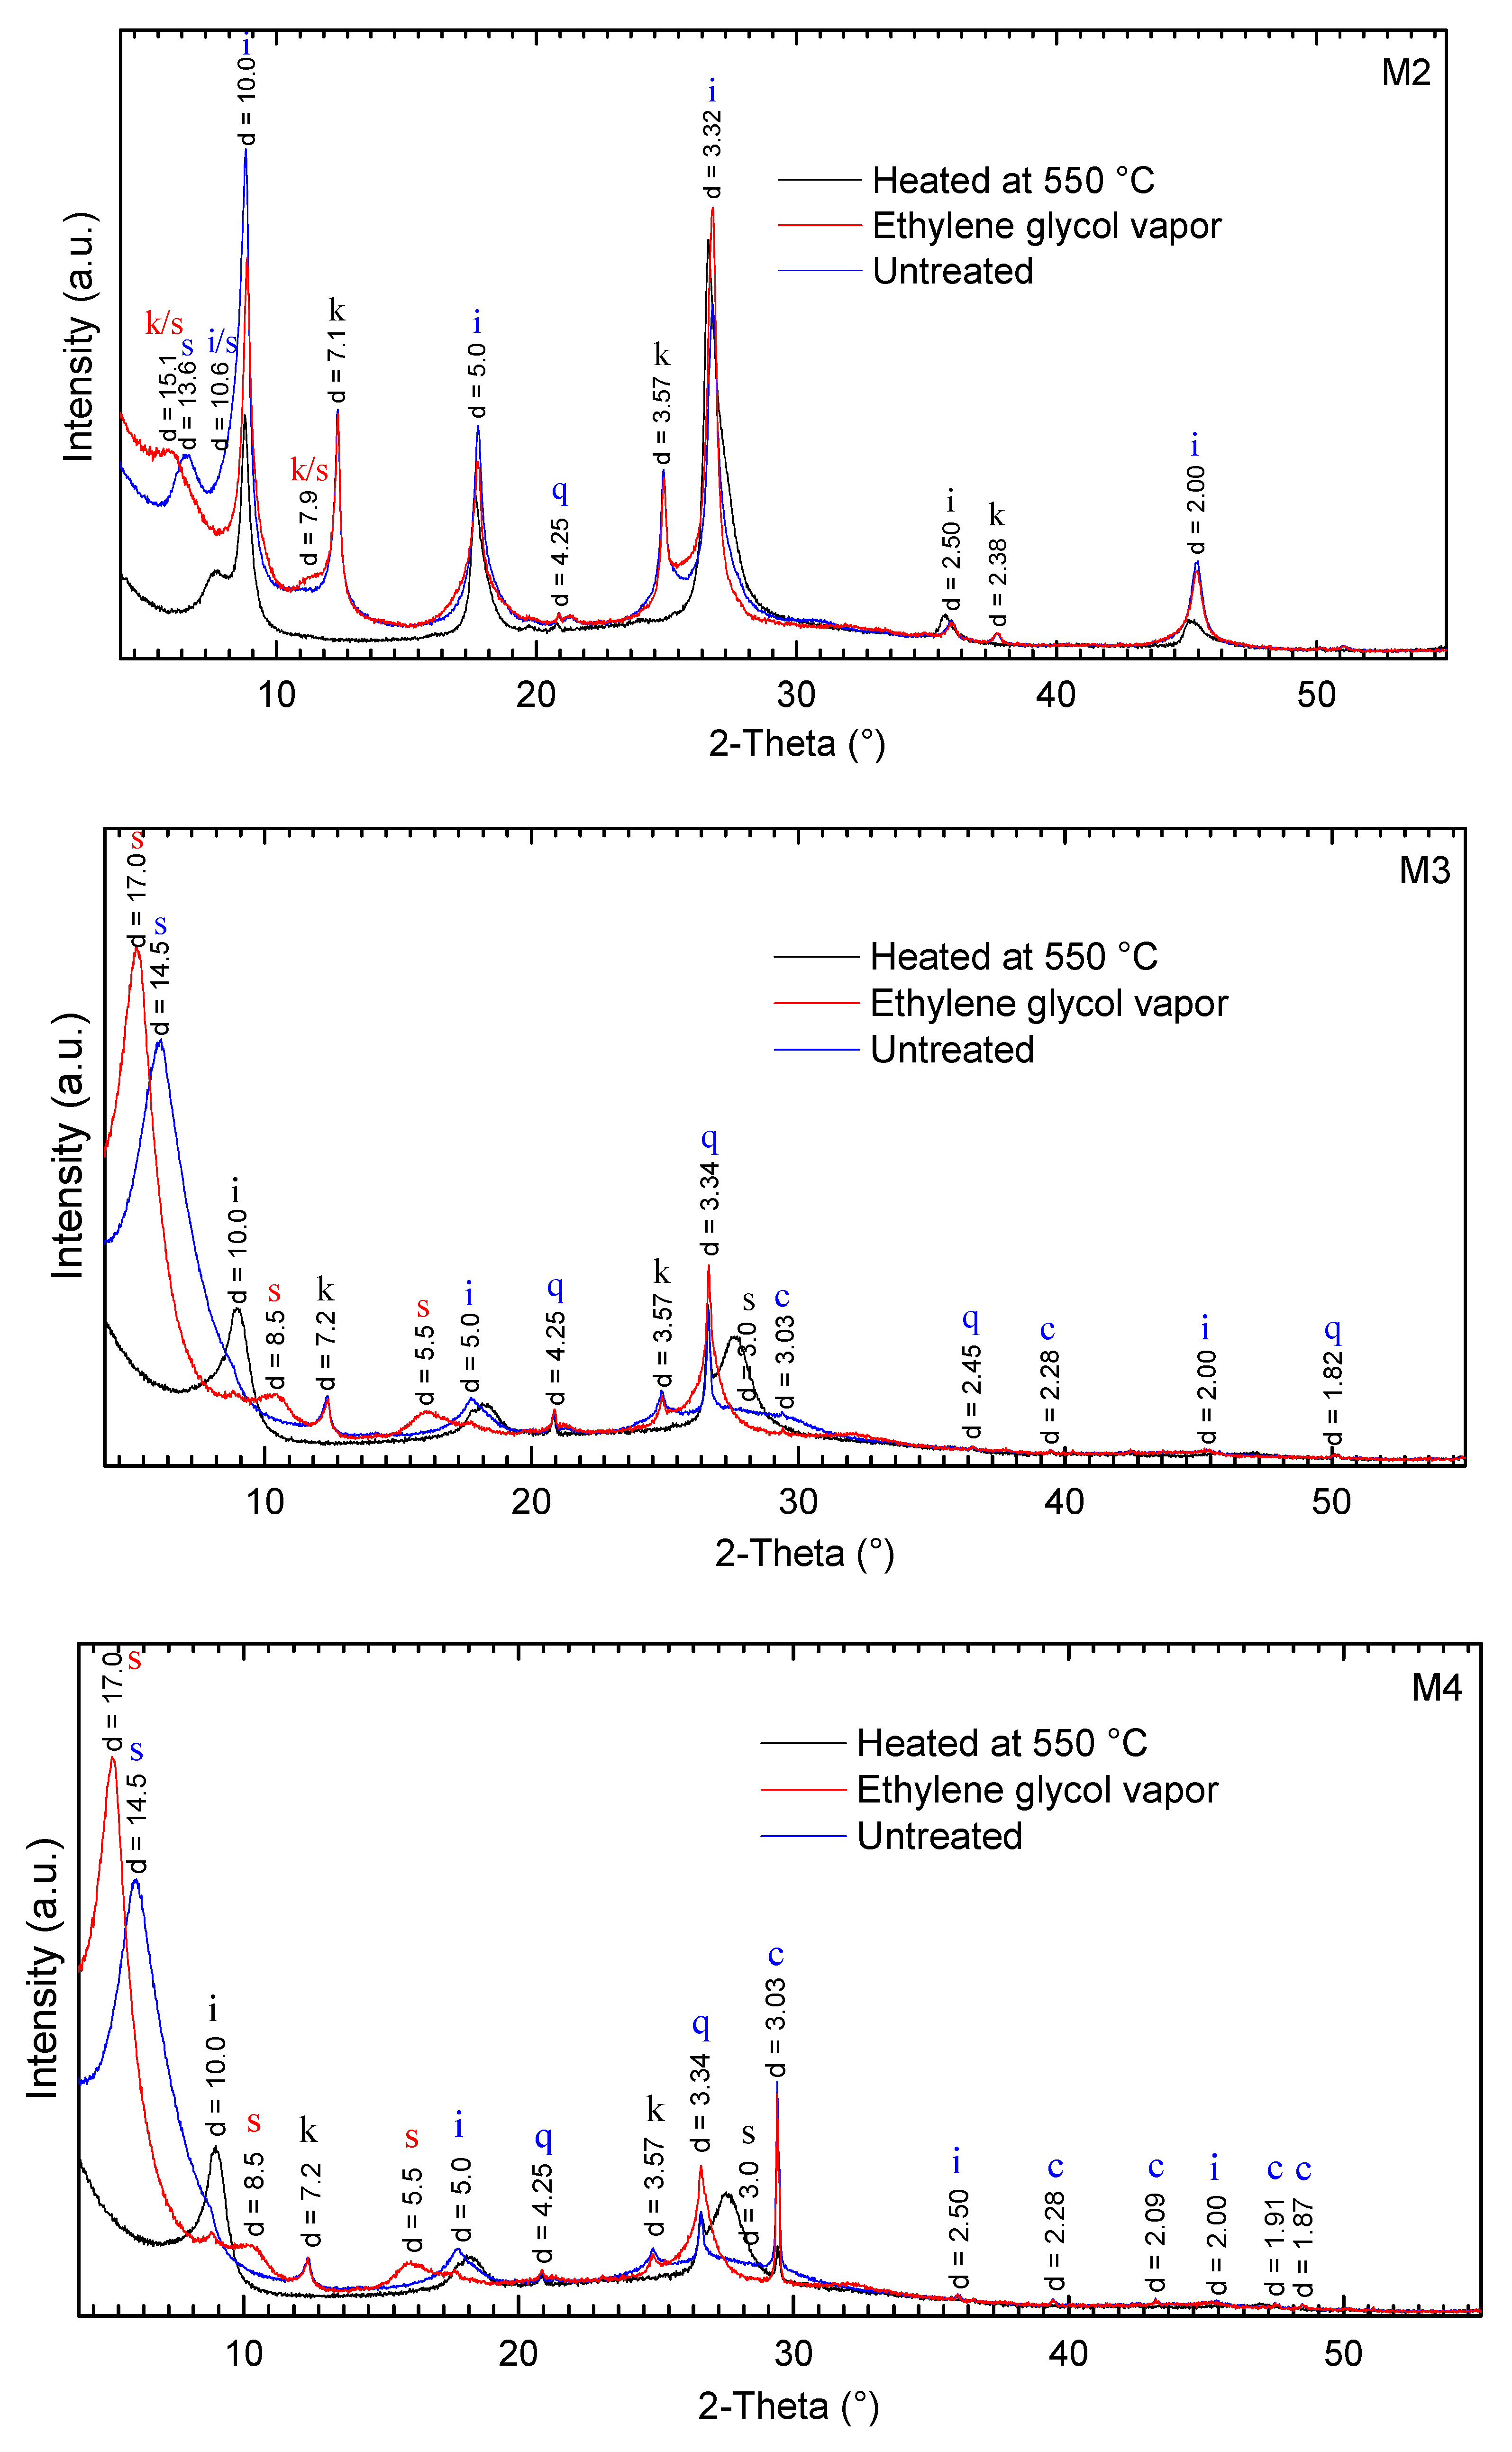
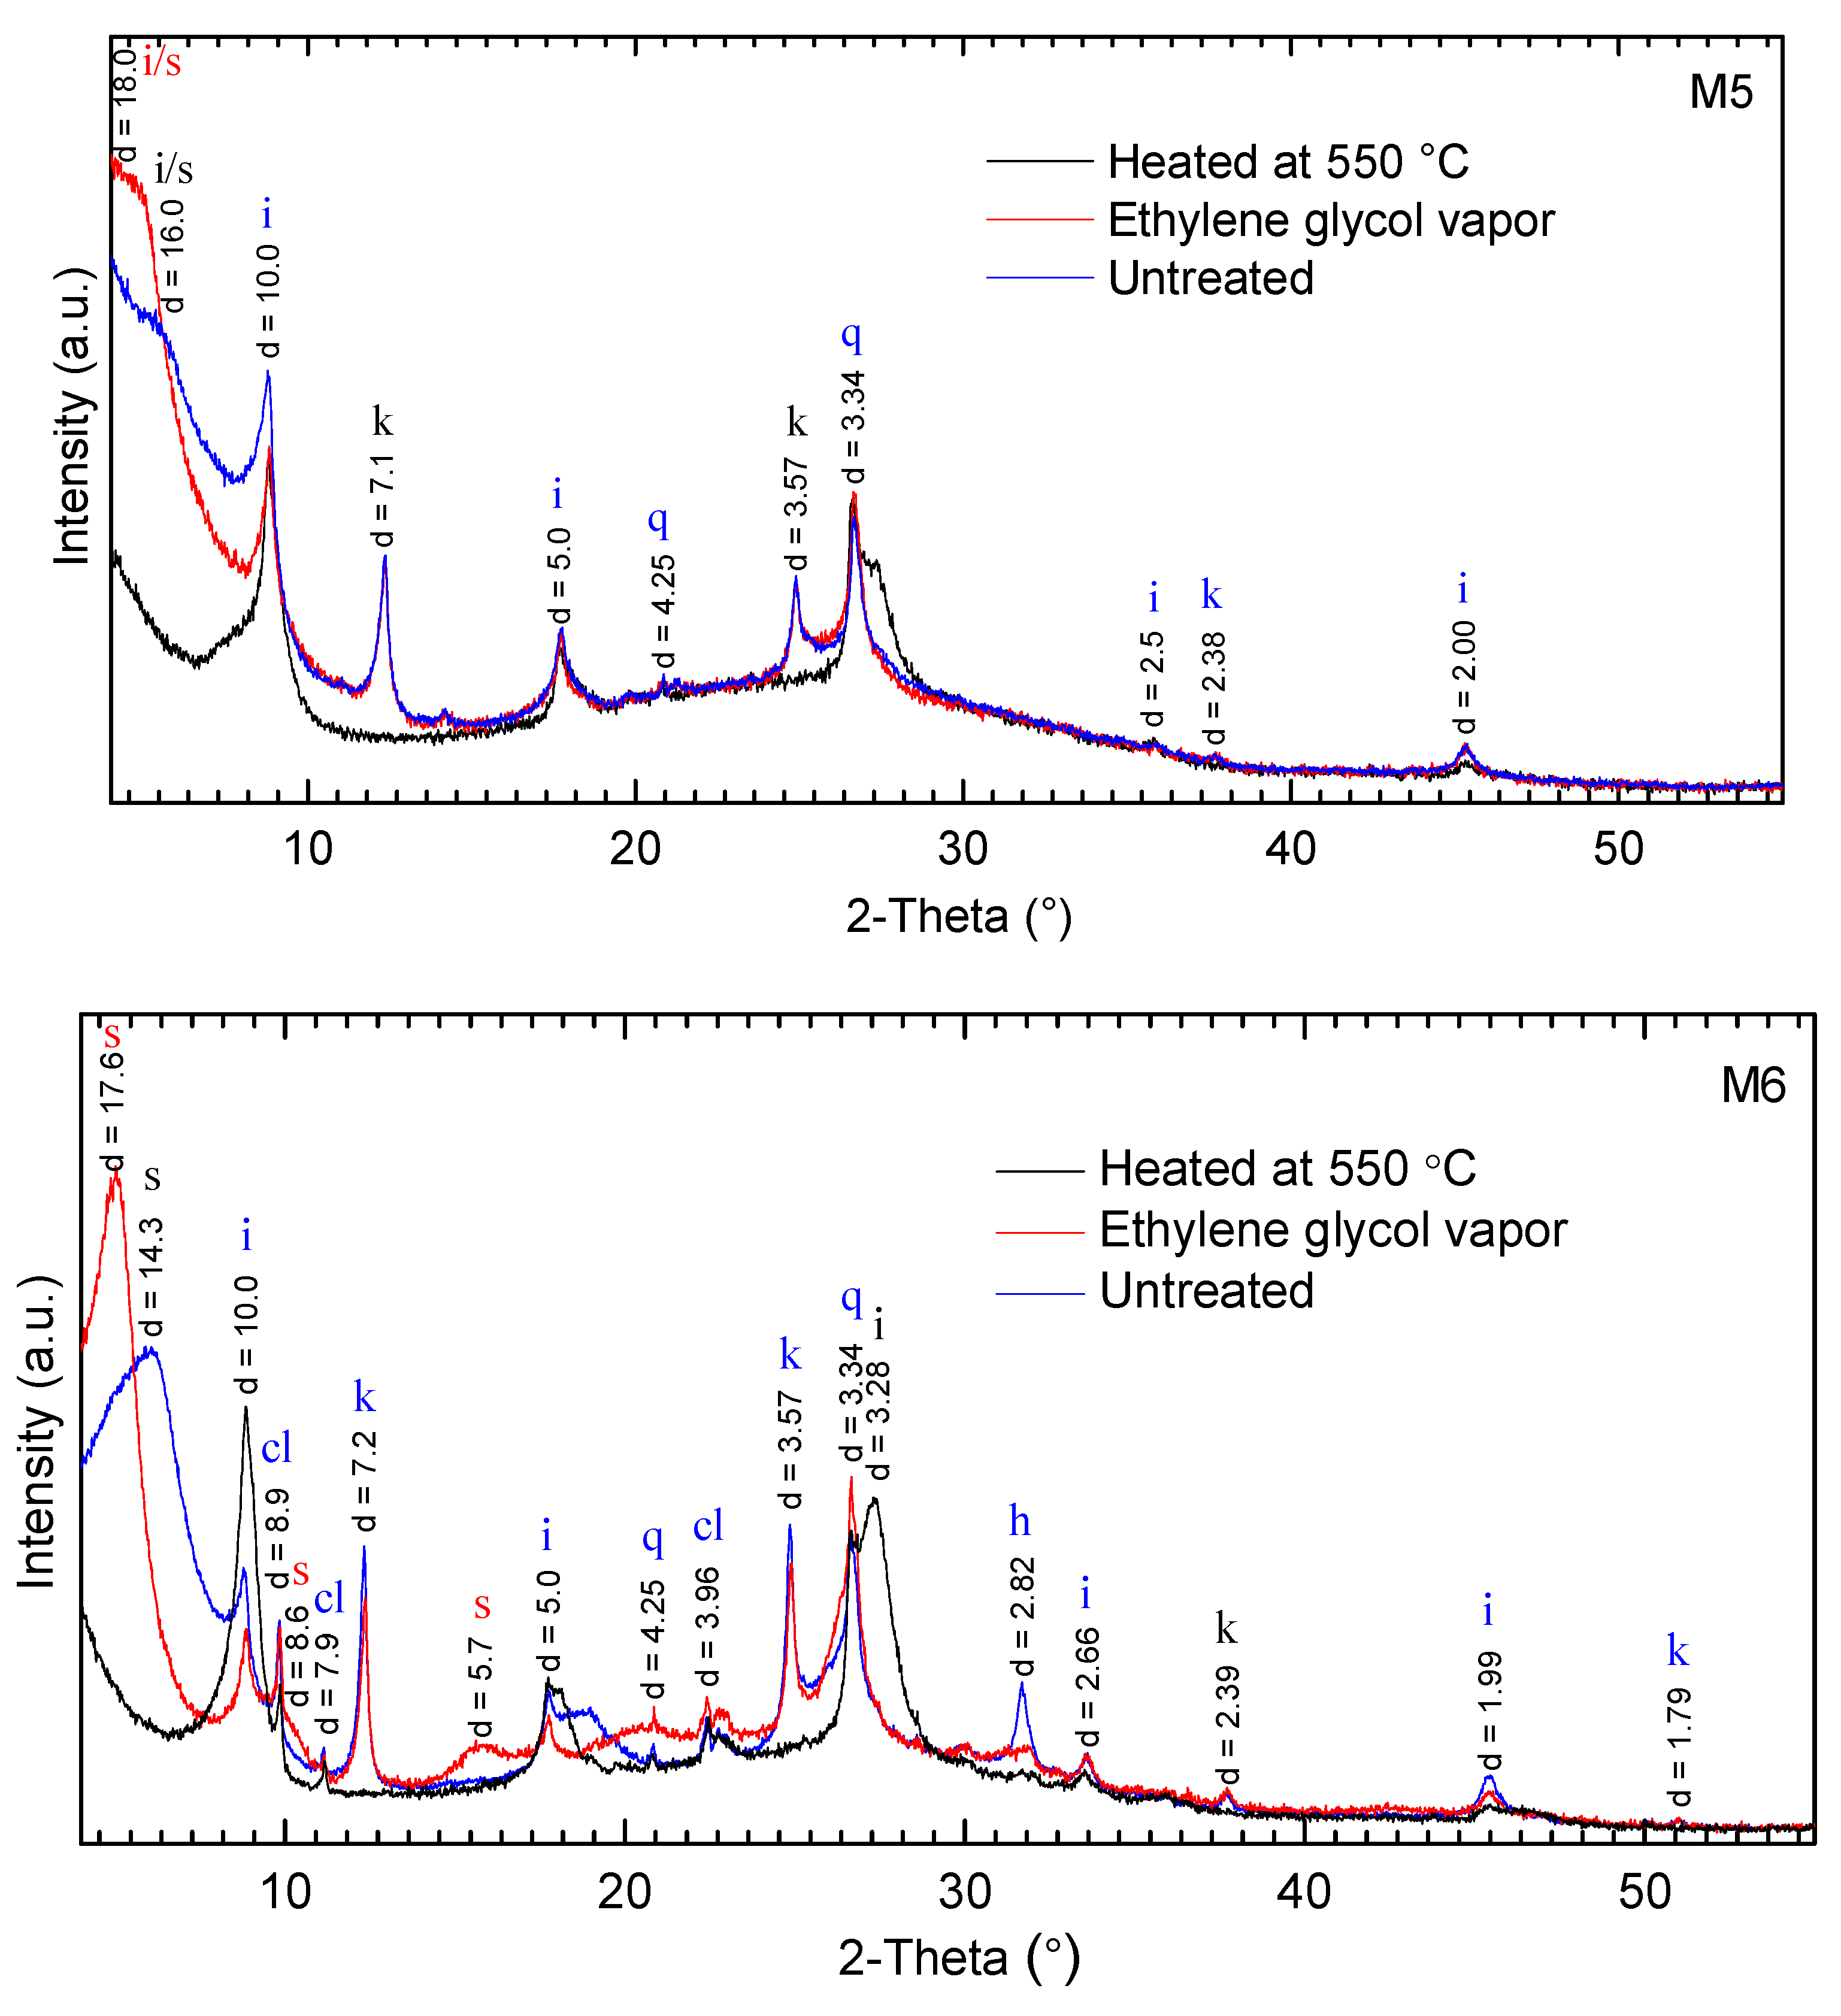
3.1. Mineralogical Compositions

The degree of plasticity is affected by a number of factors, including mineral composition, degree of dispersion, structural features, etc. [43]. Plasticity usually increases with an increase in the amount of clay minerals in the clay composition. The mineral composition of soils affects the magnitude of plasticity by a combination of a number of factors. Studies conducted by Mitchell and Soga (2005) [44] on samples of mono-mineral clays show that the plasticity of soils is greater in the case when the clay fraction contains minerals of the montmorillonite group and less when the kaolinite is contained. The increase in plasticity in the presence of minerals of the montmorillonite group in clay is associated with a significant increase in the dispersion and hydrophilicity of this type of minerals. Differences in the mechanisms of hydration of individual clay minerals are mainly determined by their crystal-chemical characteristics. Thus, for an interpretation of the regularities in the formation of plasticity and clay soils, an important stage is the quantitative analysis of their mineral composition.
The mineral composition of poly-mineral samples is determined using the pattern from non-oriented bulk samples (Figure 1). However, to calculate the mineral composition at the first stage, we analyzed the composition of clay minerals in the <2 μm fraction. The results of the diagnostics of the oriented samples are shown in Figure 2.
The XRD patterns of oriented preparations revealed the presence of mixed-layer clay minerals (MLM) in samples M2, M5. However, even the most accurate contemporary QXRD mineral analysis of rocks is capable of measuring only the total 2:1 (1:1) clay minerals (i.e., the sum of illite (kaolinite) + MLM minerals) [38,45]. The relative amount of mixed layers of illite-smectite and kaolinite-smectite has been estimated from the intensity and changes in peak positions of their reflections in the XRD patterns from oriented preparations following the method of Moore and Reynalds (1989) [46]. Identification of the MLM is made for the case of a clay mineral as a regularly interstratified species [47]. For example, smectite layers are expected to swell to ~1.7 nm with ethylene glycol and to collapse to ~1.0 nm on heating, while illite layers remain stable.
In such a manner, we determined as a swelling phase the MLM minerals of kaolinite-smectite and illite-smectite series in sample M2. Kaolinite-smectite was detected by the reflections under the saturated condition: 15.1, 7.9 Å (Figure 2); disordered illite-smectite by a significant change of the 10.0 Å line profile (in the range of 10 Å to 10.6 Å). The change of the 10.0 Å and 3.32 Å reflection positions for illite after saturation with ethylene glycol is evidence of the occurrence of illite-smectite with a richer quantity of smectite. After heating, the kaolinite component in the MLM mineral is destroyed, and the smectite component shifts to 10.6 Å. Both quartz and illite prevails in the sample, as well as in MLM illite-smectite and kaolinite-smectite series representing more than 80%.
The positions of reflections of different orders in sample M3 after saturation with ethylene glycol are 17.0 Å—(001), 8.5 Å—(002), 5.5 Å—(003) (Figure 2). The behavior of the pattern of sample M3 is identical to that of sample M4, where the smectite reflections shift to small angles upon saturating the sample with ethylene glycol. For this case, the positions of the reflections of different orders 17.0 Å—(001), 8.5 Å—(002), 5.5 Å—(003) are stable in sample M4. After heating, the smectite reflections shift to the illite ones. Sample M3 in the highest concentrations contains kaolinite and smectite clay minerals. At the same, time the prevalence of calcite is observed in sample M4. In sample M5, we found the dispersed phases of MLM illite-smectite minerals with low content of smectite component (16–18 Å) from the change of position of the basal reflections of clay minerals after saturation with ethylene glycol (Figure 2). After heating, the smectite reflections collapse to the illite ones. Content of non-clay mineral quartz prevails in this sample (~50%).
In sample M6, after saturation with ethylene glycol, the smectite reflections shift to small angles (Figure 2). At the same time, the positions of reflections of different orders 17.6 Å—(001), 8.6 Å—(002), 5.7 Å—(003) remain the same. Heating resulted in the dehydration of smectite interlayer spaces and the elementary layers came closer to each other, and this can be seen from the shifting of the main basal reflection of the mineral to greater angles, and its overlapping with the illite 10 Å reflection. The occurrence of kaolinite in sample M6 is detected from the characteristic series of reflections, 7.2 Å—(001), 3.57 Å—(002), 2.39 Å—(003), whose positions do not change after saturation with ethylene glycol. The main components of this sample are the following: quartz (~35%), clinoptilolite (25%) and MLM kaolinite-smectite minerals (~22%).
The concentrations of the minerals in analyzed soil samples and the soils’ plasticity indexes are presented in Table 1.
The results of the analysis of mineral concentrations in the studied soil samples show that quartz prevails among non-clay minerals in the samples M2, M3, M5 and M6 with the most intense reflections, 4.25 Å—(001), 3.34 Å—(002). For the sample M4 the following series of reflections is observed: calcite: 3.03 Å—(001), 2.28 Å—(002), 1.91 Å—(003), 1.87 Å—(004), giving the greatest contribution to the diffraction spectrum of the soil sample.
Among the clay minerals in the soil samples kaolinite, smectite and illite prevail, the total concentration of which may reach 60%. The samples M2 and M5 contain mixed-layer clay minerals belonging to illite-smectite and kaolinite-smectite types.

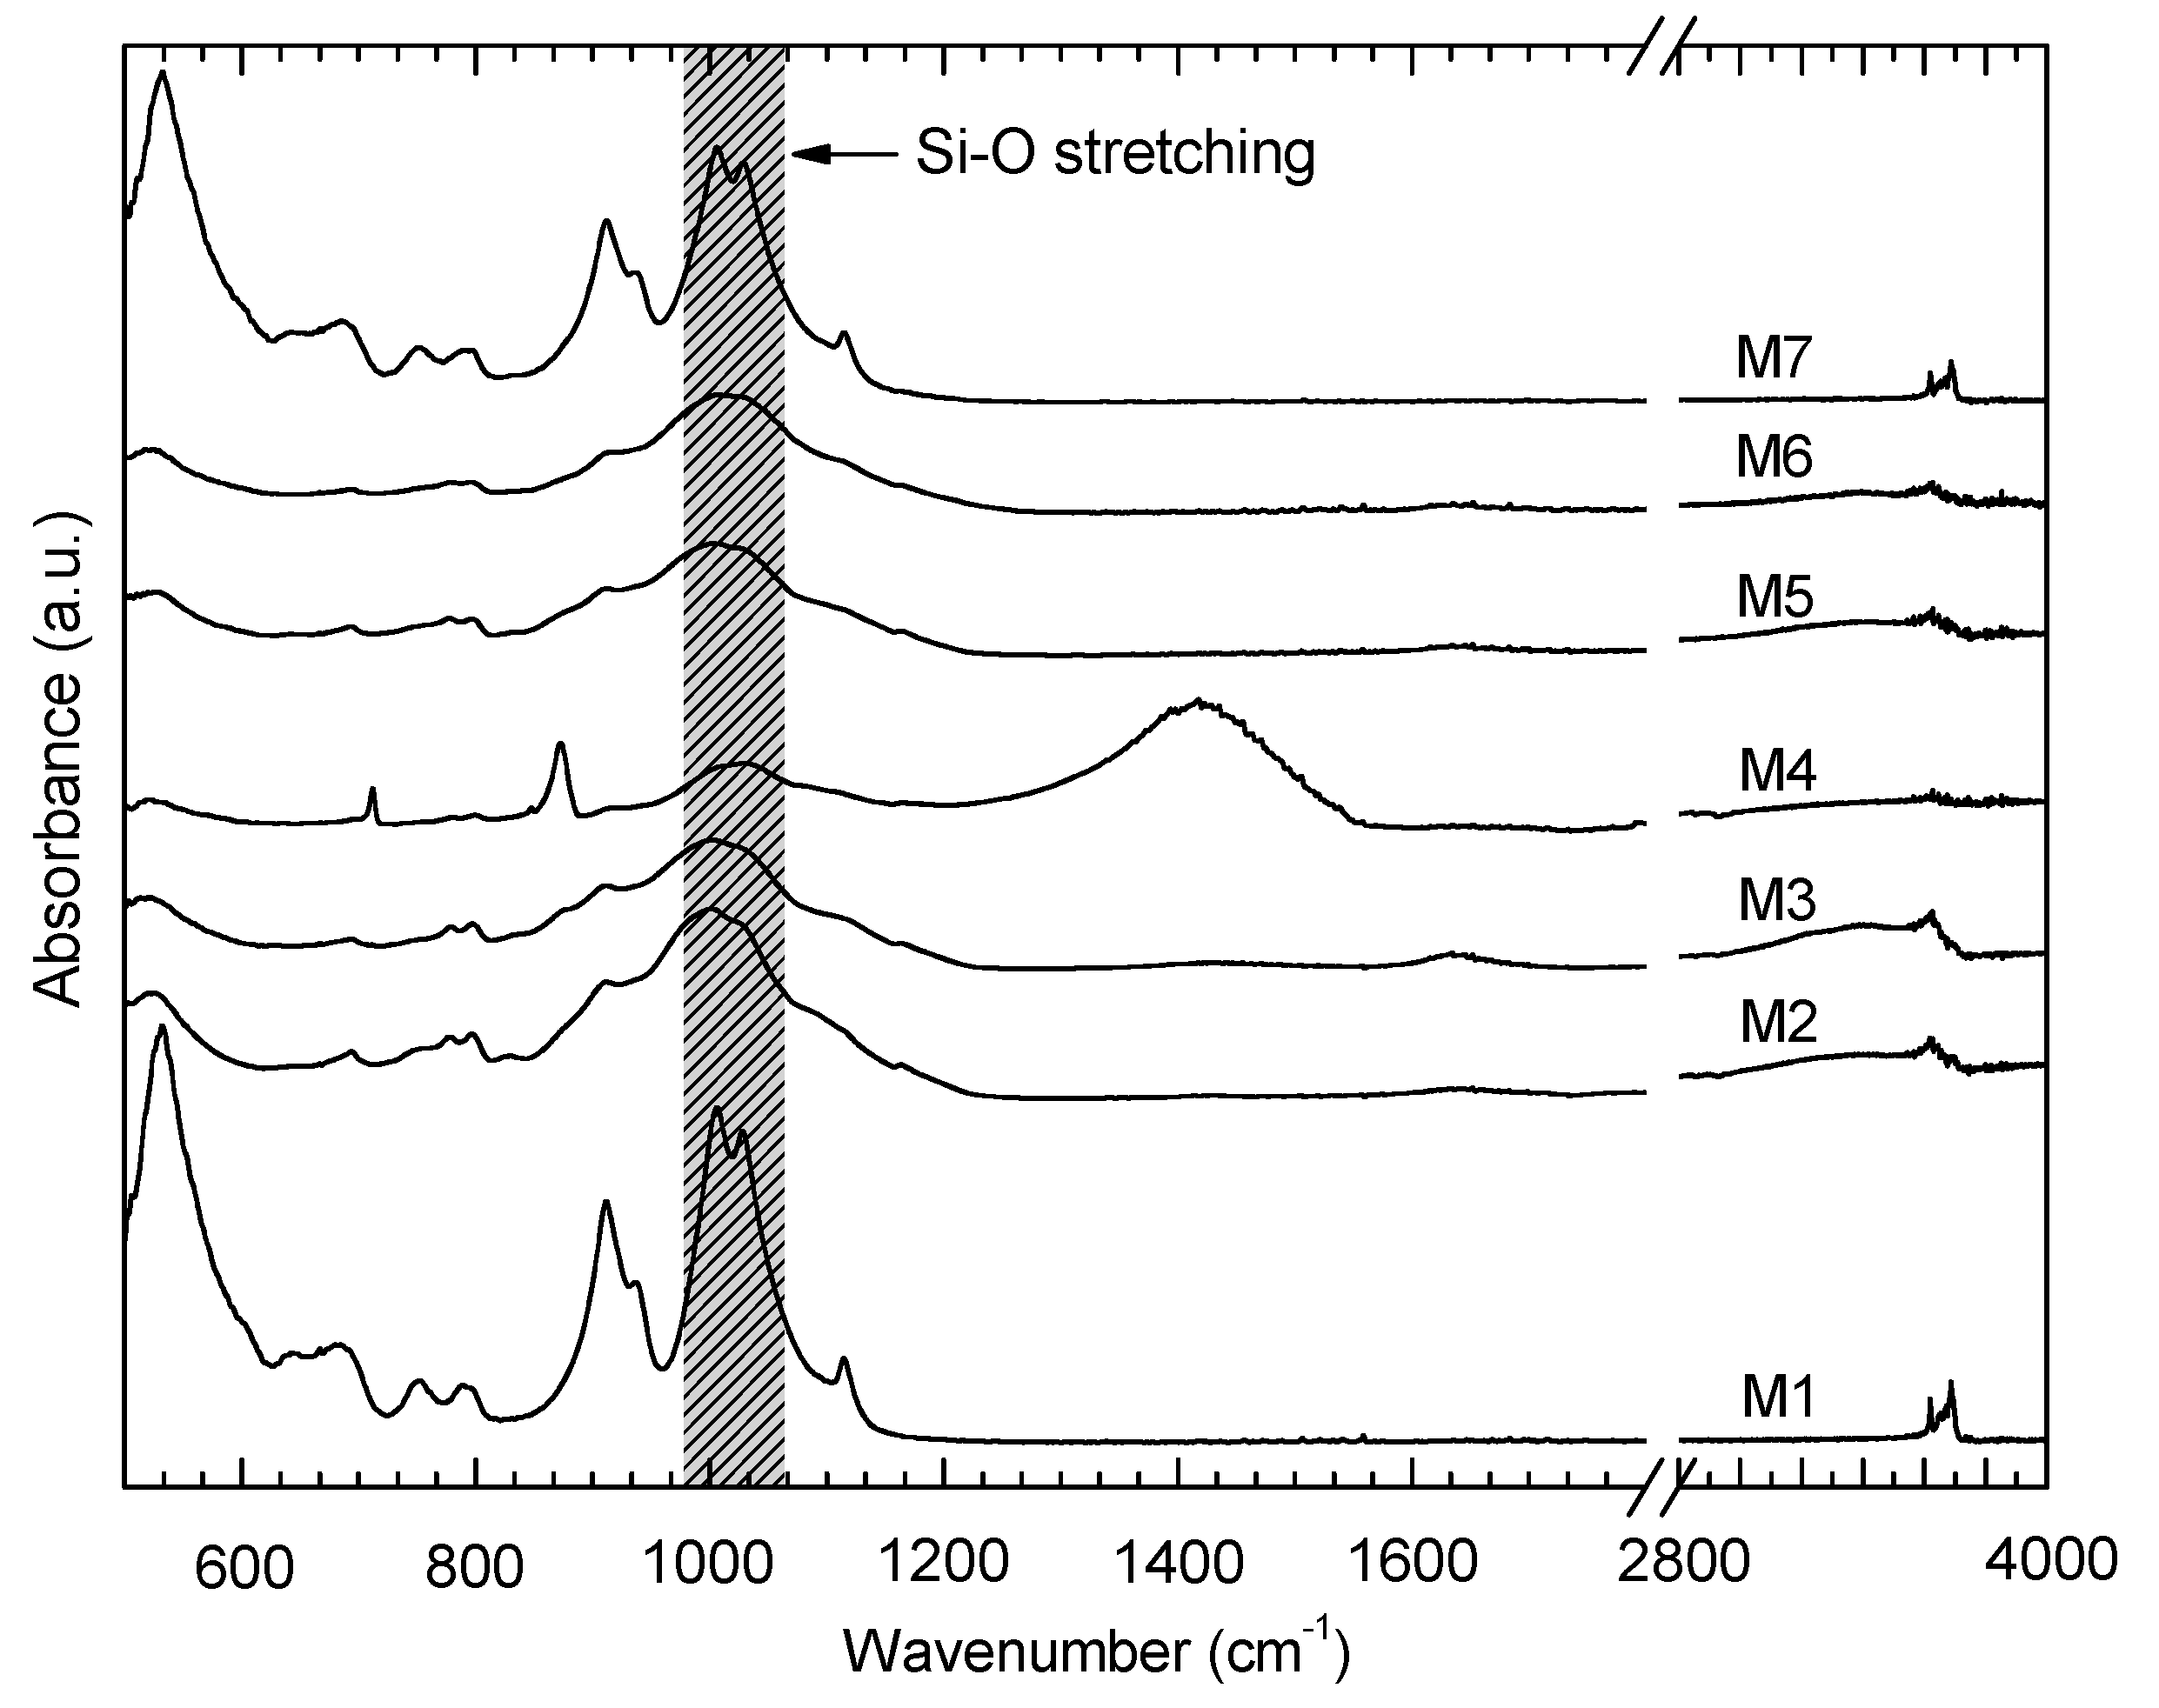
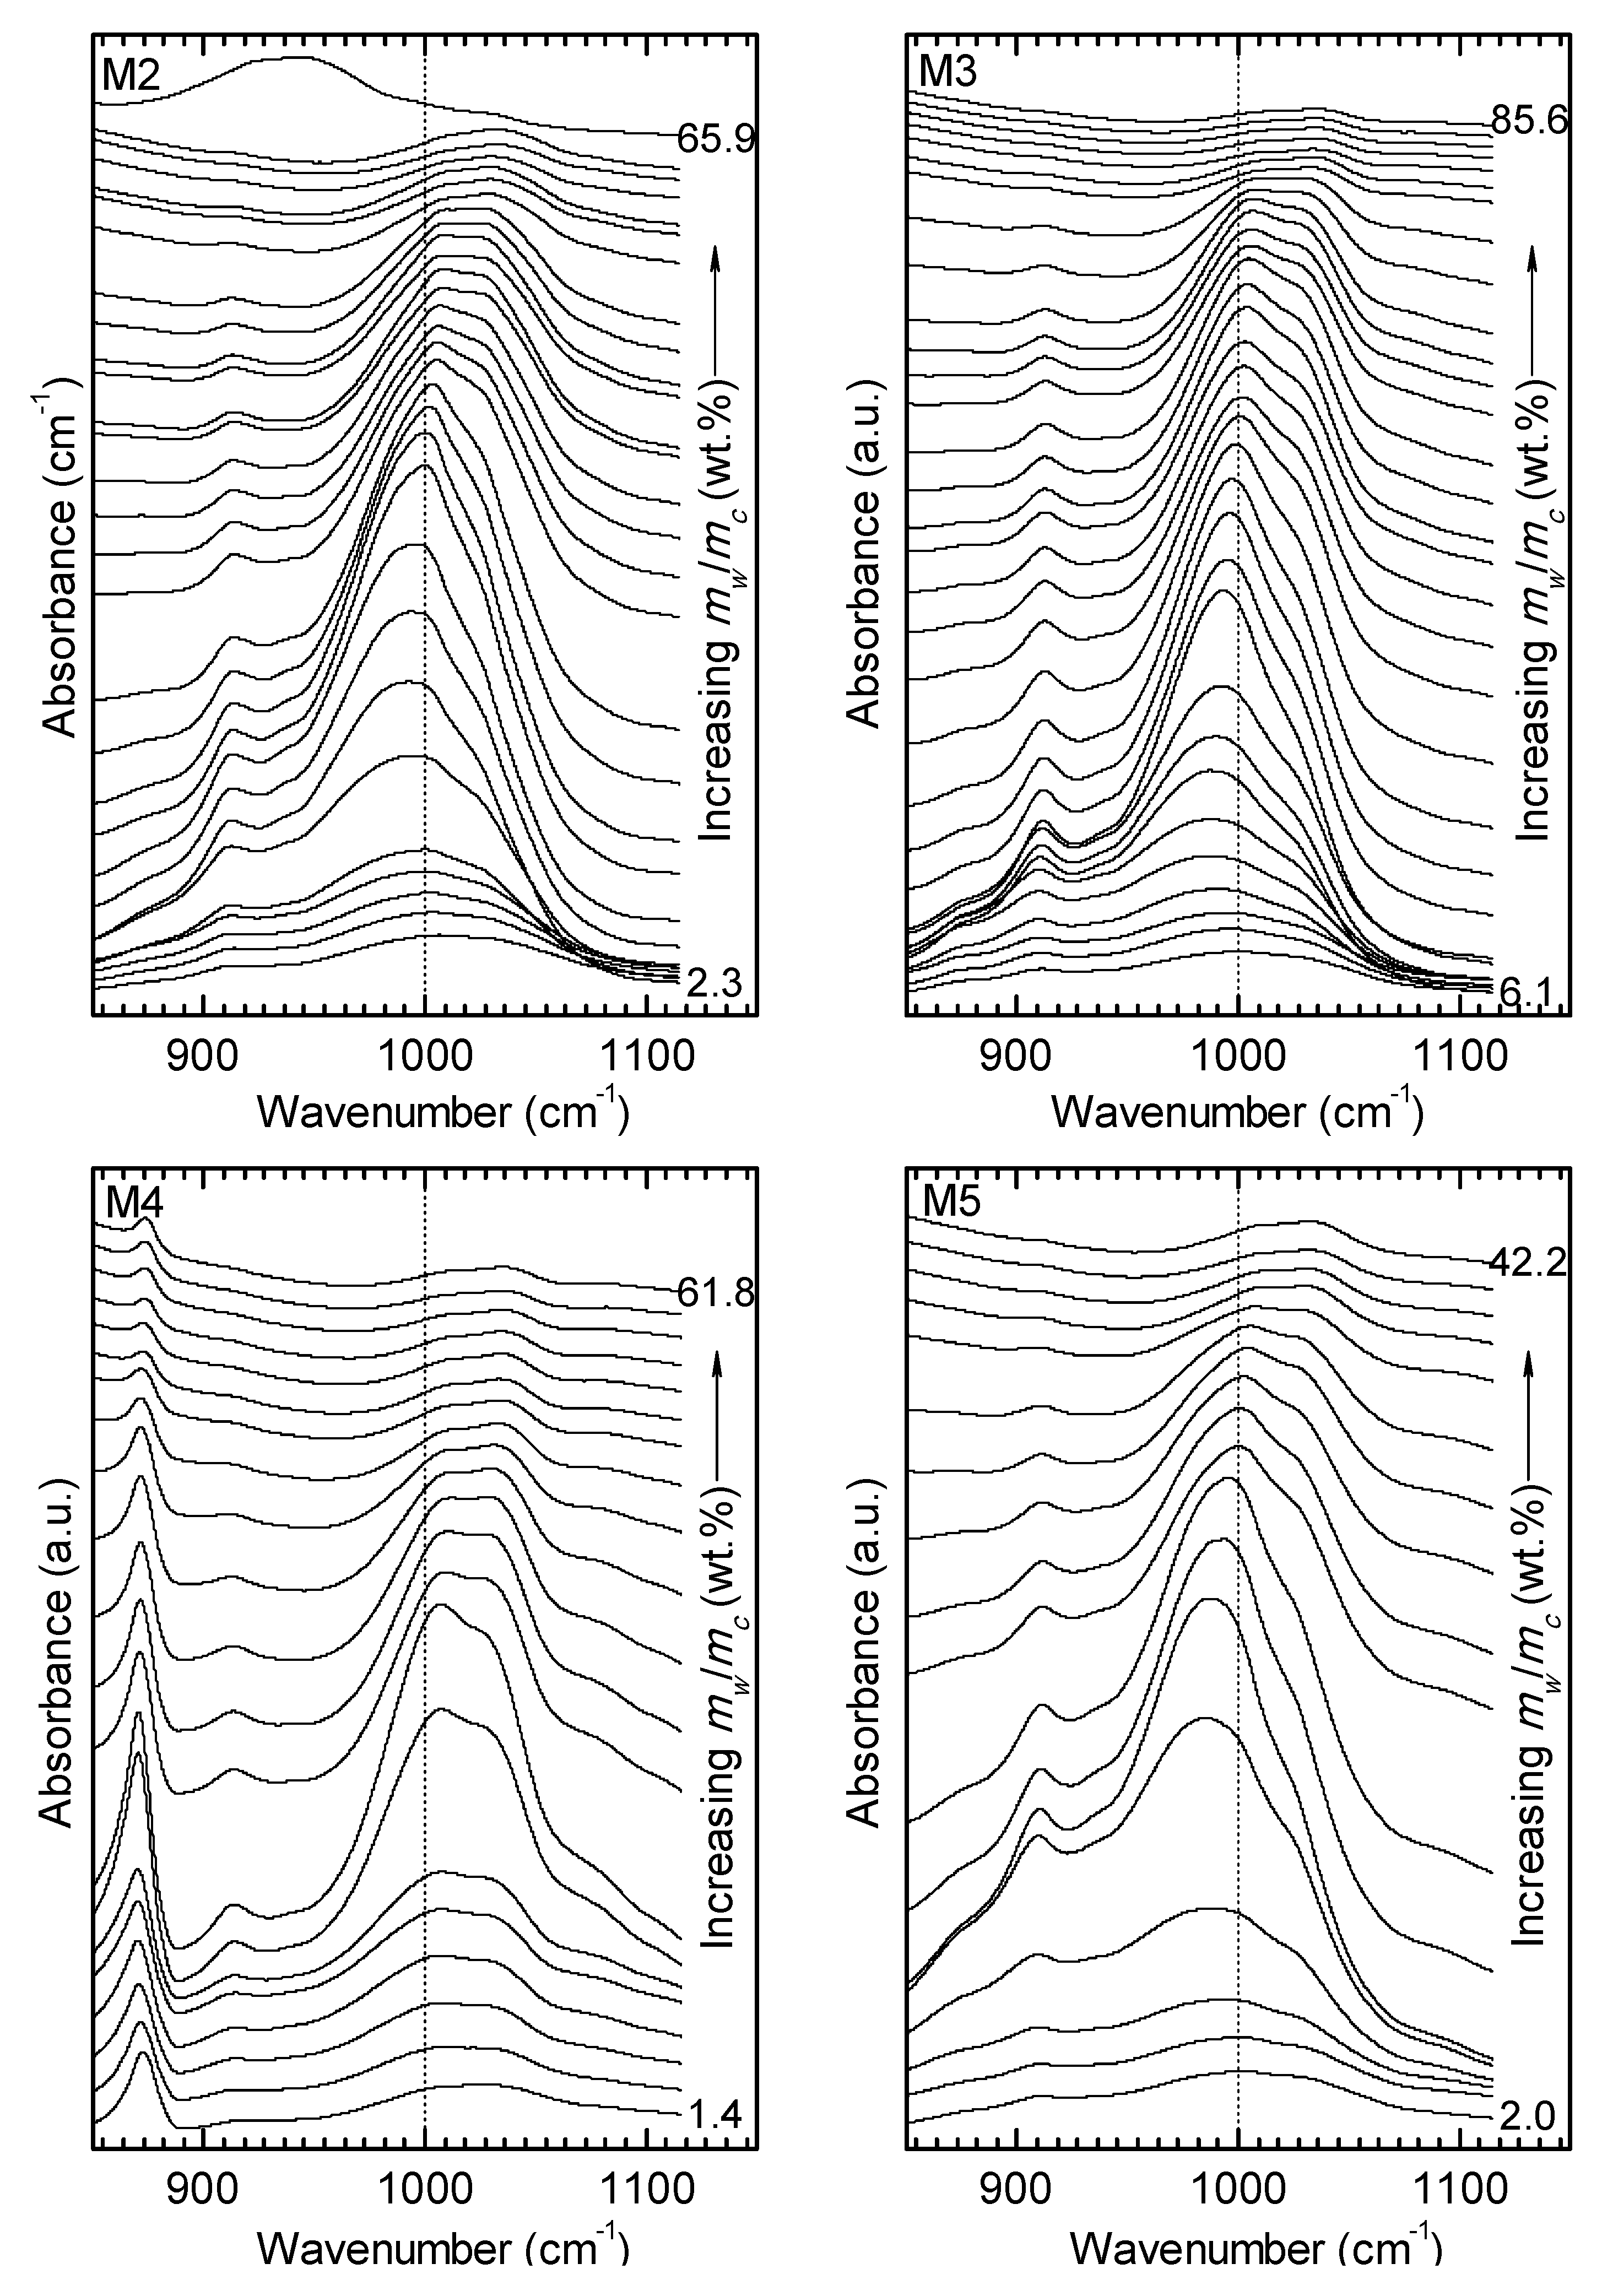
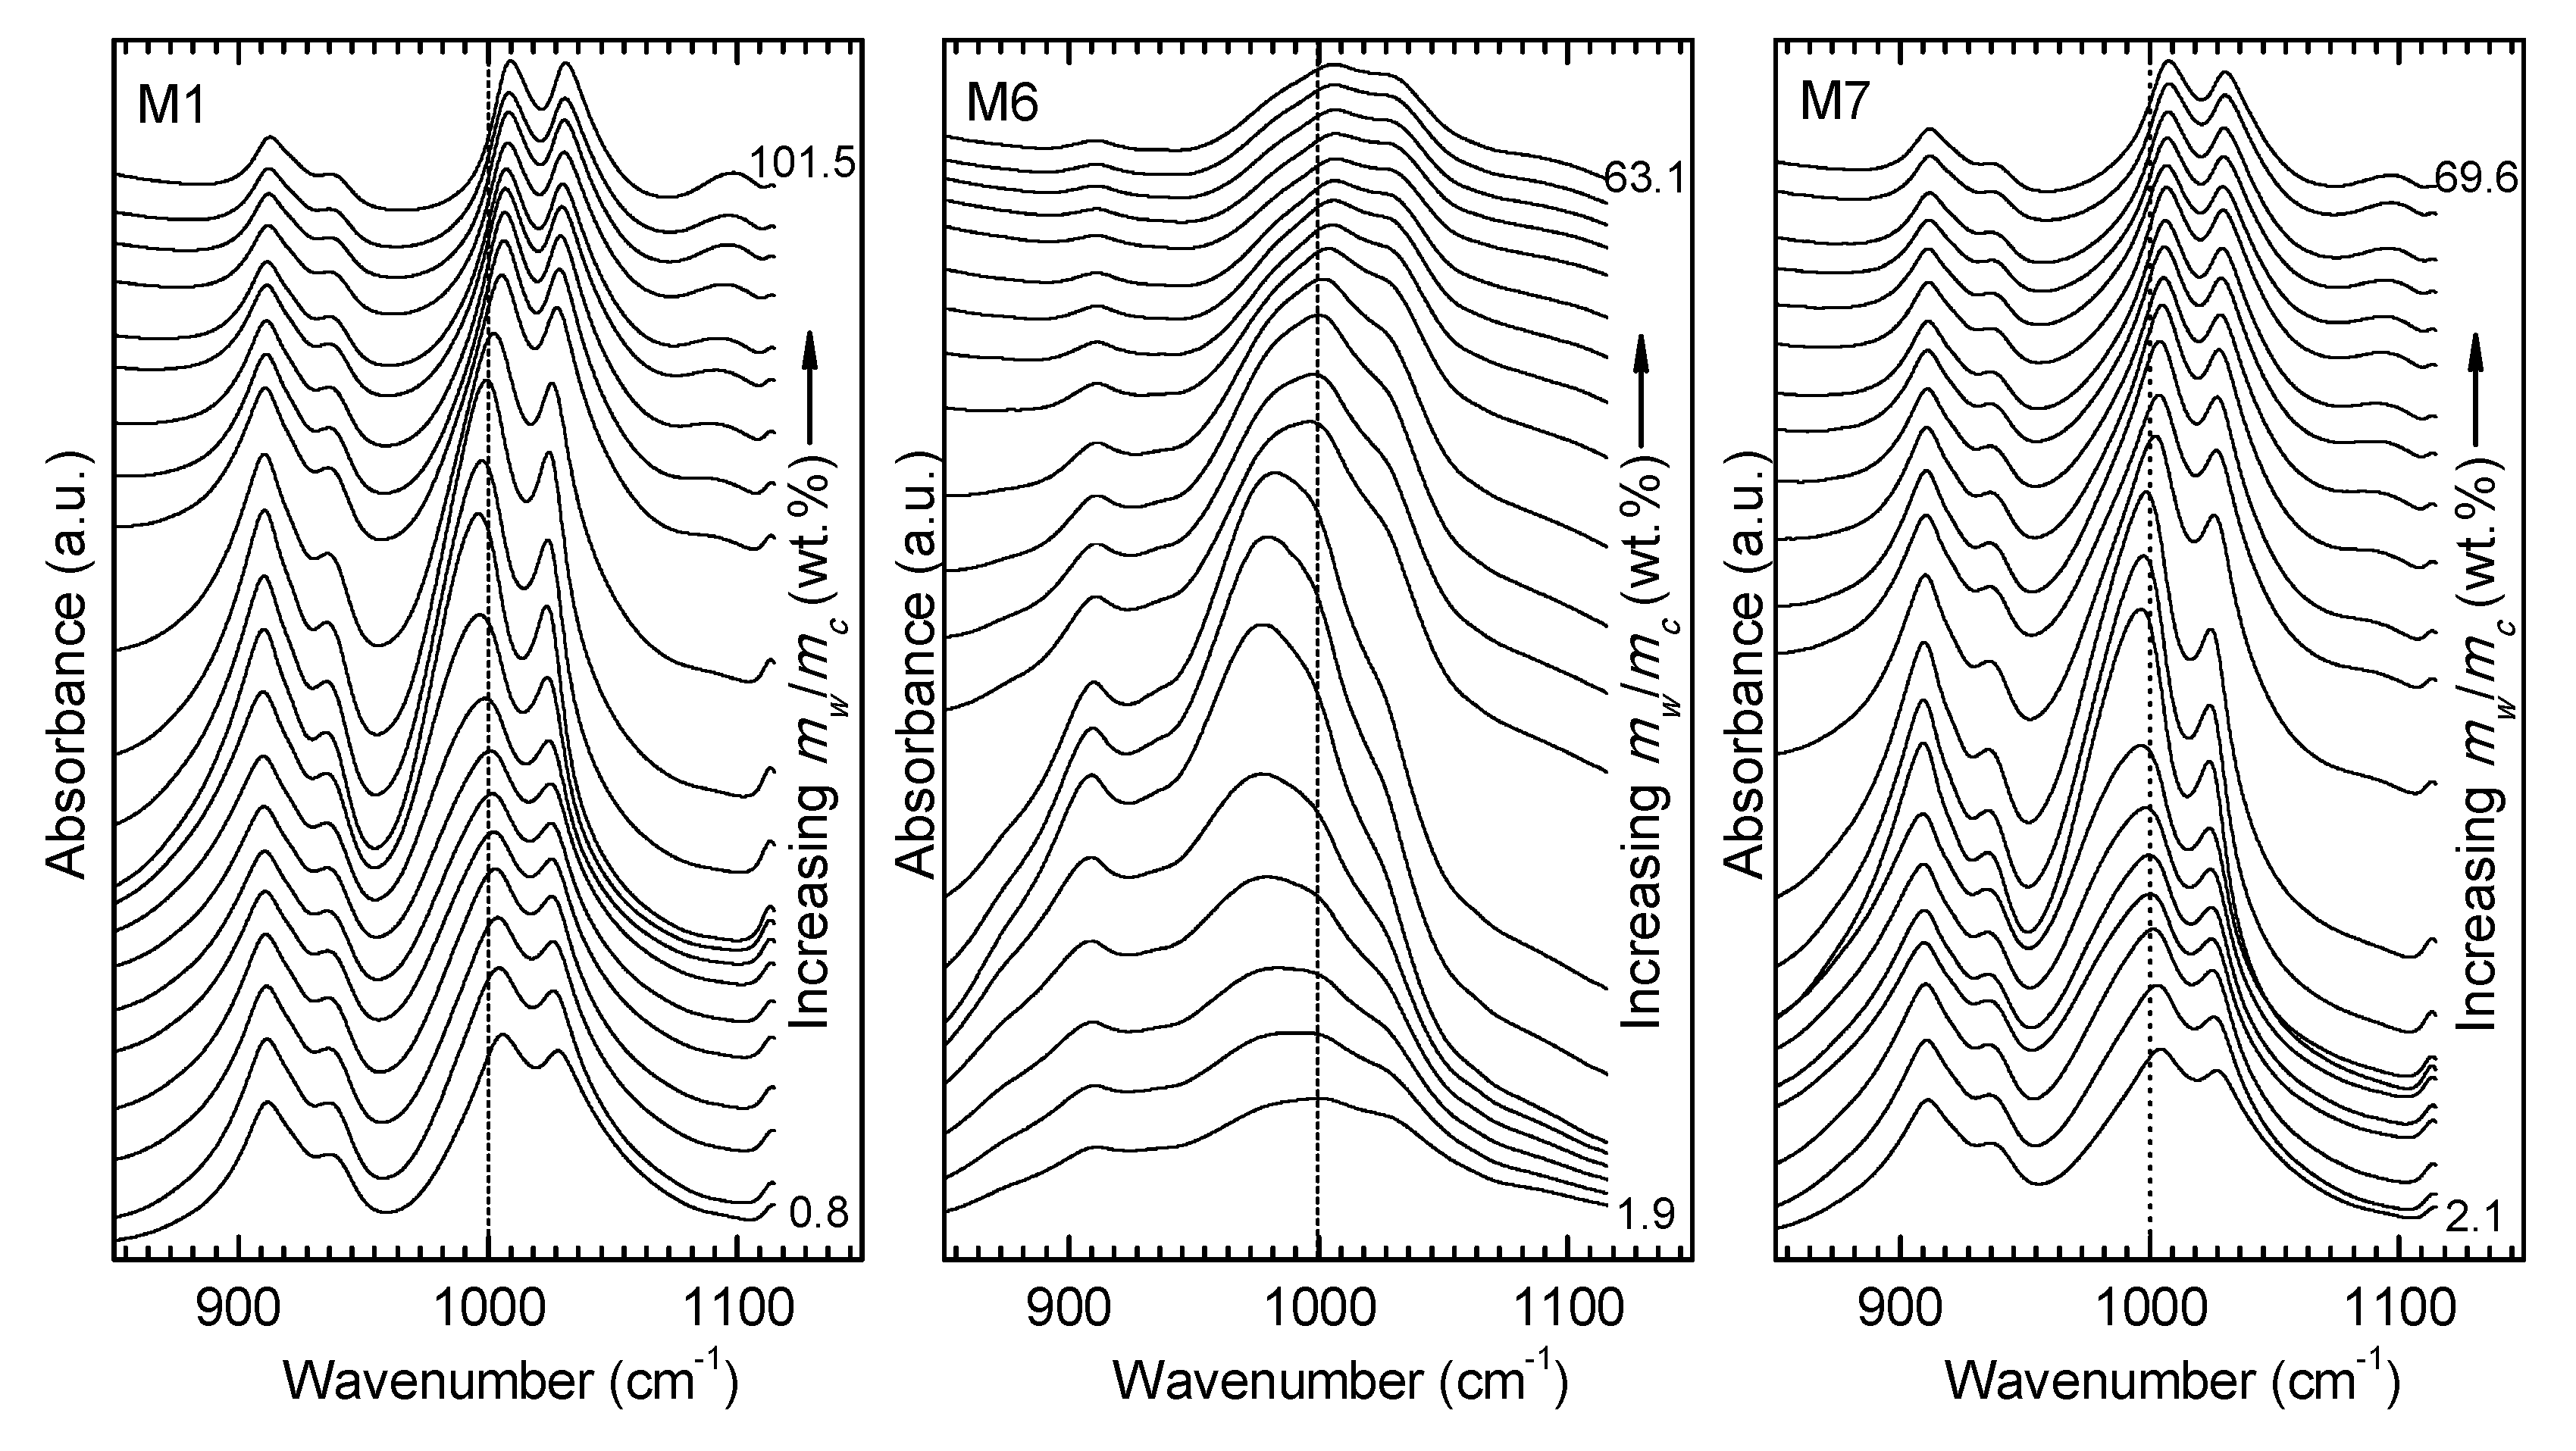
3.2. ATR FT-MIR Data

IR spectra for the dry samples and the samples with different water contents for the wide range of wavenumbers are shown in Figure 3 and Figure 4, respectively. Analysis of spectral bands has been assigned on the basis of published references [49,50,51,52].
Generally, spectral signals have been similar in shape with two main absorption intervals. The stretching and deformation vibrations of OH groups absorb in the 3700–3450 cm−1 and 950–900 cm−1 regions, respectively. The Si–O stretching modes occur in the 1150–950 cm−1 region, while the most intense absorption band appears in the 550–400 cm−1 region. The intensive absorption bands in the 550—400 cm−1 region for samples M1 and M7 correspond the vibrations of Al–O–Si and Si–O–Si. The group of vibrational frequencies 3694, 3670 and 3652 cm−1, relate to the stretching vibrations of the surface hydroxyl groups, while frequency of 3619 cm−1 corresponds to vibrations inside the hydroxyl group in kaolinite structure. This indicates the prevailing contribution of the IR spectrum of kaolinite in the spectra of soil samples, which is confirmed by the results of quantitative phase analysis. For the same reason, ranges of 3700–3450 cm−1 and 550–400 cm−1 for samples M2–M6 are weakly expressed.
Sample M4 shows additional bands. These are assigned to distinct absorption bands at 1413 cm−1 (CO3 stretching), 712 cm−1 and 875 cm−1 (CO3 deformation) caused by presence of calcite in the sample.

4. Discussion.

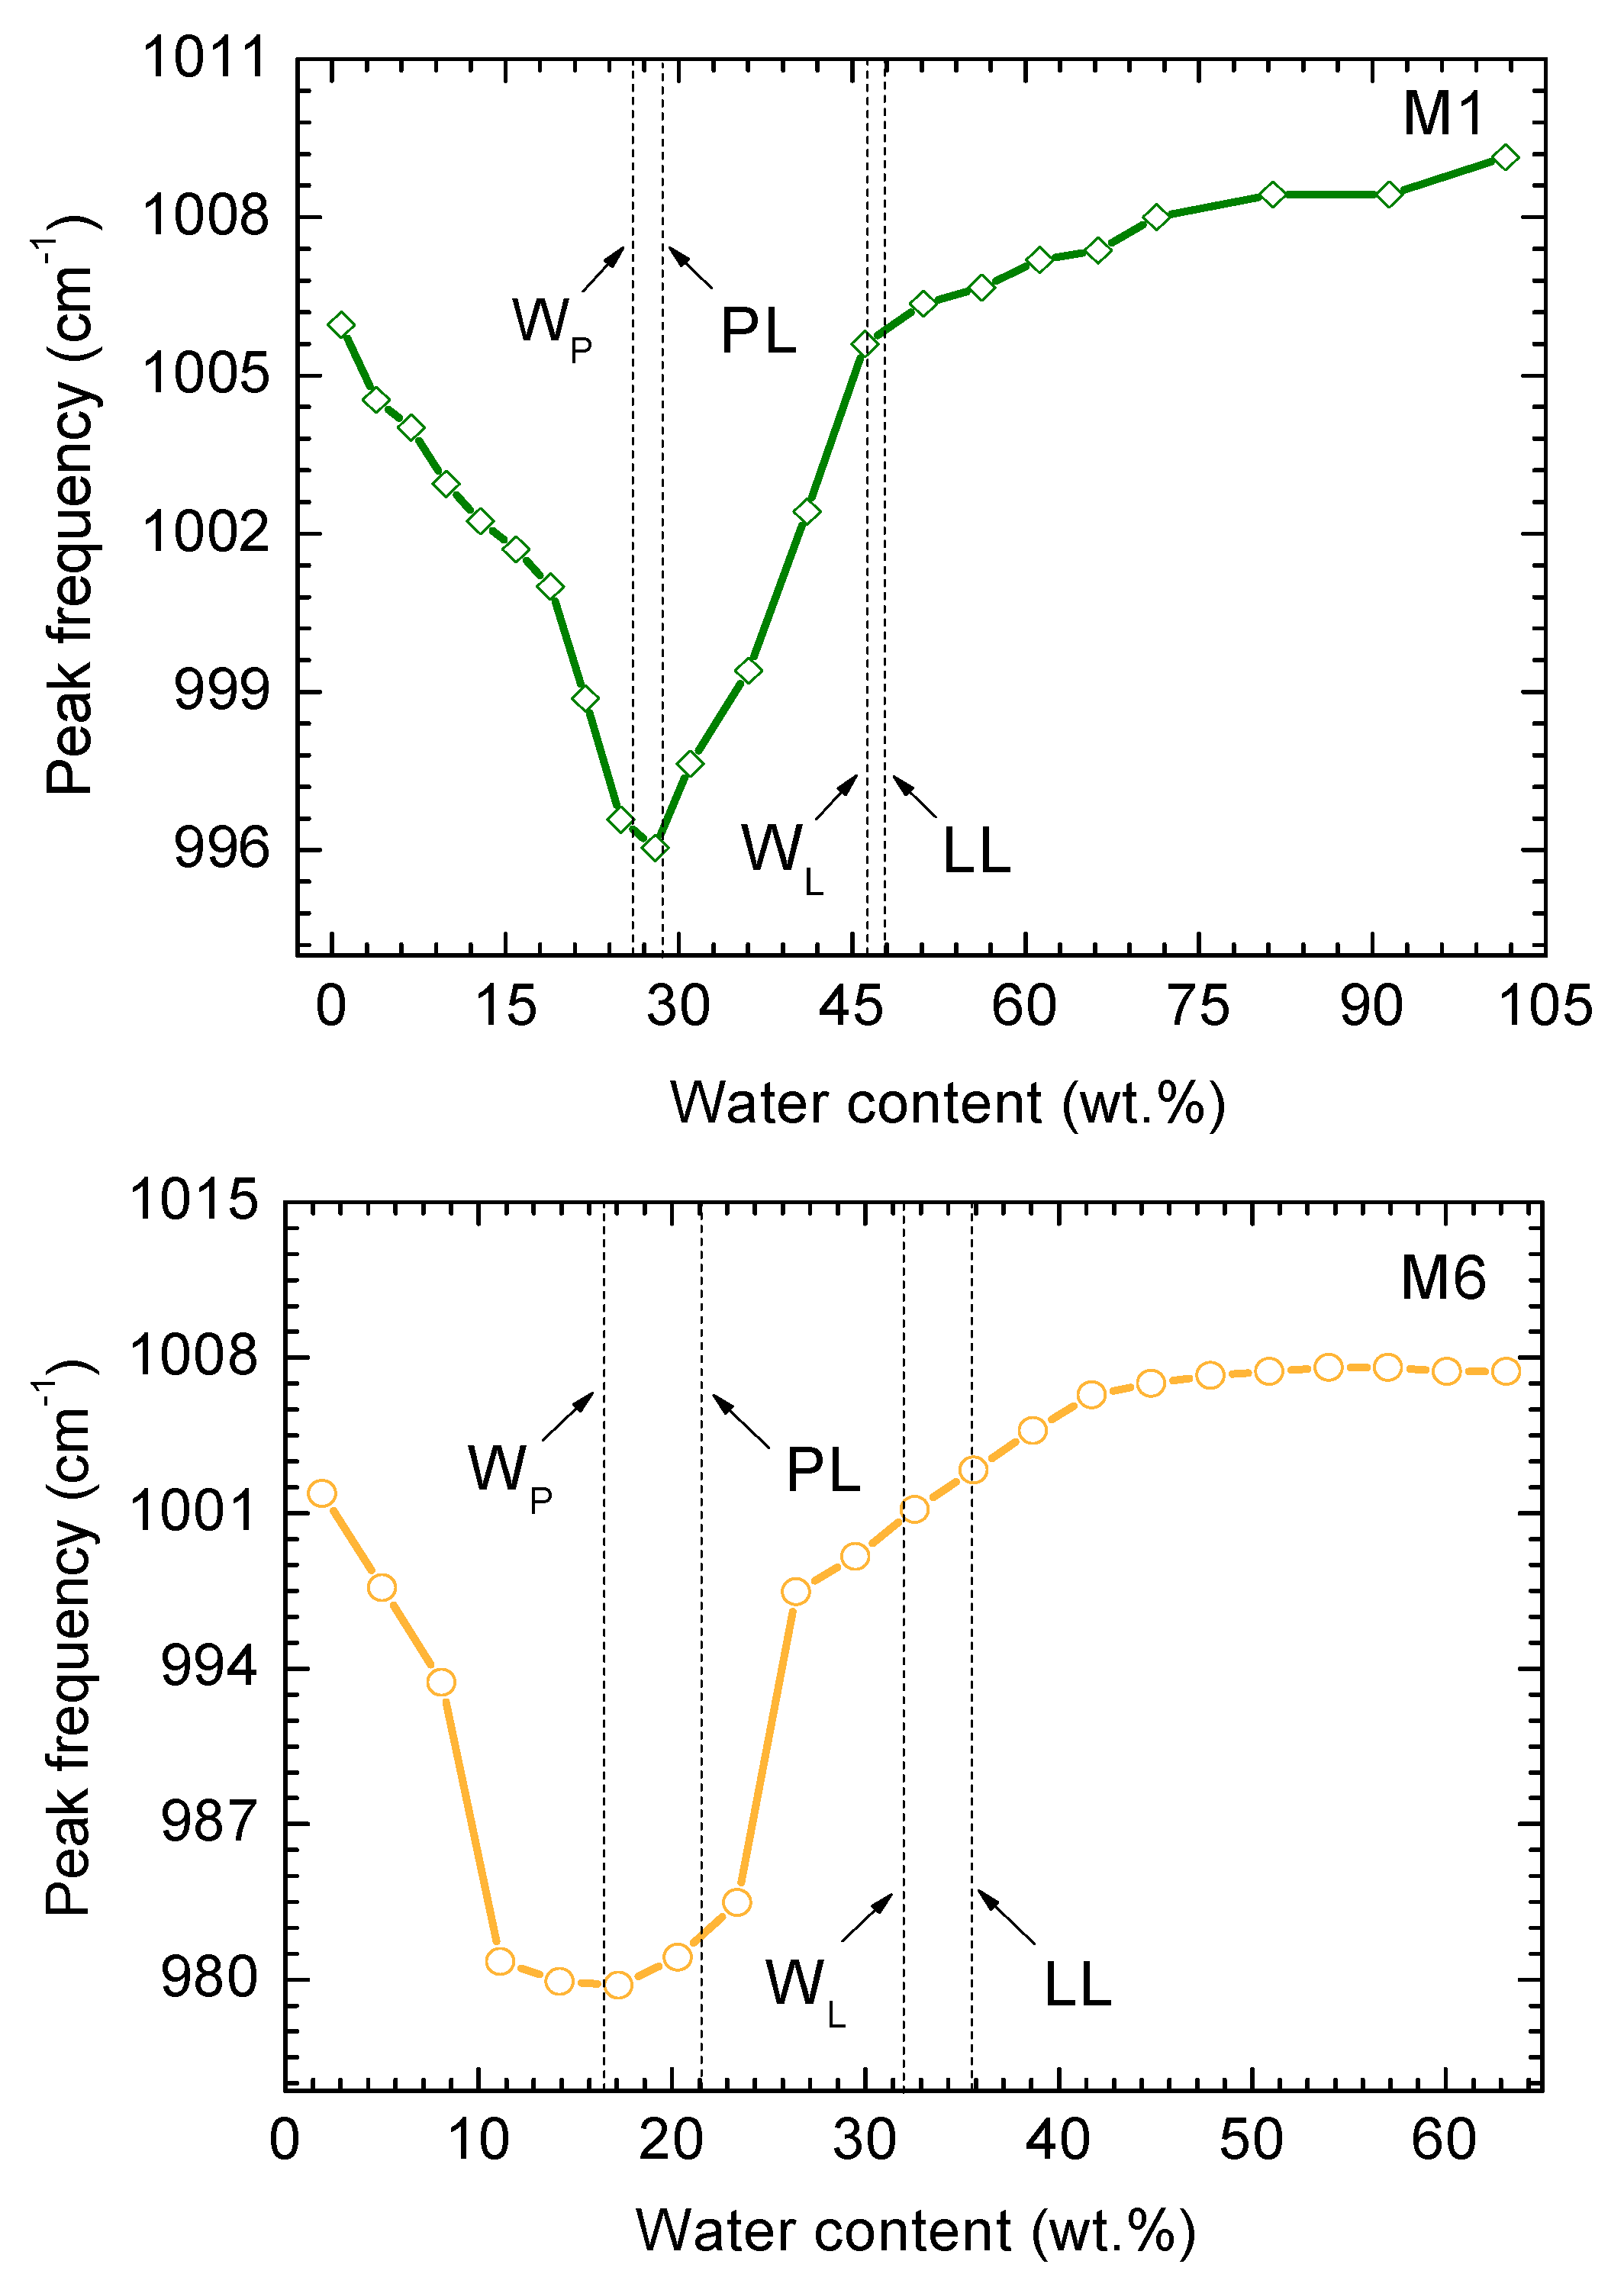
4.1. Comparison of the Spectral Behavior of Kaolinite and a Polymineral Sample

The results shown in Figure 5 make it possible to split the considered range of moisture variation into sub-ranges that are characterized by the same qualitative behavior of the most intensive absorbance of the spectra of analyzed objects. The moisture intervals shown in Figure 5 are determined on the basis of the need to assess the changes in the spectral position of the analyzed Si–O lines in the range up to the values measured by the standard LL methods until the samples are completely saturated with water.
The spectral position of the most intensive absorbance of the IR spectrum for samples M1 and M6 at various sample moisture contents is shown in Figure 5. This absorbance reflects the stretching vibration of the group Si–O ν for the kaolinite (M1) or for components of the polymineral sample (M6).
The sub-range up to 19% moisture content for kaolinite and up to 8% moisture content for polymineral soil is characterized by the decrease of the wavenumber of the IR spectra. This regularity can be explained by the strong interaction of a tightly bound monolayer of water and a tetrahedral layer of clay minerals [35,53].
A further increase of moisture up to 28% in kaolinite, and up to 17% in a polymineral soil, respectively, results in the filling of the pore spaces in these clay soils. At the same time, for the sample M1, this moisture value corresponds quite accurately to the well-defined minimum of the graph, while for the polymineral sample M6, the minimum of the graph is not very strong, and a smooth transition from the solid state to the plastic state in the humidity range 10%–17% is observed. This can be explained by the fact that the transitions to the plastic state for different clay components in polymineral soil occur at different moistures. This results in a more rapid decrease of the wavenumber of the IR spectrum line which can be explained by the increase of the interaction between the atoms of the clay particles, the pore water, and the atoms of neighboring particles. This type of interaction results in building molecular structures that include fragments of clay particles and water molecules.
An accumulation of water up to 47% for kaolinite and up to 27% for polymineral soil results in the decrease of interaction between the atoms of neighboring clay particles; this can be explained by the swelling of soil and the screening of the interaction due to additional water layers in pore space. Further accumulation of water by soils in the liquid state does not significantly affect the interaction between atoms of clay particles and water molecules [48]. In this range of moistures, the wavenumber of the spectral lines does not vary considerably. In other words, this water can be interpreted as bulk water. As a result, the reduced mass of oscillators decreases and this leads to the increase of the spectral line’s wavenumber. Respective moisture ranges belong to the interval of soil plasticity, and their upper limits determine the values of moisture at liquid limit. In the case of polymineral soil, the transition to the liquid state is characterized by the interval of moisture values from 27% to 45%; this can be explained (neglecting the interaction between the particles of different mineral nature) by consecutive transitions of different phases to the liquid state. The upper limit of this sub-range of moistures matches well the value of moisture at liquid limit for kaolinite, which makes 47% of the sample.
Figure 5 also shows plastic limit and liquid limit determined with different standard methods according to GOST 5180 [3], ISO/TS 17892-12 [4] and ASTM D-4318 [5]. The comparison of measured spectral characteristics and the results of standard measurements of PL (WP) and LL (WL) show us the following:
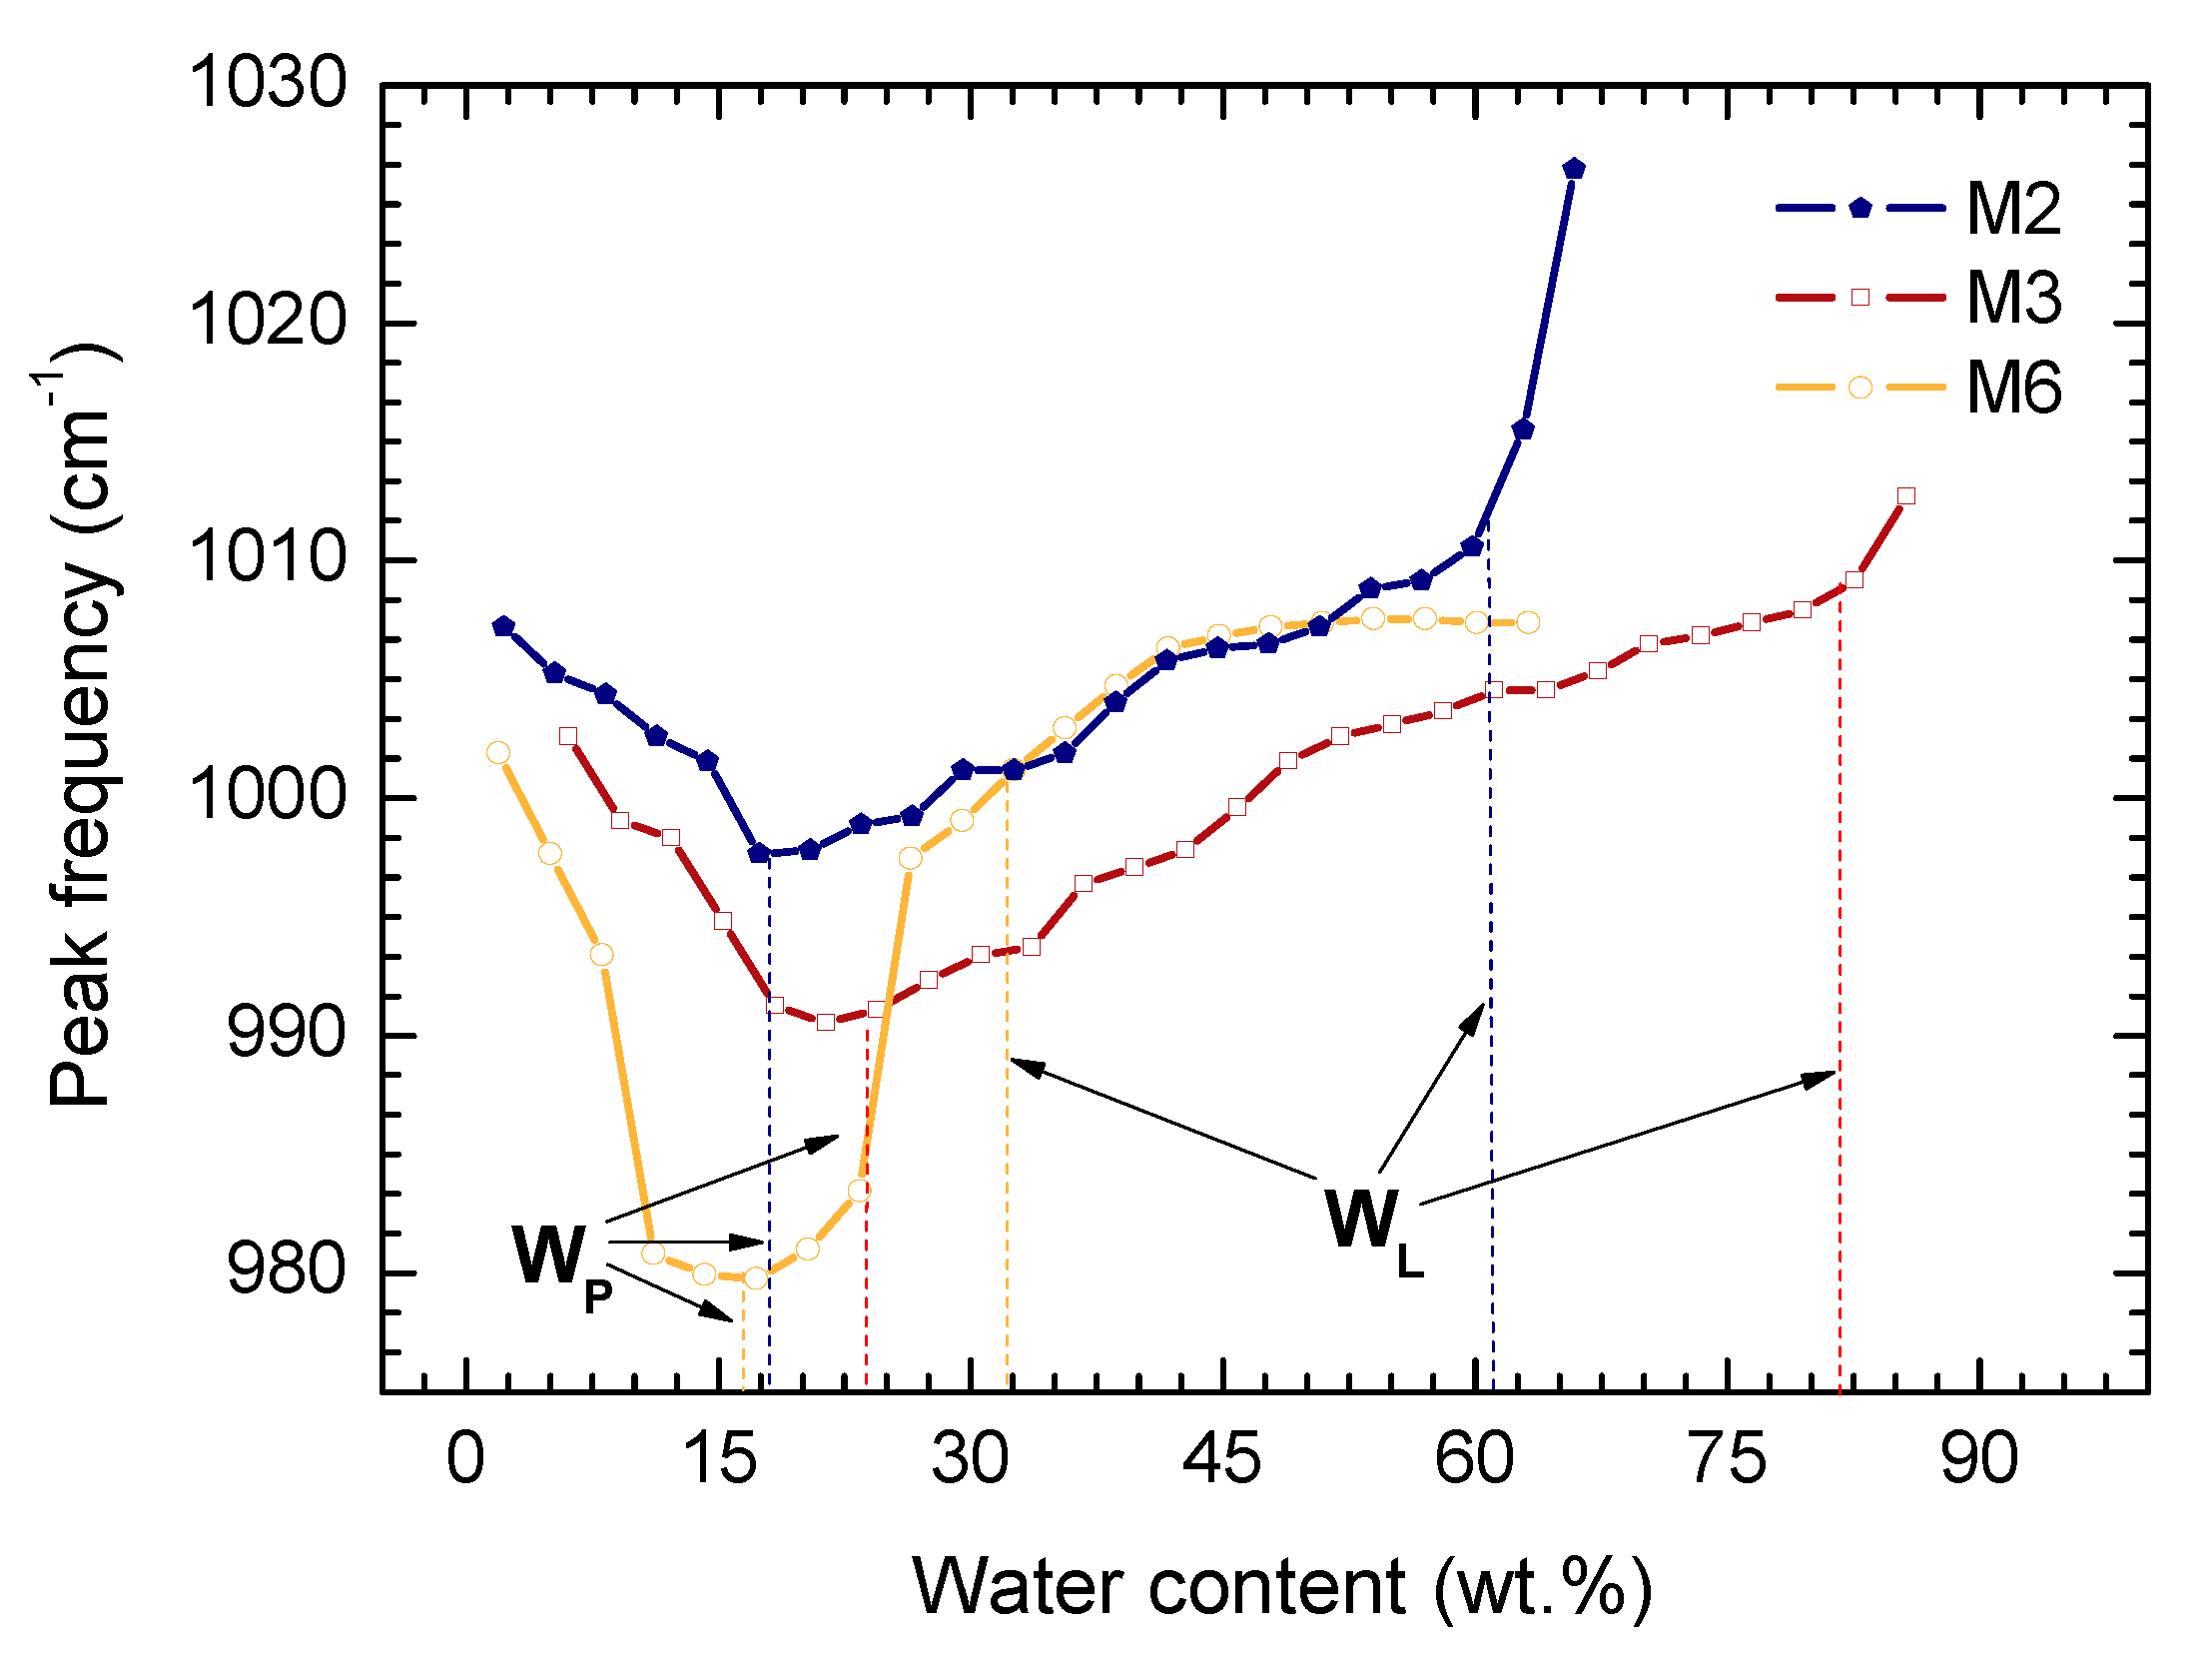
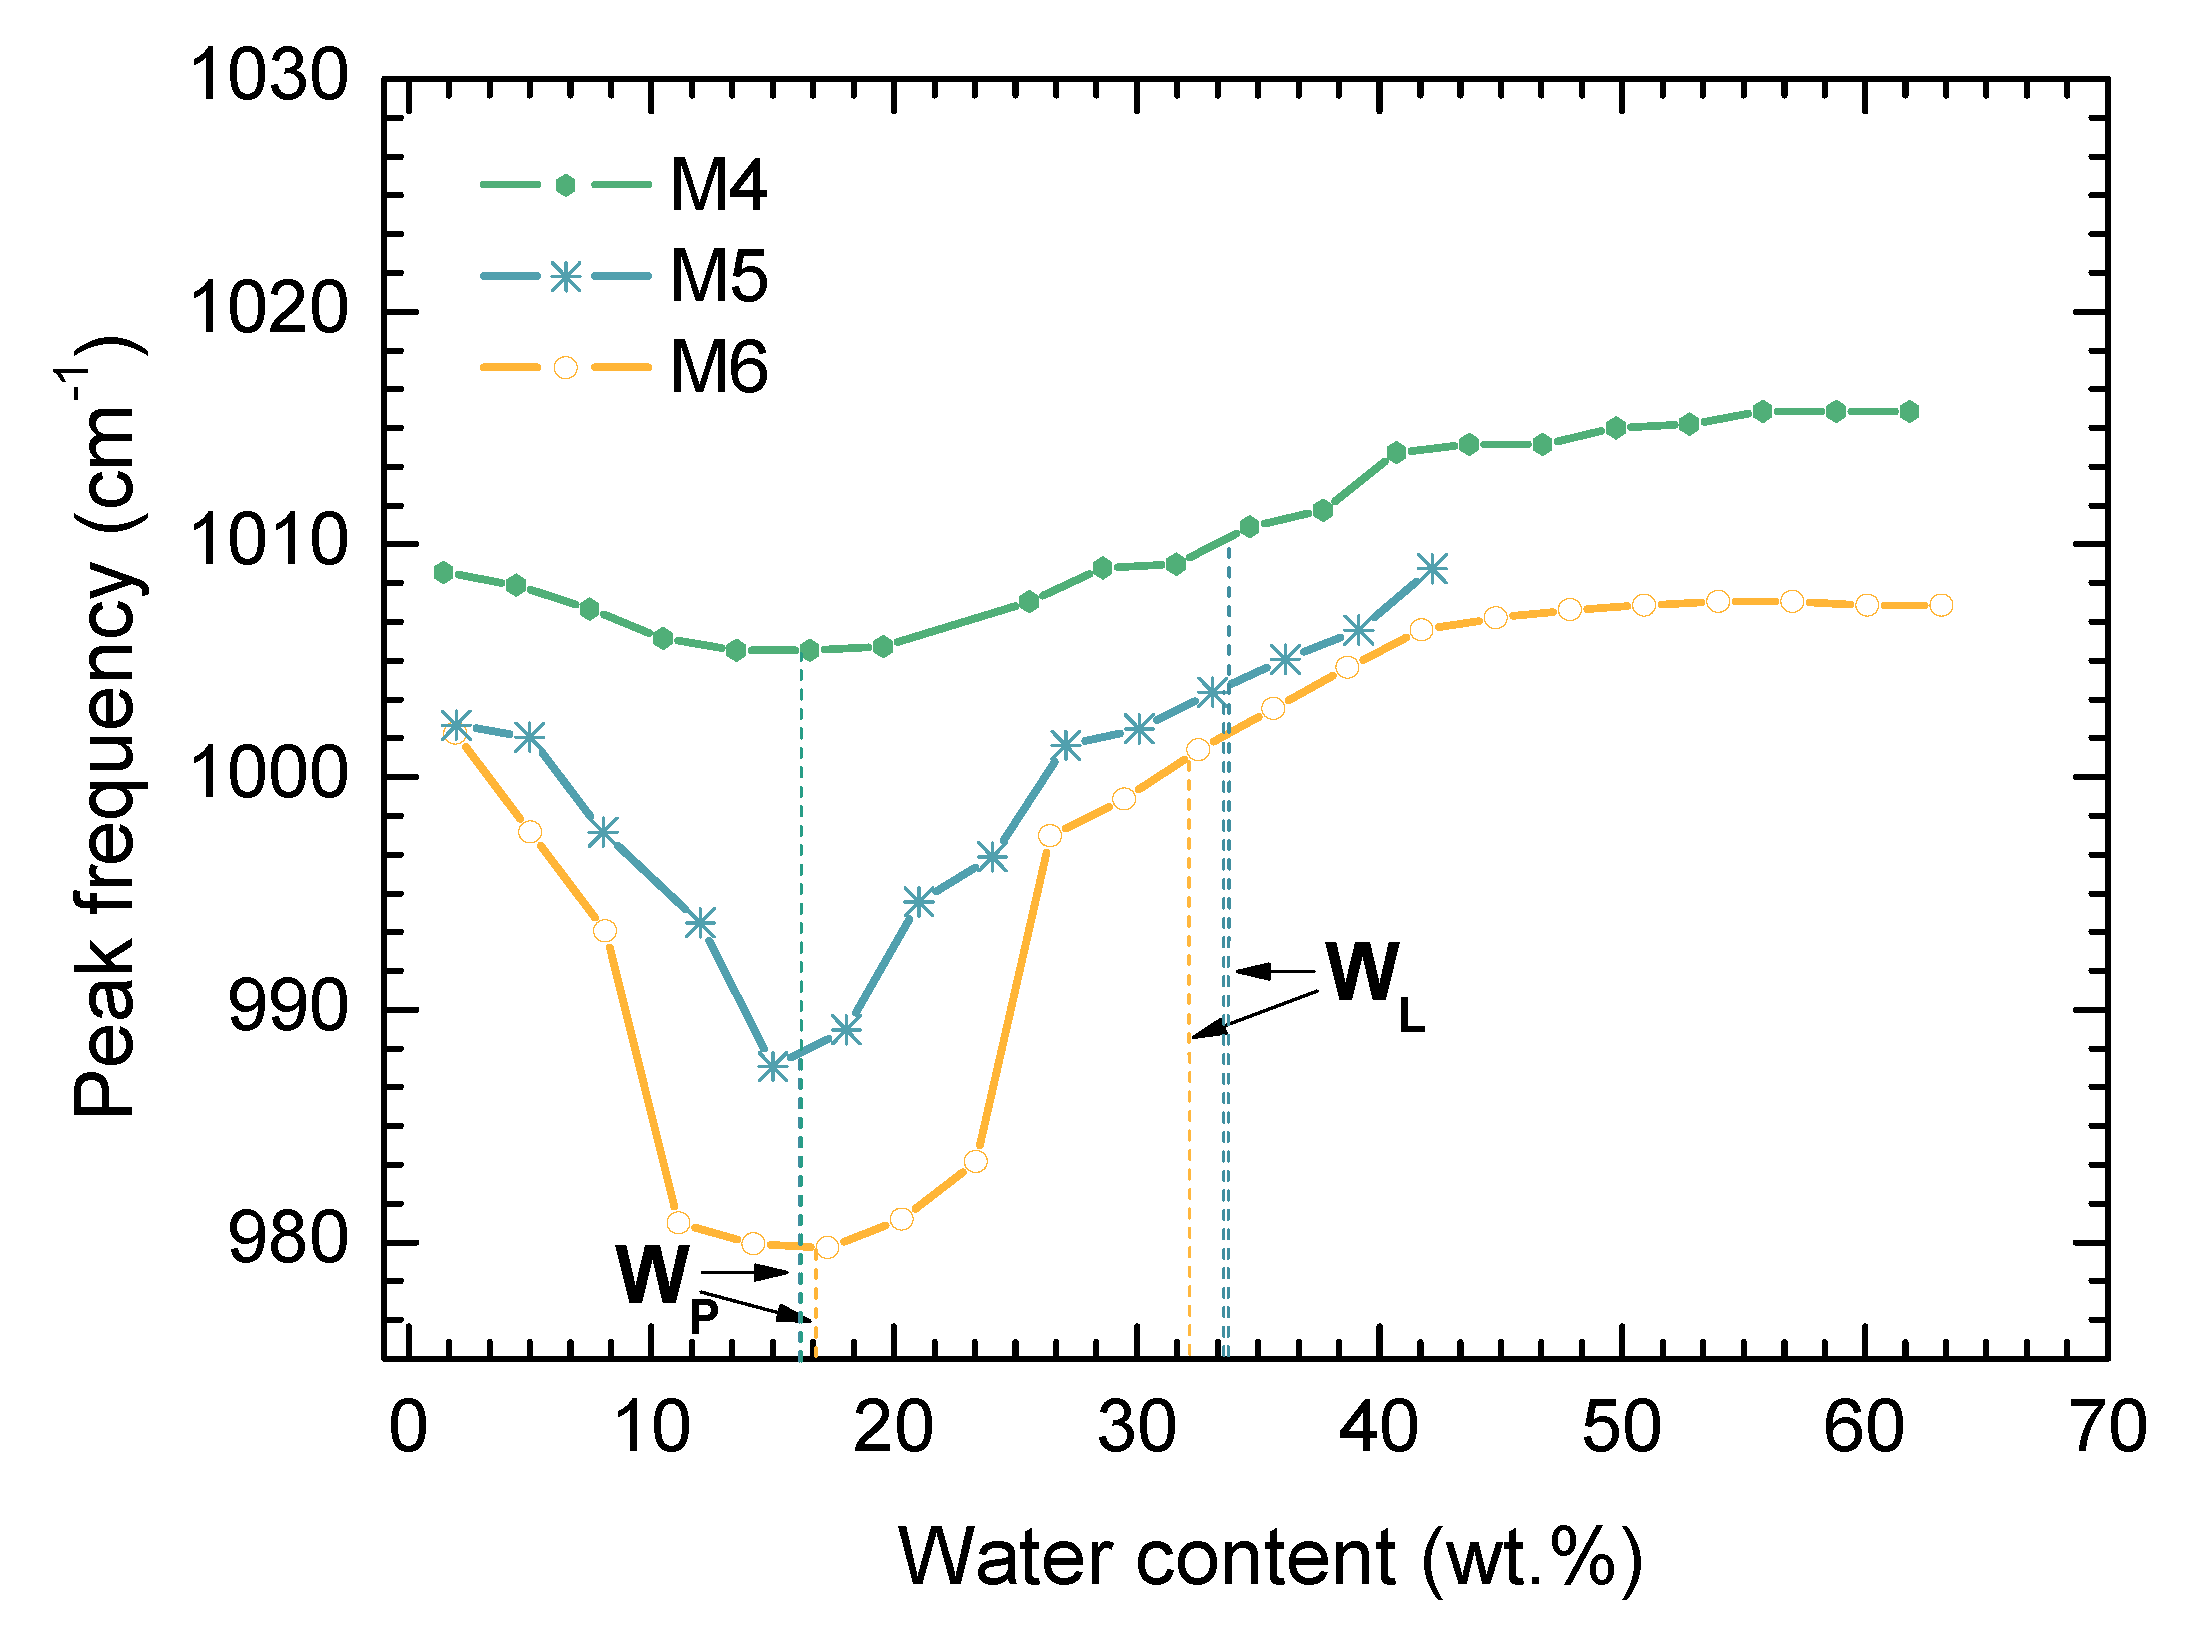
  • The value PL (WP) for analyzed samples corresponds to the minimum of wavenumber in the range of moistures 0%–40% for kaolinite, and 0%–25% for polymineral soil;
  • A characteristic slope-change position of the curve for sample M1 observed above LL (WL) agrees with the LL (WL) values obtained by standard methods. In the case of polymineral soil (M6) there are two characteristic slope changes coming from consecutive plastic-to-liquid transitions of soil components; the LL (WL) obtained with standard methods are between them;
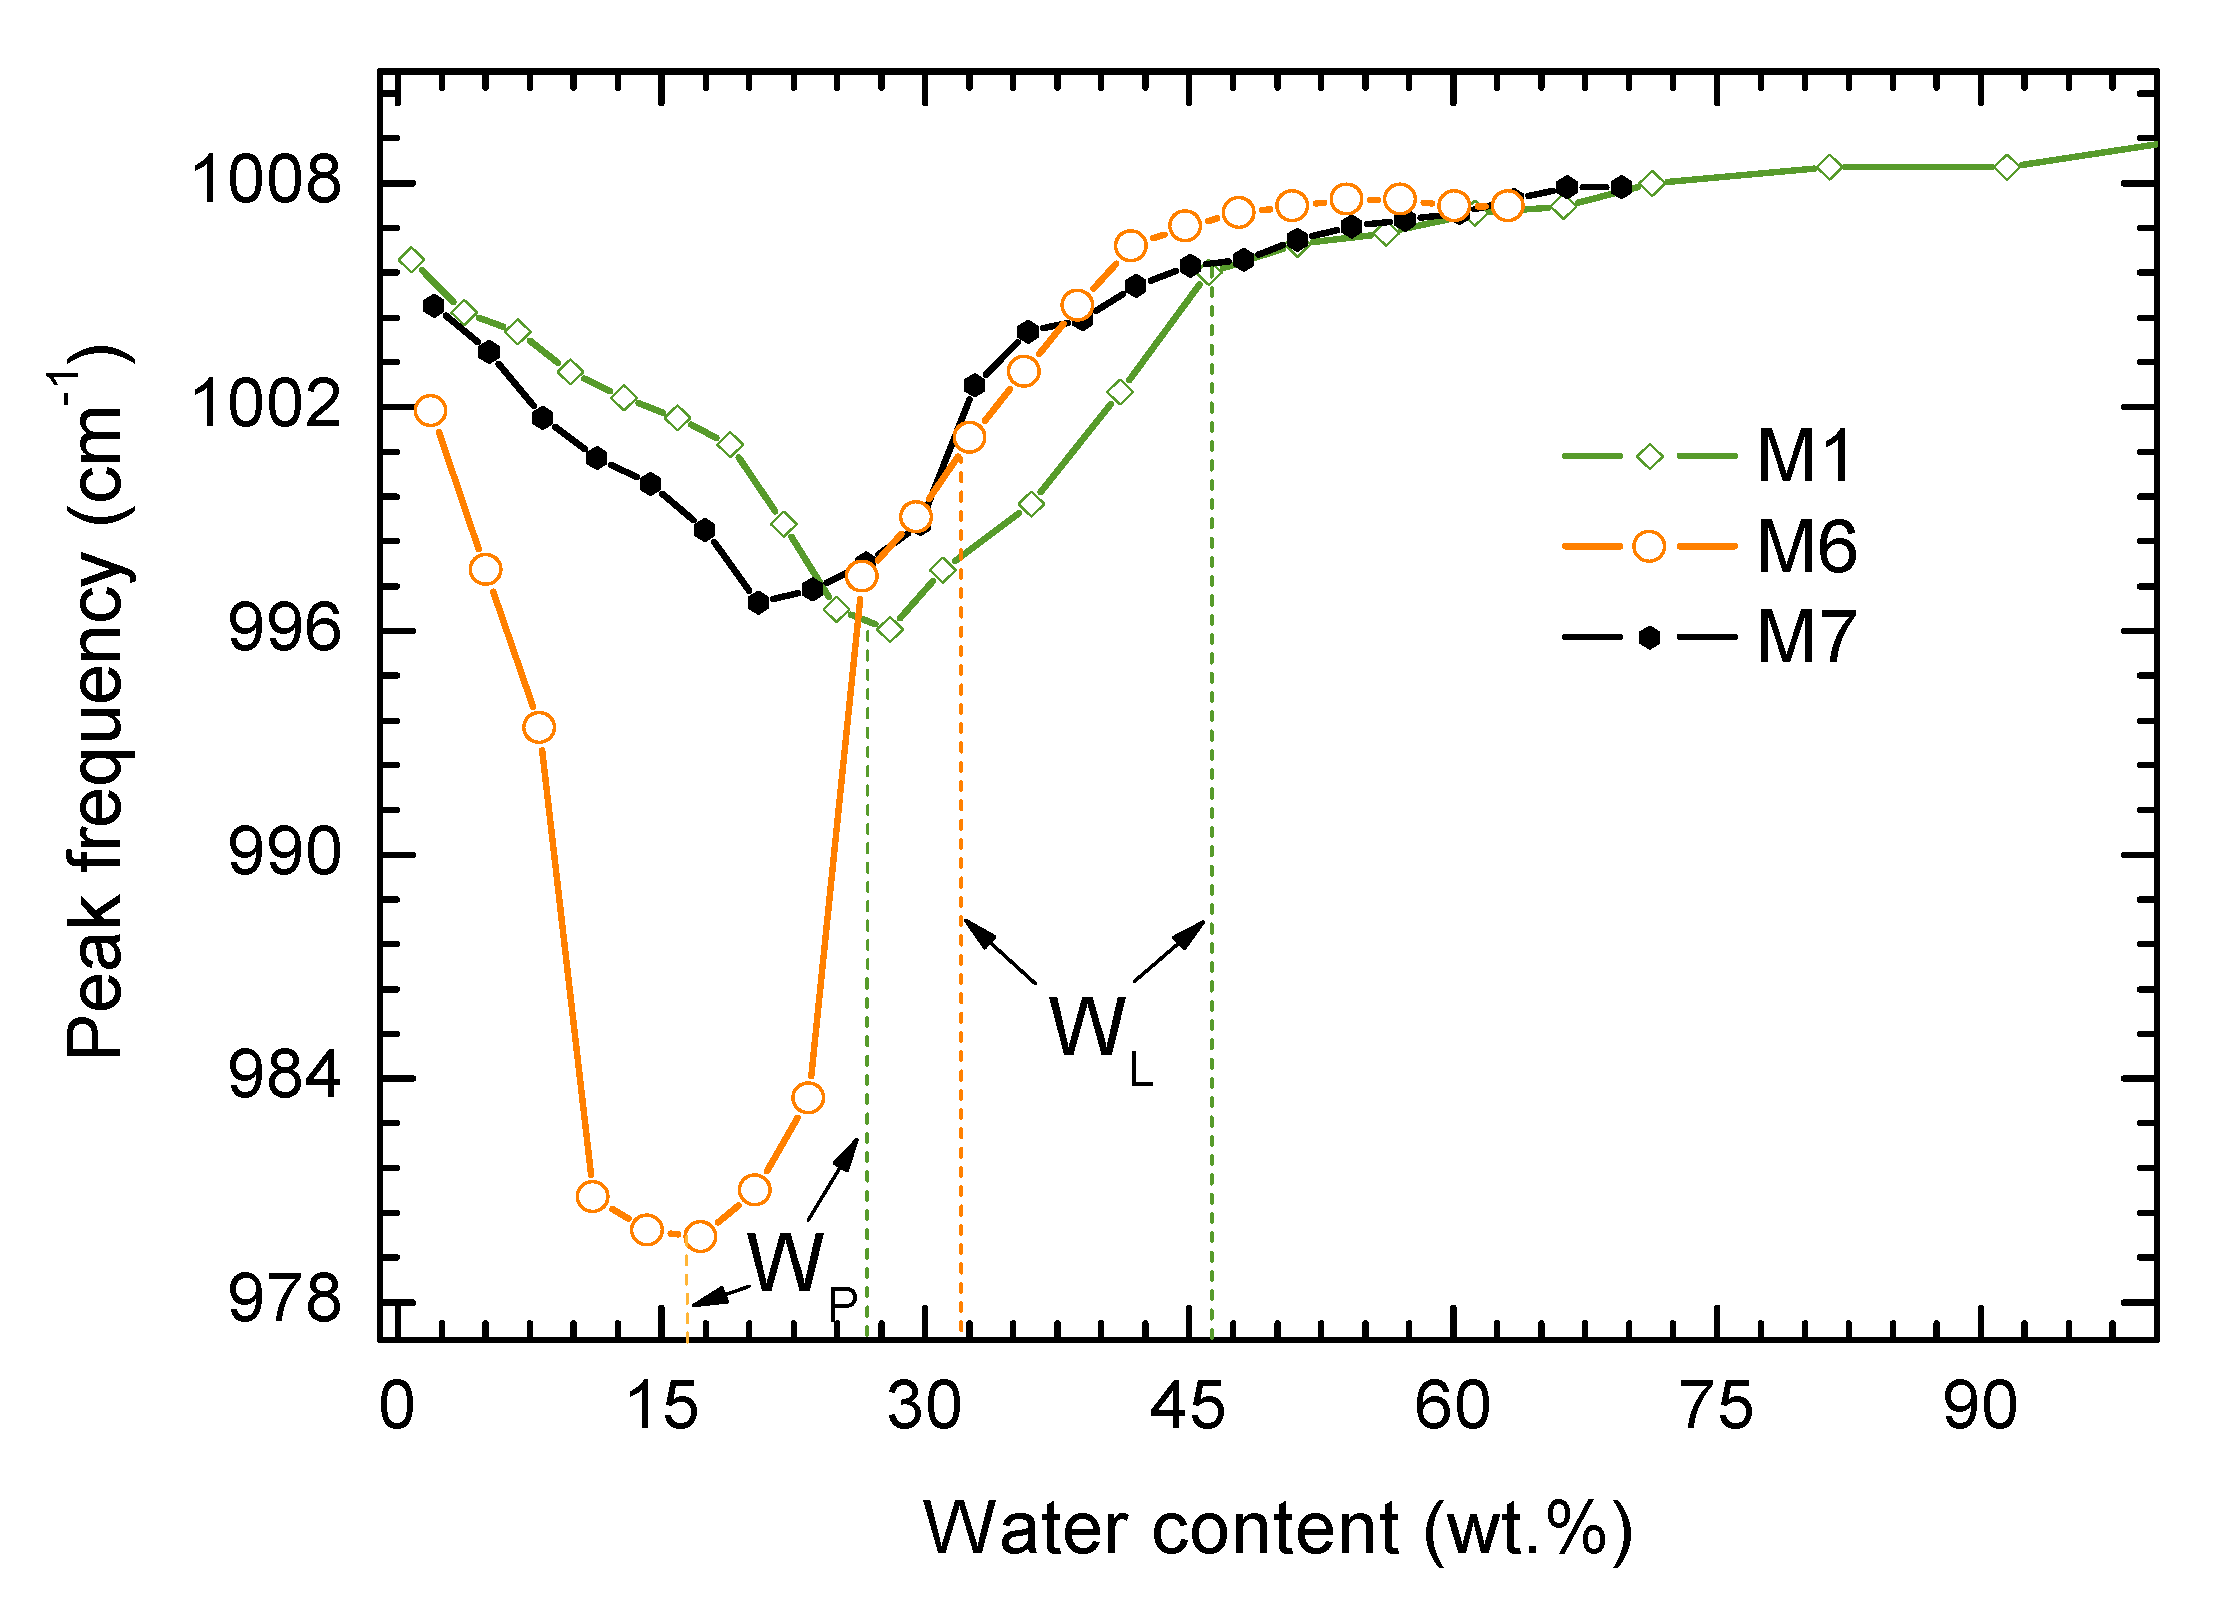
  • The form of the valley in the Si–O—moisture content curve is broader in a polymineral system comparing to a monomineral system. So the FTIR spectroscopy technique provides some measure of the complexity of the soil’s mineralogy.

4.2. Spectral Behavior of Kaolinite—Polymineral Sample Mixture

Figure 6 shows the dependence of the wavenumber of the most intensive IR spectrum line on moisture for the 1:1 mixture of kaolinite and polymineral soil (M7).
It is clear that the moistening of the kaolinite + polymineral sample mixture with the concentration of smectite from 10% to 20% leads to spectral changes typical for kaolinite. This may be due to the fact that water molecules for these concentrations of smectite are mainly wetting the surfaces of kaolinite grains by the interaction of their electric dipole and the electric charge of grain surfaces and influencing the Si–O bond strength. Increasing the moisture wetting surfaces of kaolinite grains, the water molecules start to interact with grains of other clay minerals of the sample. All the surfaces are likely covered at lower water content than ~45%. But the interaction of the water with the surface is still having a marked effect on the position of the Si–O. This makes complete sense for a soil which contains smectite.
The complex nature of the interaction of the polymineral clay soil components with water molecules leads to the conclusion made in the discussion of Figure 5: namely transitions to plastic and to liquid states take place at different moistures for different soil components. Thus, the mineral composition of a sample determines the behavior of the wavenumber of the spectral line considered in certain moisture ranges near plastic and liquid limits. Note that the conventional methods provide average values of plastic and liquid limits, whereas the method of IR spectroscopy allows fixing the start and the completion of the series of phase transitions.
The addition of kaolinite to the polymineral sample leads to the increase of moisture value at the plastic limit, and to the reduction of the mixture’s plasticity range (Figure 6).

4.3. Influence of the Smectite Concentration on the Spectral Behavior of Polymineral Soil Samples

Figure 7 shows the spectral Si–O ν absorption positions in the soils taken from: the landslide slope at the 1919th km of the Lazarevskaya–Chemitokvadzhe track section (sample M3) that contains 70% clay particles, the railway embankment at the 56th km of the Likhaya–Morozovskaya track section that contains 61% clay particles (M2), and from the Millerovo deposit that contains 35% of clay particles (M6).
The first, second, and third samples cited above have respective plasticity indexes of 58, 43 and 14. This can be related to the variation of the content of swelling smectites, whose concentration in the samples are, respectively, 42%, 5% (and 29% mixed-layer minerals containing smectite) and 22%.
Figure 8 shows the spectral Si–O ν line positions in samples M4, M5 and M6. The last two samples have similar mineralogical compositions, but differ in the concentration of minerals they contain. It is clear that the change of the concentration of clay minerals leads to considerable changes in the character of wavenumber-moisture dependence curves, while moistures at the plastic and liquid limits, according to the traditional measures, change little.
The samples M4, M5 and M6, contain 87%, 57% and 65% of non-clay particles, respectively. The data in Figure 8 show that the concentration of non-clay minerals affects significantly the absolute values of the wavenumbers of the Si–O ν line.
The obtained results prove that correlation of surface water absorbed by clay minerals and free water in the sample of soil, determined by the concentration of clay and non-clay minerals, influences essentially absolute wavenumber value.

5. Conclusions

Existing methods for the determination of soil plasticity characteristics have a number of disadvantages. In particular, the principal among them are the significant labor-intensiveness, the long time needed for measurements, and the low accuracy in determining moistures of soils at which they demonstrate plastic behavior.
In this work, we propose to use FT-MIR spectroscopy as a fundamental physically-based method allowing one to study structural characteristics of clay soils and their “phase” state, with an accuracy which is superior to previous methods, and which is also less time consuming. It is noted that the method of IR spectroscopy allows fixing the start and the completion of the series of “phase transitions” of the soil in the plastic and liquid state.
It is shown that for the monomineral kaolinite moisture, the dependence of the spectral position of the Si–O stretching band has clearly identifiable specific points at the plastic and liquid limits. Thus, near the plastic limit, the wavenumber of this line has a minimal value; further increase of moisture leads to the change of the graph’s slope steepness at the moisture value corresponding to the liquid limit.
The studies of the IR spectra of polymineral samples show that these specific points extend into intervals, where the analyzed line wavenumber varies monotonically against moisture. Plasticity indexes of the soils depend on the concentration of the smectite in their composition. The variation of the measured IR spectra wavenumber with moisture, as illustrated by the presented results, is determined by the concentration of clay particles in samples. The significant effect of the concentration of non-clay minerals on the Si–O ν line is that a moisture content curve is noticed, which may help us to predict the clay content of the soil without undertaking XRD analysis.

Author Contributions

Georgy Lazorenko performed the ATR FT-MIR and plasticity measurements; Anton Kasprzhitskii analyzed of XRD data; Antoine Khater and Victor Yavna interpreted all data; Victor Yavna wrote manuscript.

Acknowledgments

This work of G. Lazorenko is supported by the Russian Science Foundation under grant 17-79-10364 and performed in the Rostov State Transport University.

Conflicts of Interest

The authors declare no conflict of interest.

References

  1. Chen, W.F.; Baladi, G.Y. Soil Plasticity. Theory and Implementation. In Developments in Geotechnical Engineering, 1st ed.; Chen, W.F., Baladi, G.Y., Eds.; Elsevier Science: Amsterdam, The Netherlands, 1985; Volume 38, pp. 1–231. ISBN 9780444598363. [Google Scholar]
  2. Mukherjee, S. The Science of Clays, 1st ed.; Springer Science & Business Media: Dordrecht, The Netherlands, 2013; pp. 1–335. ISBN 978-94-007-6683-9. [Google Scholar]
  3. Interstate standard GOST 5180-2015. Soils. Laboratory methods for determination of physical characteristics; 1694-st; Standardinform: Moscow, Russia, 2016; pp. 1–18. [Google Scholar]
  4. ISO/TS 17892-12. Geotechnical investigation and testing. Laboratory testing of soil. Part 12: Determination of Atterberg limits; ISO: Geneva, Switzerland, 2004; pp. 1–22. [Google Scholar]
  5. ASTM D-4318-10. Standard Test Methods for Liquid Limit, Plastic Limit, and Plasticity Index of Soils; ASTM: West Conshohocken, PA, USA, 2010; pp. 1–16. [Google Scholar]
  6. Alfani, R.; Guerrini, G.L. Rheological test methods for the characterization of extrudable cement-based materials—A review. Mater. Struct. 2005, 38, 239–247. [Google Scholar] [CrossRef]
  7. Andrade, F.A.; Al-Qureshi, H.A.; Hotza, D. Measuring the plasticity of clays: A review. Appl. Clay Sci. 2011, 51, 1–7. [Google Scholar] [CrossRef]
  8. Yu, H.; Mitchell, J. Analysis of cone resistance - review of methods. J. Geotech. Geoenviron. 1998, 124, 140–149. [Google Scholar] [CrossRef]
  9. Modesto, C.O.; Bernardini, A.M. Determination of clay plasticity: Indentation method versus Pfefferkorn method. Appl. Clay Sci. 2008, 40, 15–19. [Google Scholar] [CrossRef]
  10. Gleissle, W.; Graczyk, J. Rheology and Extrudability of Ceramic Compounds. In Extrusion in Ceramics, 1st ed.; Händle, F., Ed.; Springer: Berlin, Germany, 2009; pp. 161–172. ISBN 978-3-540-27102-4. [Google Scholar]
  11. Baran, B.; Erturk, T.; Sarikaya, Y.; Alemdaloglu, T. Workability test method for metals applied to examine a workability measure (plastic limit) for clays. Appl. Clay Sci. 2001, 20, 53–63. [Google Scholar] [CrossRef]
  12. Ribeiro, M.J.; Ferreira, J.M.; Labrincha, J.A. Plastic behaviour of different ceramic pastes processed by extrusion. Ceram. Int. 2005, 31, 515–519. [Google Scholar] [CrossRef]
  13. Flores, O.J.; Andrade, F.A.; Hotza, D.; Al-Qureshi, H.A. Modeling of plasticity of clays submitted to compression test. World Acad. Sci. Eng. Technol. 2010, 61, 191–196. [Google Scholar]
  14. Haigh, S.K.; Vardanega, P.J. Fundamental basis of single-point liquid limit measurement approaches. Appl. Clay Sci. 2014, 102, 8–14. [Google Scholar] [CrossRef] [Green Version]
  15. Sivappulaiah, P.V.; Sridharan, A.; Stalin, V.K. Hydraulic conductivity of bentonite-sand mixtures. Can. Geotech. J. 2000, 37, 406–413. [Google Scholar] [CrossRef]
  16. Berilgen, S.A.; Berilgen, M.M.; Ozaydin, I.K. Compression and permeability relationships in high water content clays. Appl. Clay Sci. 2006, 31, 249–261. [Google Scholar] [CrossRef]
  17. Lawrence, W.G. Factors involved in plasticity of kaolin–water systems. J. Am. Ceram. Soc. 1958, 41, 147–150. [Google Scholar] [CrossRef]
  18. Dumbleton, M.J.; West, G. Some factors affecting the relation between the clay minerals in soils and their plasticity. Clay Miner. 1966, 6, 179–193. [Google Scholar] [CrossRef]
  19. Onoda, G.Y. Mechanism of plasticity in clay–water systems. In Science of Whitewares; Henkes, V.E., Onoda, G.Y., Carty, W.M., Eds.; American Ceramic Society: Westerville, OH, USA, 1996; pp. 79–87. ISBN 978-1-574-98011-0. [Google Scholar]
  20. Schmitz, R.M.; Schroeder, C.; Charlier, R. Chemo–mechanical interactions in clay: A correlation between clay mineralogy and Atterberg limits. Appl. Clay Sci. 2004, 26, 351–358. [Google Scholar] [CrossRef]
  21. Lagaly, G.; Dékány, I. Colloid Clay Science. In Handbook of Clay Science, 2nd ed.; Bergaya, F., Lagaly, G., Eds.; Elsevier: Amsterdam, The Netherlands, 2013; Volume 5, pp. 243–345. ISBN 9780080993713. [Google Scholar]
  22. Jepson, W.B. Kaolins: Their properties and uses. Philos. Trans. Royal Soc. A 1984, 311, 411–432. [Google Scholar] [CrossRef]
  23. Grim, R.E.; Güven, N. Bentonites, Geology, Mineralogy, Properties and Uses; Elsevier Science: Amsterdam, The Netherlands, 1978; Volume 24, pp. 1–266. ISBN 978-0444416131. [Google Scholar]
  24. Odom, I.E. Smectite clay minerals: Properties and uses. Philos. Trans. Royal Soc. A 1984, 311, 391–409. [Google Scholar] [CrossRef]
  25. Janik, L.J.; Skjemstad, J.O. Characterization and analysis of soils using mid-infrared partial least squares. II. Correlations with some laboratory data. Aust. J. Soil Res. 1995, 33, 637–650. [Google Scholar] [CrossRef]
  26. Viscarra Rossel, R.A.; Walvoort, D.J.J.; McBratney, A.B.; Janik, L.J.; Skjemstad, J.O. Visible, near infrared, mid infrared or combined diffuse reflectance spectroscopy for simultaneous assessment of various soil properties. Geoderma 2006, 131, 59–75. [Google Scholar] [CrossRef]
  27. Sorensen, L.K.; Dalsgaard, S. Determination of clay and other soil properties by near infrared spectroscopy. Soil Sci. Soc. Am. J. 2005, 69, 159–167. [Google Scholar] [CrossRef]
  28. Brown, D.J.; Shepherd, K.D.; Walsh, M.G.; Mays, M.D.; Reinsch, T.G. Global soil characterization with VNIR diffuse reflectance spectroscopy. Geoderma 2006, 132, 273–290. [Google Scholar] [CrossRef]
  29. Shepherd, K.D.; Walsh, M.G. Infrared spectroscopy—enabling an evidence-based diagnostic surveillance approach to agricultural and environmental management in developing countries. J. Near Infrared Spec. 2007, 15, 1–19. [Google Scholar] [CrossRef]
  30. Ben-Dor, E.; Banin, A. Near-infrared analysis as a rapid method to simultaneously evaluate several soil properties. Soil Sci. Soc. Am. J. 1995, 59, 364–372. [Google Scholar] [CrossRef]
  31. Kariuki, P.C.; Van der Meer, F.D.; Siderius, W. Classification of soils based on engineering indices and spectral data. Int. J. Remote Sens. 2003, 24, 2567–2574. [Google Scholar] [CrossRef]
  32. Minasny, B.; McBratney, A.B.; Tranter, G.; Murphy, B.W. Using soil knowledge for the evaluation of mid-infrared diffuse reflectance spectroscopy for predicting soil physical and mechanical properties. Eur. J. Soil Sci. 2008, 59, 960–971. [Google Scholar] [CrossRef]
  33. Kariuki, P.C.; Van Der Meer, F.; Verhoef, P.N.W. Cation exchange capacity (CEC) determination from spectroscopy. Int. J. Remote Sens. 2003, 24, 161–167. [Google Scholar] [CrossRef]
  34. Waruru, B.K.; Shepherd, K.D.; Ndegwa, G.M.; Kamoni, P.T.; Sila, A. Rapid estimation of soil engineering properties using diffuse reflectance near infrared spectroscopy. Biosyst. Eng. 2014, 121, 177–185. [Google Scholar] [CrossRef]
  35. Yan, L.; Roth, C.B.; Low, P.F. Changes in the Si−O vibrations of smectite layers accompanying the sorption of interlayer water. Langmuir 1996, 12, 4421–4429. [Google Scholar] [CrossRef]
  36. Eberl, D.D. User’s Guide to RockJock—A program for Determining Quantitative Mineralogy from Powder X-ray Diffraction Data: U.S. Geological Survey Open-File Report 2003-78; U.S. Geological Survey: Reston, VA, USA, 2003; 47p.
  37. Rietveld, H.M. A Profile Refinement Method for Nuclear and Magnetic Structures. J. Appl. Crystallogr. 1969, 2, 65–71. [Google Scholar] [CrossRef]
  38. Omotoso, O.; McCarty, D.K.; Hillier, S.; Kleeberg, R. Some successful approaches to quantitative mineral analysis as revealed by the 3rd Reynolds cup contest. Clays Clay Miner. 2006, 54, 748–760. [Google Scholar] [CrossRef]
  39. Hubbard, C.R.; Evans, E.H.; Smith, D.K. The Reference Intensity Ratio for Computer Simulated Powder Patterns. J. Appl. Cryst. 1976, 9, 169–174. [Google Scholar] [CrossRef]
  40. Hillier, S. Accurate quantitative analysis of clay and other minerals in sandstones by XRD: Comparison of a Rietveld and a reference intensity ratio (RIR) method and the importance of sample preparation. Clay Miner. 2000, 35, 291–302. [Google Scholar] [CrossRef]
  41. Osacky, M.; Geramian, M.; Ivey, D.G.; Liu, Q.; Etsell, T.H. Mineralogical and chemical composition of petrologic end members of Alberta oil sands. Fuel 2013, 113, 148–157. [Google Scholar] [CrossRef]
  42. Bristow, T.F.; Kennedy, M.J.; Morrison, K.D.; Mrofka, D.D. The influence of authigenic clay formation on the mineralogy and stable isotopic record of lacustrine carbonates. Geochim. Cosmochim. Acta 2012, 90, 64–82. [Google Scholar] [CrossRef]
  43. Wagner, J.-F. Mechanical Properties of Clays and Clay Minerals. In Handbook of Clay Science, 2nd ed.; Bergaya, F., Lagaly, G., Eds.; Elsevier: Amsterdam, The Netherlands, 2013; Volume 5, pp. 347–381. ISBN 9780080993645. [Google Scholar]
  44. Mitchell, J.K.; Soga, K. Fundamentals of Soil Behavior, 3rd ed.; John Wiley & Sons, Inc.: New York, NY, USA, 2005; pp. 1–577. ISBN 978-0-471-46302-3. [Google Scholar]
  45. Środoń, J.; Drits, V.A.; McCarty, D.K.; Hsieh, J.C.C.; Eberl, D.D. Quantitative X-ray diffraction analysis of clay-bearing rocks from random preparations. Clays Clay Miner. 2001, 49, 514–528. [Google Scholar] [CrossRef]
  46. Moore, D.M.; Reynolds, R.C., Jr. X-Ray Diffraction and the Identification and Analysis of Clay Minerals; Oxford University Press: Oxford, UK, 1989; pp. 179–201. [Google Scholar]
  47. Bailey, S.W. Nomenclature for regular interstratifications. Am. Mineral. 1982, 67, 394–398. [Google Scholar] [CrossRef]
  48. Kasprzhitskii, A.; Lazorenko, G.; Yavna, V.; Daniel, P. DFT theoretical and FT-IR spectroscopic investigations of the plasticity of clay minerals dispersions. J. Mol. Struct. 2016, 1109, 97–105. [Google Scholar] [CrossRef]
  49. Farmer, V.C. Differing effect of particle size and shape in the infrared and Raman spectra of kaolinite. Clay Miner. 1998, 33, 601–604. [Google Scholar] [CrossRef]
  50. Madejová, J.; Komadel, P. Baseline studies of the clay minerals society source clays: Infrared methods. Clays Clay Miner. 2001, 49, 410–432. [Google Scholar] [CrossRef]
  51. Petit, S.; Madejová, J. Fourier Transform Infrared Spectroscopy. In Handbook of Clay Science, 2nd ed.; Bergaya, F., Lagaly, G., Eds.; Elsevier: Amsterdam, The Netherlands, 2013; Volume 5, pp. 213–231. ISBN 9780080993713. [Google Scholar]
  52. Yavna, V.A.; Kasprzhitskii, A.S.; Lazorenko, G.I.; Kochur, A.G. Study of IR spectra of a polymineral natural association of phyllosilicate minerals. Opt. Spectrosc. 2015, 118, 529–536. [Google Scholar] [CrossRef]
  53. Schnetzer, F.; Thissen, P.; Giraudo, N.; Emmerich, K. Unraveling the Coupled Processes of (De)hydration and Structural Changes in Na+-Saturated Montmorillonite. J. Phys. Chem. C 2016, 120, 15282–15287. [Google Scholar] [CrossRef]
Figure 1. Diffractograms of bulk samples. Lines from internal standard are marked red.
Minerals 08 00184 g001
Figure 2. XRD patterns of the clay fractions of soil samples (notations: s—smectite, i—illite, k—kaolinite, i/s—illite–smectite, k/s—kaolinite–smectite, q—quartz, cl—clinoptilolite, h—halite, d—dolomite and c—calcite).
Minerals 08 00184 g002aMinerals 08 00184 g002b
Figure 3. ATR-FTIR spectra of clay soils in air-dry condition.
Minerals 08 00184 g003
Figure 4. ATR-FTIR spectra of clay soils with different water contents.
Minerals 08 00184 g004aMinerals 08 00184 g004b
Figure 5. Peak frequency shifts for the Si–O stretching band as a function of water content (moisture) of the kaolinite (M1) and polymineral soil (M6) [48].
Minerals 08 00184 g005
Figure 6. Peak frequency shifts for the Si–O stretching band as a function of water content (moisture) of the kaolinite (M1), polymineral soil (M6), and their 1:1 mixture (M7).
Minerals 08 00184 g006
Figure 7. Peak frequency shifts for the Si–O stretching band as a function of water content (moisture) of the polymineral soil samples (M2, M3 and M6) with different concentrations of smectite.
Minerals 08 00184 g007
Figure 8. Peak frequency shifts for the Si–O stretching band as a function of water content (moisture) of the polymineral soil samples (M4, M5 and M6) with different concentration of clay minerals.
Minerals 08 00184 g008
Table 1. Mineral composition and plasticity characteristics of soils.
Sample NumberNon-Clay Minerals (wt %)Σ Non-Clay Minerals (wt %)Clay Minerals (wt %)Σ Clay Minerals (wt %)Plasticity Characteristics
QuartzFeldsparAlbiteCalciteDolomiteClinoptiloliteKaoliniteIlliteIllite–Smectite MLMSmectiteKaolinite–Smectite MLMWP/PL (wt %)WL/LL (wt %)
M1 *3-----397----9726.0/28.646.3/47.7
M231-71trace-39720175126117.861.4
M318327--30208-42-7023.981.5
M44-380--87-3-10-1316.133.6
M54825-2-57810205-4316.133.4
M6 *3523--256549-22-3517.0/21.532.2/35.6
M71911--1233515-11-67--
* Ref. [48].

