Next Article in Journal
The Hydrothermal Breccia of Berglia-Glassberget, Trøndelag, Norway: Snapshot of a Triassic Earthquake
Next Article in Special Issue
Acid Rock Drainage or Not—Oxidative vs. Reductive Biofilms—A Microbial Question
Previous Article in Journal
Insights into the Surface Transformation and Electrochemical Dissolution Process of Bornite in Bioleaching
Previous Article in Special Issue
Formation of Fe- and Mg-Rich Smectite under Hyperalkaline Conditions at Narra in Palawan, the Philippines
 
 
Correction published on 22 October 2018, see Minerals 2018, 8(10), 473.
Article

Key Factors Affecting Strength Development of Steel Slag-Dredged Soil Mixtures

1
Graduate School of Engineering, Hokkaido University, 1-3 Kita 13, Nishi 8, Kita-ku, Sapporo 060-8628, Japan
2
Division of Sustainable Resources Engineering, Faculty of Engineering, Hokkaido University, 1-3 Kita 13, Nishi 8, Kita-ku, Sapporo 060-8628, Japan
3
Division of Engineering and Policy for Sustainable Environment, Faculty of Engineering, Hokkaido University, 1-3 Kita 13, Nishi 8, Kita-ku, Sapporo 060-8628, Japan
*
Author to whom correspondence should be addressed.
Minerals 2018, 8(5), 174; https://doi.org/10.3390/min8050174
Submission received: 6 February 2018 / Revised: 9 April 2018 / Accepted: 18 April 2018 / Published: 24 April 2018
(This article belongs to the Special Issue Environmental Mineralogy)

Abstract

:
Some of the steel slag from ironworks and dredged soils from marine and waterfront engineering work are partially treated as waste. However, a mixture of these two kinds of waste has the potential to be used as construction materials when mixed, due to chemical reactions forming secondary phases. Utilizing waste of such kind as a resource will help to improve sustainability in society by reducing waste and replacing virgin resources such as cement. Recently, it was reported that mixtures of steel slag and dredged soil hardens under specific conditions. The phase compositions of dredged soils and steel slags vary depending on the quantity of each component, which results in unpredictable strength development of mixtures. The effect of the variations in the components of steel slags and dredged soils on strength development of the mixtures is not yet clear, limiting the utilization of both materials. Understanding the hardening mechanisms of the mixtures will enable the prediction of strength development. Focusing on the variations in the components in steel slags and, especially of dredged soils, this study aims to identify the components in both materials that affect the secondary phase formation that are responsible for strength development. We found support for suggestions that calcium silicate hydrate, C-S-H, is one of the secondary phases responsible for the strength development of the mixtures. From a comparison of two kinds of steel slags and various dredged soils, the amount of portlandite in the steel slags and the amount of amorphous silica in the dredged soils are suggested as a couple of the key components of starting materials involved in the C-S-H formation.

1. Introduction

The effect of a partial substitution of starting materials to form cement and concrete has been widely studied as it would make it possible to decrease the environmental impact of cement production and/or improve the properties of cement and concrete. The ASTM C618 [1] defines mineral admixtures that can be used for mixing concrete, such as diatomaceous earths, opaline chert and volcanic ashes, among others, and the physical performance of construction materials made with these natural additives has been investigated to widen their applications [2,3]. Also, industrial byproducts such as fly ash and slags from metallurgy have been utilized for construction materials to reduce waste volumes [4]. Furthermore, the performance of construction materials that utilize no cement but instead employ waste soils and industrial byproducts, such as mixtures of fly ash and dredged sediments have also been investigated [5]. This increase in the diversity of starting materials for mixing hardening mixtures suggests that construction can be conducted with economically optimal materials, derived from the surrounding environment and industries that can conform to desirable physical properties.
As one potential diversification of construction materials, steel slag-dredged soil mixtures is the focus of this study. Dredged soils are derived from the excavation of soil sediments beneath ports. The physical properties of soft dredged soils are difficult to improve as it contains a large fraction of fine particles and, thus, maintains the water at content a high level. Therefore, they are treated with dumping after excavation that is costly and also produces unwanted waste. Dredged soils are generated in Japan as well as in other countries where there is an inflow of water currents transporting soils that settle on sea floors and riverbeds [6]. Furthermore, the yield of the eroding soil particles is reported to be getting greater due to increases in the rate of soil erosion as a result of intensive agriculture and global warming [7]. The wider use of soil sediments would reduce the dumping of such materials in landfills and would enable the substitution of resources that would otherwise be excavated on land. Steel slag is one byproduct from ironworks that has the ability to be alkali-activated. Although the utilization of steel slags has been investigated to increase volumes that are used [4,8] it is still difficult to utilize all steel slags that are produced. Recently, the utilization of dredged soils by modifying their physical properties with addition of alkaline activators has been investigated [5,9,10,11]. Improvements in the physical properties of dredged soils by mixing with steel slags would enhance the application in undersea construction by utilizing them in constructions, such as reclamation and tideland. Simultaneously, it would replace cement utilized for ordinary undersea construction, which would contribute to reductions in the CO2 emissions and use of energy, as steel slag-dredged soil mixtures do not need preparatory calcination.
The mixtures made with various dredged soils and steel slags show differences in strength development, inhibiting the utilization of the steel slag-dredged soil mixtures in many engineering fields. It is because the hardening mechanisms, namely responsible components in the starting materials for the strength development and the secondary phase formation that is responsible for changes in physical properties, are both not immediately evident. Portlandite, Ca(OH)2, in steel slags and soluble silica from dredged soils have been proposed to be the key components for the strength development because calcium silicate hydrate (C-S-H) is thought to be the cause of strength development [10]. Confirming C-S-H formation and identifying factors that affect the formation of C-S-H would provide a methodology to predict its formation quantitatively, by analyzing the content of the critical mineralogical phases in the starting materials. Also, the effects of components such as humic acid in dredged soils are known to limit the strength development of cementitious materials [11,12]. Considering these factors, the objective of this study is to identify the key components affecting strength development, i.e., the formation of C-S-H, in steel slag-dredged soil mixtures. After determining the components that affect secondary phase formation, interaction of dredged soils with steel slags is simulated using geochemical modeling to provide insights into the possibility to predict the amounts of C-S-H needed to achieve specified strength development.

2. Materials and Methods

2.1. Materials

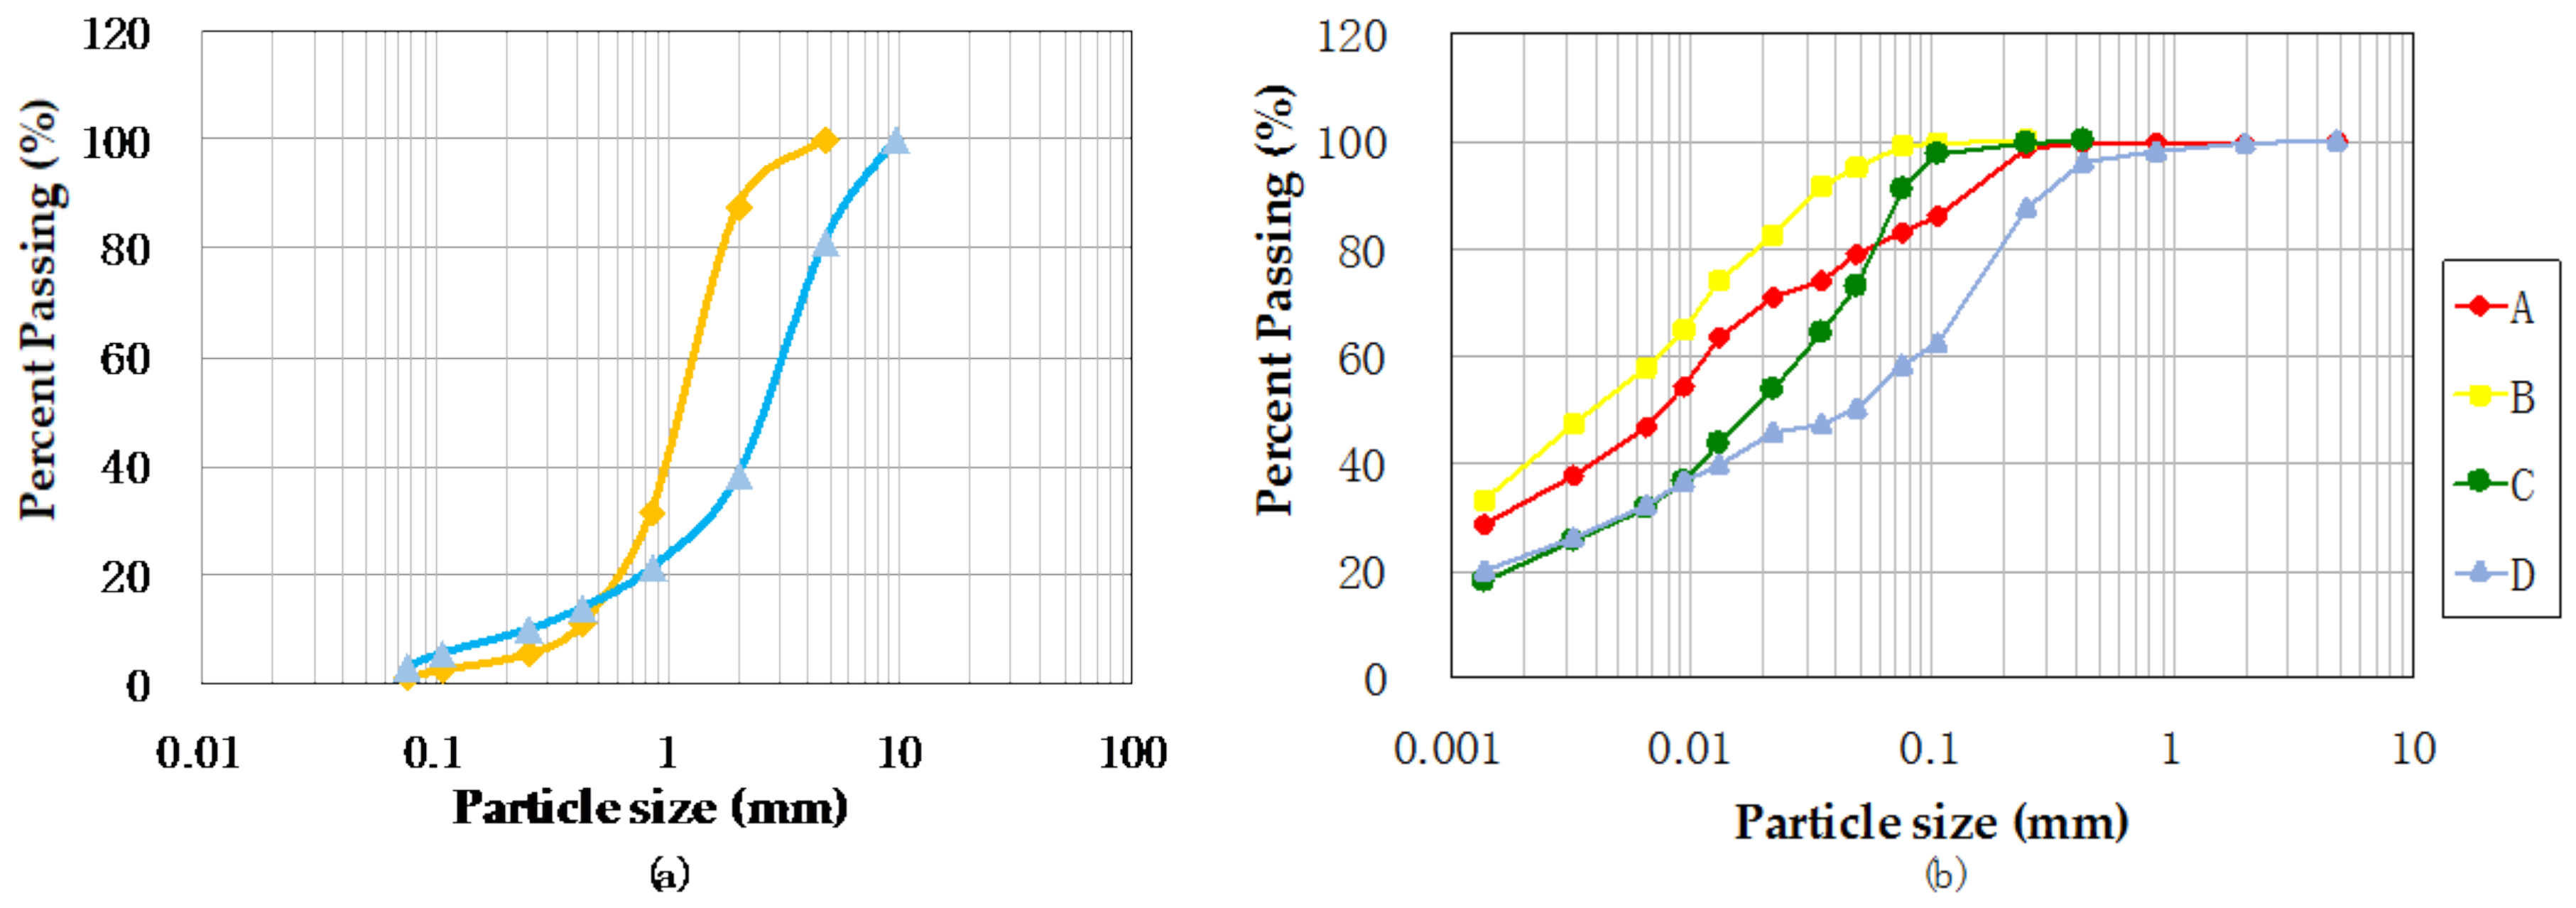
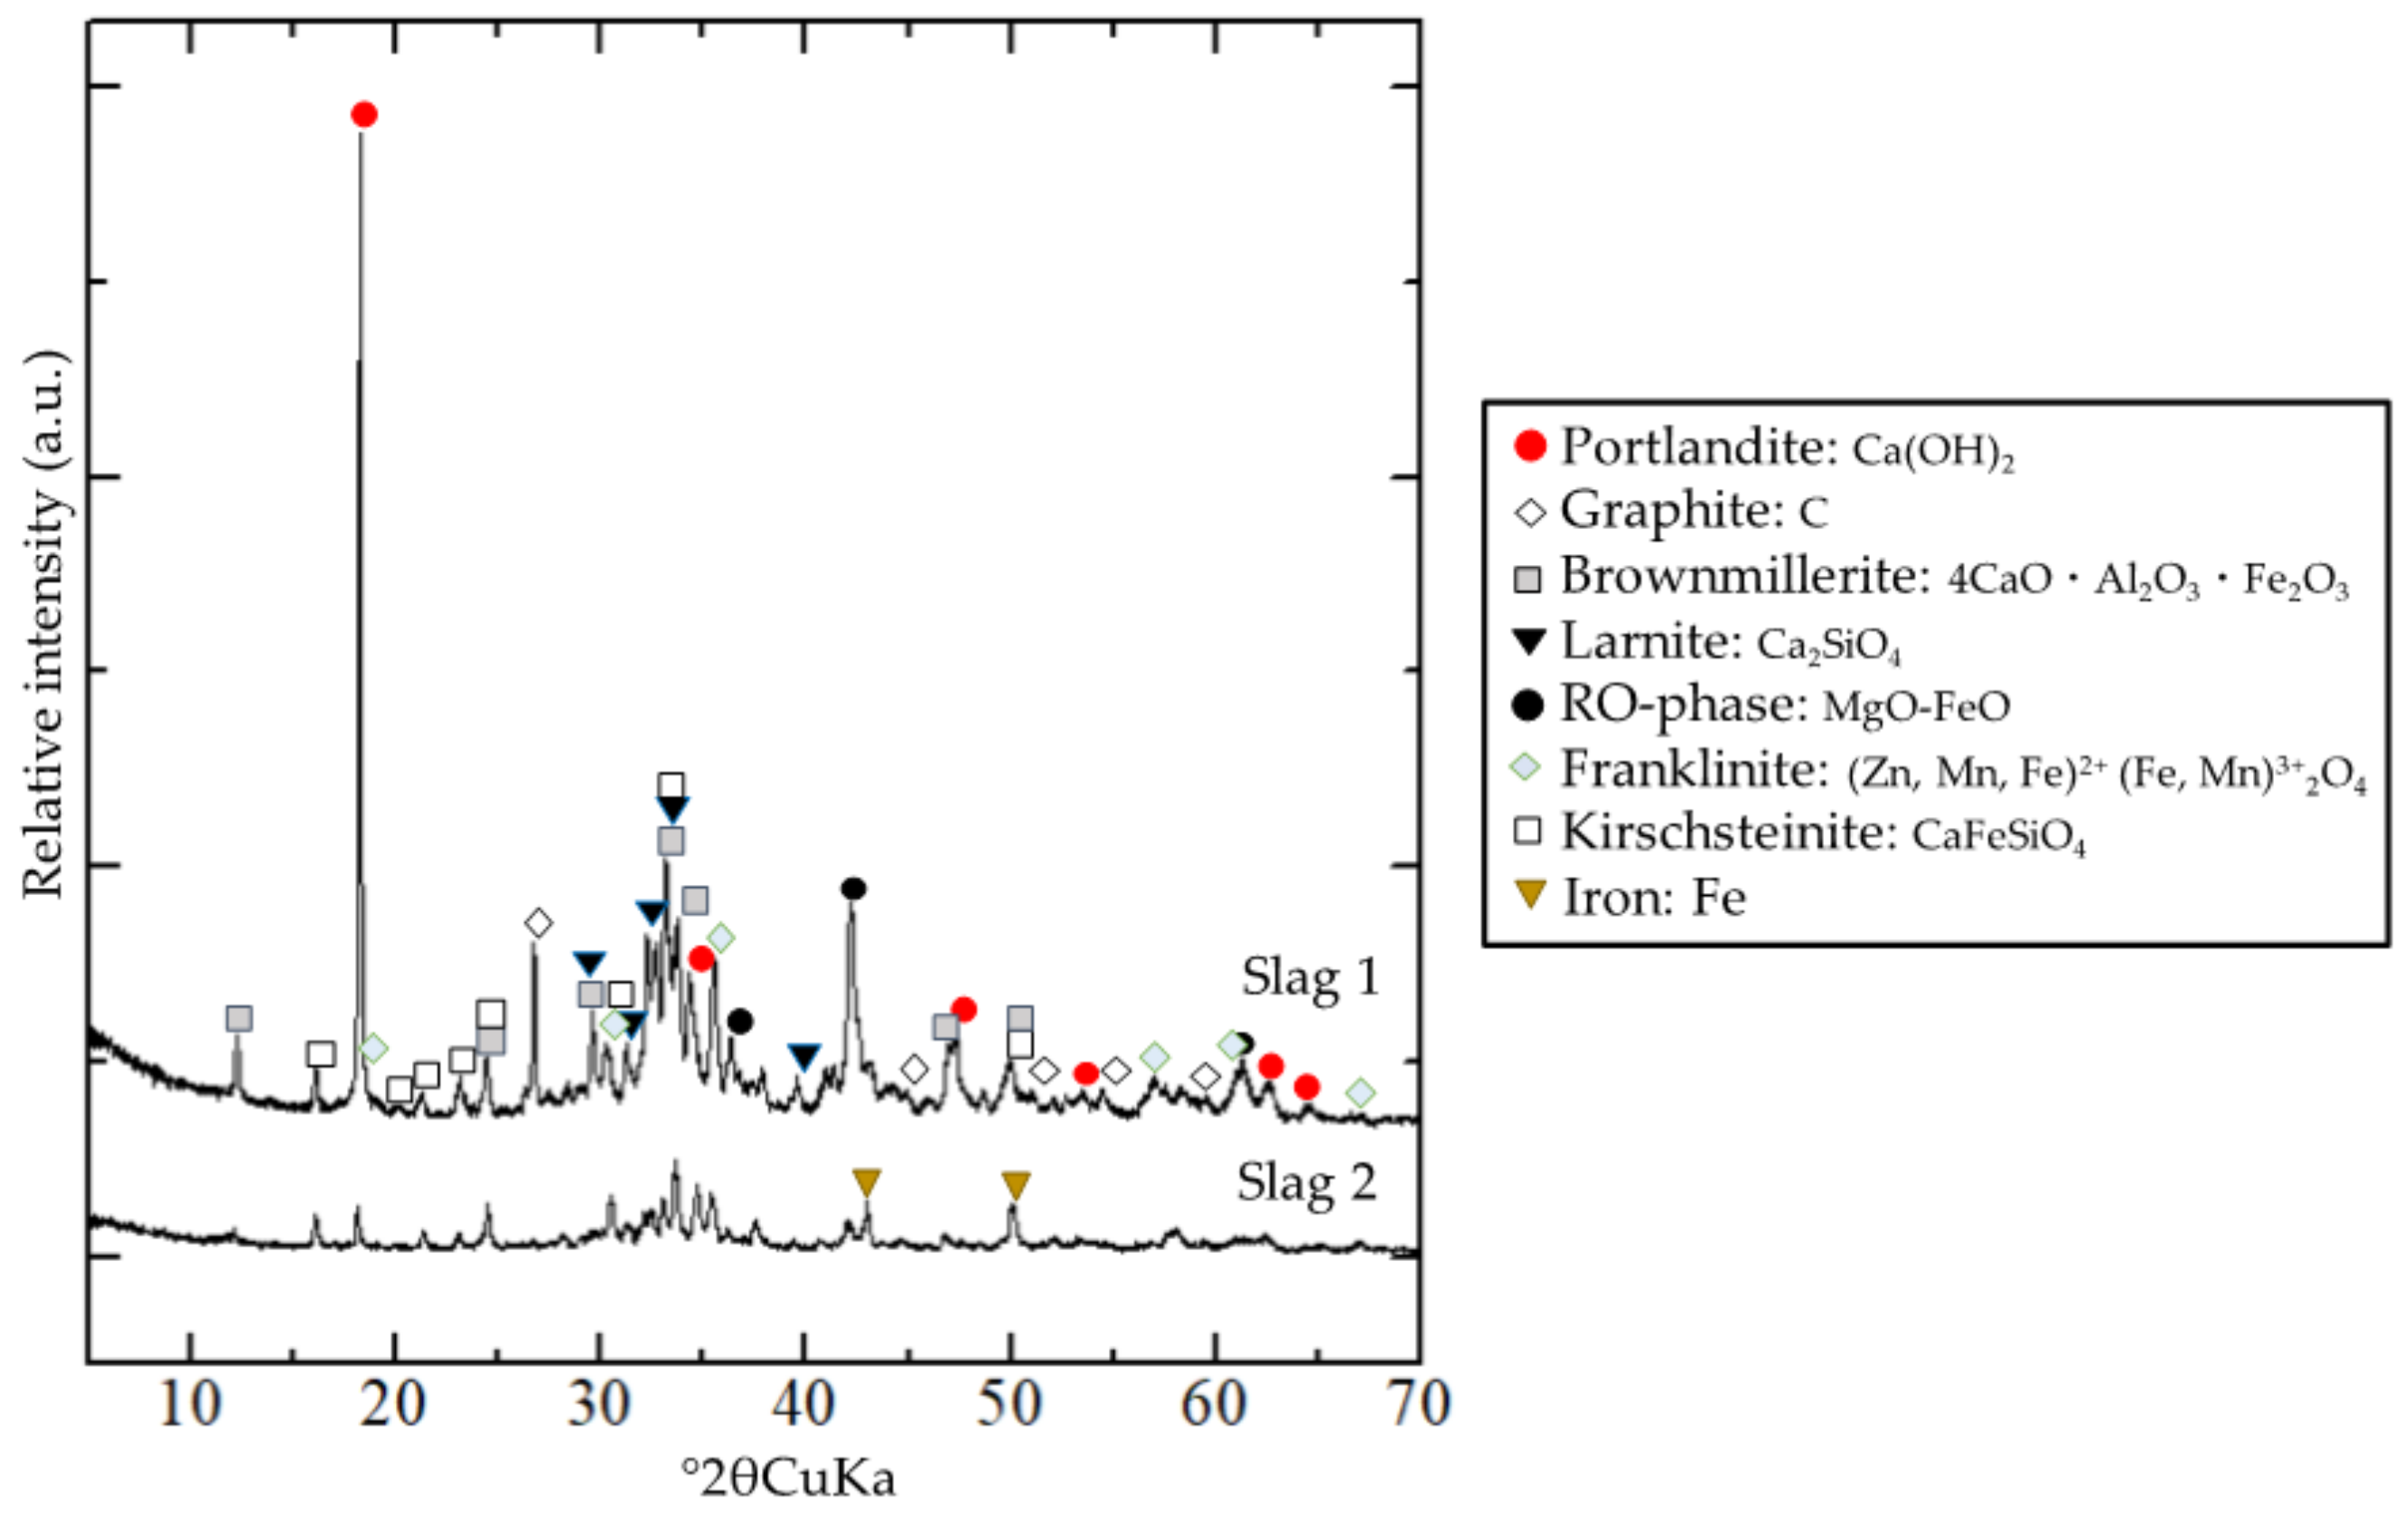
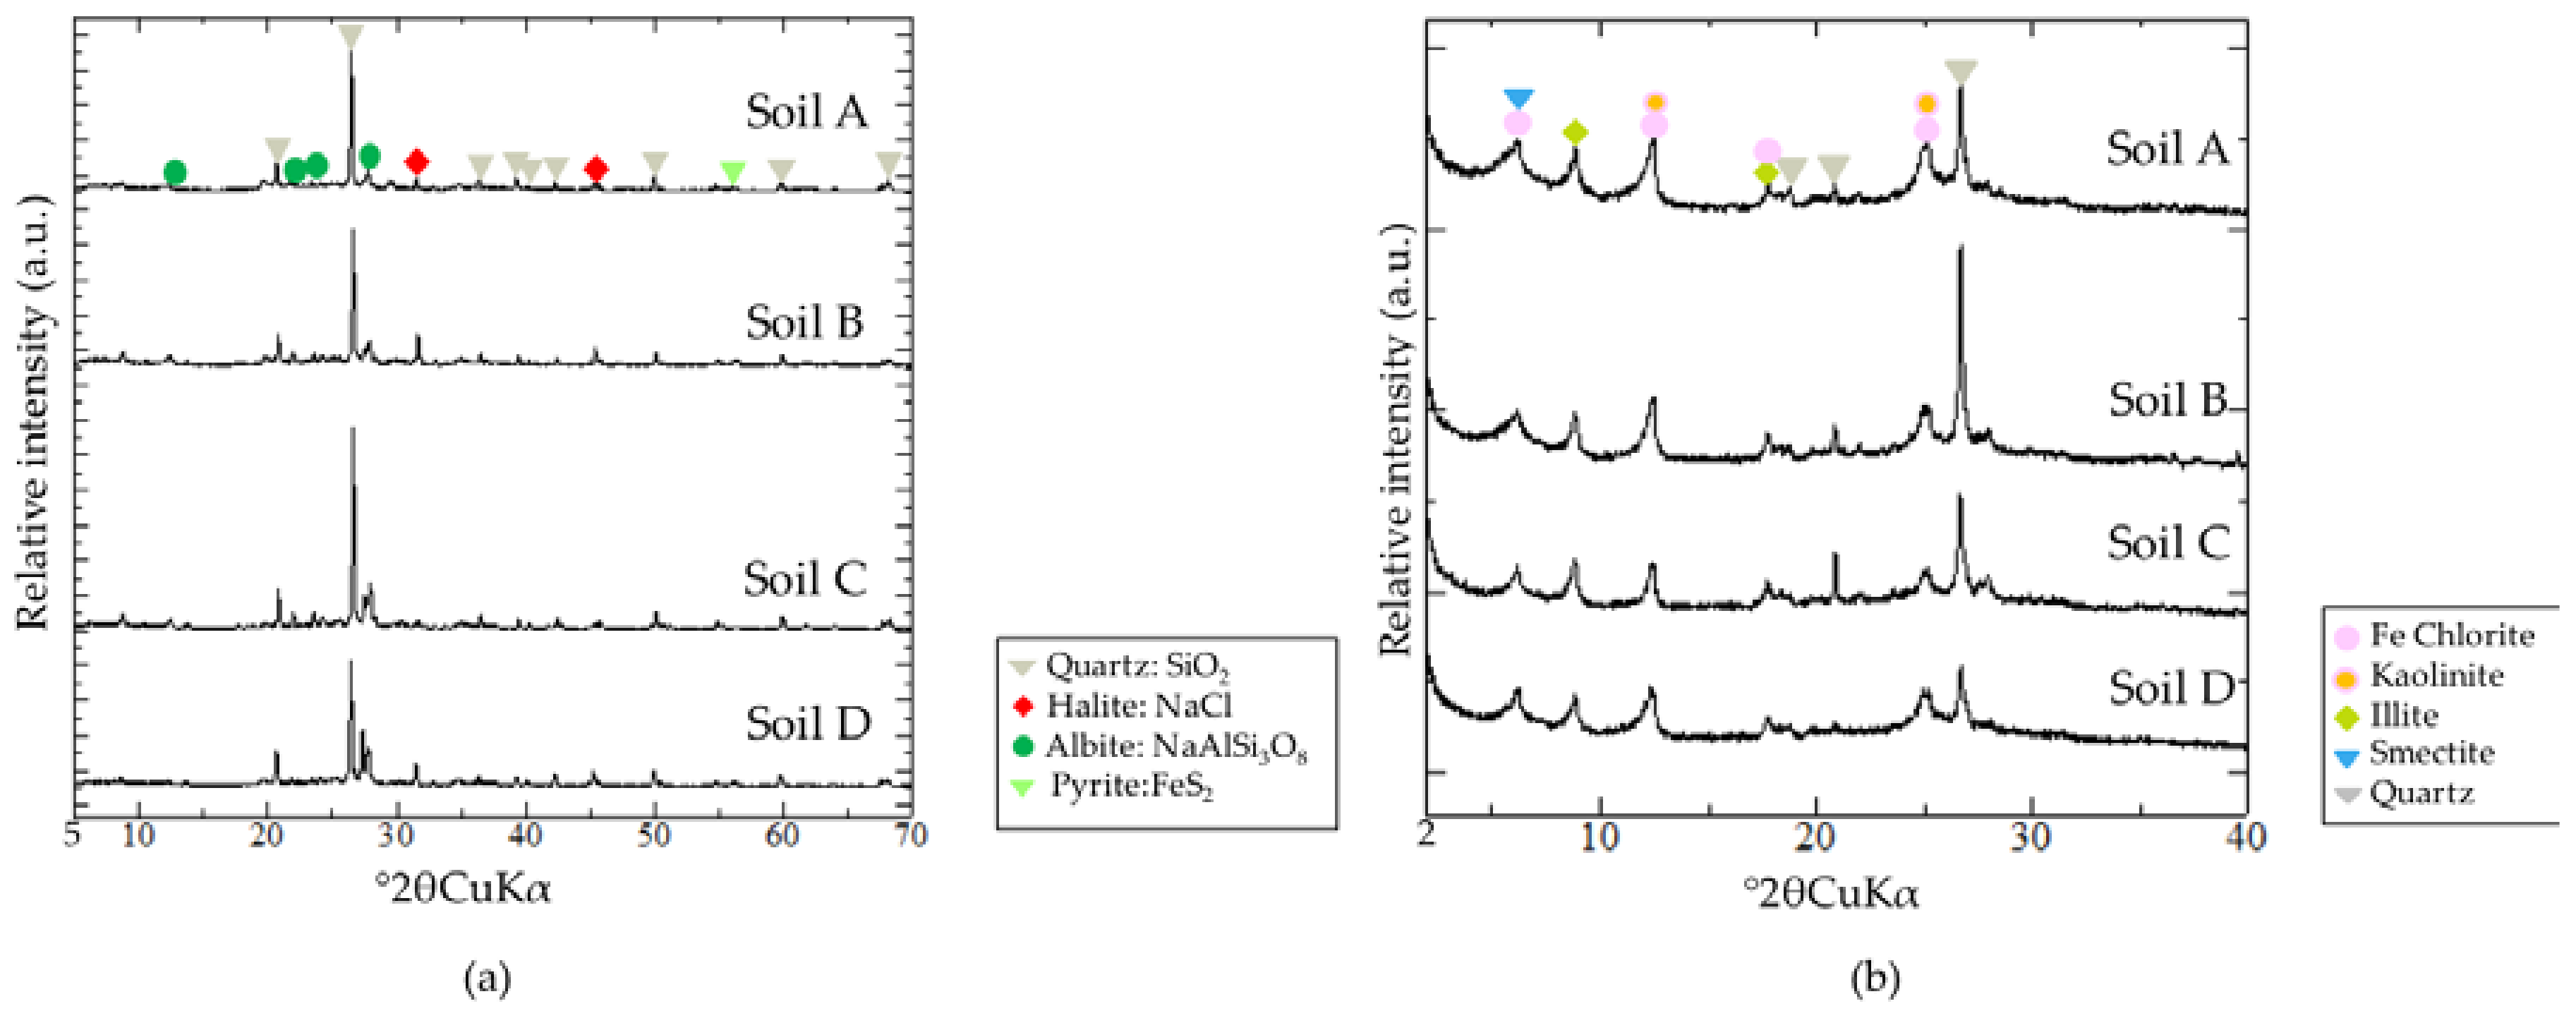
2.1.1. Steel Slags and Dredged Soils

The dredged soils used in this study were collected from various bays in Japan, hereafter named soils A, B, C, and D. The physical properties of the dredged soils are detailed in Table 1. Humic acid was extracted from the dredged soils to quantify the content by the methodology described by Fukushima et al., (2009) [13]. The extracted samples of humic acid were purified by dialysis and freeze dried to quantify the content. Purified humic acid content was highest in soil D (0.30%) followed by B (0.20%), C (0.14%) and A (0.09%).
Steel slags were obtained from two ironworks in Japan and are hereafter named slag 1 and slag 2. The densities of slag 1 and slag 2 in surface-dry condition are 3.5 g/cm3 and 3.8 g/cm3, respectively. Particle size distributions of the steel slags and the dredged soils are shown in Figure 1a,b.

2.1.2. Preparation of Steel Slag-Dredged Soil Mixtures

The steel slags were used in air-dried condition to make the experimental mixtures. Particles larger than 4.75 mm in the dredged soils such as marine shells were removed by sieving to eliminate inhomogeneities in the matrix of the mixtures for the measurement of strength. The water content was set to 1.5 times of the respective soil liquid limits (Table 1) by adding artificial seawater. This conditioning creates the soil slurries of a broadly similar consistency range.
The mixtures for measuring the strength development were made by mixing both steel slags with the four soils. The mixtures made with slag 1 and soils A, B, C, and D are termed 1A, 1B, 1C, and 1D, respectively, and the mixtures with slag 2 and soils A, B, C, and D are termed 2A, 2B, 2C, and 2D, respectively. The steel slag-dredged soil mixtures for all analyses were prepared under the same conditions as the mixtures that were used for measuring strength development. The mixing ratio of steel slag to dredged soil was set to 3:7 by volume. As the dredged soils and the resulting mixtures were all saturated with water, the necessary weights of the surface-dried slag particles and saturated clay required for blending were calculated from the properties and the water content reported above. The measured bulk density of the mixture specimens was 97–100% of the theoretical values, indicating that very little air was entrapped in the process. The mixtures were thoroughly mixed with electrical mixer for about 5 min. The specimens for the strength tests were prepared by filling cylindrical plastic molds with a height of 100 mm and 50 mm in diameter. The mixtures to be used for cross sectional observations were prepared in a smaller container made of PVC. When filling the molds, the mixtures were tapped to eliminate inclusions of air bubbles. The mixtures were cured hermetically in a plastic container at 25 °C under high humidity until testing. The pre- and post-curing weights of the specimens did not exhibit any statistically significant decreases in moisture content.
The specimens were cured for up to 91 days, and the mixtures at different curing times were selected for subsequent observations and analyses.

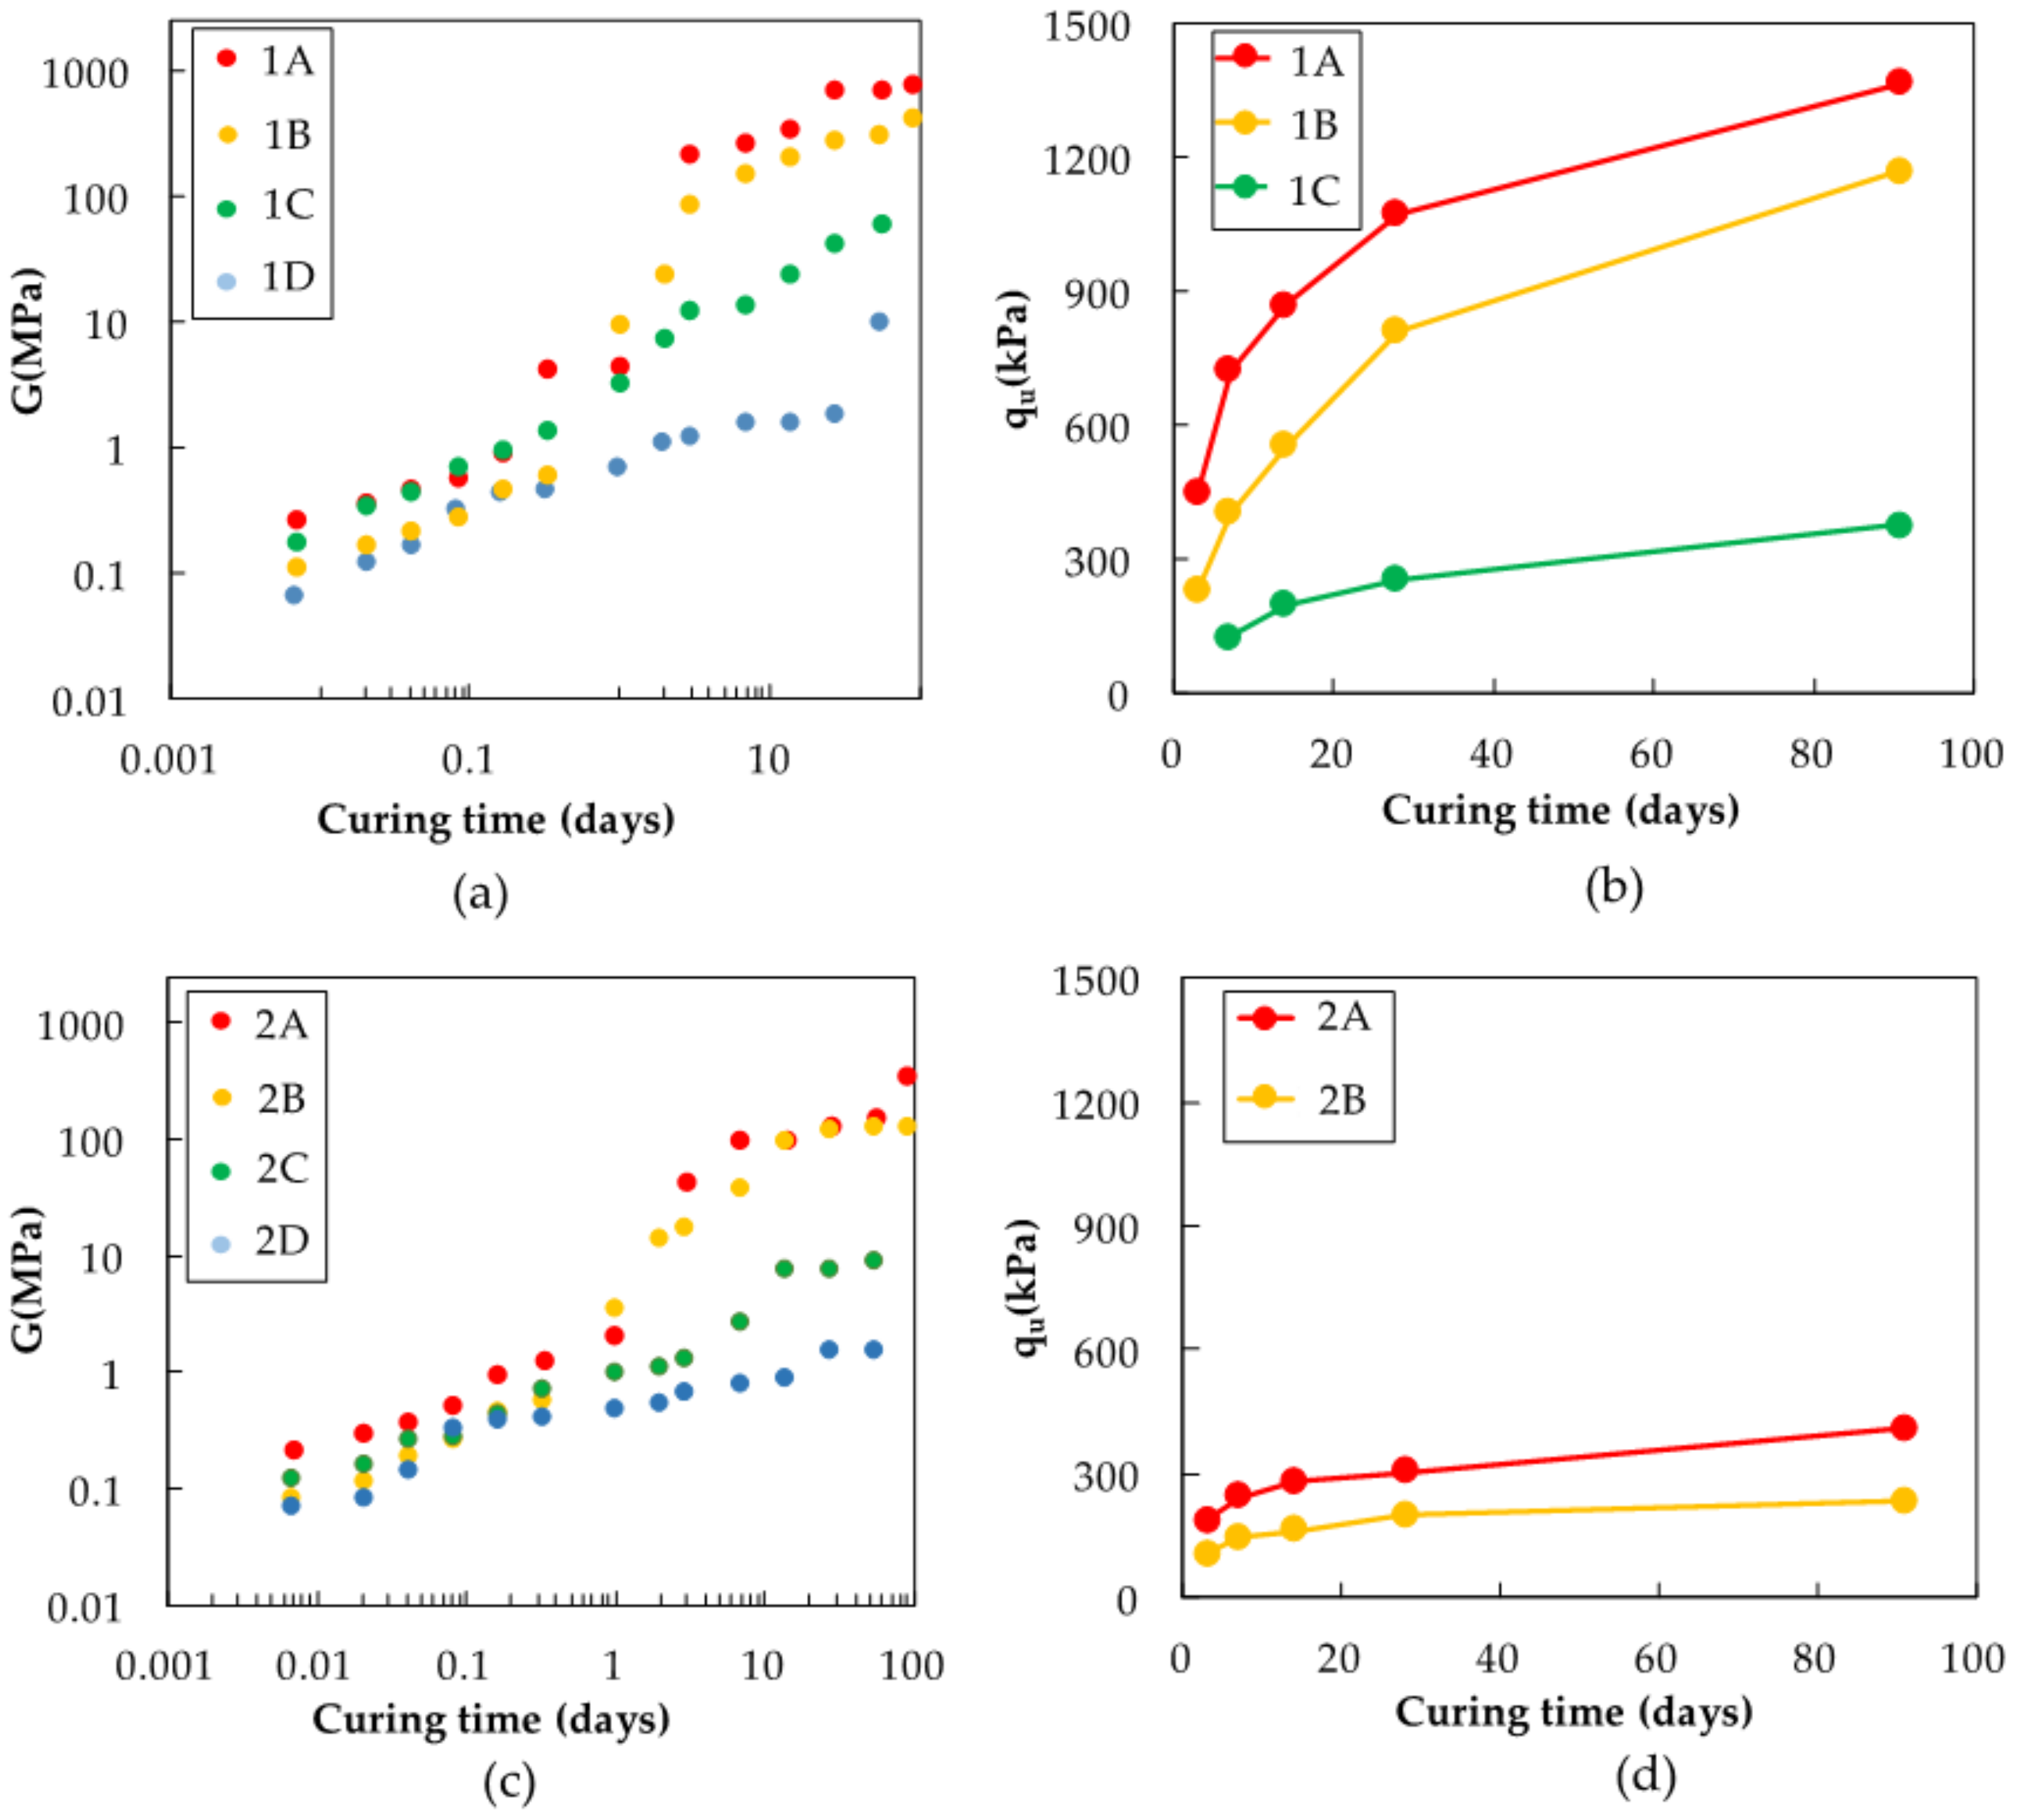
2.1.3. Physical Descriptions of Steel Slag-Dredged Soil Mixtures

The measurement of the unconfined compressive strength (qu) was conducted for mixtures cured from 3 to 91 days, and the measurements of the shear modulus (G) were made for mixtures cured from 1 h to 91 days. The strength at early curing ages, i.e., 1 h to 3 days, which was too low to be measured by the conventional compression test, was also measured by a high-accuracy direct shear apparatus (see [14], for details). The shear modulus of 1A, 1B, 1C, 1D, 2A, 2B, 2C, and 2D were measured non-destructively in previous studies as an indicator for the physical strength at the early stage of curing, as it is known that the shear modulus and uniaxial compressive strength are positively correlated in steel slag-dredged soil mixtures [15]. The modulus was calculated based on the mass density of the specimens and the shear wave velocity travelling between a pair of piezoelectric bender elements, which work as transmitter and receiver. Between 3 and 91 days of curing, the order of the magnitude of the relative strength of mixtures remained unchanged, for slag 1, the 1A showed the highest strength values followed by 1B, 1C, and 1D, and for slag 2 the 2A mixture had the highest values followed by 2B. The unconfined strength of mixtures made with slag 1 was much higher than those made with slag 2. The shear modulus indicated the significant increase of G at 3 days of curing especially in 1A and 1B and each values of G at 3 days of curing was 209.0, 84.1, 12.1, and 1.20 MPa for mixtures 1A, 1B, 1C and 1D, respectively (Figure 2). Therefore, investigation of the steel slag-dredged soil interaction at the early stage, namely at 3 days of curing, would provide information to determine the main reaction controlling the strength development.

2.2. Methods

2.2.1. Characterization of Starting Materials

The mineralogical composition of the steel slags and dredged soils was measured using randomly oriented samples by powder X-ray diffraction analysis (XRD; Multiflex Diffractometer, Rigaku, Tokyo, Japan) operating at 30 kV and 20 mA, equipped with a Cu target. Steel slags and dredged soils were ground and pulverized, and powders with diameter of below 53 μm were used for the measurements.
Detailed characterization which covers various phases from minerals and clay minerals to amorphous phases was made for the dredged soils. The clay minerals in the dredged soils were identified with XRD (RINT2100, Rigaku, Tokyo, Japan) by the preferred orientation method. The dredged soil samples were washed with 10% H2O2 to remove the organic matter and 1 N HCl to remove carbonates that may interfere with the settlement of the clay sheets on the slide glass. After the treatment, suspended solutions were washed with deionized water to suppress the aggregation of clay particles. Particles with sizes below 2 μm were separated using a centrifuge and suspended clay particles were pipetted on slide glass and dried overnight to let clay minerals settle in the same orientation. After the first XRD measurement, ethylene glycol saturation was performed on the oriented samples to check for the existence of expandable clay minerals.
To observe the amorphous components in the dredged soils that were unidentifiable by XRD, optical microscope observations of the soil particles were made with transmitted light. After removal of organic matter and carbonates from 1 g of samples of dried dredged soils and dispersal in 50 mL of distilled water, 0.2 mL of the suspended solution was pipetted onto cover glass and heated until dry. Next, one drop of mountmedia (Wako Pure Chemical Industries, Osaka, Japan) was applied and the sample was covered by slide glass to seal the samples for subsequent observations.
Selective dissolution experiments were conducted to quantify the amorphous biogenic silica and inorganic amorphous silica, following established methodologies [16,17]. The dredged soils were dried to equalize the soil particle quantities applied to dissolution experiments. For the amorphous biogenic silica extraction, ground and dried soil particles were treated with 2 M Na2CO3 with solid to a liquid ratio (S/L) of 50 mg/40 mL and heated at 85 °C for 5 h. For the inorganic amorphous silica extraction, 0.5 M NaOH was added to the soil particles at an S/L ratio of 50 mg/50 mL and heated at 100 °C for 2.5 min. The dissolved Si concentration in the obtained supernatant was measured by an inductively coupled plasma atomic emission spectroscopy (ICP-AES; ICPE-9000, Shimadzu, Kyoto, Japan).

2.2.2. Analyses of Steel Slag-Dredged Soil Mixtures

The 3, 7, 28, and 91 day cured mixtures of all combinations of mixtures were freeze-dried to stop the hydration. The dried specimens were ground and pulverized to collect particle size of under 53 μm for detecting changes in the mineralogical phases by XRD. For comparisons of the phase transitions from before curing, “0-day cured mixtures” were prepared by mixing pulverized, dry slag powder and dry soil powder under 53 μm. The mixing ratio was determined such that the weight/volume ratio of two solids, i.e., slag and clay particles, became identical to the specimens described in Section 2.1. The mixtures were prepared for optical microscope (OM) and scanning electron microscope (SEM; SUPERSCAN SSX500, Shimadzu, Kyoto, Japan) analysis to observe the formation of secondary phases. Mixtures 1A and 1D at 3 days of curing were analyzed, as they display most significant variance in the strength development. The 3 day cured mixtures were freeze dried and suspended in epoxy resin to preserve the structure of the mixture matrices. Cross sections of the resinated mixtures were polished to observe the formation of secondary phases.

2.2.3. Analyses of the Solution Chemistry of Pore Water

The pH changes of the pore water of mixtures 1A, 1B, 1C, and 1D from 0 to 91 days and of mixture 2A from 0 to 14 days were measured directly with a pH meter employing pH probe (Hanna Instruments-1053B, Hanna Instruments, Woonsocket, RI, USA) that was an electrode for semi-solids and soils. Pore water from mixtures 1A, 1B, 1C and 1D after 3 days of curing were extracted by compression and they were filtered by membrane filter with pore diameter of 0.2 μm. The Ca concentration of the pore water samples were measured by ICP-AES. The dissolved Si concentration of the pore water in the dredged soils was measured by an Ultraviolet-Visible Absorption Spectroscope (UV-VIS; V-550, JASCO Corporation, Tokyo, Japan).

3. Results

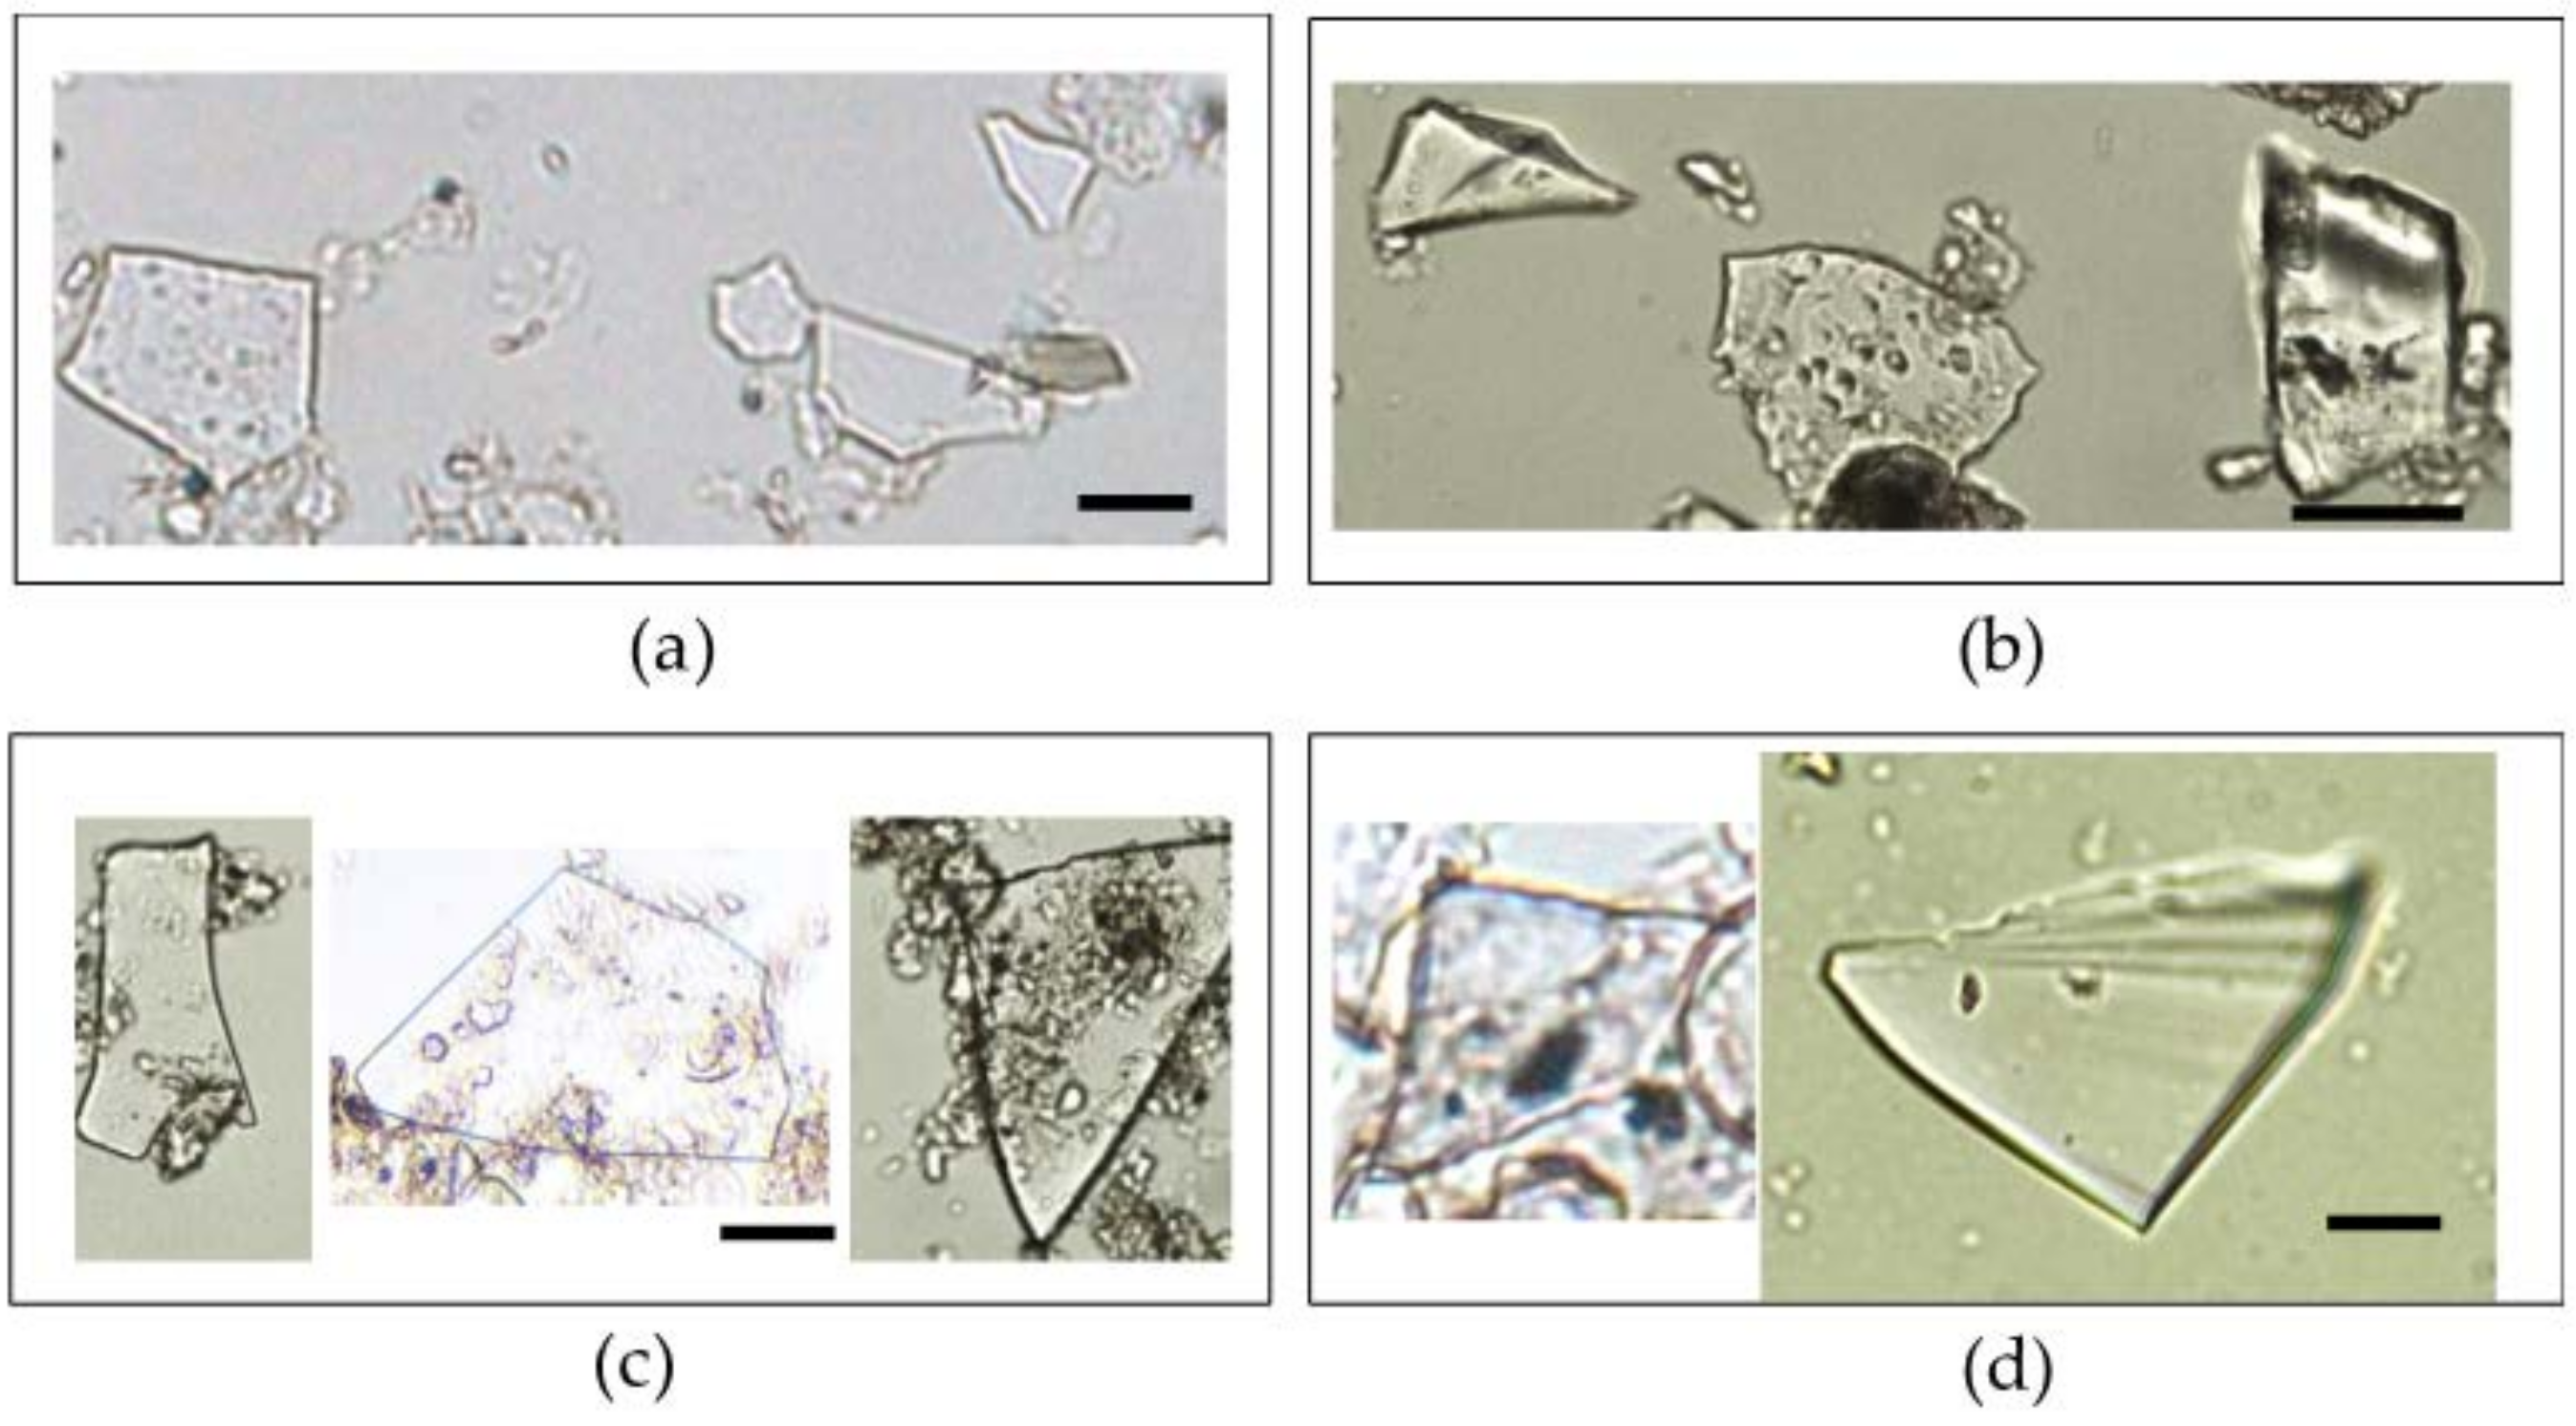
3.1. Characterization of the Starting Materials

The steel slags—The mineralogical phases of slag 1 and slag 2 are similar to those of the reported ordinary steel slag [18], consisting of portlandite Ca(OH)2, larnite C2S, brownmillerite C4AF, and others, as identified by XRD (Figure 3). Slag 2 contains native iron which is not identified in slag 1. When we compare the intensity of the peaks corresponding to portlandite, its content is higher in slag 1 than in slag 2.
The dredged soils—The XRD results show that all soils contained quartz, albite, halite, and pyrite (Figure 4a); and clay minerals including smectite, kaolinite, chlorite, and illite (Figure 4b). There are no significant differences between the soil samples in terms of mineralogy and clay mineralogy. The OM observation of particles in the dredged soils revealed that all soils contain amorphous silica phases, including diatom frustules originating from the growth of diatom algae (Figure 5), and volcanic glass originating from erupted ejecta of volcanoes (Figure 6). Diatom frustules are a kind of biogenic silica, and volcanic glasses are a kind of inorganic silica. The genus of the diatoms varied among the four dredged soils, all containing both centric and pennate diatoms. The shapes of the volcanic glass did not differ significantly in these dredged soils. The dissolved mass of diatom frustules and volcanic glass by selective dissolution experiments showed that: both diatoms and volcanic glass content was highest in soil A, followed by soil B, C, and D (Figure 7). The dissolved Si concentration of the pore water in the dredged soils was the highest in soil A, followed by soil B, C, and D (Figure 7).

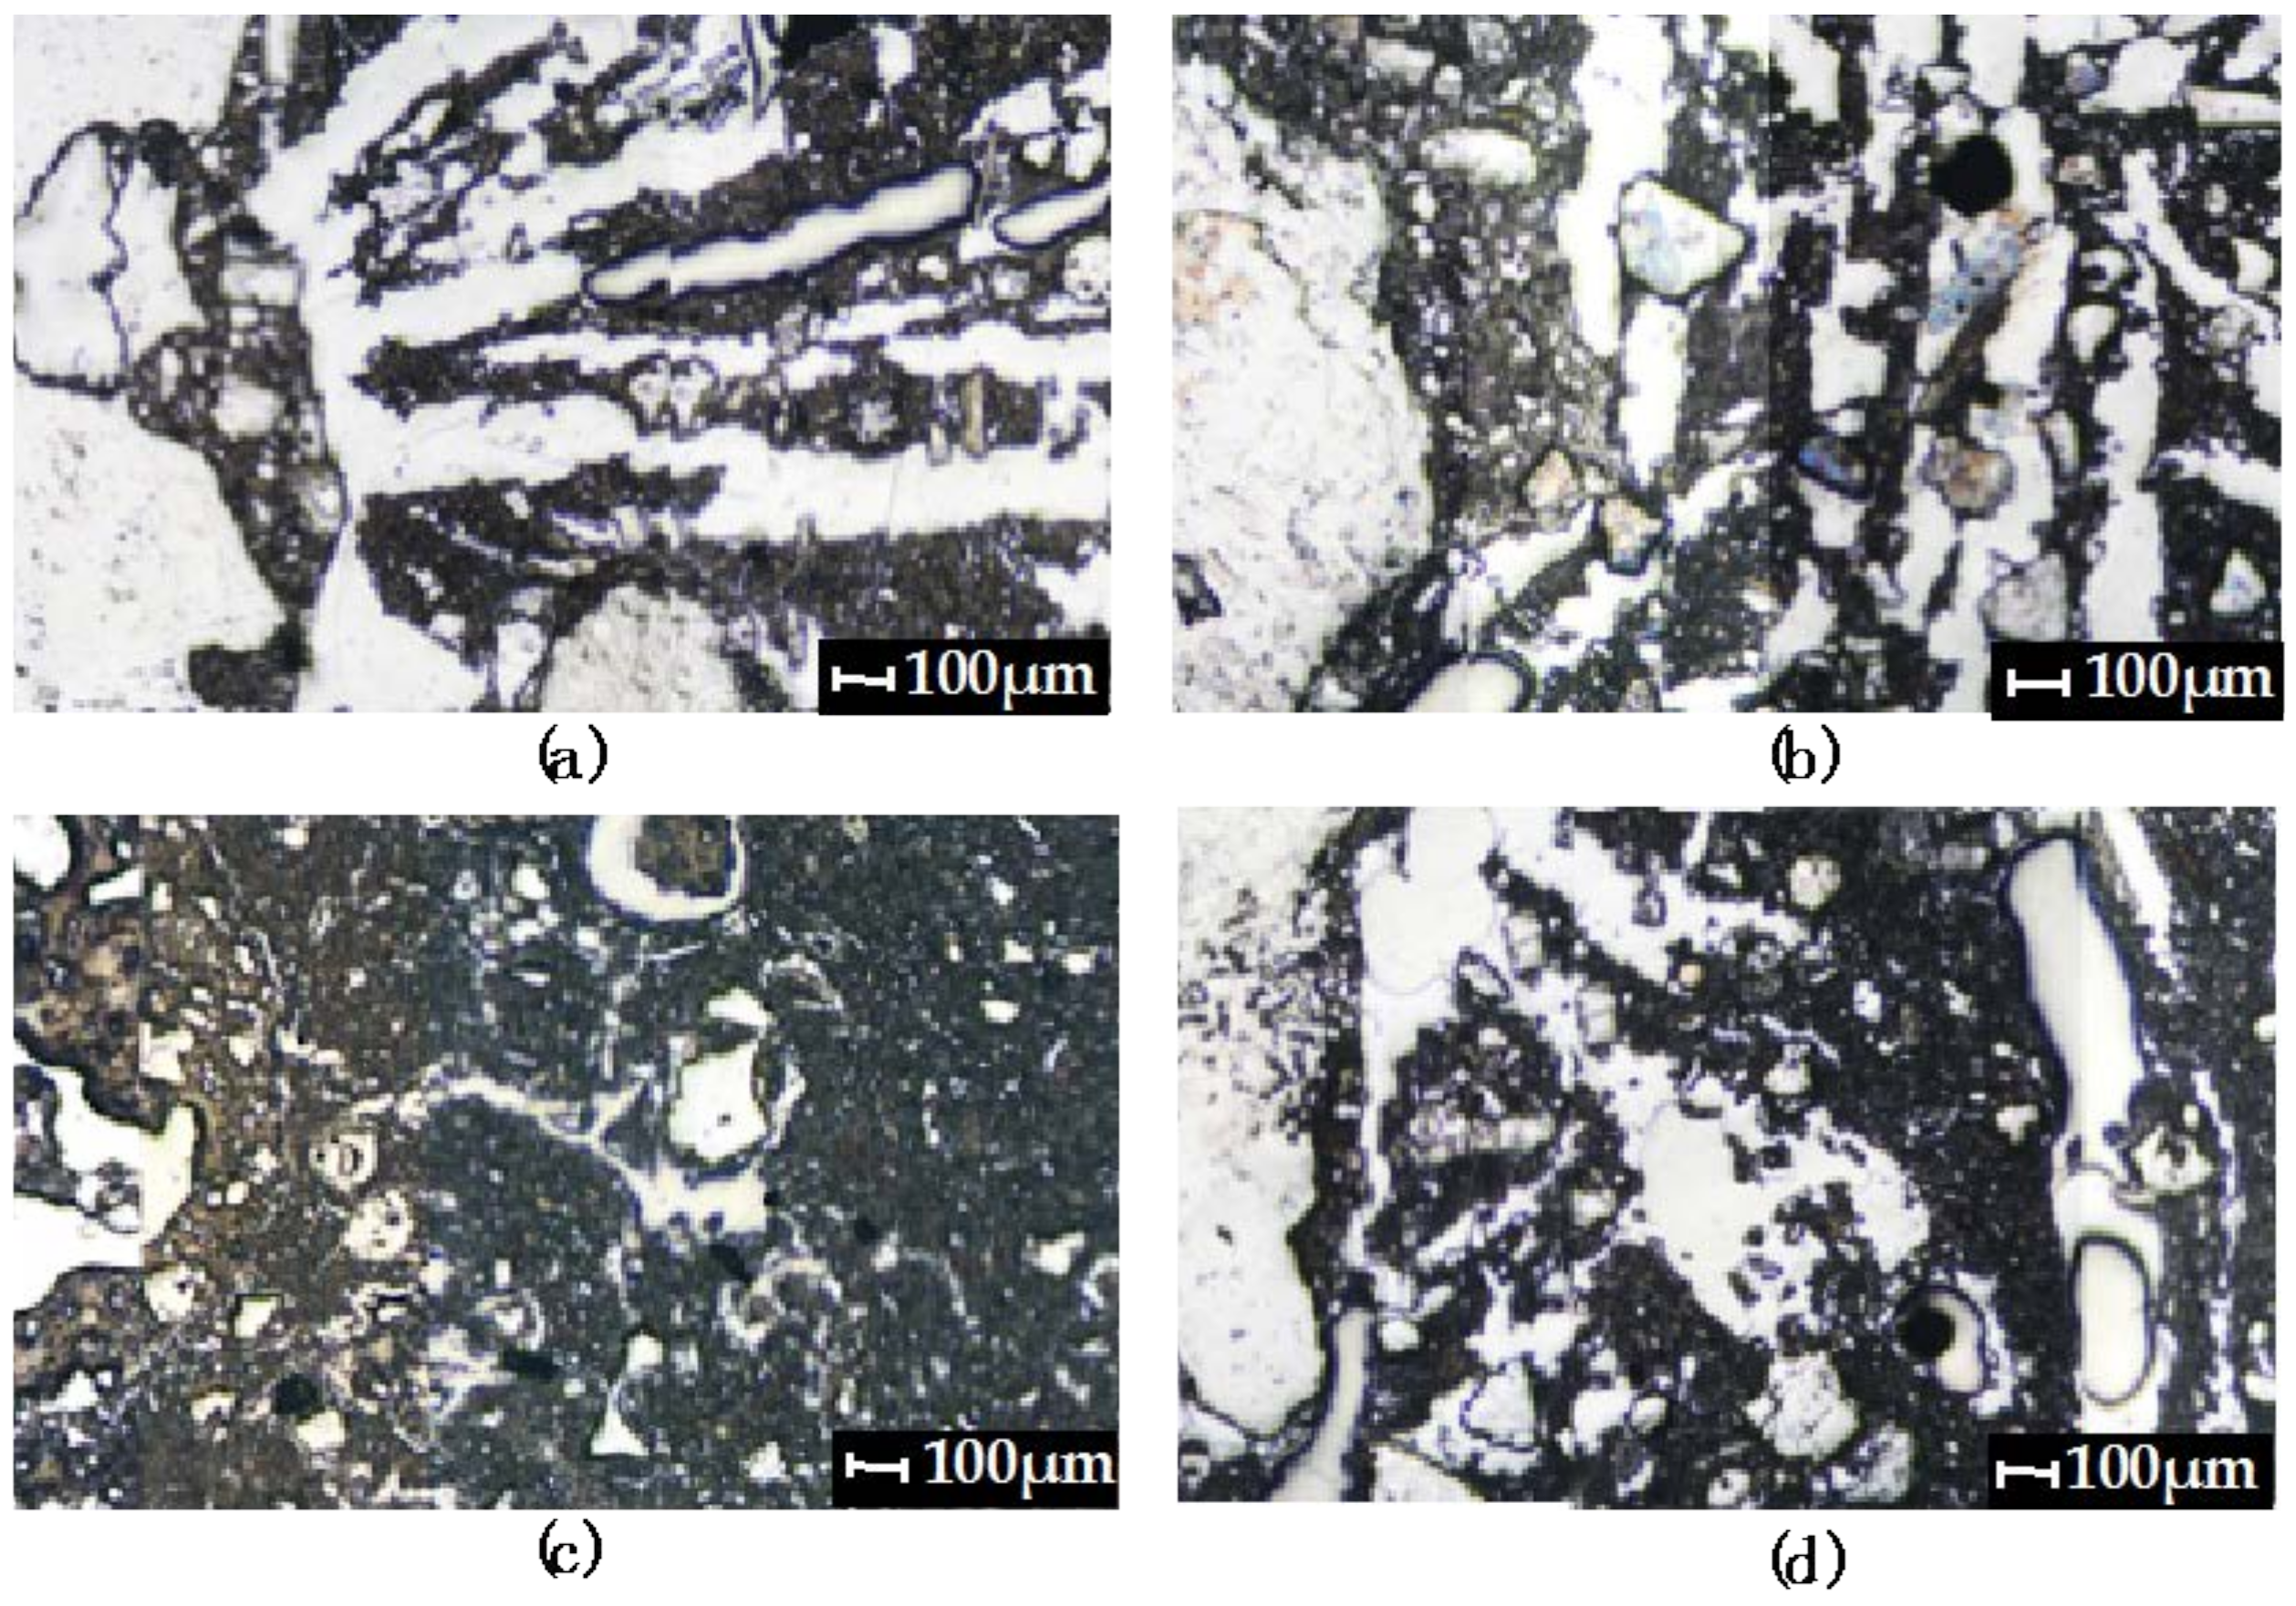
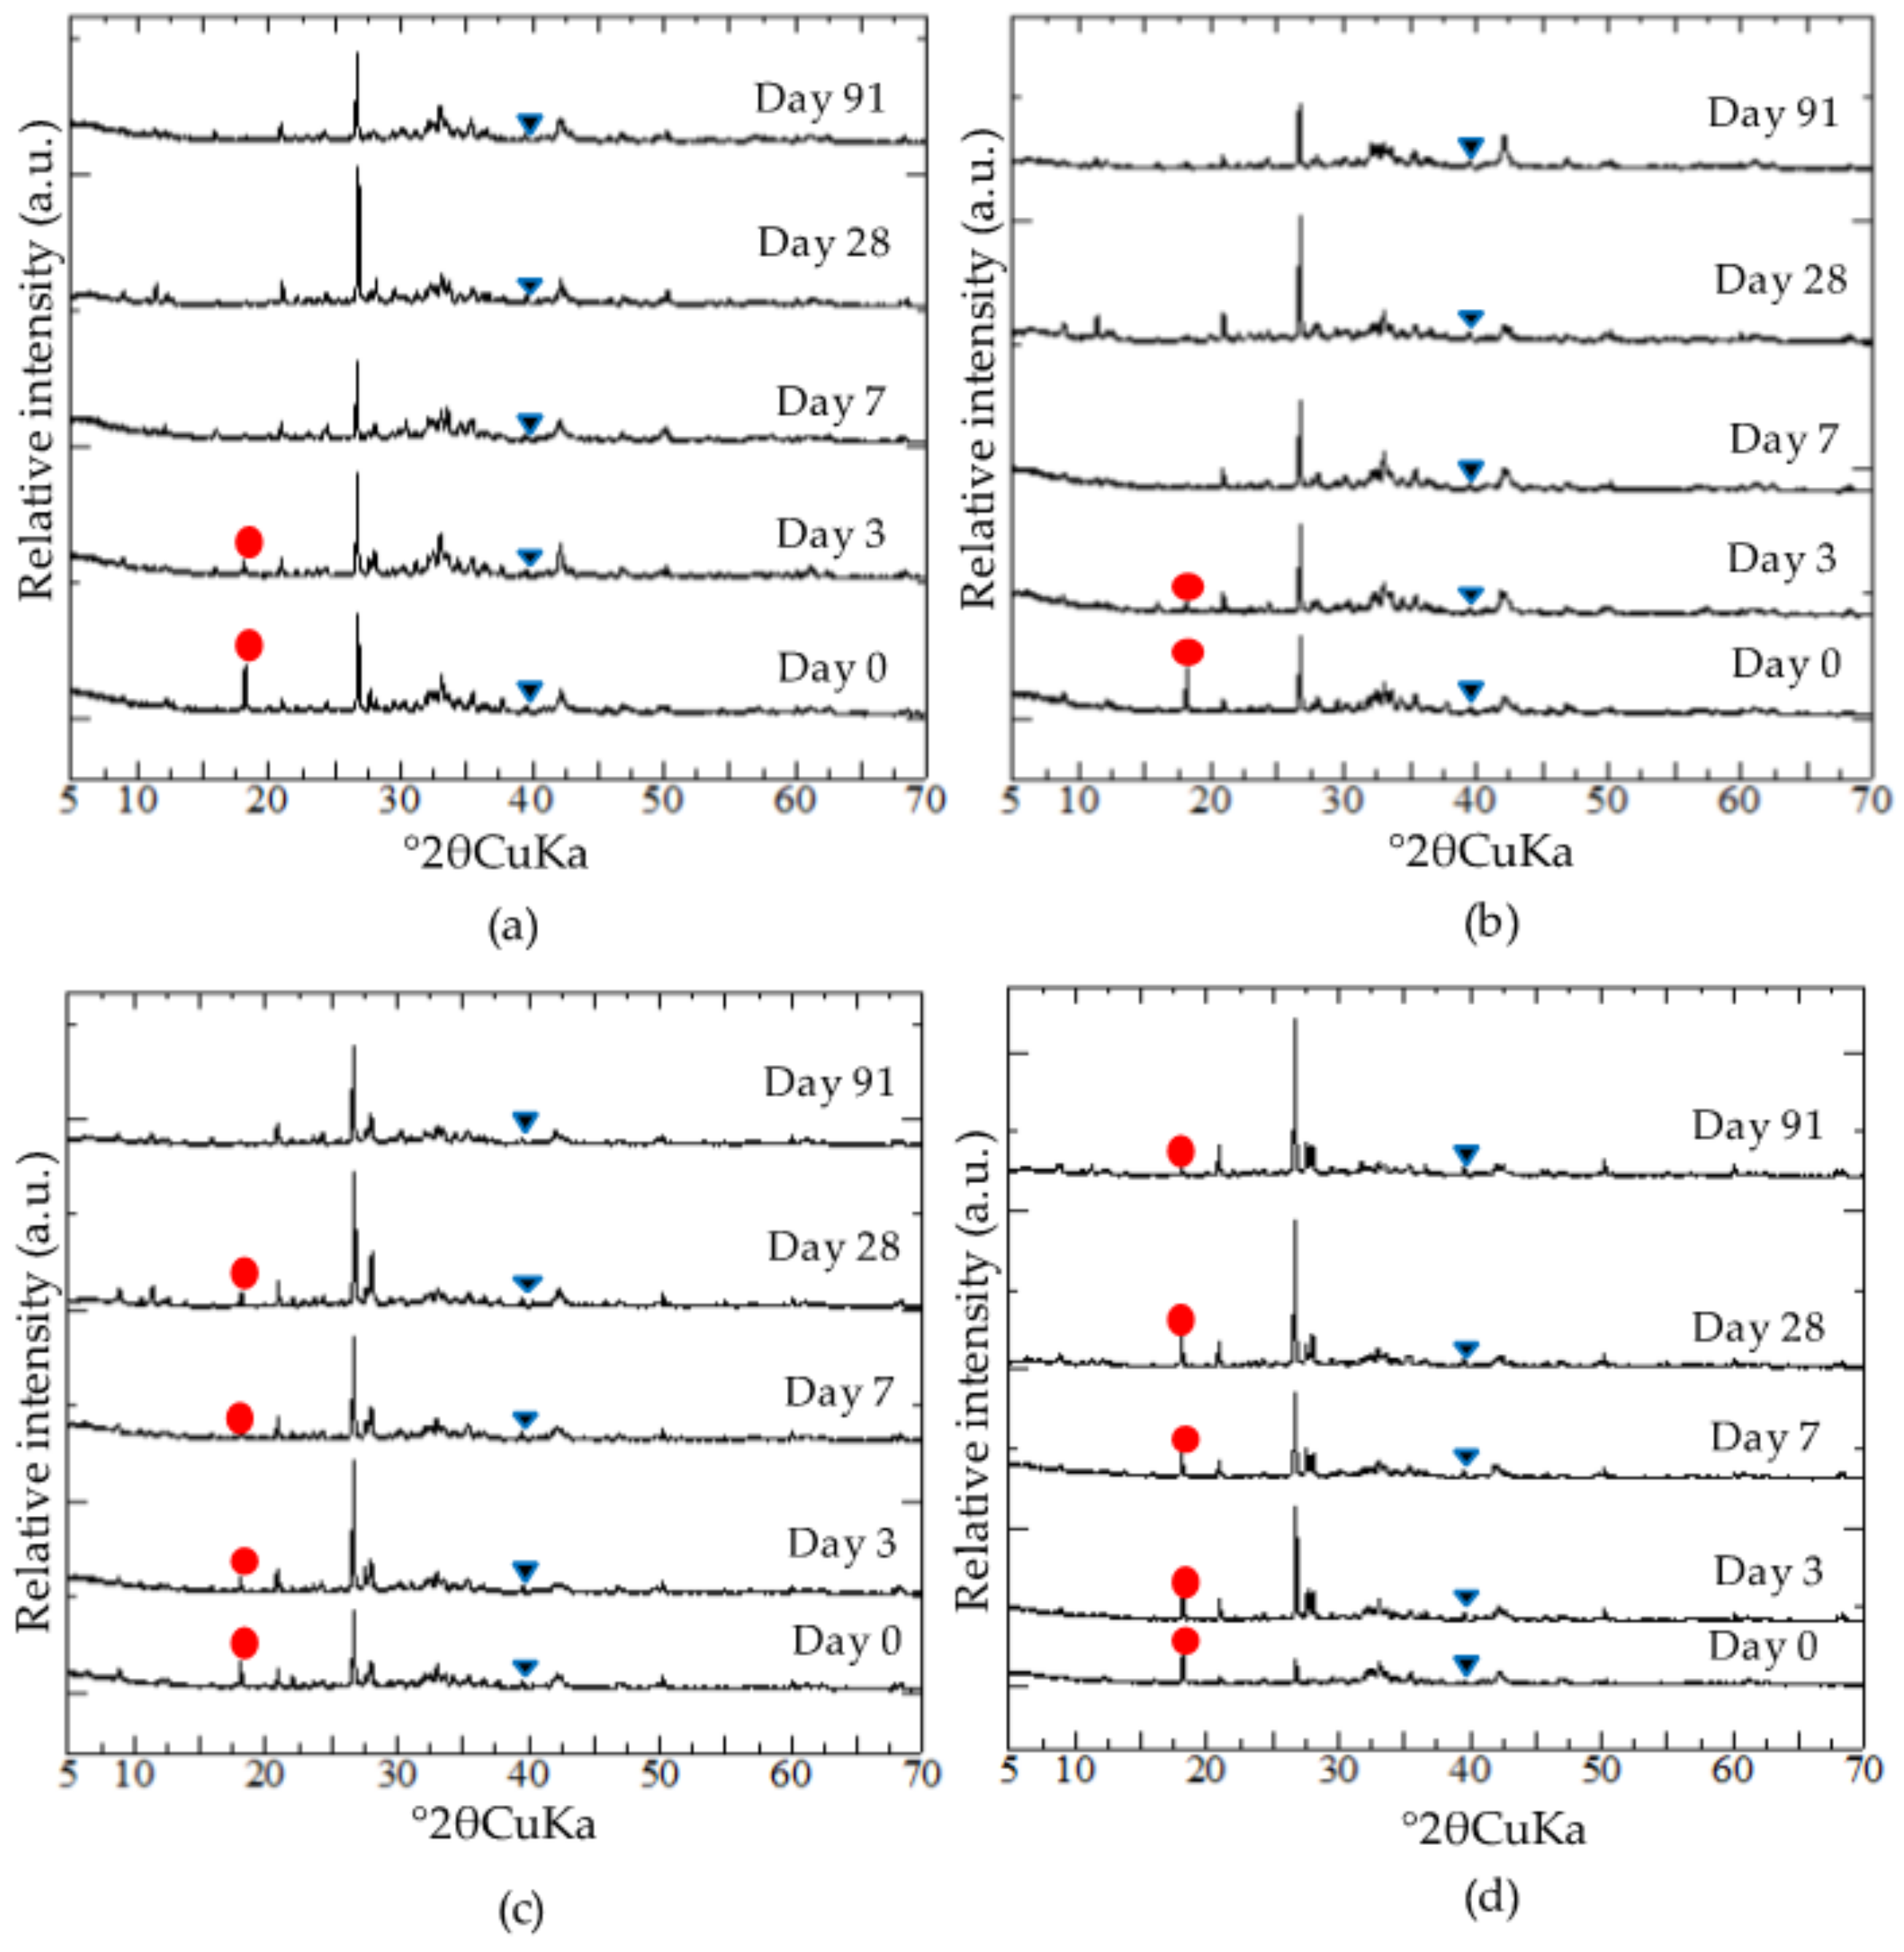
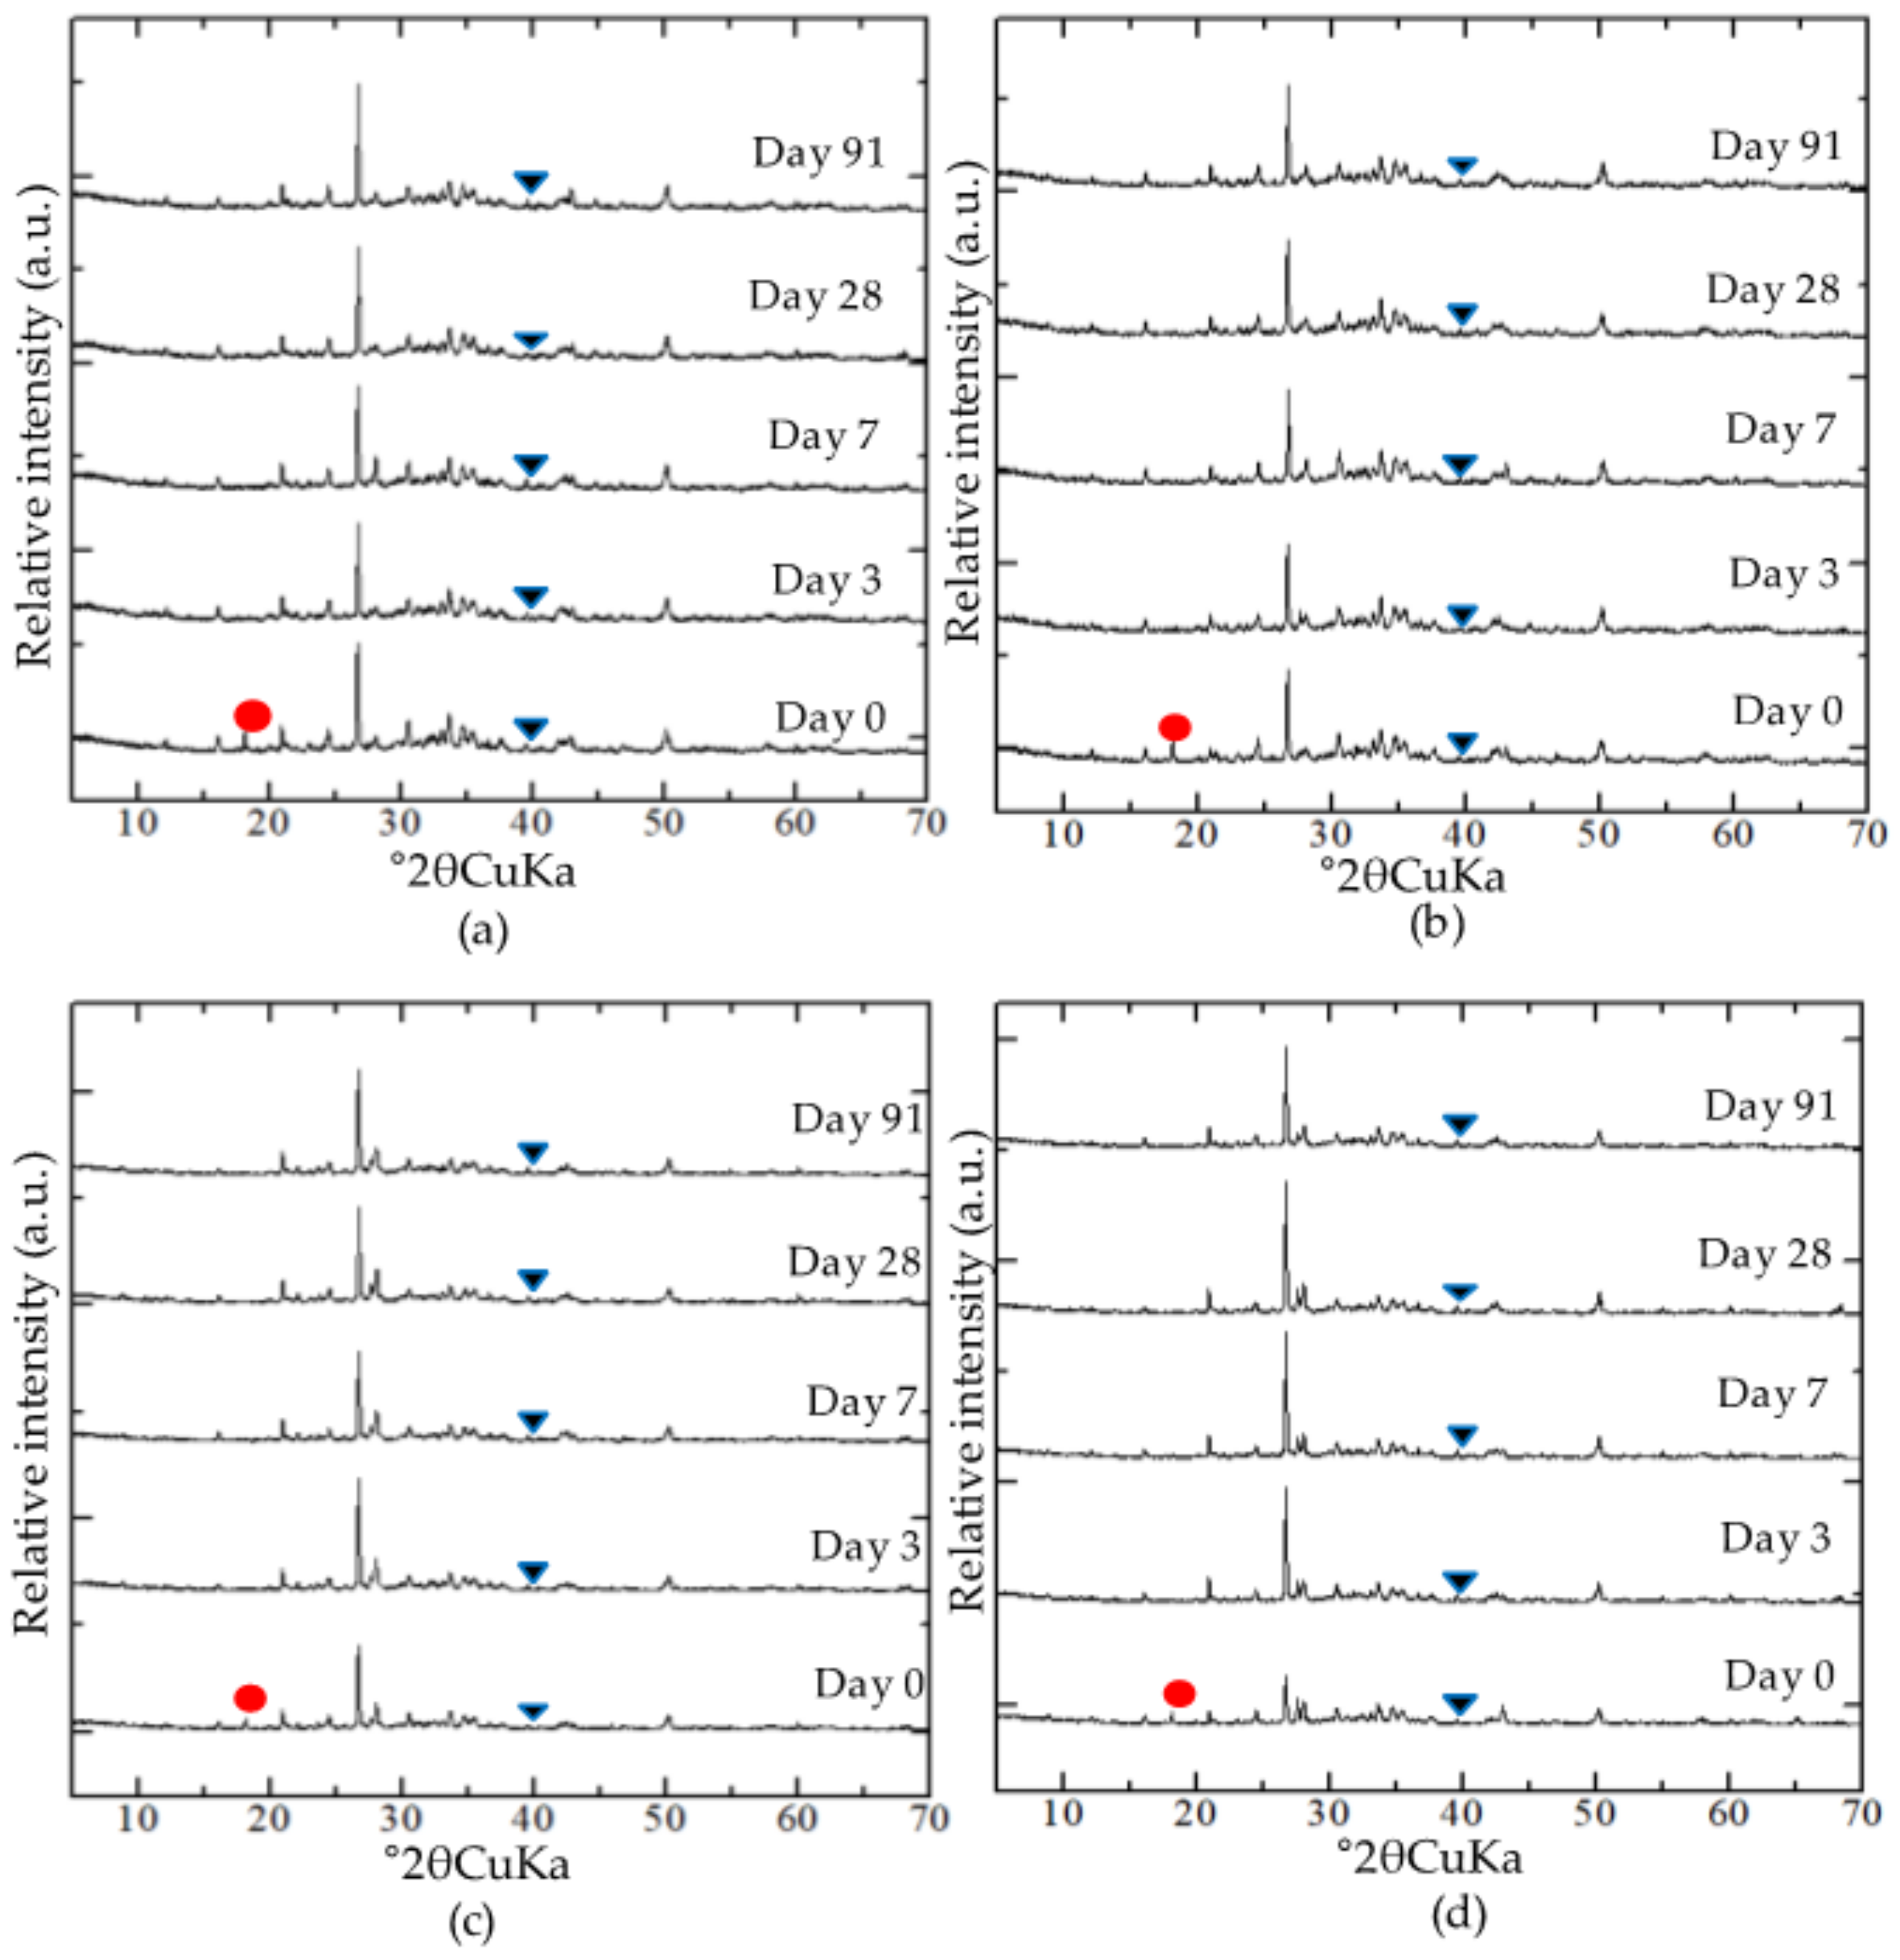
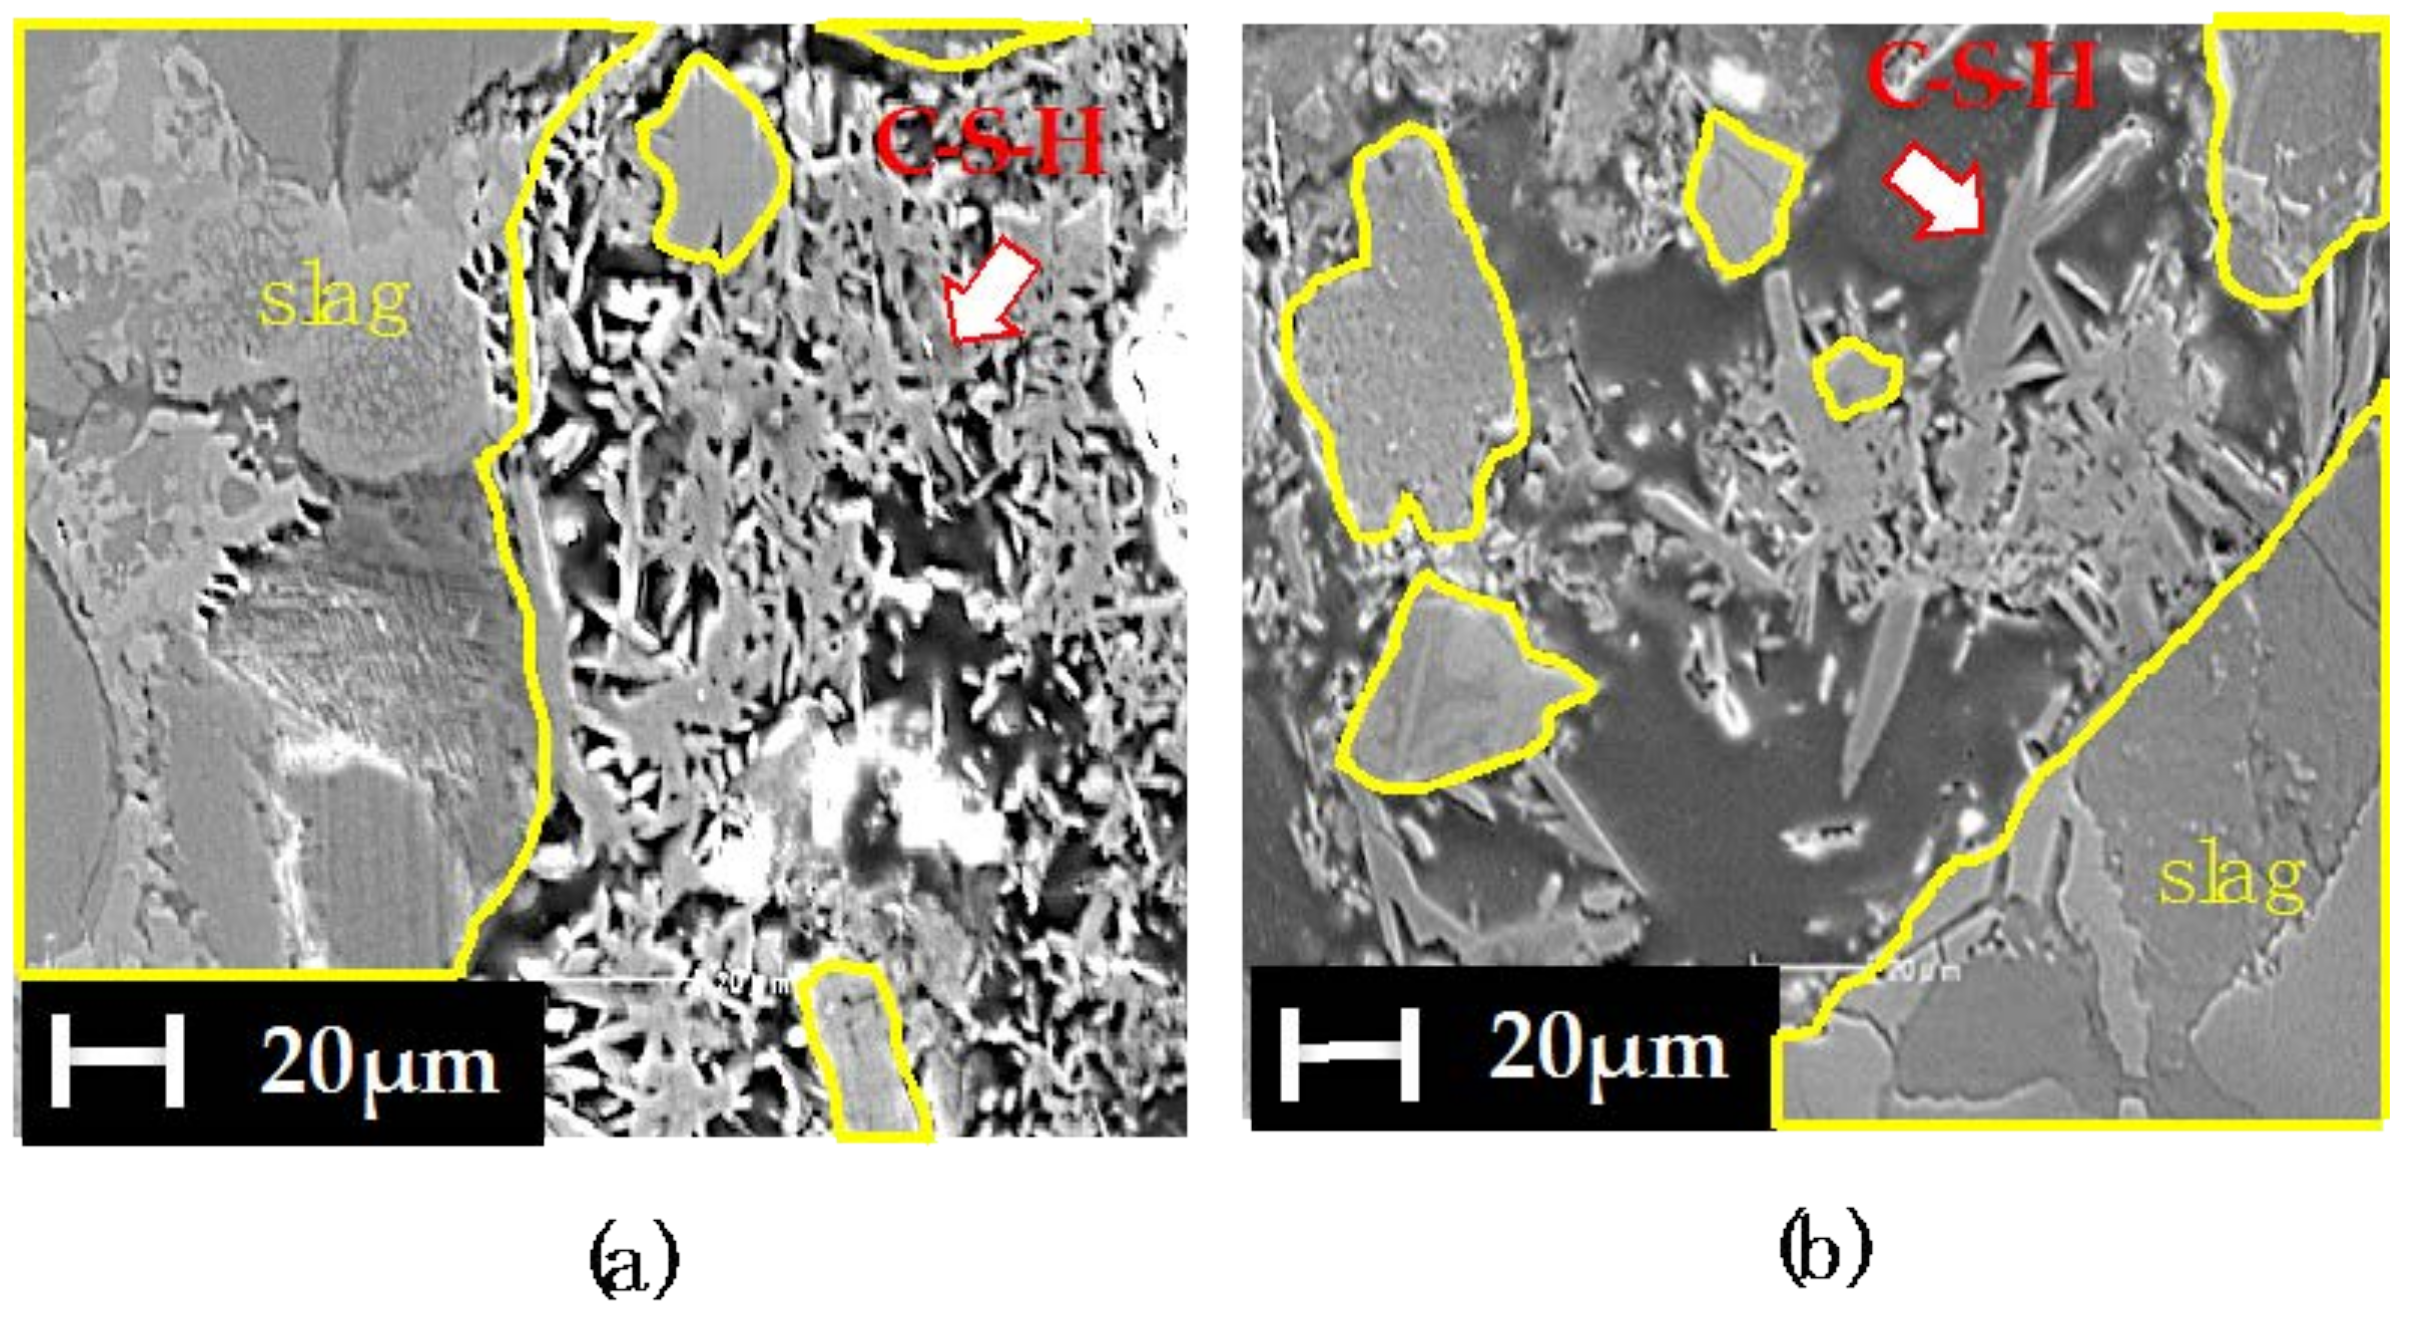
3.2. Secondary Phase Formation in the Mixtures

No newly formed crystalline mineralogical phases were detected in the XRD profiles of the cured mixtures (Figure 8 and Figure 9). This leads to the conclusion that the secondary phases responsible for development of the strength of the mixtures are amorphous. Also, the peaks corresponding to portlandite were no longer detected in mixtures 1A and 1B after 7 days of curing, unlike the other components of the steel slag, such as larnite. The peaks corresponding to portlandite were detected in mixtures 1C and 1D after 7 days of curing (Figure 8). In the XRD profiles of the mixtures with slag 2, the peaks corresponding to portlandite disappeared in all mixtures after 3 days of curing, showing that the portlandite content was much lower than that of the mixtures with slag 1 and, thus, portlandite did not remain in the later curing stages.
Photos of the mixtures of soil 1A and 1D before curing and after 3 days of curing taken with OM are shown in Figure 10. Significant amounts of voids were observed in both specimens before curing. However, after 3 days, mixture 1A had fewer voids than before curing. In contrast to this, there was very little change in the void volume of mixture 1D after 3 days of curing. This suggests that the pores in mixture 1A were filled with secondary phases and caused the cementation of particles that were separate and unconnected before interaction of the steel slags and dredged soils.
From the SEM observations of the specimens after 3 days of curing, the formation of needle-like C-S-H in both mixture 1A and 1D was confirmed (Figure 11); C-S-H is well known as the phase responsible for hardening in cementitious materials [19]. Based on the SEM observations, the C-S-H formed in mixture 1A appears denser than that in mixture 1D.

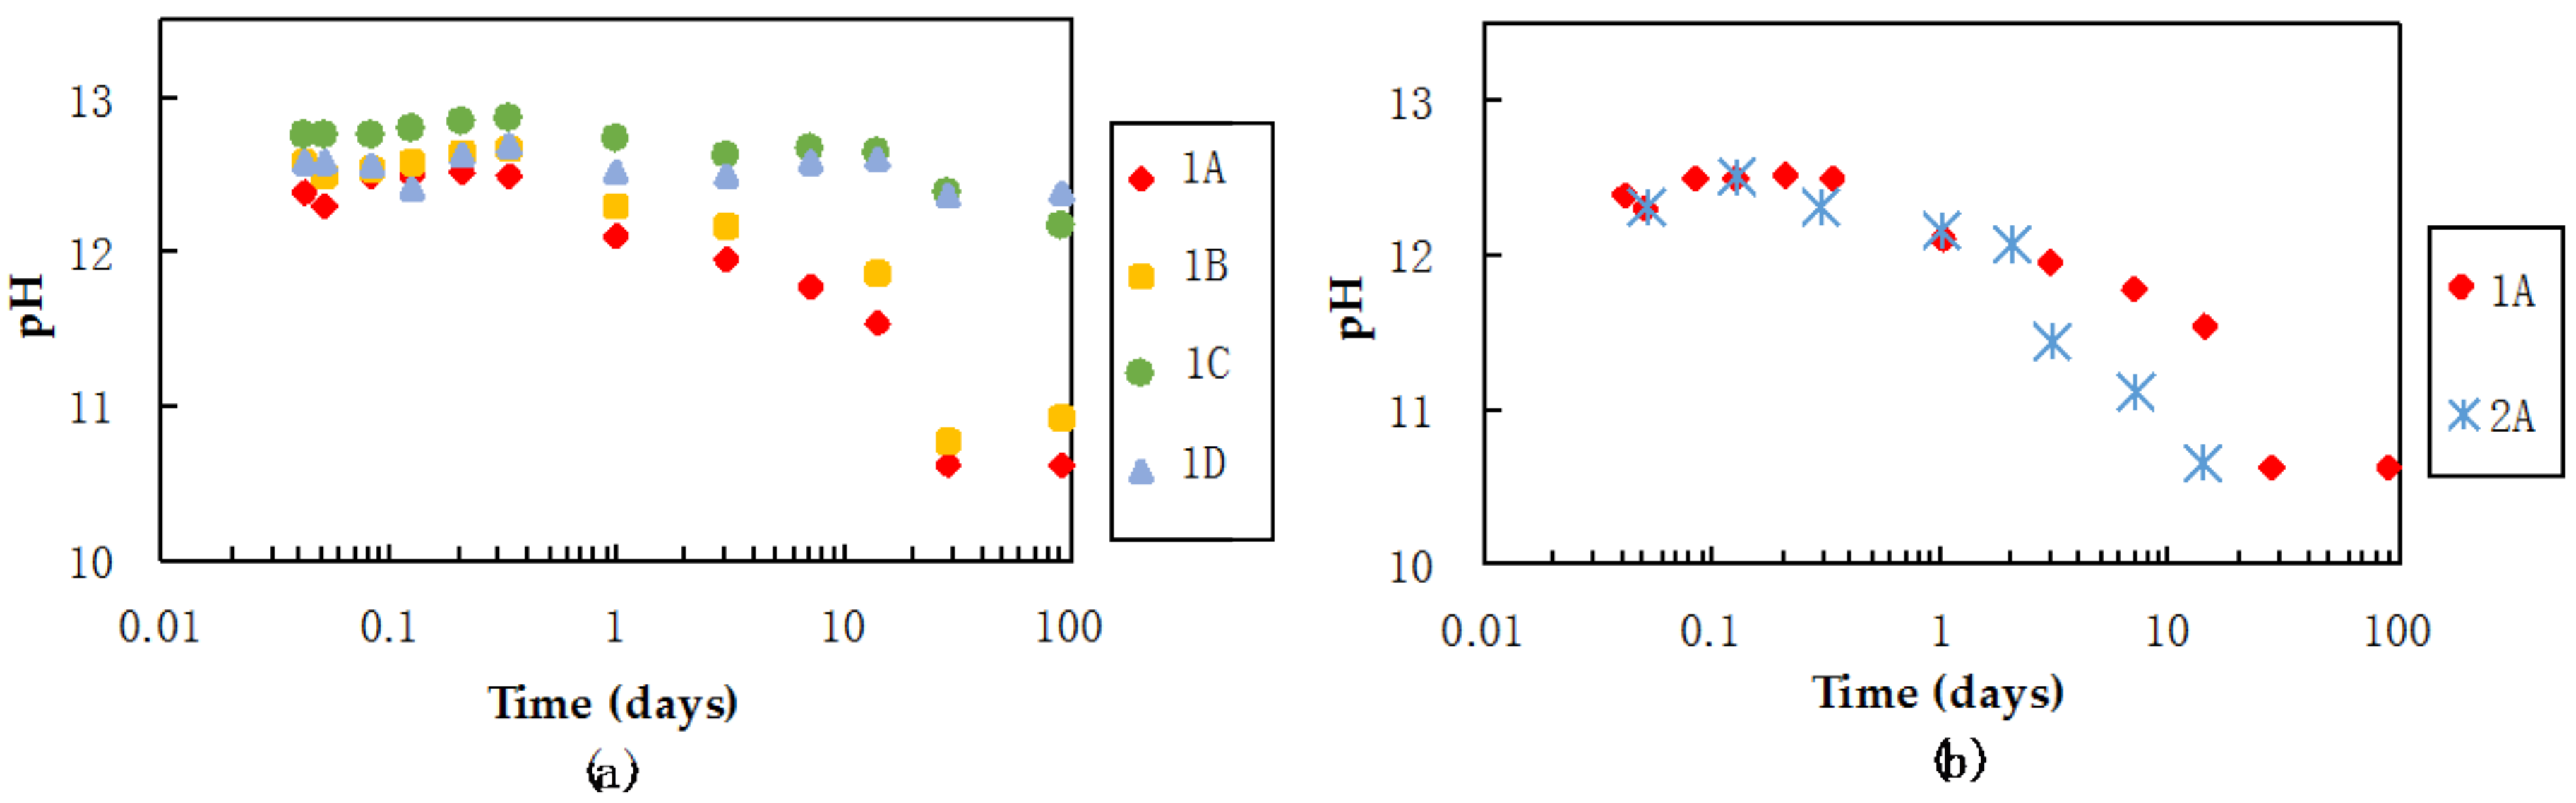
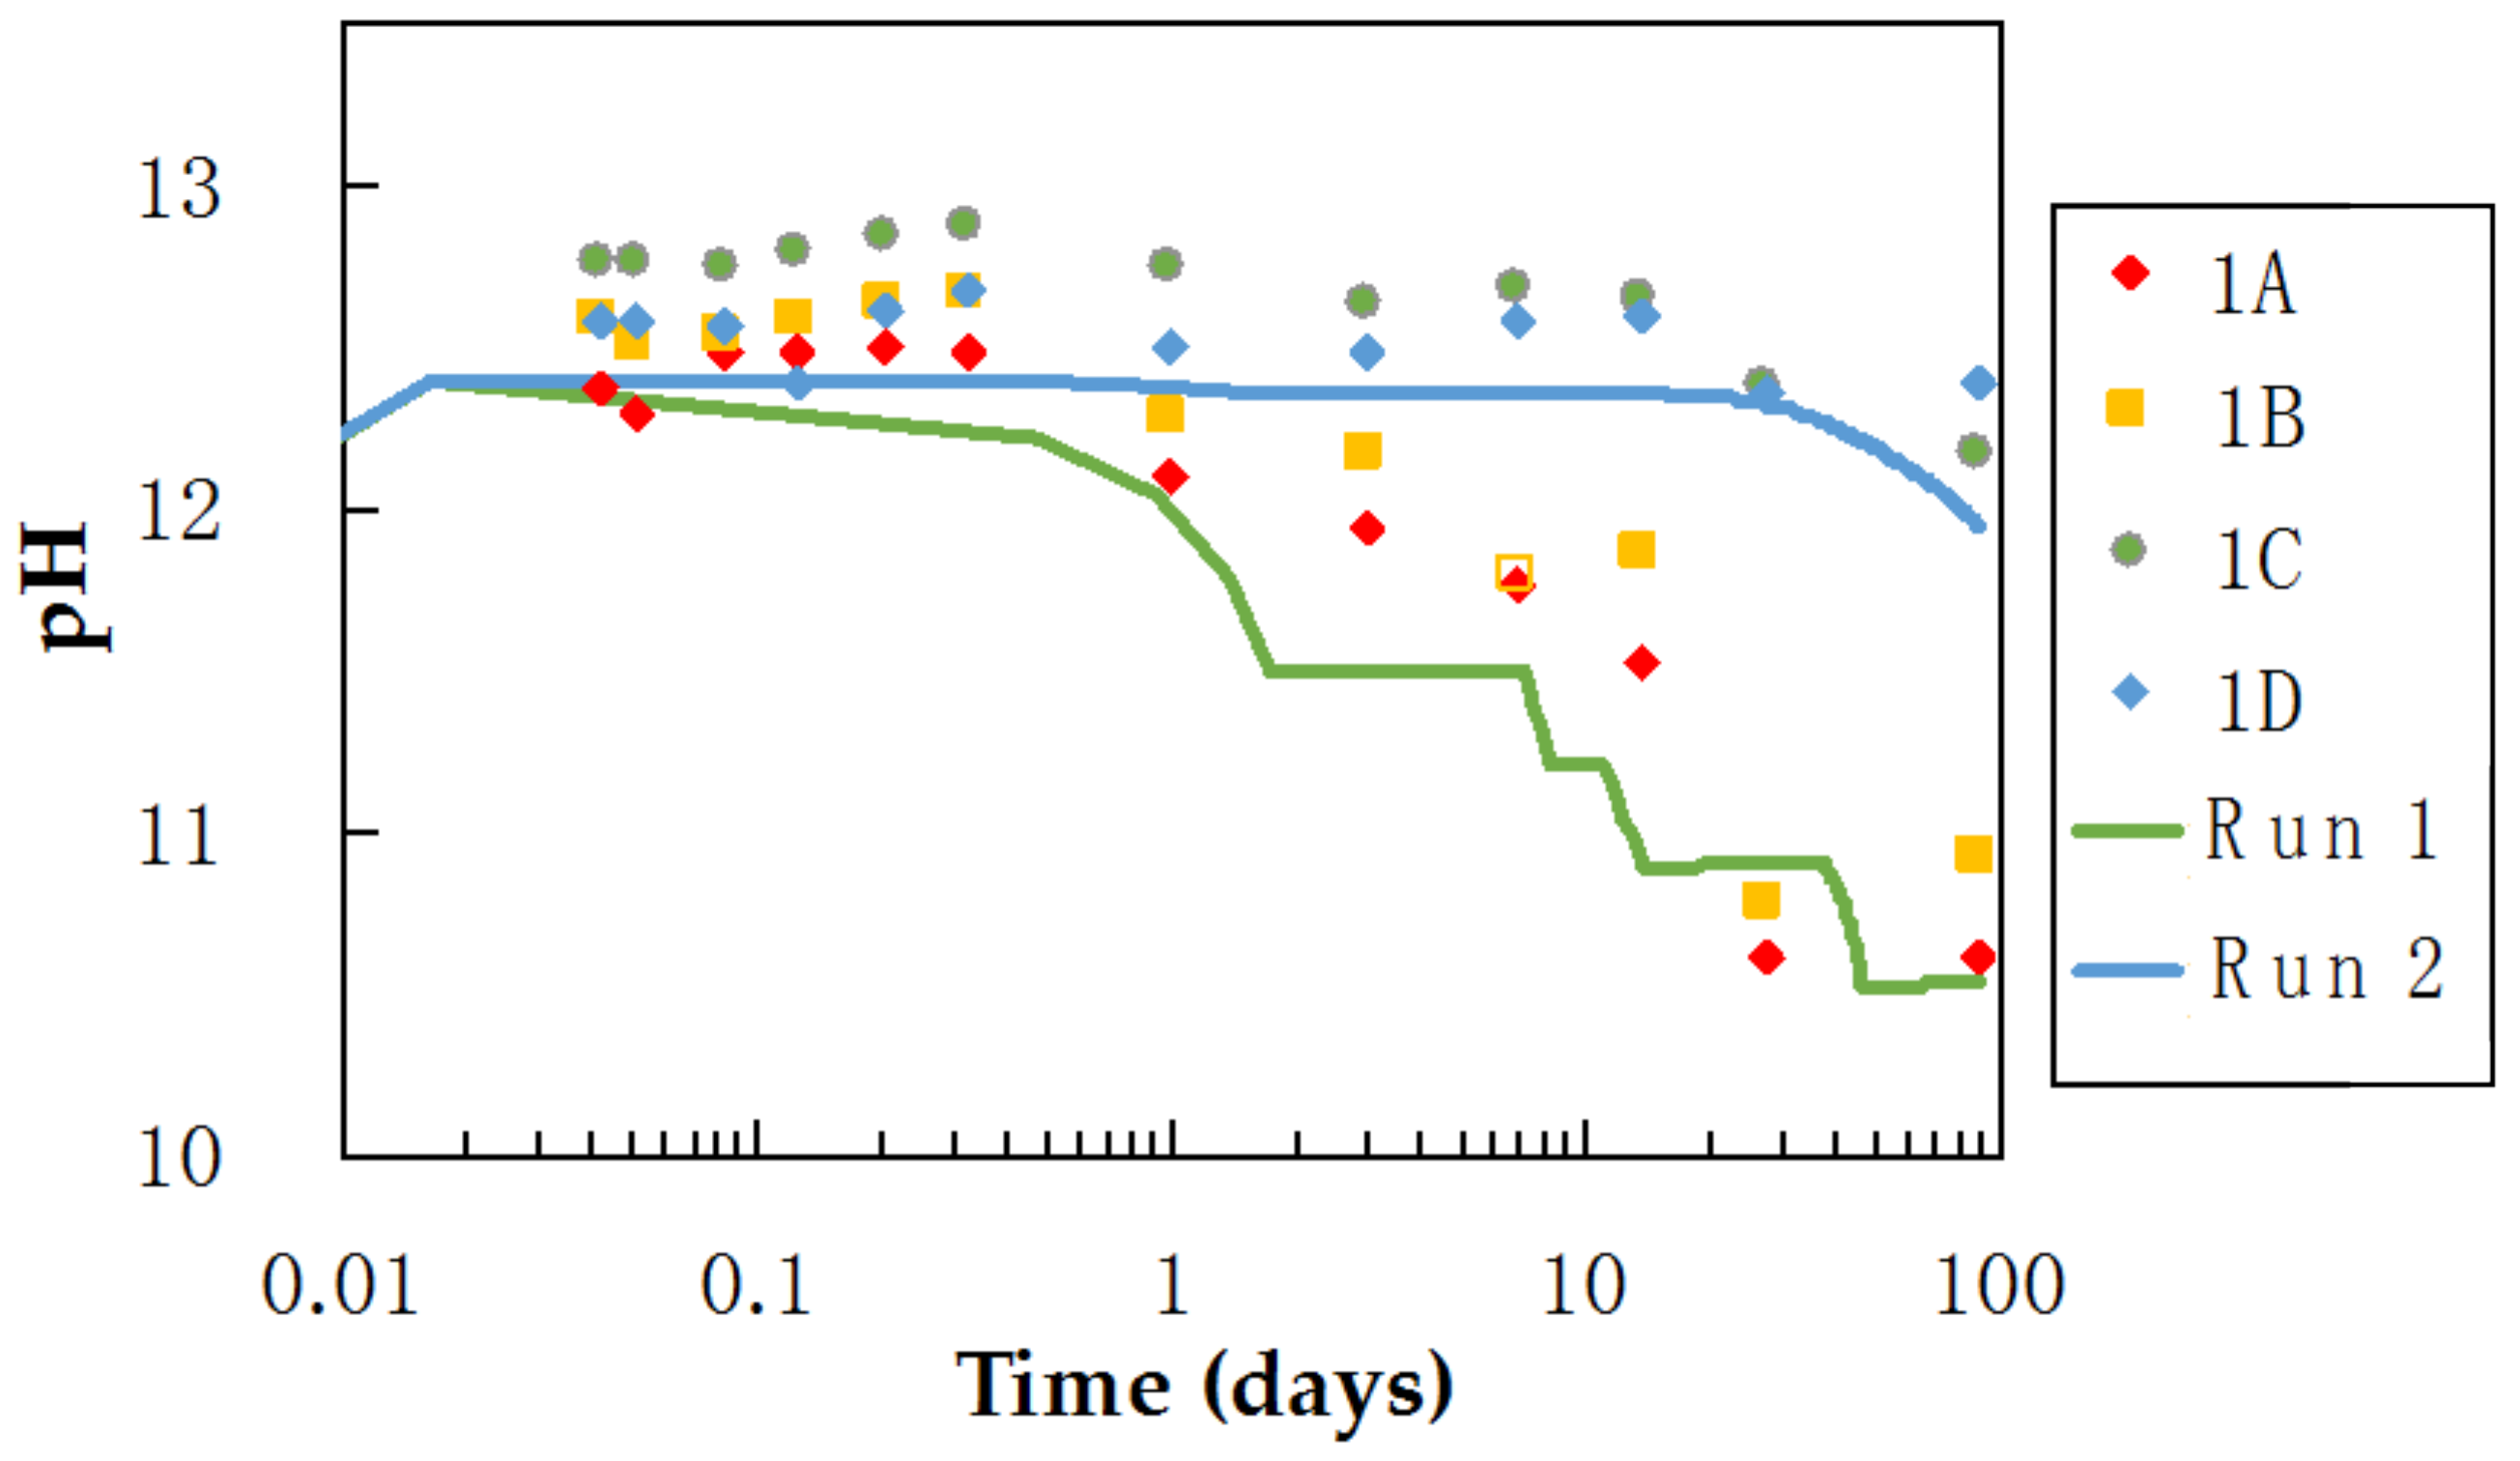
3.3. pH and Ca Concentrations of Pore Water in Mixtures during Curing

The pH of the pore water in the mixtures showed changes in the stronger mixtures; those with the higher unconfined strength, 1A and 1B, from pH 12.5 to 10.5. In mixtures 1C and 1D, the pore water maintained pH values above 12 throughout the curing (Figure 12a). Comparing the pH changes of mixtures 1A and 2A, the decrease in pH occurred earlier in 2A than in 1A. The dissolved Ca ion concentrations of the pore water obtained from mixtures 1A, 1B, 1C, and 1D at 3 days of curing, were 415, 54.5, 134 and 1140 ppm, respectively.

4. Discussion

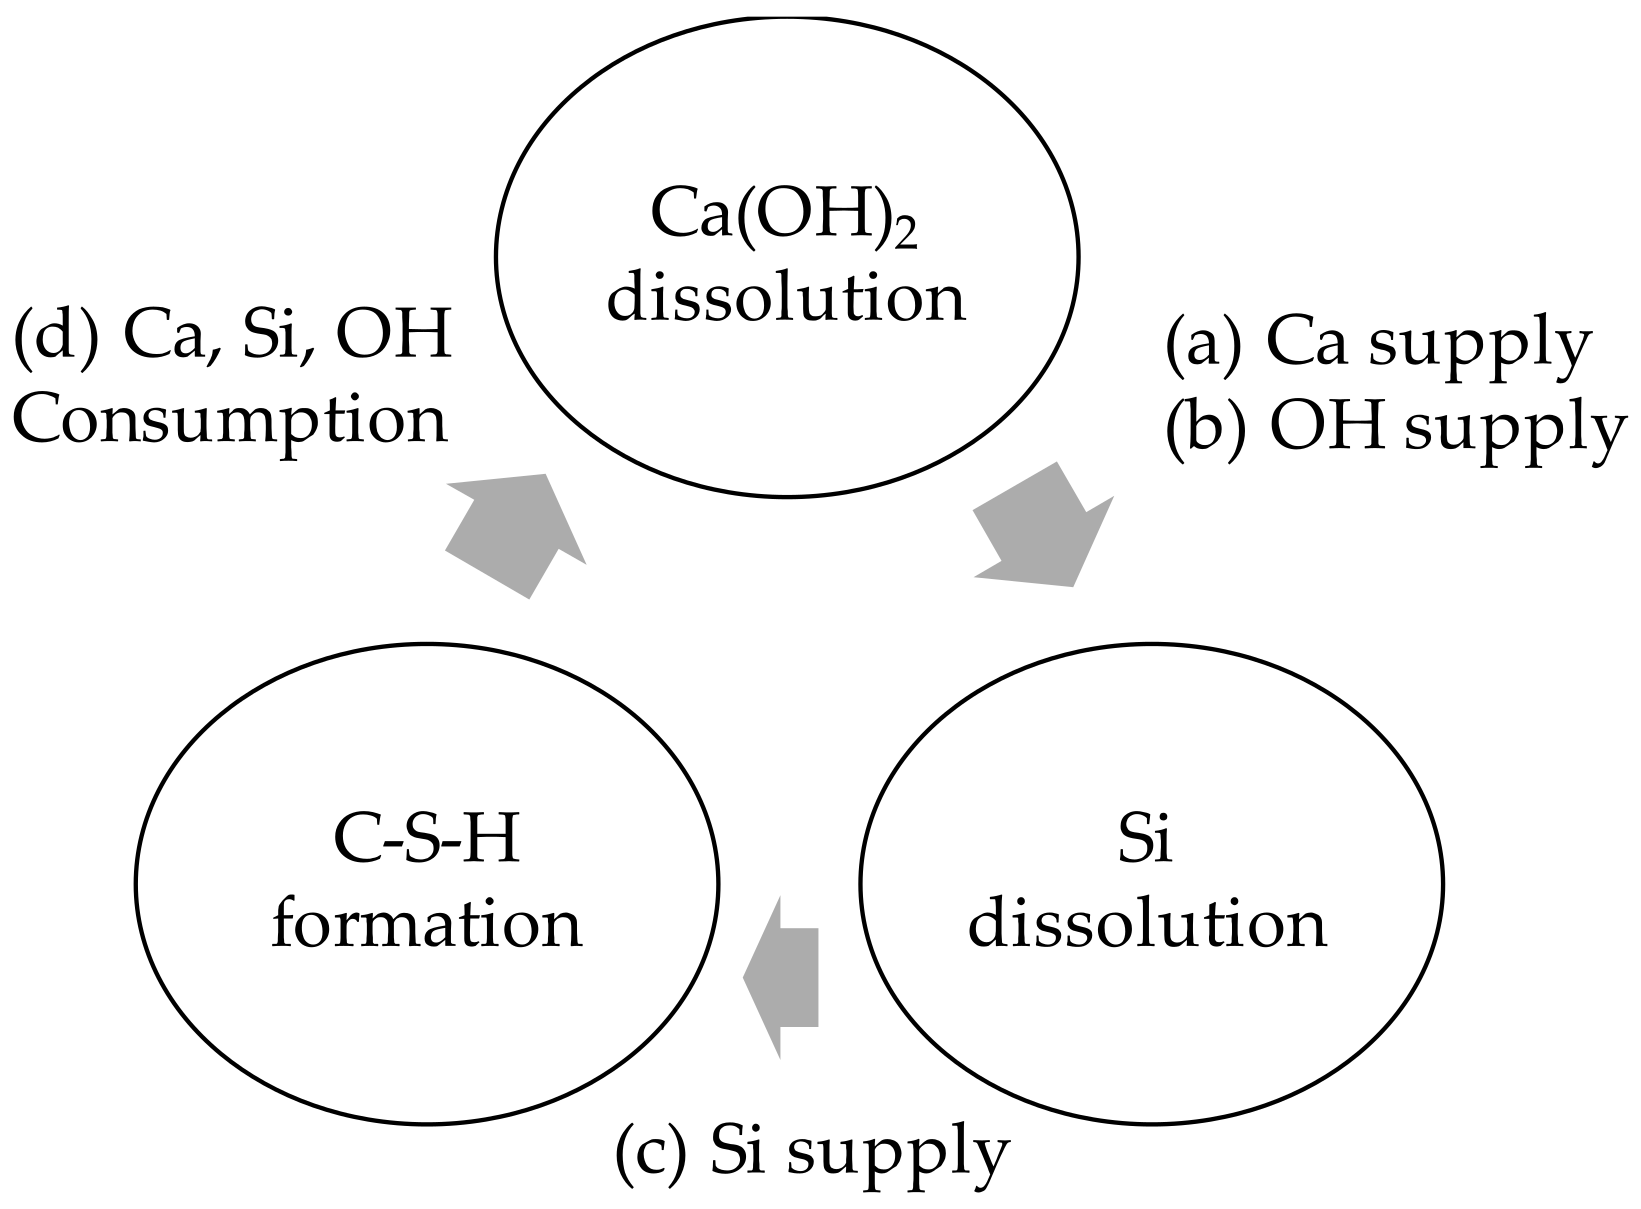
4.1. Candidates for Factors Affecting the Formation of C-S-H

The chemical equation for C-S-H formation can be expressed as (1) [20].
1.6Ca2+ + 2.18H2O + H4SiO4(aq) → Ca1.6SiO3.6(OH)1.54·1.81H2O(s) + 3.2H+(aq)
Based on Equation (1) and a previous study [10], the main factors determining the amount of C-S-H formation in steel slag-dredged soil mixtures can be considered as (a) the supply of Ca ions, (b) pH changes that corresponds to geochemical reactions and the state of phases, i.e., pH increases leads to increases in solubility of the silica-bearing phases, and (c) the supply of Si ions.

4.1.1. Factor (a): Calcium Ion Supply as a Factor in C-S-H Formation

The results of the XRD analyses of the mixtures made with slag 1 clearly show that portlandite was consumed after 7 days in only the stronger mixtures (mixture 1A and 1B; Figure 8). This indicates that dissolved Ca ions were mainly supplied from the portlandite in the steel slags for the formation of C-S-H. Because portlandite easily reaches saturation in aqueous solutions at ambient temperatures [21], and factor (a) here would be the limiting factor for C-S-H formation when there are limits to the portlandite quantity in the steel slags. The XRD analyses of the mixtures made with slag 2 show that the portlandite supply was much lower than in the mixtures with slag 1 (Figure 8 and Figure 9), indicating that the content of portlandite in the steel slags, is an important factor controlling the formation of C-S-H.
Here, it is noteworthy that dredged soil D that formed the weakest mixture made with slag 1, contained the highest amount of humic acid amongst the other dredged soils used in this study. The presence of humic acid that bind with dissolved Ca ions [22], may limit the supply of Ca ions for C-S-H formation by forming insoluble compounds [23]. Such Ca complexing agents like humic acid may retain Ca in solution in complex form, which cannot be filtered by 0.2 μm filter, thus, its detected concentration in the pore water by ICP-AES may be oversaturated against portlandite. Complexed Ca become unavailable for reactions with silica to produce C-S-H. Dissolved Ca ion concentration in the pore water of mixture D was the highest among these mixtures. This suggests that the presence of humic acids in the dredged soil may be inhibiting the supply of dissolved Ca ions to form C-S-H, at least in the studied mixtures here. Furthermore, humic acid is known to inhibit the crystal growth of calcite by forming ligands with the surface of calcite [24]. It is not clarified if the same effect occurs by humic acids with C-S-H that inhibit C-S-H formation. Hence, the factors affecting the Ca ion supply can be assumed to be the portlandite content of steel slags, and the humic acid content may also be affecting the C-S-H formation.

4.1.2. Factor (b): pH of Pore Water in the Mixtures as a Factor in C-S-H Formation

Dissolution of portlandite in steel slags could also be responsible for factor (b). Achievement of hyper alkaline condition would cause enhancement of C-S-H formation due to increase in Si concentration, causing C-S-H to become a phase that is thermodynamically stable. However, an additional factor to consider is that the pH of the pore water may be buffered to values of weak bases by the humic acid as they are weak acids [25]. The pH of the pore water of mixtures 1A, 1B, 1C, and 1D were maintained above 12 within the first day of curing, which can be explained by the dissolution equilibrium of portlandite, that establishes pH of 12.45 [21]. The effect of pH buffering by humic acids were not observed in the mixtures where pH was measured in this study. This suggests that the content of humic acids in soils A, B, C and D (0.09–0.30%) is not sufficient to act as a pH buffer.
A pH of above 12 was maintained within the running time of experiments, i.e., 0–91 days, in the cured mixtures 1C and 1D. However, in mixtures 1A and 1B, pH gradually decreased from 12.5 to 10.5 (Figure 12). This period of decrease in pH of pore water overlaps with the period of portlandite consumption in the curing mixtures (Figure 8). C-S-H formation is known to decrease the pH of the pore water to 10.5 [26]. This behavior of the pH here could indicate that the formation of C-S-H and consumption of portlandite are determining factors of the pH of the pore water of the mixtures.

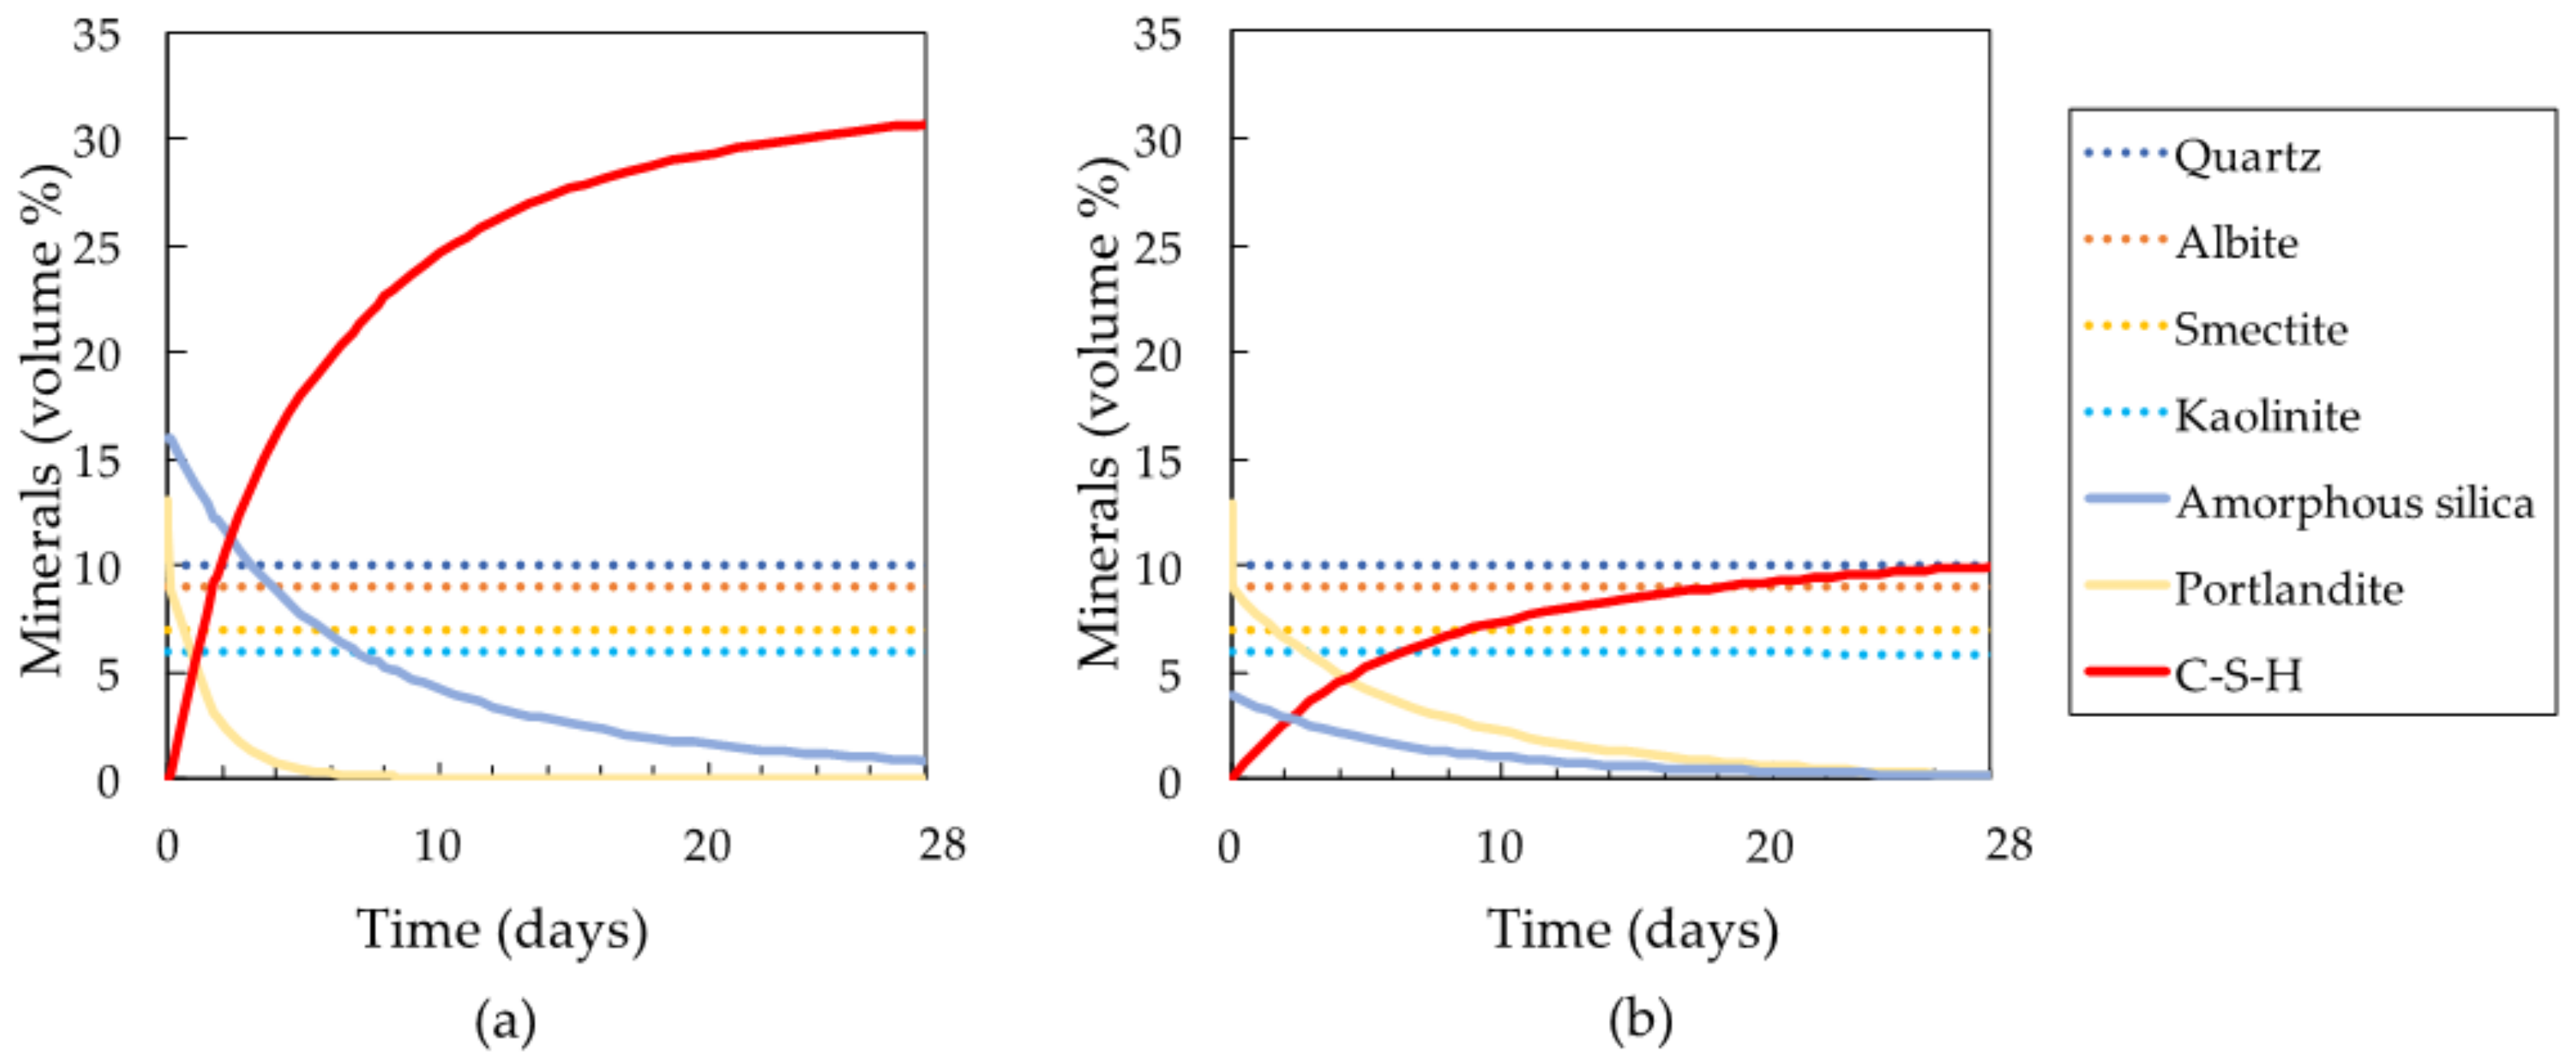
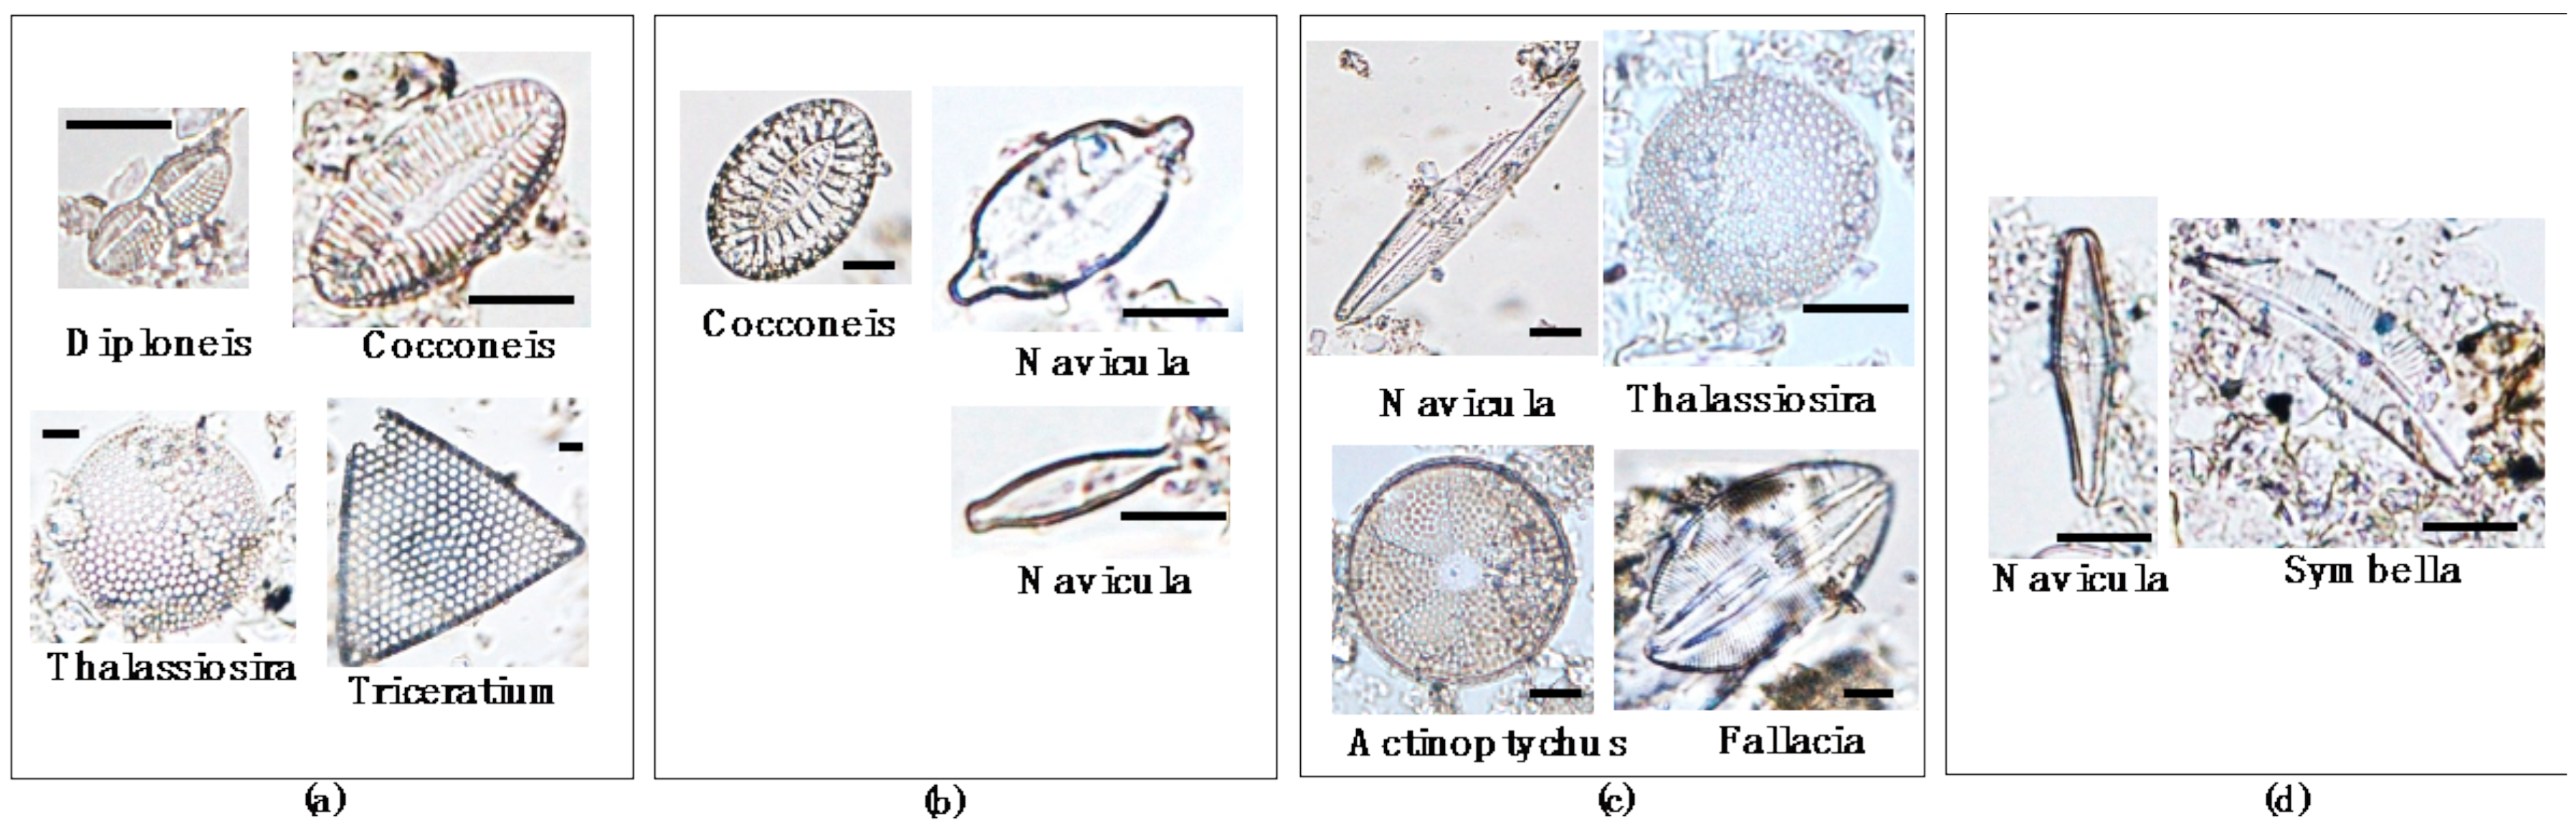
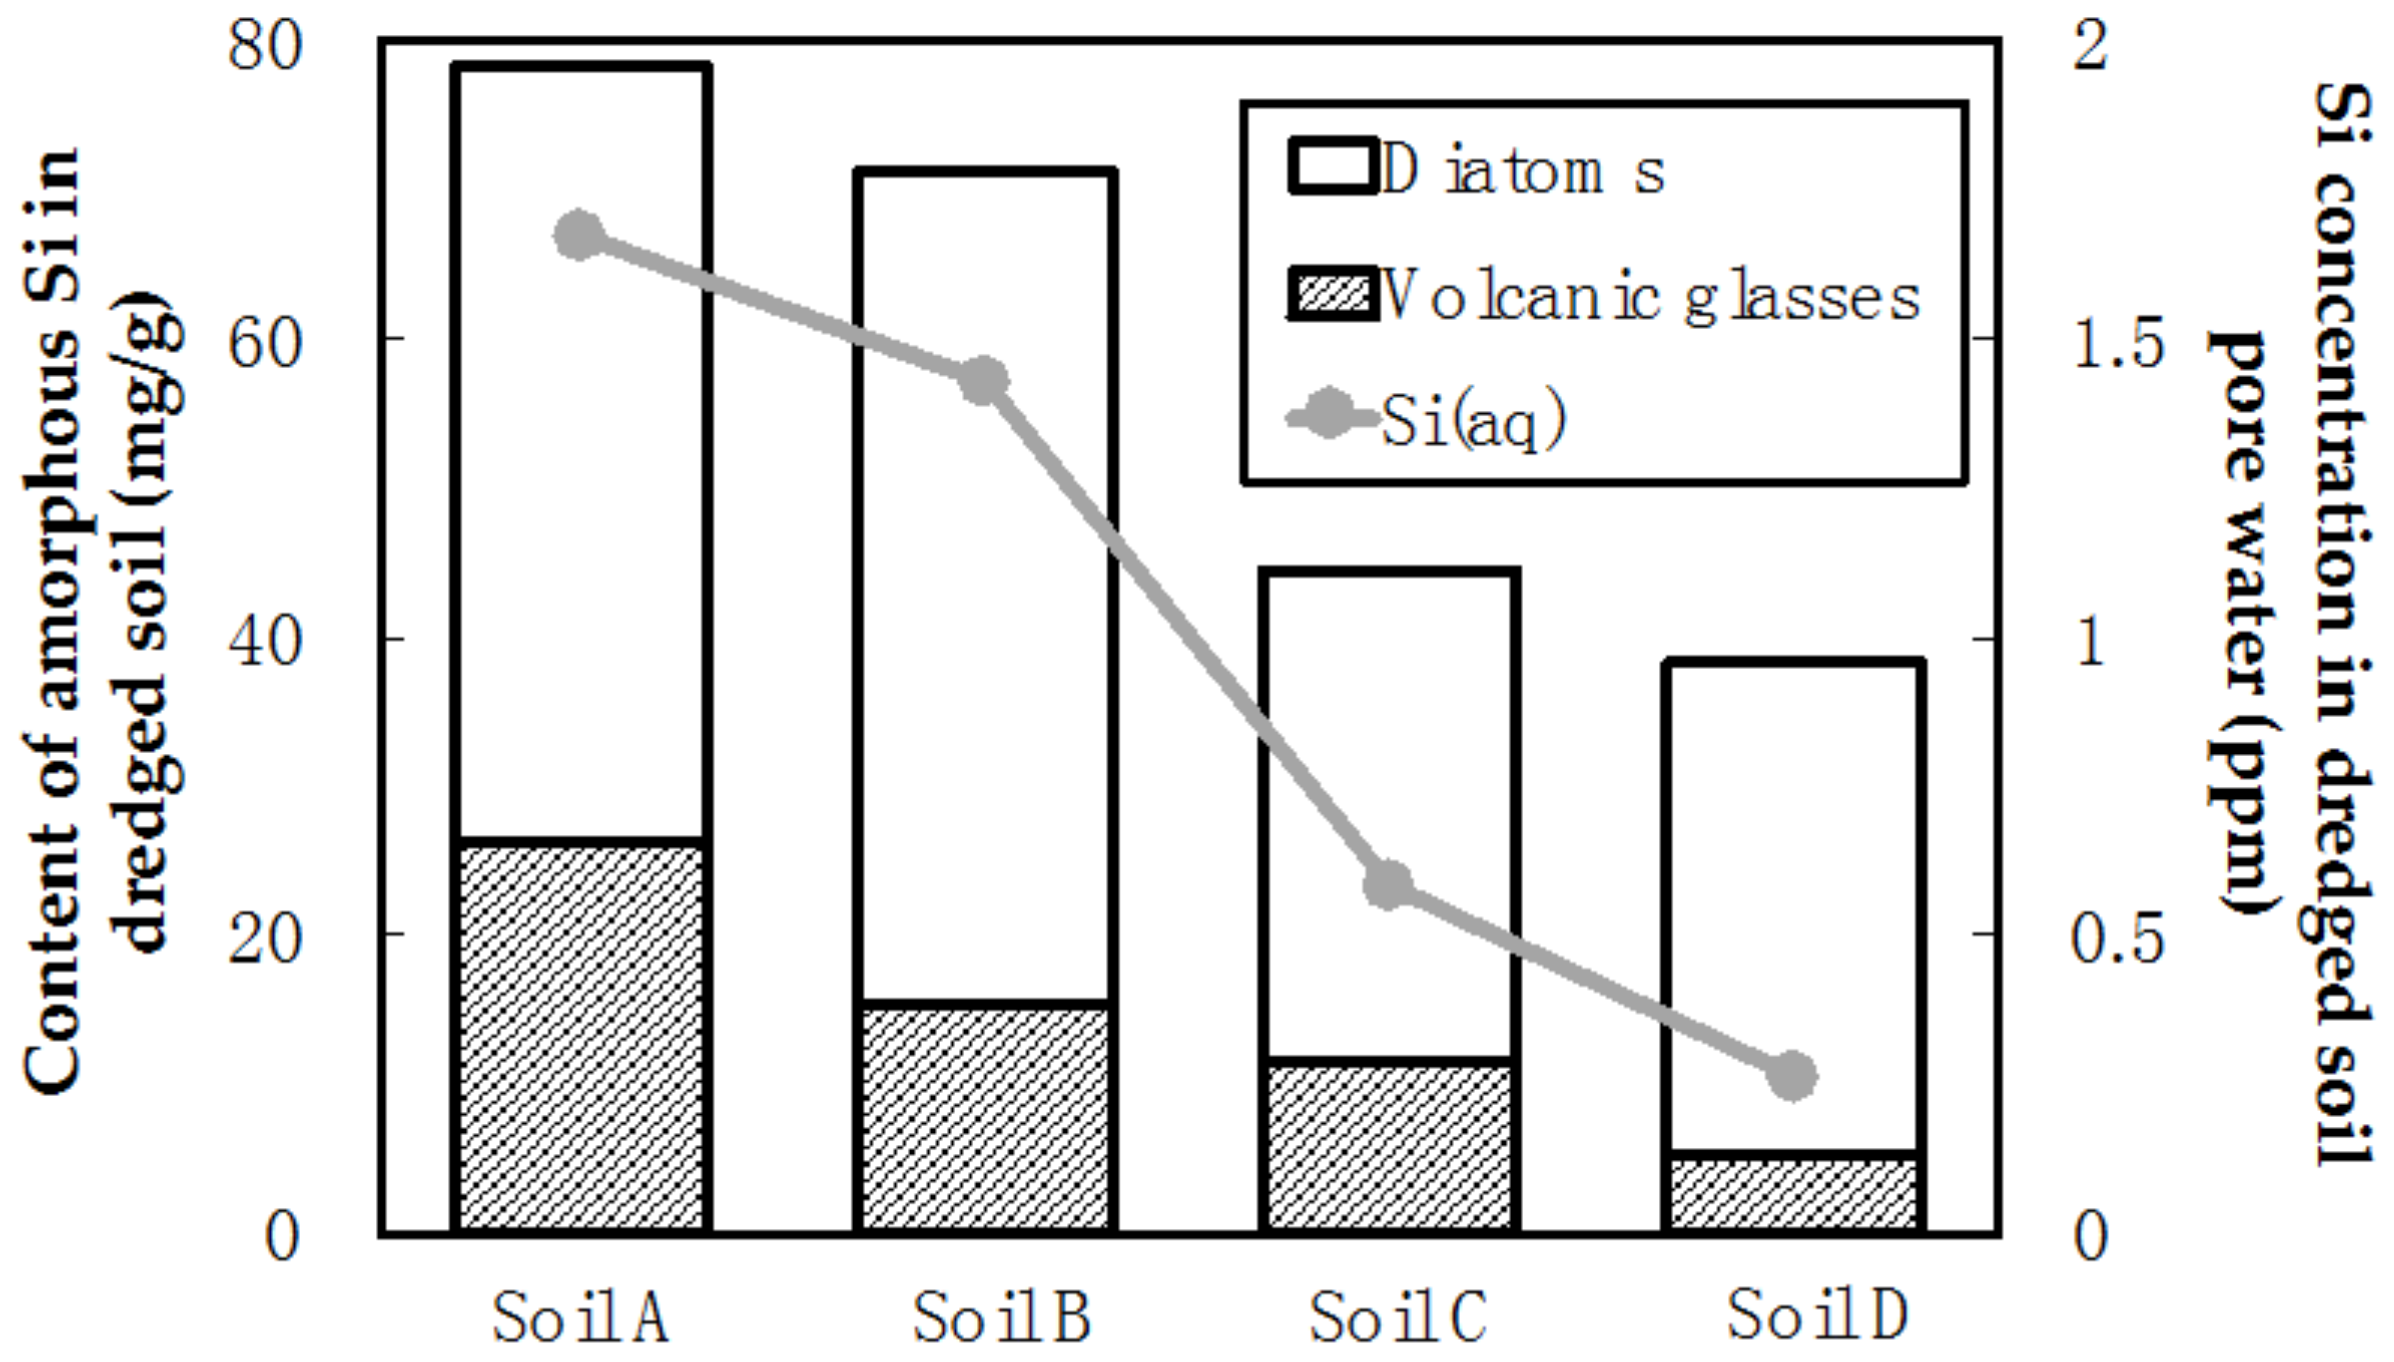
4.1.3. Factor (c): Silica Supply as a Factor in C-S-H Formation

Factor (c) here is likely dependent on the silica-bearing phases, originating in the dredged soils. The dissolution kinetics of each silica-bearing phases under hyper alkaline condition may be determining the contributing phase of Si ion supply for the C-S-H formation.
The results of the XRD analysis indicate that the mineralogical compositions of soils A, B, C, and D are not significantly different (Figure 4). The XRD results of the mixtures did not show the disappearance in the crystalline mineralogical phases including clay minerals, suggesting that they are not likely to be the source of Si ions due to their order of the rate of dissolution kinetics. Therefore, other silica-bearing phases are suggested to be present in the dredged soils, which these may be amorphous.
Amorphous silica that has a higher dissolution rate may be incorporated in the dredged soils, since dredged soils are sea sediments that could contain any particles that have settled on the sea floor. From OM observations, volcanic glass with angular plate-like shapes (Figure 6) was a component of the dredged soils. In addition, diatom frustules with rounded, triangular, moon-like shapes (Figure 5) were also observed in the dredged soils. Because both these components would be predominantly composed of amorphous silica, they are quite likely to be Si sources for C-S-H formation.
The amounts of diatom frustules and volcanic glass manifested by the dissolution experiment showed a strong positive correlation with the physical strength of the mixtures (Figure 2andFigure 7). To assess the ability of strength development of steel slag-dredged soil mixtures, amorphous silica would be an important indicator, and here the amount of amorphous silica is identified as the factor that contributes the most to the Si supply in the C-S-H formation. Furthermore, the H4SiO4(aq) concentration of pore water in the dredged soils correlate with the amorphous silica content, and this correlation could be used as a method to estimate the approximate potential for strength development namely by measuring the dissolved silica concentration of the pore water of newly sampled dredged soils (Figure 7).

4.2. Key Factors That Are Important in the Formation of C-S-H

Portlandite, which is the most likely phase in the steel slags that supply Ca ions from the steel slag-dredged soil mixtures according to [10] and in this study, is an important factor in the C-S-H formation (Figure 13a). When reaching a pH of 12.45, the dissolution equilibrium with portlandite (Figure 13b), amorphous silica in the dredged soil starts dissolving (Figure 13c), forming C-S-H and consuming Ca and Si ions, and decreasing the pH (Figure 13d). The decrease in the concentration of Ca ions and pH would make portlandite to be undersaturated in the mixtures, which would enable further the portlandite to dissolve, thus, maintain a continuous chemical reaction to form C-S-H. When the continuous cycle of C-S-H formation is established, the consumption of portlandite and amorphous silica contained in steel slags and dredged soils before reaction would both be readily attained, enabling both phases to be the main reservoir of Ca and Si ions for C-S-H formation. This could be the condition of successful C-S-H formation, and the dissolution of amorphous silica could then be seen to be the rate-determining step for the C-S-H formation. To understand the effect of the kinetics of different silica-bearing phases and the amount of amorphous silica on the formation of C-S-H, geochemical modeling of steel slag-dredged soil interactions was conducted using The Geochemist’s Workbench, to understand and evaluate the quantitative effects of amorphous silica on C-S-H formation.
The Geochemist’s Workbench thermodynamic database was loaded from Thermoddem provided by the French geological survey (BRGM). This database contains detailed thermodynamic properties of minerals forming at low temperatures, including hydrates like C-S-H that form in cements. The dissolution rate constants and the surface area of silica-bearing phases obtained from previous studies [27,28,29,30,31] were loaded in the model to understand and identify the phases responsible for the supply of Si ions to form C-S-H. The silica-bearing phases listed in Table 2 and portlandite were input in the model as reactants. Two models were calculated with these same reactants but with different quantities of amorphous silica. First, the system “Run 1” was fitted to follow the measured pH changes in the pore water in mixtures 1A and 1B, by adjusting the surface area and dissolution rate constant of portlandite and the surface area of amorphous silica (Figure 14). Run 1 required 13 vol % of portlandite and 16 vol % of amorphous silica. For “Run 2”, the quantity of amorphous silica was decreased to simulate the pH changes of mixtures 1C and 1D, to understand the quantitative effect of amorphous silica on the formation of C-S-H (Figure 14).
Run 2 required a quarter amount of the amorphous silica input compared to run 1. Run 1 and Run 2 show that amorphous silica with the highest dissolution rate among other silica-bearing phases was the main phase that dissolved to supply Si ions to form C-S-H within 91 days of reaction time (Figure 15), since it is the distinct phase in the systems that decreases in percentage in volume as the reaction progresses.
The amount of amorphous silica that is simulated to dissolve, suggests how to determine the amount of C-S-H formation, and details the pH changes in the pore water of the mixtures.

5. Conclusions

This research determined that the content of amorphous silica is one of the key factors affecting the C-S-H formation in dredged soil-steel slag mixtures.
The portlandite content in steel slags as the main factor for C-S-H formation was also suggested in a previous study [10] and was strongly supported. Here, it is also possible to state that there is no effect owing to humic acid on pH buffering on the pore water of the mixtures within the investigated samples. However, limitations of the Ca ion supply to form C-S-H or the crystal growth inhibition of C-S-H may arise by coexisting humic acids, indicating that these humic acids may play a role in suppressing C-S-H formation. The most significant discovery through this study is that when focusing on controlling component in dredged soils for C-S-H formation, one of its determining factor was found to be the content of amorphous silica, which is the most reactive of the silica-bearing phases in dredged soils. Amorphous silica can be expected to establish an equilibrium with the dredged soils pore water as it has the highest solubility among other silica-bearing phases, which may make it possible for the amount of amorphous silica to be estimated from the concentration of dissolved silica in the pore water of the dredged soils.
Presently, the strength development of mixtures is examined by actual destructive strength tests of the mixtures, which require laboratory work that is time consuming and labor intensive. If we apply the findings of the present research, estimates of the strength development based on the content of portlandite in steel slags and the dissolved Si concentration in dredged soil pore water would give a simple, easily attainable evaluation to determine whether newly sampled dredged soils and newly tested steel slags can be expected to develop sufficient strength for desired use.
The application of geochemical modeling to the systems studied here, which are a kind of alkaline-activated natural soils and sediments, showed the possibility to: (a) untangle the components that contribute to the secondary phase formation within starting materials that various components co-exist and (b) estimate the quantity of the forming secondary phases from the quantified reactive initial phases and from their dissolution kinetics.

Author Contributions

K.T. is the principal author conducting analyses, experiments, and writing this paper. T.S. is the chief supervisor of K.T. in the master’s program. T.S. designed the study. T.O. and S.N. are also supervisors. H.S. and W.N. conducted measurements of the physical properties of the samples.

Acknowledgments

This research was partly founded by Steel Foundation for Environmental Protection Technology.

Conflicts of Interest

The authors have no conflict of interest to declare.

References

  1. Standard specification for coal fly ash and raw or calcined natural pozzolan for use as a mineral admixture in concrete. In American Society for Testing and Materials; ASTM International: West Conshohocken, PA, USA, 2008.
  2. Davraz, M.; Gunduz, L. Engineering properties of amorphous silica as a new natural pozzolan for use in concrete. Cem. Concr. Res. 2005, 35, 1251–1261. [Google Scholar] [CrossRef]
  3. Phoo-Ngernkham, T.; Chindaprasirt, P.; Sata, V.; Sinsiri, T. High calcium fly ash geopolymer containing diatomite as additive. Indian J. Eng. Mater. Sci. 2013, 20, 310–318. [Google Scholar]
  4. Horii, K.; Kato, T.; Sugahara, K.; Tsutsumi, N.; Kitano, Y. Overview of iron/steel slag application and development of new utilization technologies. Nippon Steel Sumitomo Technol. Rep. 2015, 109, 5–11. [Google Scholar]
  5. Lirer, S.; Liguori, B.; Capasso, I.; Flora, A.; Caputo, D. Mechanical and chemical properties of composite materials made of dredged sediments in a fly-ash based geopolymer. J. Environ. Manag. 2017, 191, 1–7. [Google Scholar] [CrossRef] [PubMed]
  6. UNESCO International Sediment Initiative. In Sediment Issues & Sediment Management in Large River Basins Interim Case Study Synthesis Report; UNESCO: Paris, France, 2011.
  7. Amundson, R.; Berhe, A.A.; Hopmans, J.W.; Olson, C.; Sztein, A.E.; Sparks, D.L. Soil and human security in the 21st century. Science 2015, 348, 647–654. [Google Scholar] [CrossRef] [PubMed]
  8. Yi, H.; Xu, G.; Cheng, H.; Wang, J.; Wan, Y.; Chen, H. An overview of utilization of steel slag. Procedia Environ. Sci. 2012, 16, 791–801. [Google Scholar] [CrossRef]
  9. Miraoui, M.; Zentar, R.; Abriak, N.E. Road material basis in dredged sediment and basic oxygen furnace steel slag. Constr. Build. Mater. 2012, 30, 309–319. [Google Scholar] [CrossRef]
  10. Kiso, E.; Tsujii, M.; Ito, K.; Nakagawa, M.; Gomyo, M.; Nagatome, T. Method of dredged soil improvement by mixing with converter steel-making slag. Kaiyo Kaihatsu Ronbunshu 2008, 24, 327–332. [Google Scholar]
  11. Kamon, M.; Tomohisa, S.; Sawa, K. On stabilization of hedoro by using cement group hardening materials. Zairyo 1989, 432, 1092–1097. [Google Scholar] [CrossRef]
  12. Kang, G.; Tsuchida, T.; Kim, Y.; Baek, W. Influence of humic acid on the strength behavior of cement-treated clay during various curing stages. J. Mater. Civ. Eng. 2017, 29, 1–18. [Google Scholar] [CrossRef]
  13. Fukushima, M.; Yamamoto, M.; Komai, T.; Yamamoto, K. Studies of structural alterations of humic acids from conifer bark residue during composting by pyrolysis-gas chromatography/mass spectrometry using tetramethylammonium hydroxide (TMAH-py-GC/MS). J. Anal. Appl. Pyrolysis 2009, 86, 200–206. [Google Scholar] [CrossRef]
  14. Weerakoon, N.; Nishimura, S.; Sato, H.; Toda, K.; Sato, T.; Arai, Y. Laboratory estimation of stiffness and strength mobilization in steel slag-mixed dredged clays with curing time. In Proceedings of the 3rd International Conference on Ground Improvement and Ground Control, Hangzhou, China, 27–29 October 2017. [Google Scholar]
  15. Sato, H.; Nishimura, S.; Sato, T.; Toda, K.; Arai, Y. Characteristics and interpretation of development of strength and stiffness for early-age Calcia-stabilized dredged soils. In Proceedings of the Japanese Geotechnical Society, Hokkaido Branch, Japan, 28–29 January 2016; pp. 4–5. [Google Scholar]
  16. Mortlock, R.A.; Froelich, P.N. A simple method for the rapid determination of biogenic opal in pelagic marine sediments. Deep Sea Res. Part A Oceanogr. Res. Pap. 1989, 36, 1415–1426. [Google Scholar] [CrossRef]
  17. Kodama, H. Identification and quantification of non-crystalline inorganic minerals in soils by selective chemical dissolution method. Chisitsu News 1995, 496, 26–35. [Google Scholar]
  18. Vlcek, J.; Tomkova, V.; Ovcacikova, H.; Ovcacik, F.; Topinkova, M.; Matejka, V. Slags from steel production: Properties and their utilization. Metallurgy 2013, 52, 329–333. [Google Scholar]
  19. Richardson, I.G. Nature of C-S-H in hardened cements. Cem. Concr. Res. 1999, 29, 1131–1147. [Google Scholar] [CrossRef]
  20. Blanc, P.; Bourbon, X.; Lassin, A.; Gaucher, E.C. Chemical model for cement-based materials: Temperature dependence of thermodynamic functions for nanocrystalline and crystalline C-S-H phases. Cem. Concr. Res. 2010, 40, 851–866. [Google Scholar] [CrossRef]
  21. Bates, R.G.; Bower, V.E.; Smith, E.R. Calcium hydroxide as a highly alkaline pH standard. J. Res. Natl. Bur. Stand. 1956, 56, 305–312. [Google Scholar] [CrossRef]
  22. Tipping, E.; Hurley, M.A. A unifying model of cation binding by humic substances. Geochim. Cosmochim. Acta 1992, 56, 3627–3641. [Google Scholar] [CrossRef]
  23. Zhu, W.; Chiu, C.F.; Zhang, C.L.; Zeng, K.L. Effect of humic acid on the behaviour of solidified dredged material. Can. Geotech. J. 2009, 46, 1093–1099. [Google Scholar] [CrossRef]
  24. Hoch, A.R.; Reddy, M.M.; Aiken, G.R. Calcite crystal growth inhibition by humic substances with emphasis on hydrophobic acids from the Florida Everglades. Geochim. Cosmochim. Acta 2000, 64, 61–72. [Google Scholar] [CrossRef]
  25. Tremblay, H.; Duchesne, J.; Locat, J.; Leroueil, S. Influence of the nature of organic compounds on fine soil stabilization with cement. Can. Geotech. J. 2002, 39, 535–546. [Google Scholar] [CrossRef]
  26. Atkinson, A.; Everitt, N.; Guppy, R. Evolution of pH in a Radwaste Repository: Internal Reactions between Concrete Constituents; AERE-R12939; UKAEA Harwell Lab.: Harwell, UK, 1988. [Google Scholar]
  27. Brady, V.P.; Walther, V.J. Kinetics of quartz dissolution at low temperatures. Chem. Geol. 1990, 82, 253–264. [Google Scholar] [CrossRef]
  28. Chou, L.; Wollast, R. Steady-state kinetics and dissolution mechanisms of albite. Am. J. Sci. 1985, 285, 963–993. [Google Scholar] [CrossRef]
  29. Sato, T.; Kuroda, M.; Yokoyama, S.; Tsutsui, M.; Fukushi, K.; Tanaka, T.; Nakayama, S. Dissolution mechanism and kinetics of smectite under alkaline condition. In Proceedings of the International Workshop on Bentonite-Cement Interaction in Repository Environments, Tokyo, Japan, 14–16 April 2004; pp. 38–41. [Google Scholar]
  30. Huertas, F.J.; Chou, L.; Wollast, R. Mechanism of kaolinite dissolution at room temperature and pressure Part II: Kinetic study. Geochim. Cosmochim. Acta 1999, 63, 3261–3275. [Google Scholar] [CrossRef]
  31. Niibori, Y.; Kunita, M.; Tochiyama, O.; Chida, T. Dissolution rates of amorphous silica in highly alkaline solution. J. Nucl. Sci. Technol. 2000, 37, 349–357. [Google Scholar] [CrossRef]
Figure 1. Particle size distribution of (a) steel slags and (b) dredged soils of fraction smaller than 4.75 mm.
Minerals 08 00174 g001
Figure 2. Variation of mechanical properties of mixtures: (a,c) show the shear modulus (G) of the mixtures, and (b,d) show the unconfined compressive strength (qu) of the mixtures.
Minerals 08 00174 g002
Figure 3. XRD profiles of steel slag 1 and slag 2 prior to mixing with dredged soils
Minerals 08 00174 g003
Figure 4. XRD profiles of (a) randomly oriented dredged soil samples to detect mineralogical phases and (b) oriented dredged soil samples to detect clay mineralogical phases.
Minerals 08 00174 g004
Figure 5. Microscopic observations of diatom frustules incorporated in (a) soil A, (b) soil B, (c) soil C, and (d) soil D. Each scale bar represents 20 μm.
Minerals 08 00174 g005
Figure 6. Microscopic observations of volcanic glass particles incorporated in (a) soil A, (b) soil B, (c) soil C, and (d) soil D. Each scale bar repesents 20 μm.
Minerals 08 00174 g006
Figure 7. Mass of diatoms and volcanic glasses by selective dissolution experiments, calculated as SiO2.
Minerals 08 00174 g007
Figure 8. XRD profiles of mixtures cured for 0, 3, 7, 28, and 91 days of (a) mixture 1A, (b) mixture 1B, (c) mixture 1C, and (d) mixture 1D. Red circle corresponds to portlandite and black triangle corresponds to larnite.
Minerals 08 00174 g008
Figure 9. XRD profiles of mixtures cured for 0, 3, 7, 28, and 91 days of (a) mixture 2A, (b) mixture 2B, (c) mixture 2C, and (d) mixture 2D. Red circle corresponds to portlandite and black triangle corresponds to larnite.
Minerals 08 00174 g009
Figure 10. Optical microscope observations of: (a) mixture 1A before curing, (b) mixture 1D before curing, (c) mixture 1A after 3 days of curing, and (d) mixture 1D after 3 days of curing. Areas that are shaded in orange correspond to slag particles, and the blue shaded areas corresponds to voids that were filled by epoxy resin.
Minerals 08 00174 g010
Figure 11. C-S-H observed by SEM analysis of: (a) mixture 1A and (b) mixture 1D, after 3 days of curing.
Minerals 08 00174 g011
Figure 12. pH changes of the pore water in (a) mixtures 1A, 1B, 1C, and 1D and (b) mixtures 1A and 2A during the curing.
Minerals 08 00174 g012
Figure 13. Schematic mechanism of C-S-H formation cycle.
Minerals 08 00174 g013
Figure 14. pH changes of the pore water of the simulated mixtures, Run 1 with 16 vol % and Run 2 with 4 vol % of amorphous silica.
Minerals 08 00174 g014
Figure 15. Calculation of C-S-H formation by simulated steel slag-dredged soil interactions in: (a) Run 1, with 16 vol % of amorphous silica as the reactant and (b) Run 2, with 4 vol % of amorphous silica as the reactant.
Minerals 08 00174 g015
Table 1. Physical properties of the dredged soils.
Soil Particle Density (g/cm3)Liquid LimitPlastic LimitContent of Fine Particles (<0.075 mm) (%)
Soil A2.77773.428.483.2
Soil B2.73789.837.199.3
Soil C2.70944.129.191.1
Soil D2.70766.230.758.6
Table 2. Mineral dissolution rates and surface areas of silica-bearing phases loaded in the geochemical modeling as reactants.
Mineral Dissolution Rate (mol/cm2·s)Surface Area (cm2/g)ReferenceVol %
Run 1Run 2
Quartz5.37 × 10−151110Brady and Walther (1990) [27]1010
Albite4.17 × 10−15750Chou and Wollast (1985) [28]99
Smectite1.97 × 10−1653,000Sato et al. (2004) [29]77
Kaolinite3.31 × 10−1681,600Huertas (1999) [30]66
Amorphous Silica9.40 × 10−125000 (Adjusted)Niibori et al. (2000) [31]164

