Article

Quantitative Mineralogical Comparison between HPGR and Ball Mill Products of a Sn-Ta Ore

1
Departament d’Enginyeria Minera, Industrial i TIC, Universitat Politècnica de Catalunya Barcelona Tech, Av. Bases de Manresa 61-63, Manresa, 08242 Barcelona, Spain
2
TESCAN, Libušina tř. 21, 62300 Brno, Czech Republic
3
Departament de Mineralogia, Petrologia i Geologia Aplicada, Universitat de Barcelona, Carrer Martí i Franquès, s/n, 08028 Barcelona, Spain
*
Author to whom correspondence should be addressed.
Minerals 2018, 8(4), 151; https://doi.org/10.3390/min8040151
Submission received: 16 February 2018 / Revised: 4 April 2018 / Accepted: 5 April 2018 / Published: 11 April 2018
(This article belongs to the Special Issue Process Mineralogy of Critical Metals)

Abstract

:
The mineralogy and liberation characteristics of the comminuted Penouta leucogranite host of the Sn-Ta ore were determined. Grinding developed by a combination of high-pressure grinding rolls (HPGR) followed by a ball mill (BM) was compared with a single ball mill process. The mineral characteristics of the grinding products were analyzed using a Tescan Integrated Mineralogical Analyzer (TIMA-X) and X-ray powder diffraction (XRD). The ore contains 103 ppm of Ta and is mainly composed of quartz, albite, microcline, muscovite, and kaolinite. Nb, Ta-rich minerals are columbite-(Mn) and tantalite-(Mn), as well as minor microlite and wodginite. The liberation in the product is high in the size fraction of less than 250 µm (51–52 wt % for columbite-group minerals (CGM) and 74–80 wt % for cassiterite) and reduced in larger particles (8.8–17 wt % for CGM and 28–37 wt % for cassiterite). The recovery in the −250 µm fraction was high, while in the larger fraction it is limited, remaining up to 80 ppm in some tailings. The combined use of HPGR and a BM reduces the particle size distribution of the product and, thus, increases the liberation of the ores. Smaller fractions can be treated directly using gravity methods; however, particles of a size greater than +250 µm should be ground more.

1. Introduction

Tantalum has a great relevance nowadays for its use in modern technologies, is difficult to substitute using other metals [1], and is considered a critical metal [2,3,4,5]. Europe needs to have greater self-sufficiency in the exploitation of strategic metals; for this reason, the exploitation of low-grade deposits should be considered. This is the case with the tantalum ore deposits in Europe. Tantalum deposits are mainly pegmatites and rare metal granites [6]. In general, low-grade tantalum ore deposits in rare metal granites are relatively abundant in the western part of Europe. However, in order to make the exploitation of these deposits economically viable, their processing needs to be optimized. To this end, it is crucial to know the mineralogical and textural characteristics of the ores in order to be able to carry out their liberation in the most efficient way.
The selection of the comminution mechanisms is very important in the ore processing and, thus, this process consumes between 65% and 68.5% of all the energy used for processing [7]. The use of high-pressure grinding rolls (HPGR) followed by a ball mill (BM) can represent a significant increase in circuit capacity and energy savings [8,9,10].
The mineral chemistry of Ta-bearing minerals is important to establish ore processing. Tantalum occurs in a variety of oxide minerals, usually as a solid solution with niobium. In addition, some radioactive elements, such as thorium and uranium, can be present [11] in substitution of Nb and Ta, or as mineral impurities. Texture is a fundamental characteristic of ore that will determine the mineral separation [12,13]. The particle shapes have a direct influence on the interactions of the mineral with the media during processing [14], and the mineral liberation size is a determining parameter to determine the comminution process during mineral processing. In addition, knowing what minerals accompany the ore represents valuable information for applying separation techniques. The first study for predicting the natural liberation spectrum was conducted by Gaudin [15]. Since then, many liberation models have been established based on the analysis of the mineral texture and mineralogy that accompany the ore of interest [16,17,18]. In these models, the texture of an ore is simplified and characterized in such a way that the liberation distribution of the particles can be predicted as a function of the size [19].
The use of automated techniques to determine the process mineralogy provides an important tool to determine the liberation degree of ore [20,21,22,23,24]. The main advantage is the determination of a large number of particles that are important for statistical results and reduction of human error [25]. However, the correct interpretation of automated mineralogy data requires a mineralogical understanding of the material [26], and must usually be used in conjunction with other mineralogical techniques, e.g., this technique does not distinguish between polymorph minerals. Another problem is the difficulty in obtaining a representative sample to analyze [27]. A previous mineral knowledge of the sample is necessary to obtain good results. This is especially important for minerals that form solid solutions, such as Nb-Ta oxides, or those with lithium or hydroxyl groups. The use of scanning electron microscopy (SEM) and an electron microprobe analyzer (EMPA) can be decisive in predicting the minerals present in the sample. Additional problems can be derived from sample preparation; this needs to prevent the agglomeration of particles so that automated mineralogy techniques do not consider it as a single particle [28]. Moreover, some stereological errors are made with the use of mineralogical techniques based on the analysis of polished sections [29,30]; however, several methods were proposed to introduce a correction or provide suggestions for making the estimation [31].
The aim of this work was to characterize the ground products for low-grade tantalum ore and to compare the liberation degrees of two different milling procedures to determine the best option to optimize mineral processing operations. The grinding procedures include HPGR and BM devices.

2. Study Area

The Penouta ore deposit is located in Penouta village, in the municipality of Viana do Bolo, Ourense, Galicia, northeast of Spain. It is a Sn-Ta greisen-type ore deposit, where mineralization occurs in quartz veins related to the greisen and in the surrounding leucogranites. The Penouta leucogranite is hosted in metamorphic rocks, mainly constituted by gneisses and mica-schists corresponding to the Viana do Bolo series. This deposit has been mined for Sn, and occasionally for tantalum, since Roman times. In 1983, the exploitation of the ore deposit ended due the low price of metal and the poor recovering degree of Sn, approximately 30% of the total tin content [32]. As a result, several tailings remain close to the mine [33].
The mining interest in the area is the ancient Sn-Ta ore open pit and the ancient tailings, which still contain significant amounts of Sn and Ta. The mineralogy of the open pit was recently reported in ore deposit studies [33,34,35]. The process mineralogy study of the largest tailing is presented in this volume [36].

3. Materials and Methods

3.1. Sample Preparation

A representative sample of the ancient open pit of the Penouta mine was used. An initial sample of 1 ton of leucogranite was sorted, and 15 kg were used in the experiments. The sample, after the primary crushing by jaw crusher, was split and prepared into two parts for further crushing by either HPGR or BM, and only BM at the mines laboratory at the Polytechnic University of Catalonia. Ball mill tests were carried out in a mill with an internal diameter of 305 mm and a length of 305 mm, with conditions shown in Reference [37]. A HPGR test was conducted using a unit of 25 cm diameter rolls and a width of 15 cm that was fully equipped to control and record the hydraulic pressures, which runs at 40 bar. These experiments were conducted effectively, with representative samples of the same feed being milled in each device to two target product size distributions (+600 and −600 µm). The top feed size for the units was 5–20 mm and the products from the HPGR and BM were then screened into two fractions (+600 and −600 µm). The sample top size (+600 µm) from HPGR was fed to the BM and comminuted for 10 min. in the same way as the first ball milling. In this study, subsamples from two size fractions in the products were subjected to a shaking table to study the effect of milling on the liberation process.
Due to the low Ta content in the Penouta deposit, it had to be concentrated in order to obtain a high number of ore particles to be studied. After the sample was ground, it was sieved and fed into a laboratory scale Holman-Wilfley shaking table separation. The screened samples under 600 µm were physically separated into two fractions (−250 µm and −600 + 250 µm) in order to obtain concentrate samples. In the schematic diagram of sample preparation, (Figure 1) C1, C3, and C5 are −250 µm and C2, C4, and C6 are −600 + 250 µm.

3.2. Analytical Methods

The whole rock sample and the Sn, Ta, Nb, U, and Th of all the grinding products were analyzed at ALS laboratories by X-ray fluorescence (XRF) using glass beads, followed by acid digestion and Inductively Coupled Plasma Mass Spectrometry (ICP-MS).
Mineralogy was determined by optical microscopy, X-ray powder diffraction (XRD), scanning electron microscopy with energy-dispersive spectral analysis (SEM–EDS) in the back-scattered electron mode (BSE), and EMPA. Electron microprobe analyses were obtained in a JEOL JXA-8230 electron microprobe. X-ray diffraction data were collected with a PANanalytical X’Pert PRO MPD X-ray diffractometer at the Centres Cientifics i Tecnològics de la Universitat de Barcelona. Identification and Rietveld semiquantitative evaluation of phases were made on PANanalytical X’Pert HighScore software. Scanning electron microscopy with SEM–EDS was used in the BSE mode.
A JEOL JXA-8230 EMPA located at the Centres Cientifics i Tecnològics de la Universitat de Barcelona was used to obtain the chemistry of minerals. More than 500 analyses on Nb-Ta-rich minerals were conducted at an accelerating voltage of 20 kV, an electron beam current of 20 nA, and a beam diameter of 2 μm. Each element was counted for 5 s, except Ti, Sc, and Pb, which were counted for 10 s and F for 15 s. Standards used were: Nb (NbLα), Ta (TaLα), Fe2O3 (FeKα), rhodonite (MnKα), rutile (TiKα), ThO2 (ThMα), UO2 (UMβ), Sn (SnLα), W (WLα), Sc (ScKα), albite (NaKα), apatite (FKα), and wollastonite (CaKα). The detection limits are 0.17 wt % U; 0.1% wt. Th and W; 0.06 wt % Ta, Sn and Nb; and <0.03 wt % for other elements. The formulas for columbite-group minerals (CGM) were calculated on the basis of 24 atoms of oxygen and 12 cations. The excess of cations was compensated by recasting FeO to Fe2O3 [35].
Automated mineral liberation analysis was used to quantify the mineralogical characteristics of particles and grains. Samples from all the concentrates obtained from HPGR and BM were analyzed using a new generation of the Tescan Integrated Mineralogical Analyzer (TIMA-X). All samples were micro-riffled to produce a representative subsample to be mounted and polished for TIMA-X analysis. Samples were prepared with an addition of graphite flakes. Perpendicular cross-sections through the mounts were created once the epoxy was cured. The cross-sections were remounted in order to avoid the effect of heavy particle settling. It was carried out at the Tescan facilities in Brno, Czech Republic. Measurements were performed using an acceleration voltage of 25 kV and a current of 7.47 nA. Dot mapping analytical mode was used for the analysis. The image was segmented in two stages using this approach. The BSE imaging based segmentation with a resolution of 2 µm and preceded the actual collection of EDS spectra. The EDS analytical points (3000 counts) were placed in the middle of each segment smaller than the predefined distance of 10 µm. Segments larger than this value were covered with a regular mesh of analytical points 10 µm apart. Segment boundaries were adjusted based on the chemical information obtained by EDS in the next stage of segmentation.

4. Results and Discussion

4.1. Chemical and Mineralogical Characterization of the Bulk Sample

The Penouta leucogranite from the open pit area shows a range from 81 to 140 ppm Ta and 50 to 64 ppm of Nb [35]. The sample used in this study has between 103 ppm of Ta, 81 ppm of Nb, 383 ppm of Sn, and 35 ppm of W. Radioactive elements are present in small amounts, 2.40 ppm of Th and 2.48 ppm of U.
Textural characteristics of tantalum ore from granitic rocks are usually important for process planning. The texture of the rocks and the characteristic texture of the CGM (columbite-tantalite) will define the behavior of this material during comminution.
The inequigranular texture of the Penouta granitic rock is due to the presence of relatively large grains of quartz, 1–2 mm in size, included in a matrix of other grains lower than 0.5 mm. These are constituted by albite, quartz, K-feldspar (microcline), albite, and muscovite, with minor amounts of kaolinite, garnet (spessartine), tourmaline of schorl type, biotite, zircon, monazite, beryl, cassiterite, and Nb-Ta oxide minerals.
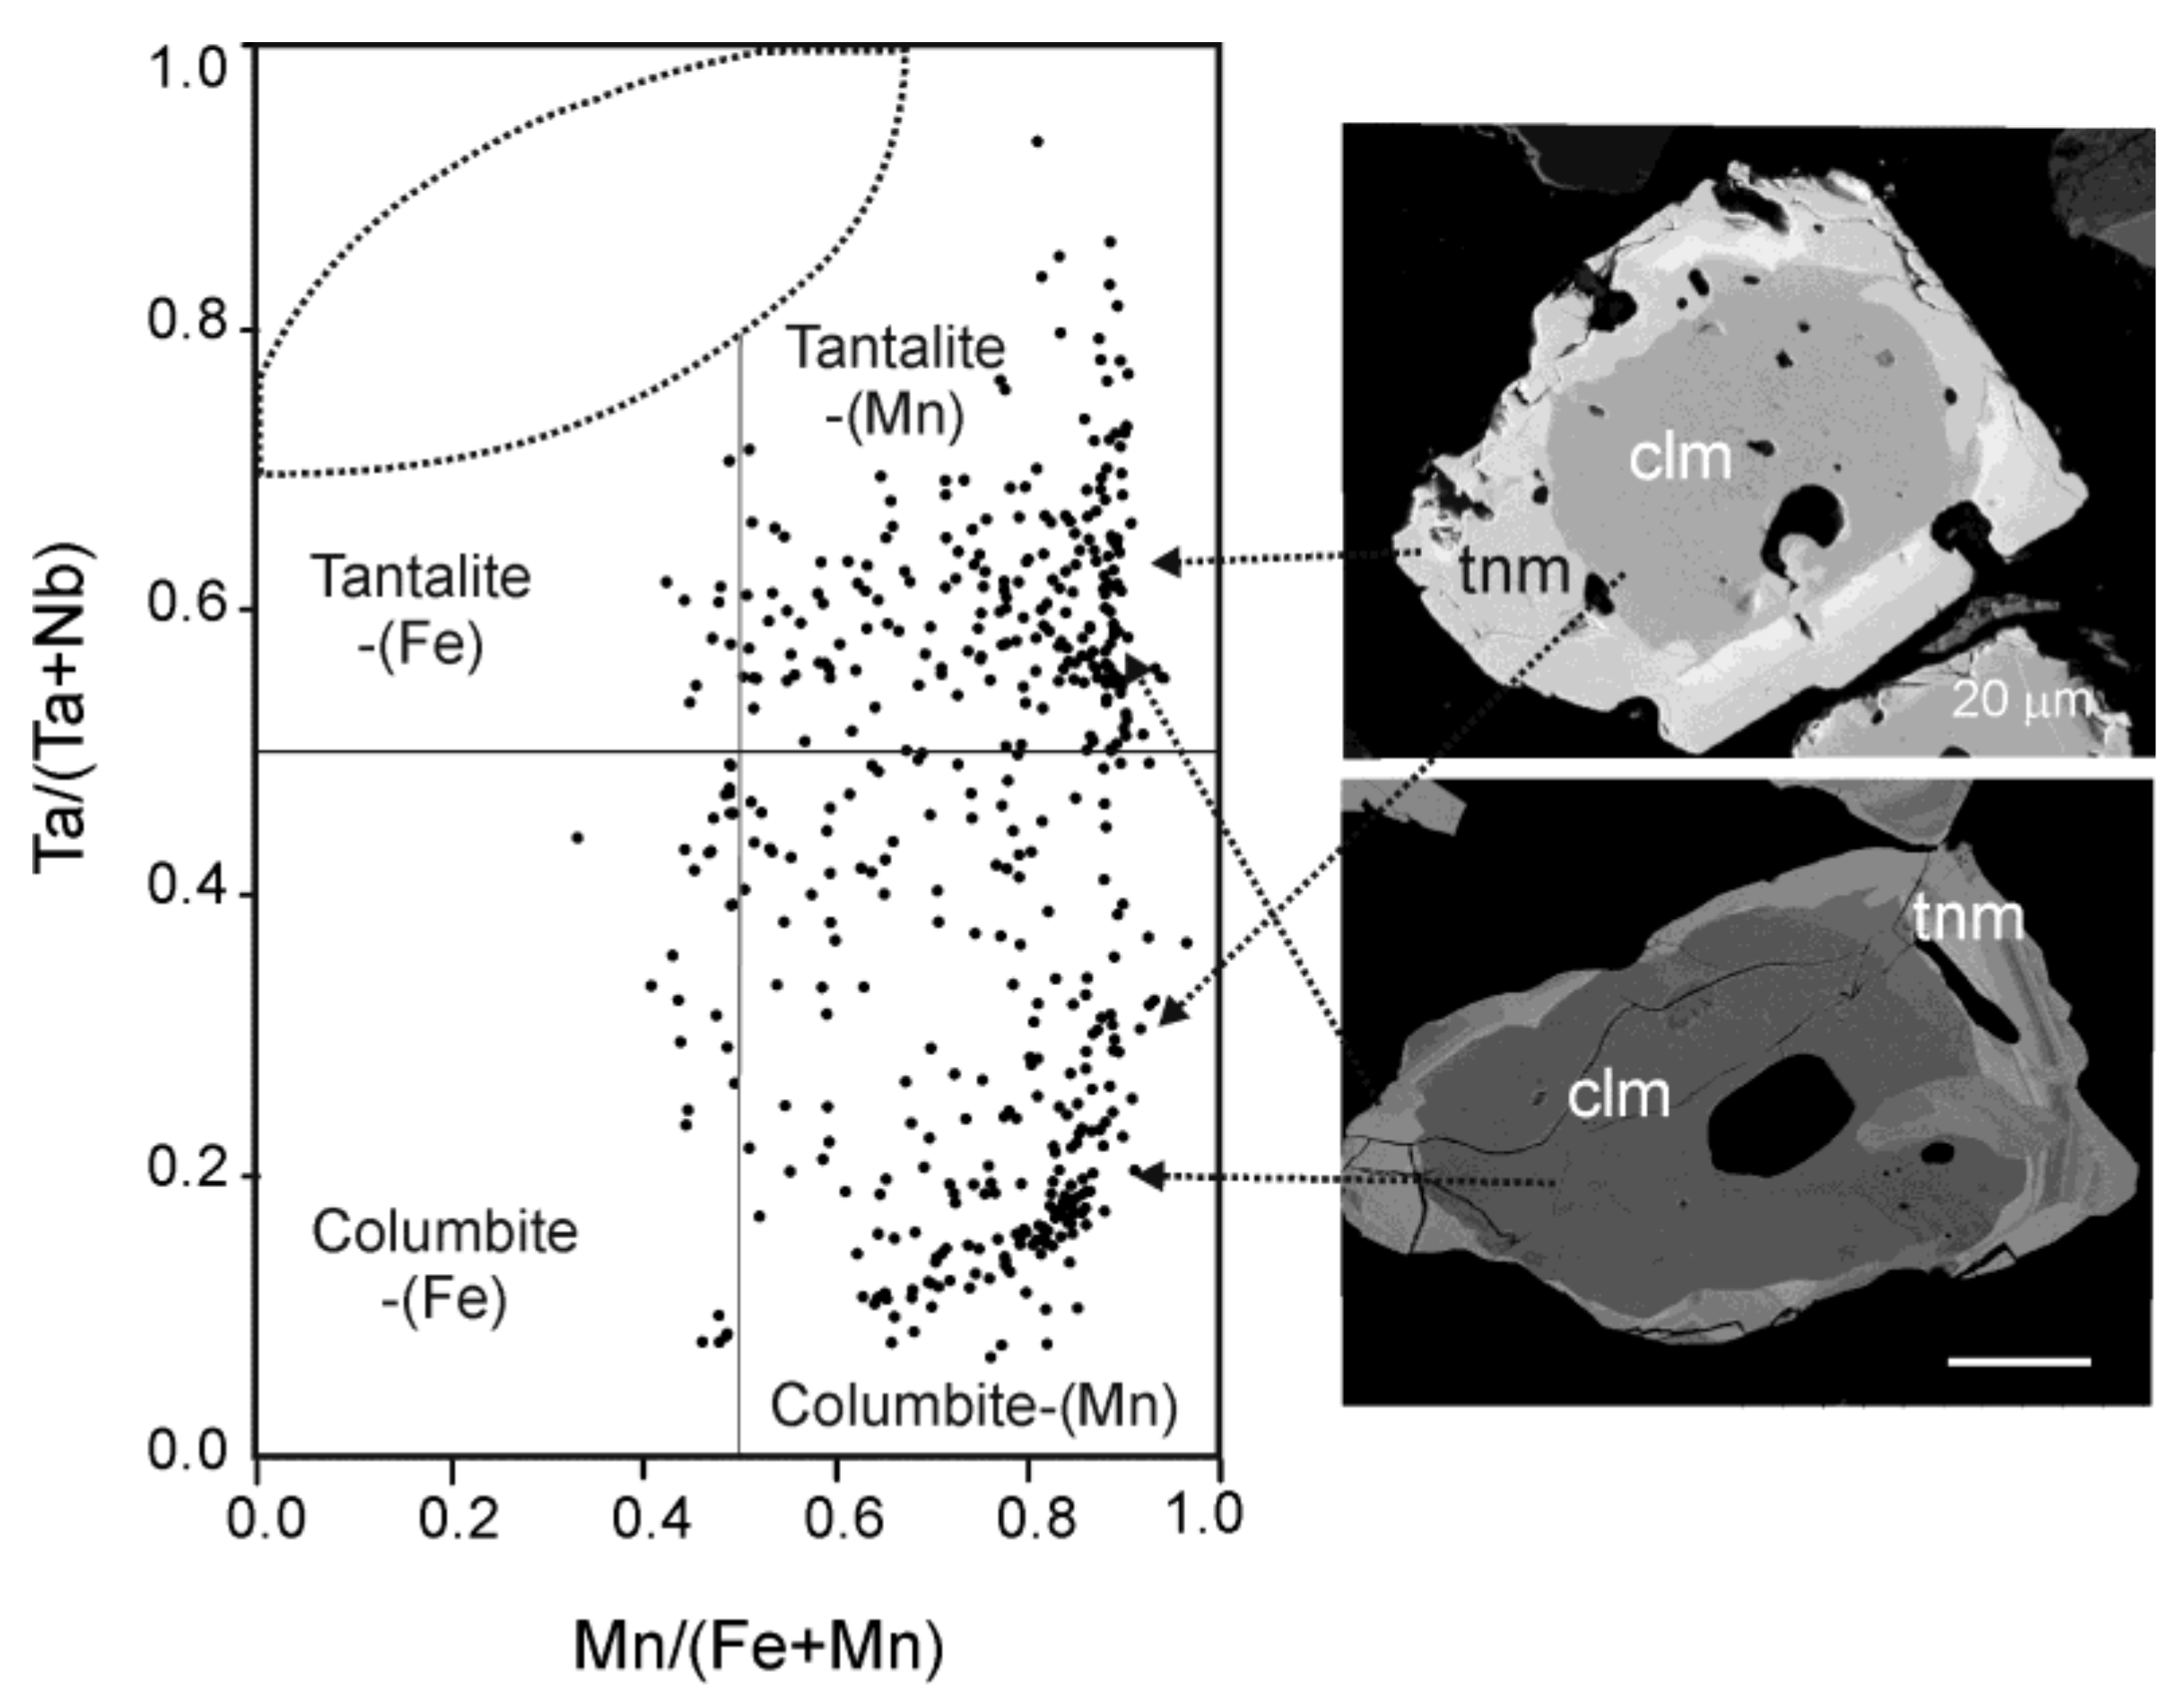
A detailed characterization of Nb-Ta oxide minerals from Penouta is presented in [33,34,35]. Nb and Ta occur mainly in minerals of CGM. This group is constituted by a solid solution of columbite and tantalite, with a general formula of (Fe,Mn)(Nb,Ta)2O6 and four end members: columbite-(Fe), FeNb2O6; columbite-(Mn), MnNb2O6; tantalite-(Fe), FeTa2O6; and tantalite-(Mn), MnTa2O6. The EMPA data of the ore used in the experiments indicates that these minerals are predominantly columbite-(Mn) and tantalite-(Mn), (Figure 2 and Table 1).
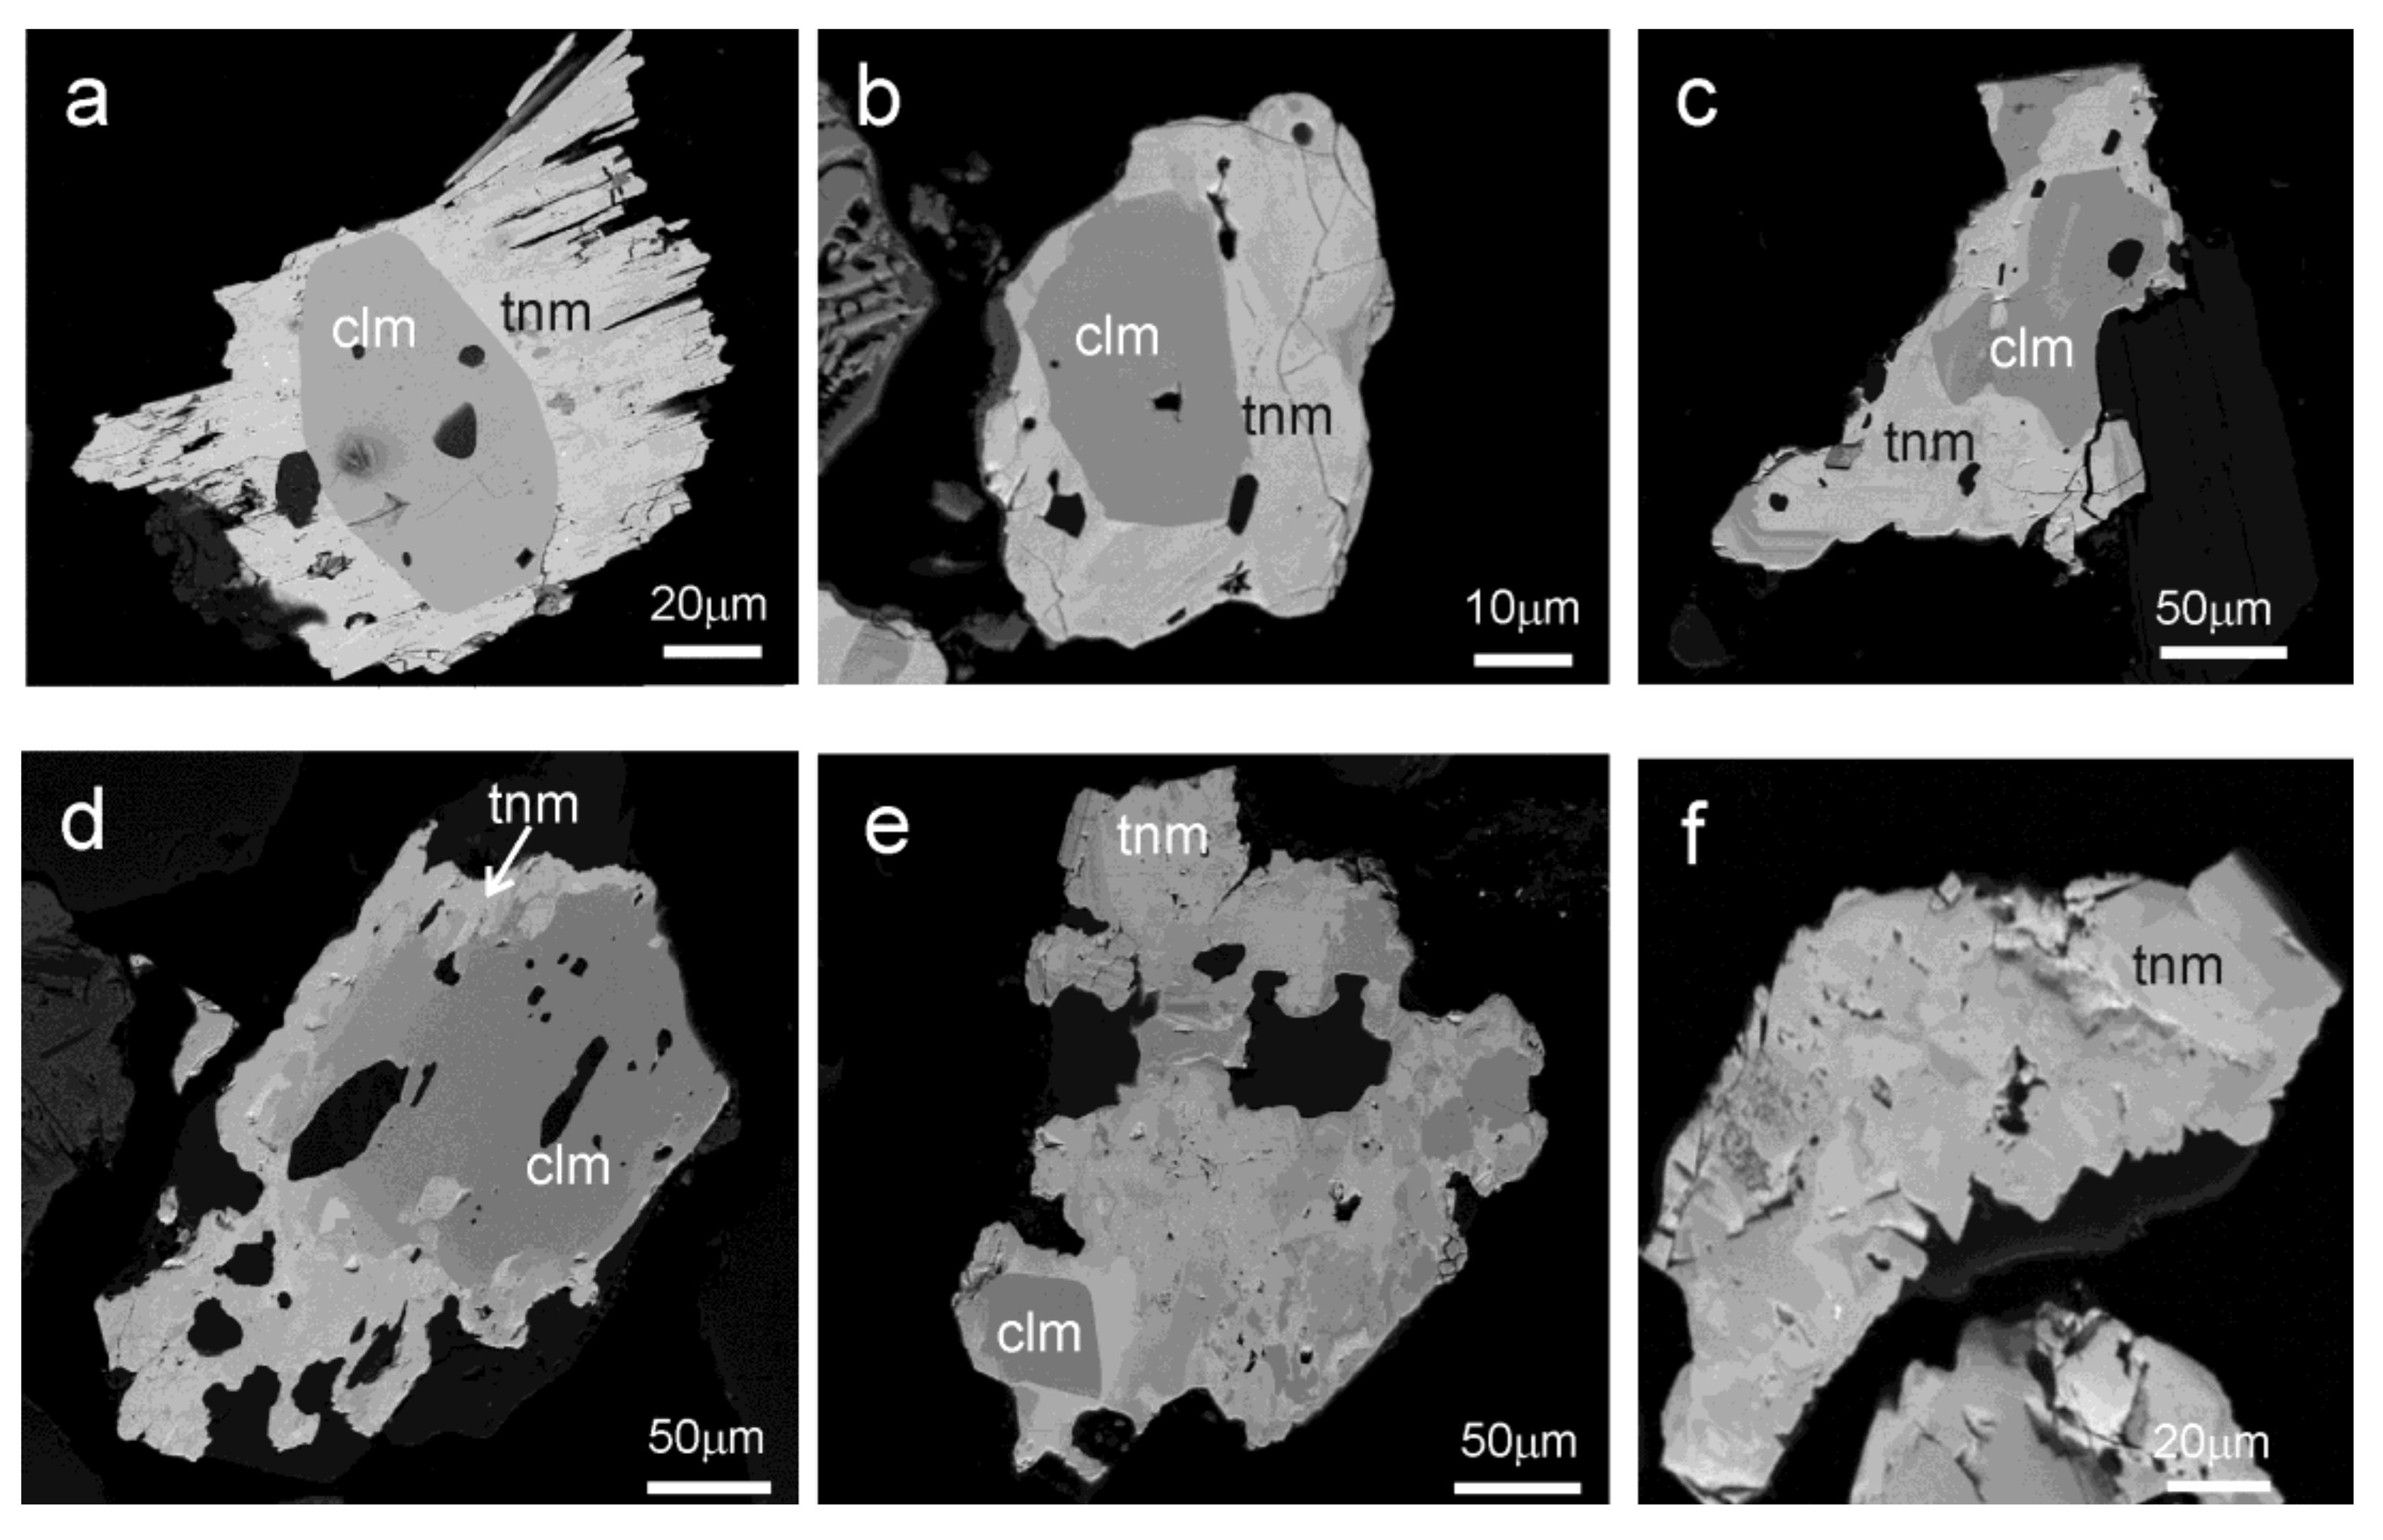
CGM usually occur as grains of less than 250 µm with variable composition, consisting of tantalite and columbite distributed in the same grain following different patterns. The most common textural pattern is presented as grains with a Nb-rich core and a Ta-rich rim (Figure 2 and Figure 3).
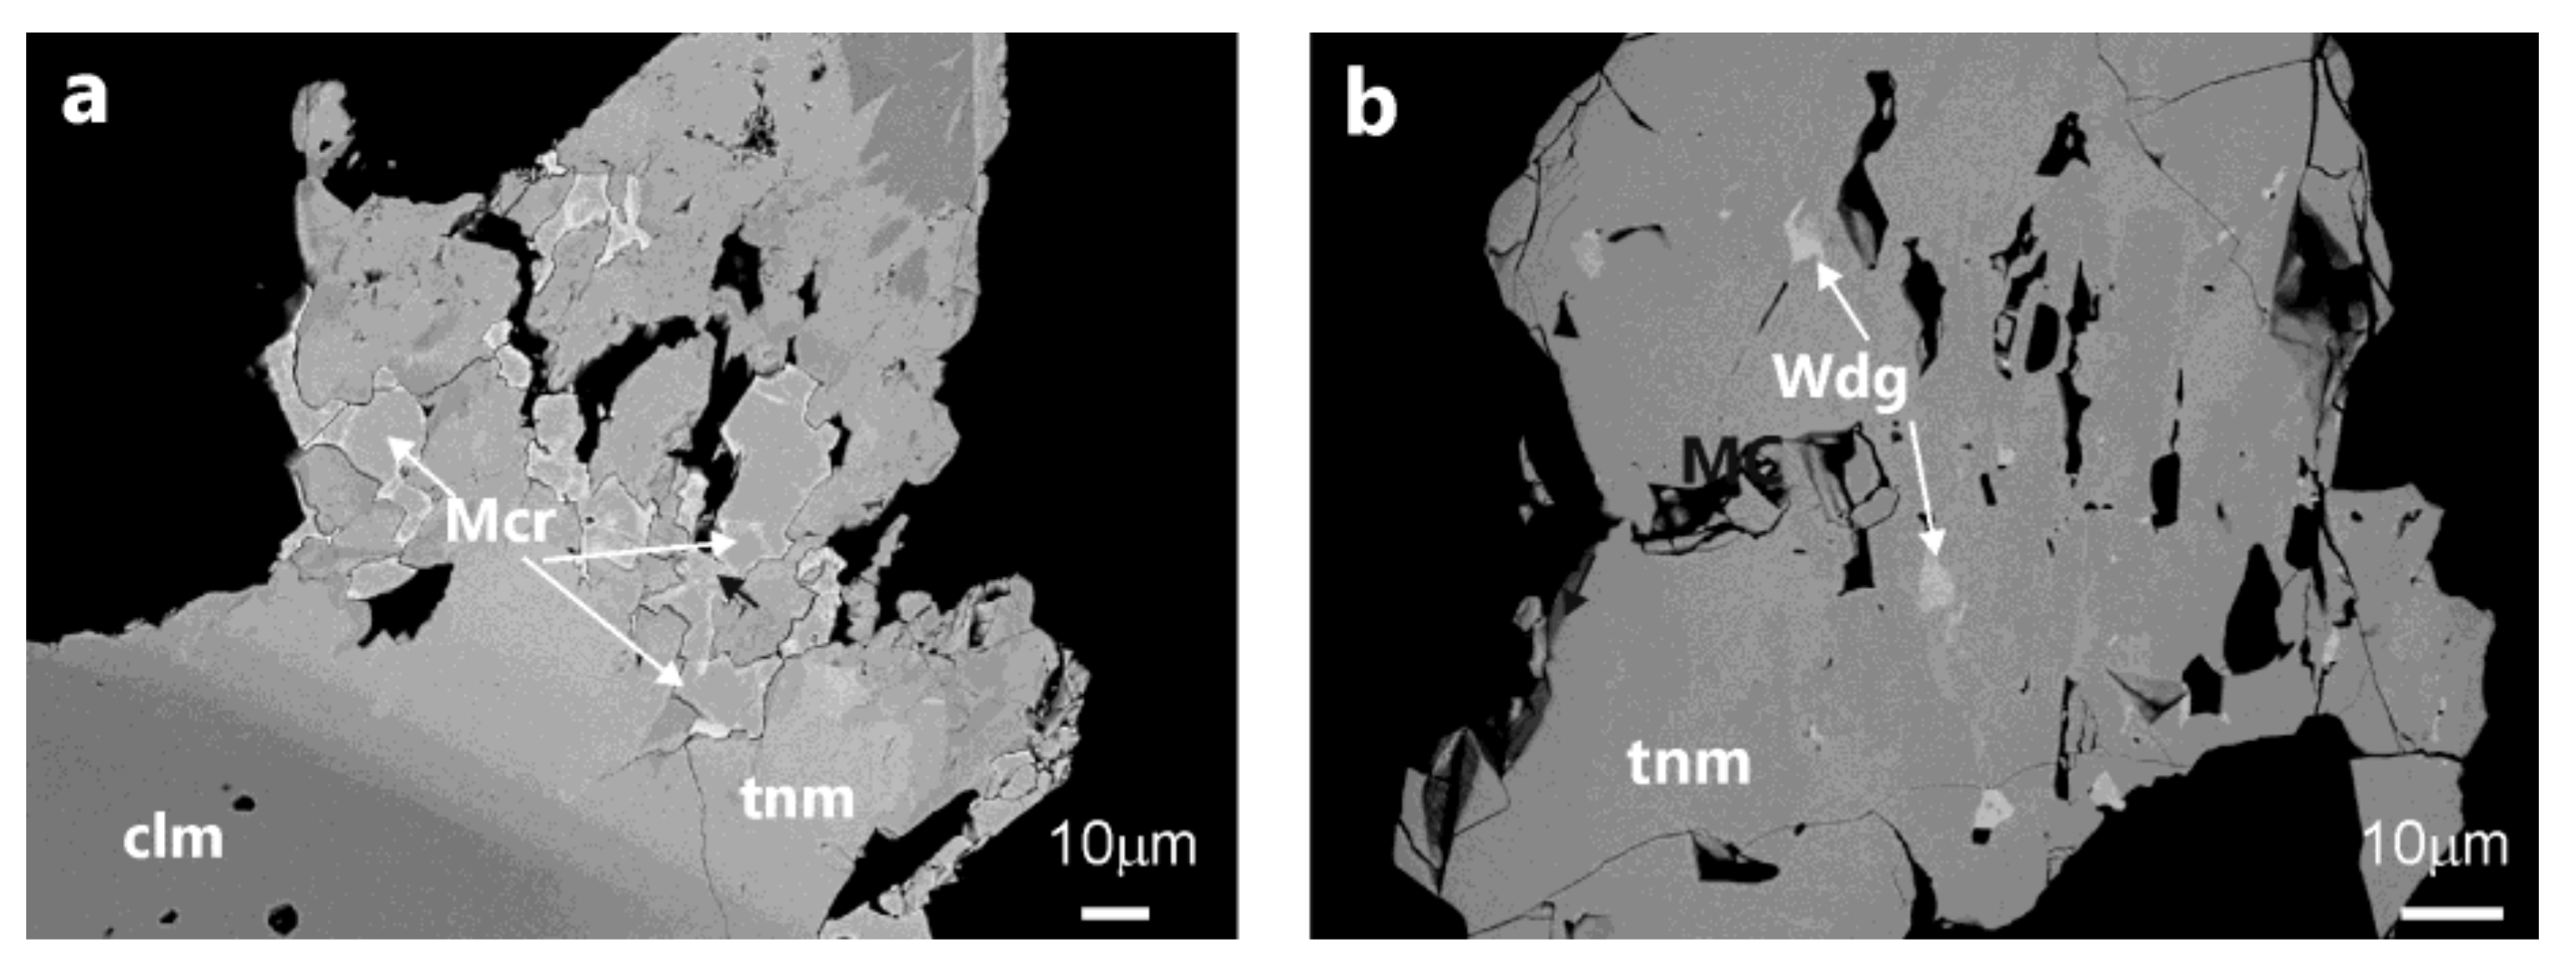
Microlite-group minerals, (Ca,Na,REE,U,Y,)2(Ta,Nb)2O6(O,OH), are generally present in Penouta as crystals a few microns in size and are associated with columbite-tantalite (Figure 4a). The chemical composition is highly variable. Although Ca (being classified as oxymicrolite) is the most abundant cation in Penouta, in some cases, U and Pb contents are also abundant, and kenoplumbomicrolite occasionally occurs as rims around microlite. Wodginite, (Ta,Nb,Sn,Mn,Fe)4O8, is present in minor amounts. Under the SEM, it has a grey color that can only be determined with the EDS due to its high content in both Ta and Sn (Figure 4b).
Cassiterite is the most abundant ore mineral in Penouta, and it occurs as homogeneous subhedral to anhedral grains. The chemical composition shows a high Ta content, up to 9 wt % of Ta2O5.

4.2. Characterization of the Comminuted Products

4.2.1. Particle Size Distribution (PSD)

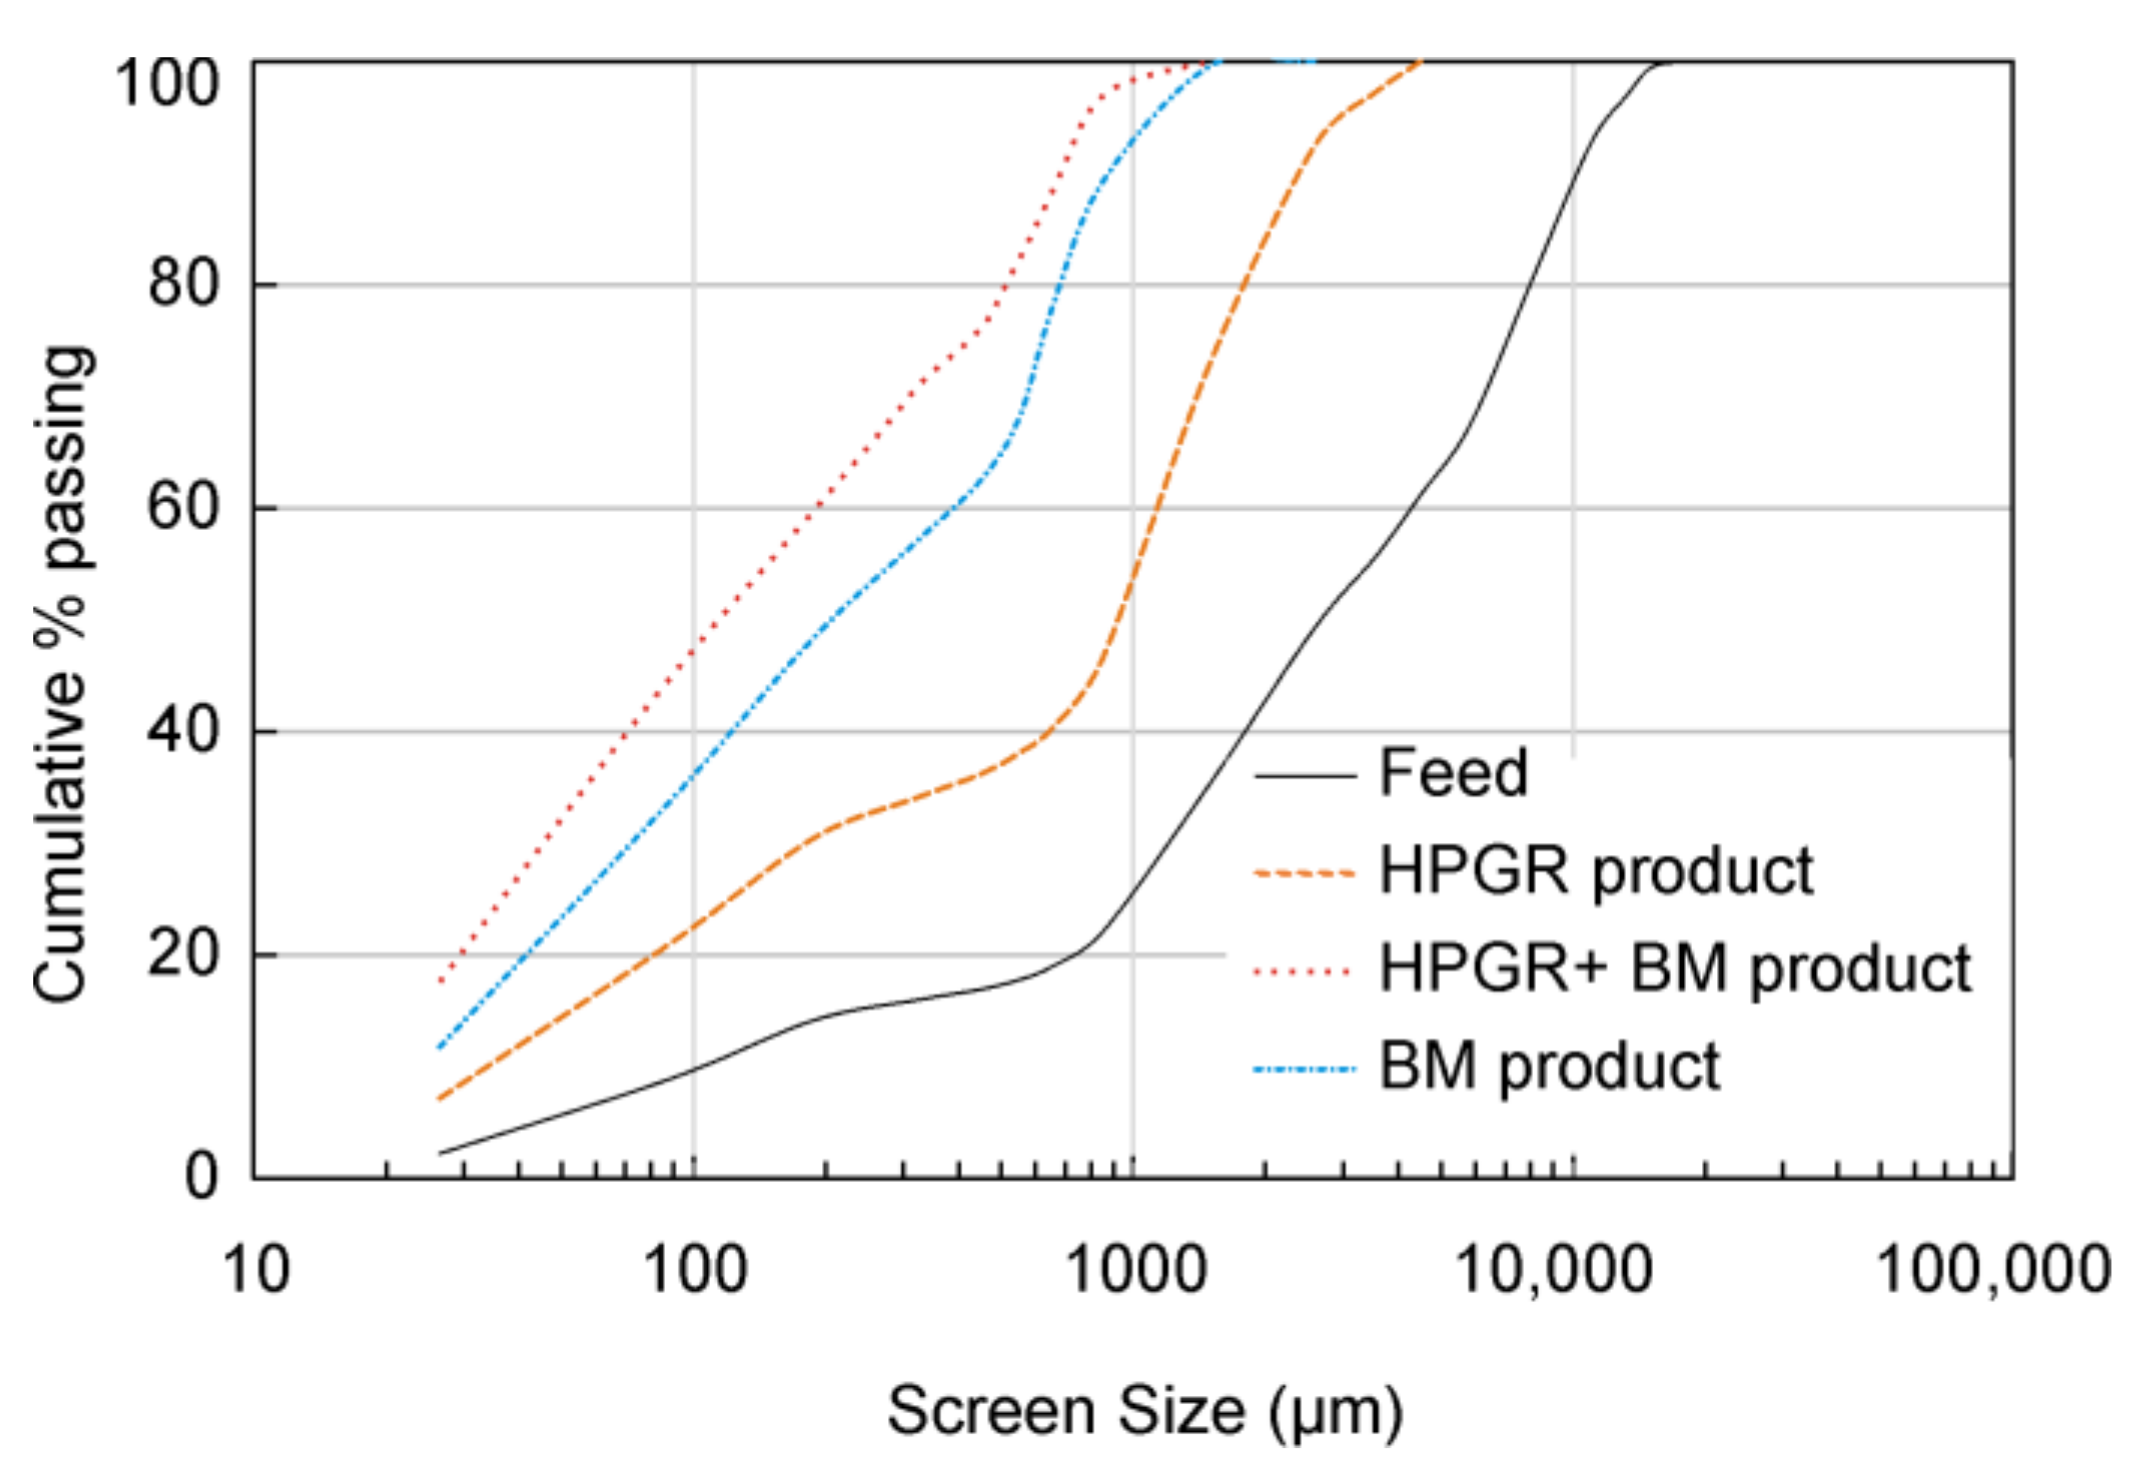
The particle size distributions obtained after grinding using HPGR and a BM, or only a BM, are similar (Figure 5). After the HPGR grinding 40 wt % of the material is smaller than 600 μm. From this, 31.8 wt % is lower than 250 μm, and 8.8 wt % is in the range 250–600 μm. Finally, only 11 wt % of the material is coarser than 600 μm. In the BM product, 22.8 wt % of processed material is higher than 600 μm, and about 61 wt % is lower than 250 μm. According to Reference [38], when the HPGR unit was in an open circuit together with a BM, it had no significant effect on the fineness of the final comminuted product. However, in the present investigation, the BM combined with a previous step of HPGR produces a finer end product than with the BM alone.

4.2.2. Modal Mineralogy

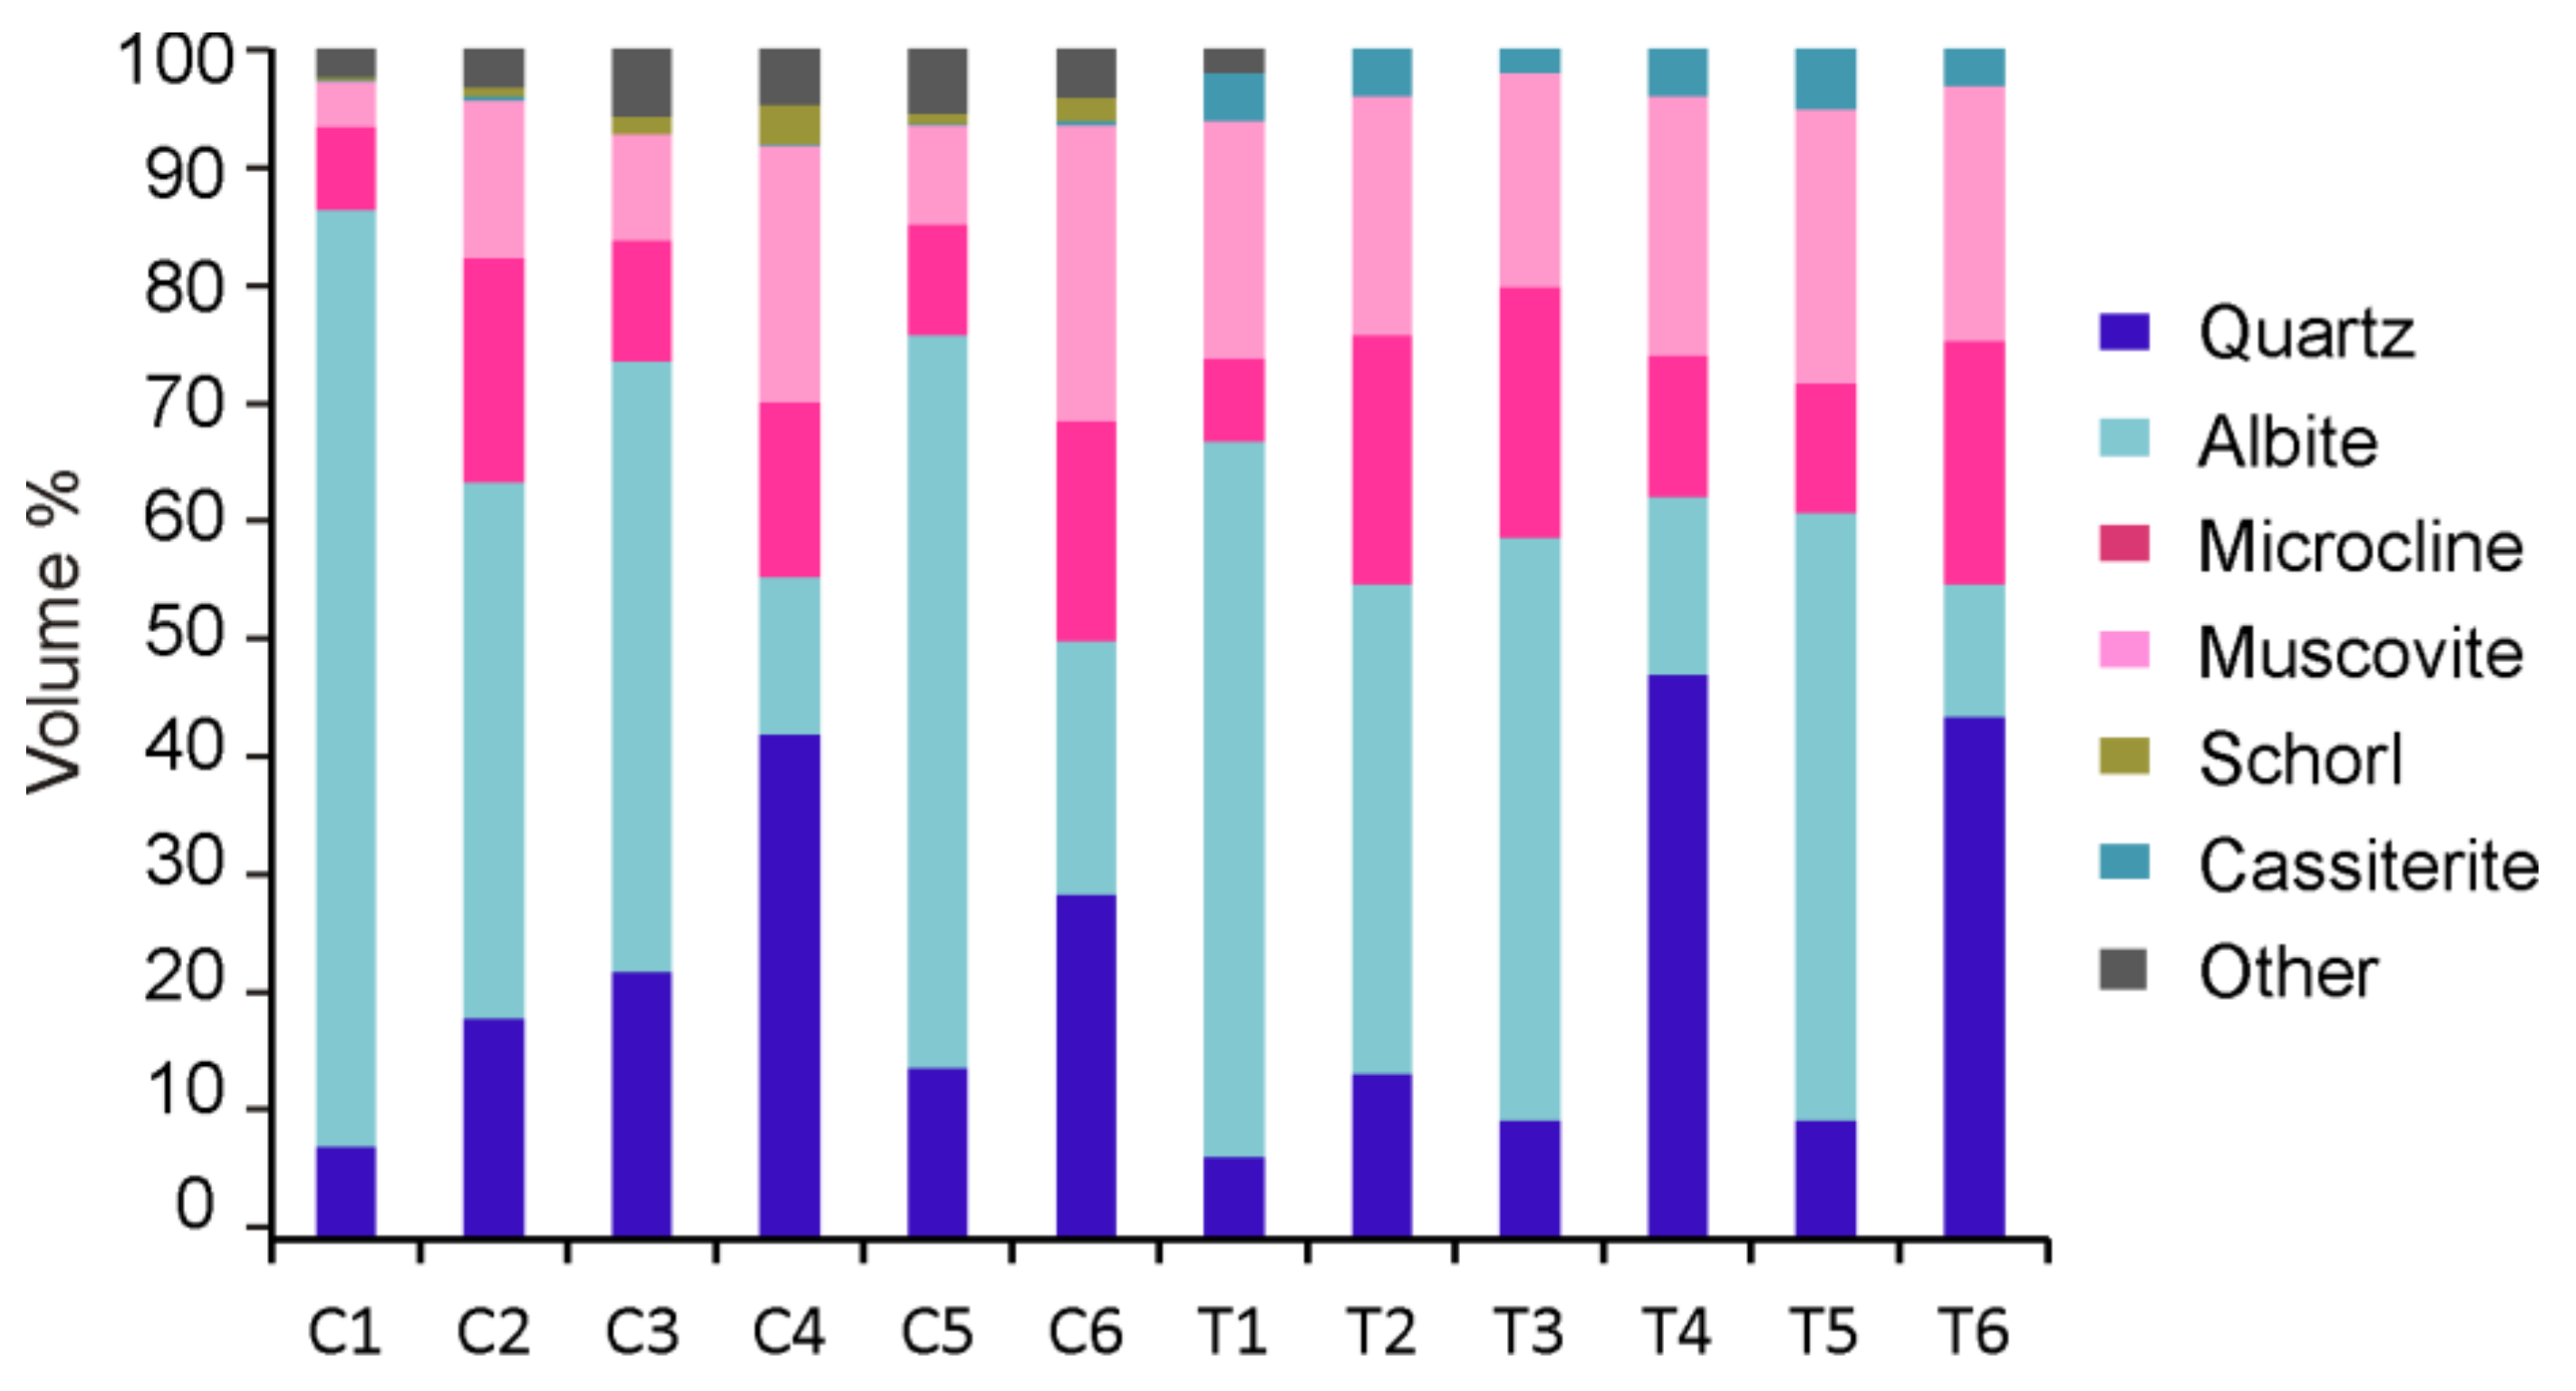
The modal mineralogy of concentrates from the open pit of Penouta was determined by TIMA-X (Figure 6), and the composition of the resulting tailings was obtained by XRD. The combination of both techniques is useful to obtain a complete mineralogical characterization. X-ray powder diffusion ensures representativeness in coarse-grained samples, because it measures millions of particles as a result of grinding the sample to less than 60 µm. However, this technique can only detect minerals in concentrations over 1 wt % [39]. Thus, these techniques are complementary, and often the combination of both is necessary to obtain satisfactory results.
Albite is the most abundant mineral in all fractions of −250 µm, whereas quartz is dominant in concentrates from the coarser fractions of the final processes (C4 and C6) and the equivalent ratios in tailings (T4 and T6). K-feldspar is microcline, as indicated by the XRD data and by the presence of the grid twining. This mineral occurs in variable amounts, being more abundant in concentrate products of coarser size, with 7–10 wt % in products of a size less than 250 µm, and 15–50 wt % in products between 250 and 600 µm.
Optical and XRD allowed determining that K-feldspar is microcline. This is homogeneously distributed, except in the fraction of −250 µm obtained from HPGR processing, which has a lower content.
Muscovite content is considerably different in concentrates and tailings. The most significant difference between the mineralogical data obtained from TIMA-X and XRD is the amount of muscovite. The sheet structure of this mineral makes quantification difficult in the analysis of sections and also in XRD estimations. Muscovite is usually overestimated in XRD analyses due to the preferential orientation of crystals [40]. Other studies also found discrepancies in the content of micas between the results provided by both techniques [41].
Minor minerals have been included in Figure 6 as are other minerals. These are mainly beryl, phosphates, such as apatite, xenotime, and monazite, and scheelite, pyrite, hematite, and ilmenite.
The composition of minerals in tailings after the gravity concentration of Nb-Ta minerals is presented in Table 2. Albite is the most abundant mineral in the tailing products finer than 250 µm, whereas quartz is predominant in products of +600 µm (T7 and T8) and in the size fraction of 250–600 µm that was not grinded with HPGR. Although the obtained quartz contents were higher in the tailings, they vary proportionally with those from the respective concentrates.

4.2.3. Morphology and Texture of Particles

The mineral composition maps of the Nb-Ta rich minerals (Figure 7) show their morphology and mineral association. Although columbite and tantalite are usually present in the same particle, tantalite occurs in particles smaller than those of columbite. This is also partly evident in the images due to a possible stereological error.
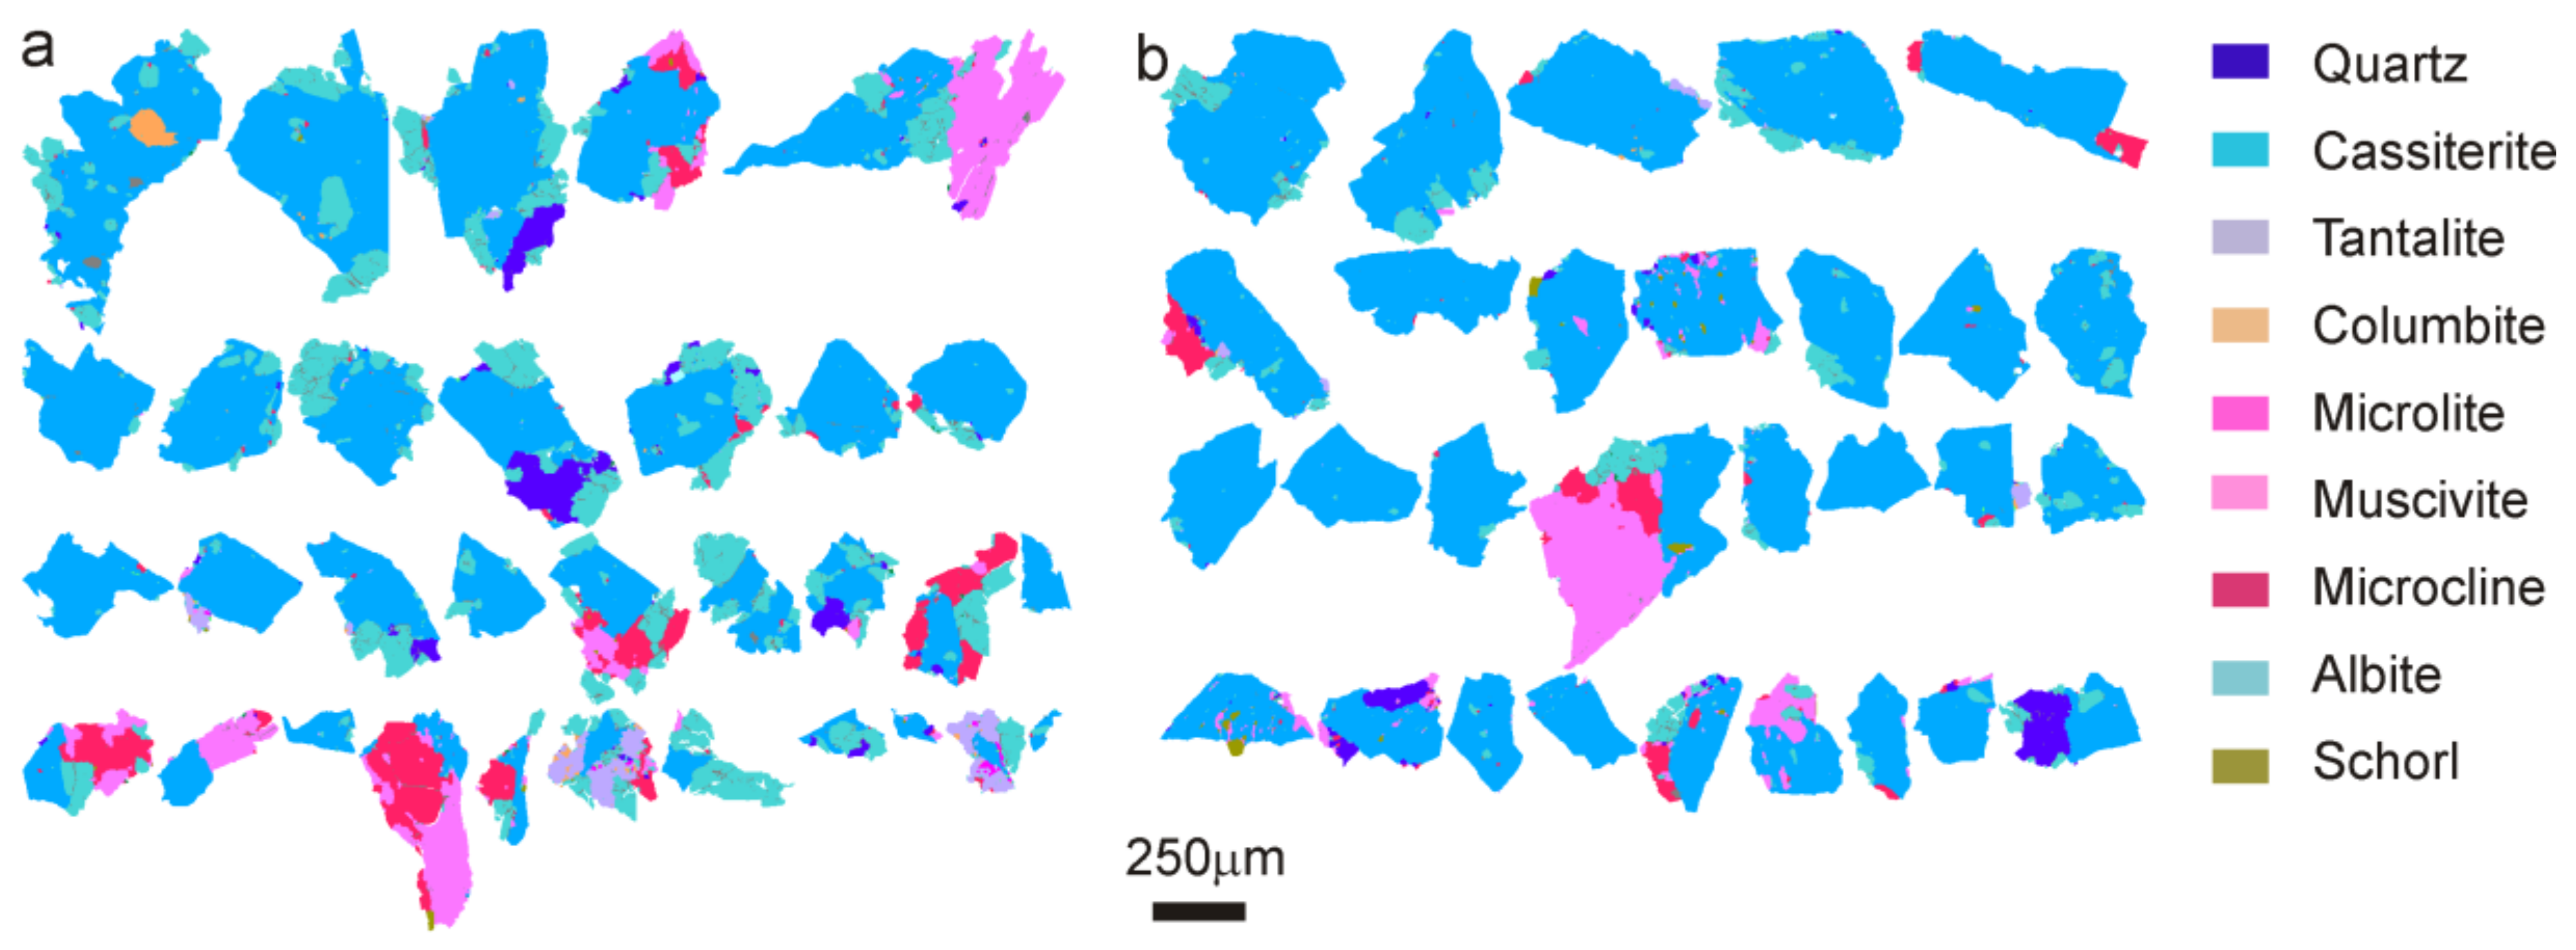
An essential parameter for mineral processing is the shape of ground particles and this can be influenced by the methods used for comminution [42]. HPGR produce a higher surface area in minerals than other comminution devices, such as jaw crushers [43]. In Penouta ore ground using HPGR, particles exhibit higher angularity than those obtained from a BM, as well as a larger specific surface area (Figure 8).

4.2.4. Mineral Associations

CGM grains are mainly associated with albite, quartz, muscovite, and cassiterite (Figure 9). The locking properties of ore from the Penouta open pit are highly dependent on the relationship between the mineral and particle size. The free surface indicates those minerals that are not surrounded by others. Free surface is highest in cassiterite compared to other ore minerals (Table 3) due to the higher grain size of this mineral. In CGM, as they often constitute crystals with a columbite core and a tantalite rim, tantalite presents more free surface than columbite. In the case of microlite and wodginite, these minerals are a few microns in size and usually genetically associated with columbite and tantalite [35], and thus, in most cases they are locked in these minerals and also in albite and cassiterite. CGM and cassiterite association occurs mainly in coarse particles, where usually tantalite is in contact with or included in cassiterite.

4.2.5. Metal Distribution

The chemical composition of concentrates and tailings obtained in this study are shown in Table 4. Nb and Ta occur in significant amounts in all particle size fractions obtained in the experiments. After grinding by HPGR, Ta content is similar in both fraction sizes (less and more than 250 µm), whereas with a BM, the smaller fraction is always Ta-richer; Ta-rich minerals move to the concentrate, remaining in the tailing a minor amount. Similar behavior exists for Nb and Sn. However, in the size fraction of +250 µm higher, contents of Nb-Ta-rich minerals are in the tailings, especially in the case of products obtained from grinding by HPGR, where 80 ppm remain in the tailings. Tailings of product with a size of +600 µm are poor in Nb and Ta, but still have high Sn contents, 336–528 ppm.
The mineral content of the ore was determined by TIMA, and a theoretical composition was also calculated from the chemical composition data of the different fractions (Table 4). As columbite and tantalite are the main Ta-Nb bearing phases, all Ta was assigned to tantalite and all Nb is in columbite. The TIMA results show that the most abundant ore mineral in the concentrates is cassiterite, followed by tantalite and columbite, determined by the chemical composition calculated, assuming that all Ta is in tantalite and all Nb is in columbite. The contents of microlite and wodginite have not been taken into account due to the low significance of their content.
The tantalite/columbite ratio in the calculated minerals ranges between 1.2 and 1.4 in the concentrates and significantly lower in the tailings, especially in tailings of +600 µm, where it is from 0.5 to 0.9. This could be attributed to the fact that in the gravity concentration, tantalite moves more easily to the heavy fraction (density of tantalite-(Mn) is 8.1) than columbite (density of columbite-(Mn) is 5.28).
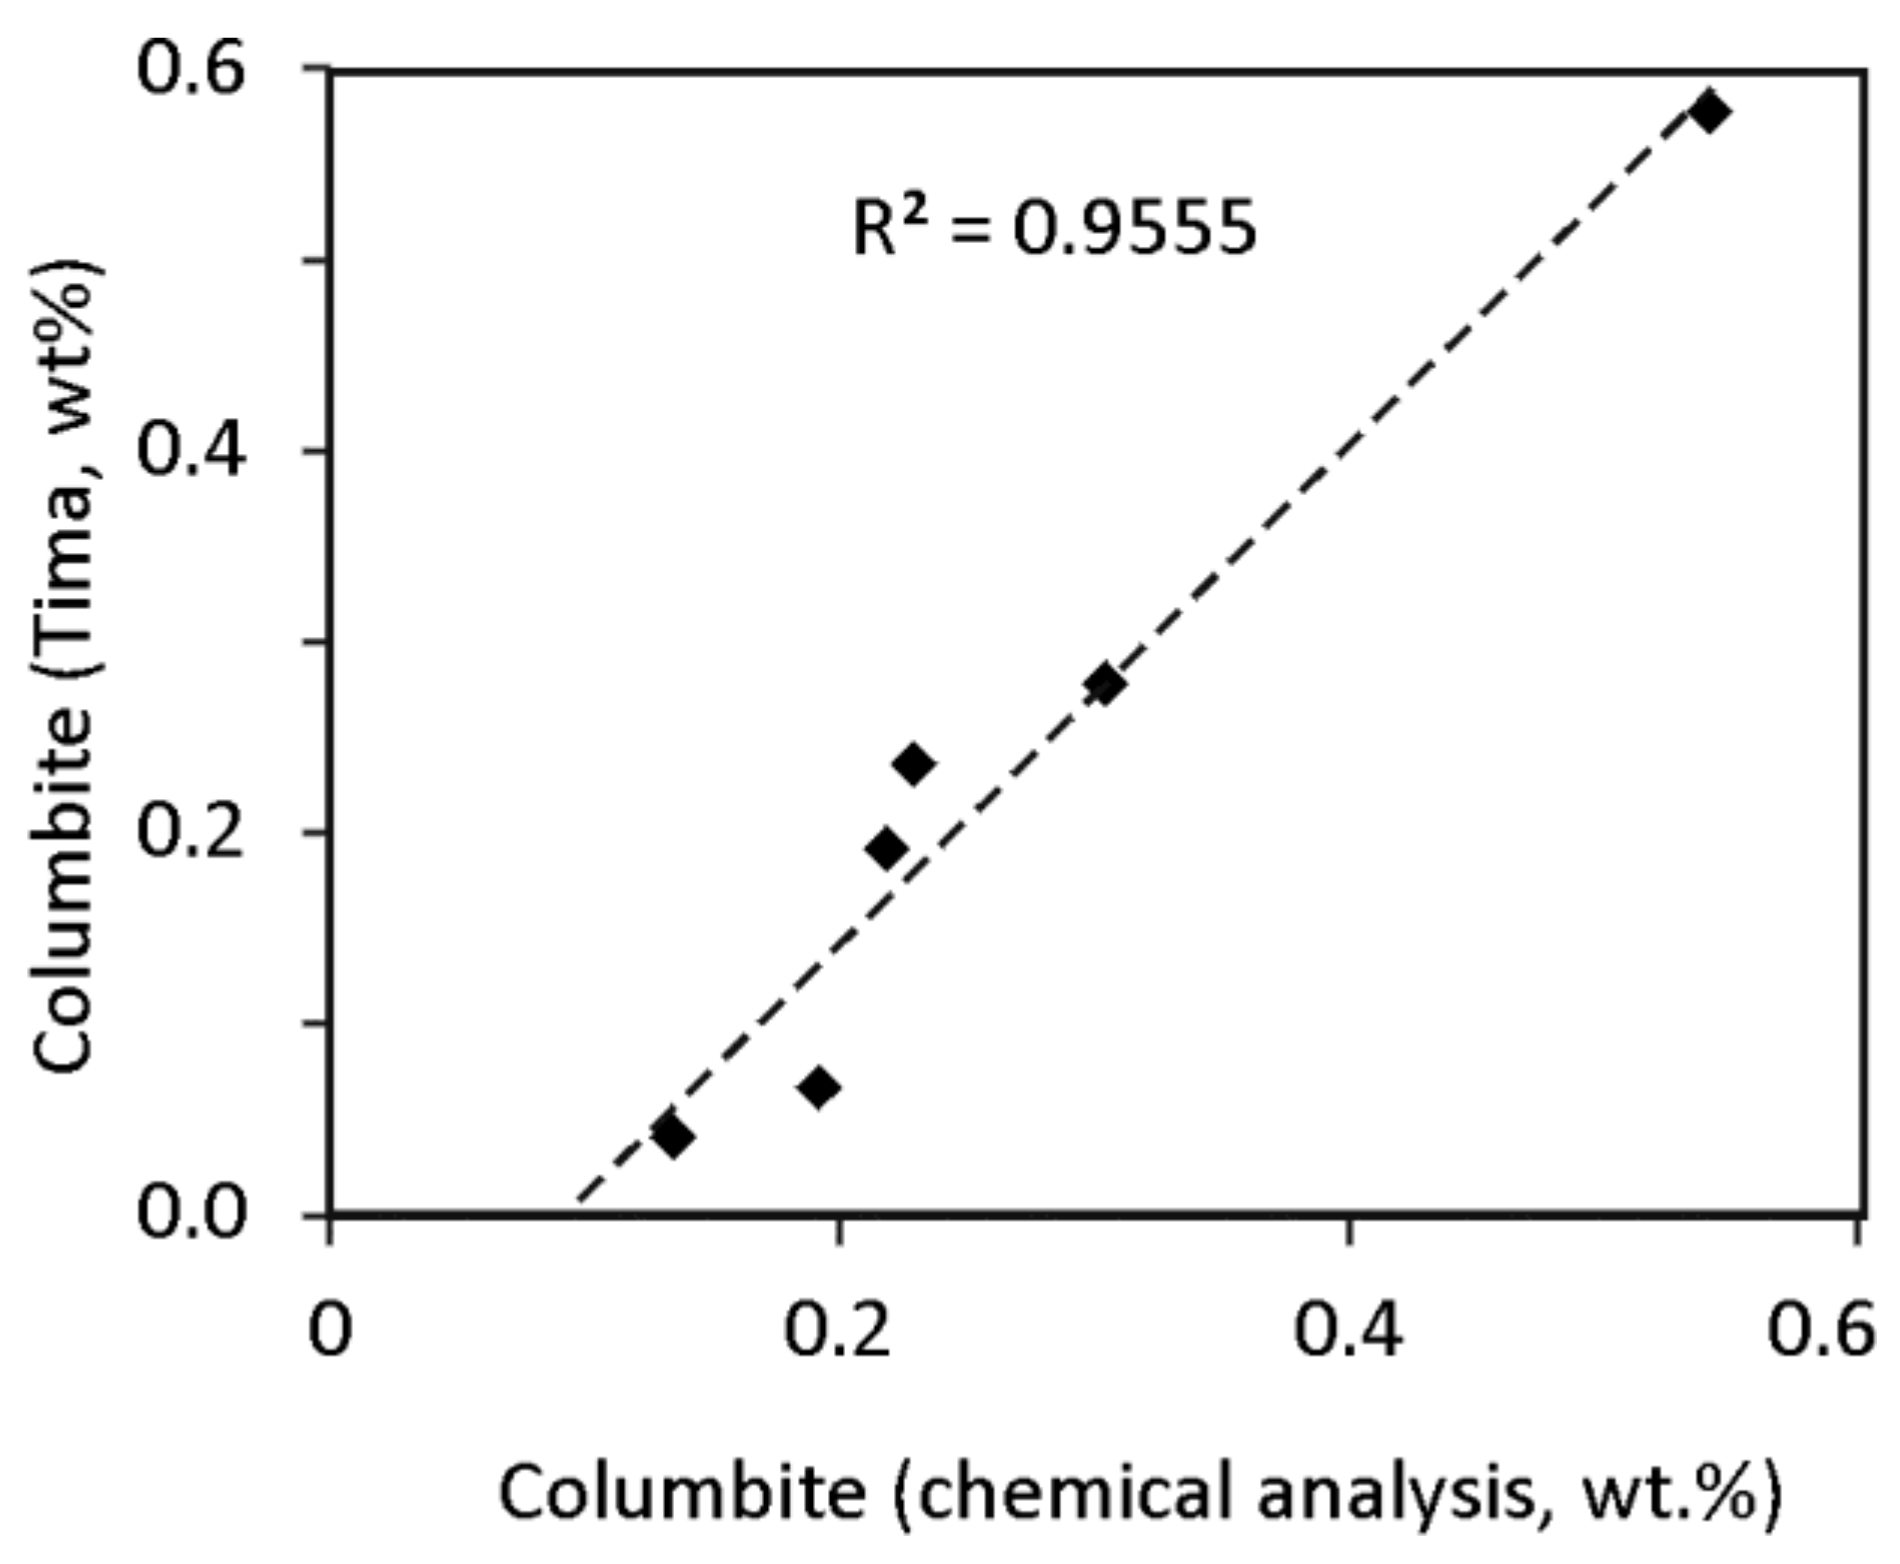
The tantalite contents determined by TIMA are higher, whereas the Nb contents are similar in both determinations (Figure 10). The tantalite/columbite ratio is double in the cases of the lower particle size. This could be due to the stereological error produced during the analysis of image sections [29,44].

4.3. Mineral Liberation

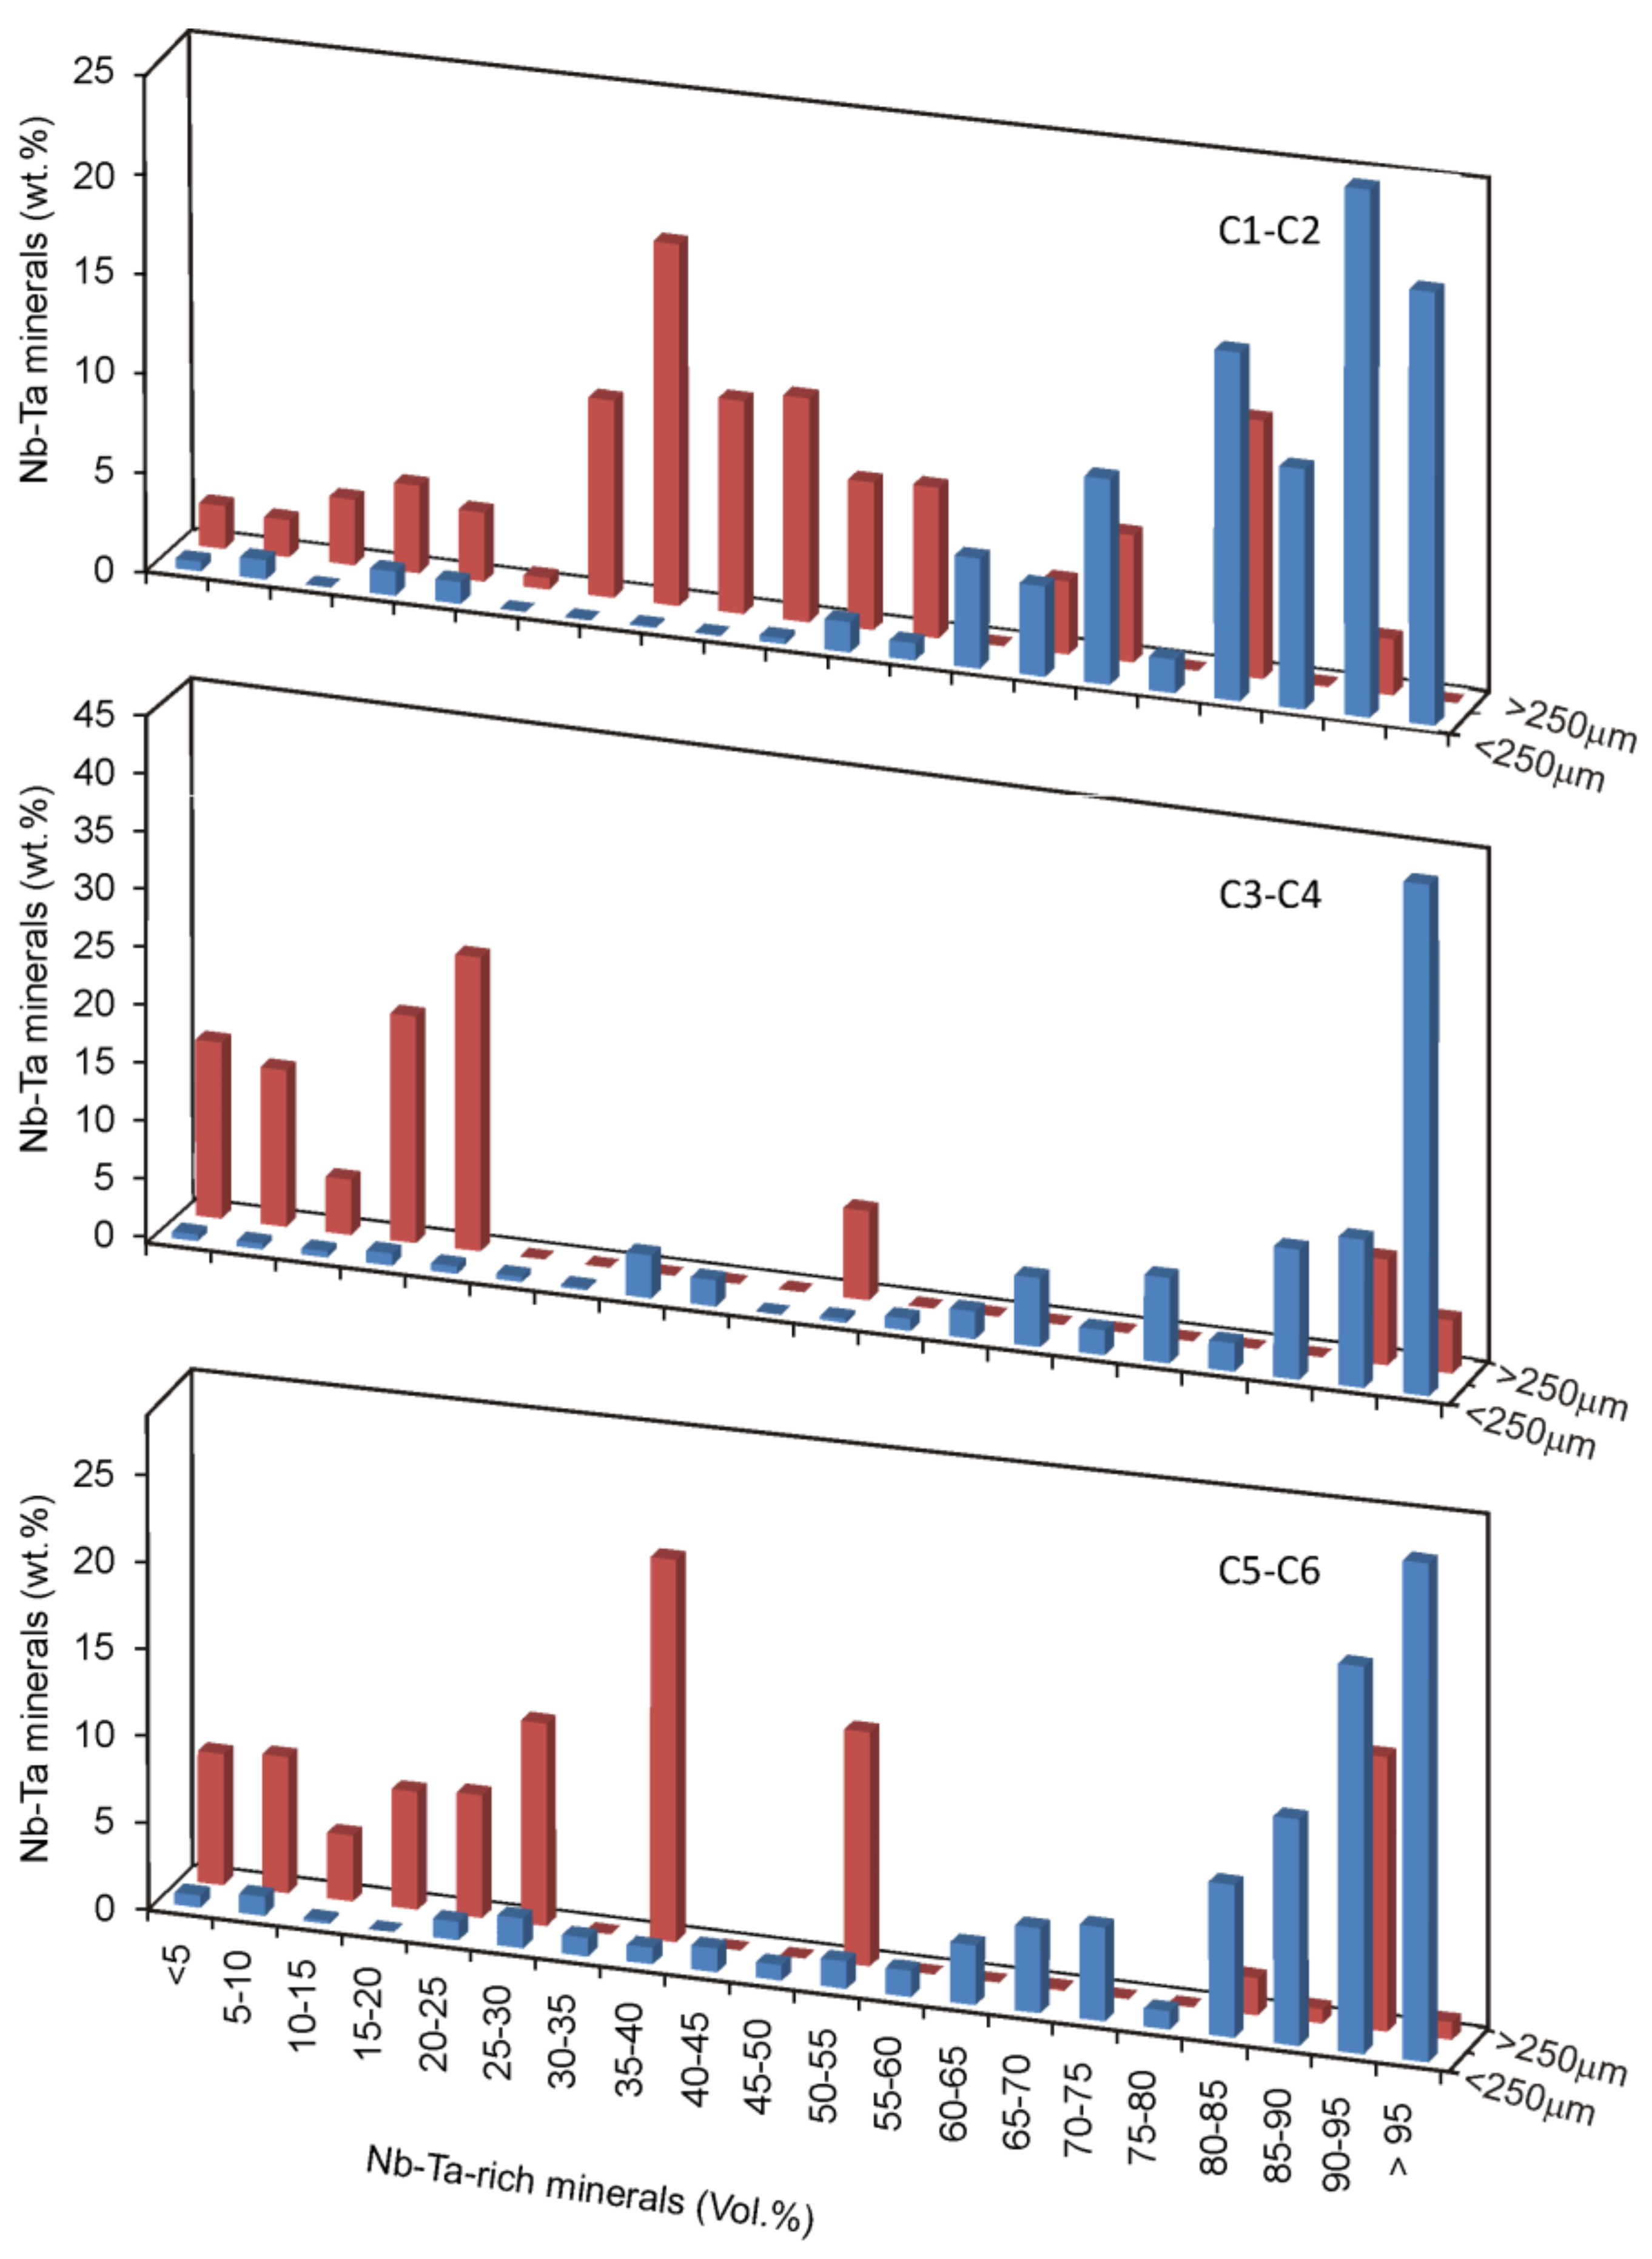
In the present study, the ore is considered as liberated when it represents >90 vol % of the particle volume. The TIMA provided the liberation characteristics of ore from the different steps of the treatment. The degree of columbite-tantalite liberation depends on the particle size (Figure 11). The highest degrees of liberation are achieved in particles smaller than 250 µm that have been comminuted with the combination of HPGR and a BM, especially in the case of cassiterite, where 84 wt % is liberated compared to 69.76 wt % when only a BM is used (Table 5).
In the fraction less than 250 µm, about 65 wt % of the columbite-tantalite minerals are liberated, whereas only 25–30 wt % is liberated in particles larger than 250 µm. This is caused by the grain size of CGM, which usually is lower than 200 µm.
However, in sizes between 250 and 600 µm, greater degrees of liberation occur in the products obtained from BM grinding. As Figure 11 shows, this is due to the low liberation degree achieved with HPGR. Therefore, all products larger than 250 m obtained from this milling should be treated with a BM.
The gravity concentration was effective in the case of liberated and Nb-Ta-rich particles, which are mainly in the fraction lower than 250 µm; however, particles rich in gangue minerals, which usually have a density lower than 3, go to the tailings product. This is more significant in the case of HPGR products of 250–600 µm, where 61 wt % of the CGM from this fraction are mixed particles between 30 and 60 vol % of Nb-Ta minerals (Figure 11), which prevents the concentration and causes enrichment in the tailing.

5. Conclusions

The Sn-Ta ore from the leucogranite Penouta is mainly constituted in cassiterite and CGM, and also occur as minor contents in microlite and wodginite. The mineral association of the ore minerals depends on the particle size of the ground products. Albite is the most abundant mineral in products of fine particle size, whereas quartz concentrates in the coarser sizes, being the most abundant mineral in tailings of +600 µm.
The quantitative process mineralogy was essential to design the comminution method for a tantalum-poor ore. The use of HPGR, followed by a BM, generated a higher proportion of fines, and thus, a higher amount of liberated ore minerals. Grinding products obtained with both HPGR and a BM produced a high liberation degree in cassiterite, tantalite, and columbite in the fraction of particles of −250 µm, but low in the fraction of coarser particles. This is attributed to the small grain size of the ore grains.
Product tailings of a −250 µm size have a low metal content, whereas those between 250 and 600 µm are still rich in metals because they are under the liberation size of Na-Ta-rich minerals.
The finest HPGR products can be directly used for gravity or other separation methods, whereas the fraction higher than 250 µm should be ground more to liberate the Ta ore and obtain a good recovery.

Acknowledgments

This work is part of the OptimOre project. This project has received funding from the European Union’s Horizon 2020 research and innovation programme under grant agreement No. 642201. The research is supported by the SGR-198 and SGR-707 of the Generalitat de Catalunya. The Strategic Minerals enterprise helped in the sampling of Penouta. The Tescan staff from Spain (Ana Pérez Campos and Juan Gabriel Rodriguez) are acknowledge helping in the TIMA analyses. X. Llovet by assisted in the EMPA analyses. Two anonymous reviewers are thanked for helping to improve the manuscript.

Author Contributions

S.A.H. and P.A. designed and performed the experiments, analyzed the data, and wrote the paper; H.A. was responsible of the HPGR experiments and reviewed the manuscript; E.G. was responsible of the Ball mill experiments; J.O. critically reviewed the experimental design, the analysis of the results, and conclusions; Marek Dosbaba carried out the TIMA analyses; M.G.-V. performed the XRD data; and M.C. assisted with the gravity concentration. All authors contributed to data interpretation and discussion.

Conflicts of Interest

The authors declare no conflict of interest.

References

  1. Deetman, S.; van Oers, L.; van der Voet, E.; Tukker, A. Deriving European tantalum flows using trade and production statistics. J. Ind. Ecol. 2017, 22, 166–179. [Google Scholar] [CrossRef]
  2. Linnen, R.L.; Van Lichtervelde, M.; Černý, P. Granitic pegmatites as sources of strategic metals. Elements 2012, 8, 275–280. [Google Scholar] [CrossRef]
  3. Mackay, D.A.R.; Simandl, G.J. Geology, market and supply chain of niobium and tantalum—A review. Miner. Deposita 2014, 49, 1025–1047. [Google Scholar] [CrossRef]
  4. Chakhmouradian, A.R.; Smith, M.P.; Kynicky, J. From “strategic” tungsten to “green” neodymium: A century of critical metals at a glance. Ore Geol. Rev. 2015, 64, 455–458. [Google Scholar] [CrossRef]
  5. European Comission. Study on the Review of the List of Critical Raw Materials. 2017. Available online: https://publications.europa.eu/en/publication-detail/-/publication/08fdab5f-9766-11e7-b92d-01aa75ed71a1/language-en (accessed on 9 February 2018).
  6. Černý, P.; Blevin, P.L.; Cuney, M.; London, D. Granite-related ore deposits. In Economic Geology 100th Anniversary Volume; Hedenquist, J.W., Thompson, J.F.H., Goldfarb, R.J., Richards, J.P., Eds.; Society of Economic Geologists: Littleton, CO, USA, 2005; pp. 337–370. [Google Scholar]
  7. Wikedzi, A.; Arinanda, M.A.; Leißner, T.; Peuker, U.A.; Mütze, T. Breakage and liberation characteristics of low grade sulphide gold ore blends. Miner. Eng. 2018, 115, 33–40. [Google Scholar] [CrossRef]
  8. Morrell, S. A method for predicting the specific energy requirement of comminution circuits and assessing their energy utilisation efficiency. Miner. Eng. 2008, 2, 224–233. [Google Scholar] [CrossRef]
  9. Aydoğan, N.A.; Benzer, H. Comparison of the overall circuit performance in the cement industry: High compression milling vs. ball milling technology. Miner. Eng. 2011, 24, 211–215. [Google Scholar] [CrossRef]
  10. Ballantyne, G.R.; Hilden, M.; van der Meer, F.P. Improved characterisation of ball milling energy requirements for HPGR products. Miner. Eng. 2018, 16, 72–81. [Google Scholar] [CrossRef]
  11. Romer, R.L.; Smeds, S.A.; Černý, P. Crystal-chemical and genetic controls of U-Pb systematics of columbite-tantalite. Mineral. Petrol. 1996, 57, 243–260. [Google Scholar] [CrossRef]
  12. Jones, M.P. Applied Mineralogy: A Quantitative Approach; Graham and Trotman: London, UK, 1987. [Google Scholar]
  13. King, R.P. Modelling and Simulation of Mineral Processing Systems; Butterworth-Heinemann: New Delhi, India, 2001; ISBN 0-7506-4884-8. [Google Scholar]
  14. Little, L.; Becker, M.; Wiese, J.; Mainza, A.N. Auto-SEM particle shape characterisation: Investigating fine grinding of UG2 ore. Miner. Eng. 2015, 82, 92–100. [Google Scholar] [CrossRef]
  15. Gaudin, A.M. Principles of Mineral Dressing; McGraw-Hill: New York, NY, USA, 1939. [Google Scholar]
  16. Butcher, A.R. A practical guide to some aspects of mineralogy that affect flotation. In Flotation Plant Optimisation; Spectrum Ser. Greet, C.J., Ed.; The Australasian Institute of Mining and Metallurgy: Melbourne, Australia, 2010; Volume 16, pp. 83–93. [Google Scholar]
  17. Djordjevic, N. Image based modelling of rock fragmentation. Miner. Eng. 2013, 46–47, 68–75. [Google Scholar] [CrossRef]
  18. Van der Wielen, K.P.; Rollinson, G. Texture-based analysis of liberation behaviour using Voronoi tessellations. Miner. Eng. 2016, 89, 93–107. [Google Scholar] [CrossRef]
  19. Schneider, C.L. The Measurement and Calculation of Liberation in Continuous Grinding Circuits. Ph.D. Thesis, University of Utah, Salt Lake City, UT, USA, 1995. [Google Scholar]
  20. Gu, Y. Automated Scanning Electron Microscope Based Mineral Liberation Analysis An Introduction to JKMRC/FEI Mineral Liberation Analyser. J. Miner. Mater. Charact. Eng. 2003, 2, 33–41. [Google Scholar] [CrossRef]
  21. Fandrich, R.; Gu, Y.; Burrows, D.; Moeller, K. Modern SEM-based mineral liberation analysis. Int. J. Miner. Process. 2007, 84, 310–320. [Google Scholar] [CrossRef]
  22. Hunt, J.A.; Berry, R.; Walters, S.G.; Bonnici, N.; Kamenetsky, M.; Nguyen, K.; Evans, C.L. A new look at mineral maps and the potential relationships of extracted data to mineral processing behaviours. In Proceedings of the ICAM Australia 2008, Brisbane, Australia, 8–10 September 2008; pp. 429–432. [Google Scholar]
  23. Ford, F.D.; Wercholaz, C.R.; Lee, A. Predicting process outcomes for Sudbury platinum-group minerals using grade-recovery modelling from Mineral Liberation Analyzer (MLA) data. Can. Mineral. 2011, 49, 1627–1642. [Google Scholar] [CrossRef]
  24. Sandmann, D.; Gutzmer, J. Use of Mineral Liberation Analysis (MLA) in the Characterization of Lithium-Bearing Micas. J. Miner. Mater. Charact. Eng. 2013, 1, 285–292. [Google Scholar] [CrossRef]
  25. Goodall, W.R.; Scales, P.J. An overview of the advantages and disadvantages of the determination of gold mineralogy by automated mineralogy. Miner. Eng. 2007, 116, 82–87. [Google Scholar] [CrossRef]
  26. Cook, N.J.; Ciobanu, C.L.; Ehrig, K.; Slattery, A.; Verdugo-Ihl, M.R.; Courtney-Davies, L.; Gao, W. Advances and opportunities in ore mineralogy. Minerals 2017, 7, 333. [Google Scholar] [CrossRef]
  27. Lotter, N.O. Modern Process Mineralogy: An integrated multi-disciplined approach to flowsheeting. Miner. Eng. 2011, 24, 1229–1237. [Google Scholar] [CrossRef]
  28. Lastra, R.; Paktunc, D. An estimation of the variability in automated quantitative mineralogy measurements through inter-laboratory testing. Miner. Eng. 2016, 95, 138–145. [Google Scholar] [CrossRef]
  29. Spencer, S.; Shutherland, D. Stereological correction of mineral liberation grade distributions estimated by single sectioning of particles. Image Anal. Stereol. 2000, 19, 175–182. [Google Scholar] [CrossRef]
  30. Leißner, T.; Hoang, D.H.; Rudolph, M.; Heing, T.; Bachmann, K.; Gutzmer, J.; Schubert, H.; Peuker, U.A. A mineral liberation study of grain boundary fracture based on measurements of the surface exposure after milling. Int. J. Miner. Process. 2016, 156, 3–13. [Google Scholar]
  31. Shutherland, D. Estimation of mineral grain size using automated mineralogy. Miner. Eng. 2007, 20, 452–460. [Google Scholar] [CrossRef]
  32. ADARO. Proyecto de Investigación de la Mina de Penouta. Cálculo de Reservas Para Leyes de Corte de 800 y 600 g/t; Unpublished Report; 1982; p. 69. [Google Scholar]
  33. López Moro, F.J.; García Polonio, F.; Llorens González, T.; Sanz Contreras, J.L.; Fernández-Fernández, A.; Moro Benito, M.C. Ta and Sn concentration by muscovite fractionation and degassing in a lens-like granite body: The case study of the Penouta rare-metal albite granite (NW Spain). Ore Geol. Rev. 2017, 82, 10–30. [Google Scholar] [CrossRef]
  34. Llorens González, T.; García Polonio, F.; López Moro, F.J.; Fernández-Fernández, A.; Sans Contreras, J.L.; Moro Benito, M.C. Tin-tantalum-niobium mineralization in the Penouta deposit (NW Spain): Textural features and mineral chemistry to unravel the genesis and evolution of cassiterite and columbite group minerals in a peraluminous system. Ore Geol. Rev. 2017, 81, 79–95. [Google Scholar] [CrossRef]
  35. Alfonso, P.; Hamid, S.; Garcia-Valles, M.; Llorens, T.; López Moro, J.; Tomasa, O.; Calvo, D.; Guasch, E.; Anticoi, H.; Oliva, J.; et al. Textural and mineral-chemistry constraints on columbite-group minerals in the Penouta deposit: Evidence from magmatic and fluid-related processes. Mineral. Mag. 2018. [Google Scholar] [CrossRef]
  36. Ghorbani, Y.; Fitzpatrick, R.; Kinchington, M.; Rollinson, G.; Hegarty, P. A Process Mineralogy Approach to Gravity Concentration of Tantalum Bearing Minerals. Minerals 2017, 7, 194. [Google Scholar] [CrossRef]
  37. Guasch, E.; Anticoi, H.; Hamid, S.A.; Oliva, J.; Alfonso, P.; Escobet, T.; Sanmiquel, L.; Bascompta, M. New approach to ball mill modelling as a piston flow process. Miner. Eng. 2018, 116, 82–87. [Google Scholar] [CrossRef]
  38. Kazerani Nejad, R.; Sam, A. Limitation of HPGR application. Miner. Process. Ext. Met. 2017, 126, 224–230. [Google Scholar] [CrossRef]
  39. Hill, R.J.; Tsambourakis, G.; Madsen, I.C. Improved petrological modal analyses from X-ray powder diffraction data by use of the rietveld method I. selected igneous, volcanic, and metamorphic rocks. J. Petrol. 1993, 34, 867–900. [Google Scholar] [CrossRef]
  40. Moore, D.M.; Reynolds, R.C. X-ray Diffraction and the Identification and Analysis of Clay Minerals; Oxford University Press: New York, NY, USA, 1989. [Google Scholar]
  41. Rahfeld, A.; Kleeberg, R.; Möckel, R.; Gutzmer, J. Quantitative mineralogical analysis of European Kupferschiefer ore. Miner. Eng. 2018, 115, 21–32. [Google Scholar] [CrossRef]
  42. Vizcarra, T.G.; Wightman, E.M.; Johnson, N.W.; Manlapig, E.V. The effect of breakage mechanism on the mineral liberation properties of sulphide ores. Miner. Eng. 2010, 23, 374–382. [Google Scholar] [CrossRef]
  43. Han, Y.X.; Liu, L.; Yuan, Z.T.; Wang, Z.H.; Zhang, P. Comparison of low-grade hematite product characteristics in a high-pressure grinding roller and jaw crusher. Miner. Metall. Process. 2012, 29, 75–80. [Google Scholar]
  44. Ueda, T.; Oki, T.; Koyaanaka, S. Comparison of Seven Texture Analysis Indices for Their Applicability to Stereological Correction of Mineral Liberation Assessment in Binary Particle Systems. Minerals 2017, 7, 222. [Google Scholar] [CrossRef]
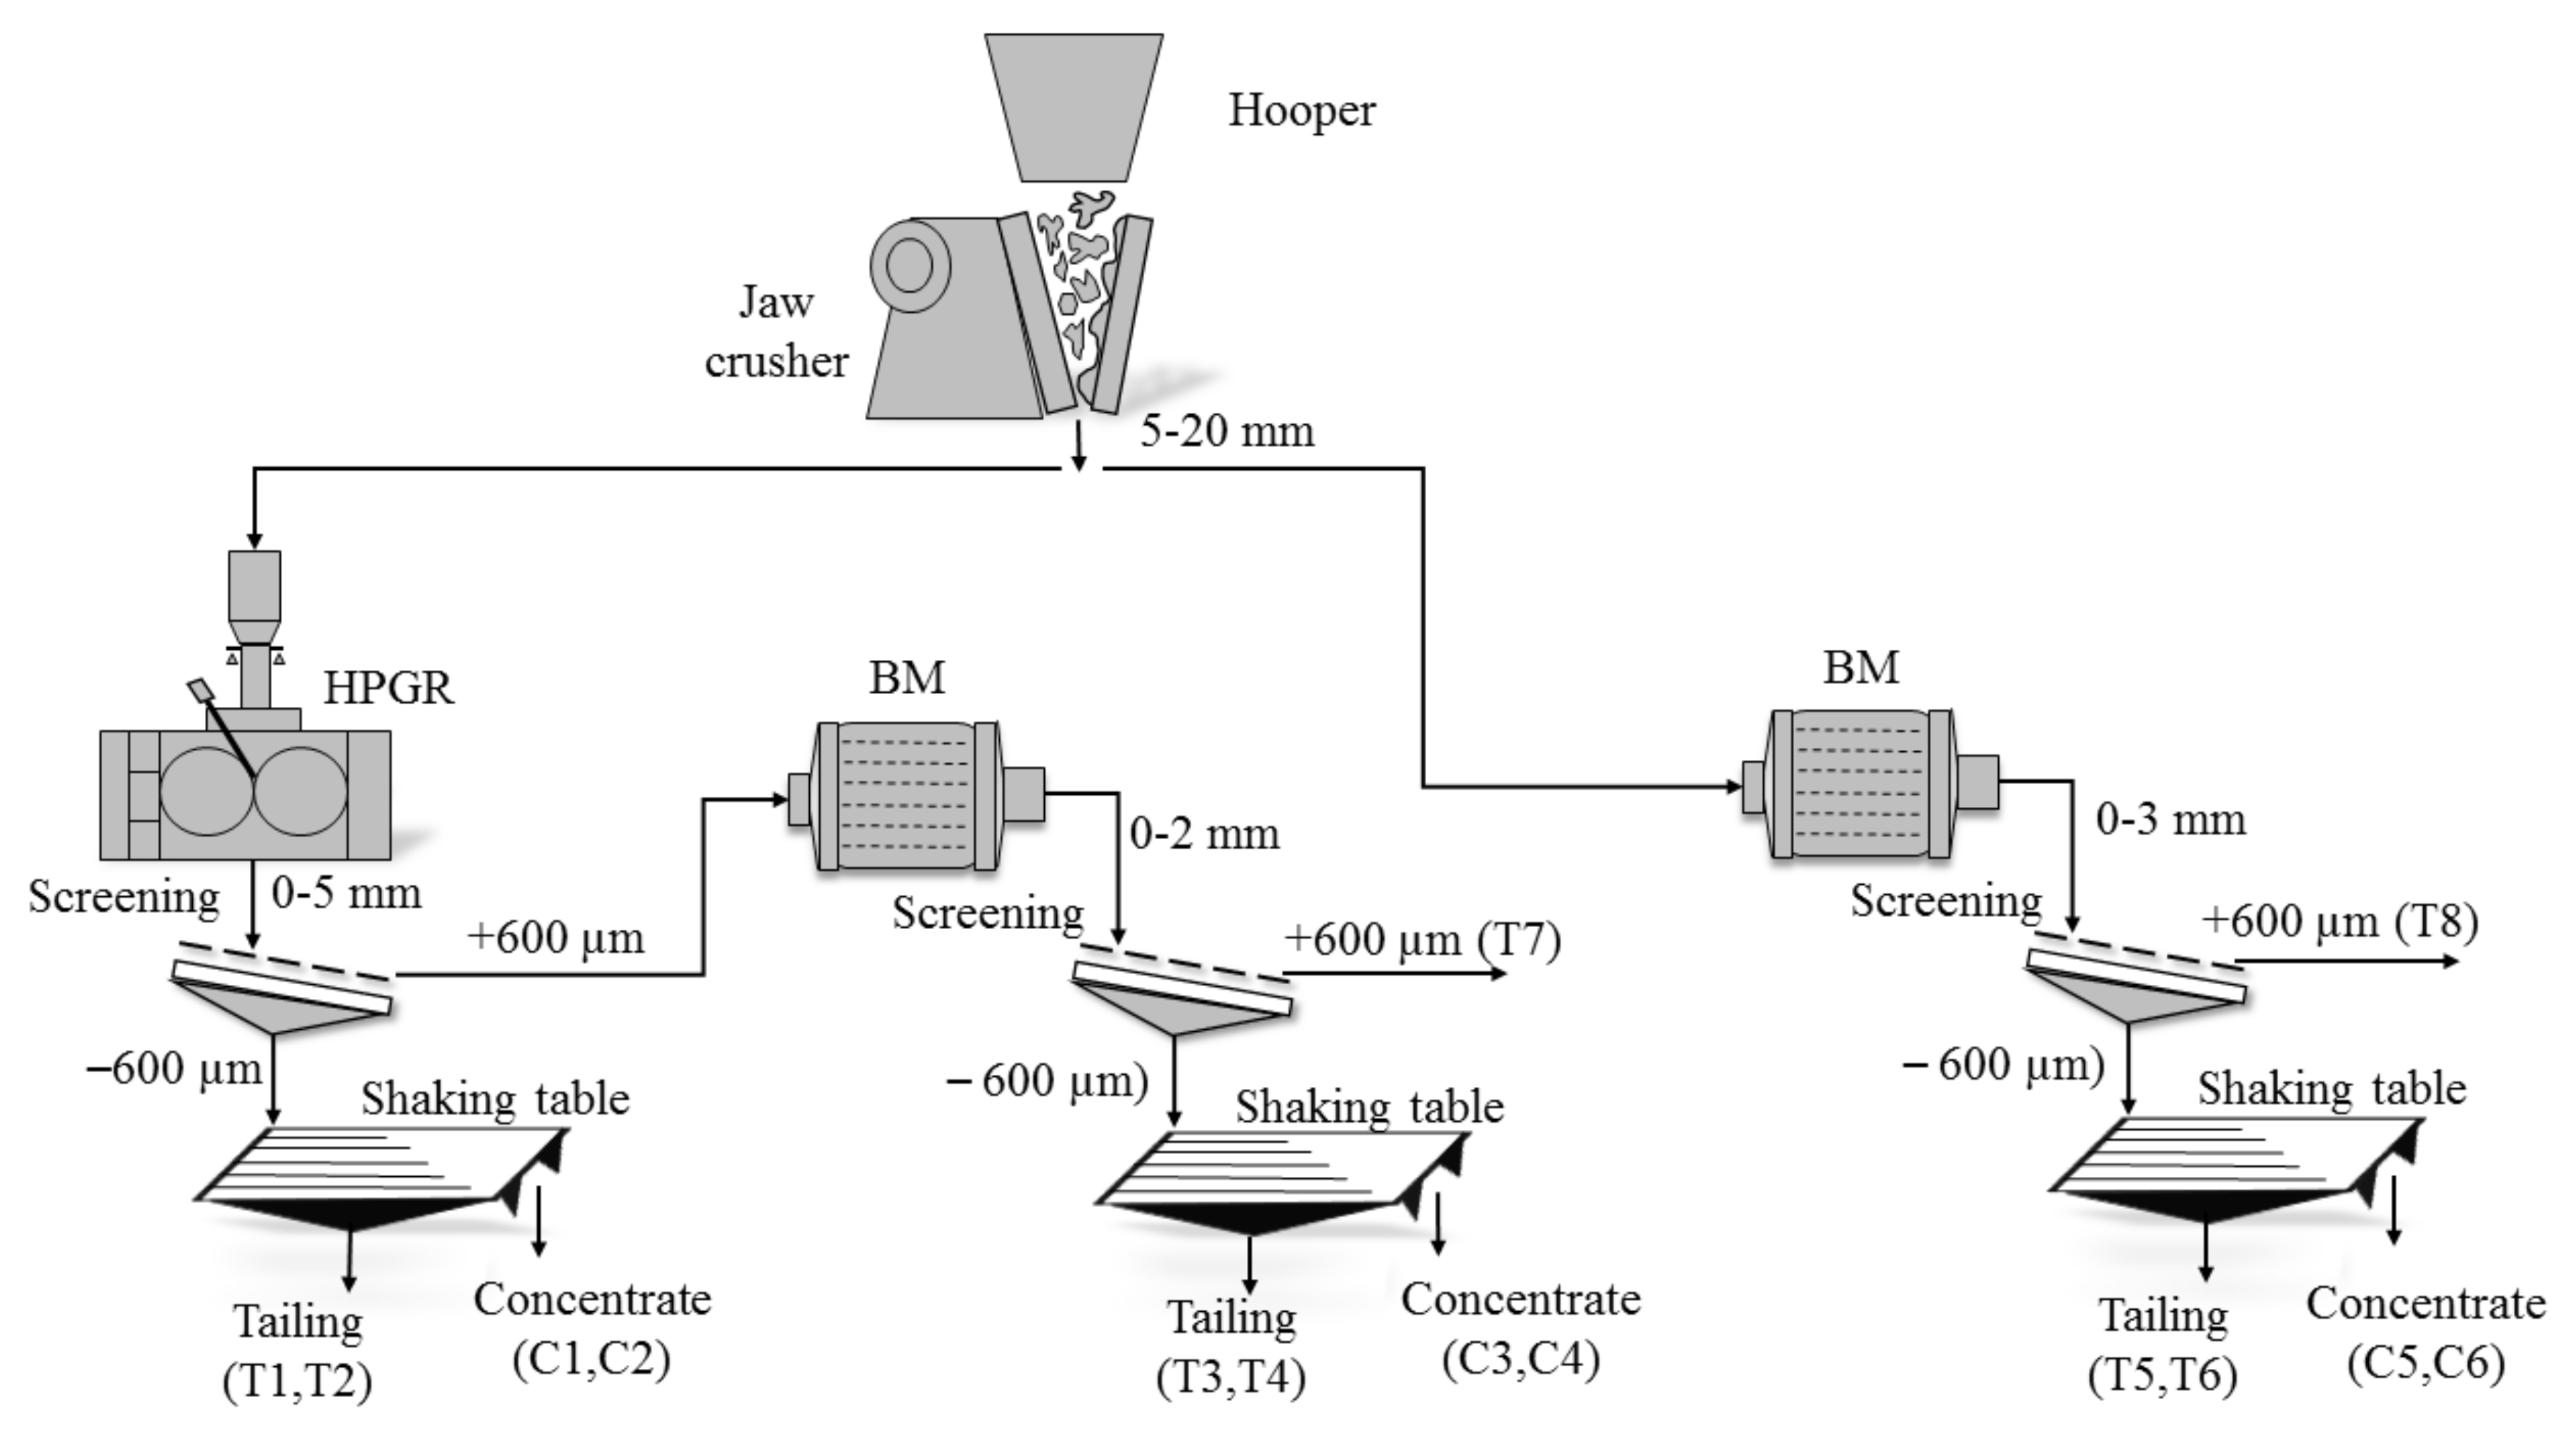
Figure 1. Schematic diagram of the Penouta open pit sample preparation. C, concentrate sample, T, tailing.
Minerals 08 00151 g001
Figure 2. Chemical composition of columbite-group minerals (CGM) from the Penouta open pit in the columbite quadrilateral [35] and two illustrative scanning electron microscopy (SEM) images. Clm, columbite-(Mn); tnm, tantalite-(Mn).
Minerals 08 00151 g002
Figure 3. CGM from the Penouta open pit leucogranite showing different textures: (ad), concentric zoning; (e,f), patchy zoning. Dark grey, columbite-(Mn); bright grey, tantalite-(Mn).
Minerals 08 00151 g003
Figure 4. Microlite (a) and wodginite (b) from the Penouta open pit leucogranite. Mcr, microlite; Wdg, wodginite. clm, columbite-(Mn); tnm, tantalite-(Mn).
Minerals 08 00151 g004
Figure 5. Particle size distribution curves for the feed and ground products.
Minerals 08 00151 g005
Figure 6. Modal mineralogy of the grinding products. C1 to C6 are the concentrates analyzed by a Tescan Integrated Mineralogical Analyzer (TIMA-X) and in tailings (T1–T6) determined by X-ray powder diffraction (XRD).
Minerals 08 00151 g006
Figure 7. TIMA false color images of columbite-tantalite from concentrates of less than 250 µm obtained from ground material using a ball mill (BM).
Minerals 08 00151 g007
Figure 8. TIMA false color images for shape comparison of cassiterite-rich particles in the 250–600 size fraction obtained (a) with high-pressure grinding rolls (HPGR), and (b) BM. Color legend as in Figure 7.
Minerals 08 00151 g008
Figure 9. Mineral locking of CGM from the Penouta open pit.
Minerals 08 00151 g009
Figure 10. Comparison of the columbite content of the grinding products determined by TIMA and from the chemical composition.
Minerals 08 00151 g010
Figure 11. Distribution of the Nb-Ta-rich minerals in the concentrate material from the Penouta open pit according to particle size and grade classes.
Minerals 08 00151 g011
Table 1. Representative chemical composition of CGM from the Penouta open pit.
Oxides, wt %P1P2P3P94P5P6P7P8
clmclmclfclmtnmtnmtnmtnm
WO30.230.110.520.330.190.160.330.43
Ta2O519.1320.4730.2247.2955.8057.6963.5569.87
Nb2O561.0660.1750.4633.8727.3324.2119.5213.57
TiO20.040.020.060.100.000.090.120.00
UO20.000.020.000.310.040.240.000.11
ThO20.000.000.000.220.000.000.080.00
Sc2O30.140.160.070.010.080.370.300.01
SnO20.060.080.100.110.180.220.220.24
Fe2O30.520.340.141.120.291.280.710.34
FeO2.863.079.807.741.632.147.553.38
MnO16.3516.168.688.5314.4812.987.6511.36
Total100.41100.60100.0599.65100.0299.38100.0399.31
Atomic Contents
W6+0.0150.0070.0340.0240.0150.0120.0250.035
Ta5+1.2591.3522.0993.5804.3744.6035.1955.972
Nb5+6.6736.5995.8274.2633.5603.2112.6531.928
Ti2+0.0070.0030.0110.0220.0000.0210.0280.000
U4+0.0000.0010.0000.0190.0030.0160.0000.008
Th4+0.0000.0000.0000.0140.0000.0000.0060.000
Sc3+0.0120.0160.0220.0280.0460.0550.0580.065
Sn4+0.0150.0170.0080.0010.0110.0480.0400.000
Fe3+0.0950.0620.0270.2350.0630.2850.1490.080
Fe2+0.5770.6222.0941.8030.3930.5231.8980.888
Mn2+3.3473.3211.8782.0113.5353.2261.9483.024
CATSUM12.00012.00012.00012.00012.00012.00012.00012.000
Table 2. Semi-quantitative mineral composition of the product tailings determined by XRD. Particle size of T1, T3, and T5 is −250 µm; T2, T4 and T6 is 250–600 µm; and T7 and T8 is + 600 µm.
Mineral (wt %)T1T2T3T4T5T6T7T8
Quartz714104810436237
Albite6041511551111530
Microcline721231211201314
Muscovite202014222321716
Kaolinite44245311
Beryl2 -----2
Table 3. Free surface of ore minerals from the Penouta open pit.
Mineral (wt %)C1C2C3C4C5C6
Cassiterite84.0648.5587.9771.0582.3867.66
Columbite45.6211.1350.3930.1352.4013.44
Tantalite50.4518.6653.5923.6548.1926.17
Microlite8.381.9626.290.3926.590.00
Wodginite5.721.0711.660.1814.200.43
Table 4. Chemical composition and mineralogy of the grinding products of the Penouta ore. tn, tantalite; cl, columbite, and Cst, cassiterite.
GrindingChemical Composition (ppm)Mineralogy (wt %)
(Normative)(TIMA-X)
MethodSize (μm)SampleTypeSnNbTaCsttncltn/clCsttncltn/cl
HPGR–250PN-1C13010108019800.380.280.231.220.390.720.243.07
HPGR+250PN-3C2-10301990-0.280.221.291.810.580.193.02
HPGR + BM–250PN-5C3-14352720-0.390.301.261.300.630.282.26
HPGR + BM+250PN-7C4-6351355-0.190.131.423.760.060.041.43
BM–250PN-9C5-25505000-0.710.541.311.991.130.581.96
BM+250PN-11C6-9051895-0.270.191.403.230.110.071.68
HPGR–250PN-2T16714300.010.000.001.43
HPGR+250PN-4T222458800.030.010.010.92
HPGR + BM–250PN-6T38817300.010.000.001.18
HPGR + BM+250PN-8T413145400.020.010.010.59
BM–250PN-10T511823400.010.010.001.16
BM+250PN-12T613249500.020.010.010.68
HPGR + BM+600PN-19T752842300.070.000.010.48
BM+600PN-20T833646600.040.010.010.87
Table 5. Liberation of cassiterite and CGM from the Penouta open pit leucogranite. Grade is reported in volume % and minerals content in wt %.
MineralCasssiteriteColumbite-Group
HPGR + BMBMHPGR + BMBM
Grade−250+250−250+250−250+250−250+250
<100.080.140.100.161.2017.511.7915.37
10–200.000.790.000.001.3916.640.1810.56
20–300.441.790.554.141.0715.662.7918.68
30–400.003.960.881.862.2511.832.0622.01
40–500.114.841.962.461.439.242.300.00
50–600.344.380.630.561.7710.583.1013.48
60–703.5316.025.428.408.851.578.370.10
70–807.3516.762.714.2310.322.706.490.00
80–904.2122.7417.9840.8319.825.5121.882.97
>9083.9528.5969.7637.3651.908.7651.0416.83