Article

The Use of Infrared Spectroscopy to Determine the Quality of Carbonate-Rich Diatomite Ores

Resource Engineering Section, Department of Geoscience and Engineering, Delft University of Technology, Stevinweg 1, 2628 CN Delft, The Netherlands
*
Author to whom correspondence should be addressed.
Minerals 2018, 8(3), 120; https://doi.org/10.3390/min8030120
Submission received: 28 February 2018 / Revised: 15 March 2018 / Accepted: 17 March 2018 / Published: 20 March 2018
(This article belongs to the Special Issue Mineralogy of Quartz and Silica Minerals)

Abstract

:
Diatomite, a rock formed by the accumulation of opaline diatom frustules, is a preferred raw material for the manufacturing of filters. Its uniqueness relies on the high porosity and inertness of the frustules. The presence of carbonates in some diatomite ores hinders these properties. The purpose of this study was to identify the type of carbonates and their association with the ore in a diatomite deposit, and to assess the suitability of determining the quality of the ore using techniques with potential for in-pit implementation. For this, run-of-mine samples were analysed using environmental scanning electron microscopy (ESEM) and infrared spectroscopy. The ESEM images showed that carbonate is present as cement and laminae. The infrared data revealed that the carbonate minerals correspond to aragonite and calcite, and that their occurrence is linked to the total amount of carbonate in the sample. By using a portable spectral instrument that uses diffuse reflectance, it was possible to classify the spectra of the ore samples based on the carbonate content. These results indicate that infrared technology could be used on-site for determining the quality of the ore, thus providing relevant information to assist the optimisation of mining and beneficiation activities.

1. Introduction

Diatomite is a sedimentary rock formed mainly by the accumulation of the skeletal remains of diatoms. Diatoms are a kind of unicellular algae that have exoskeletons (frustules) made of amorphous opaline silica with an intricate porous structure [1,2]. These characteristics make of diatomite a unique material with high porosity, low density and low chemical reactivity. Due to these properties, diatomite has great importance as an industrial raw material and is widely used as filtration media, adsorbent, filler and functional mineral additive. From these applications, filtration represents the majority of the consumption of the diatomite production [3].
The purity of diatomite is especially important to ensure the adequate performance of filter grade products. Industry standards, such the Food Chemical Codex (FCC), determine that the amount of non-siliceous substances in diatomite filters should not be more than 25 wt % [4]. Filters used for beverages pay particular attention to impurities that can be soluble in the filtered media [5]. However, during the formation of diatomite deposits, other minerals deposit along with the diatom frustules, among which carbonate minerals are common [6]. The high reactivity of CO3 in these minerals affects the chemical purity of the diatomite ore. Furthermore, the intimate association of the frustules and carbonates can affect the porosity of diatomite. Conventionally, to generate filter-grade diatomite products, diatomite deposits are mined through open-pit methods, the extracted ore is then treated by disagglomeration, drying, degritting and sizing. Special care is taken through all these processes to preserve the delicate diatom structure [2]. Finally, to adjust the pore structure and particle size required for filtration, the beneficiated ore is calcined in a rotary kiln [7,8]. At this stage, the presence of CO3 in the ore is also detrimental to the process, since it increases the energy consumption for the kiln and increases the CO2 emissions [9].
In the processing of filter-grade diatomite products, the objective is to generate a grade or blend with a controlled amount of impurities. Such product must provide an acceptable flow-rate and clarity by the industrial standards and customers’ requirements, at the time that maintains the essential pore structure of the diatom frustules. In this context, a considerable number of beneficiation techniques have been developed to remove the carbonate minerals and improve the purity of the diatomite finished products. Some methods use physical separation of ore and impurities such as sequential classification [10], electric field-based separation [11,12] and centrifugal separation [13]. These are sometimes complemented with enrichment methods such as flotation [14] and acid leaching [15,16]. Even though these techniques have been proven successful in increasing the purity of diatomite products, they are not ideal for the beneficiation process. The physical techniques can destroy the diatom structure [15,16], reducing the porosity of the diatomite, whereas acid leaching and flotation generate large amounts of acid wastewater, increasing the environmental impact of the process. As a consequence, it is relevant to reduce the effect of the beneficiation techniques in the quality of the diatomite products and the environment. This could be achieved by feeding the processing with a pre-upgraded ore, allowing the optimisation of the beneficiation techniques.
The author’s recent research [17] suggested that the in-pit classification of the diatomite ore based on the carbonate content could support a controlled feed to the processing plant. Following this approach, prior knowledge about the characteristics of the diatom frustules and their association with the type and amount of carbonate minerals would also influence the decision-making for the beneficiation process. For this information to be useful for operational feedback, it is necessary to be able to acquire the data of the ore synchronously with the mining and processing activities, that is to say, on-time and in (near) real-time. In this context, infrared (IR) spectroscopy can detect the minerals present in the diatomite ore (opal and carbonates) and has the technology maturity to be used as an on-site technique.
In this work, a diatomite deposit in Spain was chosen to perform a detailed characterisation of a carbonate-rich diatomite ore. This study analyses how the characteristics of the ore are related to the carbonate content and how this information can be used for optimising mining and processing. For this, microscopic techniques were used to characterise the morphology and preservation of the diatom frustules and their association with the carbonate minerals and to analyse their possible influence in the porosity of the ore. Additionally, laboratory and portable infrared spectroscopy techniques were used to determine the type and amount of carbonate minerals in the ore. The observations focused on the capability of the portable techniques to be used as an on-site sensor for the characterisation of the diatomite ore. The results are further discussed in the context of offering new insights for the optimised beneficiation of diatomite ores.

2. Materials and Methods

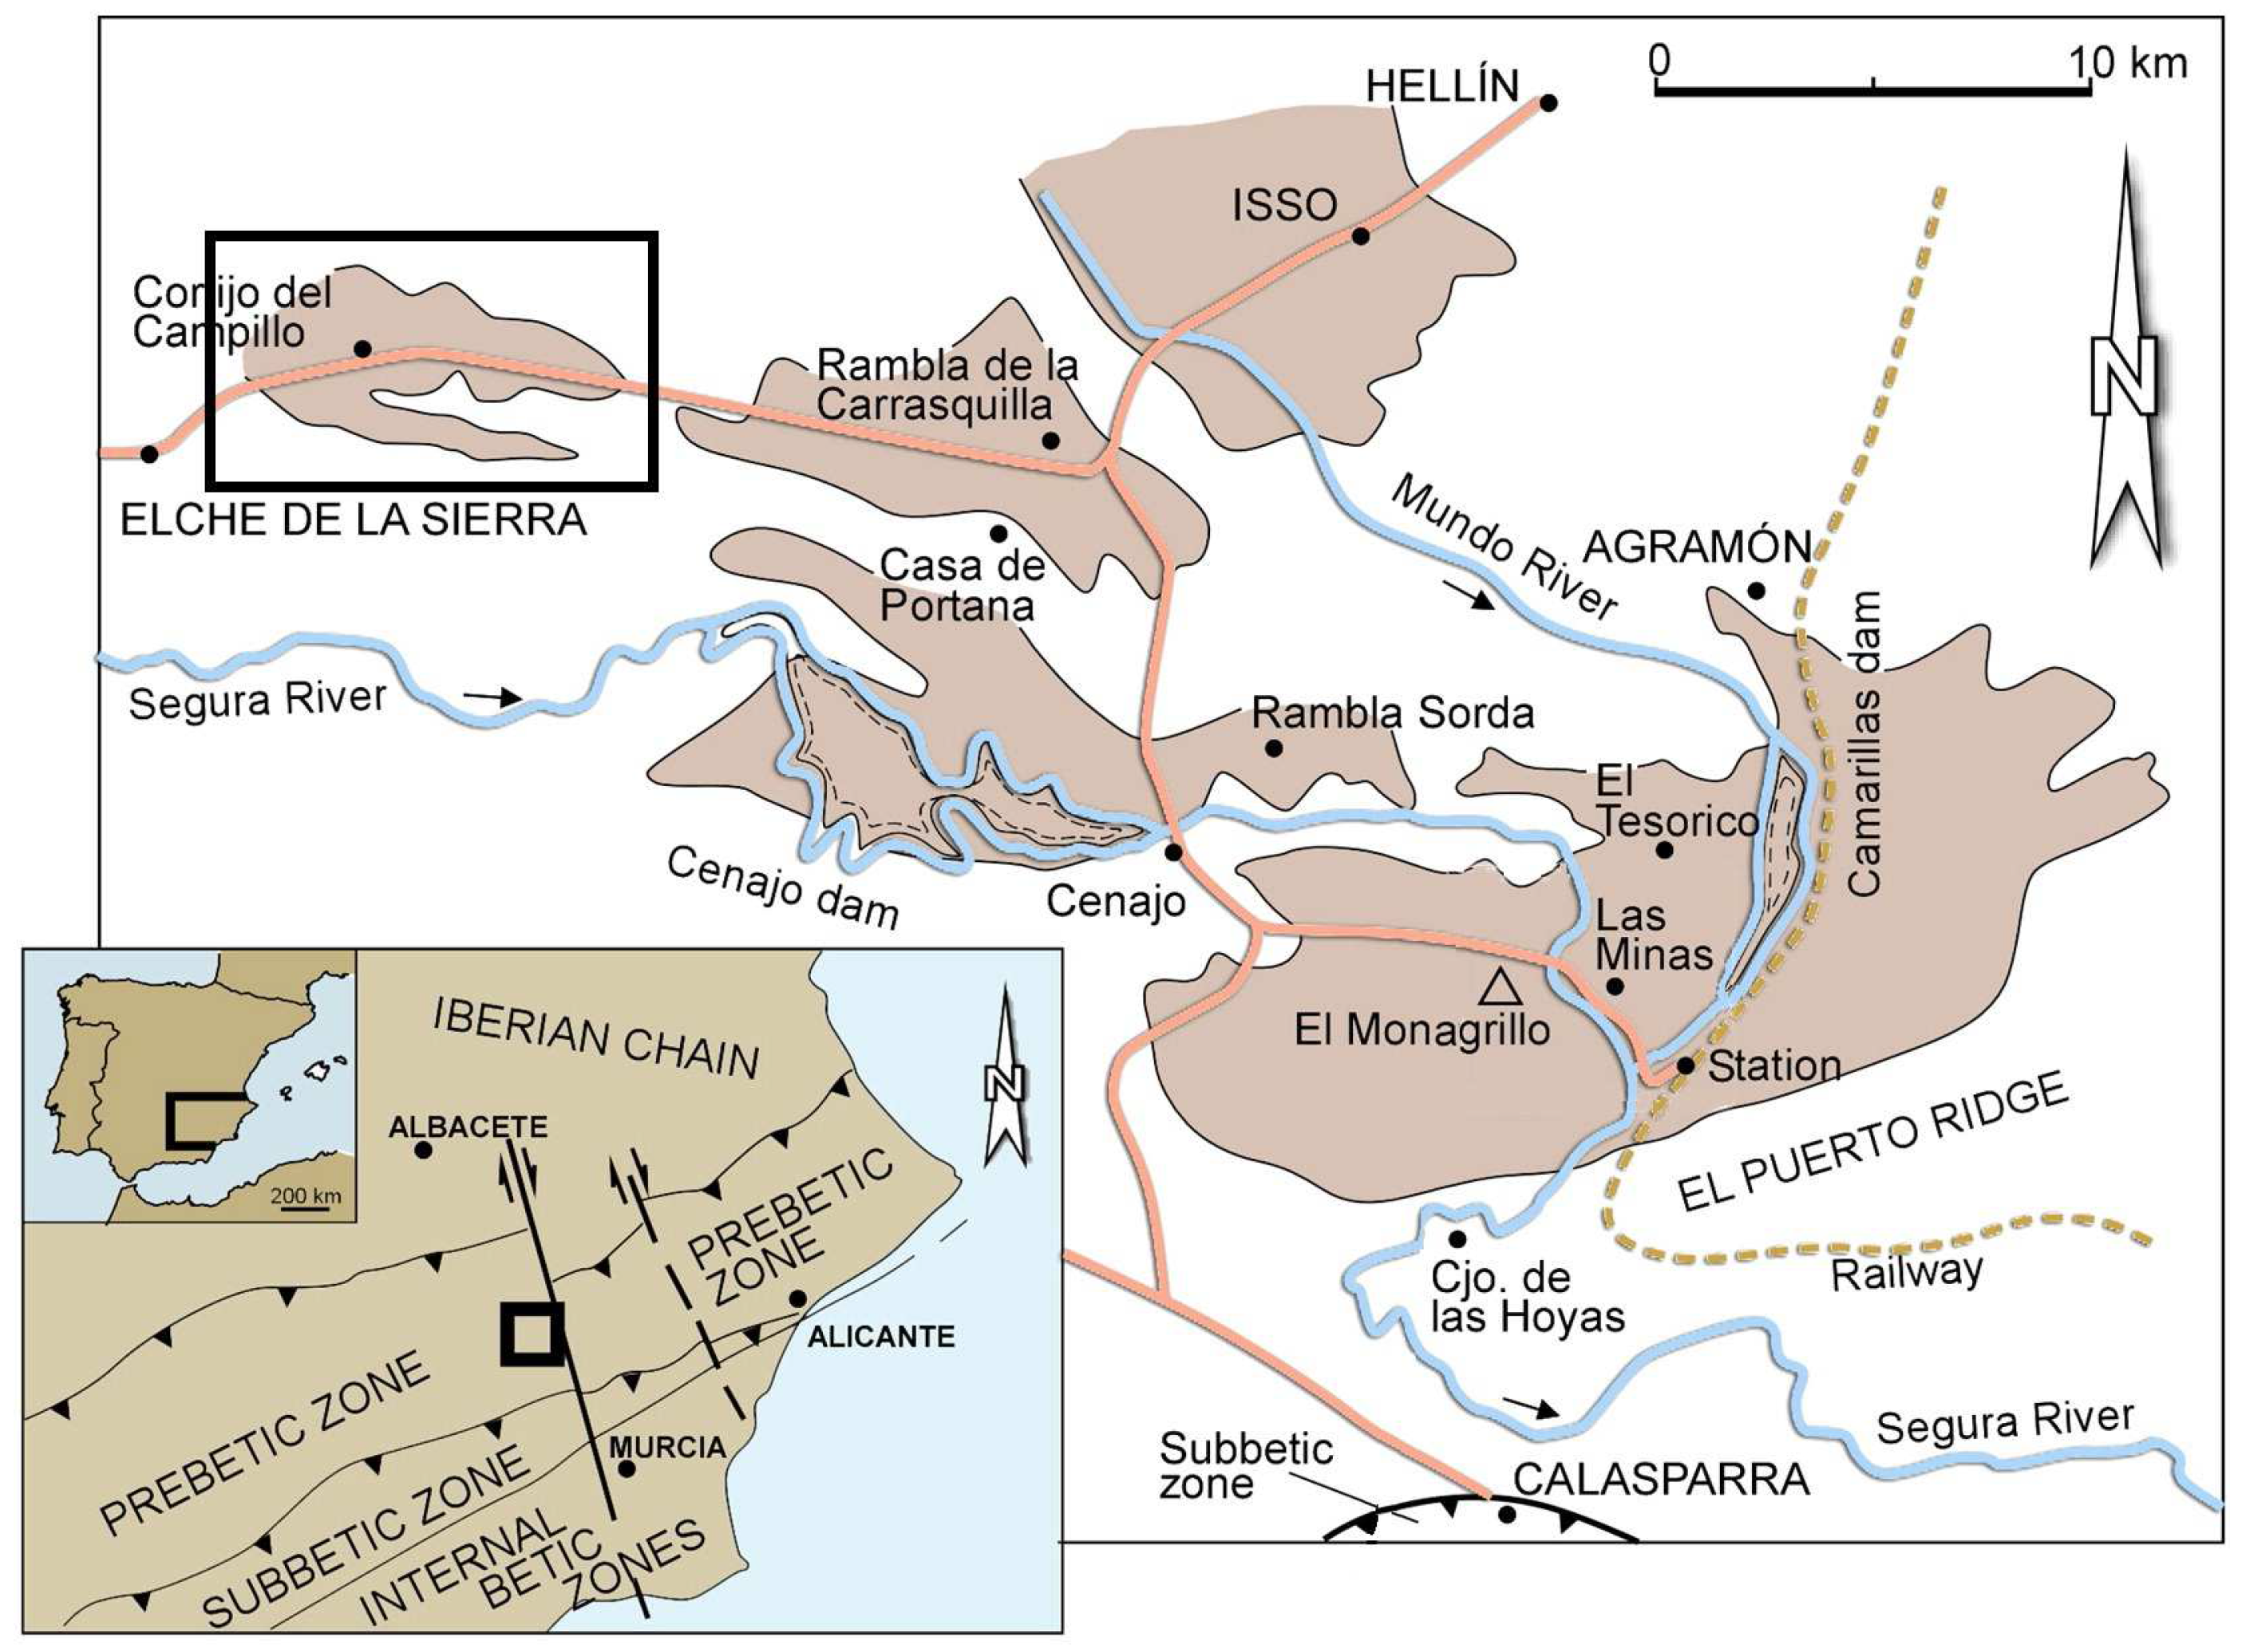
2.1. Geological Background and Samples

The samples for this study were obtained from a diatomite deposit in the Elche de la Sierra basin (SE Spain). The deposit forms part of a system of continental Neogene basins located on the external side of the Betic Ranges Figure 1 [6]. During the Upper Miocene, the basins were filled mainly with lacustrine sediments. Towards the end of the evolution of the basins, active volcanism generated a surplus of silica in the water, favouring the thriving of diatoms. The deposition of diatomites occurred together with marls and carbonates [18], generating diatomite deposits with a variable amount of carbonates and some terrigenous intercalations through the stratigraphic sequence [19]. The formation of the carbonate minerals and the type and abundance of diatoms was affected by seasonal variations of composition and volume of the water in the lakes [6]. The diatom flora indicates a depositional environment in a shallow lacustrine basin with sporadic marine inputs [20].
Locally, Jurassic and Tertiary limestones and faulted Quaternary alluvium enclose the Elche de la Sierra diatomite deposit. Northwards, diatomite transforms progressively to clays, marls and conglomerate. Southwards, the edge of the body thins and transforms into opal-CT (cristobalite/tridymite). In the central part of the basin, the diatomite deposit has a maximum thickness of 80 m. The stratigraphic sequence consists of a basal conglomerate, overlain by the diatomaceous ore body, lacustrine limestones, and a Quaternary polymictic conglomerate in the top. The diatomaceous ore body consists of 8 to 11 tabular diatomite layers, interbedded with limestones, marls, sand and clay horizons.
The material for this study was composed of run-of-mine (ROM) samples collected from a mine face in the deposit at different stratigraphic positions. Figure 2 shows a section of the deposit where diatomite layers of 1 m to 3 m thickness are recognisable by their white colour, whereas a light grey colour identifies the limestone layers. Intercalation of thin layers of diatomite, limestones, marls and clay horizons are also present in this part of the deposit. Only diatomite layers thicker than 1 m are mineable. From these layers, 13 samples were taken at different stratigraphic positions and different points in the pit upon accessibility, taking special care that all the diatomite layers were represented in the sample set. The samples were named consecutively D1 to D13, although the numbering does not necessarily relate to the stratigraphic position.
Based on the threshold established by the FCC of maximum 25 wt % of non-siliceous substances in diatomite filters, for this research, a cut-off value of 25 wt % CaCO3 was established as the maximum threshold for a sample to be regarded as diatomite ore. For an analogue with the actual processing of diatomite ore, the samples were classified into different quality grade (QG) levels based on the CaCO3 content. The cut-off values for every QG assigned in this study do not exactly correspond to those used in the industry (disclosure not possible due to commercial sensitivity), but yet they attempt to resemble the classification used by some mining companies. The cut-off values used in this study are as follows: QG 1 < 10 wt % , QG2 = 10–16 wt %, QG3 = 16–22 wt % and QG4 = 22–25 wt %. To ensure that all the QG levels were represented in the sample set, four samples with known CaCO3 values were added, namely samples D14 to D17.

2.2. Analytical Methods

The association between carbonates and diatom frustules as well as the variations in the diatom morphology and preservation were investigated using environmental scanning electron microscopy (ESEM). The observations were conducted on rock chips to avoid any alteration of the diatom frustules induced by sample preparation. The instrument used was a Philips XL30 ESEM (Amsterdam, The Netherlands) and supported with element analysis. The amount of CaCO3 and the concentration of major elements in the samples to support the mineralogical analyses were determined using X-ray fluorescence (XRF) using a PANalytical Magix Pro (Almelo, The Netherlands). The mineralogical content of the samples was identified by using infrared (IR) spectroscopy. This technique was used firstly due to its ability to detect amorphous phases in minerals, which is adequate for the detection of opaline silica [22], and secondly due to its demonstrated capabilities for operating in mining and industrial environments. The samples used for all the spectral analyses were gently powdered using pestle and mortar, trying to preserve the delicate diatom structure, and later homogenised. Laboratory data were collected using attenuated total reflection (ATR), with an ATR-Diamond accessory in a Perkin Elmer Spectrum 100 FTIR spectrometer (Shelton, CT, USA). The measuring conditions included compression of 1.5 kbar , spectral range 7.5 to 15 μ m (1333 to 667 c m 1 ), resolution of 2 c m 1 and 16 scans per second.
Spectra were also collected using portable spectrometers to assess the optimum measuring and analysing conditions required for an actual on-site application. Bidirectional reflectance spectra were collected using a PANalytical ASD FieldSpec spectrometer covering the 0.3 to 2.5 μ m (33,333 to 4000 cm 1 ) range, integrated with a contact probe and an internal light source; the spectral resolution was 0.01 μ m , using 50 scans to generate one spectrum per measurement. The measuring time per spectrum (50 scans) was on average 60 s. Diffuse reflectance spectra were measured with an Agilent 4300 hand-held FTIR spectrometer (Edinburgh, UK) using coarse silver calibration, ranging from 1.9 to 15 μ m (5263 to 666 c m 1 ), spectral resolution of 4 c m 1 , using 128 scans to generate one spectrum per measurement. The measuring time per spectrum (128 scans) was in average 90 s.
The bidirectional and diffuse spectral measurements were carried out using Petri dishes as sample containers. The surface was first compacted and flattened with a spatula to minimise void spaces and then slightly roughened with the edge of the spatula to maximise the direction of the reflections. It is important to note that, with this method, it is not possible to achieve the same roughness in all samples, causing variations in the overall reflectance from sample to sample. Five spectral measurements per sample were recorded. The spectral files were processed in the R environment. First, noise reduction was conducted by averaging the spectra recorded for every sample. The bidirectional reflectance spectra were processed using continuum removal and derivatives. The diffuse reflectance spectra were smoothed using the Savitzky–Golay filter with polynomial order of 3 and window size of 55 data points. Further principal component analysis (PCA) was also performed in the R environment using the Chemometrics With R package [23].

3. Results

3.1. Ore ESEM Microscopy

Environmental Scanning Electron Microscope images, displayed in Figure 3, were used to characterise the texture of the diatomite ore. These images allowed the identification of the morphological characteristics of the frustules, as well as their relationship with the carbonate minerals. Most of the observed frustules are centric with radial symmetry and a variable size between 10 to 40 μ m . The majority of the diatoms correspond to the genus Cyclotella, as Focault et al. [19] and Servant-Vildary et al. [20] reported previously, although diatoms of the genus Tertiarius might be present as well. Sporadic occurrences of diatoms with bilateral symmetry were also observed, and they correspond to the genera Navicula (Figure 3b), Cocconeis and Cymatopleura. The microscopic images showed that most of the valves are separated but complete, and occur together with fragments of the loose girdle bands (Figure 3b,d,f).
The carbonate was determined to be cement, coating the diatom frustules and in some cases filling the pores (Figure 3d), but also occurs as carbonate laminae in sharp contact with diatom laminae (Figure 3e). Biogenic aragonite with rod-like structure [24] was also present in some samples mixed with the diatoms frustules (Figure 3g–i) or forming the carbonate laminae (Figure 3j). In addition, the diatom frustules and the carbonate minerals, sponge spicules (Figure 3a,c) and detrital fragments were found in a very small proportion.
In order to identify any relationship between the previous observations and the QG levels, the samples from the same quality grade were compared. As Figure 3 shows, the morphological characteristics of the diatoms do not show any particular pattern regarding the QG level. Cyclotella, the most common of the diatoms, appears in all the QG levels. The other types of diatoms seem to occur randomly regardless of the type or amount of impurities in the samples. Concerning the amount and type of carbonate, it was found that, in samples from QG1 and QG2, the carbonate is most commonly found as cement, whereas laminae were almost exclusive from QG3 and QG4. Moreover, the occurrence of rod-like aragonite was also restricted to the levels with high amount of carbonate.

3.2. XRF Characterisation

The chemical composition of the samples, summarised in Table 1, reveals that the most abundant component in the samples is SiO2, comprising an average of 80% in the samples. Based on the ESEM microphotographs, most of the SiO2 can be attributed to the diatom frustules, which are made of opaline silica ( S i O 2 · H 2 O ). The second component in abundance, and therefore the principal impurity in the ore, is CaCO3, which constitutes on average 18% of the composition of the samples. It can be assigned to calcite, aragonite or vaterite, which are calcium carbonate polymorphs. The remaining 2% consist of Al2O3, Cl, Na2O, SrO and SO3, indicating that the other mineral impurities correspond to clay minerals and evaporites, such as halite, celestine and gypsum, expected from evaporitic shallow lacustrine environments, as is the case of the Elche de la Sierra basin [21]. The Mg content in the samples could be either associated with clay minerals, such as montmorillonite, or with carbonates, in the form of dolomite. However, the low concentration of Mg in the samples makes, for this study, the likely presence of dolomite negligible.

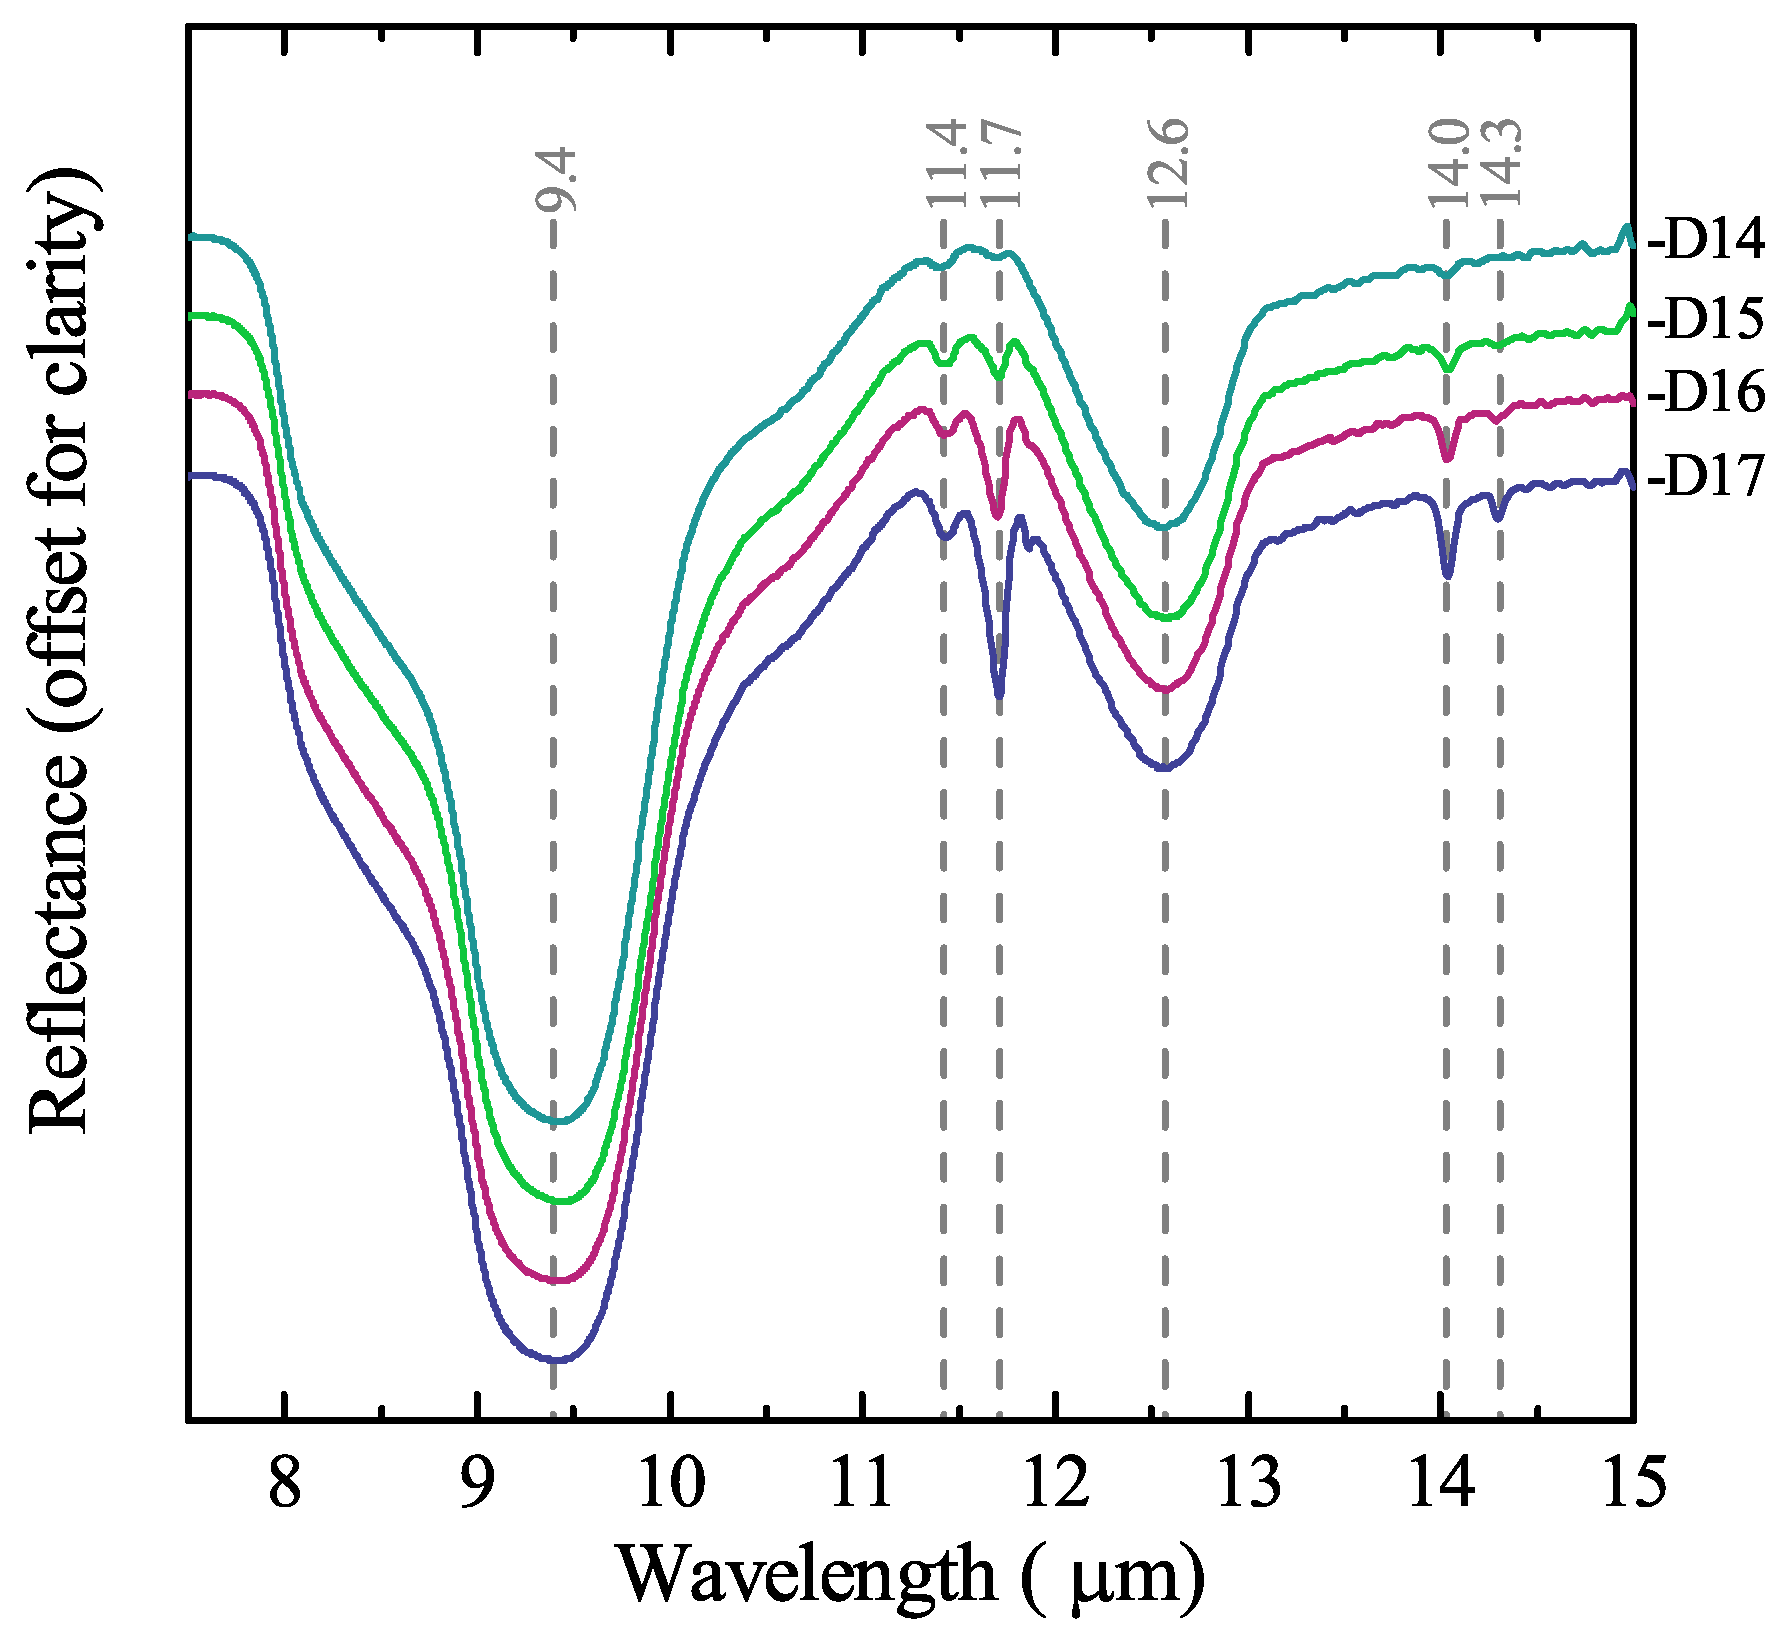
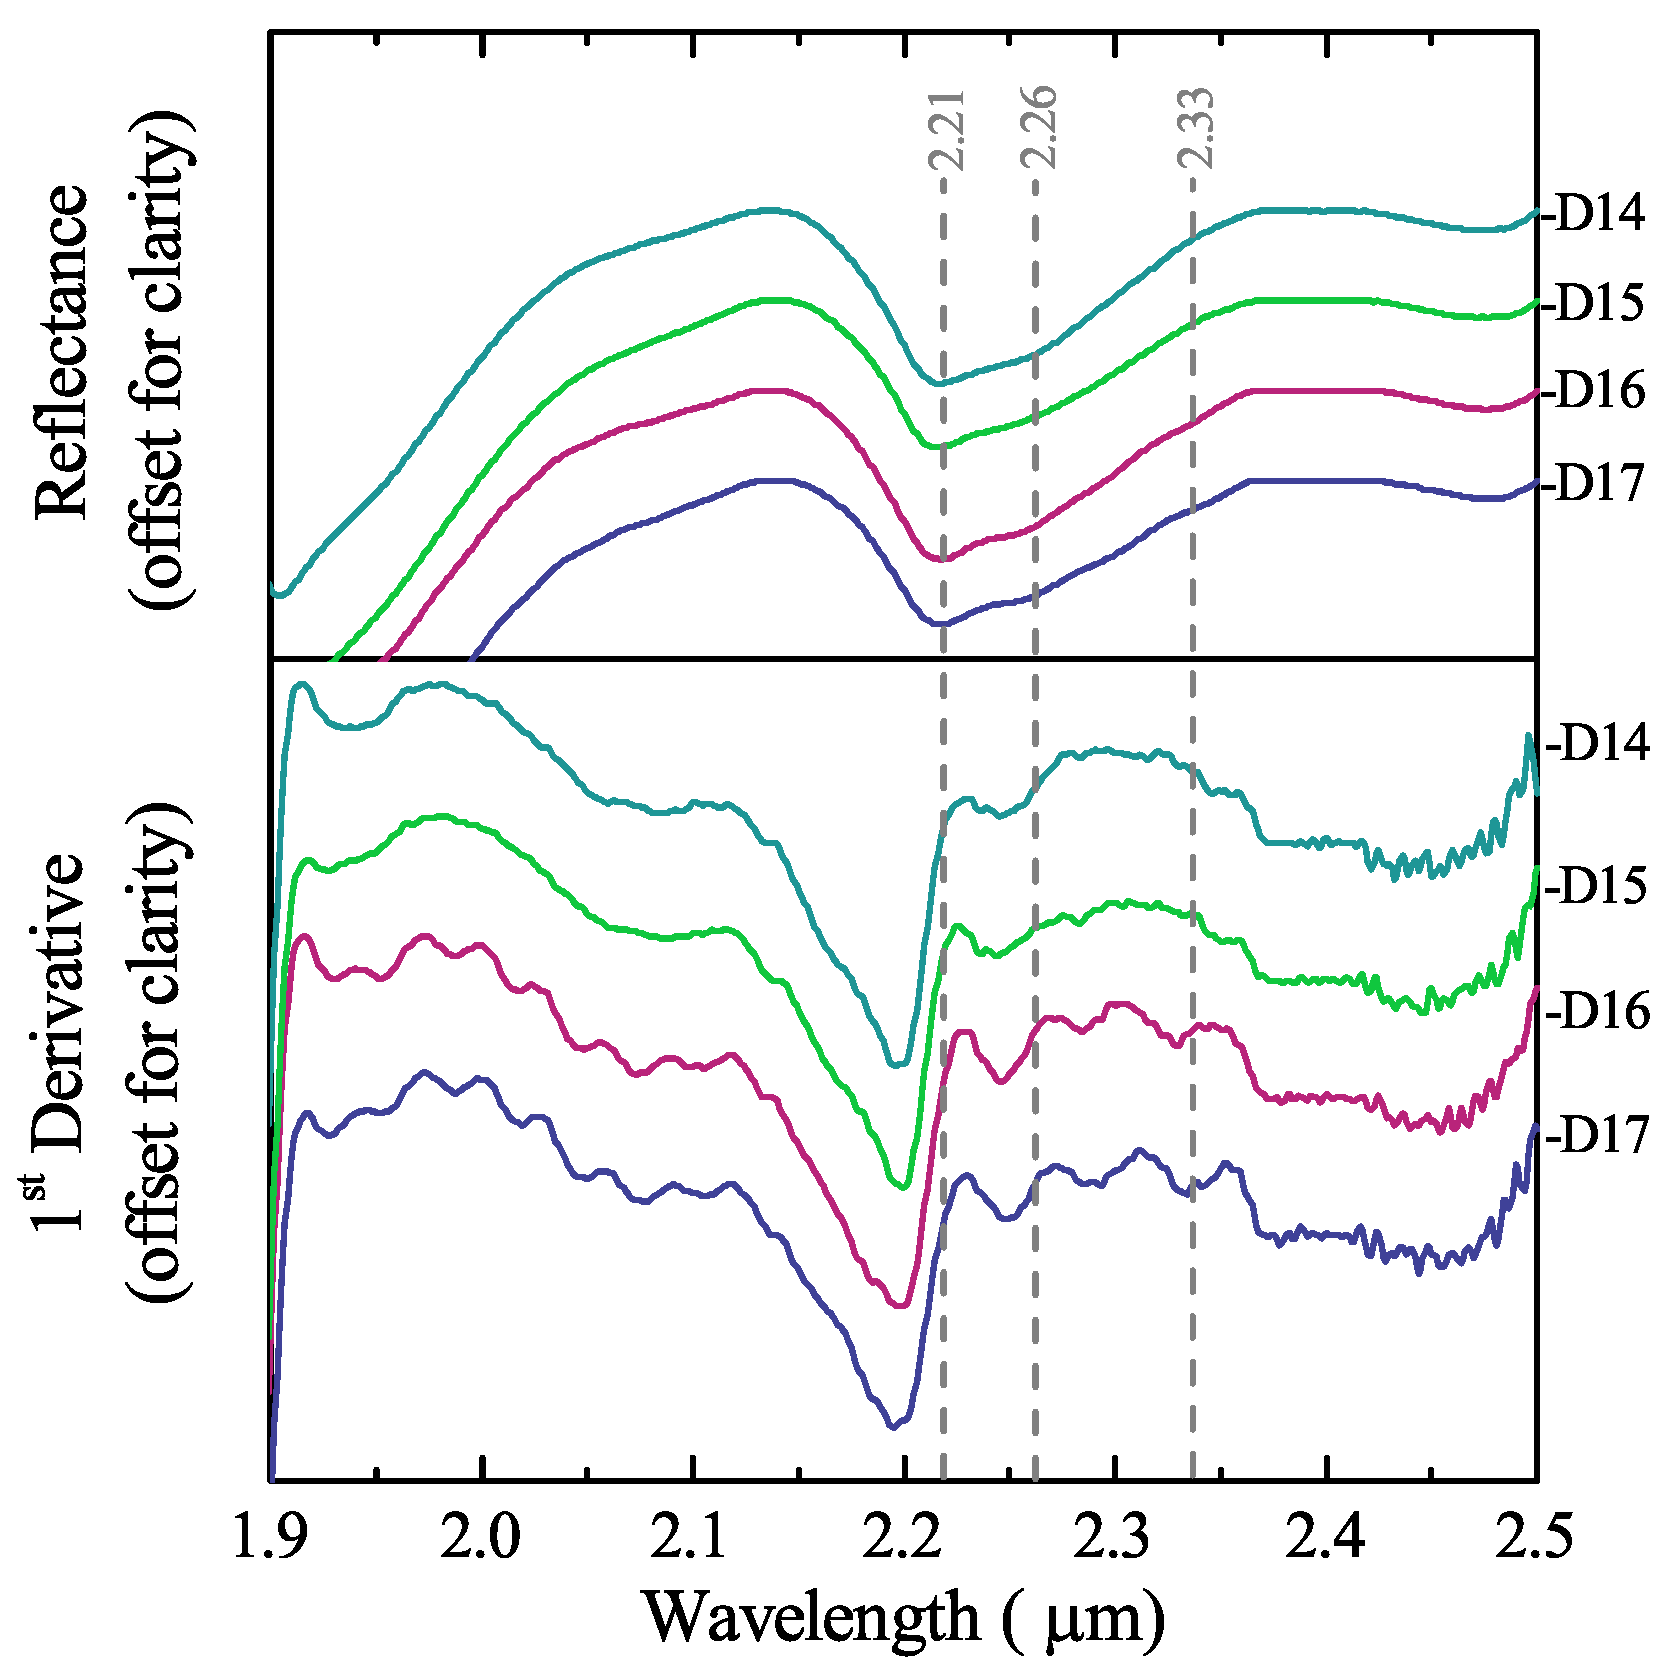
3.3. Mineralogical Characterisation Using Laboratory Infrared Spectroscopy

The infrared spectra provide a more precise characterisation of the mineralogical content in the diatomite ore. Figure 4 presents the spectra of the ore reference samples with different amounts of CaCO3. The most prominent spectral features are those that are characteristic of opaline silica. The main feature, centred at 9.4 μ m , is caused by the asymmetric stretching of the [SiO4] tetrahedron; the feature around 12.6 μ m is associated with the Si–O–Si bending vibration mode; and the shoulder at 10.2 μ m is due to Si–OH molecular vibrations [25]; this feature is in particular distinctive for diatoms [22,26,27]. Because the silica polymorphs have similar spectra in the analysed range, it was not possible to identify any other silica minerals besides opal. A particular feature of quartz at 14.4 μ m [26] was not detected in any of the samples, suggesting that quartz is either absent or in a very low concentration.
The identification of carbonate minerals was based first on the spectral feature at 14.0 μ m , caused by the OCO bending (in-plane deformation) mode. Calcite and aragonite are differentiated by the CO3 out-of-plane deformation mode feature located at 11.4 μ m for calcite and 11.7 μ m for aragonite; in addition, aragonite present as well a second feature associated with the OCO bending mode at 14.3 μ m [28,29]. The characteristic feature of vaterite at 13.4 μ m [24] was not detected in any of the samples. It is expected that the intensity of the spectral features of the carbonate minerals decreases with lower CaCO3 content. However, it is noticeable that the calcite features, even if weak, are present in the spectra of all the samples, whereas the aragonite features are only present at relatively high CaCO3 content (above ~ 11 wt % ). The IR spectra did not detect any of other minerals likely to be present in the samples, namely clays and evaporites, since their concentration in the samples is too low.

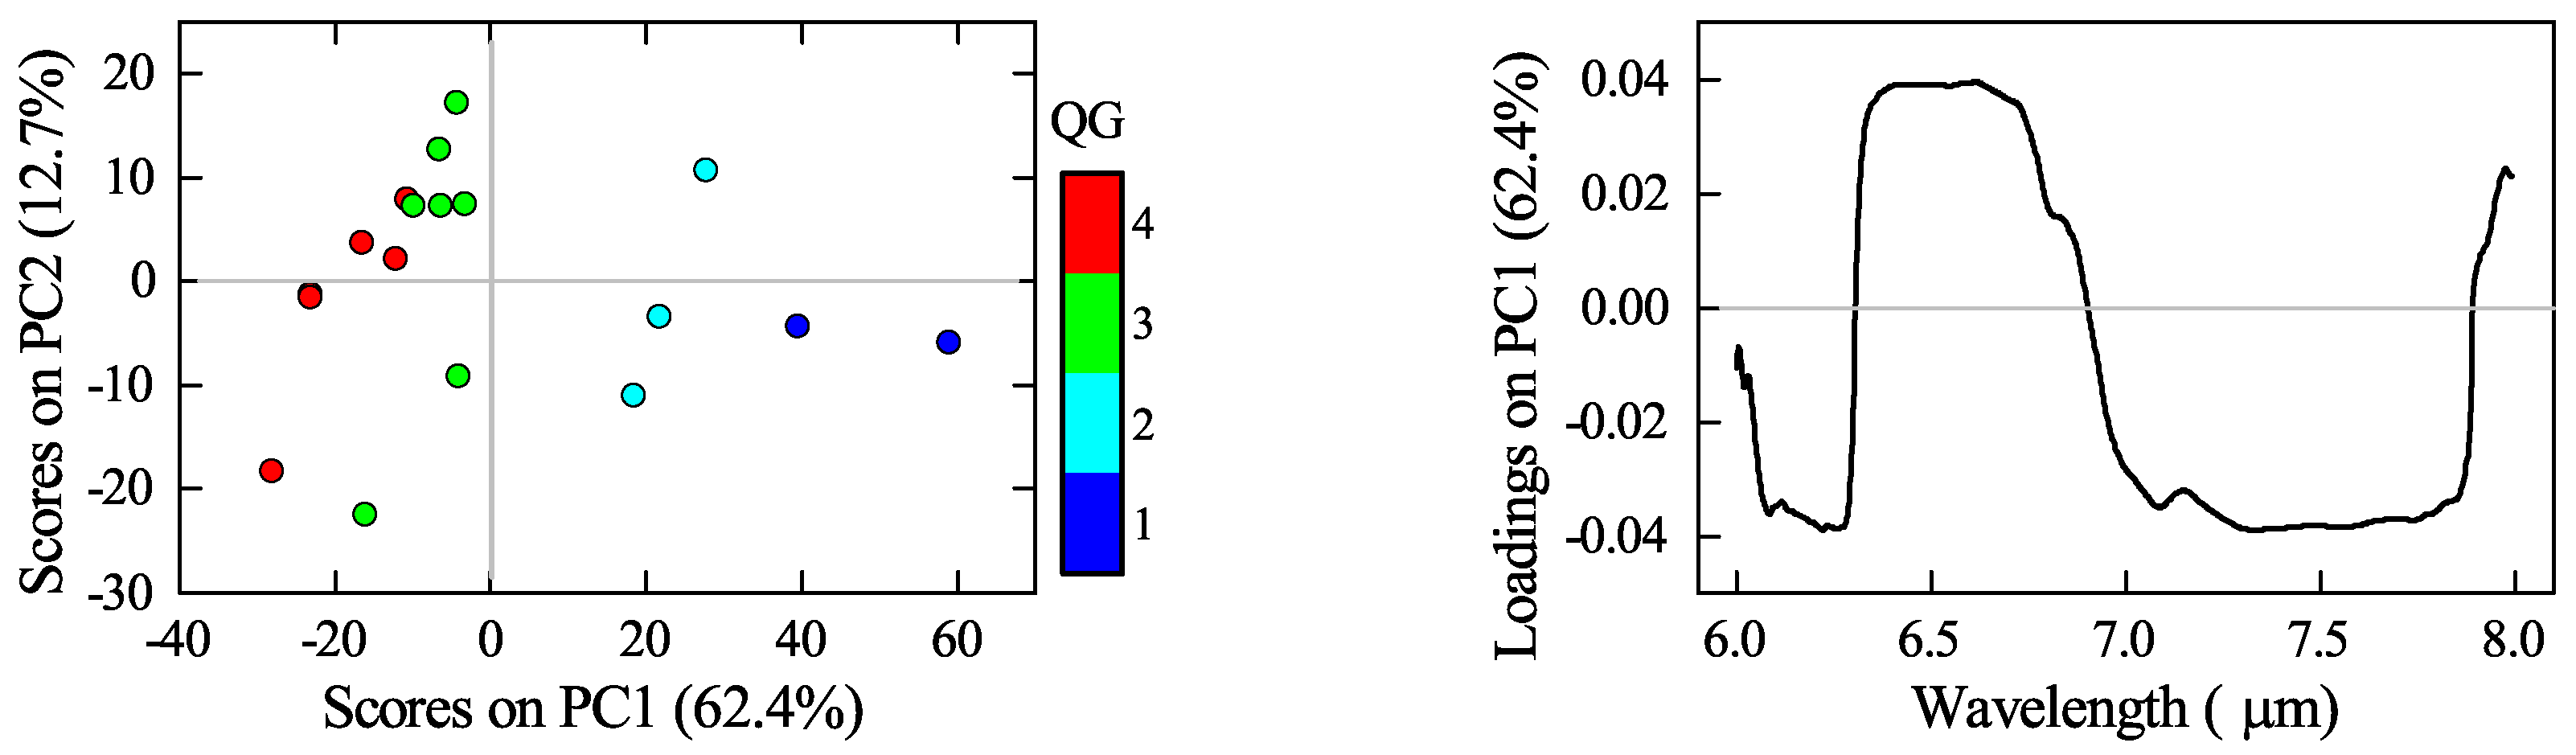
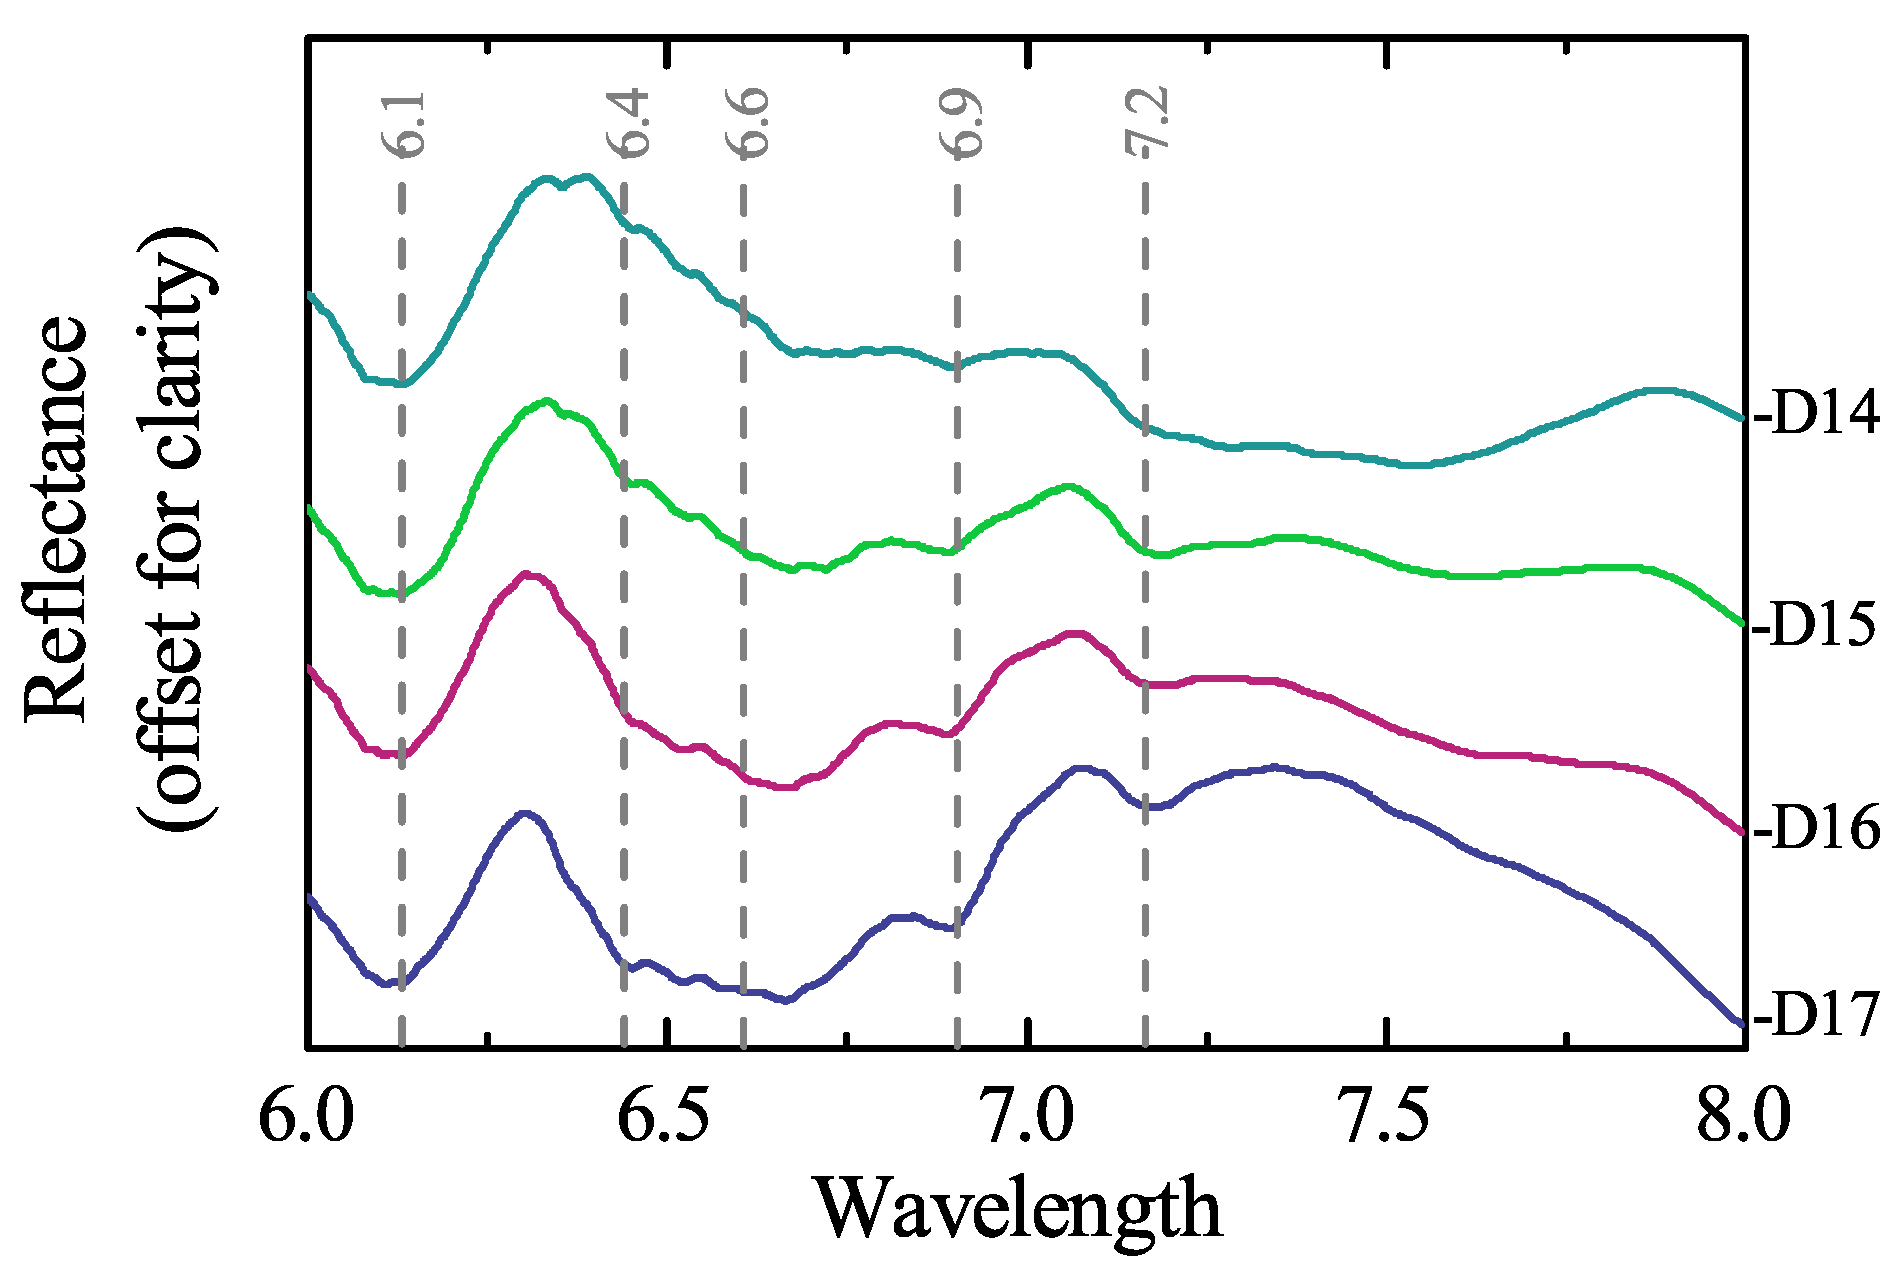
3.4. Mineral Identification Using Portable Infrared Devices

Two portable spectral techniques and ranges were tested to assess the suitability of detecting on-site the purity of the diatomite ore in relation to the carbonate content. Each technique makes use of a different type of infrared reflection and a different spectral range. The potential of these techniques for an on-site implementation was assessed based on their ability to differentiate the carbonate minerals from the opaline silica and to make a qualitative assessment of the amount of impurities in the ore.
The spectra recorded using bidirectional reflectance were constrained to the 1.9 to 2.5 μ m wavelength range, where the absorption features of opaline silica and carbonates occur. In this range, opaline silica presents features at 2.21 μ m and 2.26 μ m caused by the stretching mode of isolated Si–OH and bending mode of the H-bound silanol [27]. Aragonite and calcite present strong absorption features at 2.33 μ m and 2.26 μ m due to the combination tones of the carbonate vibrations; for these two minerals, the features occur at the same or slightly shorter wavelengths [30]. Other carbonate features are present between 1.7 to 2.1 μ m , but they are usually not present in mixed spectra. In Figure 5 (top), the spectra of the diatomite ore were processed using the Continuum Removal (CR) technique to enhance the differences between spectral features. However, only the features of opaline silica are visible. The overlap of opal and carbonate features at 2.26 μ m hinders the use of this wavelength as a diagnostic mark, and the 2.33 μ m feature is masked. To amplify the possible differences in the spectra, the first derivative was calculated. Figure 5 (bottom) reveals the 2.33 μ m carbonate feature in the D16 and D17 samples, indicating that, despite the overwhelming spectra of opaline silica, carbonate minerals can be detected as long as the amount of CaCO3 is no less than 11 wt % .
In the diffuse reflectance, the spectra were noisier than using bidirectional reflectance, and long wavelengths were influenced by the volume scattering of the diatomite powders [31], generating low-quality spectra. For these data, the most useful spectral region was the one that covers the opal and carbonate between 6.0 to 8.0 μ m . In this range, the features of opaline silica are detected at 6.1 μ m , caused by the H–O–H bend in isolated molecular water, and at 7.4 μ m , corresponding to the Christiansen Feature (CF) for silicates [27]. The features for carbonate minerals in this region are due to the asymmetric C–O stretching; absorptions at 6.3 μ m and 6.6 μ m are characteristic of aragonite, whereas those at 6.9 μ m and 7.2 μ m correspond to calcite [28,29]. In the spectra of the diatomite ore, shown in Figure 6, the opal Christiansen Feature in the D14 sample is broadened to shorter wavelengths due to the 7.2 μ m calcite feature. With the increasing CaCO3 content in the other samples, the calcite absorptions of calcite become better defined along with the aragonite ones. In the particular case of aragonite, the broad bands in Figure 6 are an indication of a distorted amorphous lattice [28].
The results of the characterisation of the diatomite ore using diffuse reflectance spectra are in general in agreement with those achieved by using the laboratory ATR data. Furthermore, they provide more complete information than that acquired by using the bidirectional reflectance set-up. Based on this outcome, further analysis was carried out for the diffuse reflectance data. Principal component analysis (PCA) was used to assess whether it is possible to classify the ore according to the QG levels using the infrared spectra. PCA analysis presents the advantage of identifying the largest possible variance in the sample set, giving the most meaningful information in the first components. Other sources of variability related to noise, for example, are relegated to other components. In the case of the spectra used in this study, the PCA analysis is convenient since it identifies not only the spectral variability related to the mineral composition, but also because it minimises the influence of spectral variations in the overall reflectance due to the sample preparation.
Figure 7 shows the scores and loadings plots of the first principal component (PC1). The scores plot is coloured based on the quality grade levels. Even though the size of the sample set is rather small, it is possible to identify trends in the PCA scores. Positive scores are associated with QG1 and QG2, whereas negative scores are related to QG3 and QG4. Moreover, the dimension of the positive scores separates QG1 from QG2. In contrast, in the negative scores, there is not a clear separation between QG3 and QG4. The variability in the spectra described by PC1 is related to the silica and the carbonate features, as the loadings plot shows. Positive loadings belong to the region between 6.3 to 6.8 μ m , where the aragonite features occur. In contrast, negative loadings correspond to the regions that host the opal features, between 6.0 to 6.3 μ m and 7.0 to 7.7 μ m . It is not surprising that the PCA does not differentiate sharply between quality grade levels since, on the one hand, the cut-off values for the quality grades are arbitrary; on the other hand, the composition and consequently the spectra of the samples vary continuously along quality grades.

4. Discussion

4.1. Influence of the Ore Characteristics in Mineral Processing

The observations about the texture of the diatomite ore revealed that, even though the girdles are commonly detached from the diatom frustule, complete valves and complete shells make up the majority of the diatom remains. This implies that the natural porosity of the diatomite ore is not affected by the disaggregation of the frustules. However, it was also observed that the carbonate present as cement fills the pores of some of the frustules, decreasing the natural porosity of the ore, as shown in Figure 3d. In contrast, biogenic aragonite crystals do not affect the porosity, due to their particle size (10 to 20 μ m ), and carbonate laminae have a reduced surface of contact with the frustules.
The association between the carbonate and the frustules, together with the type of carbonate present in the ore, might influence the performance of certain beneficiation techniques [12]. Removal of carbonate present as cement would be more effective by using wet beneficiation techniques that dissolve the CaCO3, whereas large aragonite crystals and carbonate laminae, in general, could be removed by using physical beneficiation techniques. Since the presence of carbonate as a cement is usually found in ores of higher quality (QG1 and QG2), and laminae and aragonite crystals are more common in high carbonate ores (Q3 and Q4), high and low quality ores could be beneficiated separately using adequate methods for the type of mineral association.

4.2. Potential for the Use of Infrared Sensors as a Tool for Optimising Mining and Mineral Processing

The characterisation of the diatomite using infrared spectroscopy enable the identification of calcite and aragonite as the main ore impurities. Moreover, it established a correspondence between the type of carbonate mineral and the quality of the diatomite, where aragonite is restricted to high carbonate ores. The identification of the type of carbonate was possible by using not only a well-established laboratory set-up, but also by using a portable instrument that uses diffuse reflectance spectroscopy. Even though the quality of the data collected with the device equipped with diffuse reflectance is lower than the laboratory and bidirectional reflectance ones, the acquired spectra were shown to be adequate to perform a qualitative analysis of the composition of the diatomite ore.
The main advantage of the diffuse over the bidirectional reflectance is based on the possibility of using a spectral range where the features of carbonates and opal do not overlap, enabling a straightforward identification of the two mineral phases present in the ore. Moreover, in the spectral range used, it was also possible to differentiate the features of calcite from those of aragonite. Given these factors, it was feasible to perform a qualitative analysis using principal component analysis (PCA). The PCA results demonstrated that, by using the spectra above, it is possible to classify the diatomite ore based on the carbonate content. These results also open up the opportunity for conducting more precise quantitative analysis with the aid of chemometric tools, such as partial least squares regression (PLS), as suggested by Meyer et al. [32], or relational models based on the inherent parameters of the carbonate absorption features (e.g., wavelength position, depth) and the actual CaCO3 content following the approach used by Zaini et al. [33] .
Besides the analytic advantages provided by the use of diffuse reflectance spectroscopy, this technique also represents a suitable sensor for the in-pit characterisation of the diatomite ore. The spectral range used is not affected by particle size, and, therefore, can be used either for rock or powder samples. The availability of portable instruments that work in the mentioned spectral range enables the collection of data on-site, with little or no sample preparation. The spectral acquisition takes a few minutes per sample only, and the data does not require extensive processing or high computing capabilities, making it possible to generate information in (near) real-time.
Despite these advantages, to the knowledge of the authors, the technological advances to date in the 6.0 to 8.0 μ m range allow collecting point data only, leaving applications such as sample and face imaging out of reach. Hyperspectral imagers are available only in the Short Wavelength IR (SWIR) (1.0 μ m to 2.5 μ m ) and in the thermal IR (TIR) (8.0 μ m to 12.0 μ m ). The results of this study discouraged the use of the SWIR range due to the overwhelming spectra of opal (Figure 5) and the use of the TIR range due to issues related to particle size. Nevertheless, for the applications that work for whole rock rather than for powders, this constraint is not valid anymore. In this case, the features that were studied in this work using laboratory spectra (Figure 4) could be possibly used to establish the relationship between the spectra and the CaCO3 content. However, unlike the diffuse reflectance data, the collection and processing of spectral images, either as mine face or drill core scanners, are time-consuming, and therefore, they could not be considered for processes that require real-time data.
The use of diffuse reflectance spectroscopy, using a portable device ranging around 6.0 to 8.0 μ m , would enable the on-site determination of the quality grade of the diatomite ore. Even though it works as a point measurement technique, results can be obtained on-site and (near) real-time offering the possibility of collecting several data points that characterise either a section of the pit or high volumes of stocked piled ore. The results of the spectral analysis could be used, for example, to aid selective mining, by discriminating sections of the pit with a given quality grade. The spectral classification of the ore could also assist with the upgrading of the ore before mineral processing, aiding in the selection of convenient and optimised beneficiation techniques.

5. Conclusions

This study presented the main characteristics of the diatomite ore that are relevant for generating filter-grade finished products. In addition, it assessed the potential of using infrared spectroscopy as a technique for the on-site characterisation of the diatomite ore with a view to the optimisation of mining and beneficiation.
The textural observations of the ore revealed that the diatom frustules are excellently preserved and the disaggregation state does not diminish the porosity of the diatomite. The presence of carbonate minerals was identified as the only factor that affects the quality of the ore. For this case study, carbonate was found as calcite cement in ores with relatively low carbonate content, and as cement, loose aragonite crystals and laminae in ores with relatively high carbonate content. These minerals were identified by using laboratory and portable infrared spectroscopy. From the portable techniques tested, diffuse reflectance using the 6.0 to 8.0 μ m spectral range provided a better mineral identification that could be used for classifying the diatomite ore according to the pre-determined quality grades.
These results show that the quality of the diatomite ore can be determined by using infrared spectroscopy. This information integrated with the acquired knowledge about the type of associations between the carbonate and opaline silica phases can be used for optimising the beneficiation process. Consequently, this study offers insights on the advantages and the potential of using infrared spectroscopy as an on-site tool for the characterisation of the diatomite ore. An infrared-based determination of the quality of the ore would provide relevant and timely information at mining and pre-beneficiation stages that can support proactively the decision-making process. Ultimately, the implementation of infrared ore characterisation would be reflected in the more efficient use of the diatomite resources, optimised mineral processing and generation of high-quality diatomite products.

Acknowledgments

The authors wish to thank Imerys Ltd., Cornwall, UK and Alicante, Spain, for access to the samples, and to Emiel Klifman for the ESEM analyses. This work was financially supported by the European FP7 project “Sustainable Technologies for Calcined Industrial Minerals in Europe” (STOICISM), grant NMP2-LA-2012-310645.

Author Contributions

Adriana Guatame-Garcia and Mike Buxton conceived and designed the experiments; Adriana Guatame-Garcia performed the experiments analysed the data; Adriana Guatame-Garcia wrote the paper and Mike Buxton reviewed it before submission.

Conflicts of Interest

The authors declare no conflict of interest. The founding sponsors had no role in the design of the study; in the collection, analyses, or interpretation of data; in the writing of the manuscript, and in the decision to publish the results.

References

  1. Korunic, Z. Review—Diatomaceous earths, a group of natural insecticides. J. Stored Prod. Res. 1998, 34, 87–97. [Google Scholar] [CrossRef]
  2. Breese, R.O.Y.; Bodycomb, F.M. Diatomite. In Industrial Minerals and Rocks, 7th ed.; Kogel, J.E., Trivedi, N.C., Barker, J.M., Krukowski, S.T., Eds.; Society for Mining, Metallurgy, and Exploration: Englewood, CO, USA, 2006; pp. 433–450. [Google Scholar]
  3. Crangle, R.D. 2015 Minerals Year Book–Diatomite [Advance Release]. 2016. Available online: https://minerals.usgs.gov/minerals/pubs/commodity/diatomite/myb1-2015-diato.pdf (accessed on 30 January 2018).
  4. USPC. Food Chemicals Codex. 2016. Available online: https://app.knovel.com/hotlink/toc/id:kpFCCE0031/food-chemicals-codex/food-chemicals-codex (accessed on 14 March 2018).
  5. Braun, F.; Hildebrand, N.; Wilkinson, S.; Back, W.; Krottenthaler, M.; Becker, T. Large-Scale Study on Beer Filtration with Combined Filter Aid Additions to Cellulose Fibres. J. Inst. Brew. 2011, 117, 314–328. [Google Scholar] [CrossRef]
  6. Bellanca, A.; Calvo, J.P.; Censi, P.; Elizaga, E.; Neri, R. Evolution of Lacustrine Diatomite Carbonate Cycles of Miocene Age, Southeastern Spain: Petrology and Isotope Geochemistry. J. Sediment. Petrol. 1989, 59, 45–52. [Google Scholar]
  7. Martinovic, S.; Vlahovic, M.; Boljanac, T.; Pavlovic, L. Preparation of filter aids based on diatomites. Int. J. Miner. Process. 2006, 80, 255–260. [Google Scholar] [CrossRef]
  8. Ediz, N.; Bentli, İ.; Tatar, İ. Improvement in filtration characteristics of diatomite by calcination. Int. J. Miner. Process. 2010, 94, 129–134. [Google Scholar] [CrossRef]
  9. Moffat, W.; Walmsley, M.R.W. Understanding lime calcination kinetics for energy cost reduction. In Proceedings of the 59th Appita Conference, Auckland, New Zealand, 16–19 May 2005. [Google Scholar]
  10. Al-Wakeel, M.I. Characterization and process development of the Nile diatomaceous sediment. Int. J. Miner. Process. 2009, 92, 128–136. [Google Scholar] [CrossRef]
  11. Jung, K.W.; Jang, D.; Ahn, K.H. A novel approach for improvement of purity and porosity in diatomite (diatomaceous earth) by applying an electric field. Int. J. Miner. Process. 2014, 131, 7–11. [Google Scholar] [CrossRef]
  12. Moradi, S.; Moseley, D.; Hrach, F.; Gupta, A. Electrostatic beneficiation of diatomaceous earth. Int. J. Miner. Process. 2017, 169, 142–161. [Google Scholar] [CrossRef]
  13. Sun, Z.; Mao, J.; Hu, Z.; Zheng, S. Study on pilot-scale centrifugal separator for low-grade diatomite purification using response surface methodology. Part. Sci. Technol. 2017, 35, 119–126. [Google Scholar] [CrossRef]
  14. Rezai, B. The beneficiation studies of diatomite by flotation and hydrocyclone. In Mineral Processing Technology Mpt-2005; Venugopal, R., Sharma, T., Saxena, V.K., Mandre, N.R., Eds.; McGraw Hill: New York, NY, USA, 2005; pp. 214–227. [Google Scholar]
  15. Şan, O.; Gören, R.; Özgür, C. Purification of diatomite powder by acid leaching for use in fabrication of porous ceramics. Int. J. Miner. Process. 2009, 93, 6–10. [Google Scholar] [CrossRef]
  16. Zhang, G.; Cai, D.; Wang, M.; Zhang, C.; Zhang, J.; Wu, Z. Microstructural modification of diatomite by acid treatment, high-speed shear, and ultrasound. Microporous Mesoporous Mater. 2013, 165, 106–112. [Google Scholar] [CrossRef]
  17. Guatame-García, A.; Buxton, M. Detection of mineral impurities in diatomite ores. In Proceedings of the 2nd International Conference on Applied Mineralogy & Advanced Materials AMAM-ICAM 2017, Taranto, Italy, 5–9 June 2017; Fiore, S., Ed.; Digilabs: Bari, Italy, 2017; Volume 4, pp. 19–24. [Google Scholar]
  18. Elizaga, E.; Calvo, J.P. Evolución sedimentaria de las cuencas lacustres neógenas de la zona prebética (Albacete, España). Relación, posicióny efectos del vulcanismo durante la evolución. Interés minero. Boletín Geológicoy Minero 1988, 99, 837–846. [Google Scholar]
  19. Foucault, A.; Calvo, J.; Elizaga, E.; Rouchy, J.; Servant-Vildary, S. Situation of the late Miocene lacustrine deposits from Hellin—Province of Albacete, Spain—in the geodynamic evolution of the Betic Cordilleras. [Place des depots lacustres d’age miocene superieur de la region de Hellin (Province de Albacete, Espagne) dans l’evolution geodynamique des Cordilleres betiques.]. Comptes Rendus Acad. Sci. Ser. II 1987, 305, 1163–1166. [Google Scholar]
  20. Servant-Vildary, S.; Rouchy, J.; Pierre, C.; Foucault, A. Marine and continental water contributions to a hypersaline basin using diatom ecology, sedimentology and stable isotopes: An example in the Late Miocene of the Mediterranean (Hellin Basin, southern Spain). Palaeogeogr. Palaeoclimatol. Palaeoecol. 1990, 79, 189–204. [Google Scholar] [CrossRef]
  21. Ortí, F.; Rosell, L.; Gibert, L.; Moragas, M.; Playà, E.; Inglès, M.; Rouchy, J.M.; Calvo, J.P.; Gimeno, D. Evaporite sedimentation in a tectonically active basin: The lacustrine Las Minas Gypsum unit (Late Tortonian, SE Spain). Sediment. Geol. 2014, 311, 17–42. [Google Scholar] [CrossRef]
  22. Chester, R.; Elderfield, H. The Infrared Determination of Opal in Siliceous Deep-sea Sediments. Geochim. Cosmochim. Acta 1968, 32, 1128–1140. [Google Scholar] [CrossRef]
  23. Wehrens, R. Chemometrics with R; Springer: Berlin/Heidelberg, Germany, 2011. [Google Scholar]
  24. Gopi, S.P.; Subramanian, V. Polymorphism in CaCO3—Effect of temperature under the influence of EDTA (di sodium salt). Desalination 2012, 297, 38–47. [Google Scholar] [CrossRef]
  25. Gendron-Badou, A.; Coradin, T.; Maquet, J.; Fröhlich, F.; Livage, J. Spectroscopic characterization of biogenic silica. J. Non-Cryst. Solids 2003, 316, 331–337. [Google Scholar] [CrossRef]
  26. Moenke, H.H.W. Silica, the Three-dimensional Silicates, Borosilicates and Beryllium Silicates. In The Infrared Spectra of Minerals; Monograph 4, Book Section 16; Farmer, V.C., Ed.; Mineralogical Society: Chantilly, VA, USA, 1974; pp. 365–382. [Google Scholar]
  27. Goryniuk, M.C. The reflectance spectra of opal-A (0.5–25 microns) from the Taupo Volcanic Zone: Spectra that may identify hydrothermal systems on planetary surfaces. Geophys. Res. Lett. 2004, 31. [Google Scholar] [CrossRef]
  28. Andersen, F.A.; Brečević, L. Infrared Spectra of Amorphous and Crystalline Calcium Carbonate. Acta Chem. Scand. 1991, 45, 1018–1024. [Google Scholar] [CrossRef]
  29. Gunasekaran, S.; Anbalagan, G.; Pandi, S. Raman and infrared spectra of carbonates of calcite structure. J. Raman Spectrosc. 2006, 37, 892–899. [Google Scholar] [CrossRef]
  30. Gaffey, S. Spectral reflectance of carbonate minerals in the visible and near infrared (0.35–2.55 microns): Calcite, aragonite, and dolomite. Am. Mineral. 1986, 71, 151–162. [Google Scholar]
  31. Cooper, B.L.; Salisbury, J.W.; Killen, R.M.; Potter, A.E. Mid-infrared spectral features of rocks and their powders. J. Geophys. Res. E Planets 2002, 107. [Google Scholar] [CrossRef]
  32. Meyer-Jacob, C.; Vogel, H.; Boxberg, F.; Rosén, P.; Weber, M.E.; Bindler, R. Independent measurement of biogenic silica in sediments by FTIR spectroscopy and PLS regression. J. Paleolimnol. 2014, 52, 245–255. [Google Scholar] [CrossRef]
  33. Zaini, N.; van der Meer, F.; van Ruitenbeek, F.; de Smeth, B.; Amri, F.; Lievens, C. An Alternative Quality Control Technique for Mineral Chemistry Analysis of Portland Cement-Grade Limestone Using Shortwave Infrared Spectroscopy. Remote Sens. 2016, 8, 950. [Google Scholar] [CrossRef]
Figure 1. Neogene basins on the external side of the Betic Ranges, and location of the Elche de la Sierra basin (black rectangle in the upper-left corner) (modified from [21]).
Minerals 08 00120 g001
Figure 2. Active mine face section of the diatomite deposit where some of the ore samples were obtained: (a) limestone layer with small intercalations of diatomite; (b) diatomite layer with small intercalations of limestones; (c) limestone layer; (d) intercalation of diatomite, limestones, marls and clay horizons; (e) diatomite layer with small intercalations of limestones.
Minerals 08 00120 g002
Figure 3. Environmental scanning electron microscopy (ESEM) microphotographs of the diatomite ore: (a) QG1 with fragments of sponge spicules; (b) QG1 with the occurrence of the genus Navicula; (c) QG2 with fragments of sponge spicule; (d) QG2 with carbonate cement; (e) QG3 with sharp contact between silica and carbonate laminae; (f) QG3; (gi) QG4 with rod-like aragonite crystals; (j) carbonate lamina composed mainly of rod-like aragonite crystals (zoom in from microphotograph (e)).
Minerals 08 00120 g003
Figure 4. Attenuated total reflection (ATR) infrared (IR) spectra of diatomite ore samples with variable content of CaCO3: D14 = 6.29 wt % , D15 = 10.9 wt % , D16 = 16.4 wt % , D17 = 24.4 wt % .
Minerals 08 00120 g004
Figure 5. Bidirectional reflectance spectra of diatomite ore samples with variable content of CaCO3 after continuum removal (top) and 1st derivative (bottom): D14 = 6.29 wt % , D15 = 10.9 wt % , D16 = 16.4 wt % , D17 = 24.4 wt % .
Minerals 08 00120 g005
Figure 6. Diffuse reflectance spectra of diatomite ore samples with variable content of CaCO3: D14 = 6.29 wt % , D15 = 10.9 wt % , D16 = 16.4 wt % , D17 = 24.4 wt % .
Minerals 08 00120 g006
Figure 7. Principal component analysis (PC1 vs. PC2) of diatomite ores (left) and corresponding loadings plot (right).
Minerals 08 00120 g007
Table 1. X-ray fluorescence (XRF) analysis of the diatomite ore samples (concentrations expressed in wt % ) .
Sample IDAl2O3CaCO3ClFe2O3K2OMgONa2OP2O5SiO2SO3SrOTiO2
D10.5619.90.060.430.100.190.120.0768.40.040.170.03
D20.4218.60.070.140.060.160.080.0770.90.030.170.04
D30.4610.90.090.330.080.140.120.0482.20.080.080.05
D40.6416.40.070.340.110.190.090.0673.70.050.100.03
D50.4522.10.070.140.070.160.090.0665.50.040.170.06
D60.5422.10.040.220.090.160.080.0665.30.050.220.06
D70.7722.20.030.340.130.280.060.0864.70.040.140.07
D80.6720.80.040.690.140.210.080.0866.70.030.130.05
D90.6724.30.060.250.120.200.140.0461.80.040.190.08
D100.9623.10.120.400.180.450.130.0762.70.050.210.04
D110.389.610.030.470.040.160.040.0484.30.020.070.03
D120.6810.40.020.320.090.250.060.0582.80.020.020.05
D130.8421.50.030.500.150.320.050.0865.50.030.130.06
D140.516.290.030.280.070.170.050.0489.30.020.020.04
D150.7310.90.020.450.110.250.060.0781.80.020.050.06
D160.7416.40.050.500.110.290.110.0773.30.030.120.07
D170.7224.40.030.420.100.280.050.0761.40.050.170.01
Mean0.6317.60.050.360.100.230.080.0680.60.040.130.05
SD0.165.90.030.140.030.080.030.016.080.020.060.02
Min0.386.30.020.140.040.140.040.0473.60.020.020.01
Max0.9624.20.120.690.180.450.140.0892.40.080.220.08
Error0.020.080.0060.020.0090.010.0080.0070.100.0060.0090.007

