Article

3D Modeling of the Epembe (Namibia) Nb-Ta-P-(LREE) Carbonatite Deposit: New Insights into Geometry Related to Rare Metal Enrichment

Helmholtz-Zentrum Dresden-Rossendorf, Helmholtz Institute Freiberg for Resource Technology, Division “Exploration Technology”, Chemnitzer Str. 40, 09599 Freiberg, Germany
*
Author to whom correspondence should be addressed.
Current address: Landesamt für Umwelt, Landwirtschaft und Geologie, Halsbrücker Str. 31a, 09599 Freiberg, Germany.
Minerals 2018, 8(12), 600; https://doi.org/10.3390/min8120600
Submission received: 7 November 2018 / Revised: 8 December 2018 / Accepted: 17 December 2018 / Published: 19 December 2018
(This article belongs to the Special Issue Toward Mineral Systems for HFSE Rare Metals)

Abstract

:
Geological 3D modeling delivers essential information on the distribution of enrichment zones and structures in (complex) mineral deposits and fosters a better guidance to subsequent exploration stages. The Paleoproterozoic Epembe carbonatite complex showcases the close relation between enrichment of specific elements (Nb, Ta, P, Total Rare Earth Element (TREE) + Y) and shear zones by structural modeling combined with geochemical interpolation. Three-dimensional fault surfaces based on structural field observations, geological maps, cross-sections, and drillhole data are visualized. The model shows a complex, dextral transpressive fault system. Three-dimensional interpolation of geochemical data demonstrates enrichment of Nb, Ta, P, and TREE + Y in small, isolated, lens-shaped, high-grade zones in close spatial distance to faults. Based on various indicators (e.g., oscillating variograms, monazite rims around the apatite) and field evidence, we see evidence for enrichment during hydrothermal (re-)mobilization rather than due to magmatic differentiation related to the formation of the alkaline system. This is further supported by geostatistical analysis of the three-dimensional distribution of Nb, Ta, P, and Light Rare Earth Elements (LREE) with respect to discrete shear zones.

Graphical Abstract

1. Introduction

The economic interest in Rare Earth Elements (REEs), niobium (Nb), and tantalum (Ta) has increased due to technological progress. REEs, Nb, and Ta are major constituents of green technologies, owing to their use in, e.g., wind-turbines, electric cars, smartphones, and other “smart devices”. All 18 elements (La-Lu, Y, Nb, Ta) are included in the recently-published Critical Rare Materials list for the EU [1]. Additionally, the supply of Ta is subject to conflict minerals legislation. Due to low rates of recycling, substitution, and the dominant production position of China since the mid-1980s [2,3], a renewed focus on the exploration of Nb-Ta-REE deposits is needed. Thus, companies and nations have started exploration for critical metal deposits around the world to overcome these supply risks, e.g., the Lofdal Farm Heavy Rare Earth project in Namibia, the Norra Kärr REE project in Sweden, or the recently-opened Browns Range Heavy Rare Earth mine in Australia.
REE mineralizations in general occur as primary and secondary deposits and are related to diverse geological environments and genesis [4]. The Epembe complex itself constitutes a carbonatite-syenite intrusive complex, similar to the complexes of, e.g., Otjisazu/Namibia or Siilinjärvi/Finland. These igneous rocks are usually associated with stable continental tectonic units, like shields, cratons, and crystalline blocks and localized within intra-continental rift and fault systems [5,6,7]. The origin of REE, Nb, and Ta (and other highly incompatible elements) is related to magmatic processes like small degrees of partial melting or fractional crystallization, but the economic enrichment correlates often to the precipitation of minerals from a magmatic hydrothermal solution or redistribution of REEs, Nb, and Ta by a hydrothermal fluid [7,8,9]. Exploration for these deposit types, in a first stage of targeting, often includes stream sediment geochemistry, as well as airborne gamma-ray spectroscopy, magnetics, gravimetry [7], and rarely, ground-based seismic studies [10]. A comprehensive overview of deposit models and exploration strategies was published by Simandl and Paradis [11].
The potential of 3D geological modeling is widely used in economic geology for resource estimations, to understand the processes of enrichment (e.g., [12,13,14,15]), and to provide more information on depth [16]. It is a powerful tool in structural geology for the visualization of complex fault systems, in particular if additional geophysical data are available (e.g., [17,18,19,20,21,22,23,24]). Concurrent modeling during the exploration stage of a deposit delivers essential information on the distribution of the elements within enrichment zones of the deposit, creates an impression of the 3D geometry of the system, and can direct further targeting. In geometallurgy, 3D models help to visualize and understand important constraints for further evaluation and sustainable mining.
The Nb-Ta-P-(LREE)-enriched carbonatite of Epembe in NW Namibia has been under exploration since 2011. Thus, a comprehensive dataset for modeling is available for this study. Previous studies included mapping at various scales [25,26], drilling operations, ground-based geophysics (both courtesy of Kunene Resources), and analysis of hyperspectral data [27]. For exploration purposes, the carbonatite dyke is artificially separated into 12 sectors (see Figure 1). The main focus of the exploration work is on Sectors B and K, due to economic concentrations of Nb and Ta from grab sampling. All available data were evaluated and served as the basis for the 3D modeling. During the modeling stage, in particular in comparison to field investigations (fieldwork in 2014 and 2016), mismatches to previous interpretations [26,28] became obvious.
Ongoing exploration and resource estimation require a comprehensive understanding of the geometry of the high-grade zones of different elements (Nb, Ta, REE, P) and their relationship to the fault system. Due to sufficient data coverage of Sectors B and K, those were selected for further investigation. This contribution describes the resulting model that visualizes the spatial link between the enrichment zones and the faults within the Epembe carbonatite complex. However, the close spatial relationship implies a re-evaluation of the processes for enrichments of Nb, Ta, P, and Total Rare Earth Element (TREE) + Y in small, isolated, lens-shaped, high-grade zones along the faults, i.e., due to hydrothermal (re-)mobilization.

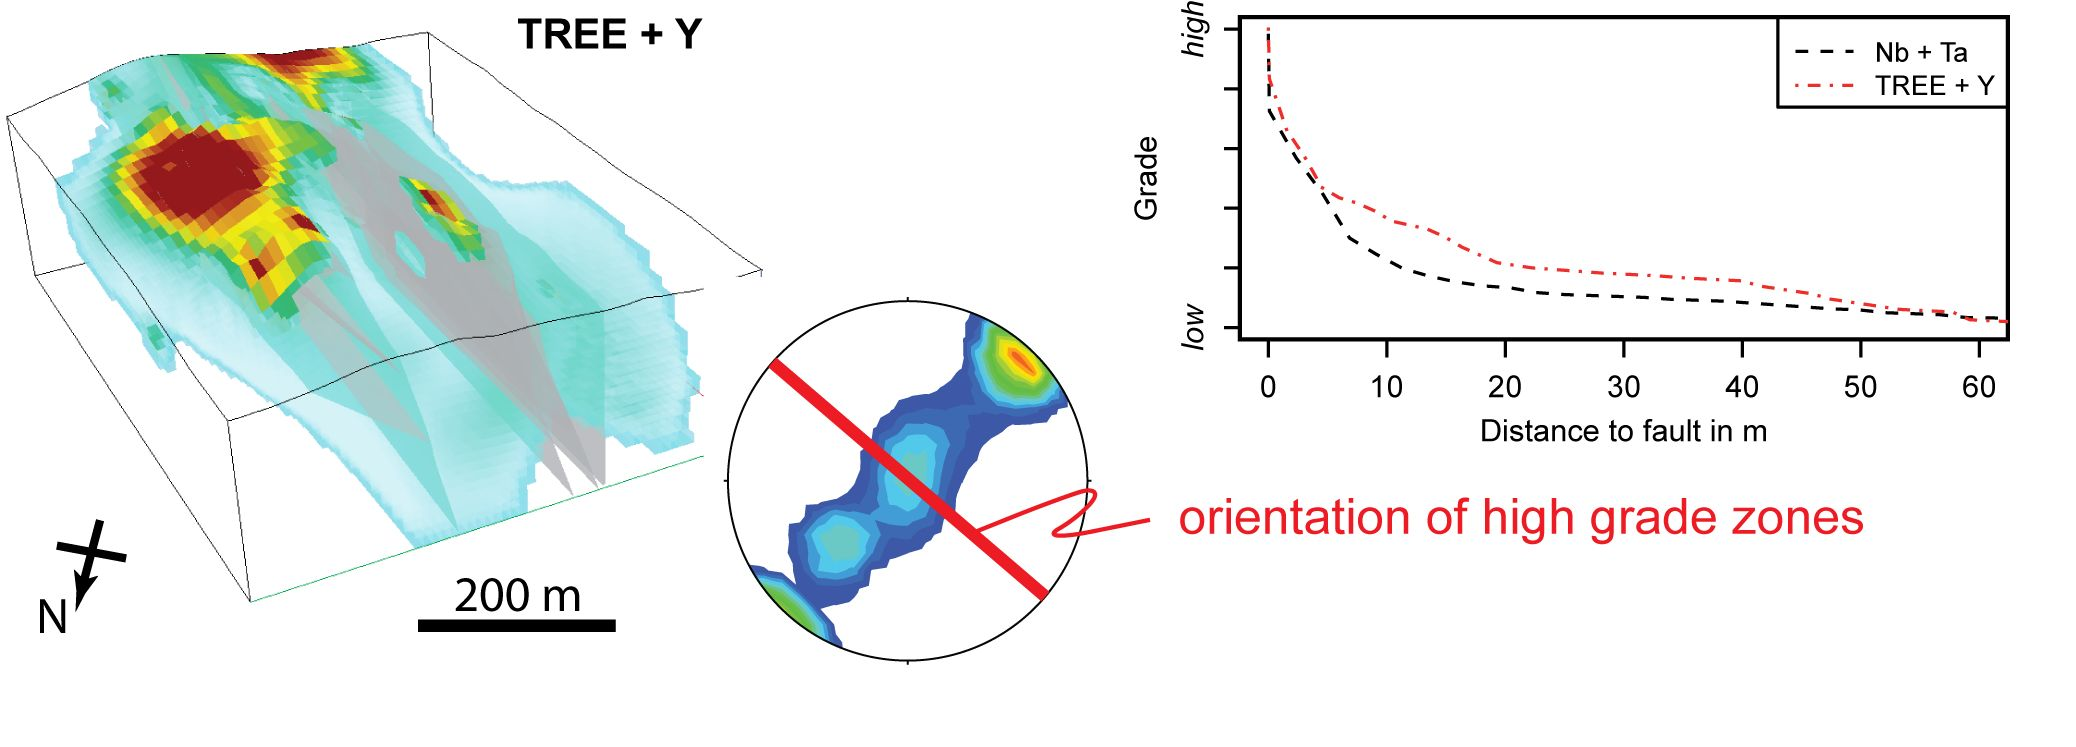
2. Geological Setting

In Namibia, four major provinces of carbonatites and alkaline rocks occur along NE-SW-trending linear features. Some authors correlate these orientations of transform faults in the South Atlantic to those of similar rocks in South America [6]. However, in the case of Northern Namibia, these structures superimpose older lineaments. Further, the intrusion ages are not related to the opening of the Atlantic [6]. Most of the NW-SE trending structures are reactivated during the rifting of the South Atlantic [29]. The Damaraland Province is the most northerly province, including the Mesoproterozoic alkaline and carbonatitic suites of Kakumangua, Swartbooisdrif, Epembe, and Agate Mountains [6].
The Epembe Nb-Ta-P-(LREE) deposit forms a 7 km-long and 400 m-wide carbonatite-syenite dyke, which intruded at the southern boundary of the Kunene Intrusive Complex (KIC) in NW-Namibia (Figure 1). The dyke is surrounded by magmatic and metamorphic rocks of the Mesoproterozoic Epupa Complex [30,31] that form the host-rock of the KIC, as well. The KIC is a large, 1.36–1.12-Ga-old, intrusive gabbro-anorthosite suite at the southeastern margin of the Congo craton [31]. During prolonged magmatism at 1215 Ma [30], a nearly complete series of mafic to alkaline/carbonatitic rock is emplaced. The syenite-carbonatite suite may represent crustal residuals formed in response to the gabbro-anorthosite suite at depth [31]. The syenites pre-date the carbonatite intrusion as evidenced by fragments of syenites in the carbonatite and fenitization of (some of) the syenite bodies.
The carbonatite intrusion follows a regional scale dextral shear zone, which strikes NW-SE and dips sub-vertically (75–80 ) towards SW [32].The internal structure of the dyke consists of lenses and sub-parallel zones of different carbonatite types, originated either from a succession of magmatic pulses [32] or a late-/post-magmatic hydrothermal overprint. An asymmetric fenitization aureole formed in the surrounding gneisses, being more extensive towards the southeast. This could be induced by the splay-fault running south of the dyke, and thus, relates to a higher permeability in this region.
Modal mineralogy of the carbonatite is composed of a coarse calcite matrix (mainly calcite, minor dolomite, and ankerite) with K-feldspar remnants, aegirine, apatite, and pyrochlore as the main accessory minerals [26,32]. The dyke hosts several high-grade zones with levels of Ta 2 O 5 up to 150 ppm and Nb 2 O 5 up to 1290 ppm in Sector B [26], which correlate with high U and K count rates of radiometric measurements. The REEs are mainly enriched in apatite and other REE phosphates, and Nb and Ta are mainly hosted by pyrochlore [26]. Apatite grains from the fault zones are often rounded and commonly rimmed by later monazite [27].
Bull [26] proposed a solely magmatic origin of the Nb-Ta-P-LREE mineralization with distinct magmatic pulses (five carbonatite, three syenite pulses). However, they were unable to decipher a chronological order from available data. Swinden [32] pointed out flow bands and enrichment along dilatational shear zones (mylonites) within the carbonatite. These flow bands, however, should be seen as of tectonic origin. This, together with distinct enrichment zones delineated by hyperspectral remote sensing analysis [27], suggests a much higher degree of hydrothermal redistribution than previously described.
Several, sub-vertical, south-dipping fault zones run parallel to the dyke. Fault zones are characterized by flow-bands, mylonitization, and if re-activated, brecciation. However, as calcite experiences plastic deformationat temperatures above 150 C, most of the deformation is non-brittle. A northern and a southern fault zone can be distinguished in both Sectors B and K.

3. Input Data for 3D Modeling
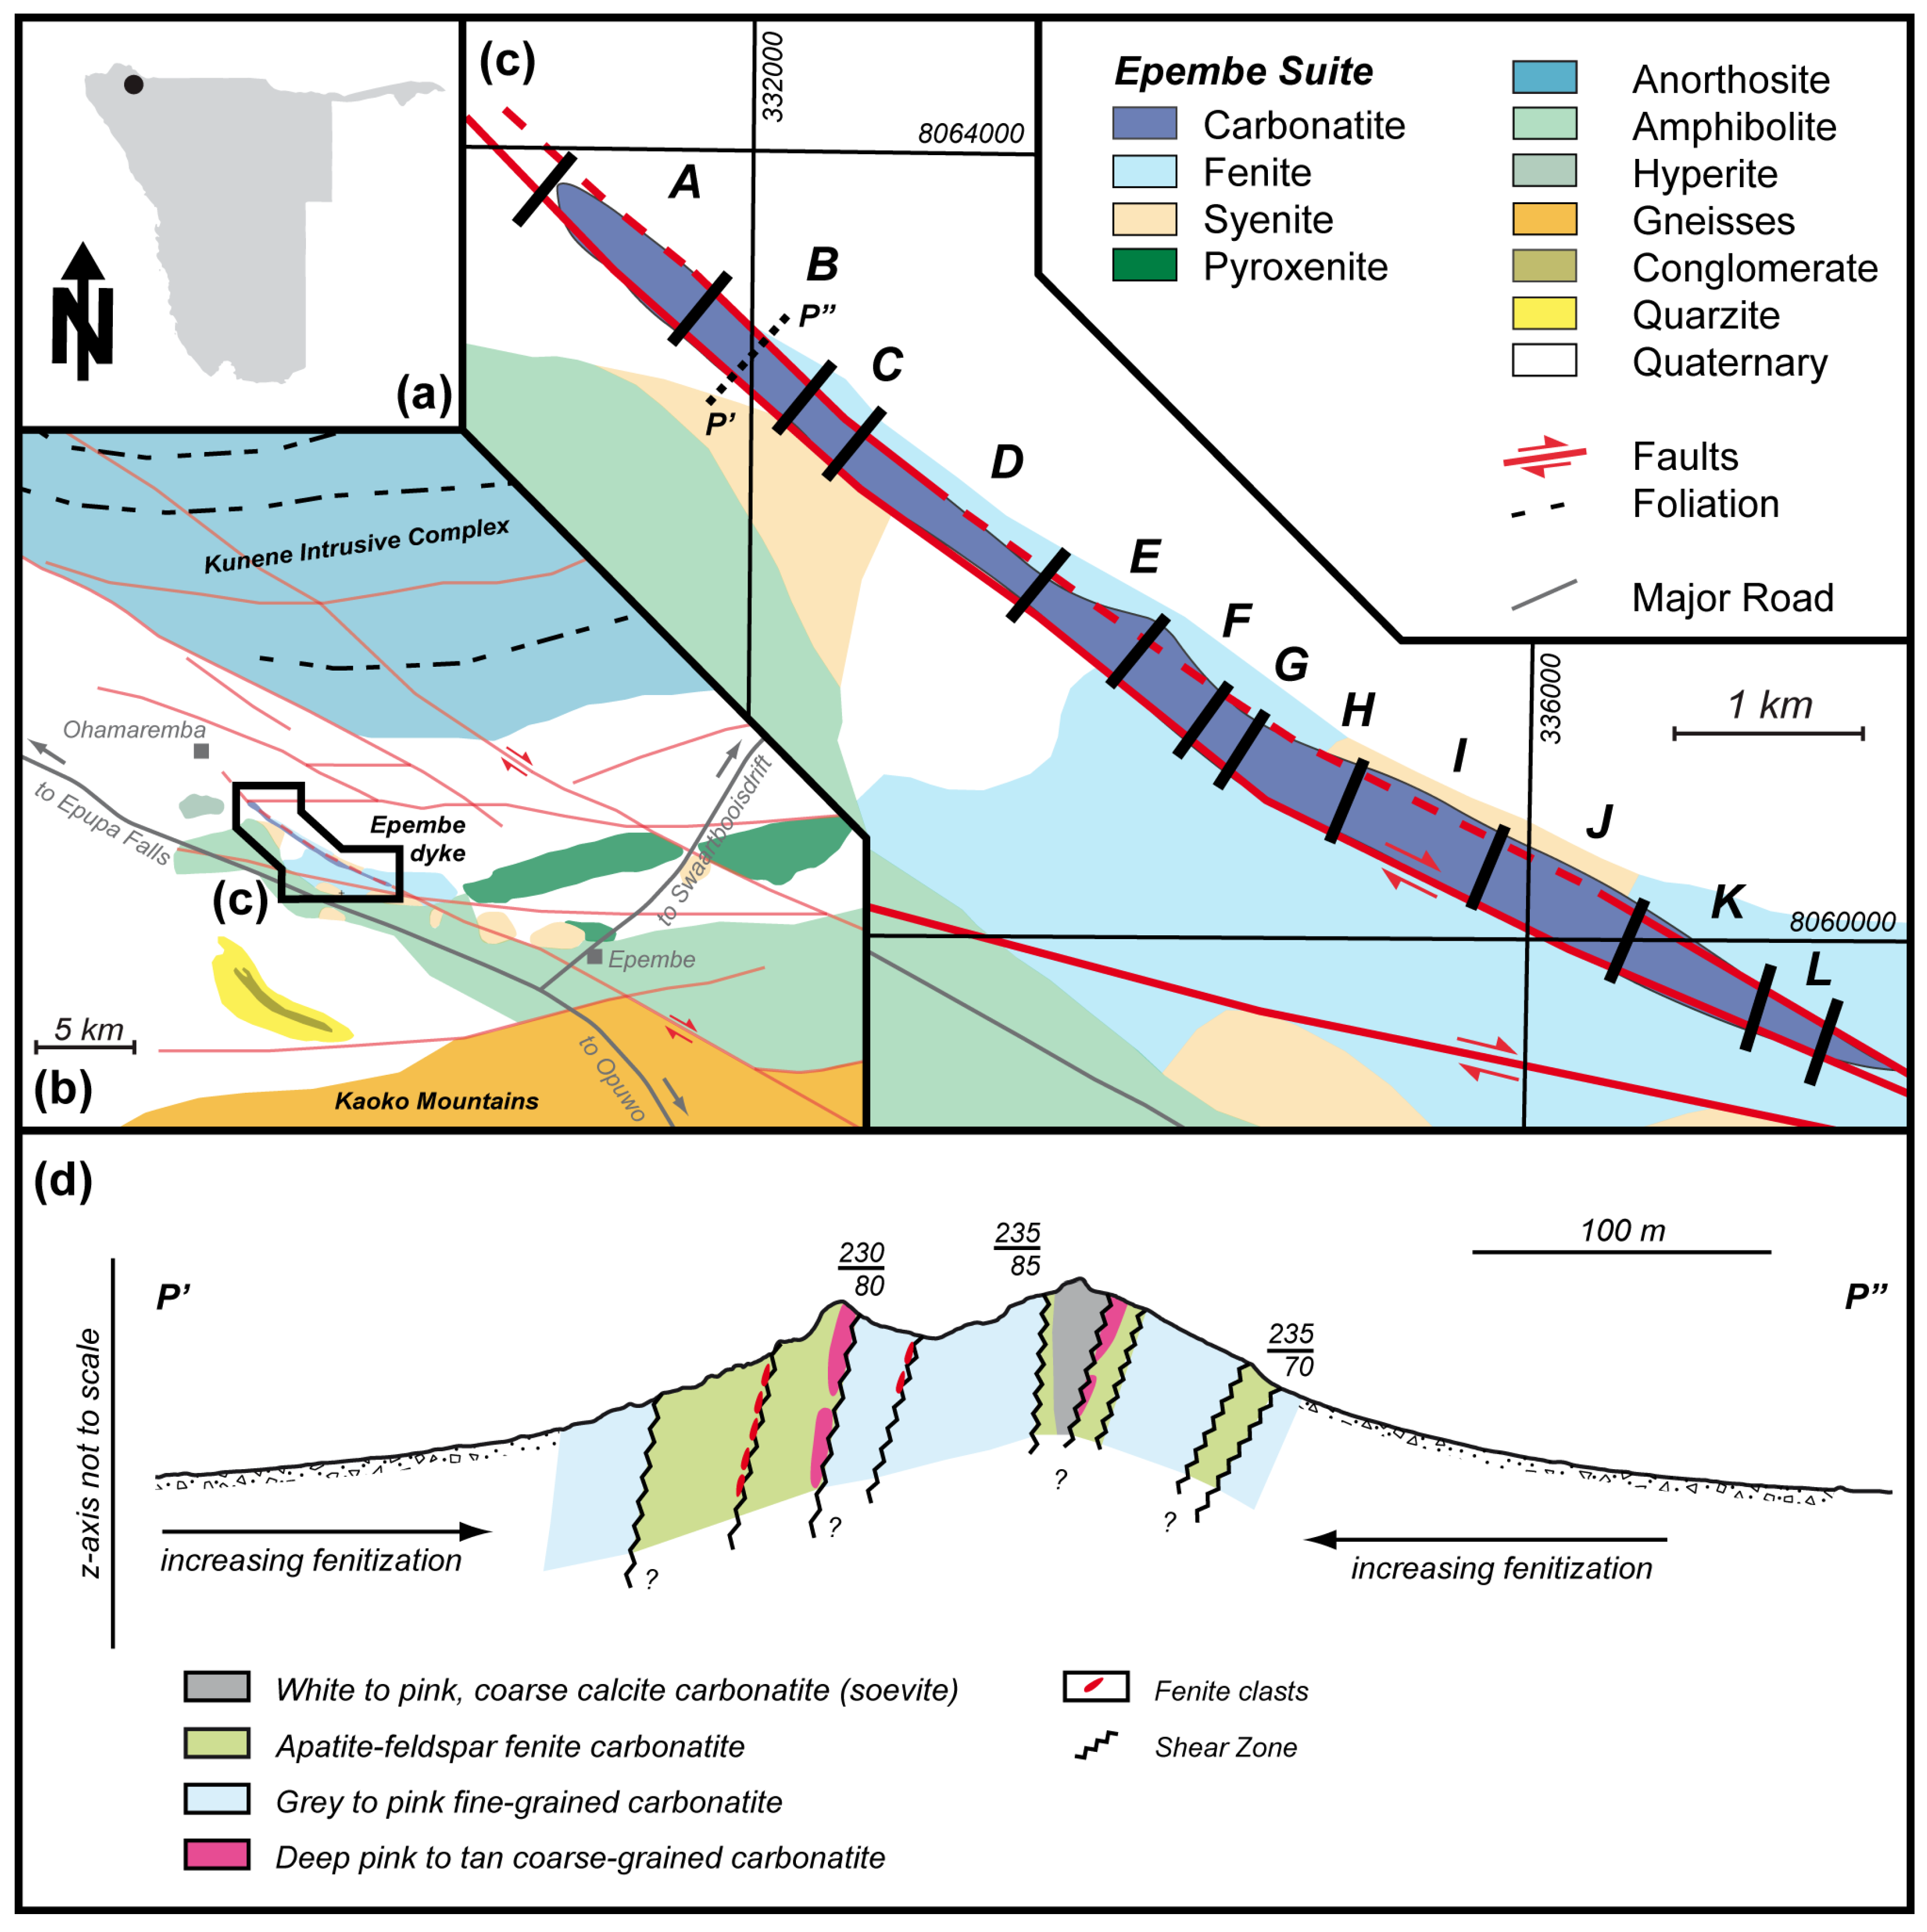
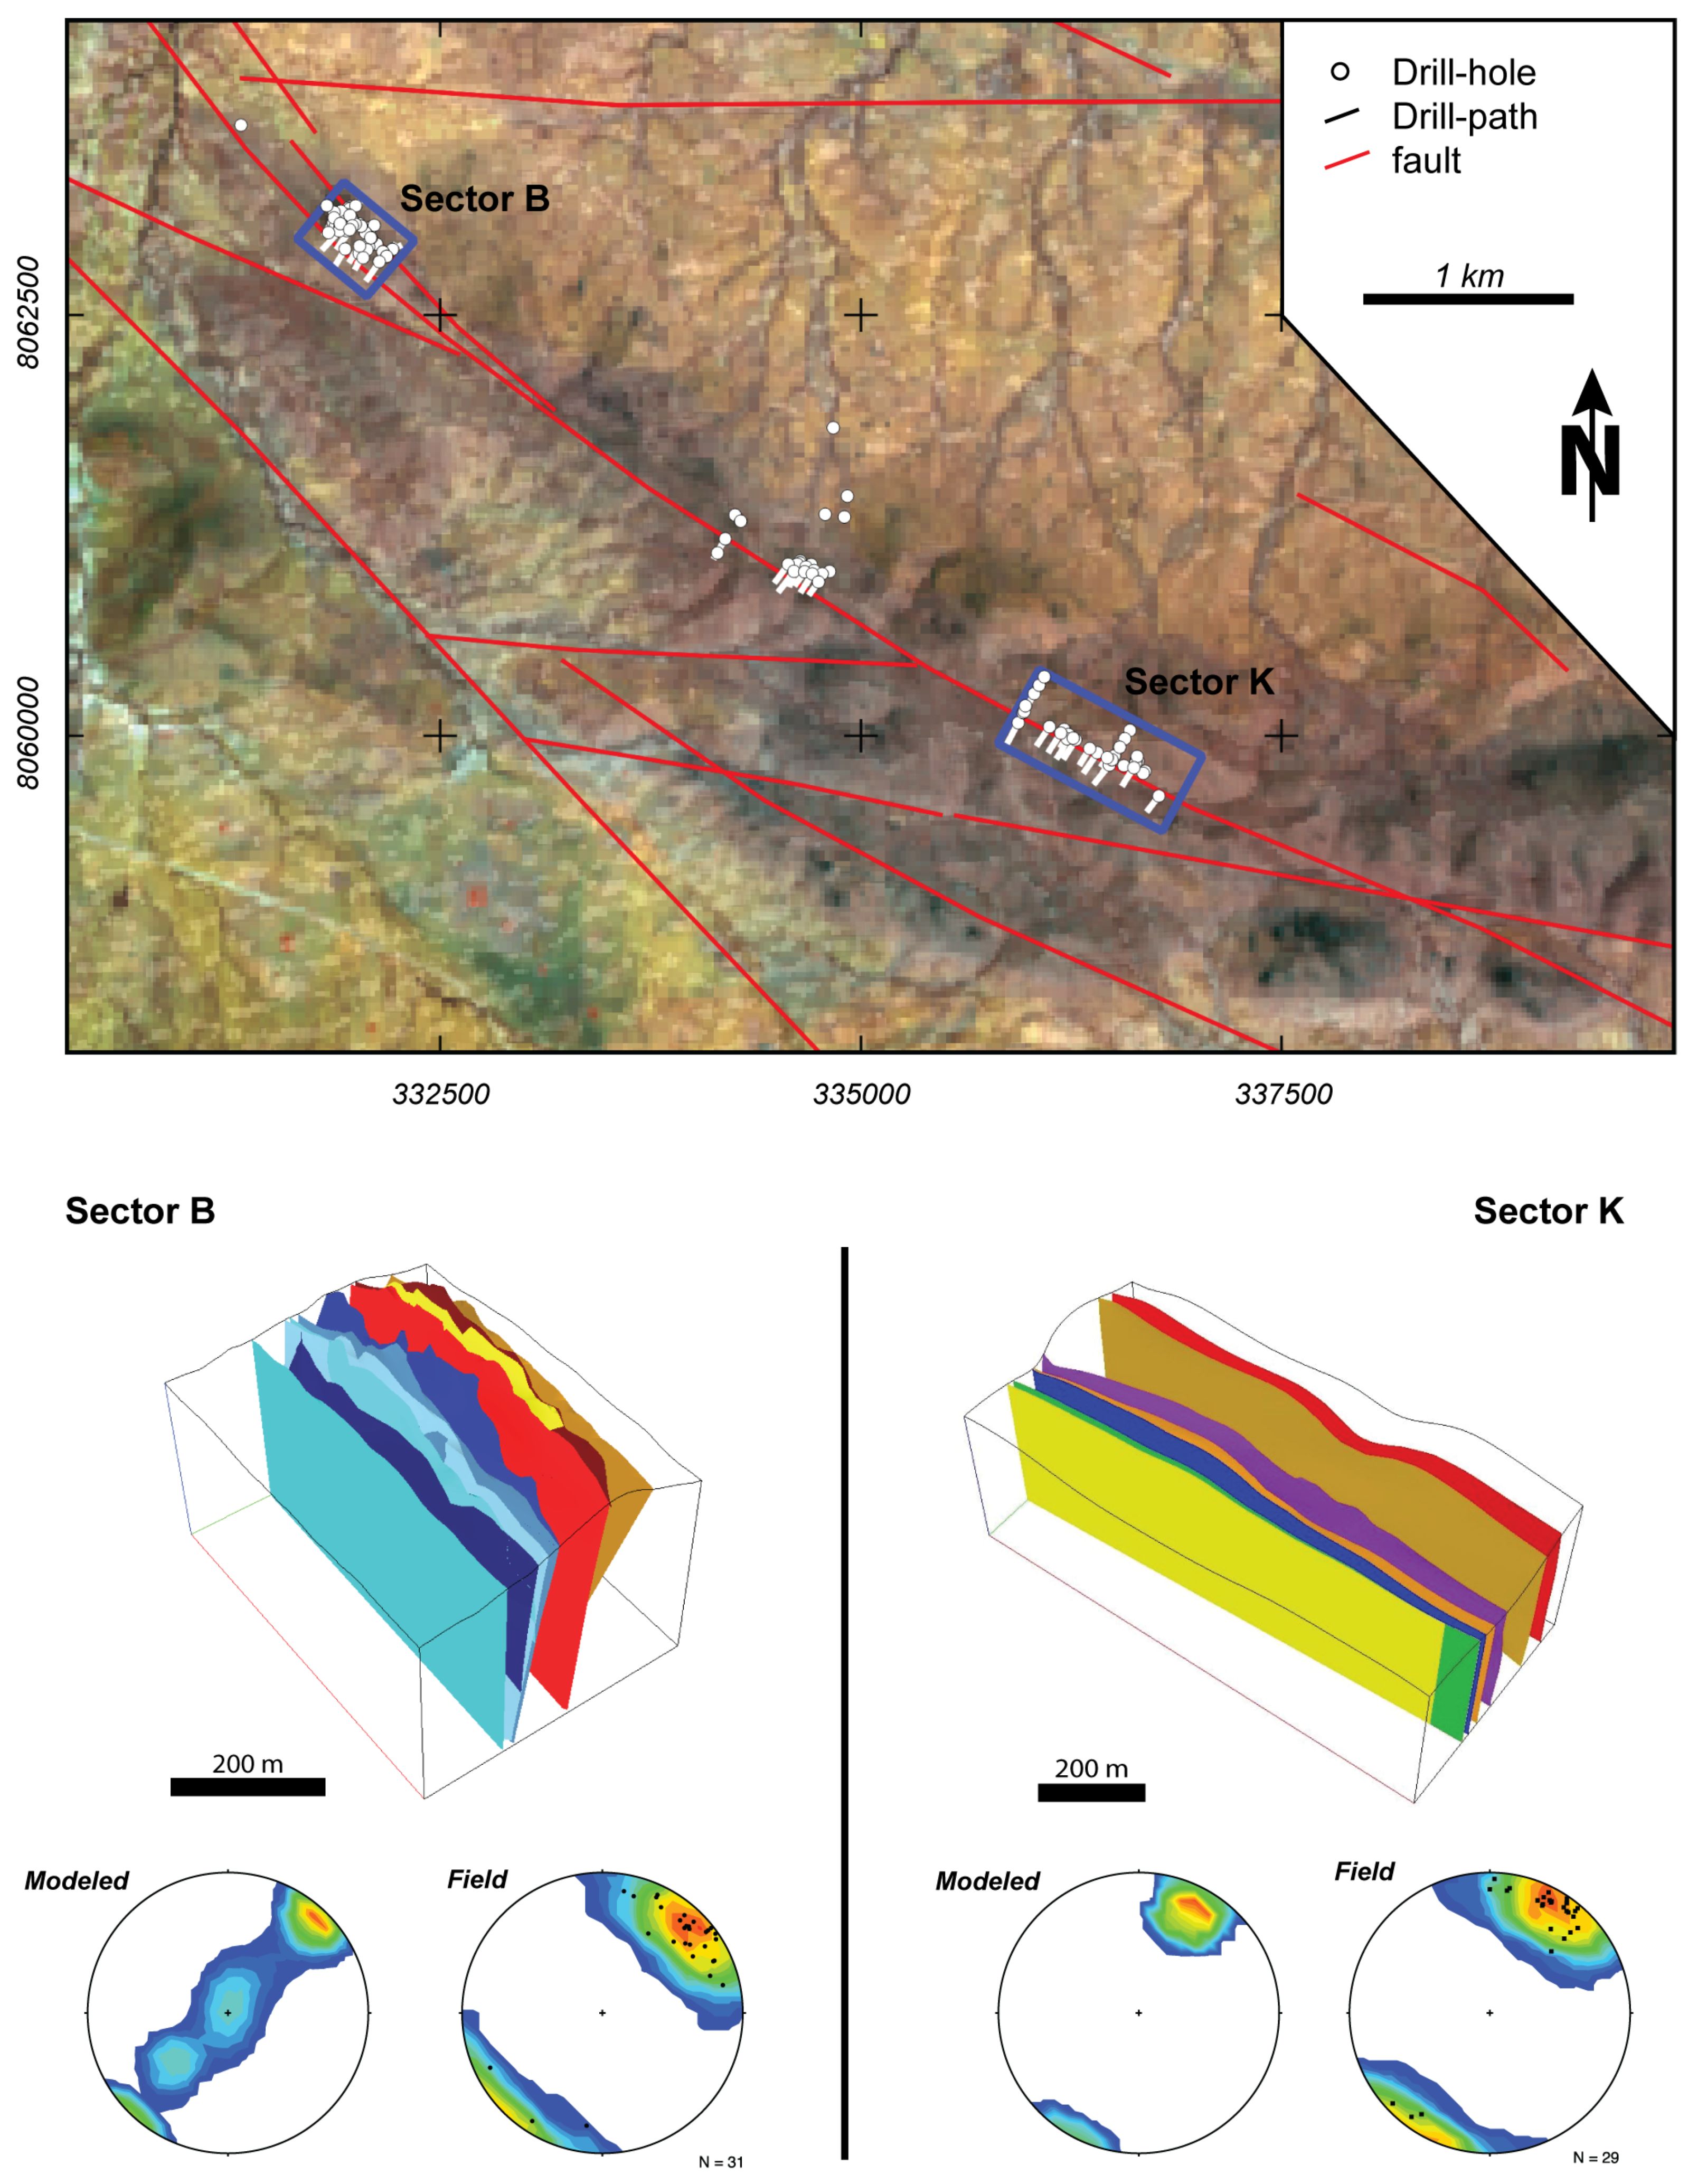
A geological database following the proposed workflows of Zanchi et al. [20] and Martin-Izard et al. [15] was created with the available datasets. The general modeling workflow is outlined in Figure 2. Relevant data are stored in the following layers:
  • Surface topography:
    The surface topography was modeled based on one-arc-second SRTM data (Shuttle Radar Topography Mission with 30-m spatial resolution [33]). In addition, available elevation information (e.g., Sector B) was densified using well locations, points of surface sampling, and GPS tracks from our own observation. All information was merged to a point (XYZ) layer and imported into the 3D modeling software.
  • Geological maps and cross-sections:
    Previous investigations of Bull [26] and Swinden [32] resulted in geological maps and cross-sections at scales of 1:10,000–1:15,000 for selected areas (Sectors B and K). The maps were digitized, and information on surface lithology, fault indicators, and structural constraints was extracted. The respective cross-sections were referenced and digitized in the modeling software. Information on the surface expression of the fault system in the area of investigation was compiled from satellite data [27]. Fault information was stored as 2D polylines and later draped on surface topography in the 3D models.
  • Drill-hole database:
    Drill-hole assay data were first re-logged and unified in terms of lithology by using the drillhole logging results. Similar rock types and transition zones were combined based on modal mineralogy, appearance, and color to match the description of surface rock types from Swinden [32]. Markers and descriptions with indications of shearing (mylonites, breccias, rock loss, flow bands) were marked for later fault modeling. The drill core data basis for the model was 117 variably-inclined reverse circulation (RC) and a few diamond-drilled boreholes with a sampling interval of 1 m. In total, a length of 7400 m, including 2900 m of diamond cores, was drilled until 2014 [28]. The boreholes were drilled at shallow angles, perpendicular to the average strike direction of the lithology. Most of them were located in Sectors B and K (Figure 3). The average depth of the drillholes was 150 m, which also corresponds to the model depth. Bulk geochemical analysis of all core sections of both host rock and carbonatite was conducted by WD-XRF and ICP-MS. Geochemical data were retrieved from percussion sample chips and averaged over one-meter intervals. Several files were created and imported to SKUA-GoCad including: (1) drill paths, (2) fault markers, and (3) geochemical data.

4. 3D and Property Modeling Methodology

4.1. SKUA-GoCad and the DSI Algorithm

Rule-based implicit modeling (see [34]) with SKUA-GoCad allows the user to model different complex geologic objects (e.g., layers, faults, intrusions) based on different classes of objects (e.g., point sets, lines, surfaces, voxels, Stratigraphic Grids (SGrids)). Homogenous or heterogeneous data like well-based information (e.g., geology, logs of properties) or grid-based 2D and 3D information (geological cross-sections and geochemical data) were imported as point sets. Geological boundaries and linear features were imported as line strings. The fundamental basis of the GoCad application was the Discrete Smooth Interpolation method (or DSI; e.g., [12,35,36]) and the Direct Triangulation (DT; [37]). DT generates rough surfaces by using triangles for the combination of the data and is mostly used with an extremely high data density. Therefore, and due to the heterogeneous and moderate amount of data, the DSI algorithm within SKUA-GoCad was used. The DSI algorithm enables modeling of a complex geological dataset by reducing the global problem (e.g., fitting a surface to a cluster of scattered control points) to a discrete number of smaller linear problems [12]. This method optimizes the use of heterogeneous data as constraints for the interpolation and enables data-weighting under different aspects. DSI is widely used for 3D surface modeling and describing 3D objects in the literature [19,22,38], because the algorithm minimizes the roughness (creates smooth surfaces), weights the data (from essential to insignificant), and uses constraints (hard vs. soft). Hard constraints restrict the degrees of freedom of surface nodes during interpolation, and soft constraints are honored in a least-squares sense by DSI [19]. DSI as an interpolation algorithm has further the advantage of considering all three spatial vertices (x-, y-, z-direction) under a large set of constraints [19,36]. Moreover, DSI is able to incorporate interpretive data to better constrain interpolation results [19].

4.2. Modeling Approach

A surface-based modeling approach, instead of a block, framework, or image-based modeling, was used to resolve the complexity of the fault network intersecting the carbonatite dyke. Surface topography was modeled from SRTM data, well locations, and surface sampling points. The generated surface was smoothed and fitted to the available data points, which were imposed as control point constraints. Border constraints were implemented to straighten and smooth the outline of the fault surfaces.
The overall orientation of the fault system was compiled using the maps of Maier et al. [31] and the visual interpretation of satellite data. The fault zones within the carbonatite and adjacent units were delineated based on geological mapping ([26,32] and own field observations) and well markers (sheared units). Resulting linear (shear zones/faults) and point data (measurements, well markers) were merged to 3D surfaces with the following assumptions:
  • Faults are sub-parallel to the tectonic foliation (Sector B mean dip direction/dip: 226/75 ; Sector K mean dip direction/dip: 210/80 according to field data) and planes dipping sub-vertically (80 to S).
  • The fault system is converging into a common detachment at the sub-surface.
Surfaces were interpolated using the DSI algorithm. Enclosing voxets were used as boundary constraints. Surface exposures of faults were set as hard constraints, while fault markers from drillhole data and interpretations from cross-sections were soft constraints. Overlapping fault surfaces were cut at the intersection, and the remaining parts were removed.
Stratigraphic Grids (SGrids) were generated with a determined amount of points parallel to the axes. SGrids are flexible 3D grids, which model a reservoir volume between two horizons. The size of the voxels was in the range of the average sampling distance of the drillhole and surface data to fit the conditions of the cardinal theorem of interpolation. The geometry of a single voxel was set to have a cuboid-like geometry. Having the shortest axis perpendicular to the strike of the dyke, voxels had dimensions of approximately ( n x n y n z ) = (5,15,15) m. This allowed us to better resolve the variation in this direction, as well as the relation to the fault system. Due to insufficient data coverage in other parts, SGrids were generated for Sectors B and K only. Voxets were the basis of the generated SGrids, which had nearly the same size for both Sectors. However, the number of voxels was further limited to display capabilities. Six major properties, representing elements or groups of elements (LREE/HREE, Nb, Ta, TREE + Y, U + Th, P), were imported in GoCad as a well-object format. After conversion to point sets, the properties can be interpolated using DSI or other interpolation algorithms. Dummy drillholes with values equal to the minimum values of the data were placed in the corners of each subarea to prevent side effects during later interpolation.

5. Results

5.1. Fault System

The results of fault modeling are shown in Figure 3. The fault density of Sector B was almost equal to that in Sector K. Field observations indicate a similar fault structure in Sector B as in Sector K, while in the latest, the modeled faults seemed to cross-cut each other. Intense shearing was mainly associated with zones of high strain close to lithological contacts within the carbonatite and between carbonatite and fenite.
Sector B represents an NW-SE-orientated, sub-vertical fault system modeled by ten separate faults. The modeled length in the strike was limited to the extent of Sector B. A northern and a southern fault system can be distinguished, which runs along two prominent ridges at the surface. Faults of each system are interpreted to merge at depth in a deep-seated crustal-scale shear zone, similar to a flower structure fault geometry. The fault system of Sector B is complex and has geometric characteristics of a small contractional strike-slip duplex in a transpressive setting. The modeled faults within this sector have an average dip direction/dip of 225/80 and correlate to field observations of 226/75 (Figure 3).
In Sector K, seven NW-SE orientated, sub-vertical faults were modeled. In this sector, a southern and a northern fault system can be distinguished. The data indicate that the faults of Sector K are steeper compared to Sector B, with an average dip direction/dip of 210/85 . The modeled faults were parallel to the dyke in accordance with the field observation of 210/80 in Sector K.

5.2. Lithological Analysis

The re-logged and unified lithological units of the Epembe area are listed in Table 1. Statistical analysis shows a distinct correlation between sheared lithological units and the occurrence of target elements (see Figure 4, first row). No sufficient data are available for the fenite (Unit (5)) and foliated, deformed grey ap-fsp-aeg (ap = apatite, fsp = feldspar, aeg = aegirine) carbonatite (Unit (10)). The host rocks (Unit (1)), syenites (Units (2) and (3)), and lamprophyres (Unit (4)) depicted a background concentration of the critical elements. In general, shear zone-related Units (6), (7), (8), and (9) showed elevated concentrations in Nb, Ta, TREE + Y, and P. Distinct flow bands at the fault zones in Unit (7) possess on average higher U + Th contents than non-sheared units. The sheared Unit (7) and the hydrothermally-overprinted fault zone Unit (8) further showed the highest enrichment in TREE + Y (Total Rare Earth Element + Yttrium). Interestingly, some primary enrichment in TREE + Y in the sövite Unit (11) can be obtained from the statistics. Low strain zones are favored sites for the enrichment of REE minerals [8].
The scatter diagram matrix (Figure 4) shows the correlation of tantalum, niobium, uranium + thorium, total rare earth elements + yttrium, and phosphorus. Ta and Nb show strong Spearman rank correlations ( R 2 = 0.92), indicating that most of those elements are associated with pyrochlore [26]. TREE + Y showed a good correlation with phosphorus ( R 2 = 0.73 ) as most of the rare earth elements (including Y) are associated with phosphates such as apatite or monazite [26]. U + Th showed a good correlation with all displayed elements due to a similar geochemical behavior. These correlations can be used as a proxy for the exploration of Nb-Ta-REE deposits [7], by the application of airborne or ground gamma-spectroscopy.

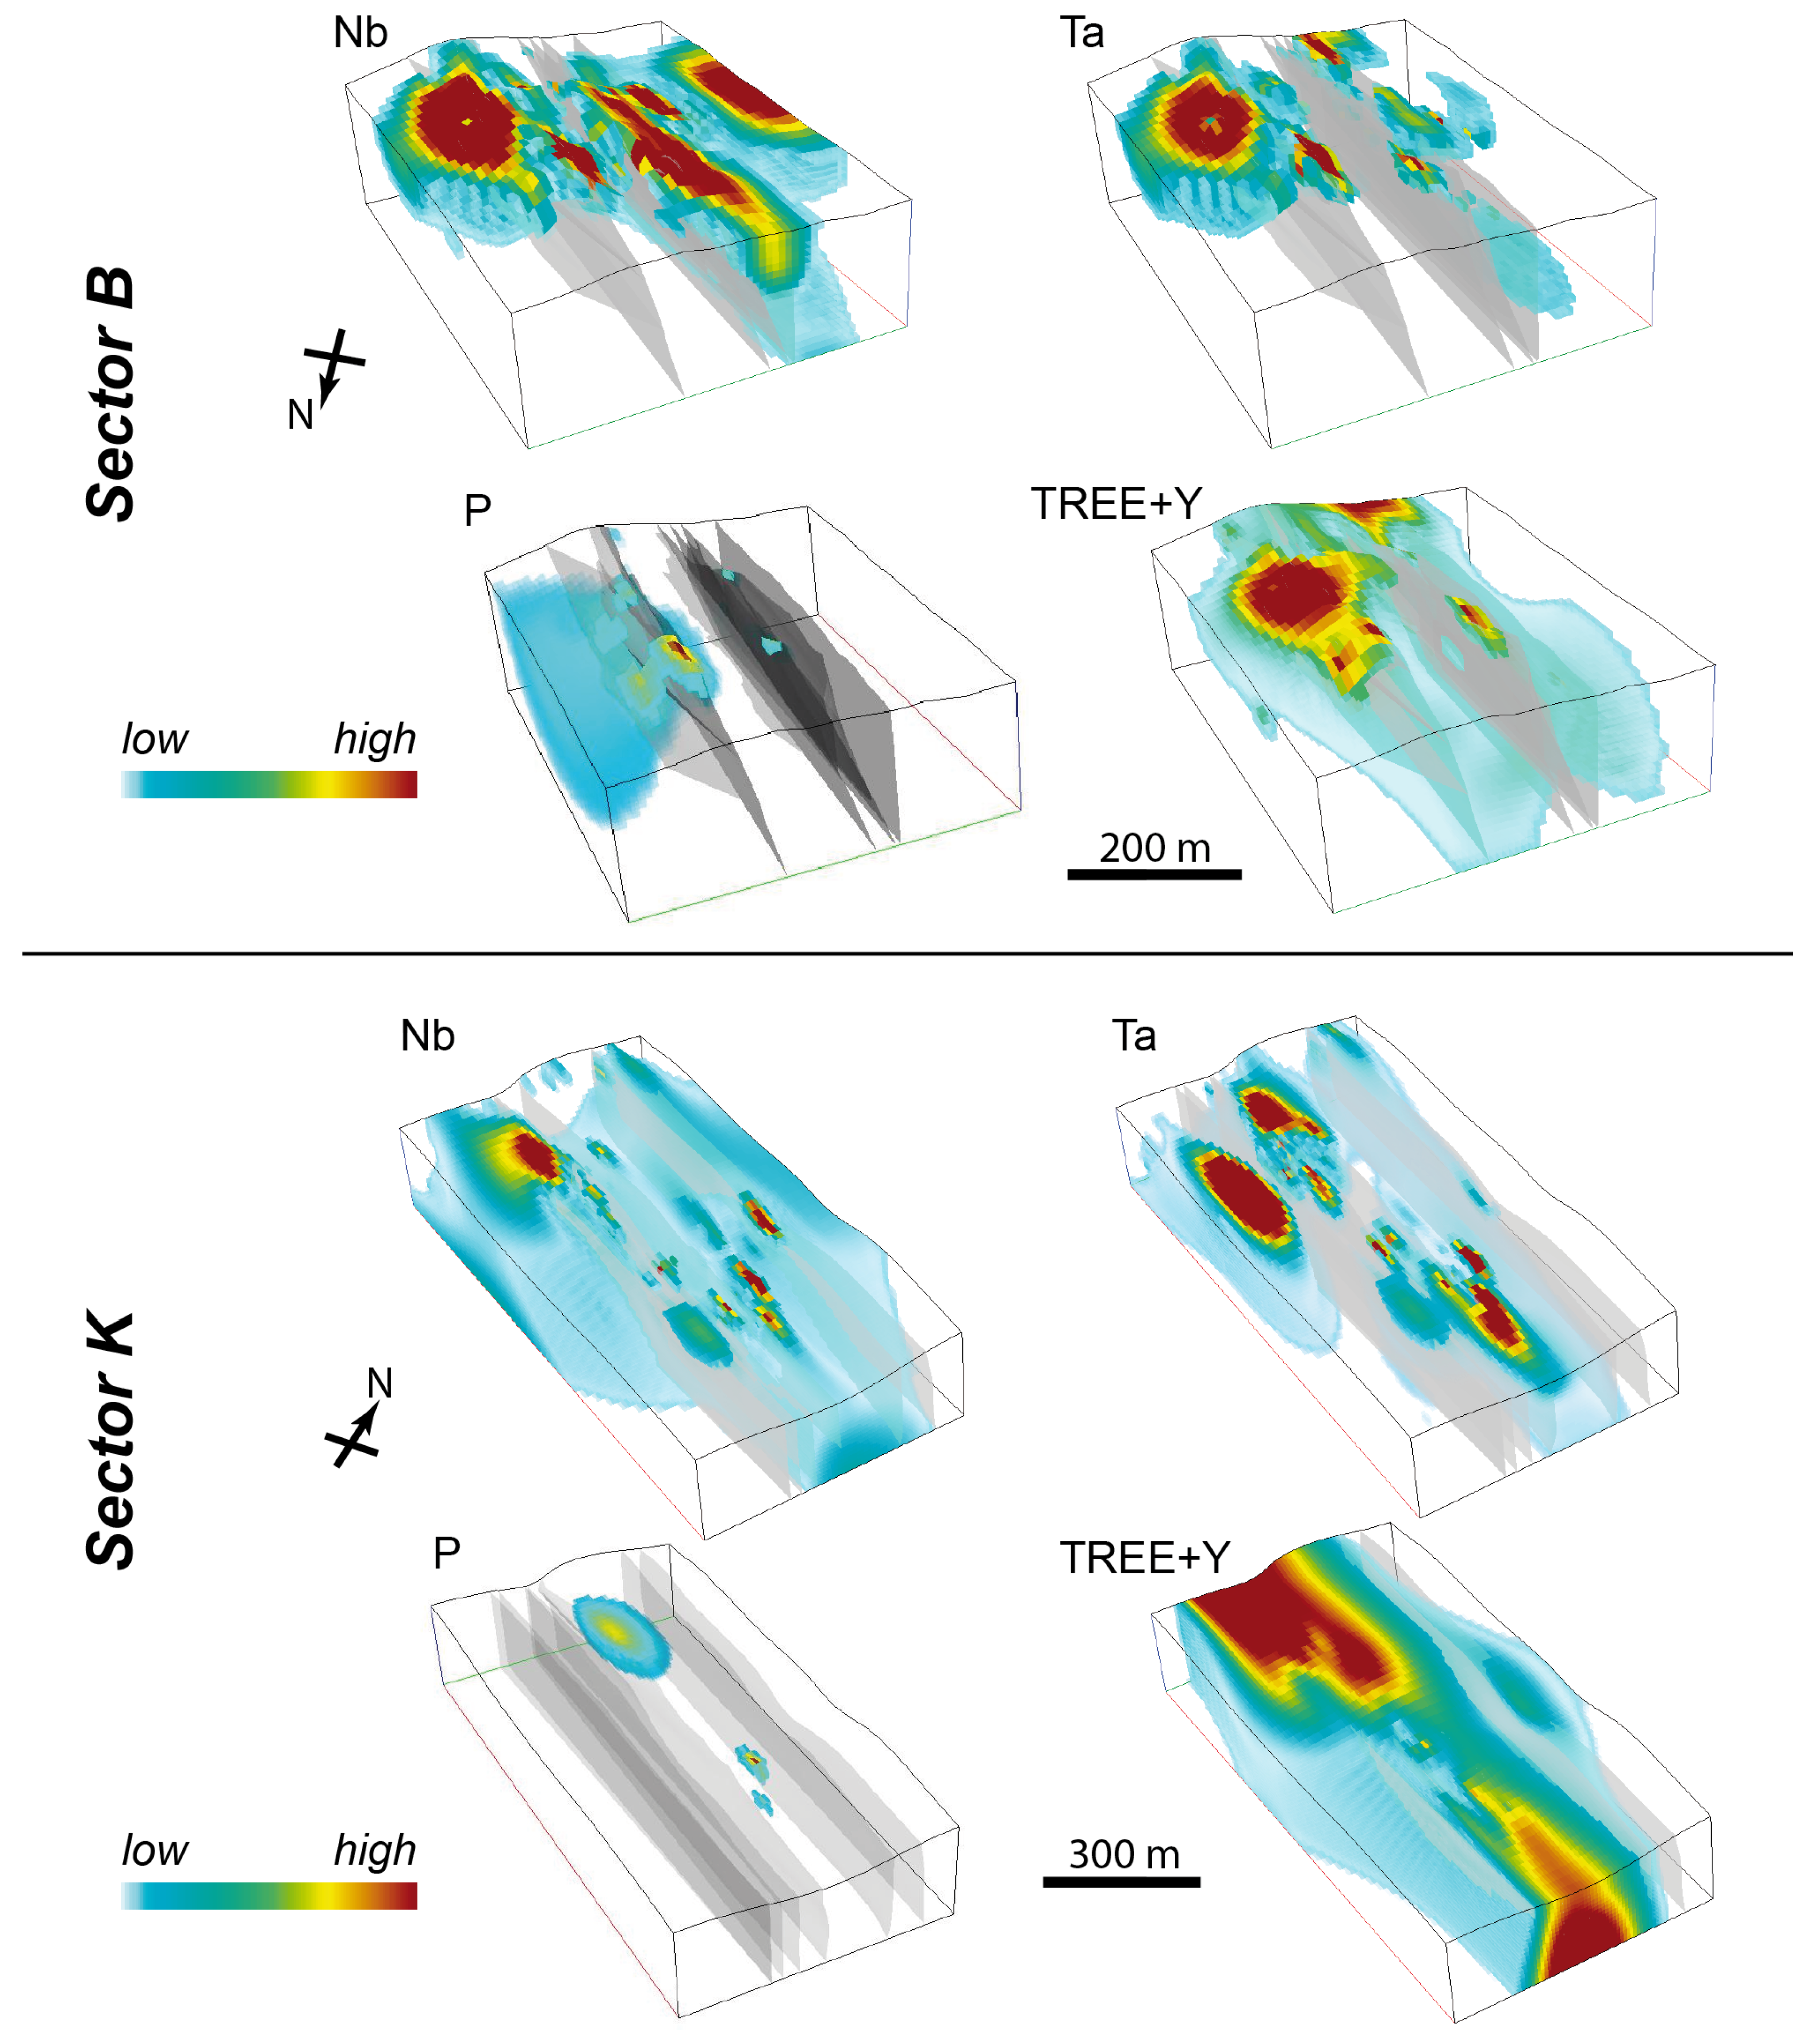
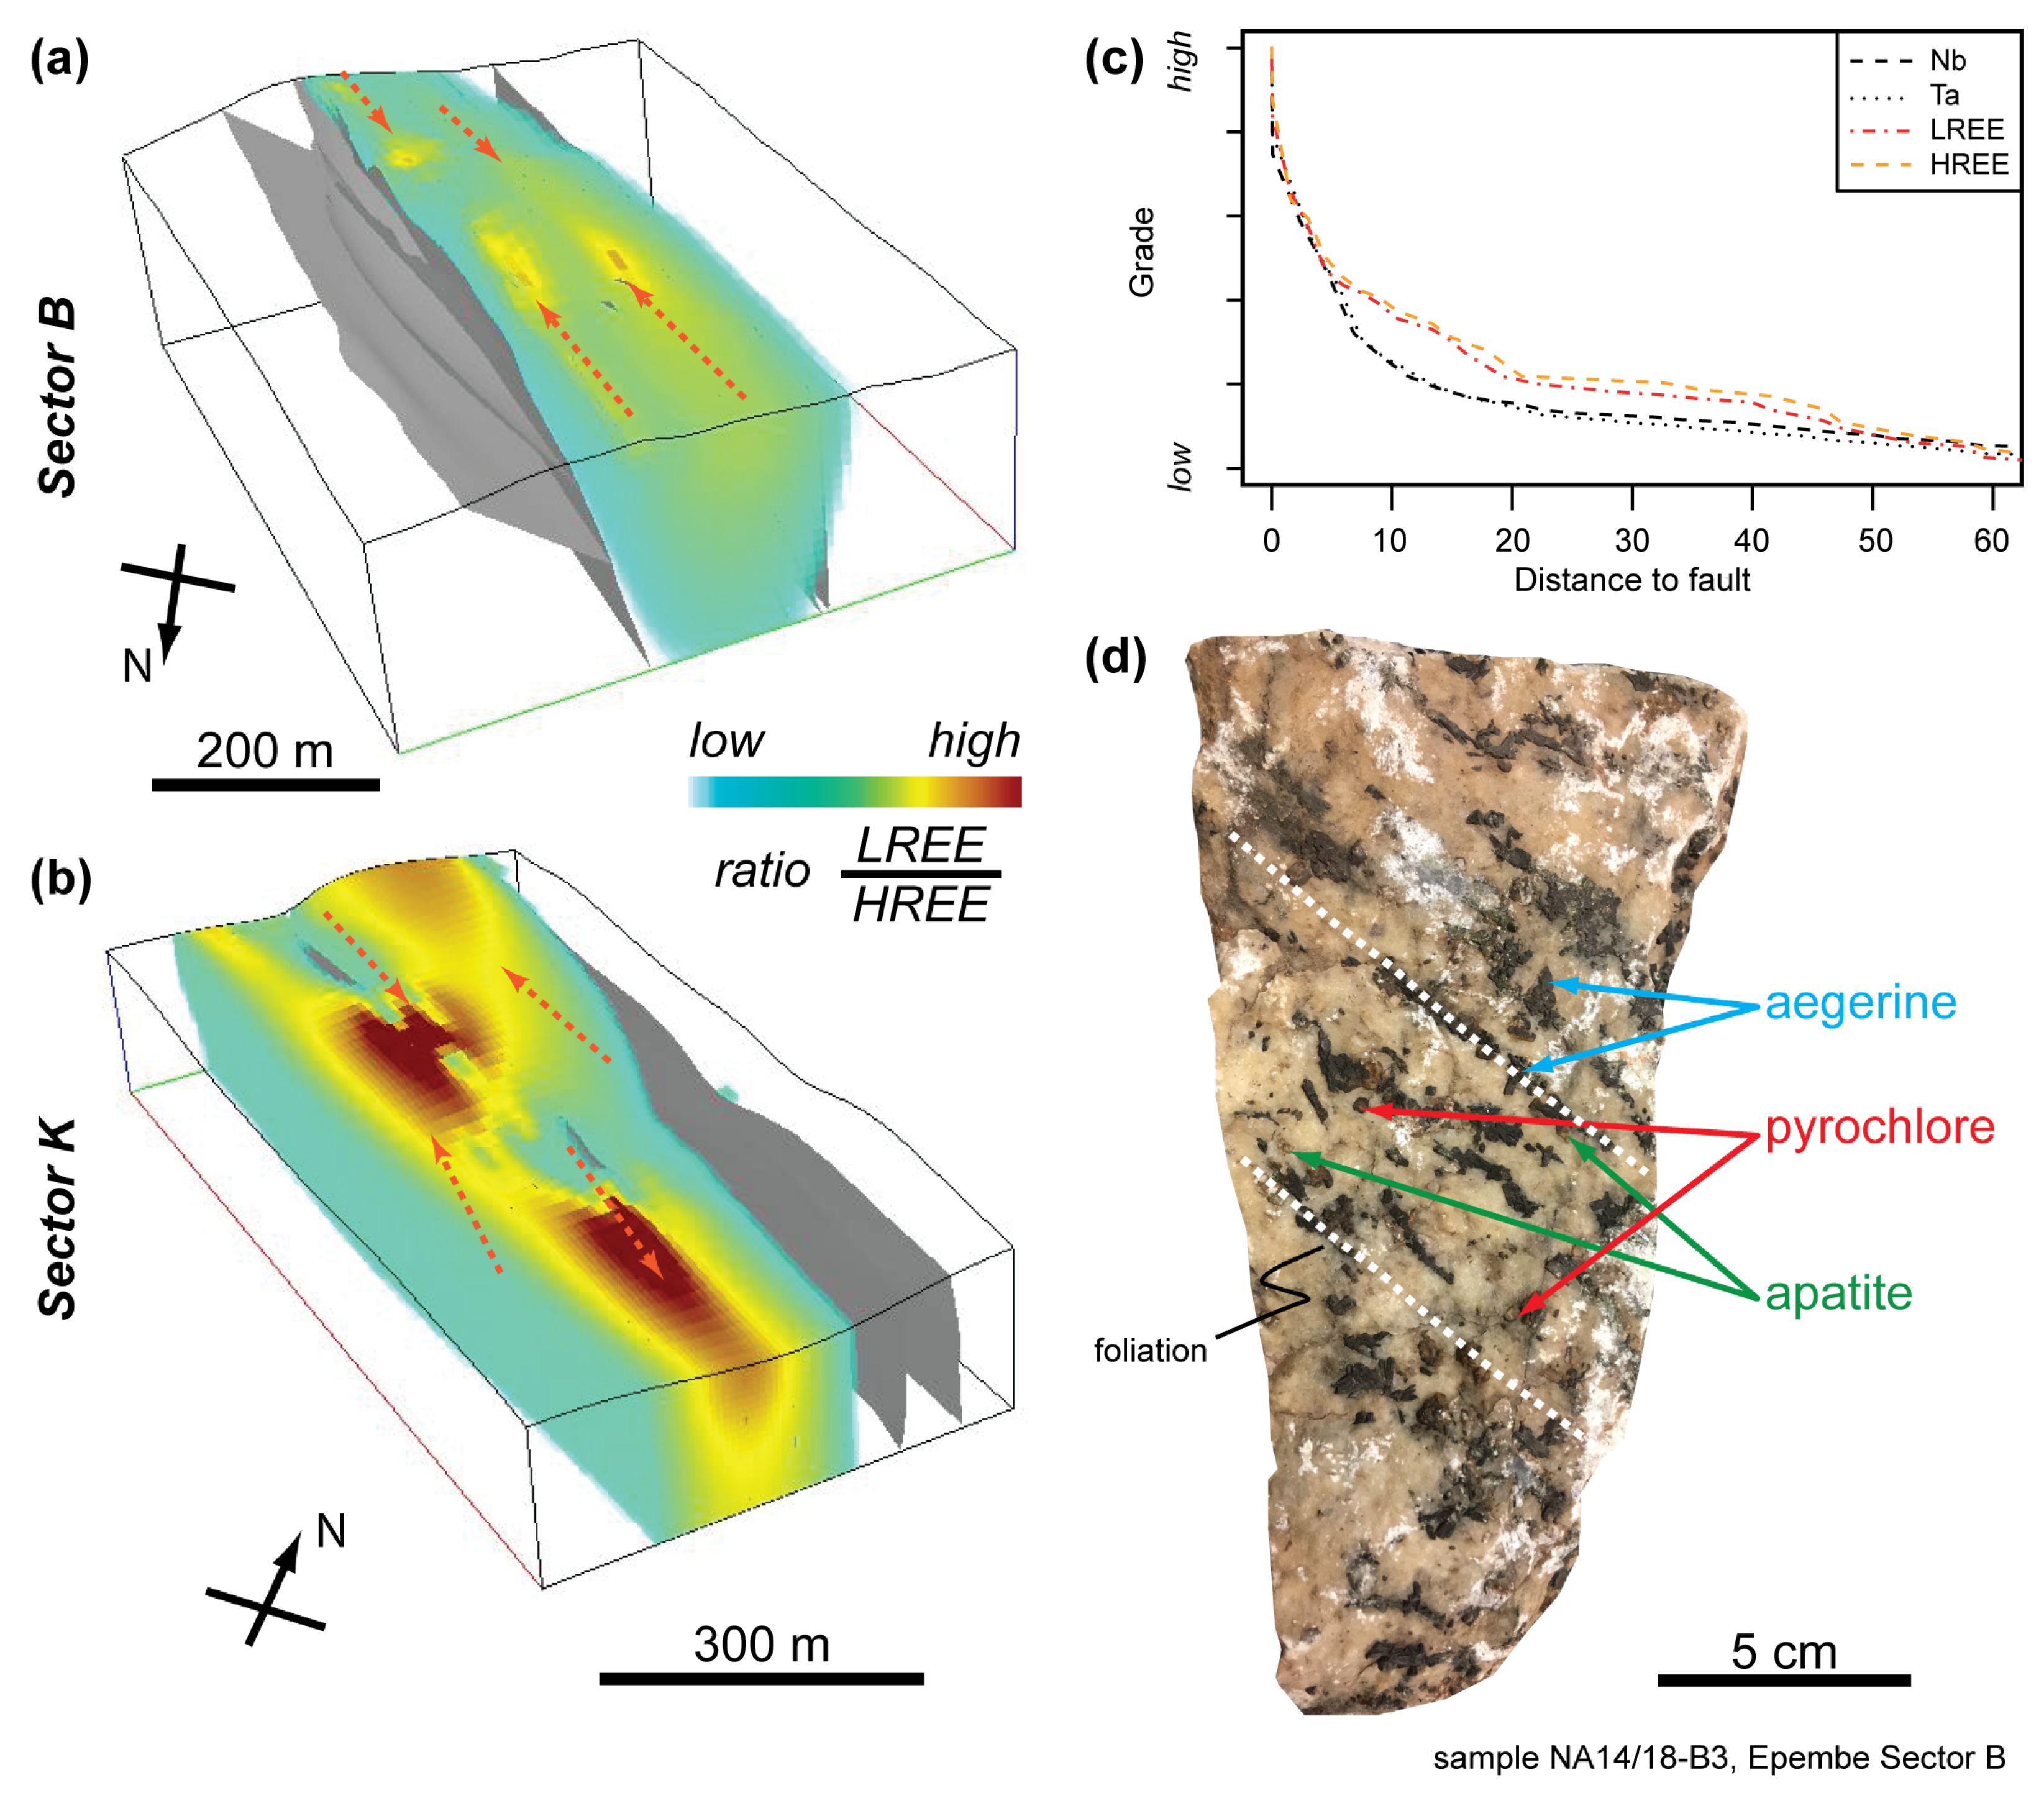
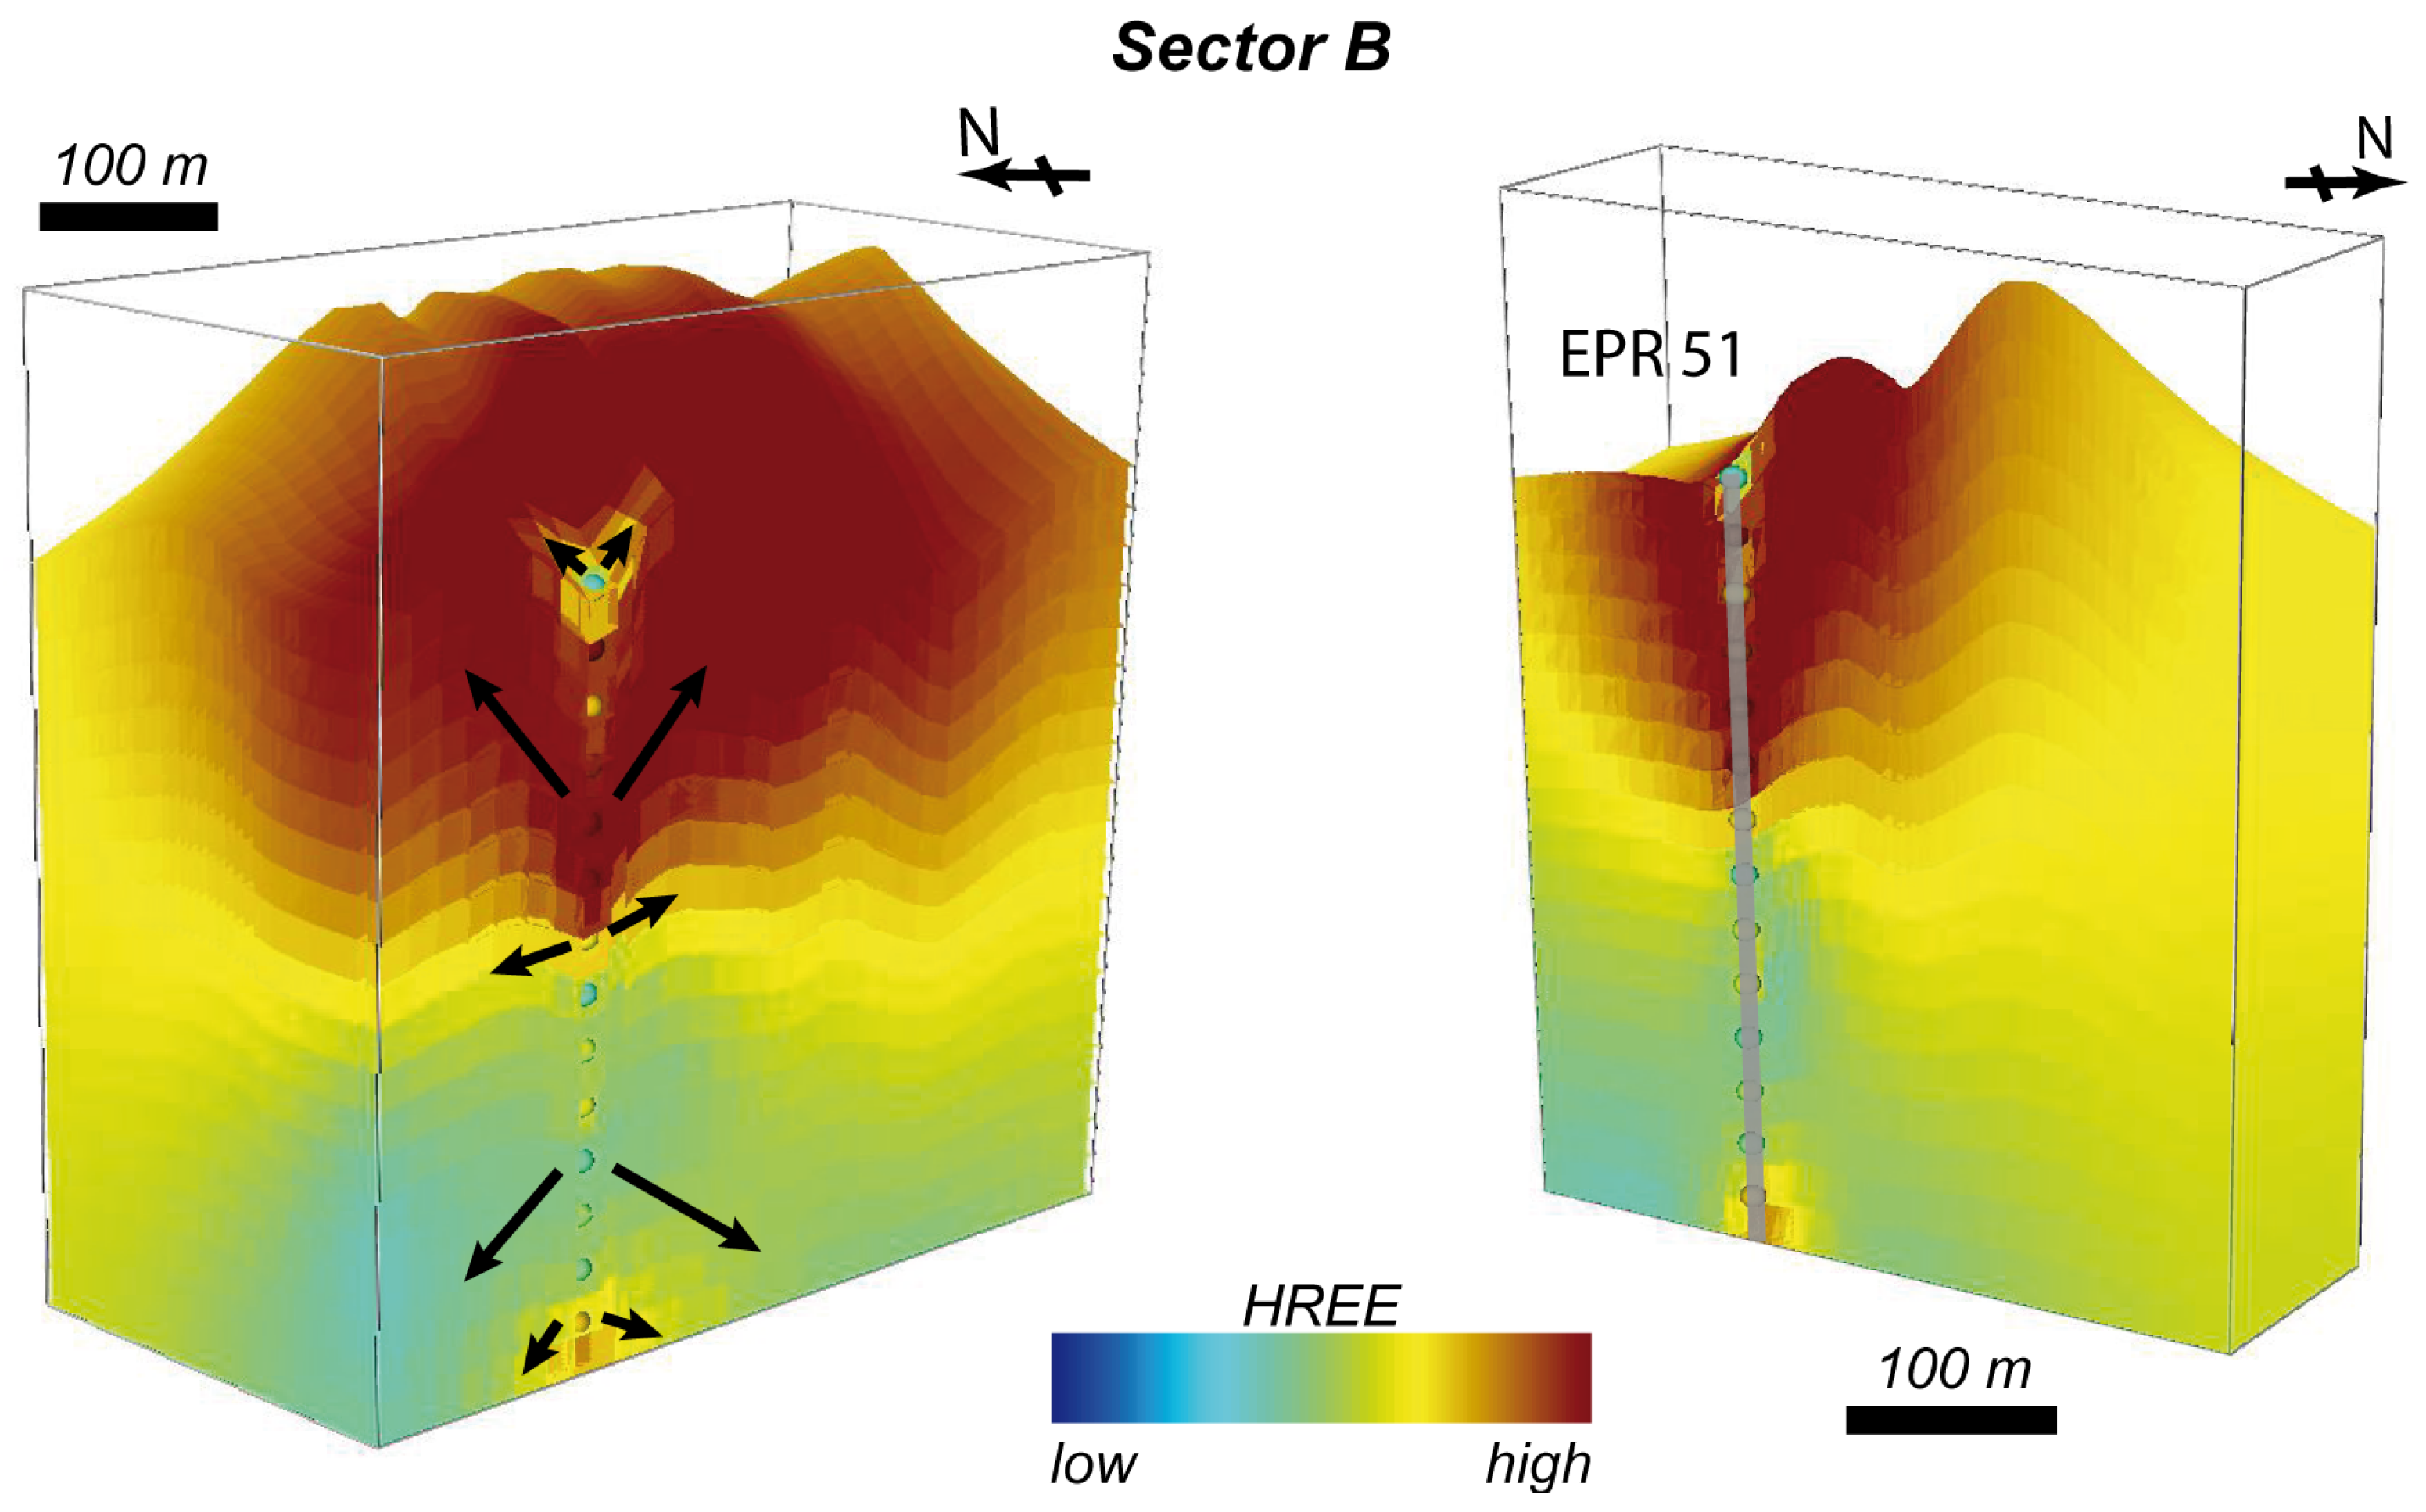
5.3. Enrichment Zones

As shown in the previous section, no direct correlation between enrichment and rock type could be established. This result is confirmed by the SGrid modeling: all enrichment zones create small lens-shaped bodies along the faults in zones of lower strain (Figure 5).
The modeled enrichment zones for Nb, Ta, P, and TREE + Y of Sector B (see the upper row in Figure 5 and Figure 6a) are associated with both the southern and northern fault system. In particular, TREE + Y seemed to be highly correlated with Nb and Ta. This could indicate that either (1) the REE are hosted by pyrochlore or (2) both Nb + Ta, as well as REE are enriched during the same process. Statistical evaluation of grade vs. distance to fault (Figure 6c) confirmed this observation of only local Nb-Ta-REE enrichment in the vicinity of the faults. The median for Sector B was 4.5 m, the 75% quantile 10-m distance to the faults. However, it further suggests that zones of enrichment for LREE and HREE are decoupled (see Figure 6). Further, another argument is the high percentage (76%) of lithological changes at shear zones. This indicates that the mineralization was not only the result of a mineral fractionation process, but also of a later to post-stage hydrothermal remobilization involving enriched volatile fluids (in particular F-, P-rich fluids; [8]) expelled from the carbonatite magma. Pervasive alteration aureoles (= fenites) are often associated with carbonatite complexes and sustain that model [39]. Overall, REE mineralization in Sector B seemed to be associated with pyrochlore, as it correlated well to elevated Nb and Ta content.
Sector K (Figure 5 lower part and Figure 6b) shows similar patterns to Sector B with a strong correlation of enrichment and faults. The grades were higher for TREE + Y and lower for Nb and Ta, and the enrichment zones were more decoupled. The spatial correlation between P and TREE + Y was more distinct and indicated that the REE were dominantly hosted by apatite. However, the overall data density was much lower compared to Sector B. Within Sector K, REE mineralization was associated with apatite mineralization.

6. Discussion

6.1. Methodological Aspects

The software SKUA-GoCad uses the DSI algorithm to interpolate the properties to the SGrid. This considers minimization of the roughness (or curvature) by setting constraints on the properties. Figure 7 visualizes the procedure of the discrete smooth interpolated properties of one borehole projected to the whole SGrid of Sector B. The arrows indicate the extrapolation trend of the properties. Artifacts occurred in undersampled areas for which little data are available. These artifacts were minimized by generating several dummy boreholes at the corners of the SGrid with values equal to the minimum values of the data. Kriging, which could prevent side effects, was not applicable here due to a decrease in variance around the faults and the non-stationarity of the data (compare Figure 8). Variograms plot the variation of the element contents (y-axis) as a function of the distance (x-axis) in the direction parallel to or vertical with respect to the faults. Variograms were calculated in three directions within SKUA-GoCad: (1) horizontal along the strike of the faults, (2) horizontal perpendicular to the faults, and (3) vertical to the Earth’s surface (see Figure 8). In cases (1) and (3), variograms showed an increase of variance with increasing distance. However, perpendicular to the dykes, variograms showed an oscillation. This means that the variance of the data is not increasing with distance, but regularly decreasing towards zero in the spacing of the faults. This strongly indicates a succession of enriched mineralization zones (named hole or periodic effect in geostatistics).
For the example of Nb (displayed in Figure 8), the parabolic shape of the Nb variogram at the origin typically revealed a non-stationarity process and the presence of trends. These trends could be fitted, and a local kriging function could be applied with an elliptical search radius. However, due to a short distance between single faults, this radius must be rather small perpendicular to the faults.
More constraints on the geometry of the dyke could be included, if appropriate geophysical data were available. In particular, seismic data would help with fault geometry and the subsurface extent of the carbonatite (see [10,40]). Modeling of gravimetric and magnetic data (e.g., see [7,40,41]) could further help to better understand and constrain the subsurface geometry of faults and highlight enrichment zones due to their different geophysical behavior. In particular, AMS (Apparent Magnetic Susceptibility) measurements would better constrain the intensity and direction of deformation. However, for the purpose of the study, investigating the correlation between faults and enrichment zones, these kind of data are not necessary.

6.2. Consequences of the 3D Model for the Nb, Ta, and REE Enrichment

Considering the modeling approach, the resulting model consisted of ten faults of Sector B and seven faults in Sector K. As the generation of surfaces with a determined dip and azimuth is difficult with GoCad, vertical to sub-vertical dip was assumed first and adapted to available shear markers in the drillhole data during interpolation. However, further information about the subsurface beside drillhole data was not available, so the fault system was reconstructed based on field observations extrapolated to the depth. The resulting faults were the most realistic conceptual model extrapolated from the surface given the available data.
The NW-SE striking faults system of Sector B had characteristics of a strike-slip duplex, in which the carbonatite intruded. This shear zone orientation was later reactivated during transpression associated with the opening of the Atlantic [29]. In the area of Epembe, this deformation stage is witnessed by the offset of Cretaceous dolerite dykes by this fault orientation (at the nearby Kunene River). It is thus assumed that the Epembe fault was reactivated as well, so a hydrothermal remobilization of fluids could have occurred during this time. This could explain why in both sectors, Ta, Nb, P, and TREE + Y showed the greatest enrichment along faults. This and the field observation of coincident pyrochlore and apatite preferred an enrichment during the same process. Figure 6c demonstrates that the high-grade zones of the elements correlating with the fault systems. Small exceptions are the westward enrichment zones of niobium and tantalum of Sector K, but possibly a fault exists in the underground. The enrichment zones of Ta, Nb, and P of both sectors showed small enriched spotty zones in both ridges. The enrichment zones of TREE + Y showed in both sectors a good correlation with the faults (Figure 5).
The correlation between the elements (U + Th)-Ta, (U + Th)-Nb, Ta-Nb, and (TREE + Y)-P (see Figure 3) reflects an enrichment of incompatible elements (High Field Strength Elements, HFSE) in the dyke. These may have accumulated during the genesis of the carbonatitic melt and subsequent fractional crystallization. Later, a hydrothermal overprint of the shear zone caused a redistribution of elements, such as REE. This re-organization of elements could be the result of deformation and solution along faults and precipitation in the low-strain zones. Similar processes have been observed at several important deposits [8] and can be demonstrated by the decoupling of LREE and HREE and the lens-shaped enrichment around shear zones. The latest intrusive phases (foliated carbonatite and sövite) seem to have become progressively richer in Nb, Ta, and U [26]. This statement should be re-formulated after statistical analysis, which proves the correlation between some lithological units, preferably sheared ones, and enrichment in specific elements. In this context, we would re-interpret the foliated carbonatites (that were interpreted to have rather a magmatic then a metamorphic foliation) as sheared units.
Most carbonatites precipitate hydrothermal HFSE-enriched minerals as veins, fillings, or fine-grained clusters, commonly associated with monazite [4]. Hence, the REE enrichment often occurs within small-scale features like small dykes and distinct enrichment zones [42]. The accumulation trend of HFSE on faults has been widely discussed and observed by exploration [7]. Higher values are concentrated in close proximity to the faults (Figure 6). The 3D model demonstrated small lensoidal high-grade zones, which occurred along migration pathways (faults). This resulted in fluctuations in the variogram (Figure 8). The generation of these enrichment zones correlates with a hydrothermal overprint, with shear zones as available migration pathways and precipitation of the elements at geochemical barriers [42].

6.3. Enrichment during the Late Stage

During the modeling stage, it became obvious that something did not fit the prior assumptions. In particular, the strong correlation between shear zones and high-grade zones was striking. This is supported by (1) oscillating variograms, (2) decoupling of LREE and HREE zones in the SGrid model, (3) monazite rims around the apatite grains [27], (4) distinct correlation between Nb, Ta, P, REE, U, and Th and sheared lithological units, as well as the concentration of high-grade zones along faults, and (5) mineralogical field evidence of distinct zones of apatite and pyrochlore in highly-sheared carbonatites correlating with small ridges that can be followed along the strike for several hundreds of meters [27].
Despite the traditional model for the enrichment of critical metals in carbonatites following the magmatic separation model (e.g., [4,7]), new observations from various places call for an adjustment. Similar observations of a late-stage dissolution-reprecipitation process come from Chilwa Alkaline Province/Malawi [9]. These authors also state that this process is related to a lower stability of the primary CO 3 2 -bearing apatite in the presence of Cl- and F-rich fluids and might be a common process in the late-stage evolution of the carbonatite complexes. Two exclusive examples of presence of late-stage, REE-rich mineralizing fluids are Lofdal Farm/Namibia (own observations and [8,43,44]) and the Browns Range prospect/Australia [45,46]. Another example of late-stage mineralization due to a carbonatite-sourced fluid is the Niaqornakavsak/Umiamako showing in Central-West Greenland (own observations and [47]). There, enrichment in critical metals (REE, U, Ta) is exclusively related to a major strike-slip shear zone where the mineralizing fluid alters basalts towards carbonate-rich amphibolites.

7. Conclusions

The 3D modeling workflow for the Epembe Nb-Ta-P-(LREE) deposit results in a constrained model for the fault system and a SGrid model for selected elements in Sectors B and K. The fault system is made up of two complex zones with more intense shearing to both boundaries of the dyke. Sector B is forming a restraining band with favorable conditions for element enrichment. The resulting SGrids show the high correlation between faults and enrichment in Nb-Ta-TREE, and P. Furthermore, these elements are enriched in small isolated, lens-shaped zones. These observations, however, strongly contradict an enrichment during magmatic processes, because:
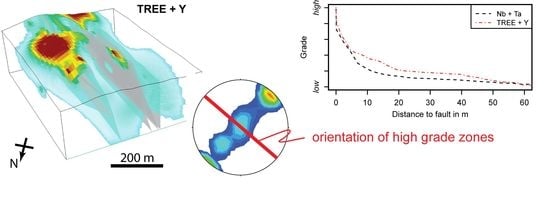
  • There is a distinct correlation between enrichment in Nb, Ta, P, REE, U, and Th and sheared lithological units, as well as the concentration of high-grade zones along faults. This is further supported by element concentration in 3D distance to faults (75% quantile 10 m and median at 4.5 m) and field evidence of shear-bands showing enrichment of apatite, pyrochlore, and pyroxene.
  • The complex fault system geometry affects the whole dyke and, thus, creates fluid pathways for the remobilization of the incompatible elements (HFSE).
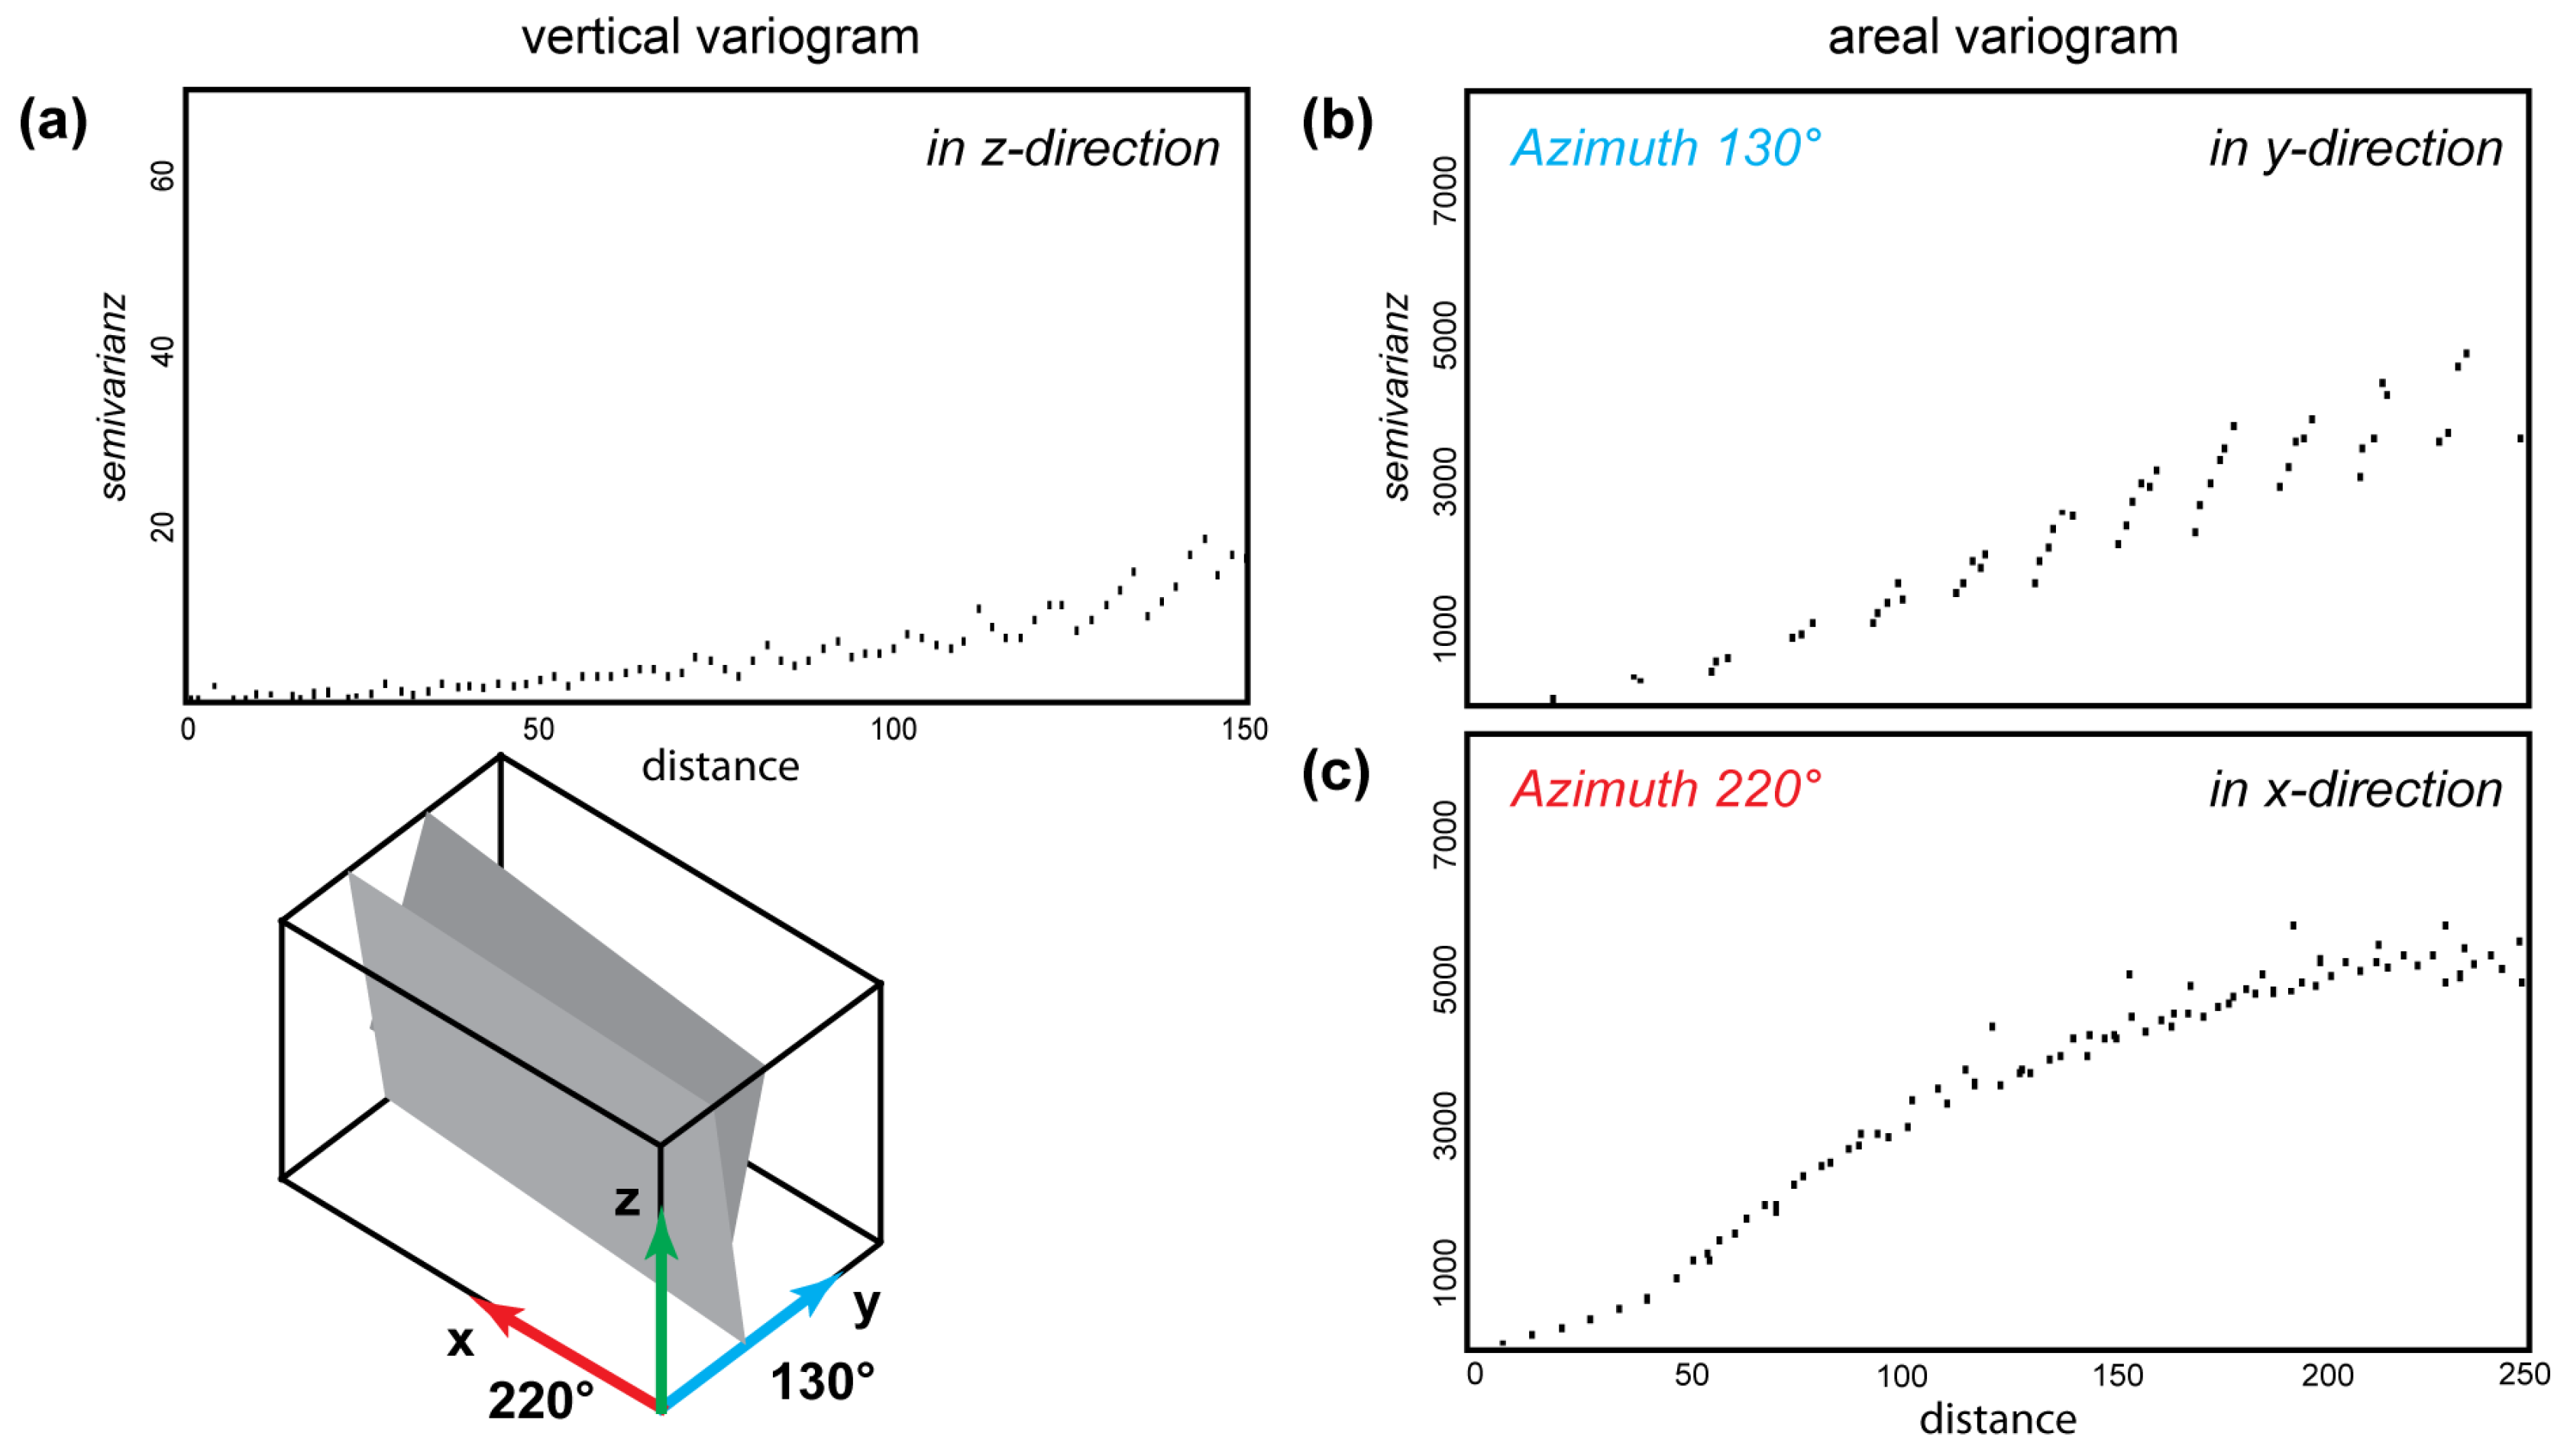
  • Oscillating 3D variograms that indicate focused enrichment along faults.
We, thus, favor a model for the formation of the high-grade zones during late-/post-magmatic hydrothermal processes that overprint pre-existing carbonatites. Further work with a focus on mineralogy and geochemistry is necessary to resolve the timing and the relation of magmatism and enrichment processes in more detail. Such an approach of early 3D data integration and analysis will help further exploration, not only for the Epembe deposit.

Author Contributions

All authors contributed in a substantial way to the manuscript. G.U. created the 3D model with support from R.Z. and R.G. R.Z. conducted field work at Epembe in 2014 and 2016. R.G. outlined the research topic and supervised the study at all stages. All authors contributed by writing and editing parts of the manuscript, as well as discussing the results.

Funding

This research received no external funding. The Helmholtz Institute Freiberg for Resource Technology is gratefully acknowledged for supporting and funding this internal project. The APC was funded by the Helmholtz-Zentrum Dresden-Rossendorf.

Acknowledgments

The authors thank Kunene Resources, Gecko Namibia, for permission to publish the results of this study. We thank Lara Satge for assistance with SKUA-GoCad, Raimon Tolosana-Delgado for help with geostatistics, and Moritz Kirsch for his critical comments on an earlier version of the manuscript. We further thank Kunene Resources, Swinden Geoscience Consultants Ltd., the Geological Survey of Namibia, and George Barakos for supporting fieldwork, kindly sharing data, and discussion of the target.

Conflicts of Interest

The authors declare no conflict of interest.

References

  1. European Union. Study on the Review of the List of Critical Raw Materials, Final Report; Publications Office of the European Union: Brussels, Belgium, 2017. [Google Scholar]
  2. Kynicky, J.; Smith, M.; Xu, C. Diversity of Rare Earth Deposits: The Key Example of China. Elements 2012, 8, 361–367. [Google Scholar] [CrossRef]
  3. Calas, G. Mineral Resources and Sustainable Development. Elements 2017, 13, 301–306. [Google Scholar] [CrossRef]
  4. Mariano, A.N. Nature of economic mineralization in carbonatites and related rocks. In Carbonatites—Genesis and Evolution; Bell, K., Ed.; Unwin Hyman Ltd.: Boston, MA, USA, 1989; pp. 149–176. [Google Scholar]
  5. Wallace, M.; Green, H. An experimental determination of primary carbonatite magma composition. Nature 1988, 335, 343–346. [Google Scholar] [CrossRef]
  6. Woolley, A.R. Alkaline Rocks and Carbonatites of the World, Part 3: Africa; British Museum (Natural History): London, UK, 2001; Chapter Namibia. [Google Scholar]
  7. Verplanck, P.L.; Van Gosen, B.S.; Seal, R.R.; McCafferty, A.E. A Deposit Model for Carbonatite and Peralkaline Intrusion-Related Rare Earth Element Deposits; U.S. Geological Survey Scientific Investigations Report; USGS: Denver, CO, USA, 2014.
  8. Williams-Jones, A.E.; Migdisov, A.A.; Samson, I.M. Hydrothermal Mobilisation of the Rare Earth Elements—A Tale of “Ceria” and “Yttria”. Elements 2012, 8, 355–360. [Google Scholar] [CrossRef]
  9. Broom-Fendley, S.; Styles, M.; Appleton, J.; Gunn, G.; Wall, F. Evidence for dissolution-reprecipitation of apatite and preferential LREE mobility in carbonatite-derived late-stage hydrothermal processes. Am. Mineral. 2016, 101, 596–611. [Google Scholar] [CrossRef]
  10. Andersson, M.; Malehmir, A.; Troll, V.R.; Dehghannejad, M.; Juhlin, C.; Ask, M. Carbonatite ring-complexes explained by caldera-style volcanism. Sci. Rep. 2013, 3, 1677. [Google Scholar] [CrossRef] [Green Version]
  11. Simandl, G.J.; Paradis, S. Carbonatites: Related ore deposits, resources, footprint, and exploration methods. Appl. Earth Sci. 2018, 127, 123–152. [Google Scholar] [CrossRef]
  12. Feltrin, L.; McLellan, J.; Oliver, N. Modelling the Giant, Zn–Pb–Ag Century Deposit, Queensland, Australia; Technical Report; Predictive Mineral Discovery Cooperative Research Centre, School of Earth Sciences, James Cook University: Douglas, Australia, 2007. [Google Scholar]
  13. Kaufmann, O.; Martin, T. 3D geological modeling from boreholes, cross-sections and geological maps, application over former natural gas storages in coal mines. Comput. Geosci. 2008, 34, 278–290. [Google Scholar] [CrossRef]
  14. Schetselaar, E.M. Mapping the 3D lithofacies architecture of a VMS ore system on a curvilinear-faulted grid: A case study from the Flin Flon mining camp, Canada. Ore Geol. Rev. 2013, 53, 261–275. [Google Scholar] [CrossRef]
  15. Martin-Izard, A.; Arias, D.; Arias, M.; Gumiel, P.; Sanderson, D.J.; Castañon, C.; Lavandeira, A.; Sanchez, J. A new 3D geological model and interpretation of structural evolution of the world-class Rio Tinto VMS deposit, Iberian Pyrite Belt (Spain). Ore Geol. Rev. 2015, 71, 457–476. [Google Scholar] [CrossRef] [Green Version]
  16. Saalmann, K.; Laine, E. Structure of the Outokumpu ore district and ophiolite-hosted Cu-Co-Zn- Ni-Ag-Au sulfide deposits revealed from 3D modeling and 2D high-resolution seismic reflection data. Ore Geol. Rev. 2014, 62, 156–180. [Google Scholar] [CrossRef]
  17. Renard, R.; Courrioux, G. Three-dimensional geometric modeling of a faulted domain: The Soultz Horst example (Alsace, France). Comput. Geosci. 1994, 20, 1379–1390. [Google Scholar] [CrossRef] [Green Version]
  18. Bistacchi, A.; Massironi, M.; Piaz, G.V.D.; Piaz, G.D.; Monopoli, B.; Schiavo, A.; Toffolon, G. 3D fold and fault reconstruction with an uncertainty model: An example from an Alpine tunnel case study. Comput. Geosci. 2008, 34, 351–372. [Google Scholar] [CrossRef]
  19. Caumon, G.; Collon-Drouaillet, P.; Le Carlier De Veslud, C.; Viseur, S.; Sausse, J. Surface-based 3D modeling of geological structures. Math. Geosci. 2009, 41, 927–945. [Google Scholar] [CrossRef]
  20. Zanchi, A.; Francesca, S.; Stefano, Z.; Simone, S.; Graziano, G. 3D reconstruction of complex geological bodies: Examples from the Alps. Comput. Geosci. 2009, 35, 49–69. [Google Scholar] [CrossRef]
  21. Cherpeaua, N.; Caumon, G.; Lévy, B. Stochastic simulations of fault networks in 3D structural modeling. C. R. Geosci. 2010, 34, 687–694. [Google Scholar] [CrossRef]
  22. Arndt, D.; Bär, K.; Fritsche, J.G.; Kracht, M.; Sass, I.; Hoppe, A. 3D structural model of the Federal State of Hesse (Germany) for geopotential evaluation. Zeitschrift der Deutschen Gesellschaft für Geowissenschaften 2011, 162, 353–369. [Google Scholar] [CrossRef]
  23. Caumon, G.; Gray, G.; Antoine, C.; Titeux, M.O. Three-dimensional implicit stratigraphic model building from remote sensing data on tetrahedral meshes: Theory and application to a regional model of la Popa Basin, NE Mexico. IEEE Trans. Geosci. Remote Sens. 2013, 51, 1613–1621. [Google Scholar] [CrossRef]
  24. Royer, J.-J.; Mejia-Herrera, P.; Caumon, G.; Collon, P. 3D and 4D Geomodeling Applied to Mineral Resources Exploration—An Introduction. In 3D, 4D and Predictive Modelling of Major Mineral Belts in Europe; Weihed, P., Ed.; Springer: Berlin, Germany, 2015; pp. 73–89. [Google Scholar]
  25. Falshaw, S. The Geology and Rare Metal Metallogenesis of the Epembe Carbonatite Dyke, North West Namibia. Master’s Thesis, Camborne School of Mines, Penryn, UK, 2012. [Google Scholar]
  26. Bull, J. Detailed Geological Mapping and Petrological Study of the Ta-Na ± U Epembe Carbonatite-Syenite Complex in North-West Namibia. Master’s Thesis, Camborne School of Mines, Penryn, UK, 2013. [Google Scholar]
  27. Zimmermann, R.; Brandmeier, M.; Andreani, L.; Mhopjeni, K.; Gloaguen, R. Remote Sensing Exploration of Nb-Ta-LREE-Enriched Carbonatite (Epembe/Namibia). Remote Sens. 2016, 8, 620. [Google Scholar] [CrossRef]
  28. Ellmies, R.; Kunene Resources (pty) Ltd., Klein-Windhoek, Namibia. Personal communication, 2014.
  29. Salomon, E.; Koehn, D.; Passchier, C. Brittle reactivation of ductile shear zone in NW Namibia in relation to South Atlantic rifting. Tectonics 2015, 34, 70–85. [Google Scholar] [CrossRef]
  30. Brandt, S.; Will, T.M.; Klemd, R. Magmatic loading in the proterozoic Epupa Complex, NW Namibia, as evidenced by ultrahigh-temperature sapphirine-bearing orthopyroxene–sillimanite–quartz granulites. Precambrian Res. 2007, 153, 143–178. [Google Scholar] [CrossRef]
  31. Maier, W.; Rasmussen, B.; Flechtner, I.; Li, C.; Barnes, S.J.; Huhma, H. The Kunene Anorthosite Complex, Namibia, and its Satellite Intrusions: Geochemistry, Geochronology and Economic Potential. Econ. Geol. 2013, 108, 953–986. [Google Scholar] [CrossRef]
  32. Swinden, S.; Swinden Geoscience Consultants Ltd., Wolfville, Canada. Personal communication, 2014.
  33. NASA JPL. NASA Shuttle Radar Topography Mission Global 1 Arc Second Number S18E013V3; NASA EOSDIS Land Processes DAAC: Sioux Falls, SD, USA, 2013.
  34. Stoch, B.; Anthonissen, C.J.; McCall, M.-J.; Basson, I.J.; Deacon, J.; Cloete, E.; Botha, J.; Britz, J.; Strydom, M.; Nel, D.; et al. 3D implicit modeling of the Sishen Mine: New resolution of the geometry and origin of Fe mineralization. Miner. Depos. 2018, 53, 835–853. [Google Scholar] [CrossRef]
  35. Mallet, J.L. Gocad: A computer aided design program for geological applications. In Three-Dimensional Modeling with Geoscientific Information Systems; Turner, A.K., Ed.; AS1 Series; Springer: Dordrecht, The Netherlands, 1992; pp. 123–141. [Google Scholar]
  36. Mallet, J.L. Discrete smooth interpolation in geometric modeling. Comput. Aided Des. 1992, 24, 178–191. [Google Scholar] [CrossRef]
  37. Mallet, J.L. Discrete smooth interpolation. ACM Trans. Gr. 1989, 8, 121–144. [Google Scholar] [CrossRef]
  38. Royse, K. Combining numerical and cognitive 3D modeling approaches in order to determine the structure of the Chalk in the London Basin. Comput. Geosci. 2010, 36, 500–511. [Google Scholar] [CrossRef]
  39. Bühn, B. The role of the volatile phase for REE and Y fractionation in low-silica carbonate magmas: Implications from natural carbonatites, Namibia. Mineral. Petrol. 2008, 92, 453–470. [Google Scholar] [CrossRef]
  40. Andersson, M.; Almqvist, B.S.; Burchardt, S.; Troll, V.R.; Malehmir, A.; Snowball, I.; Kübler, L. Magma transport in sheet intrusions of the Alnö carbonatite complex, central Sweden. Sci. Rep. 2016, 6, 27635. [Google Scholar] [CrossRef] [Green Version]
  41. Andersson, M.; Malehmir, A. Unravelling the internal architecture of the Alnö alkaline and carbonatite complex (central Sweden) using 3D models of gravity and magnetic data. Solid Earth Discuss. 2017, 1–35. [Google Scholar] [CrossRef] [Green Version]
  42. Jones, A.P.; Genge, M.; Carmody, L. Carbonate Melts and Carbonatites. Rev. Mineral. Geochem. 2013, 75, 289–322. [Google Scholar] [CrossRef] [Green Version]
  43. Wall, F.; Niku-Paavola, V.N.; Storey, C.; Müller, A.; Jeffries, T. Xenotime-(Y) from carbonatite dykes at Lofdal, Namibia: Unusually low LREE:HREE ratio in carbonatite, and the first dating of xenotime overgrowths on zircon. Can. Mineral. 2008, 46, 861–877. [Google Scholar] [CrossRef]
  44. Bodeving, S.; Williams-Jones, A.E.; Swinden, S. Carbonate–silicate melt immiscibility, REE mineralizing fluids, and the evolution of the Lofdal Intrusive Suite, Namibia. Lithos 2017, 268–271, 383–398. [Google Scholar] [CrossRef]
  45. Cook, N.J.; Ciobanu, C.L.; O’Rielly, D.; Wilson, R.; Das, K.; Wade, B. Mineral chemistry of Rare Earth Element (REE) mineralization, Browns Ranges, Western Australia. Lithos 2013, 172–173, 192–213. [Google Scholar] [CrossRef]
  46. Richter, L.; Diamond, L.W.; Atanasova, P.; Banks, D.A.; Gutzmer, J. Hydrothermal formation of heavy rare earth element (HREE)—Enotime deposits at 100 °C in a sedimentary basin. Geology 2018, 26, 263–266. [Google Scholar] [CrossRef]
  47. Mott, A.V.; Bird, D.K.; Grove, M.; Rose, N.; Bernstein, S.; Mackay, H.; Krebs, J. Karrat Isfjord: A newly discovered Paleoproterozoic carbonatite-sourced REE deposit, Central West Greenland. Econ. Geol. 2013, 108, 1471–1488. [Google Scholar] [CrossRef]
Figure 1. (a) Location of the Epembe dyke in Namibia. (b) Geological map of the Epembe region (after Zimmermann et al. [27] and the references therein) with (c) a detailed geological map of the Epembe dyke. Superimposed are the 12 artificial sectors as divided by Kunene Resources (pty) Ltd., Klein-Windhoek, Namibia. (d) Schematic cross-section P’–P” (sketch not to scale; dashed line in (c)) perpendicular to the dyke in Sector B as interpreted from field data.
Minerals 08 00600 g001
Figure 2. Overview of the processing workflow established to generate the 3D model of the Epembe deposit. See the text for a detailed explanation.
Minerals 08 00600 g002
Figure 3. Landsat 8 False Color image (Band 7-4-3) from the carbonatite dyke of Epembe with drill locations and surface projection of the drill-paths, as well as the ones used in the models of Sector B and Sektor K. Below are the results of fault modeling of both sectors. Different colors are chosen for a better differentiation of the modeled faults. A comparison of stereograms of modeled and observed structural data shows the same trend (reference coordinate system: WGS 84/UTM zone 33 S).
Minerals 08 00600 g003
Figure 4. Correlation of selected geochemical parameters to lithological units (first row; see Table 1 for a detailed description) and to each other. The scatter diagram matrix between Ta, Nb, Th + U, Total Rare Earth Element (TREE) + Y, and P shows the Spearman rank correlation value (lower left) and the scatter diagrams in the upper right. Lithological classification is explained in detail in Table 1.
Minerals 08 00600 g004
Figure 5. Thresholded Stratigraphic Grid (SGrid)) models of the enrichment zones of Nb, Ta, and TREE + Y for Sectors B and K show a good spatial correlation with the modeled faults (grey surfaces). The SGrid is cut by topography prior to interpolation, and dummy boreholes are placed in the corners.
Minerals 08 00600 g005
Figure 6. Ratio of Light to Heavy Rare Earth Elements (LREE/HREE) for (a) Sector B and (b) Sector K showing the decoupling of LREE and HREE enrichment within the dyke. LREE enrichment is focused in certain lenses close to faults. This provides circumstantial evidence in favor of a predominantly hydrothermal component during the enrichment phase. (c) Statistical evaluation of grade vs. distance to fault shows the high spatial correlation between ore-emplacement and shear zones. Visualized are the grades of Nb + Ta and REE for available data in Sectors B and K. (d) Sample NA14/18-B3 from Sector B shows the co-occurrence of pyrochlore and apatite in a deformed calcio-carbonatite.
Minerals 08 00600 g006
Figure 7. Schematic cross-section through the SGrid of Sector B with interpolated HREE contents of drillhole EPR51 (different colored spheres). Black arrows indicate the extrapolation trend of the Discrete Smooth Interpolation (DSI) algorithm.
Minerals 08 00600 g007
Figure 8. 3D variograms for the SGrid of Sector B. The visualized property is Nb, and variograms are calculated (a) vertical, (b) perpendicular ( 130 ), and (c) parallel ( 220 ) to the faults (see Figure 3). Parameters used: number of lags: 125, lag distance: 2 m, number of strata: 100, azimuths: 130 and 210 , tolerance: 20, bandwidth: 50, number of x and y columns: 100.
Minerals 08 00600 g008
Table 1. Lithological units of Epembe dyke from field observation and their genetic interpretation. Abbreviations: aeg = aegirine, ap = apatite, fsp = feldspar, px = pyroxene.
Lithofacies ClassDescriptionGenetic Interpretation
1fenite, gneisses, and mica-schistmetamorphosed (chlorite, epidote) and fenitized rockhost rock
2grey nepheline-bearing syenitegrey, medium-grained, mesocratic nepheline-bearing syeniteunaltered syenite
3red highly fenitized syenitefenitized rock, less mafic mineralshydrothermally-altered syenite
4lamprophyre dykesdark, 2–20 m-long, 0.1–0.5 m-wide porphyritic dykesmafic dykes, related to late-stage magmatism
5coarse-grained fenite brecciacarbonatic matrix with fragments of syenites or fenitealteration aureole around the carbonatite complex
6mixture zonesonly observed in drillcores, mixing of various lithologiesbreccia?
7deep-pink px-carbonatitelarge aeg crystals within flow bands, rich in U/Th/Kshear zone-related carbonatite
8grey ap-fsp-fenite- carbonatitelittle px, fenitized rocklate-stage carbonatite, hydrothermal overprint
9grey ap-fsp-aeg- carbonatiteflow bands with K-fsp, aeg, ap; syenite xenolithsshear zone-related carbonatite
10foliated, deformed grey ap-fsp-aeg-carbonatitesame as (9), but with a strong deformationintensely-sheared carbonatite, hydrothermally overprinted
11white coarse-grained sövitenon- to weakly-foliated, heterogeneous söviteweakly-deformed (primary?) carbonatite

