Post-Mineralization, Cogenetic Magmatism at the Sungun Cu-Mo Porphyry Deposit (Northwest Iran): Protracted Melting and Extraction in an Arc System

 , , ,
, , ,  and
and
Abstract
1. Introduction
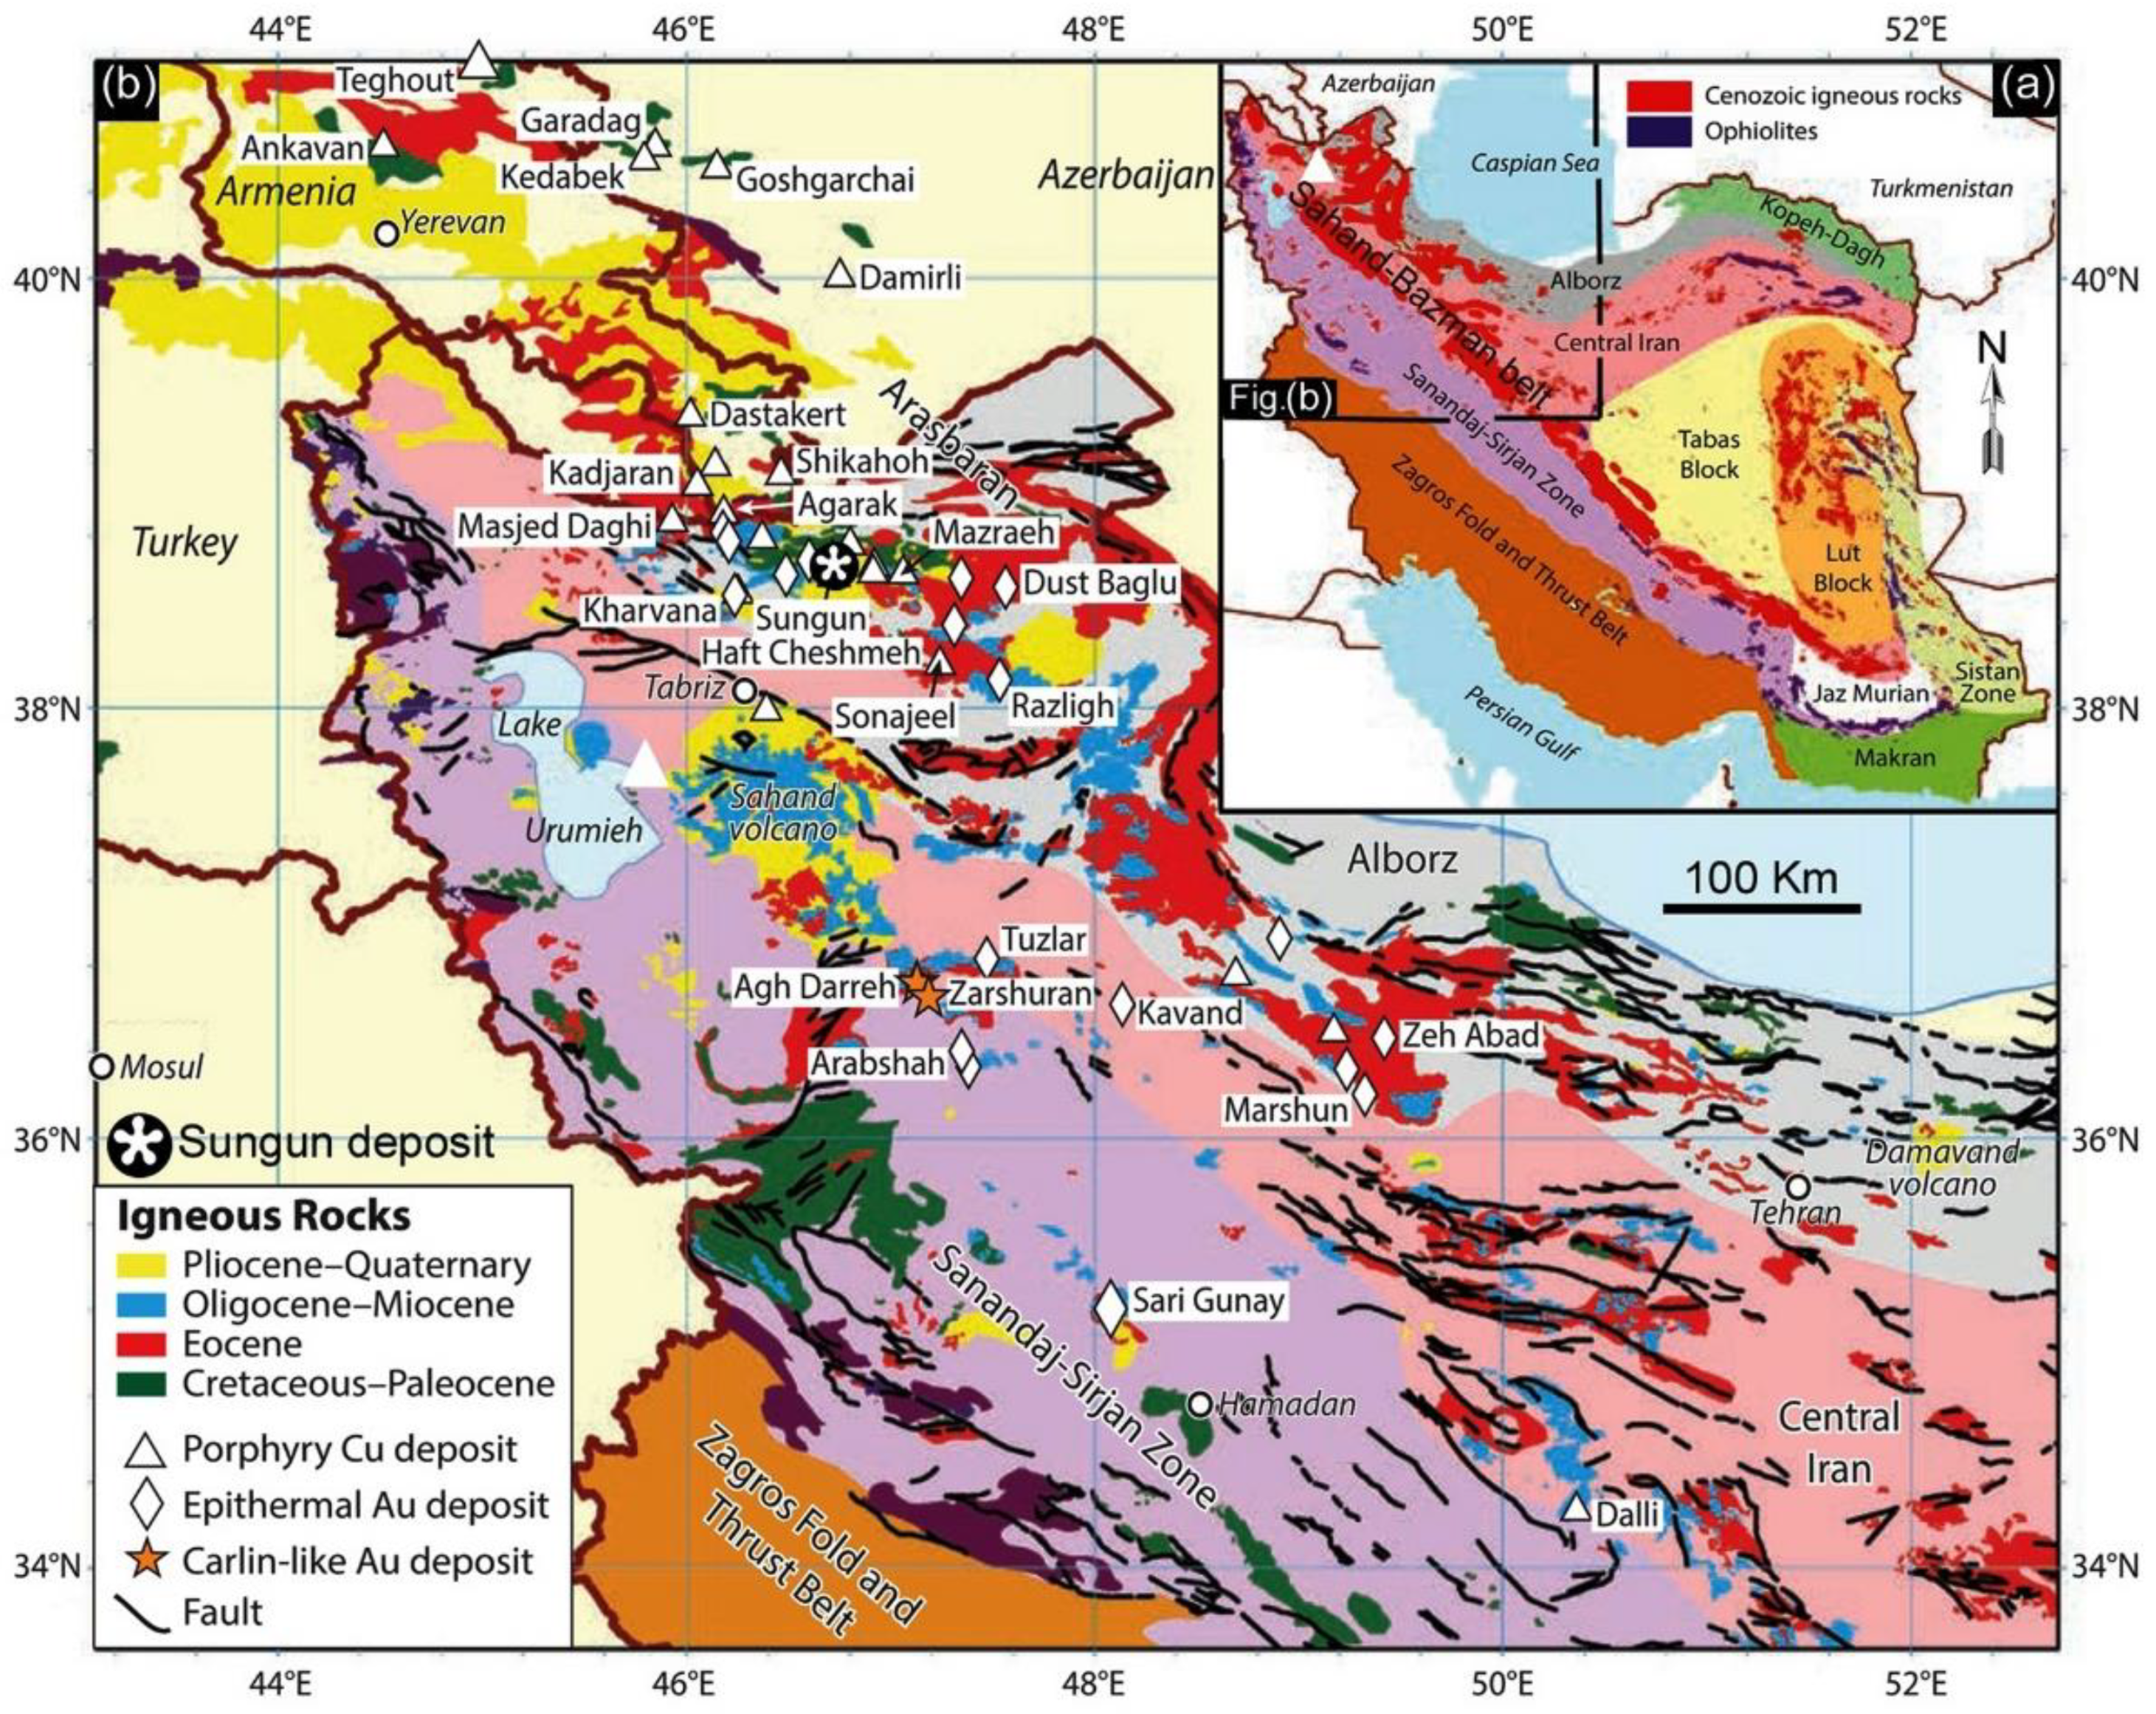
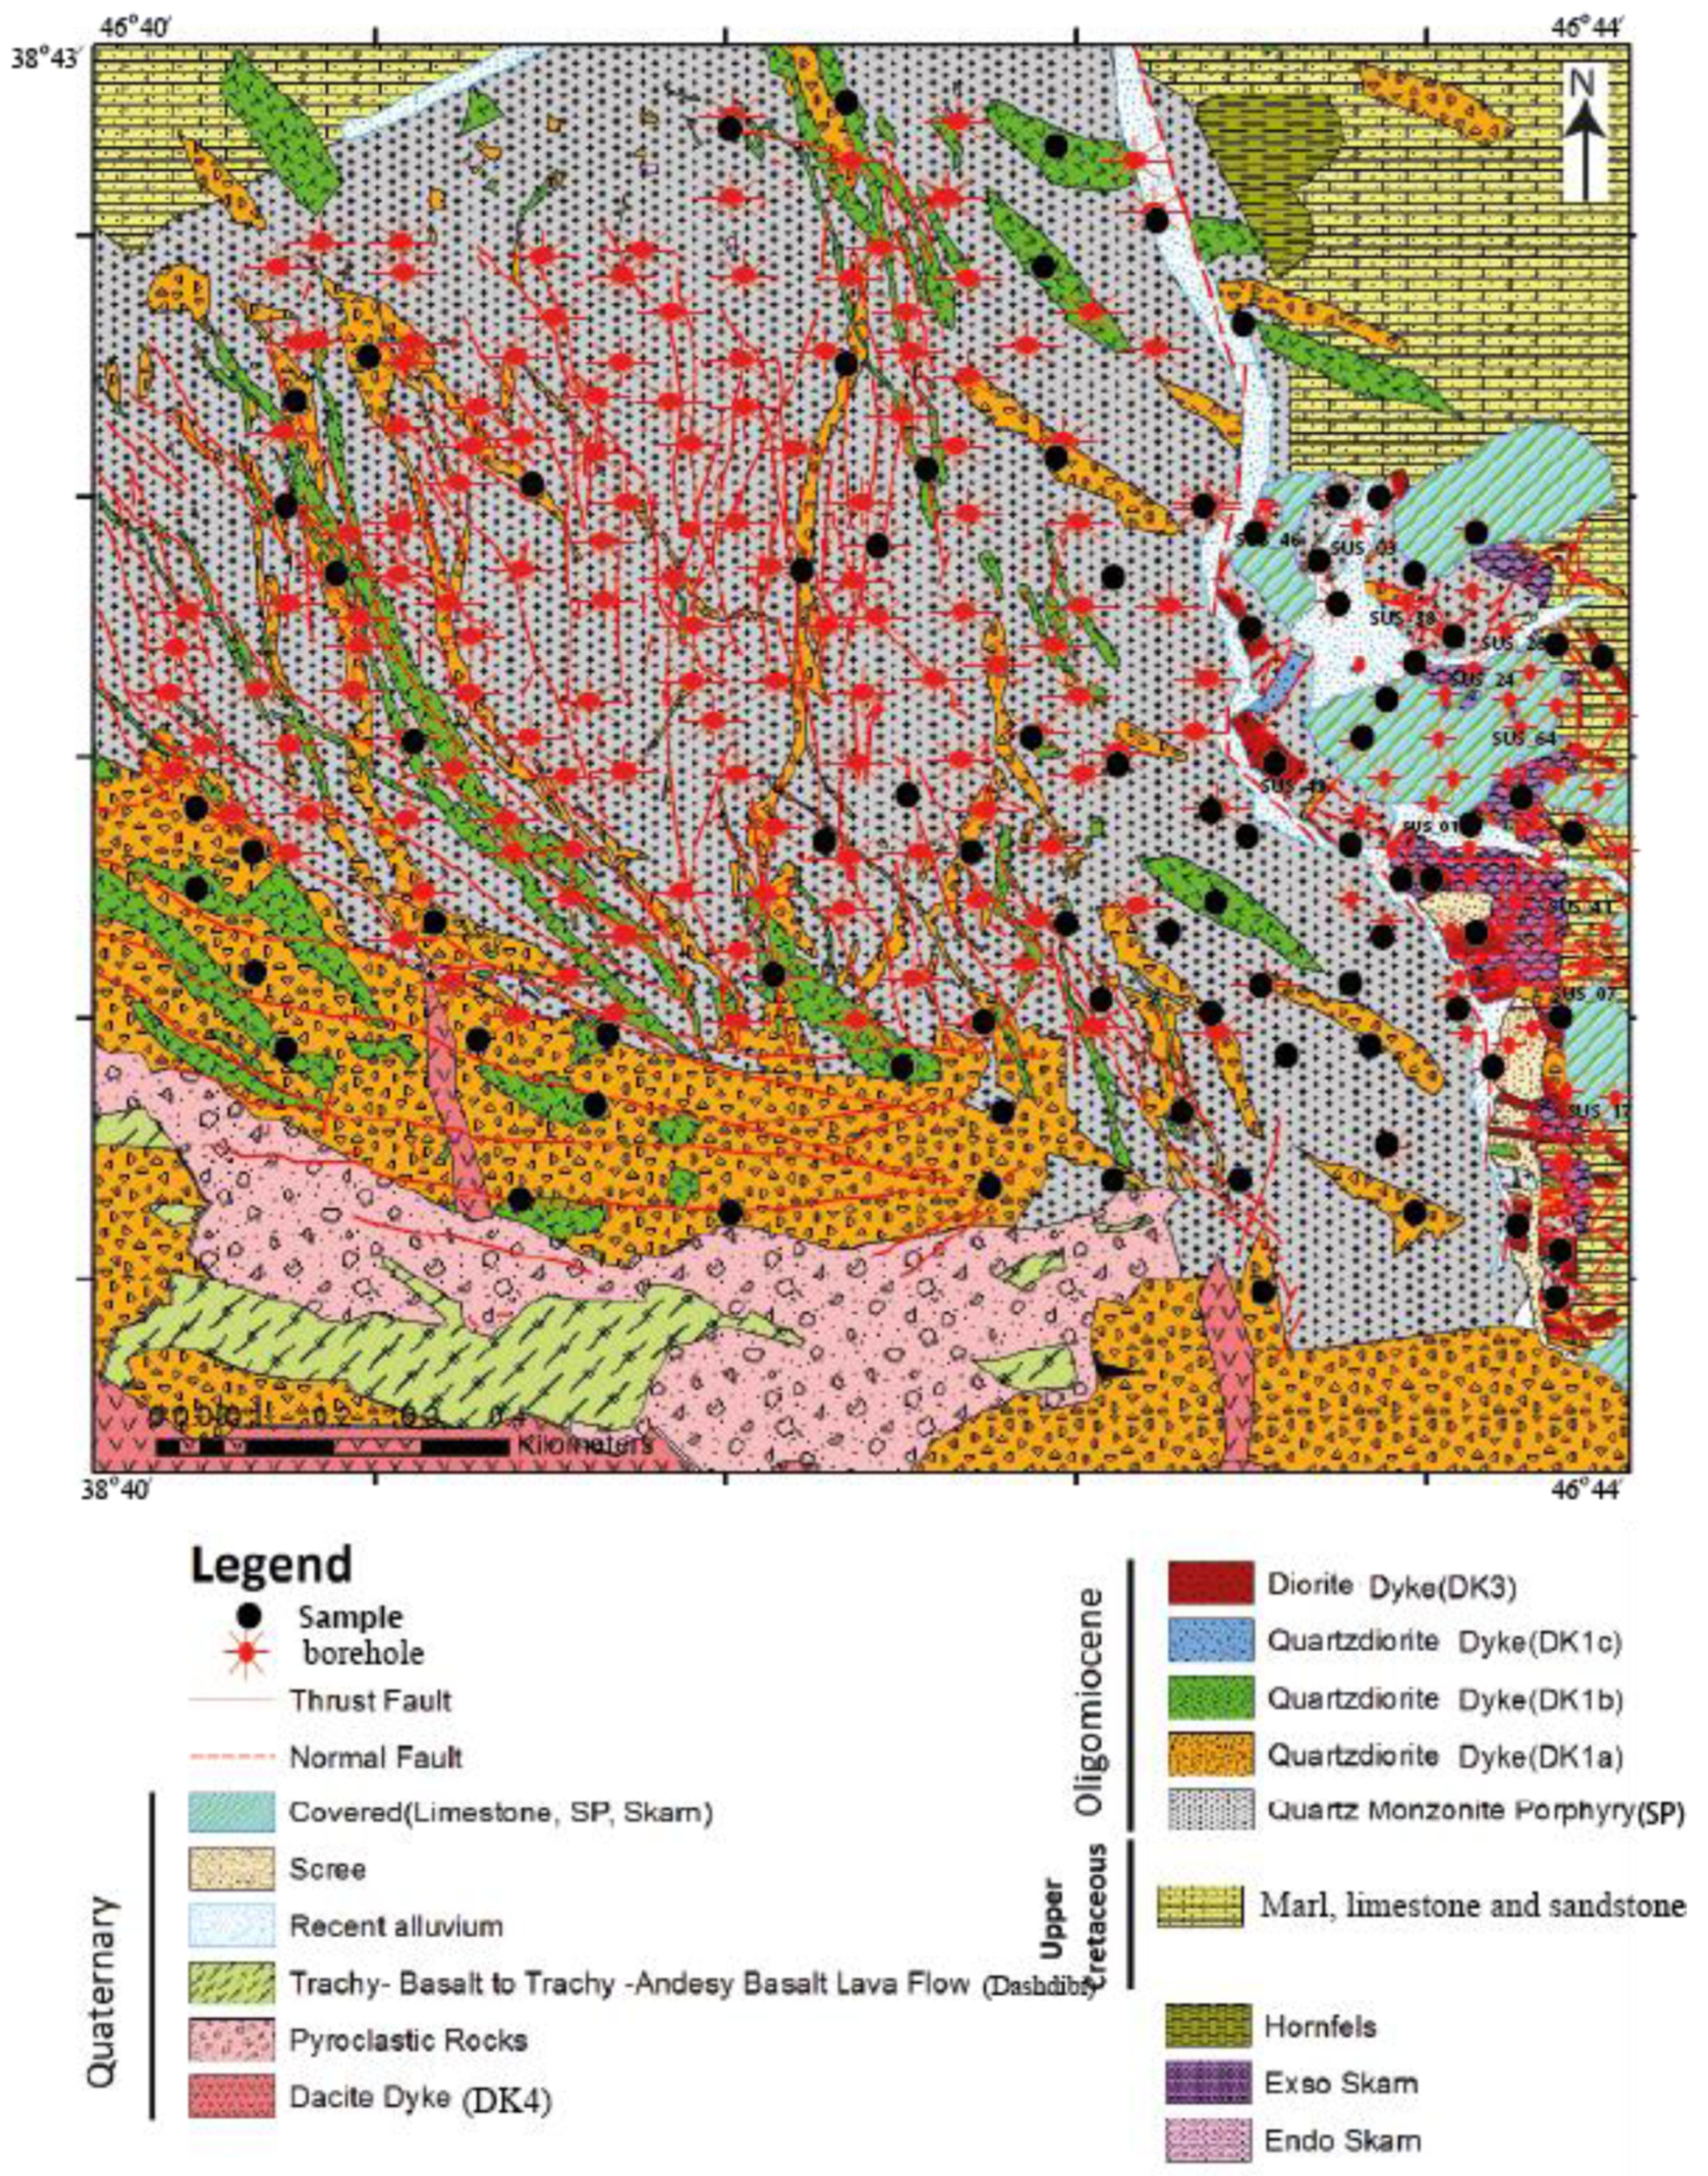
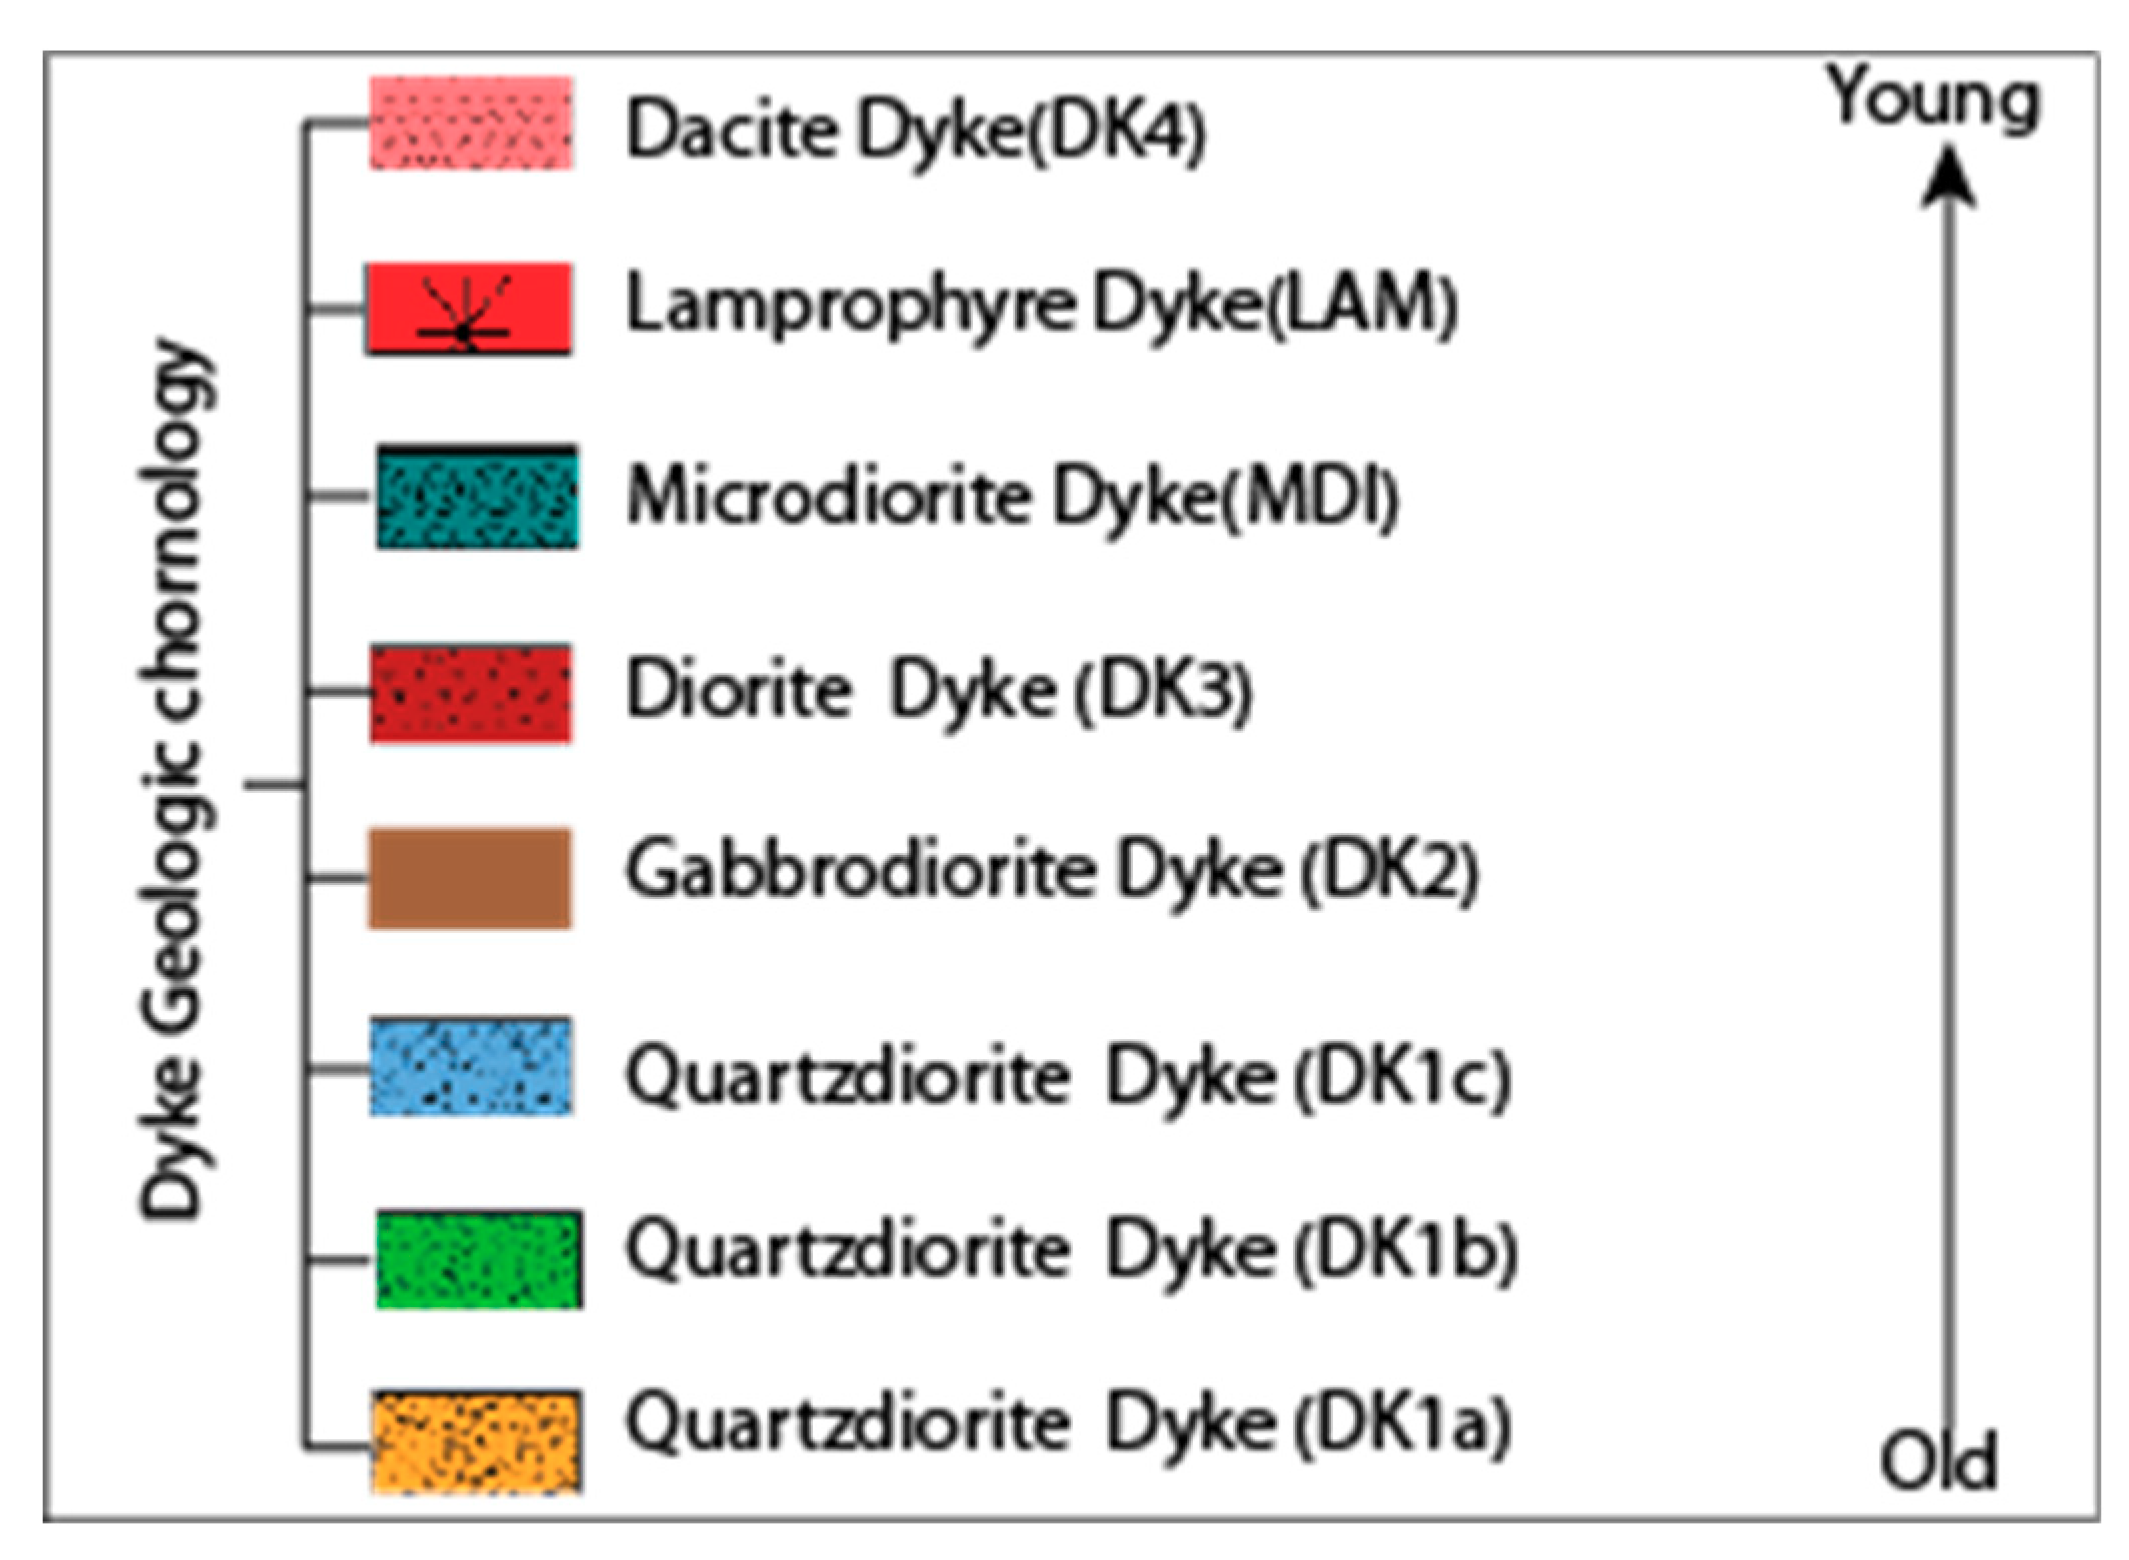
2. Geological Setting
3. Materials and Methods
4. Petrography
4.1. SP (Quartz-Monzonite)
4.2. DK1 (Quartz Diorite)
4.2.1. Dk1a
4.2.2. DK1b
4.2.3. DK1c
4.3. DK2 (Gabbro)
4.4. DK3 (Diorite)
4.5. DK4 (Dacite)
4.6. MDI (Microdiorite)
4.7. LAM (Lamprophyre)
5. Mineral Chemistry and Whole Rock Geochemistry
5.1. Mineral Chemistry
5.1.1. Plagioclase
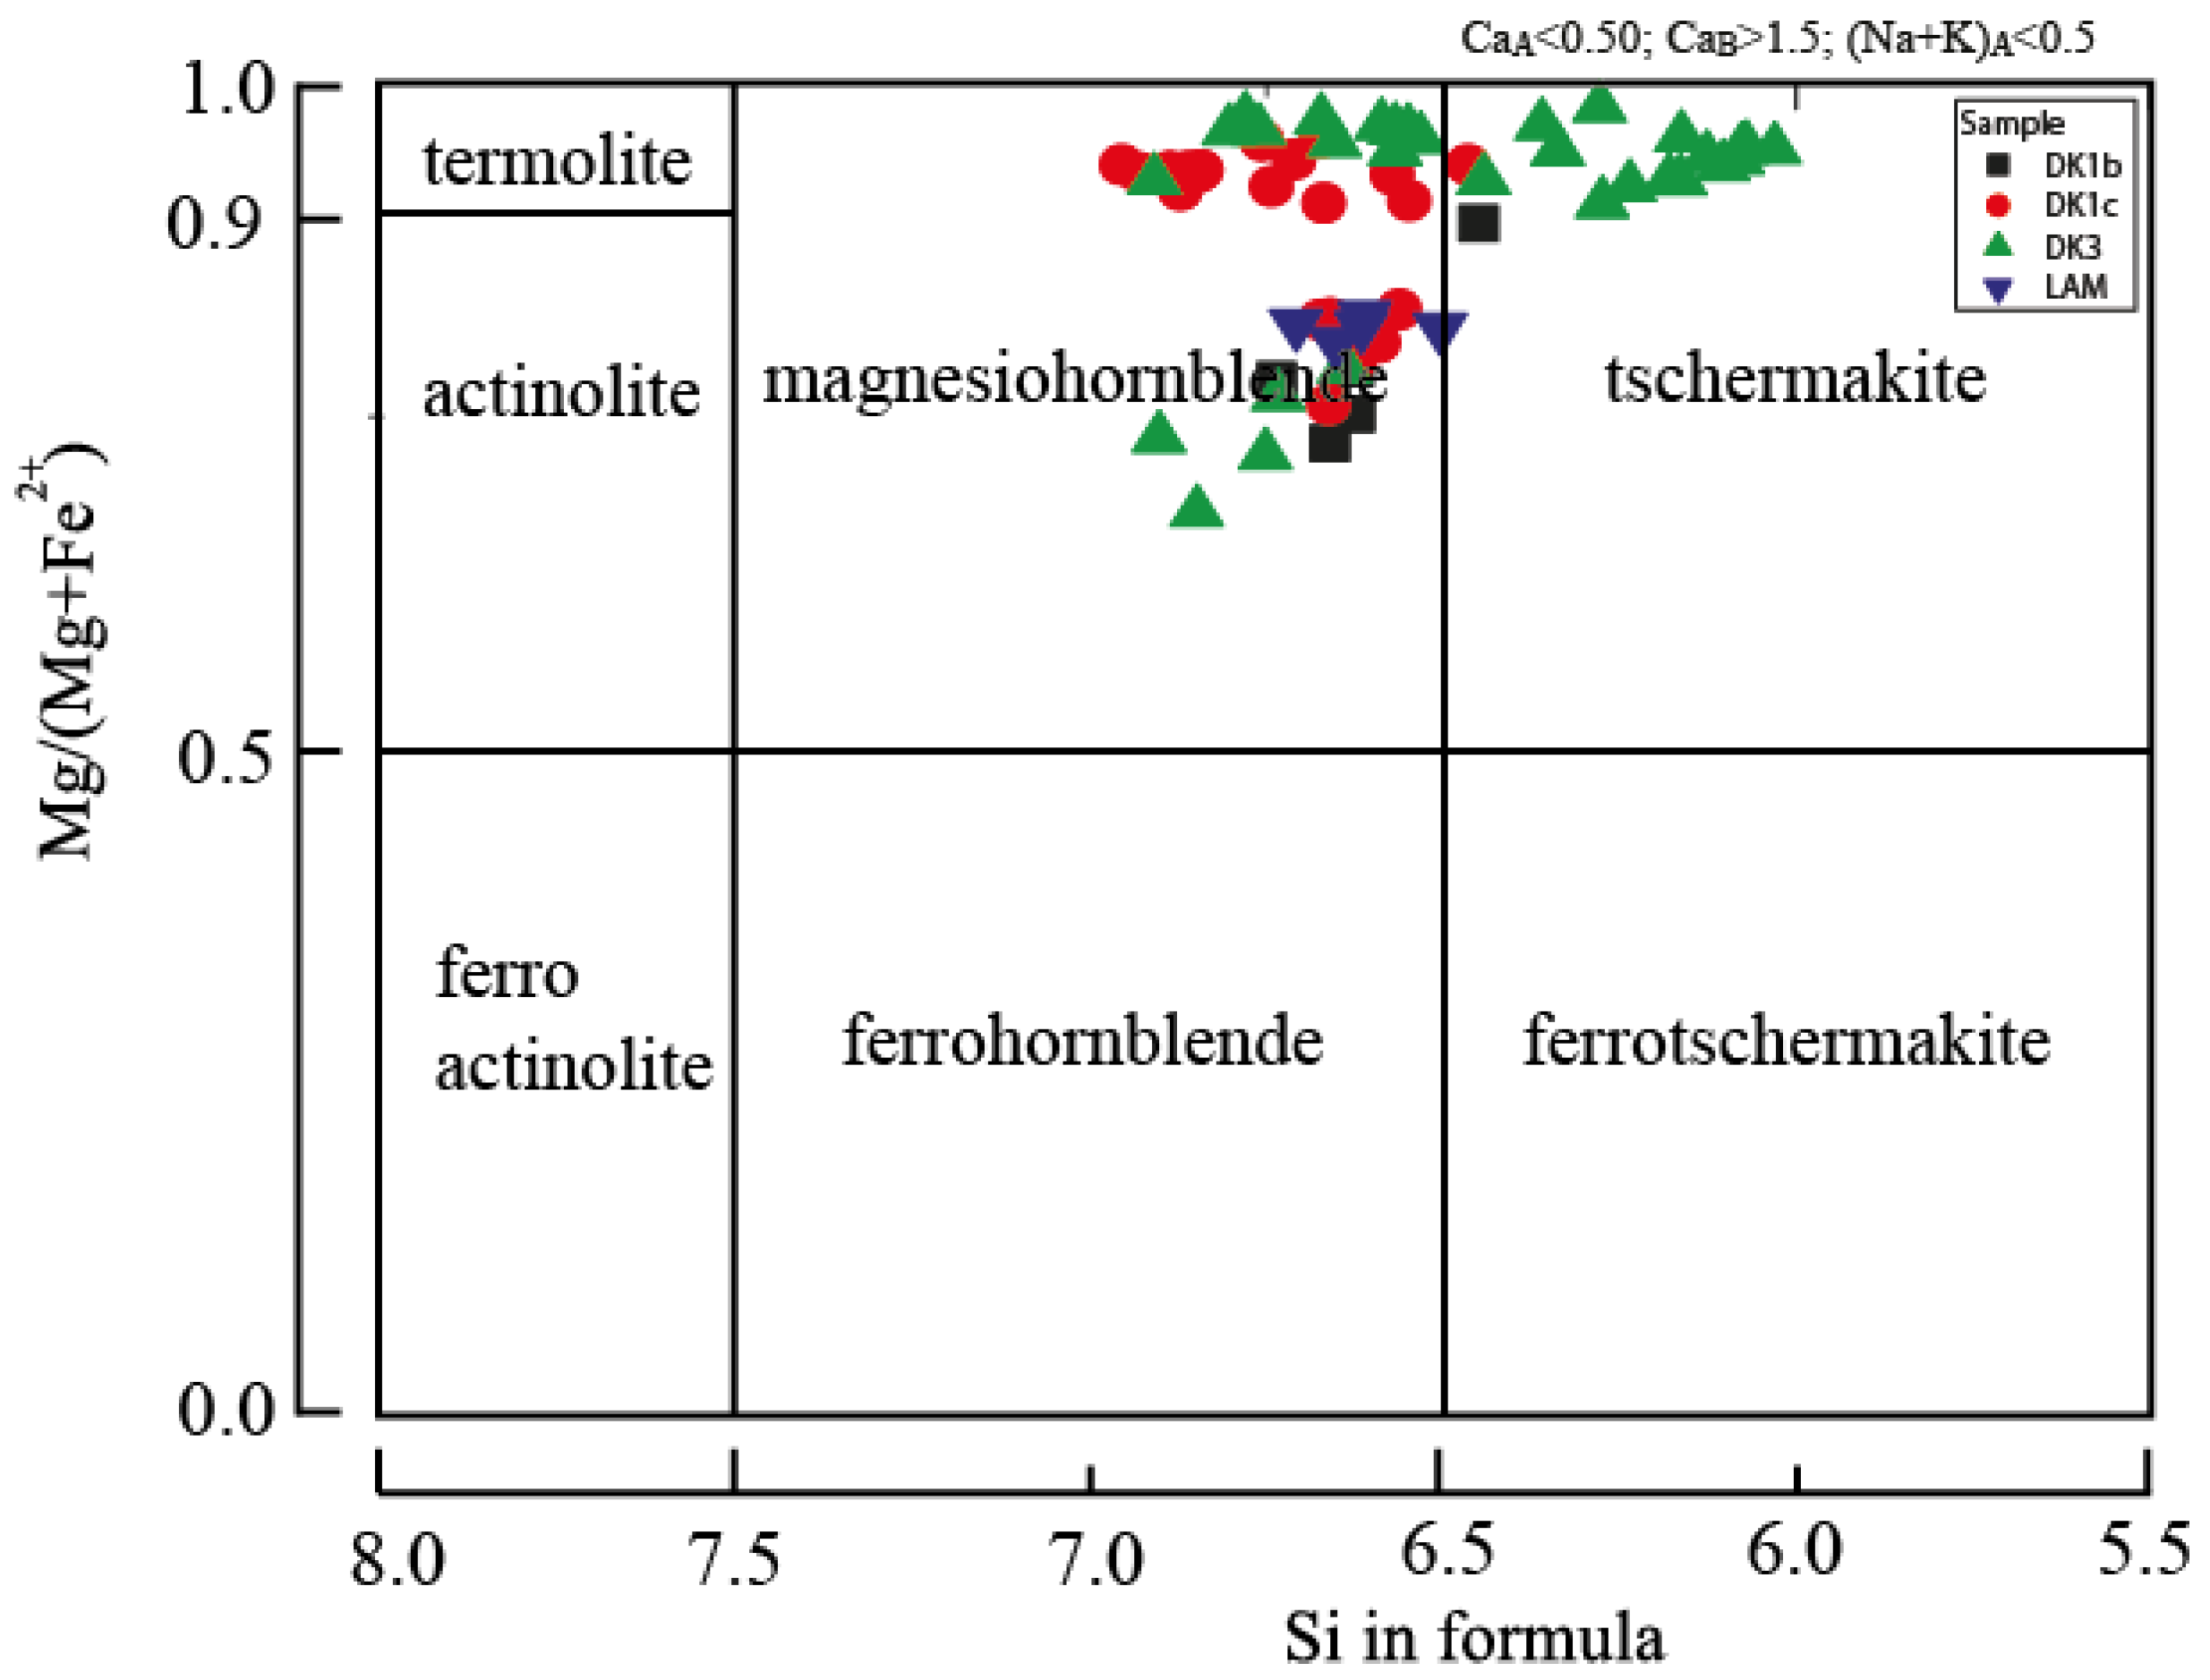
5.1.2. Amphibole
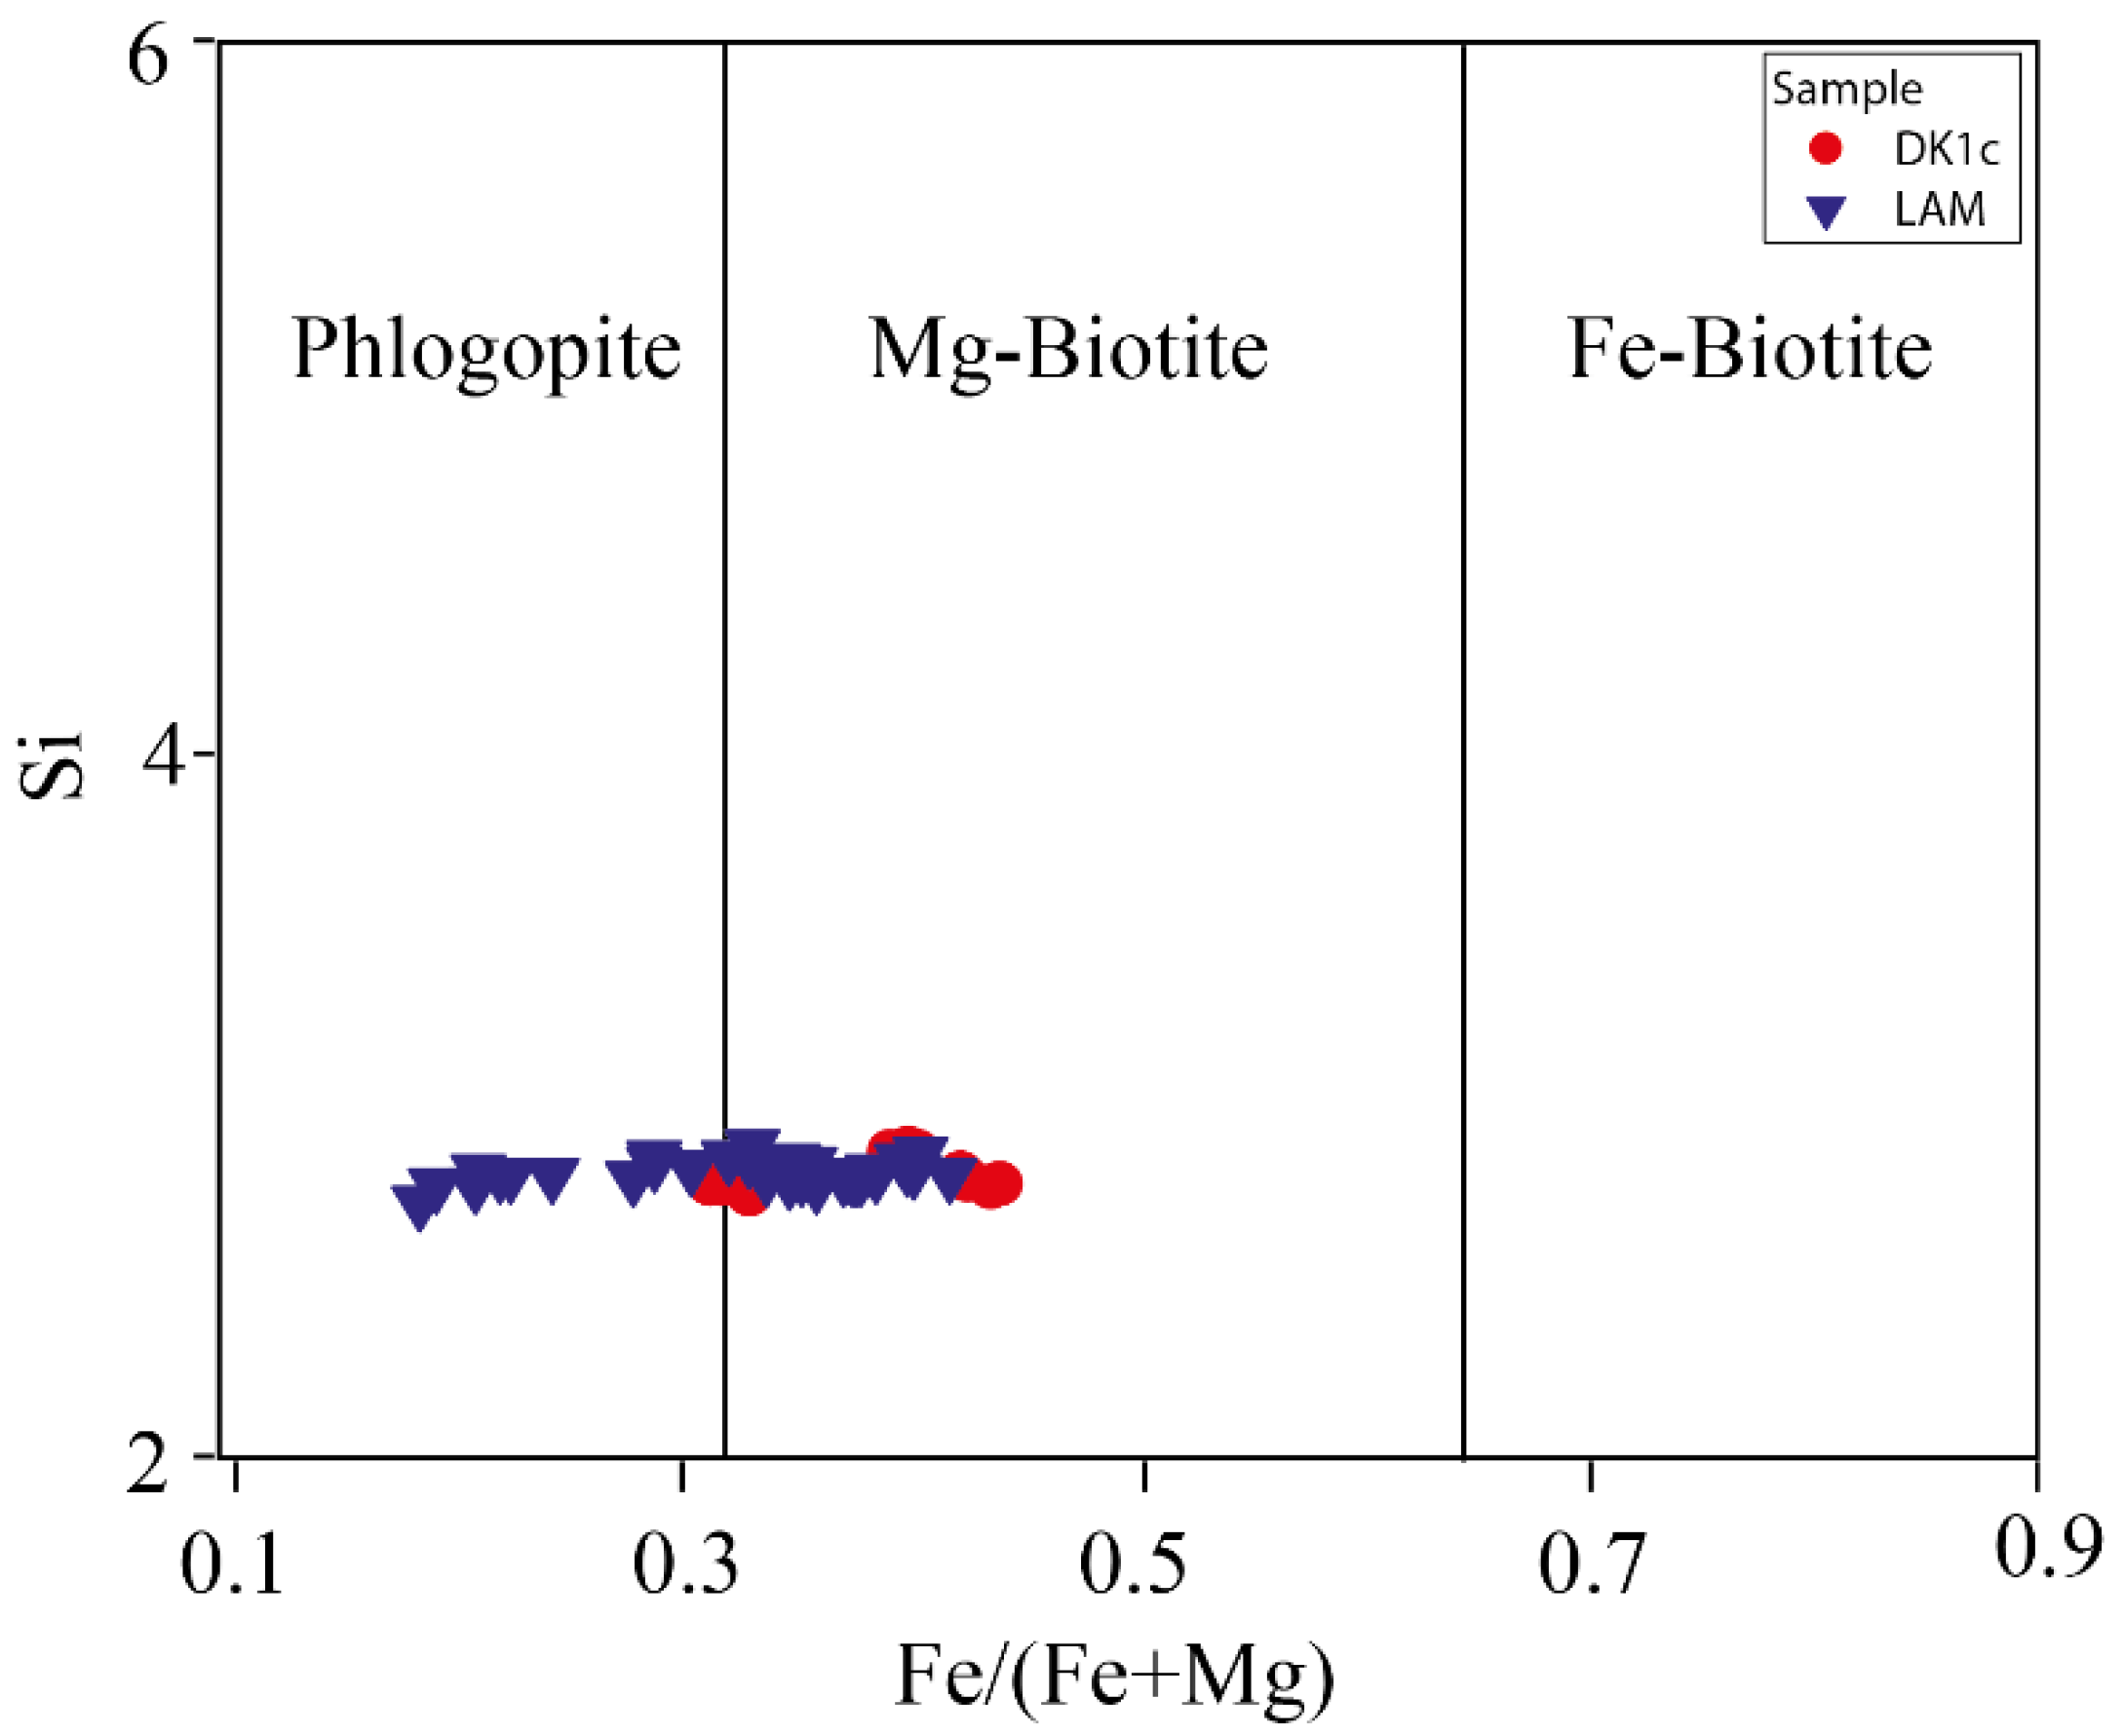
5.1.3. Biotite
5.2. Whole Rock Geochemistry
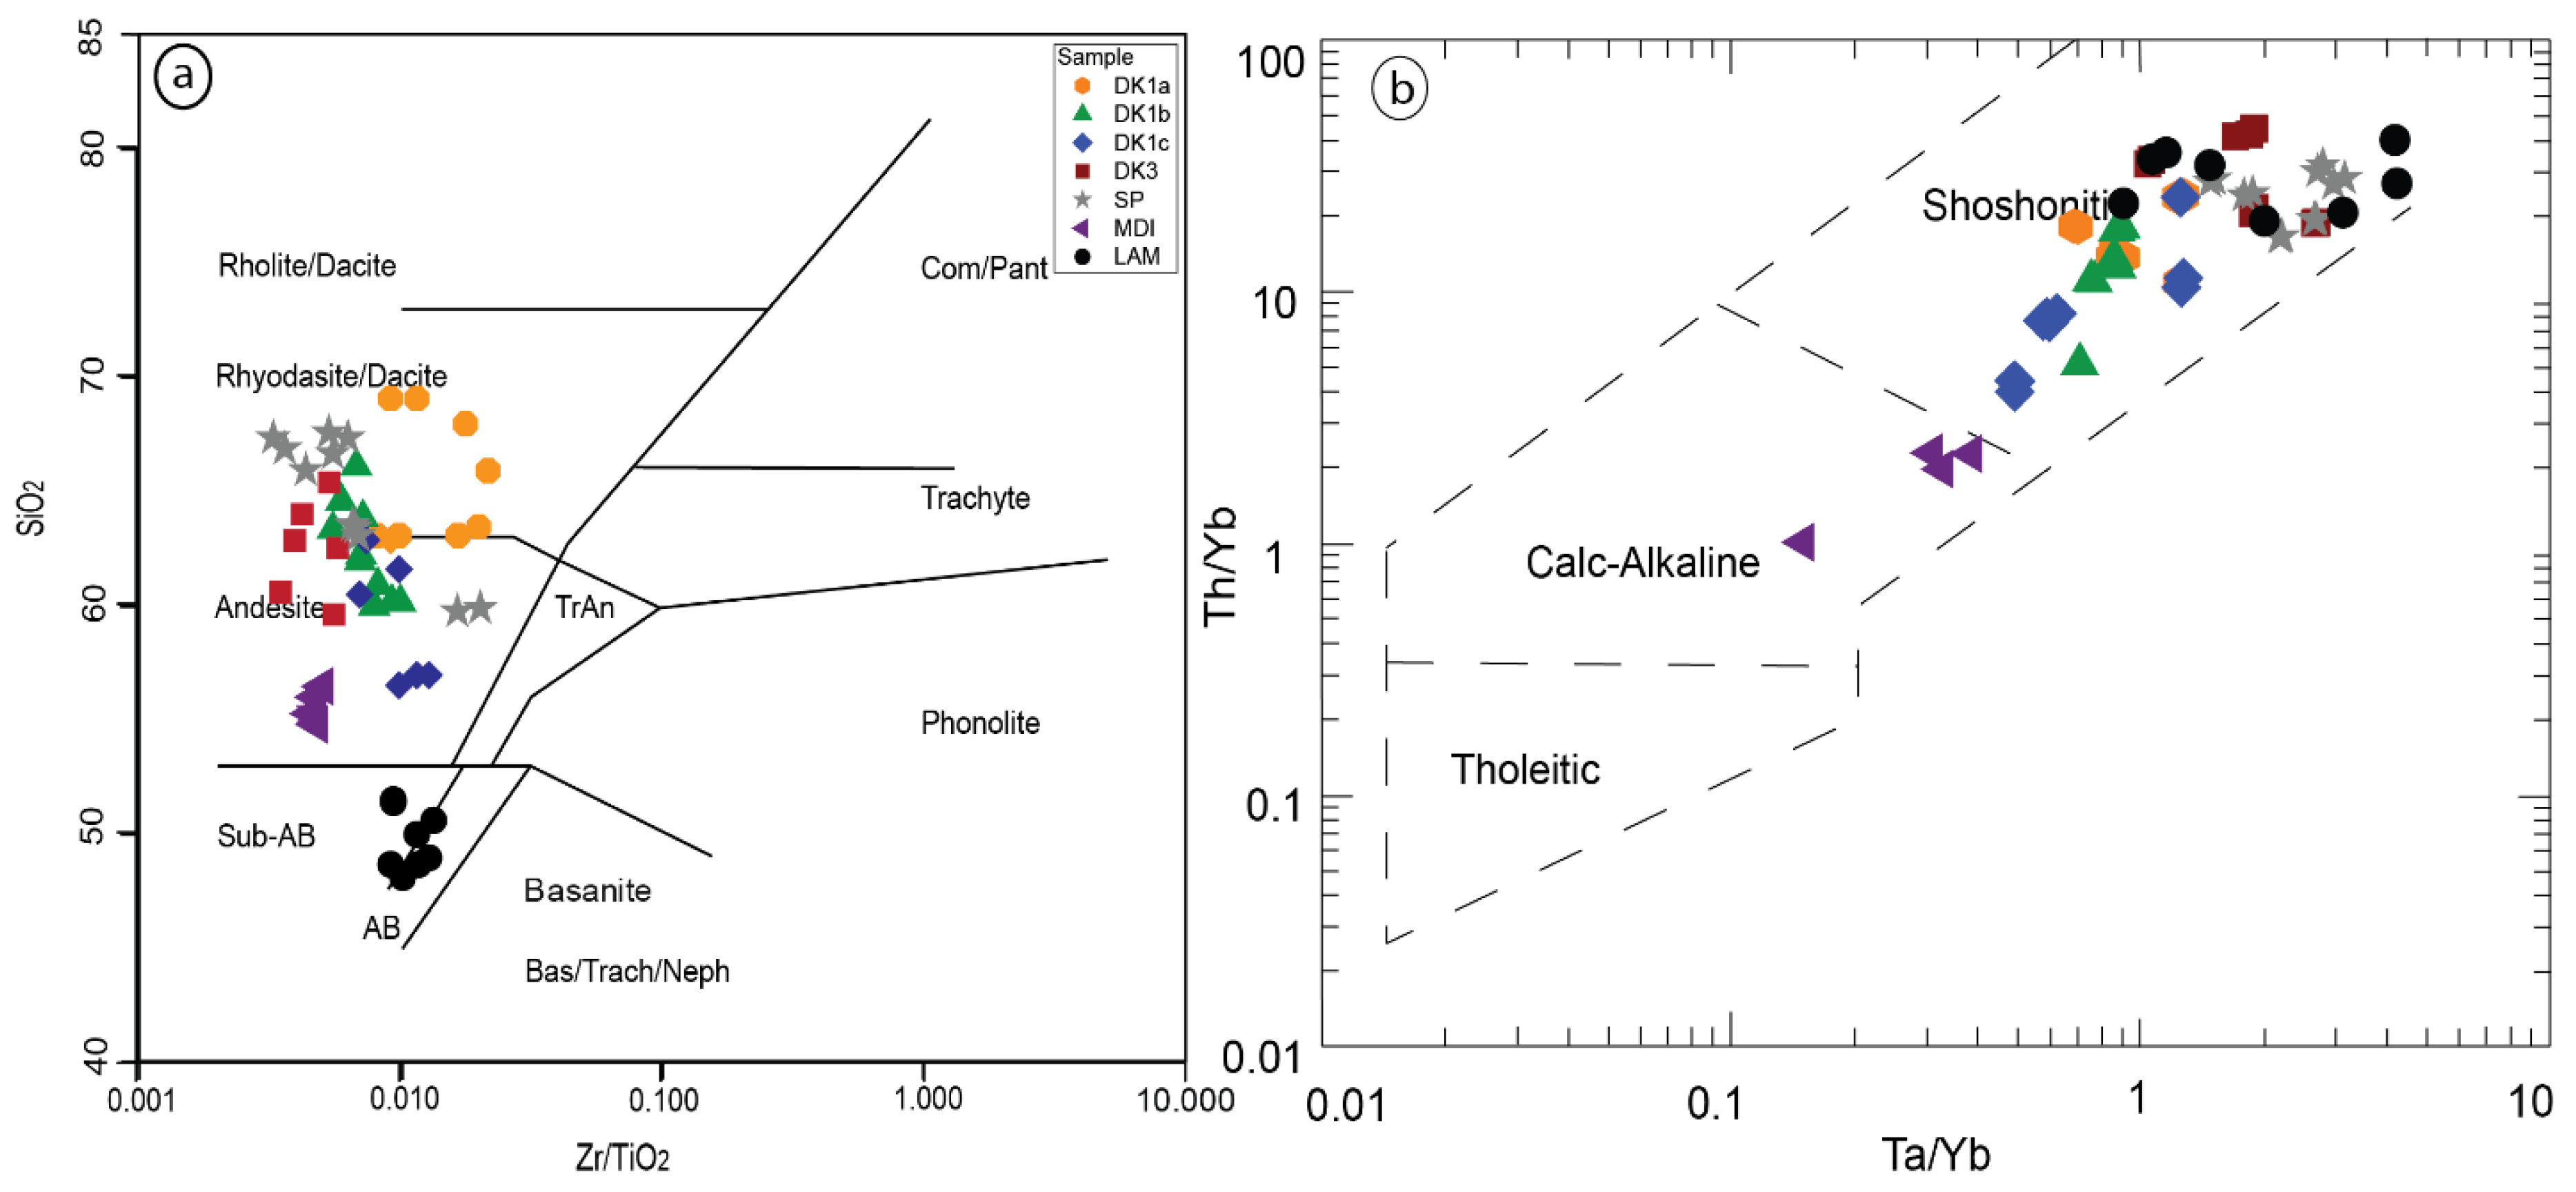
5.2.1. Trace Element Geochemistry
5.2.2. Nd-Sr Isotopes
5.2.3. Interpretations and Discussion
Tectonic Setting of the Sungun Stock and Post-Mineralization Dykes
Petrogenesis of Quartz Monzonite Stock, Quartz Diorite and Diorite Dykes
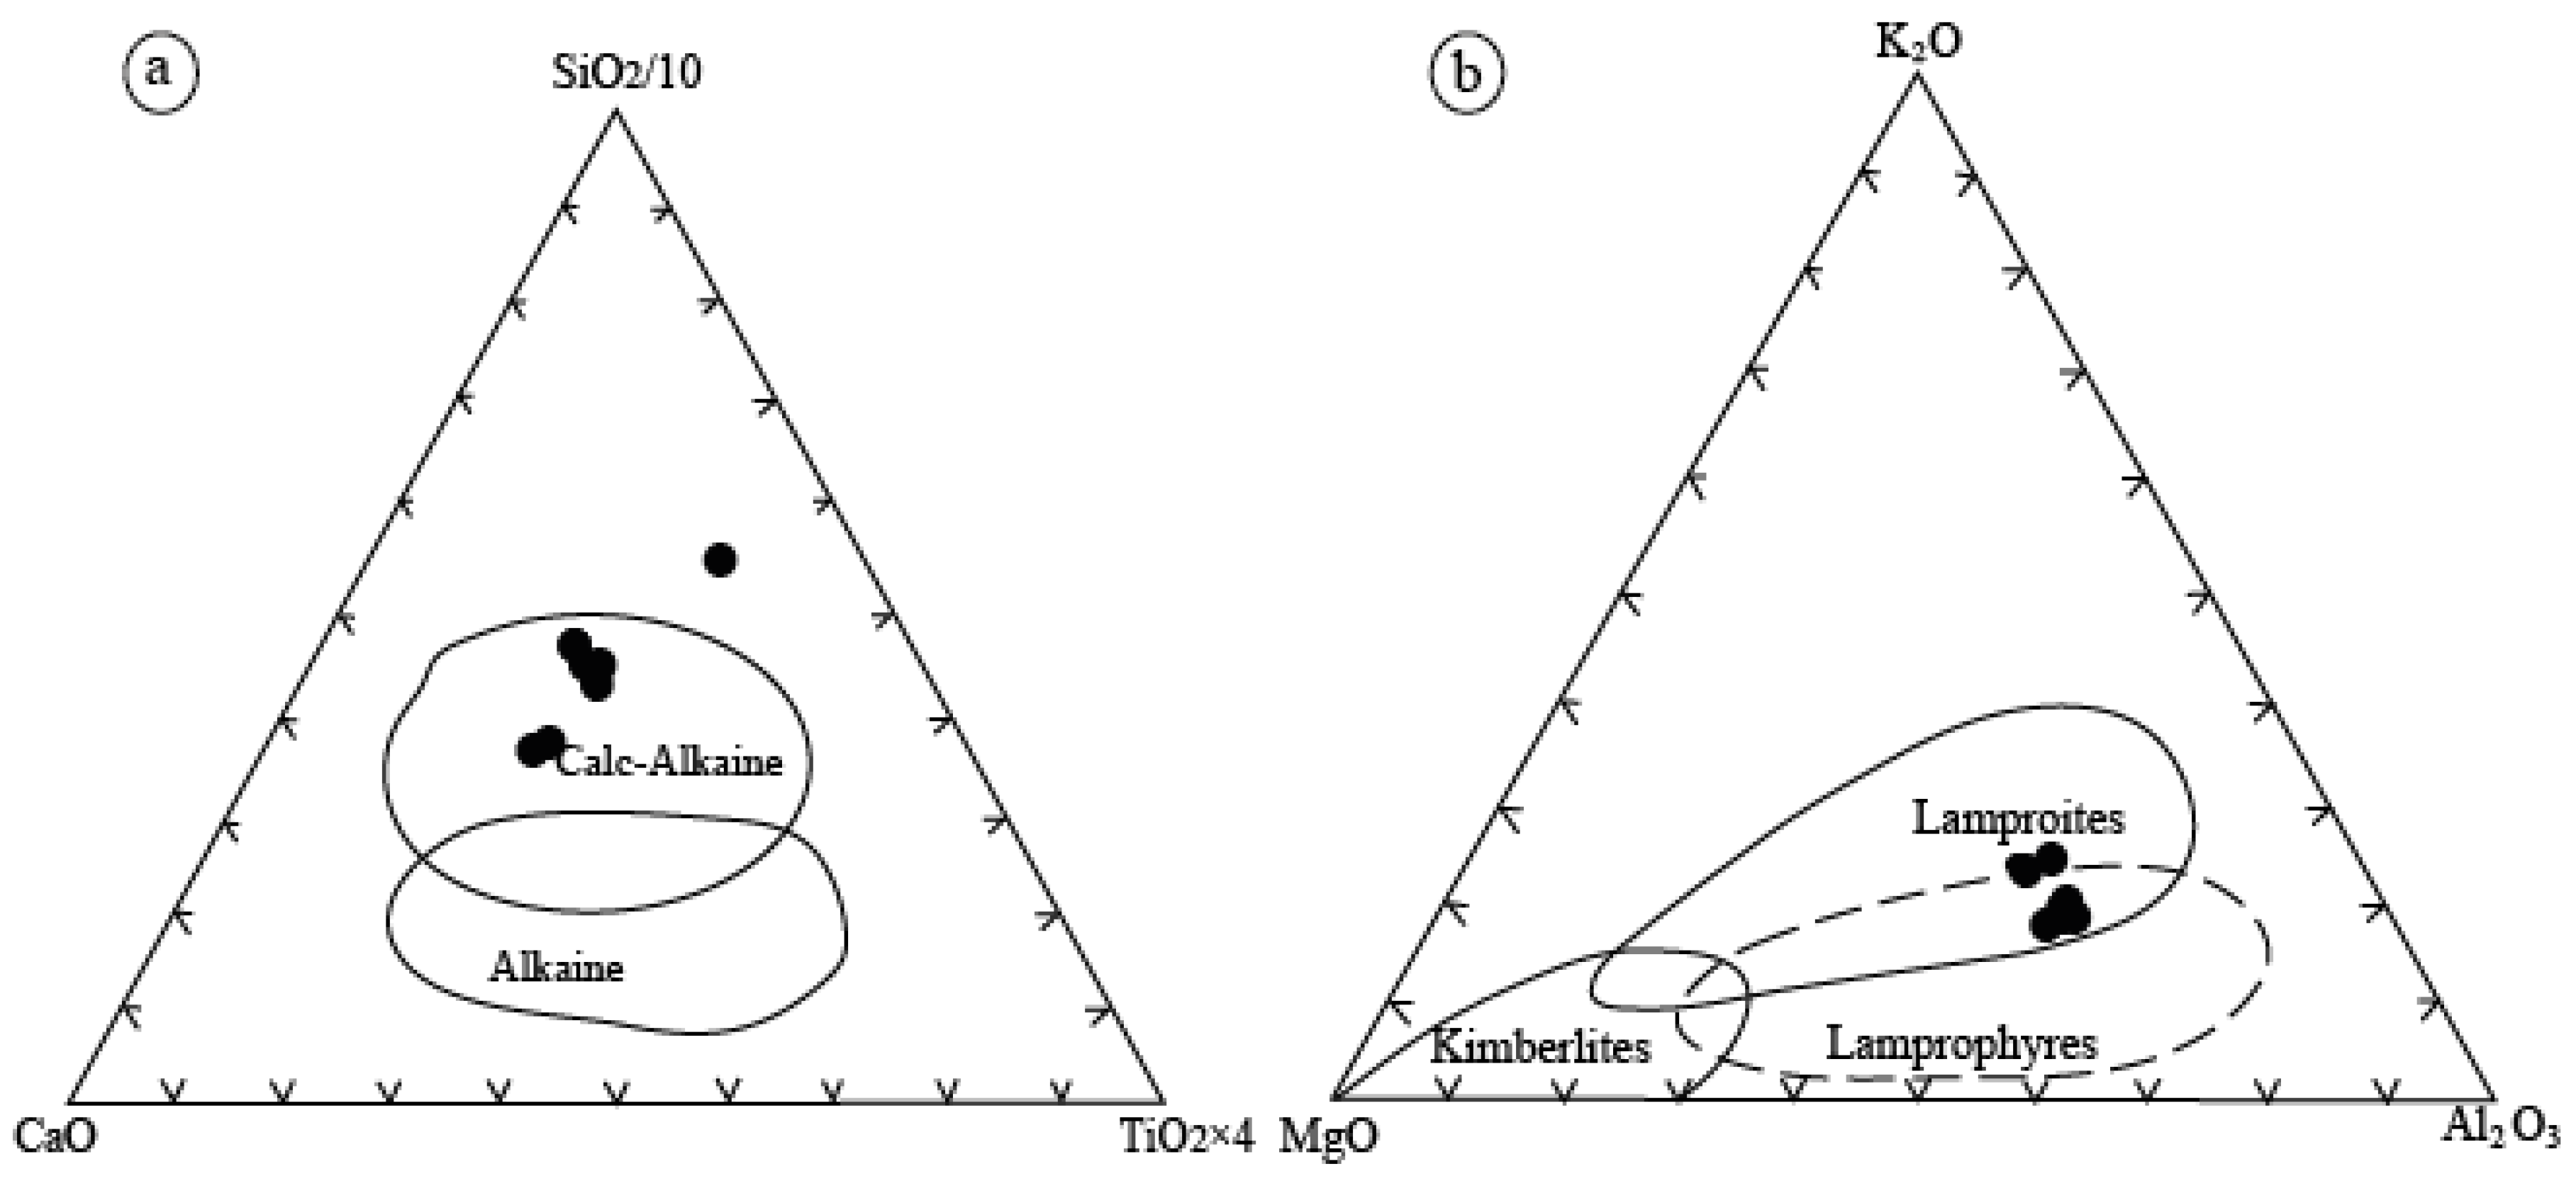
Petrogenesis of Lamprophyre Dykes
Petrogenesis of Microdirite Dykes
6. Conclusions
Author Contributions
Funding
Acknowledgments
Conflicts of Interest
References
- Haghipour, A.; Saidi, A.; Aganabati, A. International Geological Map of the Middle East 1:5,000,000, 2nd ed.; Geological Survey of Iran (GSI) and Commission of the Geological Map of the World (CGMW); UNESCO: Paris, France, 2009. [Google Scholar]
- Berger, B.R.; Ayuso, R.A.; Wynn, J.C.; Seal, R.R. Preliminary model of porphyry copper deposits. US Geol. Surv. Open File Rep. 2008, 1321, 55. [Google Scholar]
- Zürcher, L.; Bookstrom, A.A.; Hammarstrom, J.M.; Mars, J.C.; Ludington, S.; Zientek, M.L.; Dunlap, P.; Wallis, J.C.; Drew, L.J.; Sutphin, D.M.; et al. Porphyry Copper Assessment of the Tethys Region of Western and Southern Asia: Chapter V in Global Mineral Resource Assessment; US Geological Survey: Reston, VA, USA, 2015.
- Leaman, P.; Staude, J.M. Metallogenic evolution of the Western Tethys of Turkey and Iran; Metal Mining Agency of Japan, Mineral Resources Information Center: Tokyo, Japan, 2002; pp. 15–16.
- Calagari, A.A. Stable isotope (S, O, H and C) studies of the phyllic and potassic–phyllic alteration zones of the porphyry copper deposit at Sungun, East Azarbaidjan, Iran. J. Asian Earth Sci. 2003, 21, 767–780. [Google Scholar] [CrossRef]
- Hezarkhani, A. Petrology of the intrusive rocks within the Sungun porphyry copper deposit, Azerbaijan, Iran. J. Asian Earth Sci. 2006, 27, 326–340. [Google Scholar] [CrossRef]
- Richards, J.P.; Sholeh, A. The Tethyan tectonic history and Cu-Au metallogeny of Iran. Econ. Geol. Spec. Publ. 2016, 19, 193–212. [Google Scholar]
- Moshefi, P.; Hosseinzadeh, M.R.; Moayyed, M.; Lentz, D.R. Comparative study of mineral chemistry of four biotite types as geochemical indicators of mineralized and barren intrusions in the Sungun Porphyry Cu-Mo deposit, northwestern Iran. Ore Geol. Rev. 2018, 97, 1–20. [Google Scholar] [CrossRef]
- Sillitoe, R.H. Porphyry copper systems. Econ. Geol. 2010, 105, 3–41. [Google Scholar] [CrossRef]
- Maanijou, M.; Mostaghimi, M.; Abdollahi Riseh, M.; Sepahi, A.A. Systematic sulfur stable isotope and fluid inclusion studies on veinlet groups in the Sarcheshmeh porphyry copper deposit: Based on new data. J. Econ. Geol. 2012, 4, 217–239. [Google Scholar]
- Mohammadi Laghab, H.; Taghipour, N.; Iranmanesh, M.R. Distribution pattern of Cu, Mo, Pb, Zn and Fe elements in Sara (Parkam) porphyry copper deposit, Shahr–Babak, Kerman Province. Iran J. Geol. 2012, 5, 17–28. [Google Scholar]
- Ravankhah, A.; Moayyed, M.; Amini, S.; Hosseinzadeh, G.H.; Hemmatjoo, A. Studies of geology, petrology, economic geology and alteration zones in porphyry copper deposit of Dareh-zar (southwest of Kerman). Iran J. Geol. 2010, 3, 63–75. [Google Scholar]
- Moayyed, M. Geological and Exploration Operations Report of Haftcheshme Copper Deposit; National Copper Company of Iran and Pars Olang Engineering Consultant Company: Tehran, Iran, 2008. [Google Scholar]
- Etminan, H. A porphyry copper-molybdenum deposit near the Sungun village. Iran. Geol. Surv. Intern. Rep. 1977, 1, 24. [Google Scholar]
- Emami, M.; Babakhani, A. Studies of geology, petrology, and litho-geochemistry of Sungun Cu–Mo deposit. Iran Minist. Mines Met. 1991, 61, 50–63. [Google Scholar]
- Gaderi, M. Economic Geology Study of Sungun Copper Copper Deposit. Master’s Thesis, Shahid Beheshti University, Tehran, Iran, 1991. [Google Scholar]
- Mehrpartou, M. Contributions to the Geology, Geochemistry, Ore Genesis and Fluid Inclusion Investigations on Sungun Cu-Mo Porphyry Deposit (North-West of Iran). Ph.D. Thesis, University Hamburg, Hamburg, Germany, 1993. [Google Scholar]
- Izadyar, J. The Study of Petrography and Petrology of Igneous Rocks Sungun Deposit Area. Master’s Thesis, Shahid Beheshti University, Tehran, Iran, 1995. [Google Scholar]
- Calagari, A.A. Geochemical, Stable Isotope, Noble Gas and Fluid Inclusion Studies of Mineralization and Alteration at Sungun Porphyry Copper Deposit, East Azarbaidjan, Iran: Implications for Genesis. Ph.D. Thesis, University of Manchester, Manchester, UK, 1997. [Google Scholar]
- Hezarkhani, A.; Williams-Jones, A.E. Controls of alteration and mineralization in the Sungun porphyry copper deposit, Iran; evidence from fluid inclusions and stable isotopes. Econ. Geol. 1998, 93, 651–670. [Google Scholar] [CrossRef]
- Calagari, A. Concentration Variations of Major and Minor Elements across Various Alteration Zones in Porphyry Copper Deposit at Sungun, East Azarbaidjan, Iran. J. Sci. Islam. Repub. Iran 2003, 14, 27–36. [Google Scholar]
- Calagari, A.A.; Hosseinzadeh, G. The mineralogy of copper-bearing skarn to the east of the Sungun-Chay river, East-Azarbaidjan, Iran. J. Asian Earth Sci. 2006, 28, 423–438. [Google Scholar] [CrossRef]
- Moayyed, M. Petrographic and Mineralographic Report of Sungun Copper Deposit, 1st ed.; Pars Olang Engineering Company: Tehran, Iran, 2004. [Google Scholar]
- Hamedi, A. Study of Sungun Porphyry Copper Deposit Structures with a Particular Perspective on the Administration and Distribution Mechanisms of Dykes, in GEOLOGY; University of Tabriz: Tabriz, Iran, 2007. [Google Scholar]
- Hassanpour, S. Metallogeny and Mineralization of Copper and Gold in Arasbaran Zone (Eastern Azerbaijan) in Geology. Ph.D. Thesis, Shahid Beheshti University, Tehran, Iran, 2010. [Google Scholar]
- Alavi, G. Study of the Skarn Deposits Around the Sheyvar-Dagh Batolith and Comparision with the Sungun Porphyry Skarn, in Geology. Ph.D. Thesis, University of Tabriz, Tabriz, Iran, 2014. [Google Scholar]
- Aghazadeh, M.; Hou, Z.; Badrzadeh, Z.; Zhou, L. Temporal–spatial distribution and tectonic setting of porphyry copper deposits in Iran: Constraints from zircon U–Pb and molybdenite Re–Os geochronology. Ore Geol. Rev. 2015, 70, 385–406. [Google Scholar] [CrossRef]
- Kamali, A. Petrology and Mineral Chemistry of Post Mineralization Dykes of SUNGUN Cu-Mo Porphyry Deposit, North of Varzegan, East Azerbaijan. Ph.D. Thesis, University of Tabriz, Tabriz, Iran, 2016. [Google Scholar]
- Kamali, A.; Moayyed, M.; Amel, N.; Hosseinzadeh, M. Mineral chemistry and geochemistry of lamprophyric dykes in the Sungun Cu–Mo porphyry deposit (Varzaghan–Northwestern Iran). Geosci. Sci. Q. J. 2017, 26, 73–90. [Google Scholar]
- Kamali, A.; Mohsen, M.; Amel, N.; Hosainzadeh, M. Mineralogy and mineral chemistry of quartz-dioritic dykes of Sungun Mo–Cu porphyry deposit (NW Iran). Iran. J. Crystallogr. Miner. 2017, 25, 123–138. [Google Scholar]
- Deer, W.A.; Howie, R.A.; Zussman, J. An Introduction to the Rock-Forming Minerals; Longman Scientific & Technical: Hong Kong, 1992; Volume 2. [Google Scholar]
- Leake, B.E. Nomenclature of amphiboles. Miner. Mag. 1978, 49, 533–563. [Google Scholar] [CrossRef]
- Leake, B.E.; Woolley, A.R.; Arps, C.E.; Birch, W.D.; Gilbert, M.C.; Grice, J.D.; Hawthorne, F.C.; Kato, A.; Kisch, H.J.; Krivovichev, V.G.; Linthout, K. Nomenclature of amphiboles: Report of the subcommittee on amphiboles of the international mineralogical association commission on new minerals and mineral names. Miner. Mag. 1997, 61, 295–321. [Google Scholar] [CrossRef]
- Rieder, M.; Cavazzini, G.; D’yakonov, Y.S.; Frank-Kamenetskii, V.A.; Gottardi, G.; Guggenheim, S.; Koval’, P.V.; Mueller, G.; Neiva, A.M.; Radoslovich, E.W.; et al. Nomenclature of the micas. Clays Clay Miner. 1998, 46, 586–595. [Google Scholar] [CrossRef]
- Winchester, J.; Floyd, P. Geochemical discrimination of different magma series and their differentiation products using immobile elements. Chem. Geol. 1977, 20, 325–343. [Google Scholar] [CrossRef]
- Pearce, J.A. Trace element characteristics of lavas from destructive plate boundaries. Andesites 1982, 8, 525–548. [Google Scholar]
- Rock, N.M.S. The nature and origin of lamprophyres: An overview. Geol. Soc. Lond. Spec. Publ. 1987, 30, 191–226. [Google Scholar] [CrossRef]
- Bergman, S.C. Lamproites and other potassium-rich igneous rocks: A review of their occurrence, mineralogy and geochemistry. Geol. Soc. Lond. Spec. Publ. 1987, 30, 103–190. [Google Scholar] [CrossRef]
- Boynton, W.V. Cosmochemistry of the rare earth elements: Meteorite studies. In Developments in Geochemistry; Henserson, P., Ed.; Elsevier: Amsterdam, The Netherlands, 1984; Volume 2, pp. 63–114. [Google Scholar] [CrossRef]
- Martin, H. Adakitic magmas: Modern analogues of Archaean granitoids. Lithos 1999, 46, 411–429. [Google Scholar] [CrossRef]
- Woodhead, J.; Eggins, S.; Gamble, J. High field strength and transition element systematics in island arc and back-arc basin basalts: Evidence for multi-phase melt extraction and a depleted mantle wedge. Earth Planet. Sci. Lett. 1993, 114, 491–504. [Google Scholar] [CrossRef]
- Gust, D.A.; Arculus, R.J.; Kersting, A.B. Aspects of magma sources and processes in the Honshu arc. Can. Miner. 1997, 35, 347–365. [Google Scholar]
- McDonough, W.F.; Sun, S.-S. The composition of the Earth. Chem. Geol. 1995, 120, 223–253. [Google Scholar] [CrossRef]
- Villa, I.M.; De Bièvre, P.; Holden, N.E.; Renne, P.R. IUPAC-IUGS recommendation on the half-life of 87 Rb. Geochim. ET Cosmochim. Acta 2015, 164, 382–385. [Google Scholar] [CrossRef]
- Zindler, A.; Hart, S. Chemical geodynamics. Annu. Rev. Earth Planet. Sci. 1986, 14, 493–571. [Google Scholar] [CrossRef]
- Müller, D.; Groves, D.I. Potassic Igneous Rocks and Associated Gold-Copper Mineralization; Springer: Berlin, Germany, 2000; Volume 252. [Google Scholar]
- Müller, D.; Rock, N.; Groves, D. Geochemical discrimination between shoshonitic and potassic volcanic rocks in different tectonic settings: A pilot study. Miner. Pet. 1992, 46, 259–289. [Google Scholar] [CrossRef]
- Peccerillo, A. Potassic and ultrapotassic rocks: Compositional characteristics, petrogenesis and geologic significance. Episodes 1992, 15, 243–251. [Google Scholar]
- Foley, S.F.; Wheller, G.E. Parallels in the origin of the geochemical signatures of island arc volcanics and continental potassic igneous rocks: The role of residual titanates. Chem. Geol. 1990, 85, 1–18. [Google Scholar] [CrossRef]
- Sajona, F.G.; Maury, R.C.; Bellon, H.; Cotten, J.; Defant, M. High Field Strength Element Enrichment of Pliocene—Pleistocene Island Arc Basalts, Zamboanga Peninsula, Western Mindanao (Philippines). J. Pet. 1996, 37, 693–726. [Google Scholar] [CrossRef]
- Fitton, J.G.; James, D.; Leeman, W.P. Basic magmatism associated with late Cenozoic extension in the western United States: Compositional variations in space and time. J. Geophys. Res. Solid Earth 1991, 96, 13693–13711. [Google Scholar] [CrossRef]
- Pearce, J.A. Role of the sub-continental lithosphere in magma genesis at active continental margins. In Continental Basalts and Mantle Xenoliths; Hawkesworth, C.J., Norry, M.J., Eds.; Shiva Publications: Nantwich, UK, 1983; pp. 230–249. [Google Scholar]
- Condie, K.C. Geochemical changes in baslts and andesites across the Archean-Proterozoic boundary: Identification and significance. Lithos 1989, 23, 1–18. [Google Scholar] [CrossRef]
- Berberian, M.; King, G. Towards a paleogeography and tectonic evolution of Iran: Reply. Can.J. Earth Sci. 1981, 18, 1764–1766. [Google Scholar] [CrossRef]
- Mohajjel, M.; Fergusson, C.; Sahandi, M. Cretaceous–Tertiary convergence and continental collision, Sanandaj–Sirjan zone, western Iran. J. Asian Earth Sci. 2003, 21, 397–412. [Google Scholar] [CrossRef]
- Shahabpour, J. Island-arc affinity of the Central Iranian volcanic belt. J. Asian Earth Sci. 2007, 30, 652–665. [Google Scholar] [CrossRef]
- Henderson, P. Rare Earth Element Geochemistry; Elsevier Science: New York, NY, USA, 1984; pp. 652–665. [Google Scholar]
- McKenzie, D.; O’nions, R. Partial melt distributions from inversion of rare earth element concentrations. J. Pet. 1991, 32, 1021–1091. [Google Scholar] [CrossRef]
- Furman, T.; Graham, D. Erosion of lithospheric mantle beneath the East African Rift system: Geochemical evidence from the Kivu volcanic province. Lithos 1999, 48, 237–262. [Google Scholar] [CrossRef]
- Wilson, B.M. Igneous Petrogenesis a Global Tectonic Approach; Springer: Berlin, Germany, 2007. [Google Scholar]
- Dilek, Y.; Imamverdiyev, N.; Altunkaynak, Ş. Geochemistry and tectonics of Cenozoic volcanism in the Lesser Caucasus (Azerbaijan) and the peri-Arabian region: Collision-induced mantle dynamics and its magmatic fingerprint. Int. Geol. Rev. 2010, 52, 536–578. [Google Scholar] [CrossRef]
- Aydin, F.; Karsli, O.; Chen, B. Petrogenesis of the Neogene alkaline volcanics with implications for post-collisional lithospheric thinning of the Eastern Pontides, NE Turkey. Lithos 2008, 104, 249–266. [Google Scholar] [CrossRef]
- Sun, S.-S.; McDonough, W.-S. Chemical and isotopic systematics of oceanic basalts: Implications for mantle composition and processes. Geol. Soc. Lond. Spec. Publ. 1989, 42, 313–345. [Google Scholar] [CrossRef]
- Widdowson, M.; Pringle, M.; Fernandez, O. A post K–T boundary (Early Palaeocene) age for Deccan-type feeder dykes, Goa, India. J. Pet. 2000, 41, 1177–1194. [Google Scholar] [CrossRef]
- Moayyed, M. Petrologic Studies of Tertiary Volcano-Plutonic Belt in Western Alborz-Azerbaijan, with a Special Focus on Hashtchin Area, Iran. Ph.D. Thesis, University of Shahid Beheshti, Tehran, Iran, 2001. [Google Scholar]
- Sheikholeslami, M.R.; Piqu, A.; Mobayen, E.P.; Sabzehi, M.; Bellon, H.; Emami, M.H. Tectono–metamorphic evolution of the Neyriz metamorphic complex, Quri–Kor–e Sefid area (Sanandaj–Sirjan Zone, SW Iran). J. Asian Earth Sci. 2008, 31, 504–521. [Google Scholar] [CrossRef]
- Agard, P.; Monie, P.; Gerber, W.; Omrani, J.; Molinaro, M.; Meyer, B.; Labrousse, L.; Jolivet, L.; Yamato, P. Transient, synobduction exhumation of Zagros blueschists inferred from P–T, deformation time and kinematic constraints: Implications for Neotethyan wedge dynamics. Geophys. Res. 2006, 111, 11401. [Google Scholar] [CrossRef]
- Alavi, M. Tectono-stratigraphic syntethesis and structural style of the Alborz mountain system in northern Iran. J. Geodyn. 1996, 21, 1–33. [Google Scholar] [CrossRef]
- Alavi, M. Regional stratigraphy of the Zagros fold thrust belt of Iran and its proforland evolution. Am. J. Sci. 2004, 304, 1–20. [Google Scholar] [CrossRef]
- Mohajjel, M.; Fergusson, C.L.; Sahandi, M.R. Deformation history, micro-structure and P-T-t path in ALS-bearing schists, southeast Hamaan, Sanandaj-Sirjan zone, Iran. J. Geol. Soc. Iran 2006, 1, 11–19. [Google Scholar]
- Mehdipour Ghazi, J.; Moazzen, M.; Rahgoshay, M.; Shafaii Moghadam, S. Geochemicl characterstics of basaltic rocks from the Nain ophiolite (Central Iran): Constraints on mantle wedge source evolution in an oceanic back arc basin and a geodynamical model. Tectonophysics 2012, 574–575, 92–104. [Google Scholar] [CrossRef]
- Aldanmaz, E.; Pearce, J.A.; Thirlwall, M.F.; Mitchell, J.G. Petrogenetic evolution of late Cenozoic, post-collision volcanism in western Anatolia, Turkey. J. Volcanol. Geotherm. Res. 2000, 102, 67–95. [Google Scholar] [CrossRef]
- Hofmann, A.W.; Jochum, K.P.; Seufert, M.; White, W.M. Nb and Pb in oceanic basalts: New constraints on mantle evolution. Earth Planet. Sci. Lett. 1986, 79, 33–45. [Google Scholar] [CrossRef]
- Hofmann, A. Mantle geochemistry: The message from oceanic volcanism. Nature 1997, 385, 219. [Google Scholar] [CrossRef]
- Hofmann, A.W. Chemical differentiation of the Earth: The relationship between mantle, continental crust, and oceanic crust. Earth Planet. Sci. Lett. 1988, 90, 297–314. [Google Scholar] [CrossRef]
- Bradshaw, T.; Smith, E.I. Polygenetic Quaternary volcanism at Crater Flat, Nevada. J. Volcanol. Geotherm. Res. 1994, 63, 165–182. [Google Scholar] [CrossRef]
- Smith, E.I.; Sanchez, A.; Walker, J.D.; Wang, K. Geochemistry of mafic magmas in the Hurricane Volcanic field, Utah: Implications for small-and large-scale chemical variability of the lithospheric mantle. J. Geol. 1999, 107, 433–448. [Google Scholar] [CrossRef]
- Chen, W.; Arculus, R. Geochemical and isotopic characteristics of lower crustal xenoliths, San Francisco Volcanic Field, Arizona, USA. Lithos 1995, 36, 203–225. [Google Scholar] [CrossRef]
- Weaver, B.L.; Wood, D.A.; Tarney, J.; Joron, J.L. Geochemistry of ocean island basalts from the south Atlantic: Ascension, Bouvet, St. Helena, Gough and Tristan da Cunha. Geol. Soc. Lond. Spec. Publ. 1987, 30, 253–267. [Google Scholar] [CrossRef]
- Haase, K.M.; Mühe, R.; Stoffers, P. Magmatism during extension of the lithosphere: Geochemical constraints from lavas of the Shaban Deep, northern Red Sea. Chem. Geol. 2000, 166, 225–239. [Google Scholar] [CrossRef]
- Menzies, M.A.; Kyle, P.R.; Jones, M.; Ingram, G. Enriched and depleted source components for tholeiitic and alkaline lavas from Zuni-Bandera, New Mexico: Inferences about intraplate processes and stratified lithosphere. J. Geophys. Res. Solid Earth 1991, 96, 13645–13671. [Google Scholar] [CrossRef]
- Abdel-Rahman, A.F.; Nassar, P.E. Cenozoic volcanism in the Middle East: Petrogenesis of alkali basalts from northern Lebanon. Geol. Mag. 2004, 141, 545–563. [Google Scholar] [CrossRef]


| Sample | DK1a | DK1b | DK1c | DK3 | LAM | MDI | ||||||
|---|---|---|---|---|---|---|---|---|---|---|---|---|
| a1 | a2 | b1 | b2 | c1 | c2 | k2 | k2 | L1 | L2 | M2 | M3 | |
| SiO2 | 68.71 | 68.56 | 62.75 | 61.94 | 58.93 | 57.42 | 56.41 | 56.56 | 68.92 | 68.77 | 67.7 | 66.77 |
| TiO2 | 0 | 0 | 0 | 0 | 0 | 0 | 0 | 0 | 0 | 0 | 0 | 0 |
| Al2O3 | 20.43 | 20.19 | 21.71 | 20.73 | 25.1 | 26.95 | 26.83 | 26.36 | 20.46 | 20.51 | 20.05 | 20.41 |
| Cr2O3 | 0 | 0 | 0 | 0 | 0 | 0 | 0 | 0 | 0 | 0 | 0 | 0 |
| FeO | 0.03 | 0.03 | 0.59 | 0.56 | 0.25 | 0.24 | 0.41 | 0.42 | 0.01 | 0.01 | 0.2 | 0.07 |
| MnO | 0 | 0 | 0 | 0.01 | 0 | 0 | 0.01 | 0 | 0 | 0 | 0 | 0.03 |
| MgO | 0 | 0 | 0.44 | 0.44 | 0 | 0 | 0.02 | 0.03 | 0 | 0 | 0.05 | 0.02 |
| CaO | 0.11 | 0.09 | 2.7 | 4.13 | 7.02 | 8.3 | 9.65 | 9.25 | 0.57 | 0.57 | 0.45 | 0.23 |
| Na2O | 11.2 | 11.64 | 10.51 | 10.77 | 6.99 | 6.49 | 6.01 | 6.36 | 10.94 | 11.31 | 11.01 | 10.99 |
| K2O | 0.07 | 0.1 | 0.39 | 0.33 | 0.52 | 0.39 | 0.62 | 0.6 | 0.11 | 0.11 | 0.33 | 0.56 |
| Total | 100.55 | 100.6 | 99.09 | 98.91 | 98.81 | 99.79 | 99.96 | 99.58 | 101.01 | 101.28 | 99.79 | 99.08 |
| Si | 2.98 | 2.98 | 2.81 | 2.8 | 2.66 | 2.58 | 2.55 | 2.56 | 2.98 | 2.97 | 2.97 | 2.95 |
| Ti | 0 | 0 | 0 | 0 | 0 | 0 | 0 | 0 | 0 | 0 | 0 | 0 |
| Al | 1.04 | 1.03 | 1.15 | 1.11 | 1.34 | 1.43 | 1.43 | 1.41 | 1.04 | 1.04 | 1.04 | 1.06 |
| Cr | 0 | 0 | 0 | 0 | 0 | 0 | 0 | 0 | 0 | 0 | 0 | 0 |
| Fe2+ | 0 | 0 | 0.02 | 0.02 | 0.01 | 0.01 | 0.02 | 0.02 | 0 | 0 | 0.01 | 0 |
| Mn | 0 | 0 | 0 | 0 | 0 | 0 | 0 | 0 | 0 | 0 | 0 | 0 |
| Mg | 0 | 0 | 0.03 | 0.03 | 0 | 0 | 0 | 0 | 0 | 0 | 0 | 0 |
| Ca | 0 | 0 | 0.13 | 0.2 | 0.34 | 0.4 | 0.47 | 0.45 | 0.03 | 0.03 | 0.02 | 0.01 |
| Na | 0.94 | 0.98 | 0.91 | 0.95 | 0.61 | 0.57 | 0.53 | 0.56 | 0.92 | 0.95 | 0.94 | 0.94 |
| K | 0 | 0.01 | 0.02 | 0.02 | 0.03 | 0.02 | 0.04 | 0.03 | 0.01 | 0.01 | 0.02 | 0.03 |
| Total | 4.97 | 5 | 5.08 | 5.13 | 4.99 | 5 | 5.02 | 5.03 | 4.97 | 4.99 | 4.99 | 5 |
| Or | 0.43 | 0.55 | 2.09 | 1.64 | 3.02 | 2.28 | 3.47 | 3.33 | 0.65 | 0.64 | 1.87 | 3.22 |
| Ab | 99.05 | 99.03 | 85.74 | 81.16 | 62.37 | 57.26 | 51.15 | 53.6 | 96.55 | 96.68 | 95.97 | 95.66 |
| An | 0.51 | 0.41 | 12.17 | 17.2 | 34.61 | 40.46 | 45.38 | 43.08 | 2.8 | 2.68 | 2.15 | 1.12 |
| Sample | DK1b | DK1c | DK3 | LAM | ||||||||
|---|---|---|---|---|---|---|---|---|---|---|---|---|
| b1 | b2 | b3 | c2 | c3 | c4 | 3.2 | 3.3 | 3.4 | L1 | L2 | L3 | |
| SiO2 | 46.81 | 46.67 | 46.66 | 46.04 | 46.72 | 46.59 | 43.26 | 47.85 | 47.36 | 46.28 | 45.68 | 44.64 |
| TiO2 | 1.13 | 1.24 | 0.93 | 1.65 | 1.59 | 1.70 | 2.99 | 1.31 | 1.29 | 1.10 | 1.20 | 1.29 |
| Al2O3 | 7.96 | 8.53 | 8.67 | 8.77 | 8.35 | 8.53 | 10.56 | 7.02 | 7.29 | 7.90 | 8.13 | 8.79 |
| FeO | 14.70 | 15.39 | 15.39 | 13.97 | 12.62 | 12.68 | 12.02 | 11.50 | 11.57 | 14.13 | 14.65 | 15.23 |
| MnO | 0.32 | 0.38 | 0.37 | 0.13 | 0.10 | 0.08 | 0.24 | 0.33 | 0.34 | 0.33 | 0.34 | 0.30 |
| MgO | 13.36 | 13.59 | 13.61 | 13.41 | 14.11 | 13.96 | 14.52 | 16.45 | 16.18 | 13.86 | 13.37 | 13.06 |
| CaO | 11.43 | 11.44 | 11.27 | 12.62 | 12.94 | 12.65 | 11.25 | 10.51 | 10.59 | 11.24 | 11.14 | 11.27 |
| Na2O | 1.72 | 1.44 | 1.43 | 1.76 | 1.81 | 1.91 | 2.52 | 1.34 | 1.43 | 1.41 | 1.57 | 1.68 |
| K2O | 1.02 | 1.06 | 1.02 | 0.07 | 0.06 | 0.04 | 1.02 | 0.40 | 0.41 | 0.87 | 0.96 | 0.98 |
| Total | 100.53 | 101.85 | 101.46 | 100.51 | 100.40 | 100.24 | 100.48 | 98.82 | 98.56 | 99.19 | 99.10 | 99.30 |
| T | ||||||||||||
| Si | 6.74 | 6.63 | 6.64 | 6.60 | 6.68 | 6.66 | 6.17 | 6.81 | 6.76 | 6.71 | 6.66 | 6.51 |
| Al(IV) | 1.26 | 1.37 | 1.36 | 1.41 | 1.32 | 1.34 | 1.77 | 1.18 | 1.23 | 1.29 | 1.34 | 1.49 |
| Ti | 0.00 | 0.00 | 0.00 | 0.00 | 0.00 | 0.00 | 0.06 | 0.02 | 0.01 | 0.00 | 0.00 | 0.00 |
| Total | 8.00 | 8.00 | 8.00 | 8.00 | 8.00 | 8.00 | 8.00 | 8.00 | 8.00 | 8.00 | 8.00 | 8.00 |
| C | ||||||||||||
| Al(VI) | 0.09 | 0.05 | 0.09 | 0.08 | 0.08 | 0.10 | 0.00 | 0.00 | 0.00 | 0.06 | 0.05 | 0.02 |
| Ti | 0.12 | 0.13 | 0.10 | 0.18 | 0.17 | 0.18 | 0.26 | 0.12 | 0.13 | 0.12 | 0.13 | 0.14 |
| Fe3+ | 0.96 | 1.11 | 1.17 | 0.99 | 0.86 | 0.88 | 1.31 | 1.25 | 1.26 | 1.07 | 1.10 | 1.23 |
| Mg | 2.87 | 2.88 | 2.89 | 2.86 | 3.01 | 2.98 | 3.09 | 3.49 | 3.45 | 3.00 | 2.90 | 2.84 |
| Fe2+ | 0.81 | 0.72 | 0.66 | 0.69 | 0.64 | 0.63 | 0.12 | 0.12 | 0.12 | 0.65 | 0.69 | 0.63 |
| Mn2+ | 0.04 | 0.05 | 0.05 | 0.02 | 0.01 | 0.01 | 0.03 | 0.02 | 0.04 | 0.04 | 0.04 | 0.04 |
| Total | 4.89 | 4.94 | 4.95 | 4.81 | 4.78 | 4.79 | 4.81 | 5.00 | 5.00 | 4.93 | 4.92 | 4.89 |
| B | ||||||||||||
| Ca | 1.76 | 1.74 | 1.72 | 1.94 | 1.98 | 1.94 | 1.72 | 1.60 | 1.62 | 1.75 | 1.74 | 1.76 |
| Na | 0.24 | 0.26 | 0.28 | 0.06 | 0.02 | 0.06 | 0.28 | 0.37 | 0.38 | 0.25 | 0.26 | 0.24 |
| Total | 2.00 | 2.00 | 2.00 | 2.00 | 2.00 | 2.00 | 2.00 | 1.99 | 2.00 | 2.00 | 2.00 | 2.00 |
| A | ||||||||||||
| Na | 0.24 | 0.14 | 0.11 | 0.43 | 0.48 | 0.47 | 0.42 | 0.00 | 0.02 | 0.14 | 0.18 | 0.24 |
| Ca | 0.00 | 0.00 | 0.00 | 0.00 | 0.00 | 0.00 | 0.00 | 0.00 | 0.00 | 0.00 | 0.00 | 0.00 |
| K | 0.19 | 0.19 | 0.19 | 0.01 | 0.01 | 0.01 | 0.19 | 0.07 | 0.08 | 0.16 | 0.18 | 0.18 |
| Total | 0.43 | 0.33 | 0.30 | 0.44 | 0.49 | 0.48 | 0.60 | 0.07 | 0.09 | 0.30 | 0.36 | 0.42 |
| Sample | DK1c | LAM | ||||||
|---|---|---|---|---|---|---|---|---|
| AB4 | AB5 | AB6 | AB7 | a1 | a2 | a3 | a4 | |
| SiO2 | 37.56 | 37.37 | 36.88 | 36.49 | 38.14 | 38.06 | 37.95 | 37.98 |
| TiO2 | 4.37 | 4.26 | 4.32 | 4.22 | 3.68 | 3.52 | 3.73 | 3.53 |
| Al2O3 | 14.2 | 14.3 | 14.13 | 14.12 | 14.86 | 14.4 | 14.41 | 14.52 |
| Cr2O3 | 0 | 0 | 0 | 0 | 0 | 0 | 0 | 0 |
| FeO | 13.66 | 13.85 | 13.48 | 13.5 | 16.13 | 16.16 | 16.21 | 15.19 |
| MnO | 0.14 | 0.15 | 0.13 | 0.15 | 0.08 | 0.08 | 0.07 | 0.06 |
| MgO | 16.56 | 16.4 | 15.51 | 15.6 | 14.94 | 14.6 | 14.55 | 15.2 |
| CaO | 0.03 | 0.04 | 0.01 | 0.02 | 0 | 0.01 | 0.02 | 0.01 |
| Na2O | 0.42 | 0.4 | 0.56 | 0.58 | 0.01 | 0.02 | 0.04 | 0.03 |
| K2O | 8.16 | 7.83 | 8.3 | 8.14 | 9.38 | 9.3 | 9.29 | 9.52 |
| BaO | 0 | 0 | 0 | 0 | 0 | 0 | 0 | 0 |
| F | 0.38 | 0.31 | 0.37 | 0.36 | 0.53 | 0.35 | 0.44 | 0.91 |
| Cl | 0.13 | 0.13 | 0.12 | 0.12 | 0.18 | 0.18 | 0.19 | 0.19 |
| O=F, Cl | 0.19 | 0.16 | 0.18 | 0.18 | 0.26 | 0.19 | 0.23 | 0.43 |
| Total | 95.8 | 95.2 | 93.99 | 93.48 | 98.19 | 96.87 | 97.13 | 97.53 |
| Formula 11(O) | ||||||||
| Si | 2.77 | 2.77 | 2.78 | 2.76 | 2.79 | 2.81 | 2.8 | 2.8 |
| Ti | 0.24 | 0.24 | 0.24 | 0.24 | 0.2 | 0.2 | 0.21 | 0.2 |
| Al | 1.23 | 1.25 | 1.25 | 1.26 | 1.28 | 1.25 | 1.25 | 1.26 |
| Cr | 0 | 0 | 0 | 0 | 0 | 0 | 0 | 0 |
| Fe3+ | 0.08 | 0.09 | 0.08 | 0.09 | 0.1 | 0.1 | 0.1 | 0.09 |
| Fe2+ | 0.76 | 0.77 | 0.76 | 0.77 | 0.89 | 0.9 | 0.9 | 0.84 |
| Mn | 0.01 | 0.01 | 0.01 | 0.01 | 0 | 0.01 | 0 | 0 |
| Mg | 1.82 | 1.81 | 1.74 | 1.76 | 1.63 | 1.61 | 1.6 | 1.67 |
| Ca | 0 | 0 | 0 | 0 | 0 | 0 | 0 | 0 |
| Na | 0.06 | 0.06 | 0.08 | 0.08 | 0 | 0 | 0.01 | 0 |
| K | 0.77 | 0.74 | 0.8 | 0.79 | 0.87 | 0.88 | 0.88 | 0.9 |
| Ba | 0 | 0 | 0 | 0 | 0 | 0 | 0 | 0 |
| Total | 7.74 | 7.73 | 7.75 | 7.76 | 7.76 | 7.75 | 7.75 | 7.77 |
| Mg/Fe + Mg | 0.68 | 0.68 | 0.67 | 0.67 | 0.62 | 0.62 | 0.62 | 0.64 |
| Sample | DK1a-96 | DK1a-553 | DK1a-156 | DK1a-330 | DK1a-A1 | DK1a-A2 | DK1a-A3 | DK1a-A4 | DK1a-A5 | DK1a-A6 | DK1b-A1 |
| SiO2 | 67.85 | 62.91 | 65.71 | 63.24 | 62.89 | 62.77 | 62.91 | 62.98 | 69.18 | 69.24 | 62.10 |
| Al2O3 | 14.12 | 14.07 | 14.17 | 15.45 | 15.01 | 14.96 | 14.86 | 14.93 | 15.58 | 15.55 | 15.06 |
| CaO | 4.09 | 5.71 | 4.55 | 5.12 | 3.44 | 3.47 | 2.26 | 2.29 | 0.36 | 0.39 | 4.12 |
| Fe2O3 | 2.02 | 2.28 | 1.61 | 1.91 | 3.82 | 3.78 | 3.81 | 3.91 | 3.65 | 3.48 | 4.26 |
| FeO | 2.02 | 2.79 | 1.74 | 2.16 | 2.53 | 2.49 | 1.83 | 1.89 | 2.56 | 2.49 | 2.61 |
| K2O | 2.78 | 2.36 | 3.69 | 3.39 | 3.38 | 3.29 | 4.48 | 4.51 | 2.96 | 2.98 | 2.71 |
| MgO | 1.51 | 2.08 | 1.47 | 1.78 | 2.13 | 2.17 | 2.61 | 2.58 | 1.56 | 1.52 | 2.38 |
| MnO | 0.10 | 0.09 | 0.11 | 0.12 | 0.07 | 0.06 | 0.02 | 0.04 | 0.05 | 0.04 | 0.08 |
| Na2O | 3.69 | 2.67 | 2.34 | 2.49 | 4.18 | 4.12 | 4.06 | 4.02 | 3.41 | 3.49 | 4.12 |
| P2O5 | 0.28 | 0.19 | 0.18 | 0.17 | 0.24 | 0.23 | 0.26 | 0.31 | 0.24 | 0.26 | 0.29 |
| TiO2 | 0.48 | 0.54 | 0.42 | 0.46 | 0.48 | 0.51 | 0.52 | 0.56 | 0.43 | 0.38 | 0.53 |
| LOI | 1.98 | 2.86 | 3.12 | 3.42 | 3.81 | 2.98 | 1.06 | 0.98 | 1.01 | 0.96 | 3.68 |
| Total | 100.92 | 98.55 | 99.11 | 99.71 | 101.98 | 100.83 | 98.68 | 99 | 100.99 | 100.78 | 101.94 |
| Ag | 0.03 | 0.05 | 0.04 | 0.06 | 0.11 | 0.13 | 0.28 | 0.31 | 0.07 | 0.08 | 0.10 |
| As | 11.30 | 10.80 | 11.70 | 12.20 | |||||||
| Au | 0.02 | 0.02 | 0.02 | 0.03 | |||||||
| Ba | 810.00 | 780.00 | 1120.00 | 1080.00 | 1028.00 | 1036.00 | 1241.00 | 1248.00 | 471.00 | 468.00 | 854.00 |
| Be | 1.55 | 1.49 | 1.58 | 1.61 | |||||||
| Bi | 0.08 | 0.06 | 0.09 | 0.11 | 0.21 | 0.23 | 4.10 | 4.20 | 0.20 | 0.30 | 0.10 |
| Cd | 0.02 | 0.03 | 0.01 | 0.04 | 0.08 | 0.09 | 0.16 | 0.18 | 0.21 | 0.19 | 0.07 |
| Ce | 57.00 | 52.00 | 61.40 | 55.00 | 53.20 | 53.70 | 71.80 | 71.20 | 68.20 | 68.40 | 62.40 |
| Co | 8.40 | 9.10 | 9.70 | 8.60 | 10.60 | 10.90 | 14.60 | 14.30 | 8.60 | 8.90 | 12.80 |
| Cr | 10.00 | 12.00 | 17.00 | 16.00 | 26.00 | 27.00 | 41.00 | 43.00 | 24.00 | 23.00 | 41.00 |
| Cs | 1.79 | 1.68 | 1.77 | 1.81 | 1.30 | 1.20 | 2.10 | 2.20 | 3.70 | 3.90 | 1.70 |
| Cu | 31.70 | 32.60 | 35.70 | 28.20 | 81.70 | 83.00 | 951.00 | 942.00 | 3906.00 | 38.80 | 151.00 |
| Dy | 2.03 | 2.01 | 2.06 | 2.04 | 1.86 | 1.85 | 1.92 | 1.91 | 2.03 | 2.01 | 2.38 |
| Er | 1.04 | 1.05 | 1.04 | 1.06 | 1.09 | 1.12 | 1.01 | 1.03 | 1.12 | 1.14 | 1.36 |
| Eu | 0.85 | 0.88 | 0.82 | 0.86 | 0.94 | 0.96 | 1.44 | 1.47 | 1.03 | 1.07 | 1.22 |
| Ga | 17.15 | 17.12 | 16.91 | 17.36 | 15.30 | 15.50 | 16.70 | 16.40 | 16.10 | 16.30 | 16.40 |
| Gd | 2.54 | 2.53 | 2.51 | 2.57 | 2.61 | 2.63 | 3.14 | 3.16 | 3.08 | 3.11 | 3.26 |
| Ge | 0.25 | 0.21 | 0.26 | 0.29 | |||||||
| Hf | 2.20 | 2.30 | 2.10 | 2.50 | 1.37 | 1.39 | 1.12 | 1.11 | 1.36 | 1.34 | 1.31 |
| Ho | 0.39 | 0.36 | 0.39 | 0.39 | 0.41 | 0.43 | 0.35 | 0.37 | 0.41 | 0.43 | 0.53 |
| In | 0.02 | 0.02 | 0.02 | 0.02 | |||||||
| La | 31.90 | 29.70 | 32.60 | 28.70 | 29.80 | 30.10 | 40.30 | 40.50 | 39.60 | 39.80 | 37.10 |
| Li | 8.50 | 8.20 | 7.80 | 8.30 | |||||||
| Lu | 0.16 | 0.17 | 0.16 | 0.15 | 0.18 | 0.16 | 0.38 | 0.41 | 0.17 | 0.18 | 0.21 |
| Mo | 2.77 | 2.61 | 2.88 | 2.77 | 3.30 | 3.50 | 3.50 | 3.60 | 2.30 | 2.50 | 1.20 |
| Nb | 13.90 | 13.20 | 12.80 | 14.10 | 10.80 | 10.90 | 13.70 | 13.50 | 6.70 | 6.60 | 12.40 |
| Nd | 20.70 | 20.20 | 20.80 | 20.70 | 19.70 | 19.90 | 29.30 | 29.50 | 26.60 | 26.80 | 24.80 |
| Ni | 10.90 | 11.70 | 12.20 | 10.80 | 21.00 | 22.00 | 31.00 | 32.00 | 22.00 | 24.00 | 27.00 |
| Pb | 19.20 | 20.70 | 18.40 | 19.20 | 19.90 | 19.70 | 14.30 | 14.60 | 41.10 | 40.90 | 17.30 |
| Pr | 5.66 | 5.59 | 5.61 | 5.63 | 5.71 | 5.73 | 8.05 | 8.07 | 7.53 | 7.55 | 6.92 |
| Rb | 75.00 | 79.10 | 72.60 | 81.20 | 67.50 | 67.60 | 99.30 | 99.40 | 122.10 | 122.30 | 56.70 |
| Re | 0.00 | 0.00 | 0.00 | 0.00 | |||||||
| S | 5200.00 | 6100.00 | 5700.00 | 6210.00 | |||||||
| Sb | 1.07 | 1.02 | 1.12 | 1.09 | |||||||
| Se | 5.80 | 5.40 | 5.60 | 5.90 | |||||||
| Sm | 3.22 | 3.21 | 3.24 | 3.29 | 3.08 | 3.09 | 4.18 | 4.21 | 4.03 | 4.05 | 3.78 |
| Sn | 0.70 | 0.60 | 0.70 | 0.80 | 0.90 | 0.70 | 1.40 | 1.60 | 0.80 | 0.90 | 1.10 |
| Sr | 598.00 | 612.00 | 589.00 | 608.00 | 607.00 | 604.00 | 691.00 | 694.00 | 188.00 | 191.00 | 845.00 |
| Ta | 0.87 | 0.88 | 0.82 | 0.85 | 1.36 | 1.38 | 1.18 | 1.16 | 0.68 | 0.71 | 0.98 |
| Tb | 0.33 | 0.32 | 0.31 | 0.35 | 0.39 | 0.37 | 0.41 | 0.44 | 0.41 | 0.43 | 0.46 |
| Te | 0.07 | 0.08 | 0.06 | 0.08 | |||||||
| Th | 13.10 | 12.90 | 13.60 | 13.50 | 11.70 | 11.90 | 21.70 | 21.90 | 17.70 | 17.90 | 14.10 |
| Tm | 0.15 | 0.13 | 0.15 | 0.16 | |||||||
| U | 3.70 | 3.40 | 3.50 | 3.90 | 5.61 | 5.58 | 11.61 | 11.58 | 6.82 | 6.84 | 5.09 |
| V | 62.00 | 69.00 | 59.00 | 64.00 | 77.00 | 78.00 | 66.00 | 67.00 | 59.00 | 58.00 | 81.00 |
| W | 3.90 | 3.20 | 3.80 | 3.10 | 3.10 | 3.30 | 3.60 | 3.80 | 1.40 | 1.70 | 2.20 |
| Y | 9.50 | 9.70 | 9.30 | 9.60 | 10.40 | 10.60 | 9.50 | 9.60 | 10.10 | 10.30 | 13.40 |
| Yb | 0.99 | 0.98 | 0.97 | 1.02 | 1.12 | 1.13 | 0.94 | 0.96 | 1.01 | 1.03 | 1.32 |
| Zn | 77.00 | 71.00 | 78.00 | 81.00 | 54.60 | 54.30 | 32.80 | 32.60 | 158.10 | 158.30 | 52.60 |
| Zr | 81.60 | 88.20 | 89.10 | 90.20 | 43.00 | 42.00 | 34.00 | 36.00 | 42.00 | 44.00 | 38.00 |
| Sample | DK1b-A2 | DK1b-A3 | DK1b-A4 | DK1b-A5 | DK1b-A6 | DK1b-128 | DK1b-593 | DK1b-615 | DK1b-200 | DK1c-558 | DK1c-351 |
| SiO2 | 61.98 | 60.08 | 59.98 | 60.71 | 60.08 | 63.81 | 64.61 | 66.20 | 63.19 | 60.12 | 62.19 |
| Al2O3 | 15.01 | 16.12 | 16.18 | 14.58 | 14.51 | 14.33 | 16.05 | 14.70 | 14.82 | 15.29 | 14.66 |
| CaO | 4.08 | 4.61 | 4.69 | 5.14 | 5.21 | 4.49 | 2.88 | 3.06 | 3.56 | 5.25 | 5.75 |
| Fe2O3 | 4.29 | 5.51 | 5.58 | 3.41 | 3.38 | 2.36 | 2.70 | 2.43 | 3.31 | 2.84 | 2.57 |
| FeO | 2.58 | 2.61 | 2.72 | 2.08 | 2.12 | 2.36 | 2.98 | 2.70 | 3.34 | 2.90 | 2.96 |
| K2O | 2.68 | 2.38 | 2.44 | 3.11 | 3.24 | 2.45 | 2.97 | 2.41 | 2.54 | 2.37 | 2.46 |
| MgO | 2.42 | 3.08 | 3.17 | 2.18 | 2.27 | 2.27 | 2.86 | 3.07 | 2.96 | 2.72 | 3.36 |
| MnO | 0.07 | 0.11 | 0.09 | 0.07 | 0.06 | 0.09 | 0.08 | 0.07 | 0.13 | 0.08 | 0.13 |
| Na2O | 4.08 | 4.49 | 4.51 | 4.77 | 4.73 | 4.46 | 2.78 | 2.84 | 3.01 | 4.23 | 2.78 |
| P2O5 | 0.31 | 0.31 | 0.32 | 0.27 | 0.29 | 0.23 | 0.19 | 0.21 | 0.22 | 0.26 | 0.24 |
| TiO2 | 0.51 | 0.61 | 0.59 | 0.49 | 0.46 | 0.52 | 0.62 | 0.58 | 0.64 | 0.63 | 0.58 |
| LOI | 3.06 | 2.18 | 1.98 | 3.81 | 3.23 | 1.92 | 1.22 | 1.70 | 2.28 | 2.81 | 2.31 |
| Total | 101.07 | 102.09 | 102.25 | 100.62 | 99.58 | 99.29 | 99.94 | 99.97 | 100 | 99.5 | 99.99 |
| Ag | 0.12 | 0.13 | 0.14 | 0.10 | 0.11 | 0.03 | 0.03 | 0.02 | 0.05 | 0.03 | 0.03 |
| As | 1.70 | 1.60 | 1.20 | 1.80 | 1.10 | 1.30 | |||||
| Au | 0.01 | 0.00 | 0.01 | 0.00 | 0.00 | 0.00 | |||||
| Ba | 856.00 | 724.00 | 726.00 | 857.00 | 859.00 | 860.00 | 921.00 | 1070.00 | 895.00 | 770.00 | 790.00 |
| Be | 1.31 | 1.29 | 1.33 | 1.38 | 1.09 | 1.09 | |||||
| Bi | 0.10 | 0.20 | 0.10 | 0.30 | 0.20 | 0.11 | 0.12 | 0.14 | 0.17 | 0.13 | 0.15 |
| Cd | 0.09 | 0.08 | 0.09 | 0.09 | 0.11 | 0.03 | 0.02 | 0.06 | 0.02 | 0.03 | 0.04 |
| Ce | 62.60 | 45.80 | 45.50 | 70.80 | 71.10 | 50.30 | 49.80 | 51.20 | 54.00 | 49.00 | 44.00 |
| Co | 12.90 | 16.20 | 16.50 | 9.10 | 9.30 | 10.90 | 10.70 | 9.80 | 11.20 | 13.50 | 12.80 |
| Cr | 40.00 | 27.00 | 28.00 | 31.00 | 33.00 | 31.00 | 33.00 | 28.00 | 39.00 | 27.00 | 26.00 |
| Cs | 1.60 | 0.60 | 0.70 | 1.10 | 1.30 | 0.60 | 0.62 | 0.71 | 0.62 | 0.66 | 0.61 |
| Cu | 153.00 | 144.00 | 143.00 | 127.00 | 128.00 | 68.00 | 58.10 | 62.60 | 48.10 | 49.60 | 45.20 |
| Dy | 2.41 | 2.46 | 2.43 | 2.27 | 2.29 | 2.12 | 2.16 | 2.13 | 2.11 | 2.56 | 2.48 |
| Er | 1.38 | 1.39 | 1.41 | 1.22 | 1.23 | 1.09 | 1.09 | 1.08 | 1.07 | 1.39 | 1.38 |
| Eu | 1.24 | 1.07 | 1.08 | 1.11 | 1.09 | 0.96 | 0.97 | 0.93 | 0.95 | 1.09 | 1.08 |
| Ga | 16.70 | 17.50 | 17.30 | 16.60 | 16.30 | 17.30 | 17.14 | 17.37 | 16.91 | 17.35 | 17.14 |
| Gd | 3.28 | 3.12 | 3.09 | 3.09 | 3.13 | 2.68 | 2.62 | 2.70 | 2.66 | 3.25 | 3.21 |
| Ge | 0.20 | 0.21 | 0.22 | 0.19 | 0.24 | 0.25 | |||||
| Hf | 1.33 | 1.92 | 1.95 | 1.46 | 1.49 | 1.30 | 1.20 | 1.30 | 1.10 | 1.70 | 1.60 |
| Ho | 0.52 | 0.52 | 0.51 | 0.46 | 0.48 | 0.40 | 0.42 | 0.47 | 0.44 | 0.51 | 0.53 |
| In | 0.04 | 0.03 | 0.04 | 0.03 | 0.04 | 0.03 | |||||
| La | 37.00 | 24.90 | 24.70 | 42.30 | 42.50 | 28.30 | 28.60 | 27.20 | 29.70 | 28.20 | 28.30 |
| Li | 10.00 | 10.30 | 9.80 | 9.30 | 9.70 | 9.50 | |||||
| Lu | 0.23 | 0.21 | 0.22 | 0.18 | 0.16 | 0.15 | 0.16 | 0.18 | 0.14 | 0.20 | 0.18 |
| Mo | 1.40 | 2.80 | 2.90 | 4.20 | 4.30 | 2.72 | 2.69 | 2.78 | 2.81 | 2.47 | 2.46 |
| Nb | 12.20 | 11.60 | 11.70 | 11.20 | 11.40 | 12.70 | 12.20 | 11.80 | 12.40 | 11.00 | 11.90 |
| Nd | 24.90 | 19.80 | 20.10 | 26.60 | 26.80 | 19.70 | 19.30 | 19.60 | 19.90 | 20.70 | 20.60 |
| Ni | 25.00 | 22.00 | 23.00 | 24.00 | 25.00 | 20.80 | 21.20 | 20.20 | 19.80 | 20.60 | 21.20 |
| Pb | 17.40 | 14.10 | 14.30 | 9.60 | 9.70 | 21.70 | 22.20 | 23.70 | 20.60 | 10.00 | 10.60 |
| Pr | 6.96 | 5.19 | 5.15 | 7.61 | 7.63 | 5.29 | 5.31 | 5.27 | 5.24 | 5.29 | 5.31 |
| Rb | 56.50 | 37.10 | 37.20 | 65.50 | 65.20 | 57.90 | 59.40 | 56.20 | 57.40 | 47.40 | 48.60 |
| Re | 0.00 | 0.00 | 0.00 | 0.00 | 0.00 | 0.00 | |||||
| S | 3100.00 | 3260.00 | 3310.00 | 3000.00 | 2000.00 | 2100.00 | |||||
| Sb | 0.81 | 0.84 | 0.91 | 0.77 | 0.55 | 0.59 | |||||
| Se | 8.00 | 8.20 | 8.60 | 7.80 | 10.70 | 10.20 | |||||
| Sm | 3.81 | 3.31 | 3.34 | 3.76 | 3.74 | 3.17 | 3.18 | 3.21 | 3.14 | 3.70 | 3.71 |
| Sn | 0.90 | 1.00 | 0.90 | 0.80 | 0.90 | 0.80 | 0.60 | 0.70 | 0.80 | 0.90 | 0.90 |
| Sr | 847.00 | 805.00 | 807.00 | 667.00 | 664.00 | 725.00 | 736.00 | 742.00 | 718.00 | 650.00 | 662.00 |
| Ta | 0.99 | 0.91 | 0.93 | 0.98 | 0.99 | 0.85 | 0.86 | 0.89 | 0.84 | 0.73 | 0.72 |
| Tb | 0.44 | 0.43 | 0.47 | 0.43 | 0.45 | 0.35 | 0.32 | 0.35 | 0.37 | 0.43 | 0.44 |
| Te | 0.05 | 0.05 | 0.07 | 0.05 | 0.05 | 0.06 | |||||
| Th | 13.90 | 6.50 | 6.60 | 19.20 | 19.40 | 12.80 | 12.60 | 12.40 | 12.90 | 9.60 | 9.40 |
| Tm | 0.15 | 0.14 | 0.15 | 0.17 | 0.19 | 0.18 | |||||
| U | 5.07 | 3.21 | 5.24 | 4.96 | 4.95 | 3.80 | 3.80 | 4.10 | 3.20 | 2.90 | 2.60 |
| V | 82.00 | 112.00 | 111.00 | 61.00 | 59.00 | 86.00 | 82.00 | 91.00 | 86.00 | 102.00 | 104.00 |
| W | 1.90 | 1.20 | 1.30 | 13.20 | 13.40 | 2.50 | 2.60 | 2.20 | 2.10 | 1.10 | 1.30 |
| Y | 13.20 | 13.10 | 12.90 | 12.50 | 12.30 | 9.80 | 9.40 | 9.30 | 8.90 | 13.10 | 13.20 |
| Yb | 1.31 | 1.31 | 1.33 | 1.14 | 1.12 | 1.02 | 1.01 | 1.03 | 0.99 | 1.26 | 1.27 |
| Zn | 52.80 | 70.90 | 70.70 | 43.10 | 43.30 | 64.00 | 61.00 | 58.00 | 62.00 | 51.00 | 48.00 |
| Zr | 36.00 | 58.00 | 60.00 | 39.00 | 37.00 | 37.40 | 36.40 | 39.10 | 35.20 | 50.50 | 51.70 |
| Sample | DK1c-417 | DK1c-145 | DK1c-A1 | DK1c-A2 | DK1c-A3 | DK1c-A4 | DK1c-A5 | DK1c-A6 | DK3–190 | DK3-103 | DK3-25 |
| SiO2 | 61.51 | 60.53 | 62.88 | 62.81 | 62.81 | 56.45 | 56.81 | 56.88 | 65.38 | 63.72 | 60.49 |
| Al2O3 | 14.89 | 14.62 | 15.01 | 14.89 | 14.81 | 16.31 | 15.13 | 15.21 | 12.62 | 14.21 | 13.70 |
| CaO | 5.82 | 6.92 | 3.44 | 3.41 | 2.26 | 6.12 | 6.01 | 5.98 | 6.27 | 5.86 | 7.17 |
| Fe2O3 | 2.95 | 2.96 | 3.81 | 3.78 | 3.81 | 6.07 | 6.12 | 6.08 | 1.83 | 2.28 | 2.92 |
| FeO | 3.46 | 3.69 | 2.61 | 2.58 | 1.81 | 3.14 | 2.71 | 2.68 | 1.83 | 2.78 | 3.43 |
| K2O | 2.99 | 2.08 | 3.31 | 3.28 | 4.48 | 1.93 | 2.03 | 2.01 | 0.16 | 2.04 | 1.92 |
| MgO | 3.13 | 3.82 | 2.13 | 2.24 | 2.48 | 3.68 | 4.81 | 4.79 | 2.07 | 3.32 | 4.02 |
| MnO | 0.12 | 0.12 | 0.07 | 0.08 | 0.03 | 0.10 | 0.12 | 0.12 | 0.10 | 0.09 | 0.15 |
| Na2O | 2.38 | 2.61 | 4.21 | 4.18 | 4.10 | 4.10 | 4.05 | 4.08 | 6.47 | 2.65 | 3.46 |
| P2O5 | 0.21 | 0.23 | 0.26 | 0.28 | 0.29 | 0.41 | 0.33 | 0.34 | 0.22 | 0.21 | 0.25 |
| TiO2 | 0.54 | 0.73 | 0.49 | 0.51 | 0.53 | 0.68 | 0.69 | 0.62 | 0.45 | 0.56 | 0.68 |
| LOI | 2.28 | 2.12 | 3.81 | 3.68 | 1.06 | 2.12 | 2.38 | 2.18 | 2.68 | 1.98 | 2.01 |
| Total | 100.28 | 100.43 | 102.03 | 101.72 | 98.47 | 101.11 | 101.19 | 100.97 | 100.08 | 99.7 | 100.2 |
| Ag | 0.02 | 0.05 | 0.10 | 0.11 | 0.28 | 0.08 | 0.12 | 0.11 | 0.06 | 0.06 | 0.09 |
| As | 1.10 | 1.60 | 5.20 | 5.40 | 4.80 | ||||||
| Au | 0.00 | 0.00 | 0.00 | 0.00 | 0.00 | ||||||
| Ba | 810.00 | 768.00 | 1032.00 | 1038.00 | 1245.00 | 586.00 | 677.00 | 672.00 | 30.00 | 45.00 | 48.00 |
| Be | 0.98 | 1.12 | 2.08 | 2.18 | 2.02 | ||||||
| Bi | 0.18 | 0.19 | 0.20 | 0.30 | 4.10 | 0.01 | 0.13 | 0.12 | 0.36 | 0.39 | 0.41 |
| Cd | 0.06 | 0.02 | 0.09 | 0.11 | 0.14 | 0.07 | 0.09 | 0.08 | 0.06 | 0.05 | 0.04 |
| Ce | 47.60 | 45.90 | 54.80 | 53.90 | 71.80 | 61.60 | 51.70 | 51.40 | 71.40 | 72.20 | 69.60 |
| Co | 13.90 | 14.00 | 10.90 | 11.10 | 14.80 | 19.10 | 23.20 | 23.60 | 4.70 | 4.60 | 4.40 |
| Cr | 31.00 | 28.00 | 27.00 | 28.00 | 41.00 | 34.00 | 122.00 | 121.00 | 50.00 | 52.00 | 48.00 |
| Cs | 0.72 | 0.77 | 1.20 | 1.30 | 2.20 | 0.50 | 0.60 | 0.70 | 0.21 | 0.24 | 0.26 |
| Cu | 43.10 | 39.70 | 83.30 | 84.60 | 943.00 | 57.00 | 101.00 | 107.00 | 48.80 | 46.40 | 41.10 |
| Dy | 2.52 | 2.57 | 1.86 | 1.88 | 1.96 | 3.12 | 3.11 | 3.14 | 1.35 | 1.36 | 1.35 |
| Er | 1.36 | 1.40 | 1.12 | 1.08 | 1.01 | 1.77 | 1.71 | 1.73 | 0.65 | 0.66 | 0.65 |
| Eu | 1.12 | 1.06 | 0.93 | 0.97 | 1.47 | 1.31 | 1.26 | 1.28 | 0.47 | 0.44 | 0.49 |
| Ga | 16.96 | 16.62 | 15.60 | 15.30 | 16.70 | 18.20 | 17.30 | 17.40 | 12.45 | 13.01 | 13.26 |
| Gd | 3.26 | 3.29 | 2.58 | 2.56 | 3.15 | 4.11 | 3.81 | 3.87 | 2.08 | 2.06 | 2.02 |
| Ge | 0.23 | 0.21 | 0.21 | 0.22 | 0.25 | ||||||
| Hf | 1.80 | 1.60 | 1.38 | 1.39 | 1.12 | 2.14 | 2.17 | 2.15 | 1.00 | 1.20 | 0.90 |
| Ho | 0.55 | 0.49 | 0.41 | 0.39 | 0.37 | 0.64 | 0.67 | 0.66 | 0.24 | 0.26 | 0.22 |
| In | 0.03 | 0.02 | 0.20 | 0.04 | 0.20 | ||||||
| La | 29.10 | 27.20 | 29.80 | 30.10 | 40.30 | 34.70 | 28.30 | 28.60 | 40.60 | 41.20 | 39.80 |
| Li | 8.70 | 9.10 | 2.30 | 2.20 | 2.60 | ||||||
| Lu | 0.21 | 0.23 | 0.18 | 0.16 | 0.38 | 0.27 | 0.28 | 0.29 | 0.07 | 0.06 | 0.08 |
| Mo | 2.32 | 2.37 | 3.30 | 3.60 | 3.70 | 2.20 | 1.70 | 1.60 | 3.31 | 3.41 | 3.51 |
| Nb | 10.80 | 11.40 | 10.80 | 10.90 | 13.70 | 11.60 | 12.30 | 12.40 | 15.50 | 16.70 | 15.20 |
| Nd | 20.90 | 20.30 | 19.80 | 19.90 | 29.30 | 27.30 | 23.20 | 23.60 | 23.90 | 23.80 | 23.40 |
| Ni | 21.70 | 20.60 | 21.00 | 23.00 | 31.00 | 31.00 | 42.00 | 69.00 | 26.90 | 27.60 | 26.20 |
| Pb | 11.20 | 9.80 | 19.70 | 19.30 | 14.30 | 11.90 | 7.20 | 7.60 | 9.90 | 9.60 | 8.90 |
| Pr | 5.26 | 5.28 | 5.81 | 5.77 | 8.31 | 7.21 | 6.06 | 6.12 | 7.37 | 7.32 | 7.39 |
| Rb | 50.10 | 51.70 | 67.30 | 67.50 | 99.30 | 37.80 | 39.40 | 40.10 | 2.70 | 2.90 | 3.40 |
| Re | 0.00 | 0.00 | 0.01 | 0.01 | 0.01 | ||||||
| S | 2400.00 | 1900.00 | 3300.00 | 3460.00 | 3100.00 | ||||||
| Sb | 0.48 | 0.52 | 1.92 | 1.69 | 1.88 | ||||||
| Se | 11.10 | 10.80 | 6.60 | 6.60 | 6.80 | ||||||
| Sm | 3.77 | 3.68 | 3.08 | 3.05 | 4.21 | 4.34 | 4.01 | 4.06 | 3.10 | 3.12 | 3.16 |
| Sn | 0.80 | 0.60 | 0.70 | 0.90 | 1.60 | 0.90 | 0.90 | 1.10 | 0.90 | 0.70 | 0.60 |
| Sr | 626.00 | 672.00 | 605.00 | 604.00 | 698.00 | 867.00 | 771.00 | 781.00 | 316.00 | 321.00 | 334.00 |
| Ta | 0.76 | 0.74 | 1.36 | 1.37 | 1.18 | 0.85 | 0.80 | 0.82 | 0.95 | 0.97 | 0.92 |
| Tb | 0.42 | 0.41 | 0.39 | 0.37 | 0.41 | 0.56 | 0.57 | 0.59 | 0.16 | 0.17 | 0.16 |
| Te | 0.07 | 0.05 | 0.27 | 0.26 | 0.29 | ||||||
| Th | 9.80 | 9.20 | 11.90 | 11.10 | 21.90 | 6.80 | 7.10 | 7.20 | 21.80 | 22.10 | 21.80 |
| Tm | 0.17 | 0.15 | 0.08 | 0.09 | 0.08 | ||||||
| U | 2.80 | 3.10 | 5.51 | 5.58 | 11.71 | 2.44 | 2.61 | 2.66 | 3.20 | 3.30 | 3.70 |
| V | 98.00 | 105.00 | 77.00 | 74.00 | 65.00 | 122.00 | 132.00 | 136.00 | 62.00 | 63.00 | 69.00 |
| W | 0.90 | 1.40 | 3.40 | 3.30 | 3.80 | 1.00 | 1.20 | 1.10 | 1.40 | 1.30 | 1.10 |
| Y | 13.70 | 13.60 | 10.52 | 10.53 | 9.58 | 16.60 | 17.20 | 17.30 | 6.80 | 6.50 | 6.90 |
| Yb | 1.24 | 1.26 | 1.09 | 1.11 | 0.96 | 1.76 | 1.66 | 1.69 | 0.51 | 0.52 | 0.55 |
| Zn | 54.00 | 42.00 | 54.10 | 54.90 | 32.80 | 89.30 | 80.50 | 81.20 | 24.00 | 21.00 | 23.00 |
| Zr | 53.20 | 50.60 | 43.00 | 44.00 | 39.00 | 69.00 | 78.00 | 81.00 | 24.00 | 23.70 | 22.60 |
| Sample | DK3-320 | DK3-A1 | DK3-A2 | DK3-A3 | DK3-A4 | DK3-A5 | DK3-A6 | MDI-416 | MDI-196 | MDI-132 | MDI-146 |
| SiO2 | 62.72 | 62.54 | 62.51 | 59.55 | 59.57 | 62.91 | 62.95 | 54.68 | 55.12 | 56.08 | 54.48 |
| Al2O3 | 13.81 | 15.18 | 15.21 | 14.61 | 14.58 | 14.88 | 14.86 | 16.06 | 16.16 | 15.81 | 16.12 |
| CaO | 6.48 | 2.91 | 2.94 | 5.58 | 5.56 | 4.02 | 4.01 | 10.12 | 9.98 | 9.36 | 9.82 |
| Fe2O3 | 2.88 | 2.51 | 2.48 | 4.51 | 4.48 | 2.12 | 2.08 | 3.68 | 3.74 | 3.47 | 3.55 |
| FeO | 3.18 | 1.28 | 1.31 | 1.51 | 1.48 | 1.21 | 1.18 | 5.02 | 5.08 | 4.71 | 4.82 |
| K2O | 2.14 | 7.32 | 7.38 | 3.21 | 3.18 | 2.41 | 2.38 | 2.94 | 2.96 | 2.88 | 2.86 |
| MgO | 3.38 | 2.58 | 2.64 | 3.81 | 3.78 | 2.61 | 2.65 | 3.53 | 3.62 | 3.72 | 3.62 |
| MnO | 0.11 | 0.02 | 0.02 | 0.12 | 0.10 | 0.06 | 0.05 | 0.13 | 0.14 | 0.13 | 0.14 |
| Na2O | 3.66 | 3.41 | 3.38 | 5.41 | 5.38 | 5.77 | 5.78 | 1.13 | 1.16 | 1.26 | 1.26 |
| P2O5 | 0.22 | 0.31 | 0.32 | 0.32 | 0.34 | 0.31 | 0.31 | 0.27 | 0.26 | 0.27 | 0.28 |
| TiO2 | 0.62 | 0.58 | 0.59 | 0.57 | 0.58 | 0.51 | 0.53 | 0.88 | 0.91 | 0.82 | 0.82 |
| LOI | 1.36 | 0.51 | 0.48 | 1.68 | 1.65 | 3.13 | 3.21 | 2.36 | 1.98 | 2.06 | 2.12 |
| Total | 100.56 | 99.15 | 99.26 | 100.88 | 100.68 | 99.94 | 99.99 | 100.8 | 101.11 | 100.57 | 99.89 |
| Ag | 0.06 | 0.25 | 0.23 | 0.22 | 0.21 | 0.13 | 0.11 | 0.07 | 0.08 | 0.09 | 0.06 |
| As | 4.60 | 2.70 | 2.90 | 2.61 | 3.10 | ||||||
| Au | 0.00 | 0.01 | 0.00 | 0.00 | 0.00 | ||||||
| Ba | 72.00 | 1128.00 | 1119.00 | 877.00 | 881.00 | 698.00 | 691.00 | 1310.00 | 1360.00 | 998.00 | 1240.00 |
| Be | 1.98 | 0.94 | 0.96 | 0.98 | 1.02 | ||||||
| Bi | 0.34 | 1.10 | 1.00 | 60.20 | 61.80 | 1.20 | 1.30 | 0.19 | 0.18 | 0.19 | 0.21 |
| Cd | 0.02 | 0.06 | 0.06 | 0.14 | 0.15 | 0.07 | 0.08 | 0.06 | 0.07 | 0.04 | 0.06 |
| Ce | 70.00 | 41.60 | 41.30 | 51.70 | 51.40 | 106.00 | 103.80 | 24.30 | 25.60 | 29.70 | 24.20 |
| Co | 5.10 | 5.30 | 5.40 | 10.70 | 10.80 | 5.10 | 5.30 | 27.90 | 29.10 | 28.60 | 27.00 |
| Cr | 54.00 | 52.00 | 53.00 | 88.00 | 91.00 | 54.00 | 57.00 | 4.00 | 6.00 | 7.00 | 3.00 |
| Cs | 0.19 | 0.50 | 0.60 | 0.20 | 0.30 | 0.80 | 0.80 | 6.85 | 6.94 | 6.15 | 5.91 |
| Cu | 38.70 | 470.00 | 477.00 | 39.60 | 38.80 | 89.10 | 87.40 | 79.00 | 75.10 | 41.20 | 38.20 |
| Dy | 1.37 | 1.66 | 1.64 | 1.53 | 1.57 | 1.88 | 1.91 | 3.75 | 3.72 | 3.77 | 3.71 |
| Er | 0.67 | 0.85 | 0.83 | 0.81 | 0.79 | 1.01 | 1.03 | 1.96 | 1.94 | 1.92 | 1.97 |
| Eu | 0.51 | 0.74 | 0.75 | 0.86 | 0.83 | 1.21 | 1.26 | 1.20 | 1.18 | 1.22 | 1.19 |
| Ga | 12.98 | 15.70 | 15.80 | 14.50 | 14.90 | 16.70 | 16.90 | 16.40 | 17.10 | 16.12 | 17.18 |
| Gd | 2.11 | 2.35 | 2.37 | 2.32 | 2.34 | 3.32 | 3.29 | 4.01 | 4.06 | 4.02 | 4.07 |
| Ge | 0.19 | 0.21 | 0.22 | 0.19 | 0.18 | ||||||
| Hf | 4.30 | 1.32 | 1.34 | 1.17 | 1.19 | 1.01 | 1.03 | 1.50 | 1.60 | 1.90 | 1.80 |
| Ho | 0.27 | 0.33 | 0.35 | 0.30 | 0.32 | 0.37 | 0.36 | 0.73 | 0.77 | 0.71 | 0.74 |
| In | 0.20 | 0.05 | 0.06 | 0.05 | 0.06 | ||||||
| La | 41.60 | 20.10 | 20.30 | 27.70 | 27.90 | 67.80 | 67.70 | 11.10 | 10.80 | 11.20 | 10.60 |
| Li | 2.40 | 16.30 | 16.70 | 16.20 | 16.90 | ||||||
| Lu | 0.07 | 0.16 | 0.14 | 0.11 | 0.09 | 0.15 | 0.13 | 0.30 | 0.31 | 0.33 | 0.29 |
| Mo | 3.44 | 1.20 | 1.40 | 2.10 | 2.30 | 1.20 | 1.10 | 0.77 | 0.78 | 0.79 | 0.81 |
| Nb | 16.10 | 18.40 | 18.20 | 20.50 | 20.70 | 11.90 | 12.10 | 5.10 | 5.20 | 5.80 | 4.60 |
| Nd | 23.10 | 18.80 | 18.90 | 20.70 | 20.50 | 34.80 | 34.60 | 15.00 | 15.60 | 14.90 | 15.40 |
| Ni | 25.70 | 41.00 | 44.00 | 51.00 | 53.00 | 38.00 | 36.00 | 3.50 | 3.20 | 3.40 | 4.10 |
| Pb | 9.40 | 18.10 | 18.30 | 11.40 | 11.60 | 16.70 | 16.40 | 14.80 | 13.20 | 14.10 | 13.60 |
| Pr | 7.31 | 4.81 | 4.81 | 5.89 | 5.93 | 10.71 | 10.78 | 3.27 | 3.29 | 3.24 | 3.30 |
| Rb | 4.20 | 67.80 | 68.10 | 18.90 | 18.20 | 46.00 | 47.00 | 97.60 | 99.20 | 91.60 | 89.40 |
| Re | 0.01 | 0.00 | 0.00 | 0.00 | 0.00 | ||||||
| S | 3400.00 | 1800.00 | 1600.00 | 1600.00 | 1460.00 | ||||||
| Sb | 1.96 | 0.98 | 0.92 | 0.91 | 0.86 | ||||||
| Se | 6.20 | 13.10 | 13.60 | 12.80 | 12.40 | ||||||
| Sm | 3.08 | 2.85 | 2.87 | 2.98 | 3.01 | 4.32 | 4.28 | 3.67 | 3.64 | 3.66 | 3.61 |
| Sn | 0.70 | 4.60 | 4.40 | 1.20 | 1.10 | 0.90 | 0.70 | 0.80 | 0.90 | 0.80 | 0.60 |
| Sr | 298.00 | 288.00 | 291.00 | 354.00 | 355.00 | 707.00 | 709.00 | 234.00 | 226.00 | 237.00 | 216.00 |
| Ta | 0.96 | 1.93 | 1.94 | 1.29 | 1.31 | 0.94 | 0.95 | 0.27 | 0.26 | 0.27 | 0.31 |
| Tb | 0.19 | 0.34 | 0.35 | 0.32 | 0.30 | 0.43 | 0.45 | 0.57 | 0.52 | 0.56 | 0.58 |
| Te | 0.24 | 0.05 | 0.04 | 0.05 | 0.06 | ||||||
| Th | 21.40 | 13.20 | 13.30 | 14.20 | 14.00 | 28.90 | 28.70 | 1.80 | 1.90 | 1.60 | 1.80 |
| Tm | 0.09 | 0.30 | 0.31 | 0.33 | 0.29 | ||||||
| U | 2.90 | 4.36 | 4.34 | 8.08 | 8.05 | 9.36 | 9.41 | 0.50 | 0.50 | 0.70 | 0.60 |
| V | 62.00 | 84.00 | 85.00 | 89.00 | 90.00 | 63.00 | 66.00 | 176.00 | 171.00 | 168.00 | 171.00 |
| W | 1.60 | 3.60 | 3.50 | 1.70 | 1.80 | 7.20 | 7.80 | 1.10 | 1.20 | 0.90 | 1.20 |
| Y | 6.60 | 7.99 | 8.01 | 6.96 | 6.99 | 10.51 | 10.48 | 18.80 | 18.20 | 18.60 | 17.90 |
| Yb | 0.53 | 0.73 | 0.74 | 0.69 | 0.71 | 0.90 | 0.93 | 1.84 | 0.86 | 0.84 | 0.82 |
| Zn | 27.00 | 27.90 | 27.70 | 47.50 | 47.60 | 42.90 | 43.10 | 122.00 | 126.00 | 118.00 | 116.00 |
| Zr | 25.00 | 34.00 | 35.00 | 31.00 | 33.00 | 32.00 | 36.00 | 42.40 | 43.40 | 42.10 | 42.60 |
| Sample | SPA1 | SPA2 | SPA3 | SPA4 | SPA5 | SPA6 | SPA7 | SPA8 | SPA9 | SPA10 | SPA11 | SPA12 |
| SiO2 | 65.88 | 67.15 | 67.08 | 59.71 | 59.62 | 66.03 | 67.01 | 66.98 | 63.31 | 63.34 | 62.41 | 62.36 |
| Al2O3 | 15.17 | 14.48 | 14.51 | 14.01 | 14.02 | 15.18 | 14.72 | 14.74 | 13.42 | 13.41 | 14.86 | 14.91 |
| CaO | 2.43 | 0.32 | 0.31 | 6.02 | 5.96 | 2.48 | 0.48 | 0.49 | 3.08 | 3.06 | 0.48 | 0.47 |
| Fe2O3 | 2.8 | 2.41 | 2.36 | 3.38 | 3.32 | 2.72 | 3.58 | 3.61 | 2.71 | 2.78 | 6.08 | 6.02 |
| FeO | 1.68 | 1.88 | 1.85 | 2.05 | 2.06 | 2.08 | 2.61 | 2.58 | 2.42 | 2.86 | 0.95 | 0.94 |
| K2O | 5.06 | 9.41 | 9.13 | 6.38 | 6.32 | 5.01 | 6.32 | 6.28 | 7.68 | 7.71 | 6.31 | 6.28 |
| MgO | 1.51 | 1.58 | 1.55 | 2.32 | 2.34 | 1.58 | 2.68 | 2.65 | 2.08 | 2.12 | 2.88 | 2.91 |
| MnO | 0.02 | 0.01 | 0.01 | 0.06 | 0.05 | 0.02 | 0.01 | 0.01 | 0.01 | 0.01 | 0.01 | 0.01 |
| Na2O | 4.2 | 0.71 | 0.68 | 2.62 | 2.58 | 4.06 | 0.35 | 0.36 | 0.62 | 0.65 | 0.19 | 0.18 |
| P2O5 | 0.27 | 0.23 | 0.25 | 0.41 | 0.42 | 0.21 | 0.32 | 0.33 | 0.31 | 0.33 | 0.3 | 0.31 |
| TiO2 | 0.41 | 0.42 | 0.41 | 0.58 | 0.55 | 0.38 | 0.51 | 0.51 | 0.48 | 0.51 | 0.52 | 0.51 |
| LOI | 0.32 | 0.01 | 0.02 | 2.98 | 2.81 | 0.32 | 0.01 | 0.02 | 2.58 | 2.31 | 0.01 | 0.02 |
| Total | 99.75 | 98.61 | 98.16 | 100.52 | 100.05 | 100.07 | 98.6 | 98.56 | 98.7 | 99.09 | 95 | 94.92 |
| Ag | 0.25 | 0.89 | 0.92 | 0.26 | 0.27 | 0.28 | 0.56 | 0.61 | 0.96 | 0.98 | 0.18 | 0.19 |
| As | ||||||||||||
| Au | ||||||||||||
| Ba | 1870 | 1671 | 1681 | 1117 | 1127 | 1886 | 1281 | 1282 | 1427 | 1431 | 1502 | 1517 |
| Be | ||||||||||||
| Bi | 1 | 0.7 | 0.6 | 0.4 | 0.5 | 1.2 | 0.8 | 0.8 | 0.8 | 0.6 | 0.9 | 0.9 |
| Cd | 0.15 | 0.27 | 0.31 | 0.09 | 0.12 | 0.17 | 0.31 | 0.42 | 0.32 | 0.41 | 0.12 | 0.15 |
| Ce | 51.8 | 122 | 124 | 69.2 | 70.1 | 52.6 | 70.6 | 70.8 | 28.9 | 29.1 | 31.7 | 32.2 |
| Co | 8.3 | 2.3 | 2.5 | 11.2 | 11.4 | 8.8 | 7.1 | 7.3 | 9.4 | 9.6 | 29.4 | 29.7 |
| Cr | 38 | 35 | 37 | 61 | 64 | 41 | 61 | 63 | 52 | 54 | 79 | 81 |
| Cs | 1.3 | 1.6 | 1.8 | 1.1 | 1.3 | 1.2 | 3.3 | 3.4 | 3.7 | 3.5 | 0.9 | 1.1 |
| Cu | 578.6 | 11120 | 11210 | 197.6 | 200.5 | 580.9 | 6033 | 6037 | 5596 | 5592 | 1580 | 1591 |
| Dy | 1.56 | 1.06 | 1.07 | 1.94 | 1.96 | 1.57 | 1.43 | 1.45 | 1.36 | 1.34 | 0.96 | 0.94 |
| Er | 0.87 | 0.48 | 0.46 | 1.03 | 1.06 | 0.88 | 0.66 | 0.67 | 0.77 | 0.78 | 0.48 | 0.44 |
| Eu | 1.06 | 1.04 | 1.07 | 1.36 | 1.35 | 1.07 | 1.12 | 1.08 | 0.66 | 0.69 | 0.64 | 0.71 |
| Ga | 15 | 14 | 17 | 16 | 16 | 17 | 15.8 | 16.1 | 15.3 | 15.4 | 15.8 | 15.9 |
| Gd | 2.36 | 2.14 | 2.17 | 3.26 | 3.25 | 2.41 | 2.66 | 2.64 | 1.95 | 1.93 | 1.42 | 1.46 |
| Hf | 1.38 | 0.99 | 1.02 | 2.96 | 2.98 | 1.41 | 0.46 | 0.47 | 0.94 | 0.96 | 1.17 | 1.18 |
| Ho | 0.35 | 0.22 | 0.23 | 0.41 | 0.38 | 0.37 | 0.27 | 0.29 | 0.29 | 0.31 | 0.18 | 0.17 |
| La | 27.8 | 132 | 134 | 36.7 | 37.1 | 28.1 | 39.6 | 39.5 | 15.1 | 15.7 | 16.7 | 16.9 |
| Lu | 0.65 | 0.29 | 0.31 | 0.22 | 0.24 | 0.66 | 0.11 | 0.13 | 0.12 | 0.12 | 0.1 | 0.11 |
| Mo | 1.9 | 12.8 | 13.1 | 2.6 | 2.9 | 2.2 | 253 | 256 | 23.7 | 24.1 | 2.9 | 3.2 |
| Nb | 18.2 | 5.7 | 5.8 | 20.8 | 21.1 | 18.6 | 6.9 | 6.7 | 8.9 | 9.1 | 7.4 | 7.7 |
| Nd | 21.6 | 26.9 | 26.6 | 29.1 | 29.4 | 21.8 | 27.7 | 27.9 | 13.5 | 13.3 | 13.6 | 13.9 |
| Ni | 25 | 24 | 25 | 47 | 45 | 27 | 37 | 36 | 35 | 33 | 53 | 55 |
| Pb | 21.4 | 15.3 | 15.7 | 30.9 | 31.1 | 21.7 | 5.7 | 5.9 | 42.1 | 42.9 | 4.3 | 4.7 |
| Pr | 6.01 | 9.51 | 9.57 | 8.05 | 8.01 | 6.07 | 7.88 | 7.91 | 3.46 | 3.49 | 3.66 | 3.69 |
| Rb | 104 | 122 | 121 | 87 | 88 | 107 | 122 | 124 | 105 | 107 | 43 | 45 |
| Sm | 3.05 | 2.94 | 2.97 | 4.27 | 4.29 | 3.03 | 3.67 | 3.65 | 2.27 | 2.21 | 1.88 | 1.91 |
| Sn | 1.9 | 4.7 | 4.8 | 1.4 | 1.3 | 1.7 | 3.2 | 3.3 | 3.7 | 3.9 | 4.1 | 4.6 |
| Sr | 929 | 308 | 310 | 768 | 762 | 931 | 156 | 159 | 248 | 251 | 88 | 89 |
| Ta | 2.24 | 1.15 | 1.17 | 1.87 | 1.89 | 2.27 | 0.76 | 0.77 | 1.18 | 1.16 | 1.27 | 1.28 |
| Tb | 0.33 | 0.27 | 0.29 | 0.44 | 0.42 | 0.35 | 0.34 | 0.36 | 0.25 | 0.27 | 0.21 | 0.22 |
| Th | 15.8 | 12.8 | 12.7 | 13.7 | 13.9 | 16.1 | 13.7 | 13.9 | 15.1 | 15.3 | 11.1 | 11.3 |
| U | 4.53 | 5.31 | 5.33 | 5.66 | 5.57 | 4.56 | 3.06 | 3.09 | 7.52 | 7.48 | 8.24 | 8.26 |
| V | 59 | 58 | 61 | 81 | 83 | 61 | 16 | 72 | 67 | 69 | 79 | 82 |
| W | 2.3 | 5.4 | 5.5 | 4.2 | 4.4 | 2.2 | 4.4 | 4.6 | 12.8 | 12.9 | 21.7 | 21.4 |
| Y | 11.4 | 5.27 | 5.31 | 11.3 | 11.5 | 11.6 | 6.61 | 6.63 | 7.94 | 7.98 | 4.04 | 4.1 |
| Yb | 0.85 | 0.42 | 0.44 | 0.86 | 0.88 | 0.87 | 0.51 | 0.53 | 0.64 | 0.66 | 0.41 | 0.44 |
| Zn | 21.8 | 22.6 | 23.1 | 44.8 | 44.3 | 22.2 | 11.9 | 11.7 | 72.7 | 72.9 | 7.8 | 7.9 |
| Zr | 18 | 23 | 25 | 98 | 99 | 21 | 17 | 18 | 32 | 33 | 41 | 43 |
| Ge | ||||||||||||
| In | ||||||||||||
| Li | ||||||||||||
| S | ||||||||||||
| Sb | ||||||||||||
| Se | ||||||||||||
| Te | ||||||||||||
| Tm | ||||||||||||
| Sample | LAM1 | LAM2 | LAM3 | LAM4 | LAM5 | LAM6 | LAM7 | LAM8 | ||||
| SiO2 | 48.18 | 49.08 | 48.42 | 50.12 | 50.62 | 48.69 | 51.54 | 51.47 | ||||
| Al2O3 | 13.04 | 13.82 | 13.6 | 13.62 | 13.96 | 13.48 | 13.77 | 13.74 | ||||
| CaO | 1.37 | 3.31 | 5.23 | 3.41 | 3.42 | 4.96 | 3.62 | 3.74 | ||||
| Fe2O3 | 4.39 | 3.82 | 3.88 | 3.87 | 5.3 | 5.61 | 5.65 | 5.32 | ||||
| FeO | 5.91 | 5.32 | 4.7 | 5.02 | 5.3 | 4.59 | 5.22 | 5.32 | ||||
| K2O | 6.69 | 4.67 | 6.6 | 4.61 | 4.72 | 6.42 | 5.17 | 4.92 | ||||
| MgO | 8.27 | 7.26 | 7.58 | 7.44 | 8.34 | 8.54 | 7.38 | 7.57 | ||||
| MnO | 0.01 | 0.02 | 0.04 | 0.03 | 0.03 | 0.04 | 0.03 | 0.04 | ||||
| Na2O | 0.61 | 2.29 | 1.86 | 2.84 | 3.18 | 2.82 | 2.88 | 2.96 | ||||
| P2O5 | 0.8 | 0.66 | 0.88 | 0.78 | 0.86 | 0.79 | 0.81 | 0.75 | ||||
| TiO2 | 0.71 | 0.65 | 0.86 | 0.78 | 0.67 | 0.89 | 0.76 | 0.84 | ||||
| LOI | 3.61 | 4.02 | 3.82 | 3.67 | 3.71 | 3.82 | 3.98 | 3.66 | ||||
| Total | 93.59 | 94.92 | 97.47 | 96.19 | 100.11 | 100.65 | 100.81 | 100.33 | ||||
| Ag | 0.4 | 1.7 | 1.5 | 1.1 | 1.6 | 1.7 | 1.4 | 1.3 | ||||
| As | 2.8 | 4.5 | 6.3 | 6.9 | 4.4 | 5.8 | 7.1 | 6.7 | ||||
| Au | 0.08 | 0.09 | 0.07 | 0.08 | ||||||||
| Ba | 870 | 673 | 814 | 981 | 282 | 396 | 562 | 524 | ||||
| Be | 2.21 | 2.12 | 2.1 | 2.27 | 2.3 | 2.4 | 2.2 | 2.7 | ||||
| Bi | 1.78 | 1.88 | 4.81 | 6.13 | 2.9 | 4.7 | 6.4 | 6.6 | ||||
| Cd | 0.02 | 0.02 | 0.03 | 0.08 | 0.52 | 0.37 | 0.39 | 0.46 | ||||
| Ce | 173 | 154 | 169 | 167 | 139 | 129 | 147 | 132 | ||||
| Co | 15.6 | 15.9 | 16.1 | 21.2 | 15.7 | 16.8 | 20.7 | 19.5 | ||||
| Cr | 322 | 273 | 280 | 288 | 178 | 185 | 162 | 182 | ||||
| Cs | 5.54 | 3.12 | 4.61 | 5.12 | 1.7 | 1.4 | 2.3 | 1.9 | ||||
| Cu | 3080 | 2245 | 2081 | 3121 | 2275 | 1988 | 1014 | 926 | ||||
| Dy | 2.67 | 4.41 | 5.46 | 4.71 | 4.57 | 5.26 | 4.81 | 5.24 | ||||
| Er | 1.1 | 1.82 | 2.32 | 1.78 | 1.92 | 2.13 | 1.98 | 2.16 | ||||
| Eu | 2.11 | 1.87 | 2.43 | 2.53 | 1.97 | 2.23 | 2.83 | 2.37 | ||||
| Ga | 25.7 | 26.4 | 24.9 | 29.1 | ||||||||
| Gd | 5.13 | 7.75 | 9.79 | 9.03 | 7.85 | 9.46 | 9.24 | 9.16 | ||||
| Hf | 2.1 | 1.9 | 2.29 | 1.8 | 0.82 | 1.19 | 0.86 | 0.93 | ||||
| Ho | 0.46 | 0.51 | 0.47 | 0.49 | ||||||||
| La | 86.4 | 78.6 | 80.9 | 79.6 | 74 | 89 | 76 | 82 | ||||
| Lu | 0.12 | 0.13 | 0.15 | 0.11 | 0.15 | 0.13 | 0.12 | 0.16 | ||||
| Mo | 2.35 | 3.88 | 2.95 | 2.91 | 3.78 | 2.99 | 2.86 | 2.75 | ||||
| Nb | 18 | 30 | 38.2 | 38 | 35.6 | 38.9 | 37.4 | 36.7 | ||||
| Nd | 66.9 | 60.7 | 67.3 | 65.8 | 61.9 | 67.6 | 66.8 | 65.7 | ||||
| Ni | 138 | 85 | 113 | 121 | 89 | 93 | 129 | 124 | ||||
| Pb | 6.9 | 11.9 | 8.6 | 6.2 | 35 | 34 | 28 | 31 | ||||
| Pr | 19.1 | 17.3 | 18.1 | 17.9 | 17.29 | 18.42 | 17.93 | 17.68 | ||||
| Rb | 210 | 182 | 202 | 195 | 216 | 192 | 207 | 189 | ||||
| Sm | 8.91 | 8.69 | 9.01 | 8.41 | 7.45 | 8.96 | 8.54 | 8.21 | ||||
| Sn | 4.8 | 5.9 | 6.2 | 4.9 | 5.7 | 6.4 | 4.8 | 5.2 | ||||
| Sr | 198 | 468 | 494 | 435 | 465.8 | 496.4 | 437.3 | 442.6 | ||||
| Ta | 0.84 | 1.02 | 0.98 | 1.16 | 3.29 | 3.68 | 3.74 | 2.56 | ||||
| Tb | 0.54 | 0.76 | 0.95 | 0.84 | 0.79 | 0.95 | 0.87 | 0.83 | ||||
| Th | 25.8 | 30.8 | 23.7 | 24.4 | 30.72 | 23.77 | 23.24 | 23.87 | ||||
| U | 8 | 7.7 | 6.9 | 8.7 | 7.64 | 5.63 | 7.14 | 7.56 | ||||
| V | 146 | 97 | 129 | 141 | 94 | 125 | 124 | 132 | ||||
| W | 19.9 | 27.4 | 17.1 | 16.7 | 17.6 | 9.3 | 7.2 | 12.3 | ||||
| Y | 11.4 | 11.6 | 14.3 | 11.8 | 11.6 | 13.5 | 12.4 | 12.7 | ||||
| Yb | 0.8 | 0.9 | 1.1 | 0.8 | 0.8 | 1.2 | 0.9 | 1.3 | ||||
| Zn | 7 | 17 | 19 | 15 | 26 | 37 | 45 | 36 | ||||
| Zr | 72.4 | 81.6 | 77.4 | 92.3 | 88.6 | 102.7 | 71.2 | 79.4 | ||||
| Ge | 0.31 | 0.28 | 0.36 | 0.32 | ||||||||
| In | 0.07 | 0.14 | 0.35 | 0.24 | 0.17 | 0.26 | 0.31 | 0.29 | ||||
| Li | 18.3 | 17.2 | 16.8 | 19.2 | 7 | 8 | 8 | 9 | ||||
| S | 66,300 | 44,185 | 29,661 | 38,529 | 33,169 | 29,674 | 38,824 | 32,742 | ||||
| Sb | 0.32 | 2.31 | 0.98 | 2.26 | 2.6 | 2.4 | 2.1 | 2.3 | ||||
| Se | 17.1 | 12 | 13.7 | 15.6 | 2.24 | 1.27 | 1.66 | 1.72 | ||||
| Te | 1.51 | 1.16 | 1.92 | 1.34 | 0.76 | 0.96 | 1.37 | 1.12 | ||||
| Tm | 0.15 | 0.21 | 0.28 | 0.17 | 0.22 | 0.31 | 0.27 | 0.19 |
| Sample | DK1a | DK1b | DK1c | DK3 | LAM | MDI | SP * 1 |
|---|---|---|---|---|---|---|---|
| Sr ppm | 608 | 725 | 662 | 298 | 198 | 234 | 681 |
| Rb ppm | 81.2 | 57.9 | 48.6 | 4.2 | 210 | 97.6 | |
| 87Rb/86Sr | 0.386 | 0.231 | 0.212 | 0.041 | 3.068 | 1.207 | 0.67497 |
| Error (2σ) | 0.011 | 0.007 | 0.006 | 0.001 | 0.087 | 0.034 | |
| 87Sr/86Sr | 0.704874 | 0.704619 | 0.704617 | 0.705151 | 0.705722 | 0.706801 | 0.704467 |
| Error (2σ) | 3.00 × 10⁻⁵ | 2.70 × 10⁻⁵ | 2.40 × 10⁻⁵ | 2.10 × 10⁻⁵ | 2.30 × 10⁻⁵ | 3.40 × 10⁻⁵ | |
| (87Sr/86Sr)i | 0.704766 | 0.704554 | 0.704558 | 0.705139 | 0.704864 | 0.706464 | |
| Nd ppm | 20.7 | 19.7 | 20.6 | 23.1 | 66.9 | 15 | |
| Sm ppm | 3.29 | 3.17 | 3.71 | 3.08 | 8.91 | 3.67 | |
| 147Sm/144Nd | 0.096 | 0.097 | 0.109 | 0.081 | 0.081 | 0.148 | 0.29235 |
| Error (2σ) | 0.005 | 0.005 | 0.006 | 0.004 | 0.004 | 0.008 | |
| 143Nd/144Nd | 0.512733 | 0.512767 | 0.512787 | 0.512659 | 0.512666 | 0.512767 | 0.51275 |
| Error (2σ) | 1.70 × 10⁻⁵ | 1.70 × 10⁻⁵ | 2.20 × 10⁻⁵ | 1.70 × 10⁻⁵ | 1.70 × 10⁻⁵ | 1.70 × 10⁻⁵ | |
| (143Nd/144Nd)i | 0.512721 | 0.512754 | 0.512773 | 0.512648 | 0.512655 | 0.512748 | |
| εNdi | 2.12 | 2.76 | 3.13 | 0.7 | 0.83 | 2.64 |
© 2018 by the authors. Licensee MDPI, Basel, Switzerland. This article is an open access article distributed under the terms and conditions of the Creative Commons Attribution (CC BY) license (http://creativecommons.org/licenses/by/4.0/).
Share and Cite
Kamali, A.A.; Moayyed, M.; Amel, N.; Hosseinzadeh, M.R.; Mohammadiha, K.; Santos, J.F.; Brenna, M. Post-Mineralization, Cogenetic Magmatism at the Sungun Cu-Mo Porphyry Deposit (Northwest Iran): Protracted Melting and Extraction in an Arc System. Minerals 2018, 8, 588. https://doi.org/10.3390/min8120588
Kamali AA, Moayyed M, Amel N, Hosseinzadeh MR, Mohammadiha K, Santos JF, Brenna M. Post-Mineralization, Cogenetic Magmatism at the Sungun Cu-Mo Porphyry Deposit (Northwest Iran): Protracted Melting and Extraction in an Arc System. Minerals. 2018; 8(12):588. https://doi.org/10.3390/min8120588
Chicago/Turabian StyleKamali, Amin Allah, Mohsen Moayyed, Nasir Amel, Mohammad Reza Hosseinzadeh, Kourosh Mohammadiha, José Francisco Santos, and Marco Brenna. 2018. "Post-Mineralization, Cogenetic Magmatism at the Sungun Cu-Mo Porphyry Deposit (Northwest Iran): Protracted Melting and Extraction in an Arc System" Minerals 8, no. 12: 588. https://doi.org/10.3390/min8120588
APA StyleKamali, A. A., Moayyed, M., Amel, N., Hosseinzadeh, M. R., Mohammadiha, K., Santos, J. F., & Brenna, M. (2018). Post-Mineralization, Cogenetic Magmatism at the Sungun Cu-Mo Porphyry Deposit (Northwest Iran): Protracted Melting and Extraction in an Arc System. Minerals, 8(12), 588. https://doi.org/10.3390/min8120588