Article

An Improved High-Pressure Roll Crusher Model for Tungsten and Tantalum Ores

Departament d’Enginyeria Minera, Industrial i TIC, Universitat Politècnica de Catalunya Barcelona Tech, Av. Bases de Manresa 61-63, Manresa, 08242 Barcelona, Spain
*
Author to whom correspondence should be addressed.
Minerals 2018, 8(11), 483; https://doi.org/10.3390/min8110483
Submission received: 26 September 2018 / Revised: 18 October 2018 / Accepted: 22 October 2018 / Published: 25 October 2018
(This article belongs to the Section Mineral Processing and Extractive Metallurgy)

Abstract

:
An improved approach is presented to model the product particle size distribution resulting from grinding in high-pressure roll crusher with the aim to be used in standard high-pressure grinding rolls (HPGR). This approach uses different breakage distribution function parameter values for a single particle compression condition and a bed compression condition. Two materials were used for the experiments; altered Ta-bearing granite and a calc-silicate tungsten ore. A set of experiments was performed with constant operative conditions, while varying a selected condition to study the influence of the equipment set-up on the model. The material was comminuted using a previously determined specific pressing force, varying the feed particle size, roll speed and the static gap. A fourth group of experiments were performed varying the specific pressing force. Experimental results show the high performance of the comminution in a high-pressure environment. The static gap was the key in order to control the product particle size. A mathematical approach to predict the product particle size distribution is presented and it showed a good fit when compared to experimental data. This is the case when a narrow particle size fraction feed is used, but the fit became remarkably good with a multi-size feed distribution. However, when varying the specific pressing force in the case of the calc-silicate material, the results were not completely accurate. The hypothesis of simultaneous single particle compression and bed compression for different size ranges and with different parameters of the distribution function was probed and reinforced by various simulations that exchanged bed compression parameters over the single particle compression distribution function, and vice versa.

1. Introduction

The relatively new technology of comminution with the application of high-pressure grinding rolls (HPGR) is highly efficient in energy consumption when compared with conventional tumbling mills. It also has a relatively high throughput rate and low roller wear consumption [1]. This equipment was first applied in the cement industry [2,3,4,5] and subsequently used for mining activities, particularly for metallic ores, such as porphyritic copper types, as well as for gold-bearing materials [6,7,8]. There are a number of models worked out for HPGR operation in ore processing circuits, considering both technological and economic conditions [9,10], together with the application of advanced computational methods and scale-up issues [11,12].
The main advantages of HPGR lie in energy savings and the simplicity of the process [7]. However, the particle size reduction ratio is lower than that in some other types of mills, such as ball and rod mills. HPGR are used in various configurations such as pre-grinding, hybrid grinding and finish grinding, among others [4]. This is mainly due to the comminution effect under the action of high-pressure rolls, which generates many more internal fractures of particles than other devices [13,14,15], and also generates material with latent cracks for a second stage of milling or even enough to liberate the ore [4,16]. The favourable influence of HPGR performance on downstream beneficiation operations has also been proved, for example, in the ore flotation process [17]. HPGR also appears to have a less negative impact on the environment in terms of lower dust and noise emissions [18].
With regard to the description of the model, the mechanism of breakage by compression and shear is dominant in roll crushers [19]. In HPGR, two main breakage mechanisms are observed: single particle compression and bed compression [20,21,22]. Single particle compression is more efficient, but larger particles cause unnecessary liner wear issues [21] and also result in the separation of the rolls, with the consequent collapse of the compression zone, reducing the grinding efficiency [8]. On the other hand, when the particles are packed in a high-pressure environment, producing the bed compression effect, the energy is transferred directly to the particle mass by high stressed contact points between the particles; thus, the HPGR is a highly efficient machine in terms of energy consumption [1]. Early attempts to model the HPGR particle size distribution used the population balance model (PBM) [20], a simple mass balance in which the comminution is described in several steps, where a pre-crushing zone in single particle compression is followed by a final stage of bed compression [6,8,12,20,21,22,23]. In both conditions, various functions related to the mechanism of rock breakage, particle kinetics and selection criteria types are used to describe the comminution. In order to distinguish between the single particle compression and bed compression sub-processes, the same breakage function is conceived with different parameters. However, for the sake of simplicity, it is assumed that these values of the function should be the same, regardless of whether they are caused by single particle compression or bed compression effect [20]. The situation is similar when the solution for bed compression is solved by the batch grinding equation: a single particle compression breakage function uses the same parameters for bed compression [8]. Later, researchers took a different approach to these parameters and described those using different values [21,22].
Taking into account these facts, in this study an improved Austin model is presented based on three main considerations: (1) the hypothesis of having a non-normalized breakage function when it is run under different conditions of single particle or bed compression condition, (2) the new approach for determining the breakage function parameters in a high pressure environment by means of piston-die methodology [24], and (3) the consideration of the comminution of the particles as a simultaneous process when they are under single particle compression and under bed compression. For this model, when the particles are large enough to be nipped by the roll surface, the single-particle compression effect is described using the breakage function parameters values obtained in a single compression approach. However, undersized particles that are not under the nipping effect could interact with other small particles, or even with the large particles, producing the bed-compression effect. They are described by the breakage distribution function using values from the bed compression piston test [24]. The main objective of this research work was to obtain a robust model to predict the particle size distribution of tantalum and tungsten ores and to probe the consistency of the new approach to determine the breakage distribution function parameters presented in Anticoi et al. [24].

2. Methodology

2.1. Lab-Scale High-Pressure Roll Crusher Test

The lab-test work was performed using two different lithologies, which were both previously used to determine breakage function parameters [24]: granite from a tin and tantalum mine, in northwest Spain [16,25] and calc-silicate rock from a tungsten processing plant in Austria. Both ores contain low grade strategic metals; around 100 ppm of tantalum in the case of the granite [16], and 2000 ppm for the calc-silicate [25]. The experiments were performed at the facilities of the Universitat Politècnica de Catalunya, Manresa, Spain.
The sample preparation consisted of quartering and splitting approximately 250 kg of each material. The samples were previously crushed by a KHD Humboldt Wedag double toggle jaw crusher. After that, the material was screened and classified into narrow particle size fractions and multi-size particle distribution. The narrow-size classes of particles ranged from: −19 + 16 mm, −16 + 14 mm, −14 + 12.5 mm, −12.5 + 11.5 mm, −11.5 + 9.5 mm, −9.5 + 8 mm, −8 + 6.7 mm and −6.7 + 5 mm. For both lithologies, two tests with a heterogeneous particle size distribution were performed to validate the model with a realistic material. The laboratory-scale device is a modified roll crusher adapted with a high-pressure hydraulic system (Figure 1), where the mechanical overload protection springs were replaced by two 60 mm internal diameter pistons, and the original 3.7 kW motor was also changed to a 15 kW Siemens engine (Table 1). The equipment uses smooth rolls with dimensions of 250 mm in diameter and 50 mm in width. A transparent cover was built to observe the mechanical response of the material, and a slow-motion camera captured the moment of the particles under the roll breakage action. The horizontal displacement and speed of the rolls were also monitored.
The operative parameters were controlled in all tests (Table 2). The nomenclature of each experiment explains the variable condition in which each one was performed. Thus, the first character indicates the lithology type: P for the granite and M for the calc-silicate. The second character is related to the observed operative condition: V for surface speed of the rolls, F represents the feed size, P the specific pressing force and G indicates the operative gap. Finally, the last character indicates the experiment number. The bulk density ρ , which includes the porosity of the material, was measured by means of the quotient of mass m and total volume of a given sample VB (Equation (1)).
ρ = m V B
The feed density is denoted as ρ and the product density as δ. Both densities were determined, since they are necessary to calculate several model parameters [8].
The throughput (Th) was calculated using experimental data (Table 2). The product particle size distribution was determined using standard ASTME sieves with a ro-tap sieve shaker. In order to obtain disaggregated material, the calibration indicated 15 min dry-sieving.
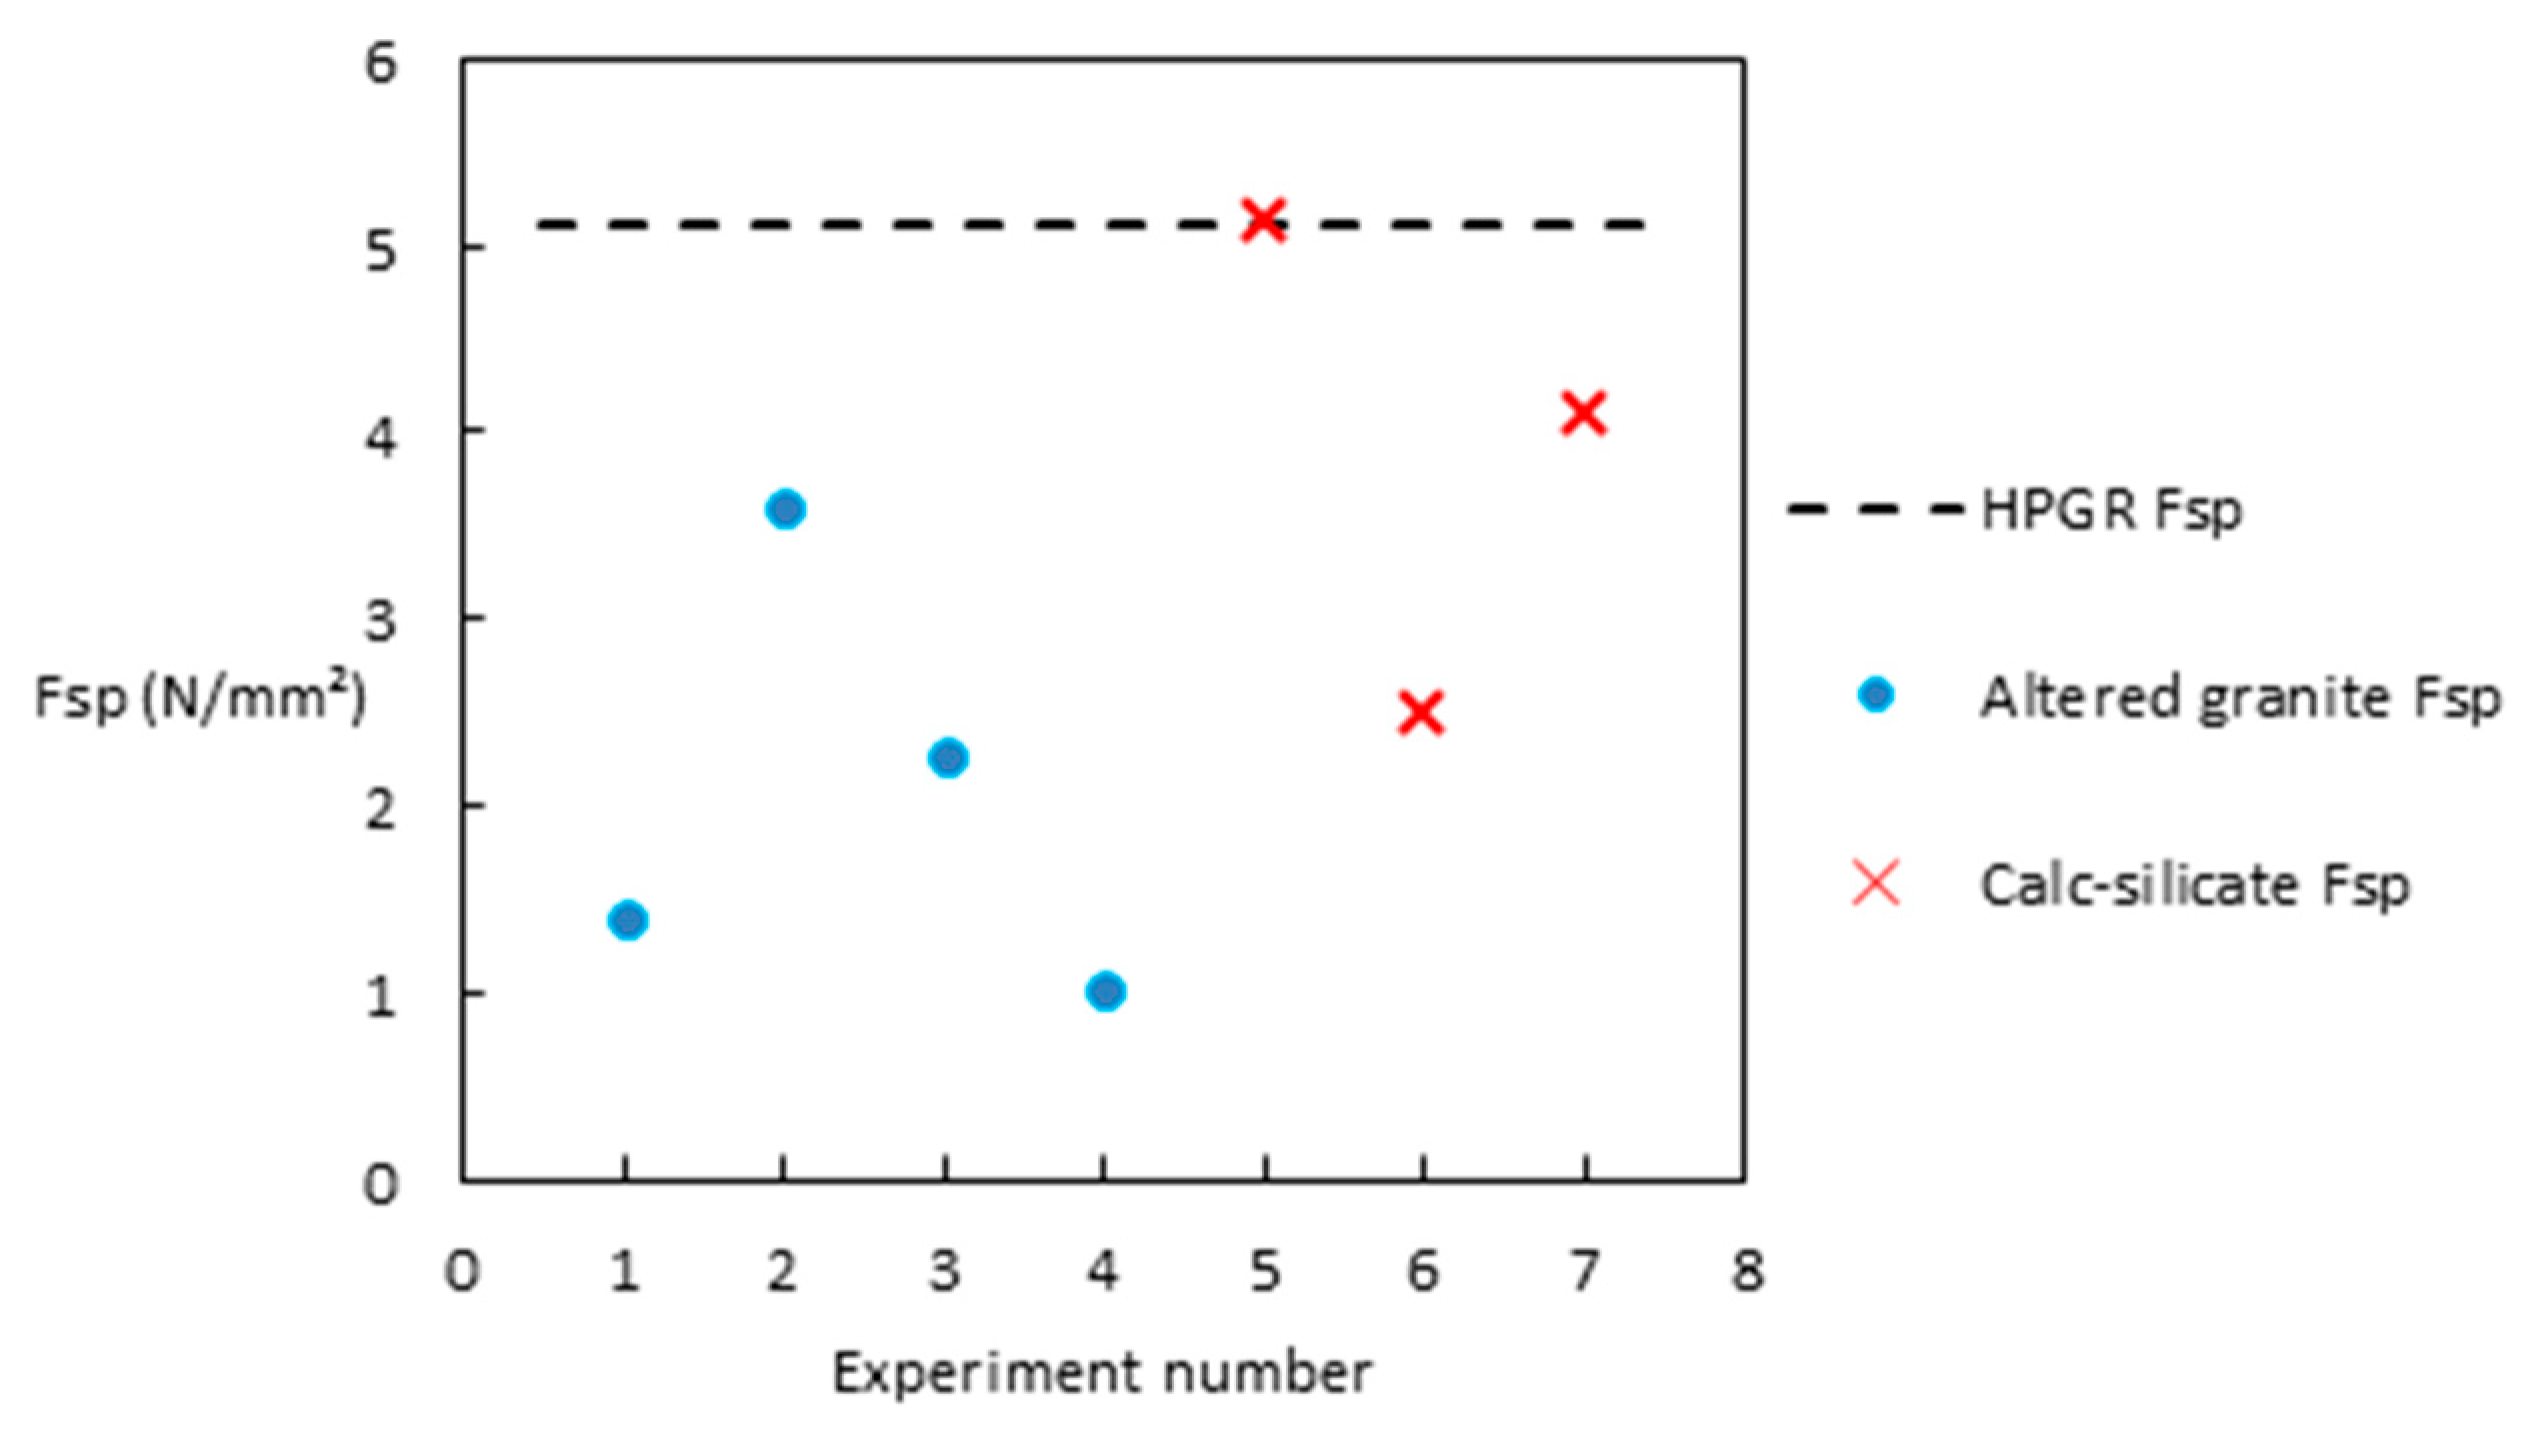
The specific pressing force (Fsp) for all tests was determined based on a compression strength test for both material types [24] (Figure 2). The aim was to test the material in the optimal pressure condition. The 95% of confidence interval for the calc-silicate ranges between 0.79 N/mm2 and 3.36 N/mm2, and from 1.94 N/mm2 to 5.17 N/mm2 for the altered granite.
In this work, the circumferential velocity, static gap, feed size and specific pressing force were studied in order to determine their influence on the particle size distribution product.

2.2. Mathematical Approach

The literature shows several approaches to HPGR models, sometimes as bi-stage sub-processes, with a single particle compression combined with a batch grinding solution [8,9] or by means of the calculation of several matrices between the differential feed and the breakage distribution function [7]. Based on the current models, an improved approach is proposed, taking into account the following hypotheses:
  • The breakage distribution function parameters should have different values when running under single particle compression compared to running under bed compression. A previous work investigating these materials [24] showed clear differences when the particles were under single particle compression or when they were under the bed compression condition.
  • The improved approach should have a selection function that is able to discriminate particles that are large enough to be nipped under the rolls from the remaining particles, which can be subjected to the bed compression effect. Thus, the selection function should be based on the particle size distribution of the feed, the internal products of the model, the geometric dimensions of the device and other characteristics, such as the material density and operational gap.
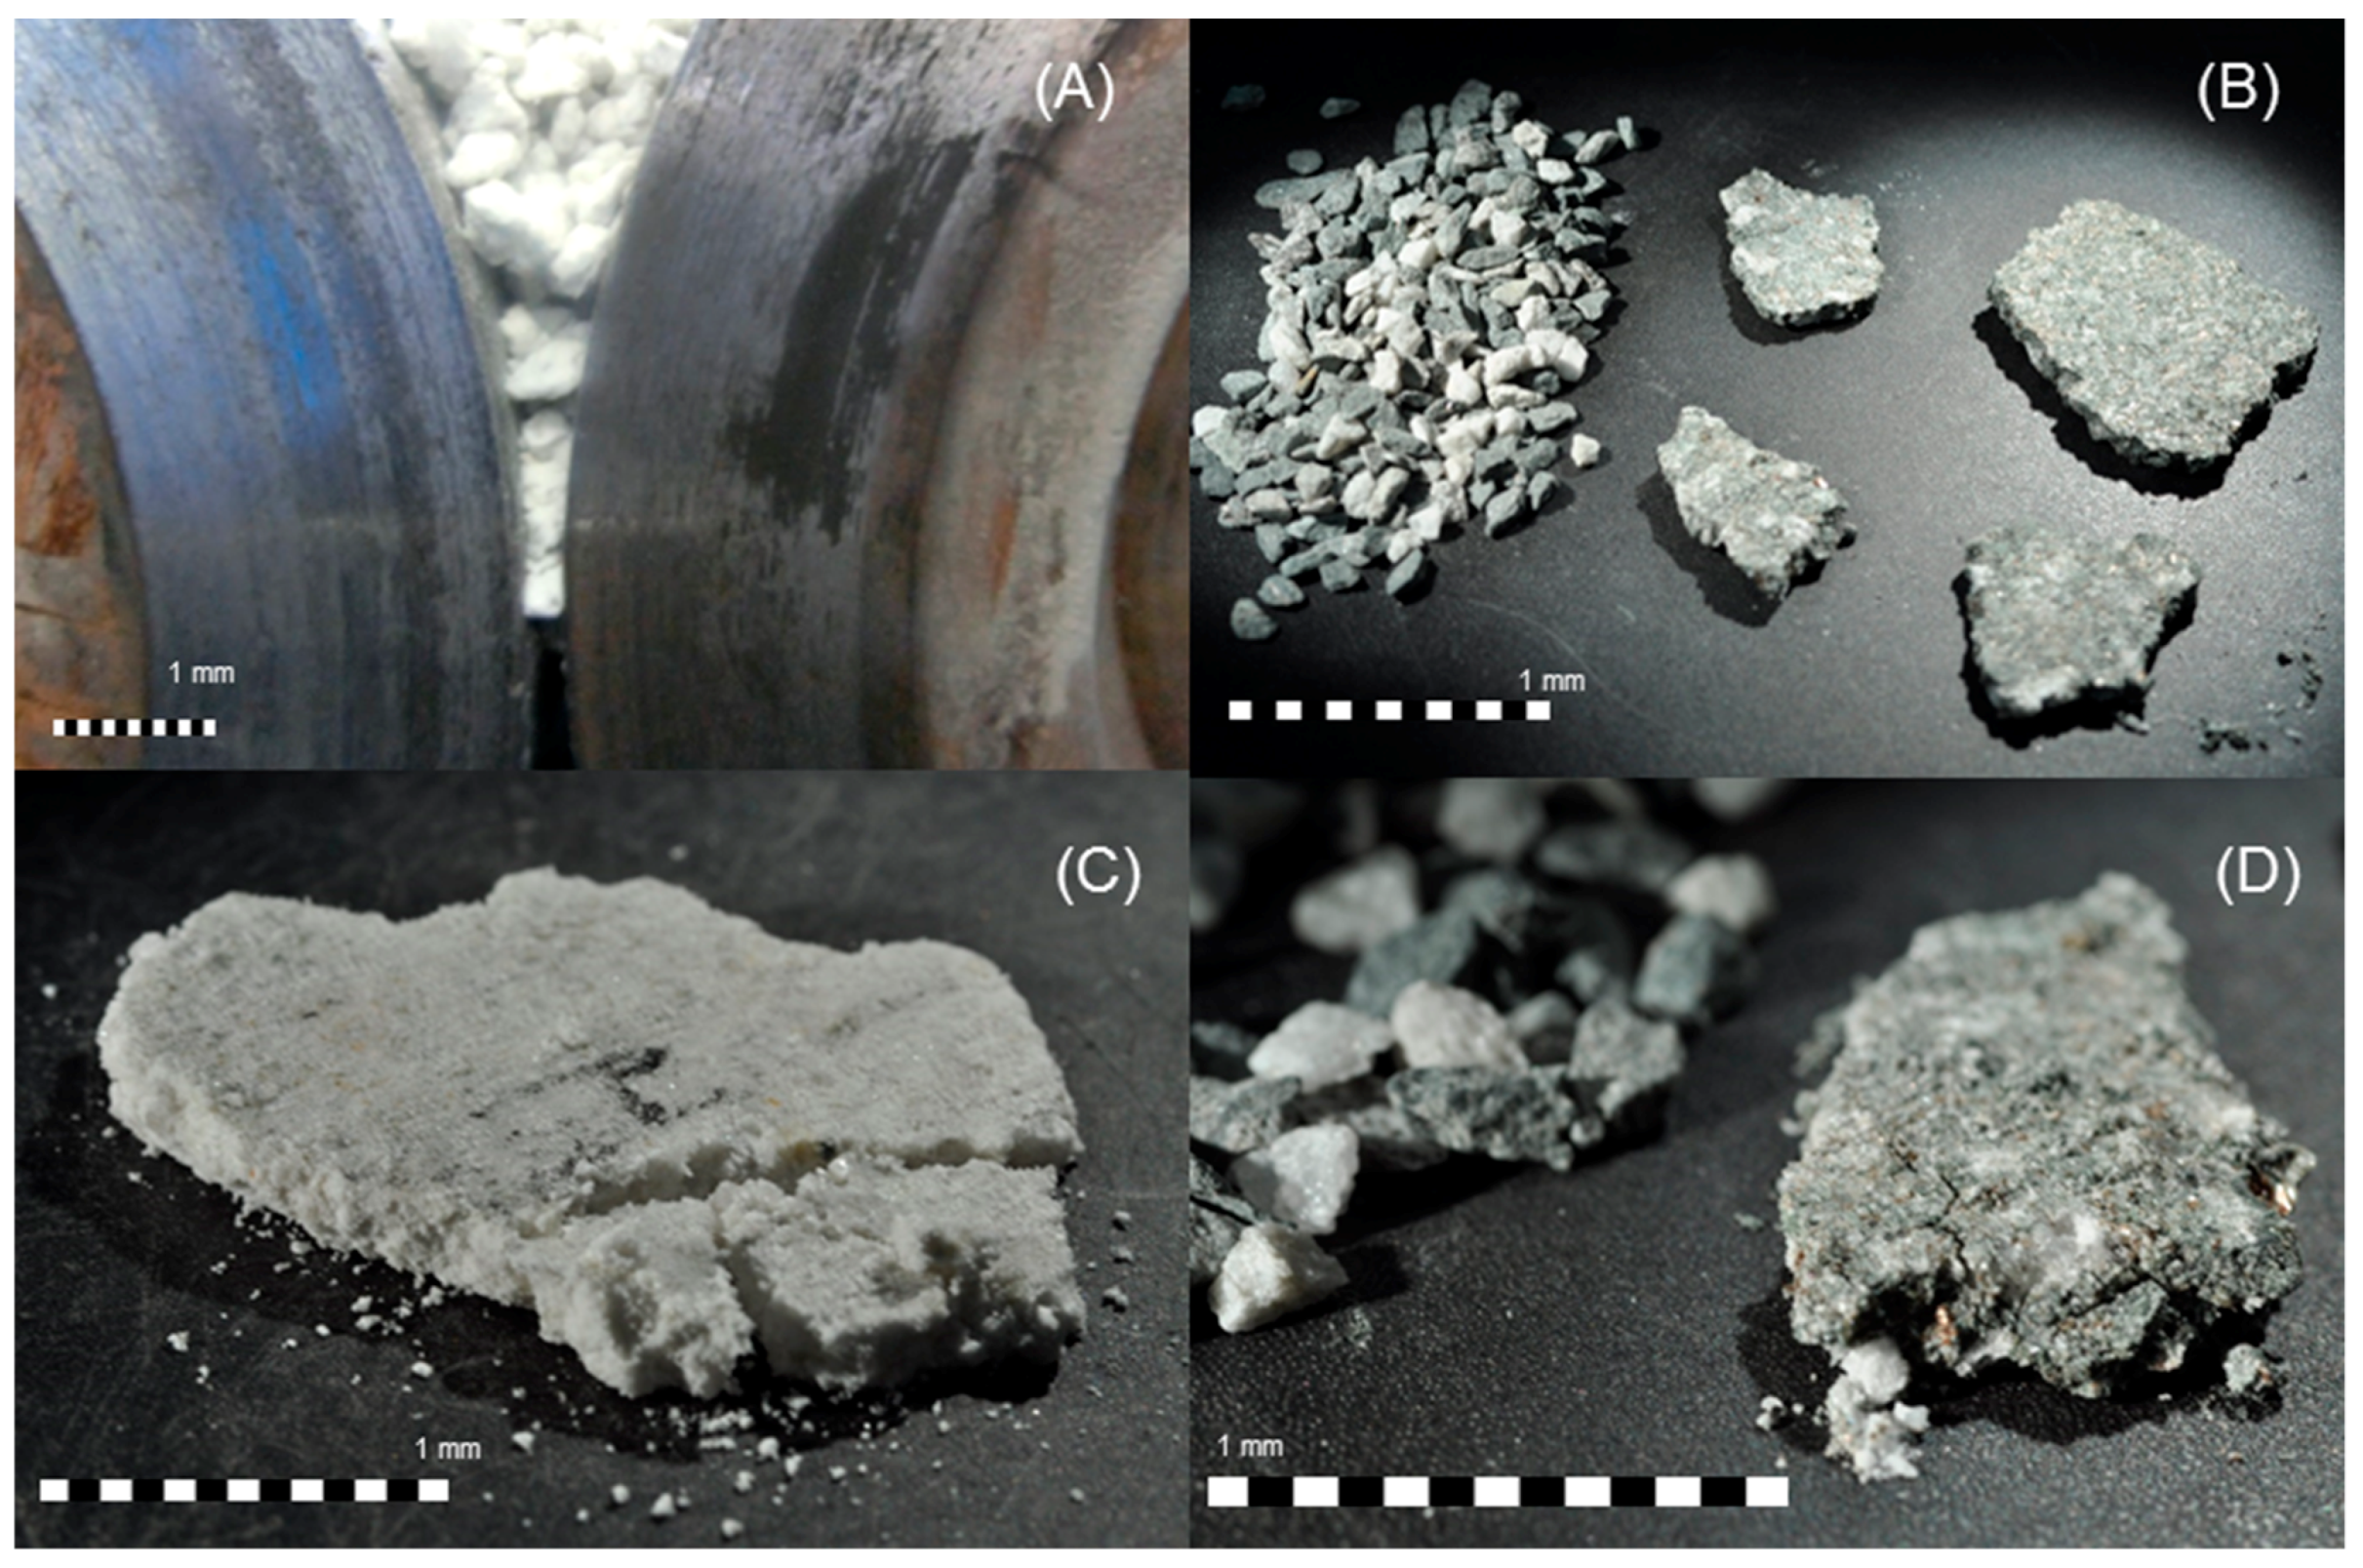
From the observations of images captured by the camera installed in front of the rolls (Figure 3), it was possible to observe the existence of a pre-crushed zone, as defined by Austin [6]. Other smaller particles, representing systems under choke feed condition also interact with each other, not under the single particle compression condition, but under bed compression. The Austin model [6,20] was then used as a new method of vertebral structure along with Evertsson [26] nomenclature, in which single particle compression and bed compression phases are used simultaneously. A block model was developed based on the size distribution of the feed (Figure 4).
The matrices b i j s , for single particle compression, and b i j b , for bed compression, represent the differential matrices extracted from the cumulative form of B distribution [27] but using different parameter values when the sample is under single particle compression compared to when it is under the bed compression effect (Equation (2)).
B i j = k ( d p i d p j ) n 1 + ( 1 k ) ( d p i d p j ) n 2   for   d p i Y 0
B i j = k ( d p i Y 0 ) n 3 ( d p i d p j ) n 1 + ( 1 k ) ( d p i d p j ) n 2   for   d p i < Y 0
b i j = B i , j B i 1 , j
The parameter dpi in Equation (2) represents the daughter particle and dpj is the parent particle, while k, n1 and n2 are function parameters. n3 and Y0 are the parameters when the breakage distribution behaves as a bimodal function. This is the case for the altered granite (Table 3) as is explained in previous studies [24]. All these parameters k, n1, n2, n3 and Y0 can also vary when the function is used under single particle compression and bed particle compression. For calculation purposes, the cumulative form B i j is transformed into the differential form b i j .
The feed f i enters the pre-crushing zone, where the particles are discriminated by the selection function. Over a certain cut-size, some of them go to the single particle compression and the remaining ones go to the bed compression. The product p i j is the sum of the results of both sub-processes. In algebraic terms, the expression for each comminution step is given by Equation (3).
p i = { [ b i j s x S 1 , i + b i j b x ( I S 1 , i ) ] [ b i j s x S 2 , i + b i j b x ( I S 2 , i ) [ b i j s x S n , i + b i j b x ( I S n , i ) } f i
The selection function used in this case belongs to the formulation reported by Whiten et al. [27], used mainly for cone and jaw crushers [26,28]; here it was applied for HPGR. Equation (4) describes this physical process in the steps at which single particle compression occurs. This function has the particularity of fixing upper and lower edges, which is related to the device geometry and the mineral characteristics.
S n , i = 1 ( d p i x n d 1 x n ) γ   f o r   d 1 < d p <   x n
S n , i = 0   f o r   d p < d 1
S n , i = 1   f o r   d p > x n
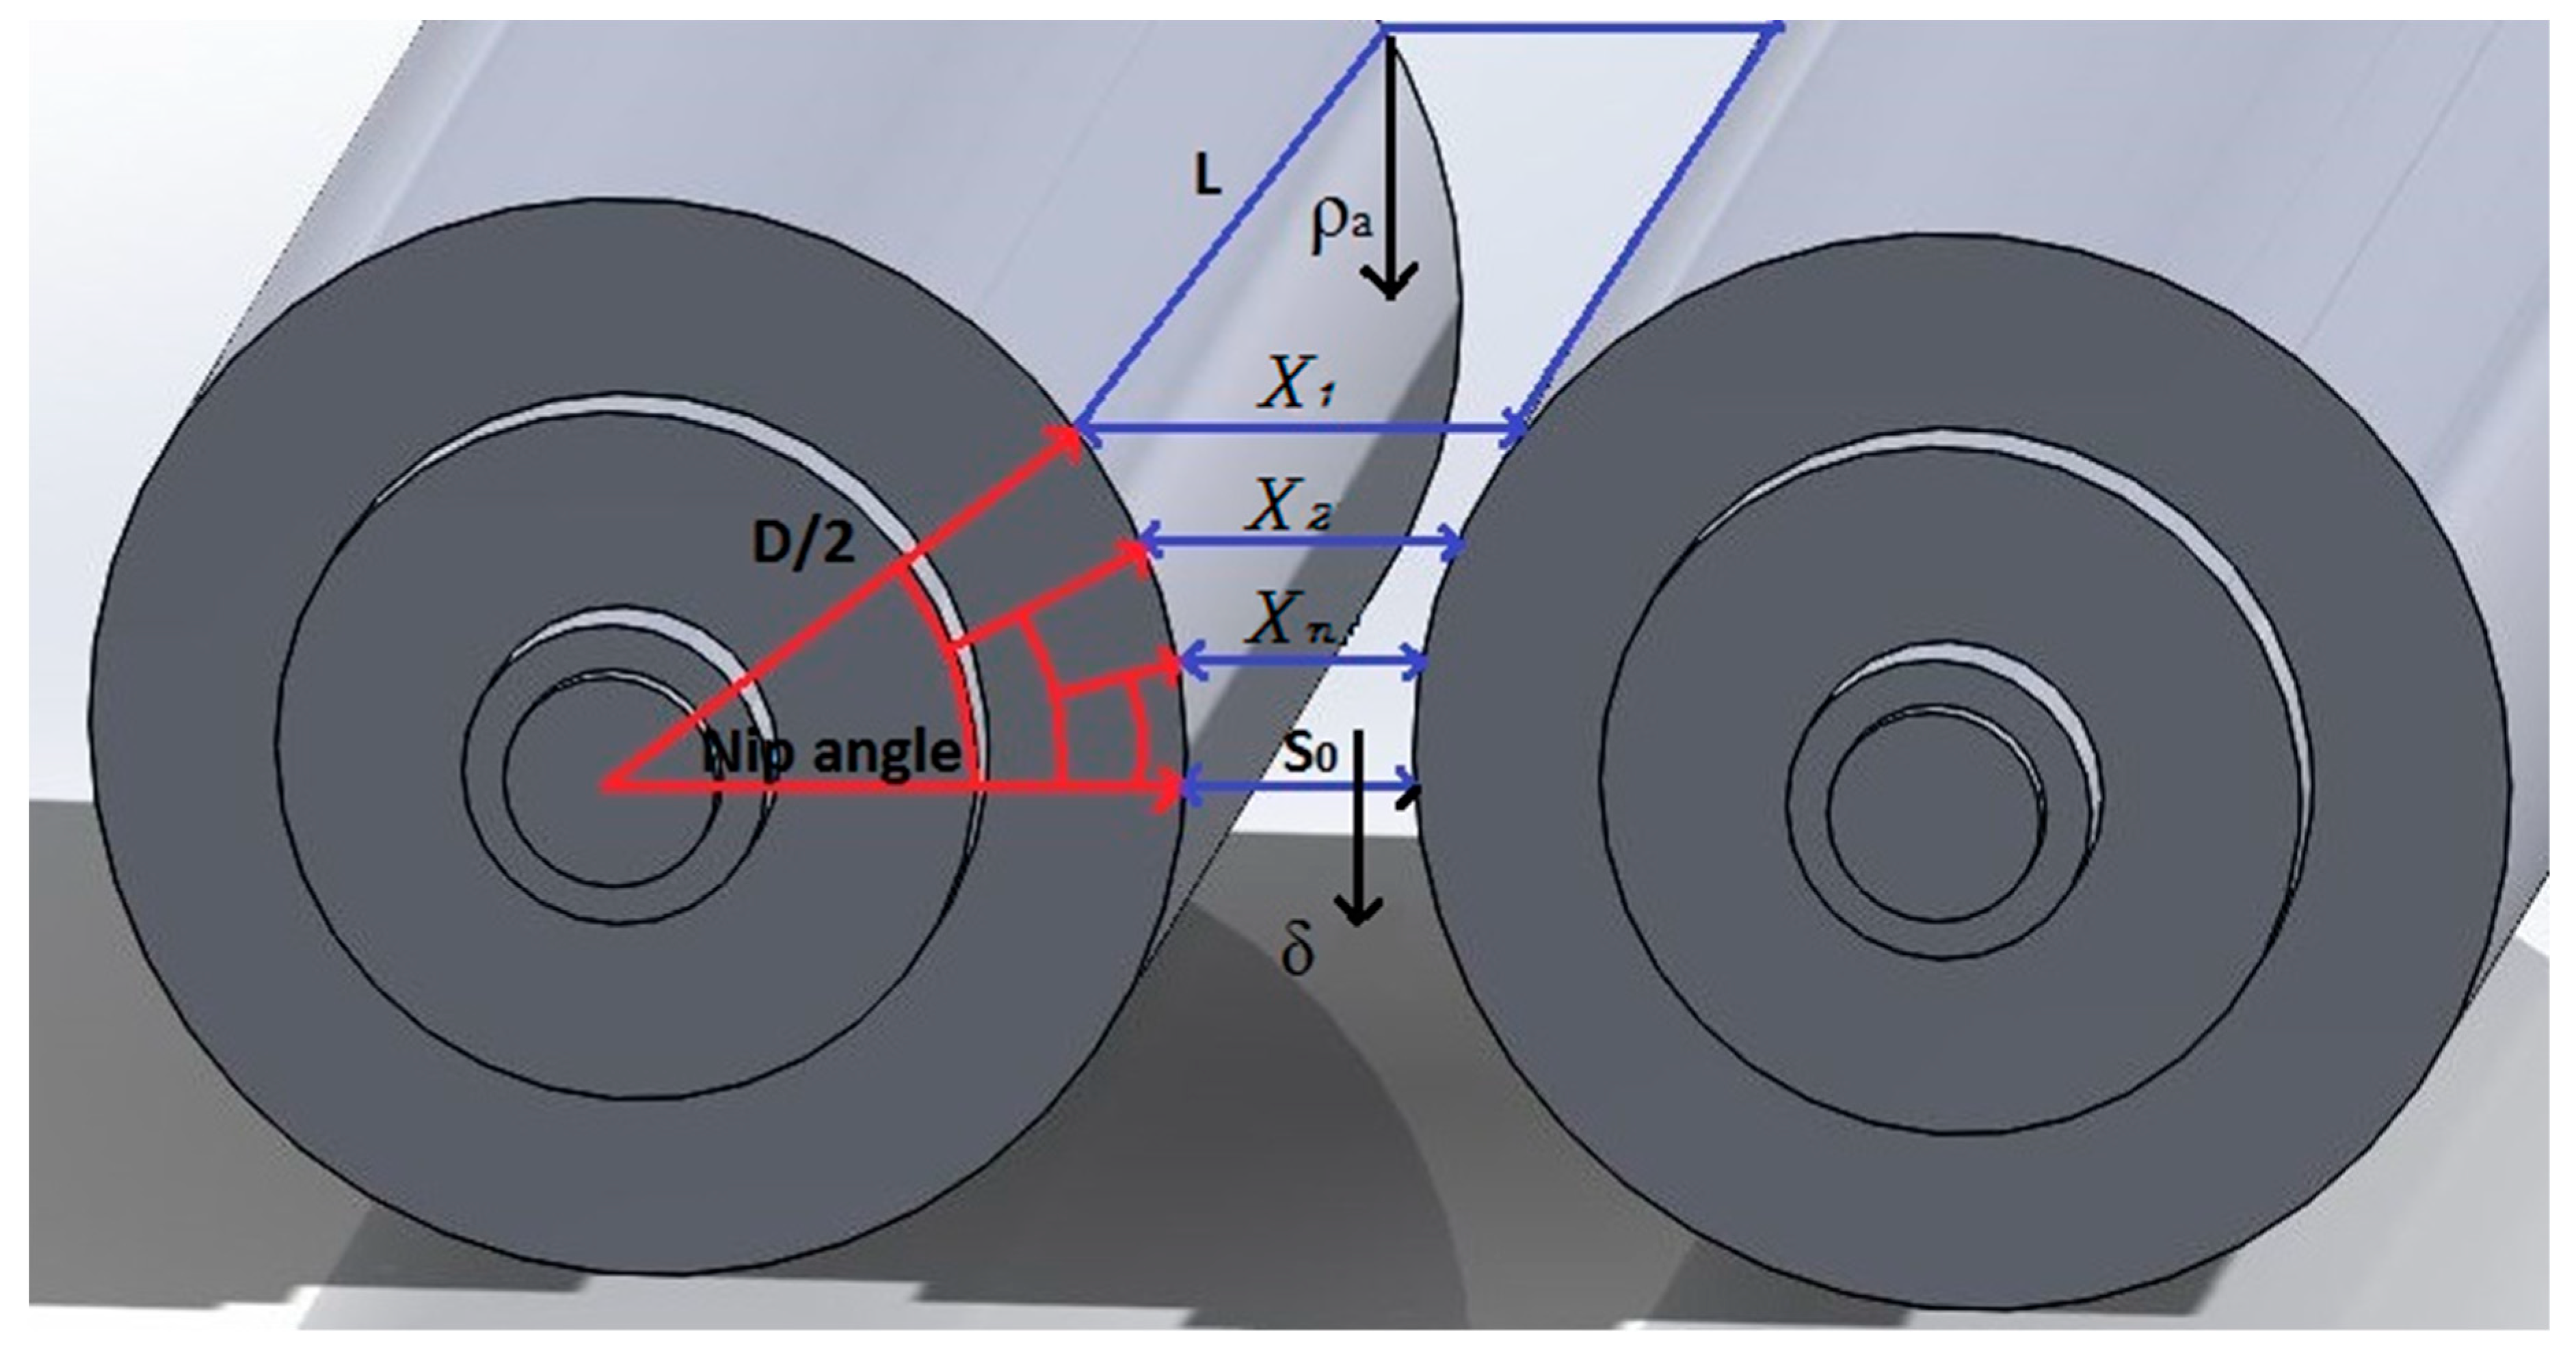
The parameter xn in Equation (3) represents the upper limit of the function and is given by the distance between rolls when the nipping action begins and d1 is the lower limit where the particles cannot be subjected to comminution under the single particle compression condition due to their size. Therefore, they tend to form in the bed compression zone, due to the interaction between coarse and fine particles. The parameter γ is related to the mineral characteristics [26] and describes the shape of the curve of the selection function Sn. The parameter xn (Equation (5)) represents the relationship among all geometric characteristics of the device, material feed size and other features such as the material density, gaps and the nip angle (Equation (6)) [8].
x n ( α n ) = S 0 + D ( 1 cos ( α n ) )
c o s ( α n i p ) = 1 D [ ( S 0 + D ) + ( S 0 + D ) 2 4 S 0 δ D ρ ]
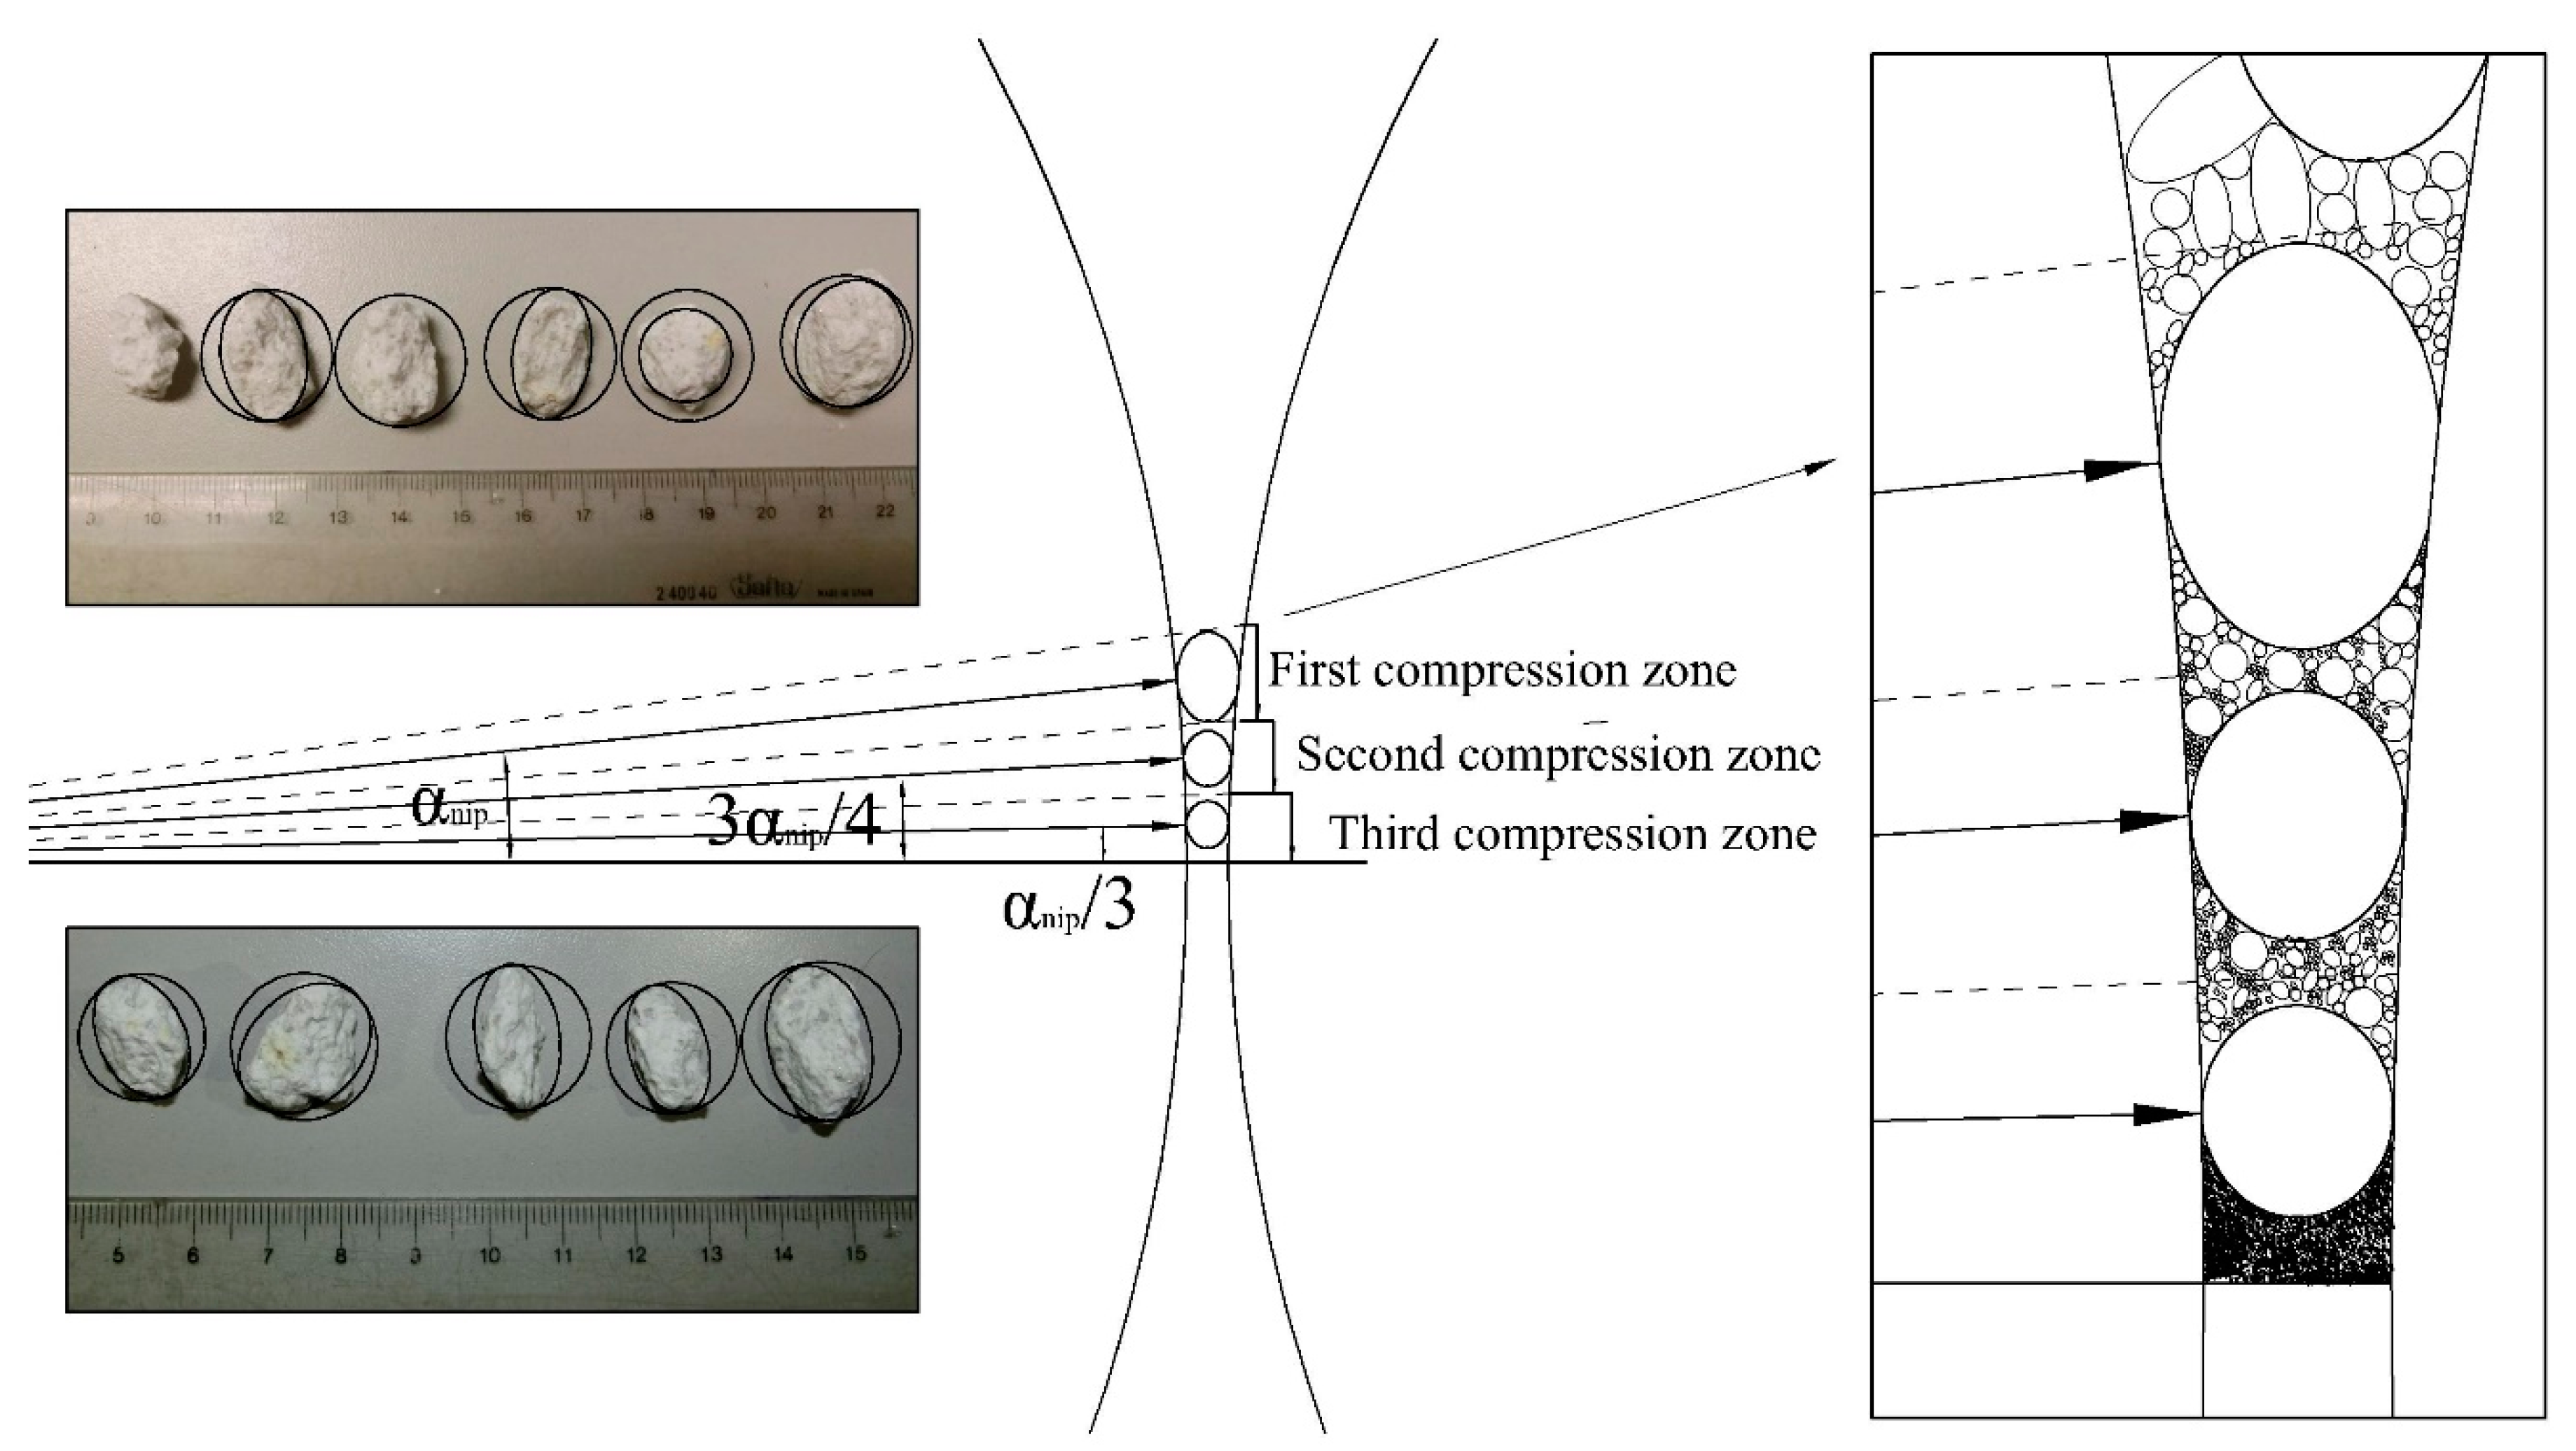
The parameter ρ (t/m3) in Equation (6) is the bulk density at the feed zone and δ (t/m3) is the bulk density at the extrusion zone, which is to say, the product density. Furthermore, D (m) is the roll diameter, and S0 (m) is the gap. The values of the vector Sn depend on x n , which is a function of the angle α (Figure 5). Nt denotes the number of single particle compression stages necessary to simulate the breakage of the material until almost all particles reach the gap size and they can be considered as a final product [8]. The angles used to evaluate the function x n are defined as in Equation (7).
α n = N t ( n 1 ) N t α n i p   n = 1 N t
In order to evaluate the value of Nt in the crushing stages, several simulations of single particle compression were performed, using the breakage function parameters found [24]. Equation (8) is presented to determine that lumps larger than the gap that must undergo repetitive breakage in order to be realized as a final product [6]:
b i j s x   f i = P i 1 .
b i j s x   P i 1 = P i 2
b i j s x   P i 2 = P i 3
b i j s x   P i N t 1 = P i N t
Equation (8) is a loop of matrices’ product x that stops when no more particles larger than the gap size are generated, and Nt is determined by the number of steps necessary to reach this size. In this work, the way in which the value of Nt is determined is compared with other characteristics of the material, such as the shape of the particles and the distance of the rollers for each rupture stage.
Matrix notations are presented in Figure 6, where I = 1 … m, j = 1 … m and n = 1 … Nt, with m being the pi vector length (Figure 6).
The model fit was evaluated by measuring the agreement between the experimental data and the model’s predictions. Although the mean absolute error (MAE) is simpler and direct [29], the best tool to appraise this difference is the Root Mean Square Error (RMSE) (Equation (9)) mainly due to the fact that most of the model errors were produced on key parameters of a typical particle size distribution (PSD) such as the P80 or P50. RMSE gives higher weight to large errors rather than lower errors in the formalism [30]. In this case, the evaluation of results is more adverse and, therefore, more demanding.
RMSE = 1 N i = 1 N ( p i y i ) 2
The parameter N in Equation (9) is the length of the input vector, p is the experimental values of the vector and y represents the simulated values. In order to obtain concise evaluations, two phases or local sections of the obtained curves were defined: the fine phases represented by all particles under 850 microns, and the coarse phase when the particles were over this cut-size.
The percentage variation (Equation (10)) was used to evaluate local values.
% = 100   x   | V i V f | | V i |
In Equation (10), Vi is the initial value and Vf the final value.
The model was programmed in a MATLAB® script (R2016a) and different solver functions from the tool-box were used to run the program in order to minimise the RMSE of the selected data.

3. Results and Discussion

3.1. Experimental Results

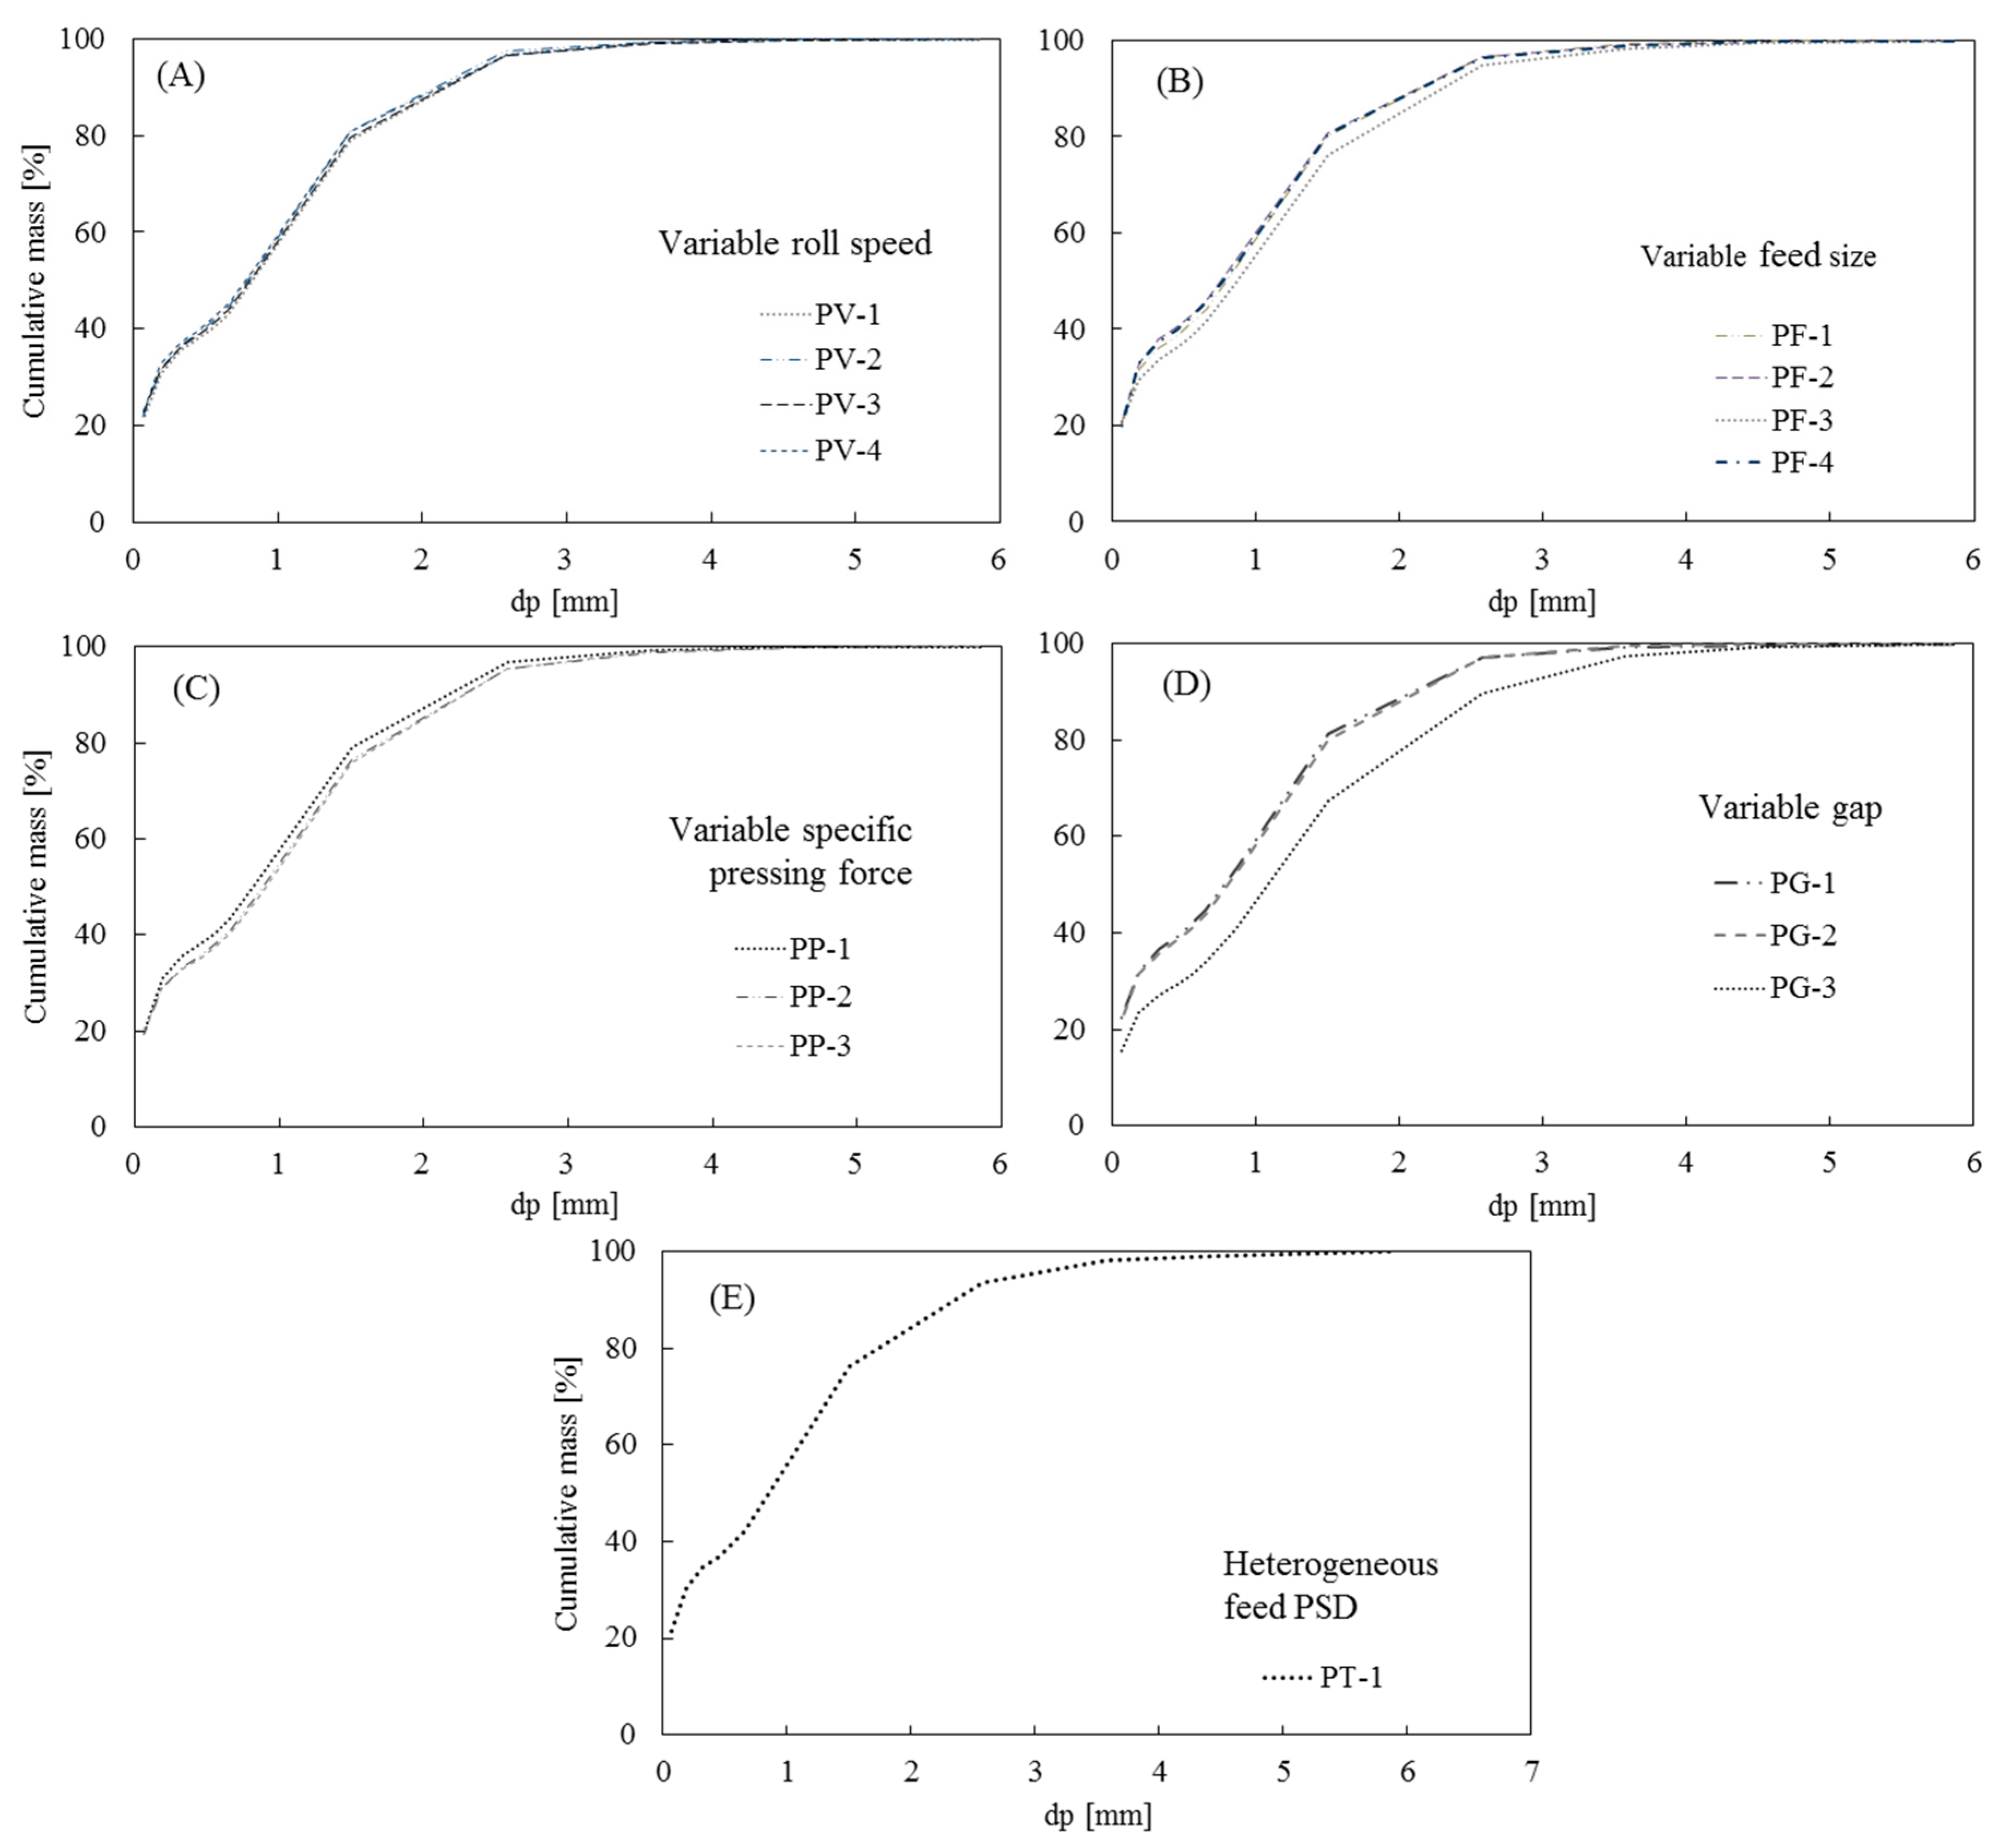
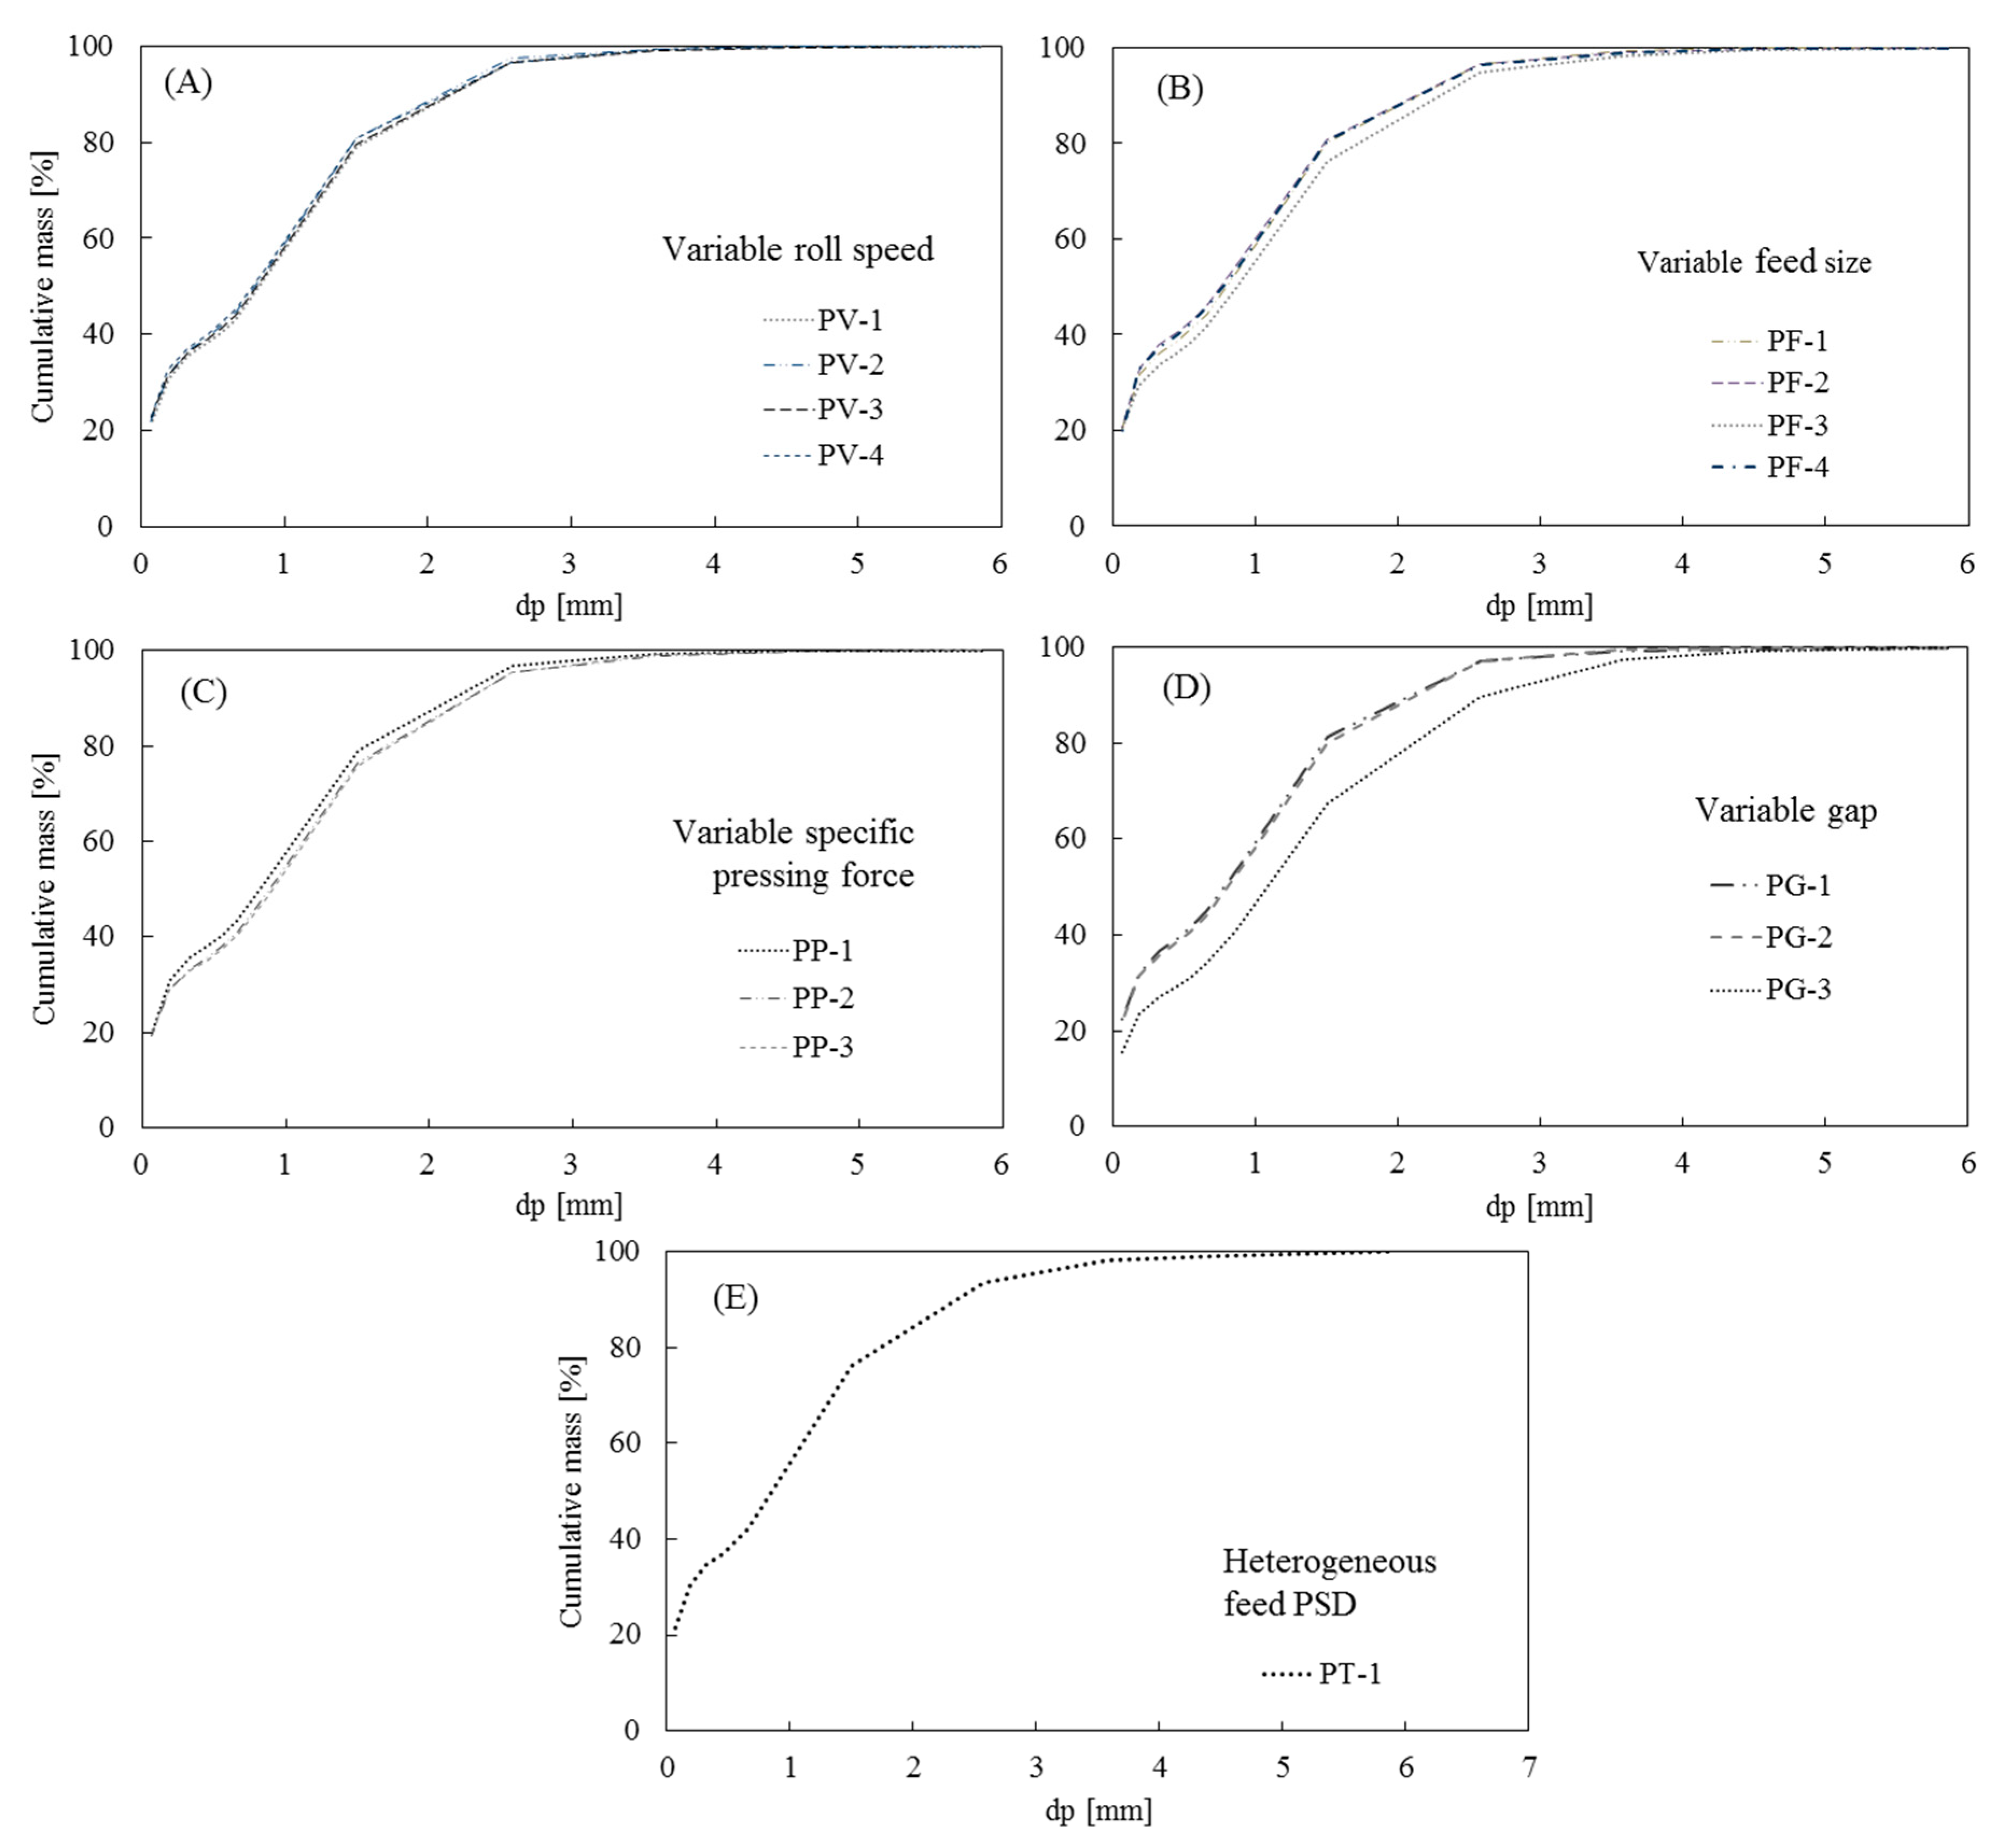
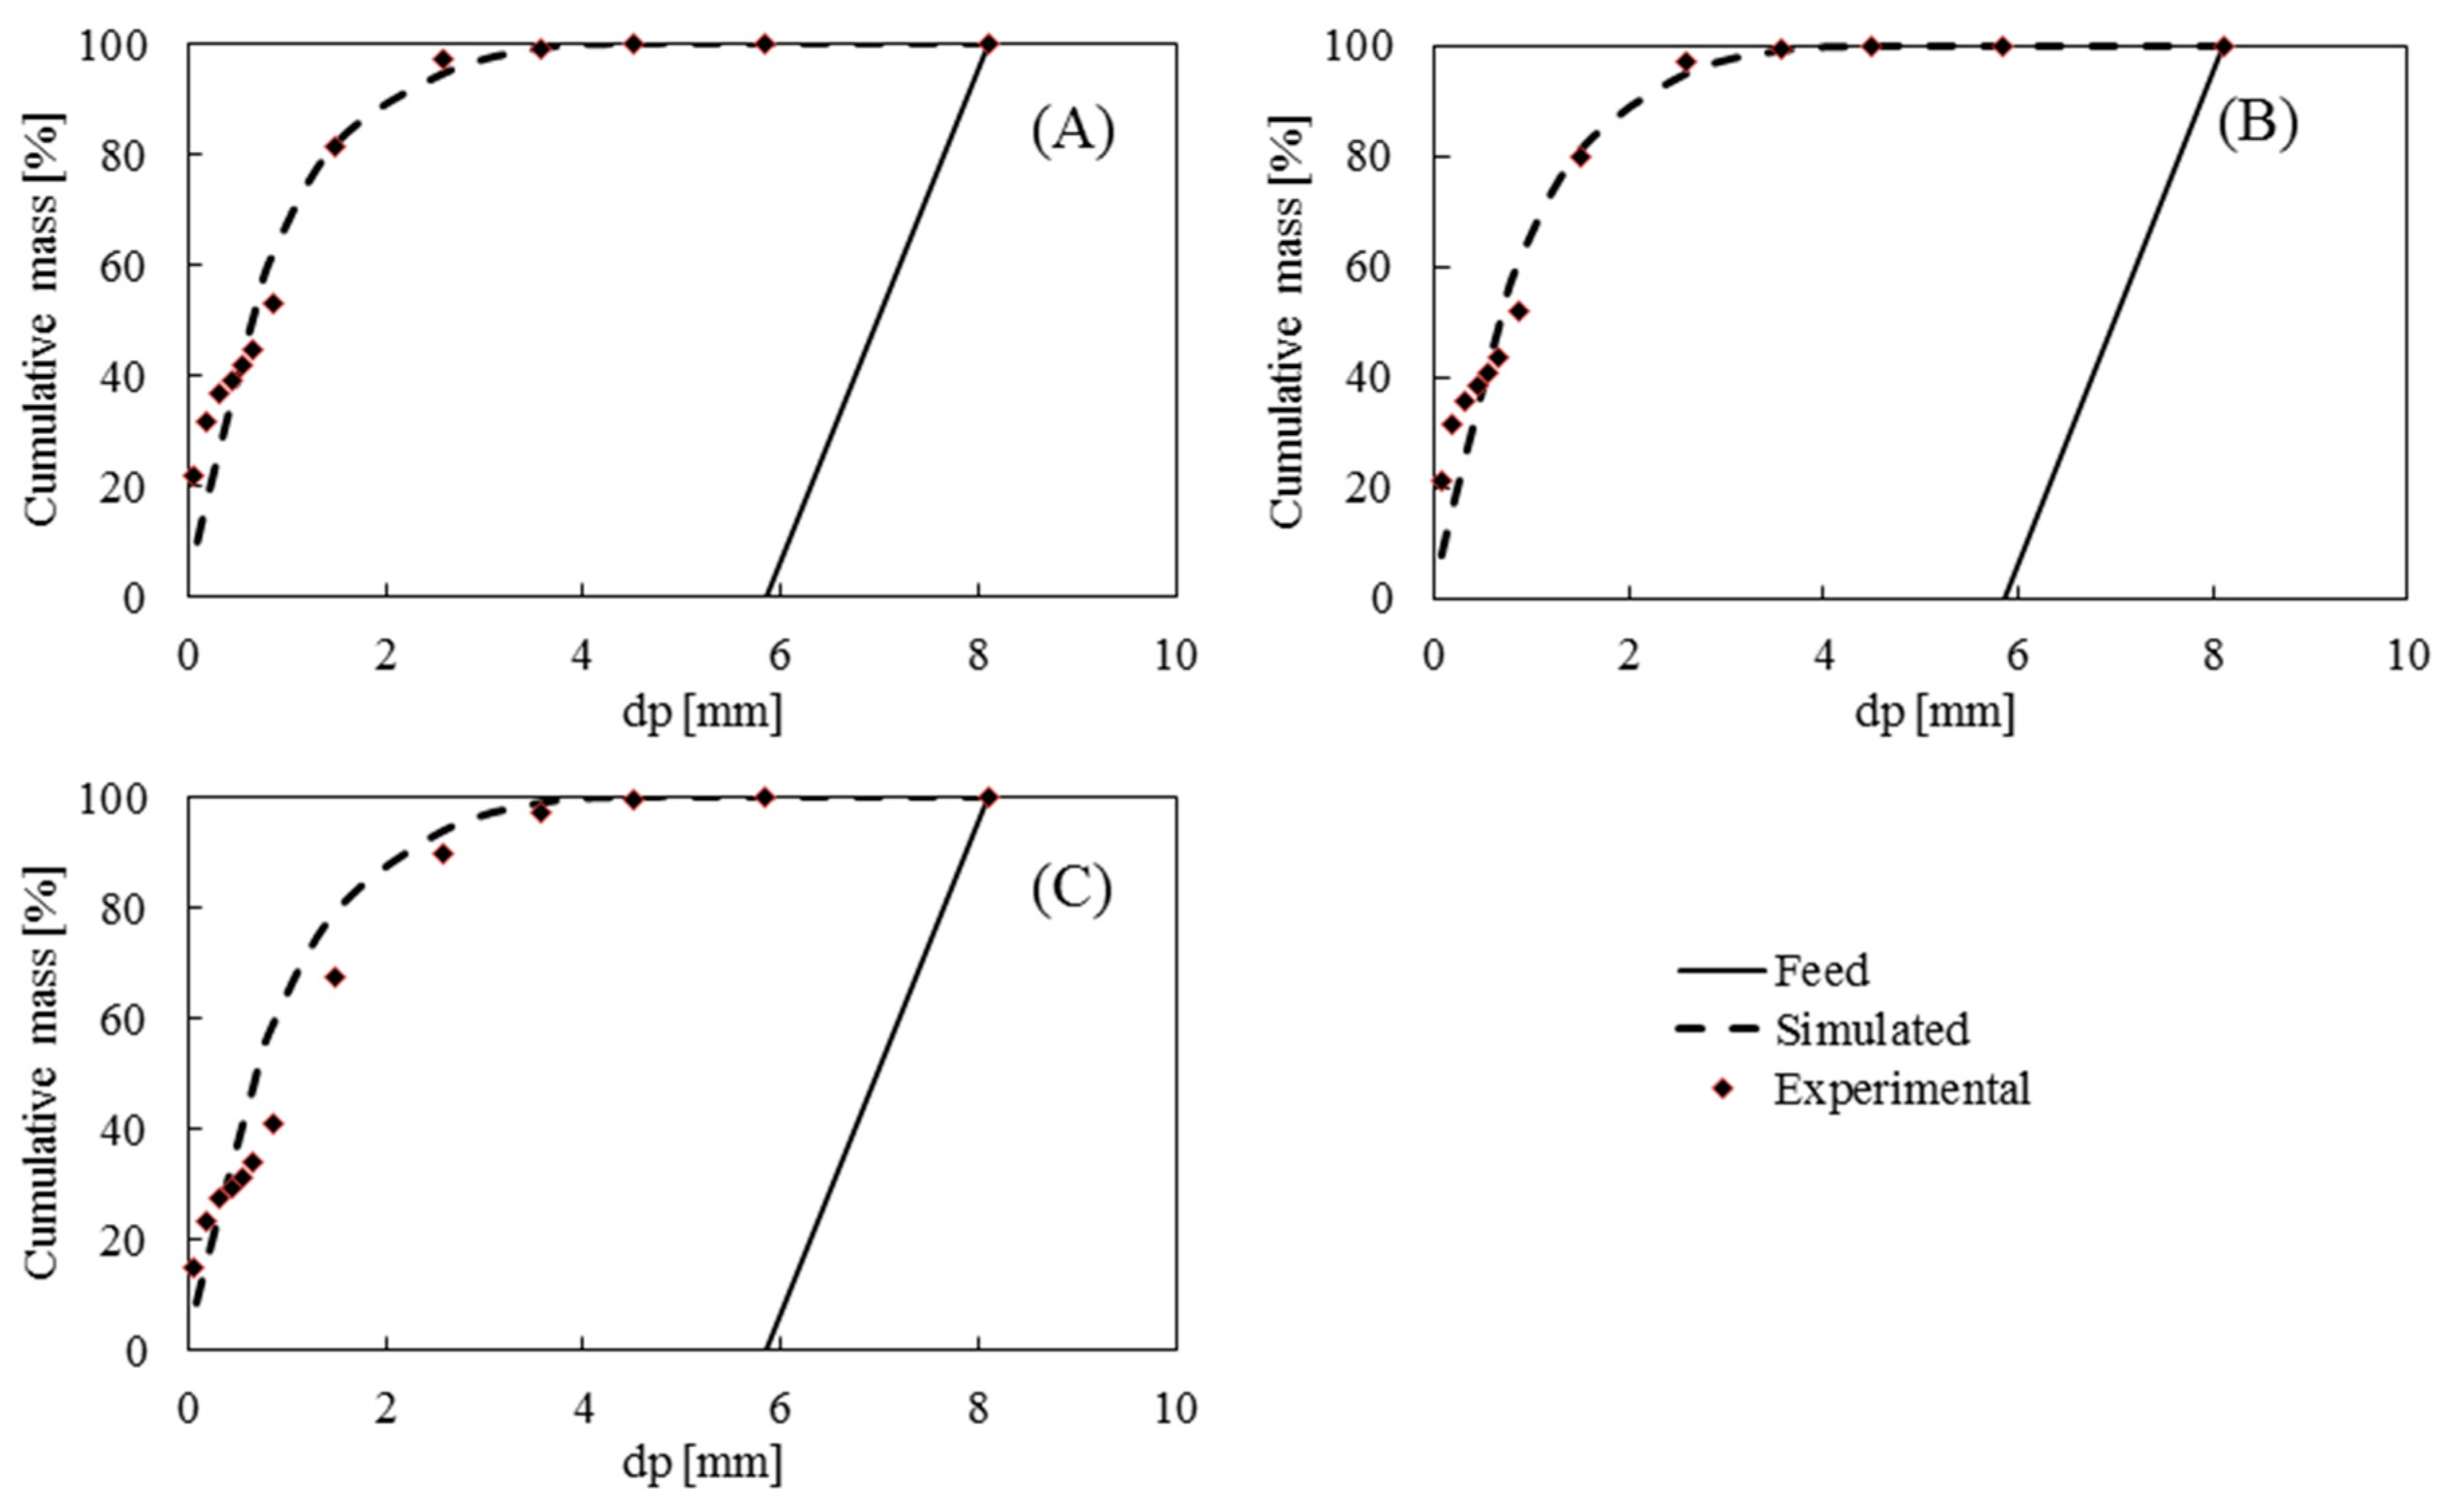
Both in the original Austin model and in the presented model, roll speed had no effect on the product particle size distribution calculation. The results of the experiments performed with the lab-scale high pressure roll crusher have a similar range of values even when the rotational speed of the rolls was changed. In the case of the altered granite (Figure 7A), the curves overlap between them. In the case of the calc-silicate (Figure 8A), the distance between curves can be perceived, but some of the key parameters such as the D80, which only varies from 3.4 mm to 3.7 mm, or the D50, which has a minimum value of 1.1 mm and maximum value of 0.95 mm, represent percentage variations of 8% and 13%, respectively.
When the feed particle size was modified (Figure 7B), the impact on the resulting size distribution was surprisingly unexceptional. No significant differences among the particle size product curves between experiments PF-1, PF-2 and PF-4 can be observed, except by a slight displacement of around 8% of the curve PF-3.
Experiments performed with different specific pressing forces show different behaviour for each material. For the altered granite, almost no differences were observed in the product size distribution for the range of 1.3 MPa to 2.5 MPa experiments (Figure 7C). In contrast, the calc-silicate material shows visible variations in front of changes, especially with low specific pressure forces (Figure 8B). Regarding the static setups, the product particle size distribution seems to be sensitive when the operational gap was opened further (Figure 7D). In terms of the size reduction ratio, this was remarkably high, reaching a 10 times reduction ratio for the PF-4 experiment, which was performed using the maximum feed top-size. The results of two experiments using heterogeneous feed particle size distribution (Figure 7E and Figure 8C) show similar behaviour compared with the other experiments with mono-size feed. These experiments were done in order to check the model in different operational conditions.

3.2. Model Capability

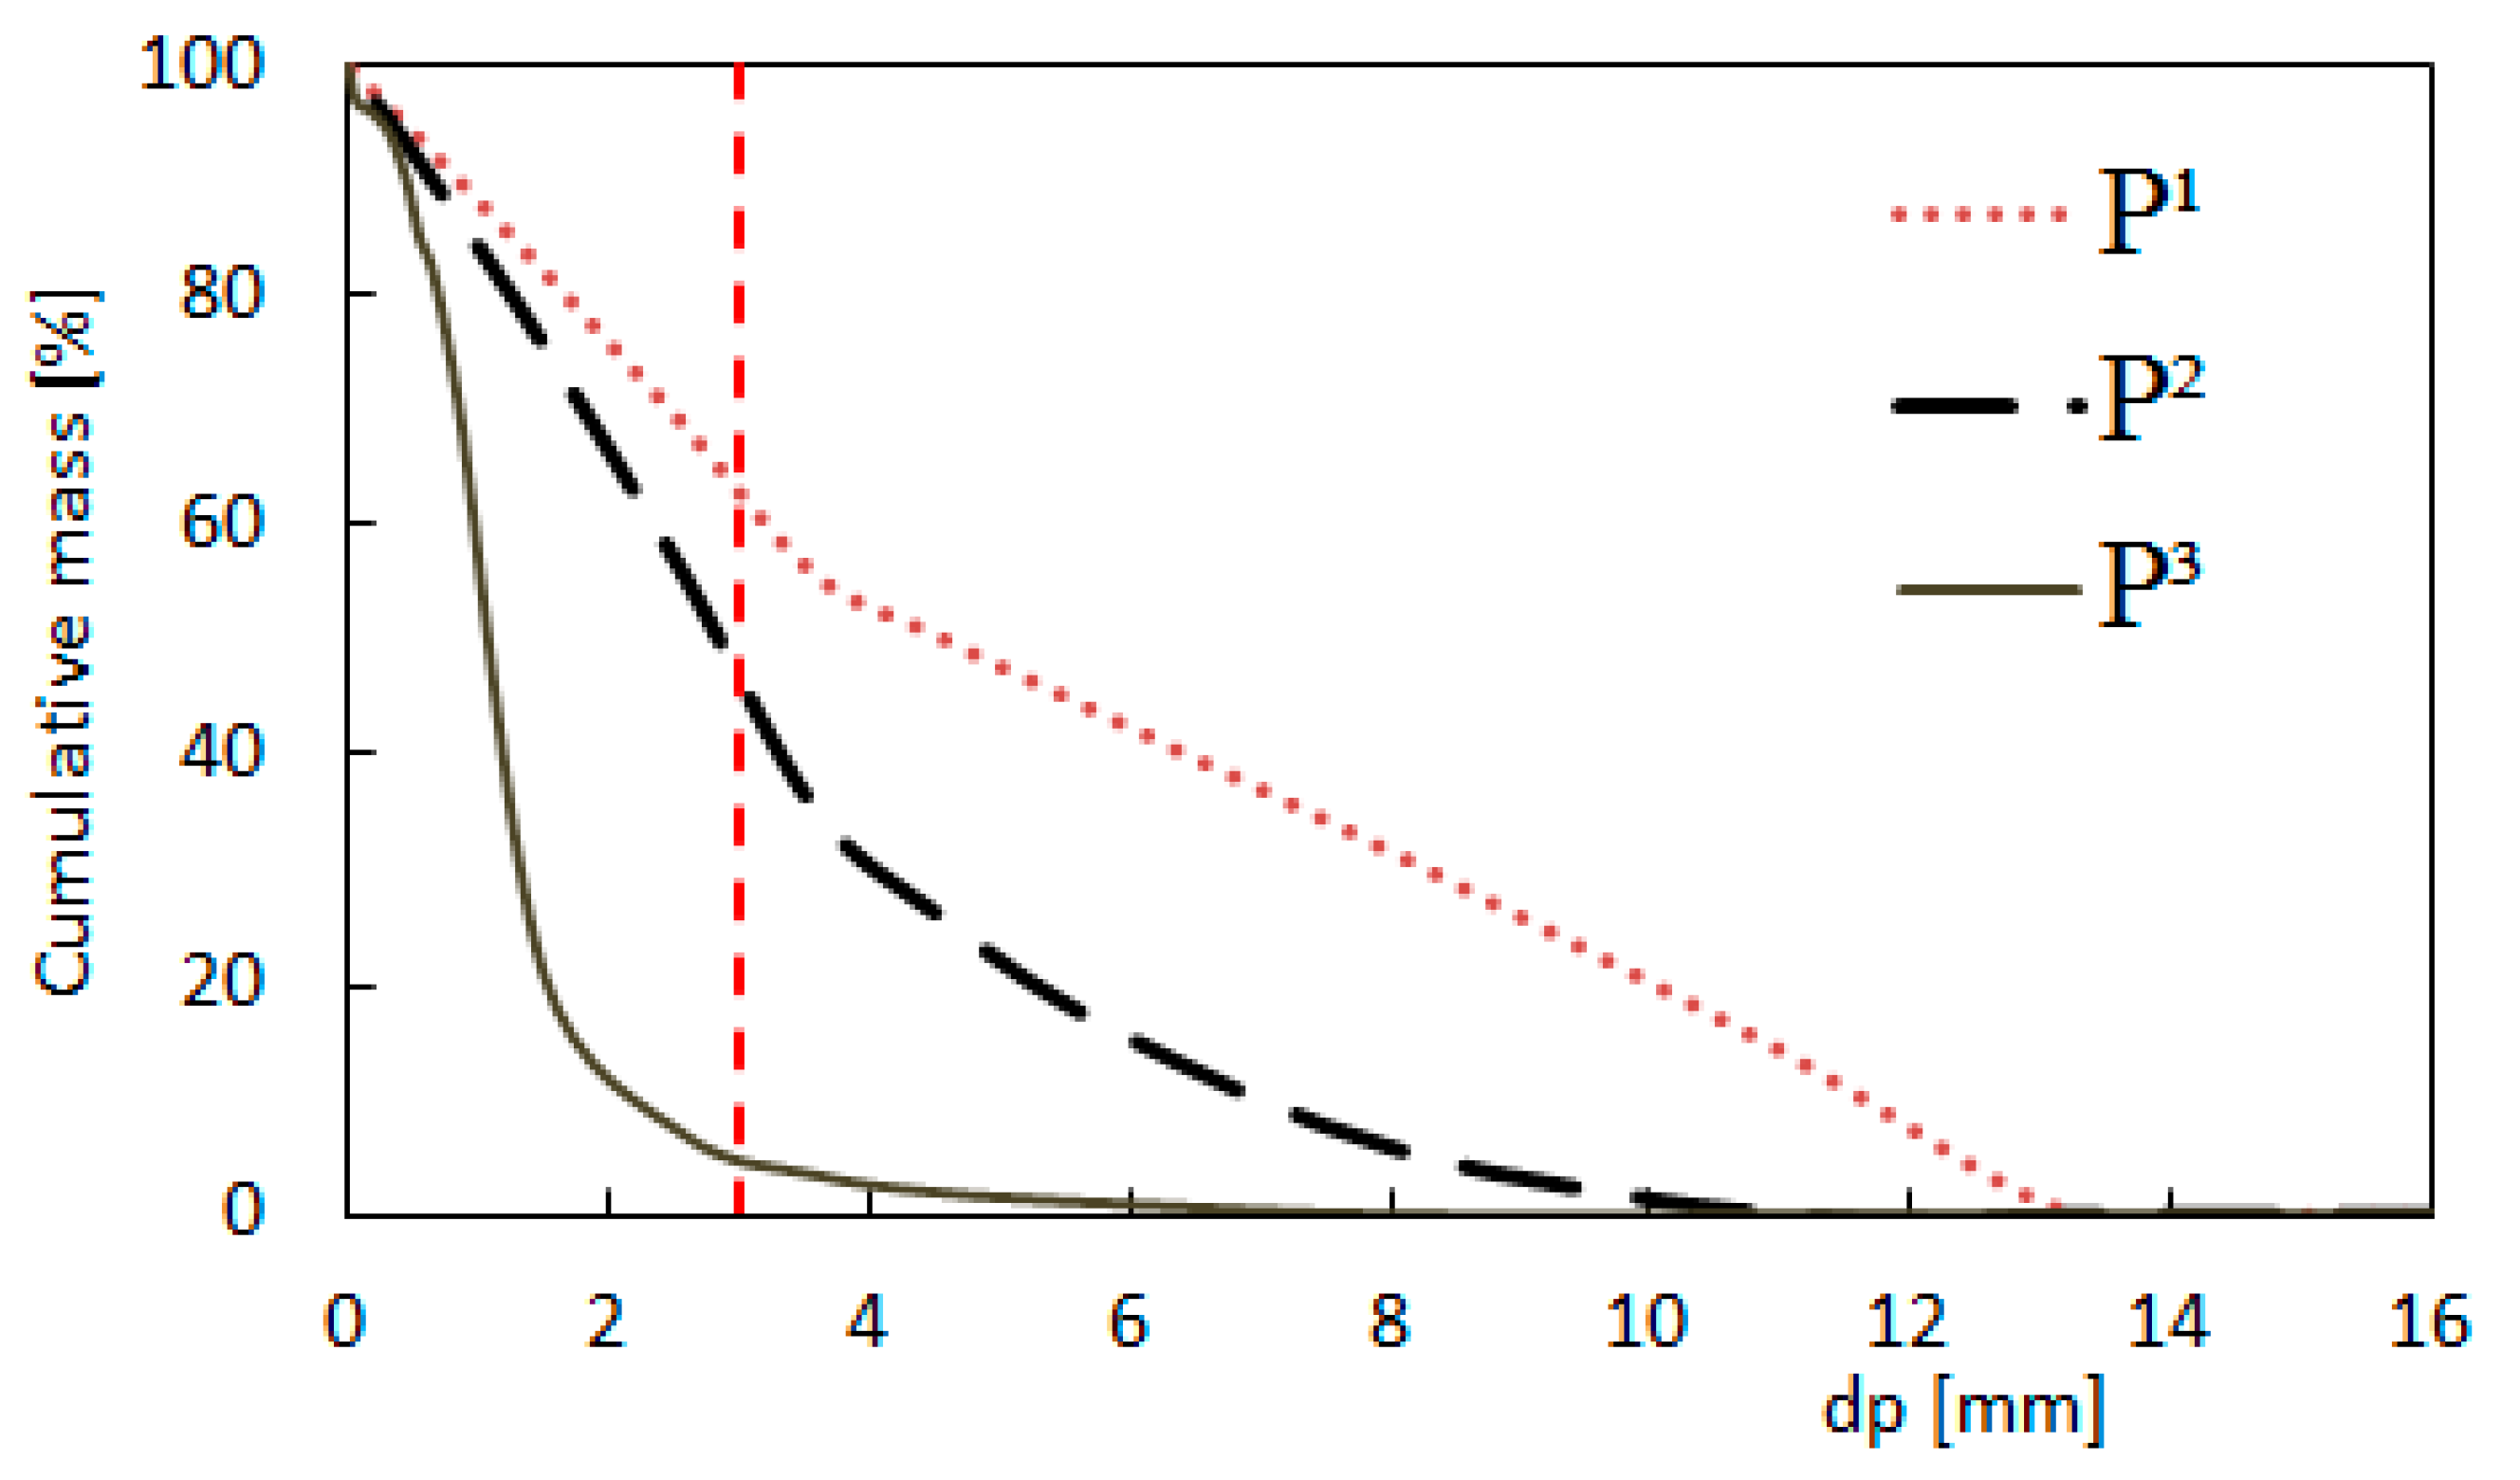
To verify the model and the prediction of the particle size distribution of the product, the altered granite was used. The breakage distribution function for single particle compression was analysed to define the number of Nt stages in order to run the model. Several simple compression stages were calculated in order to achieve this task, regardless of the selection function and avoiding the simultaneous steps of bed compression (Equation (8)), and using the experimentally determined parameters of the breakage distribution function (Table 3). Figure 9 shows an example in which the top-size particles range from 12.5 mm to 14 mm. Since the particles have an ellipsoid shape, they tend to fit in the nip zone through their smaller radius side. Once the first rupture is simulated with the product P1, more than 61% of the particles are still larger than the gap size (Figure 10), thus it is necessary to run a second stage of compression (P2). After three stages (P3), the calculations show that less than 5% of the particles are nominally larger than the gap size, and given the shape factor, most of these particles can pass through the gap between the rolls.
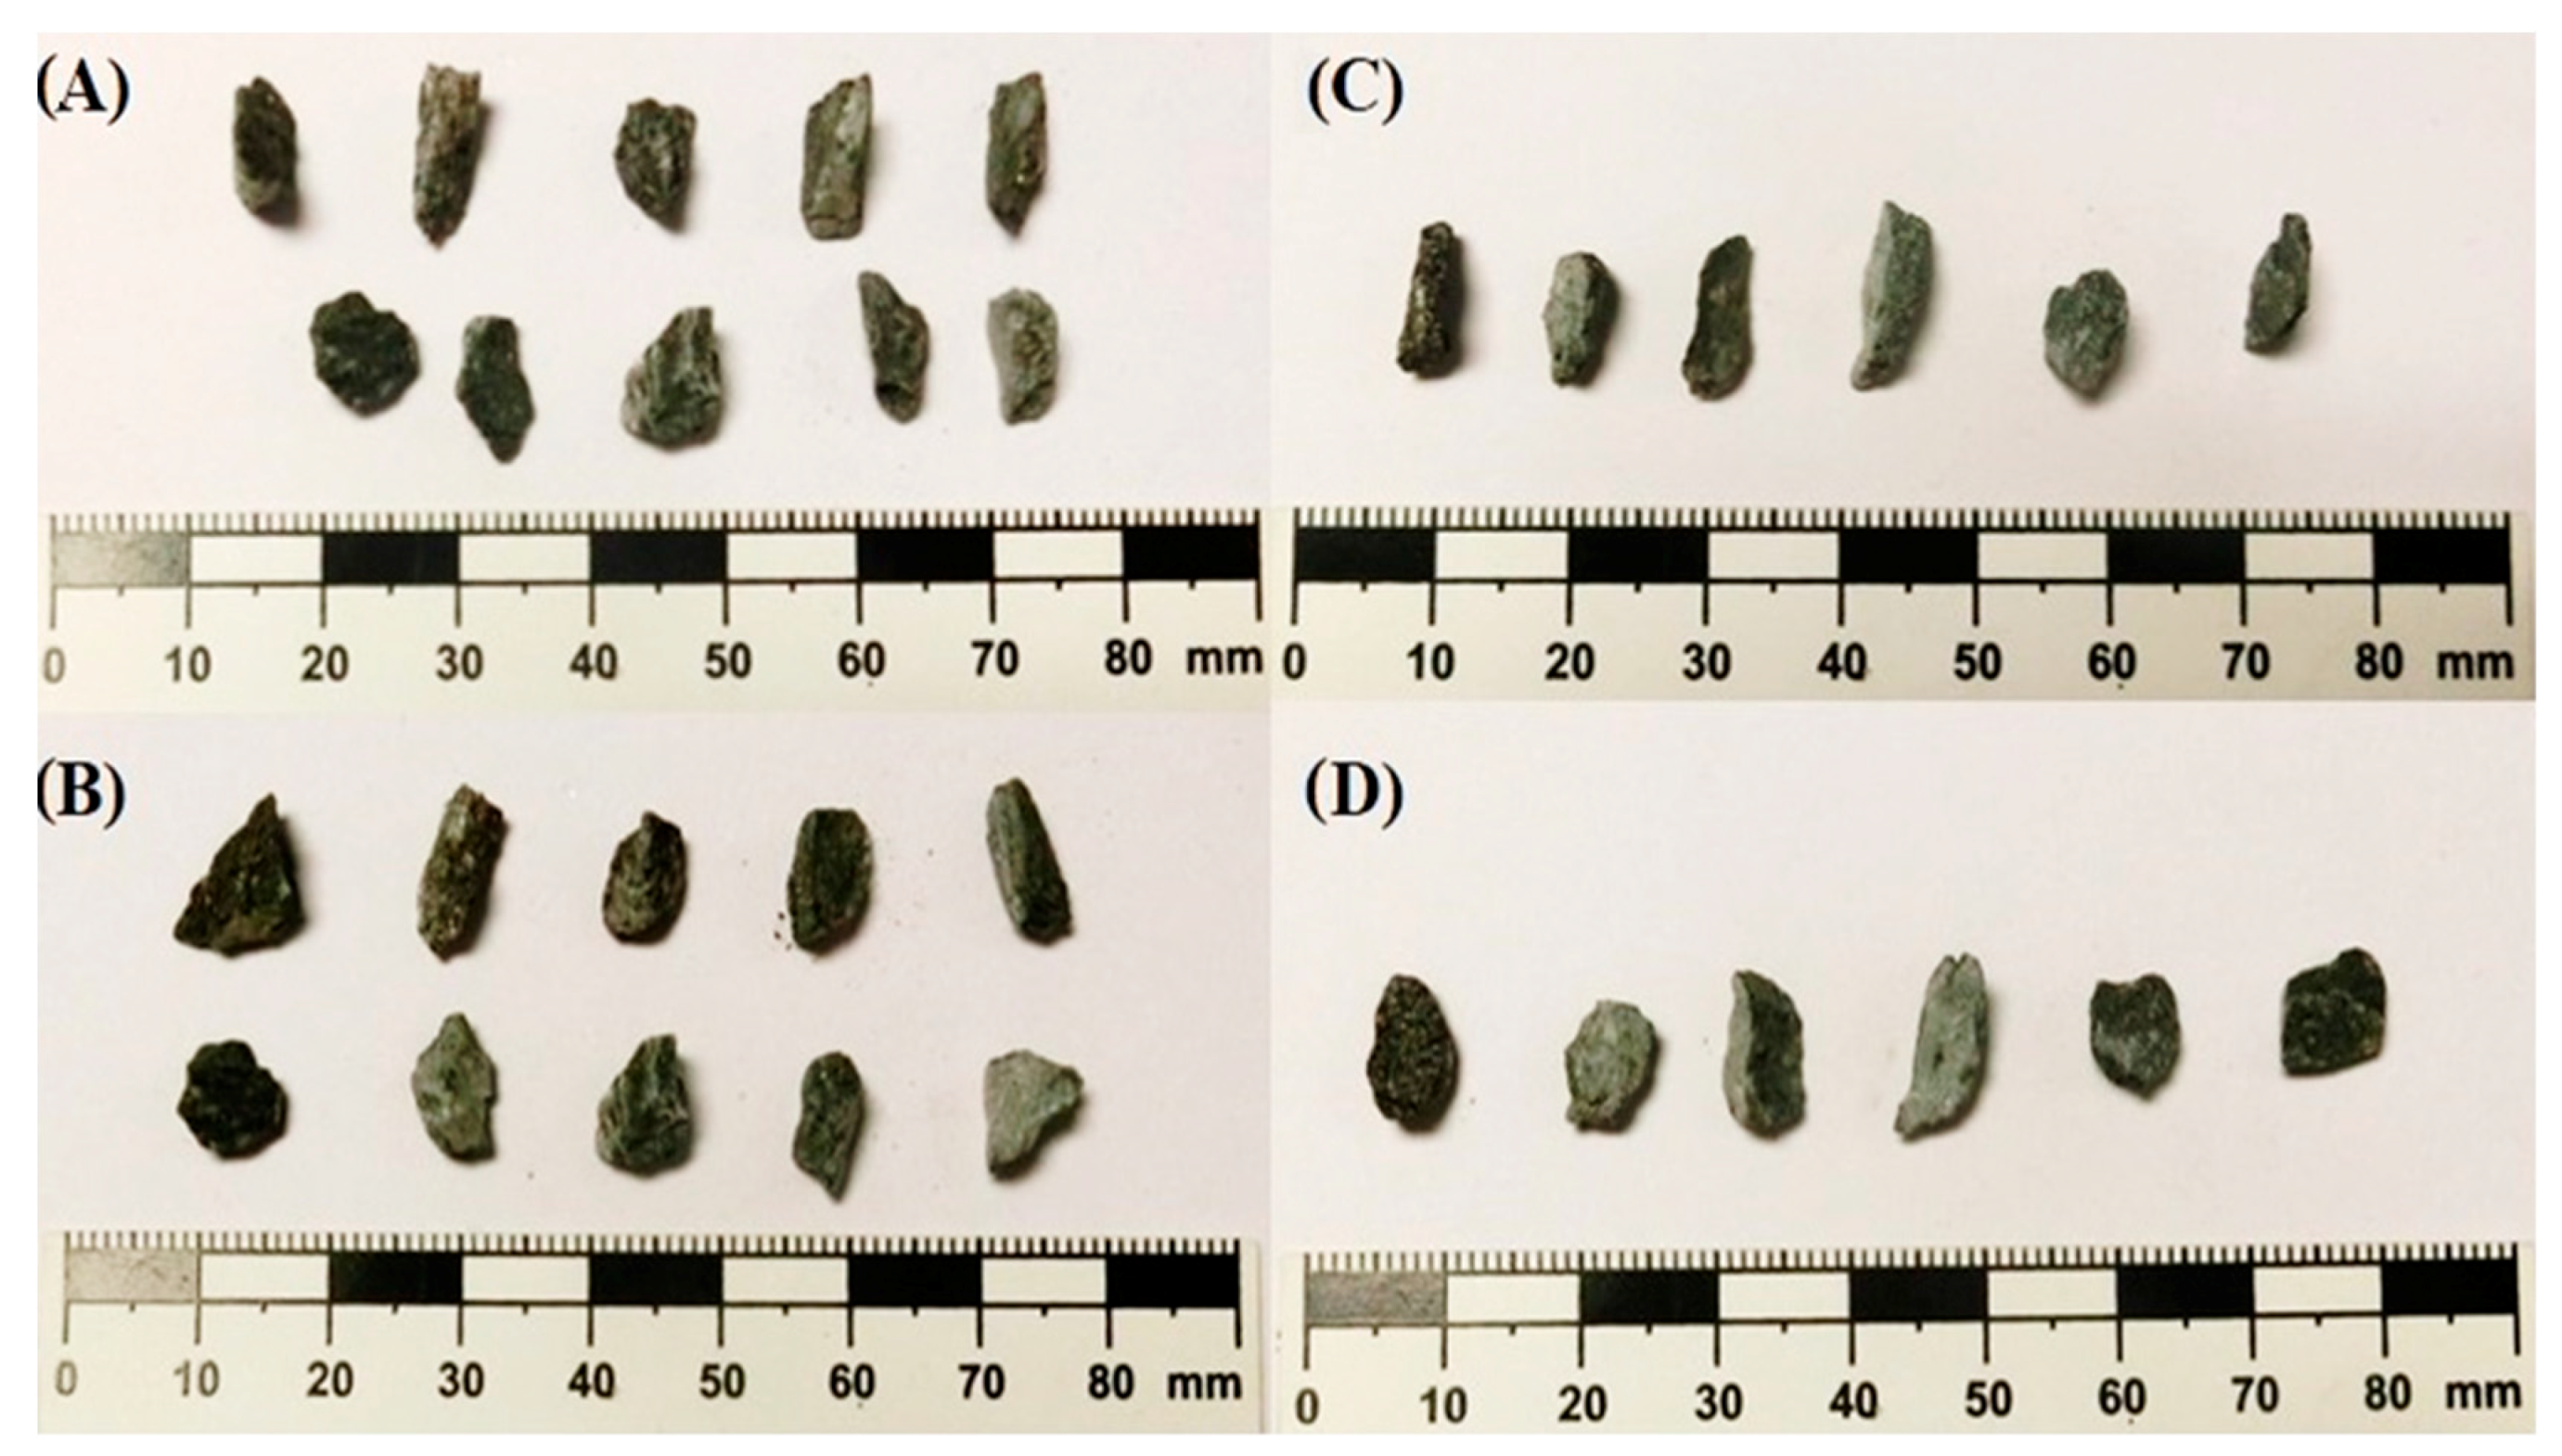
The same analysis was performed on the other size-ranges for this material, with the same results; the granite had to undergo three stages of single particle compression simulation. For the calc-silicate material, as the top-feed size ranged from 4.5 mm to 6.7 mm, and only two stages were necessary to reach the gap size of the product. The shape factor is also relevant to this material; angular particles have low sphericity in the near-gap size range (Figure 11). This unusual particle shape allows a certain percentage of the population to avoid compression and still pass through to the end as a product of grinding, where the particles are even nominally larger than the operational gap, although they were not subjected to any compression or crushing action. In industrial HPGR, this is a key factor in controlling the top-size product.
The model was executed with parameters selected from the breakage function tests, which are summarized in Table 3, using Nt = 3 for the altered granite and Nt = 2 in the case of the calc-silicate. The model variables α, xn were calculated (Table 4) using the previously presented equations (Equations (4)–(6)). The parameters d1 and γ were adjusted according to experimental data.
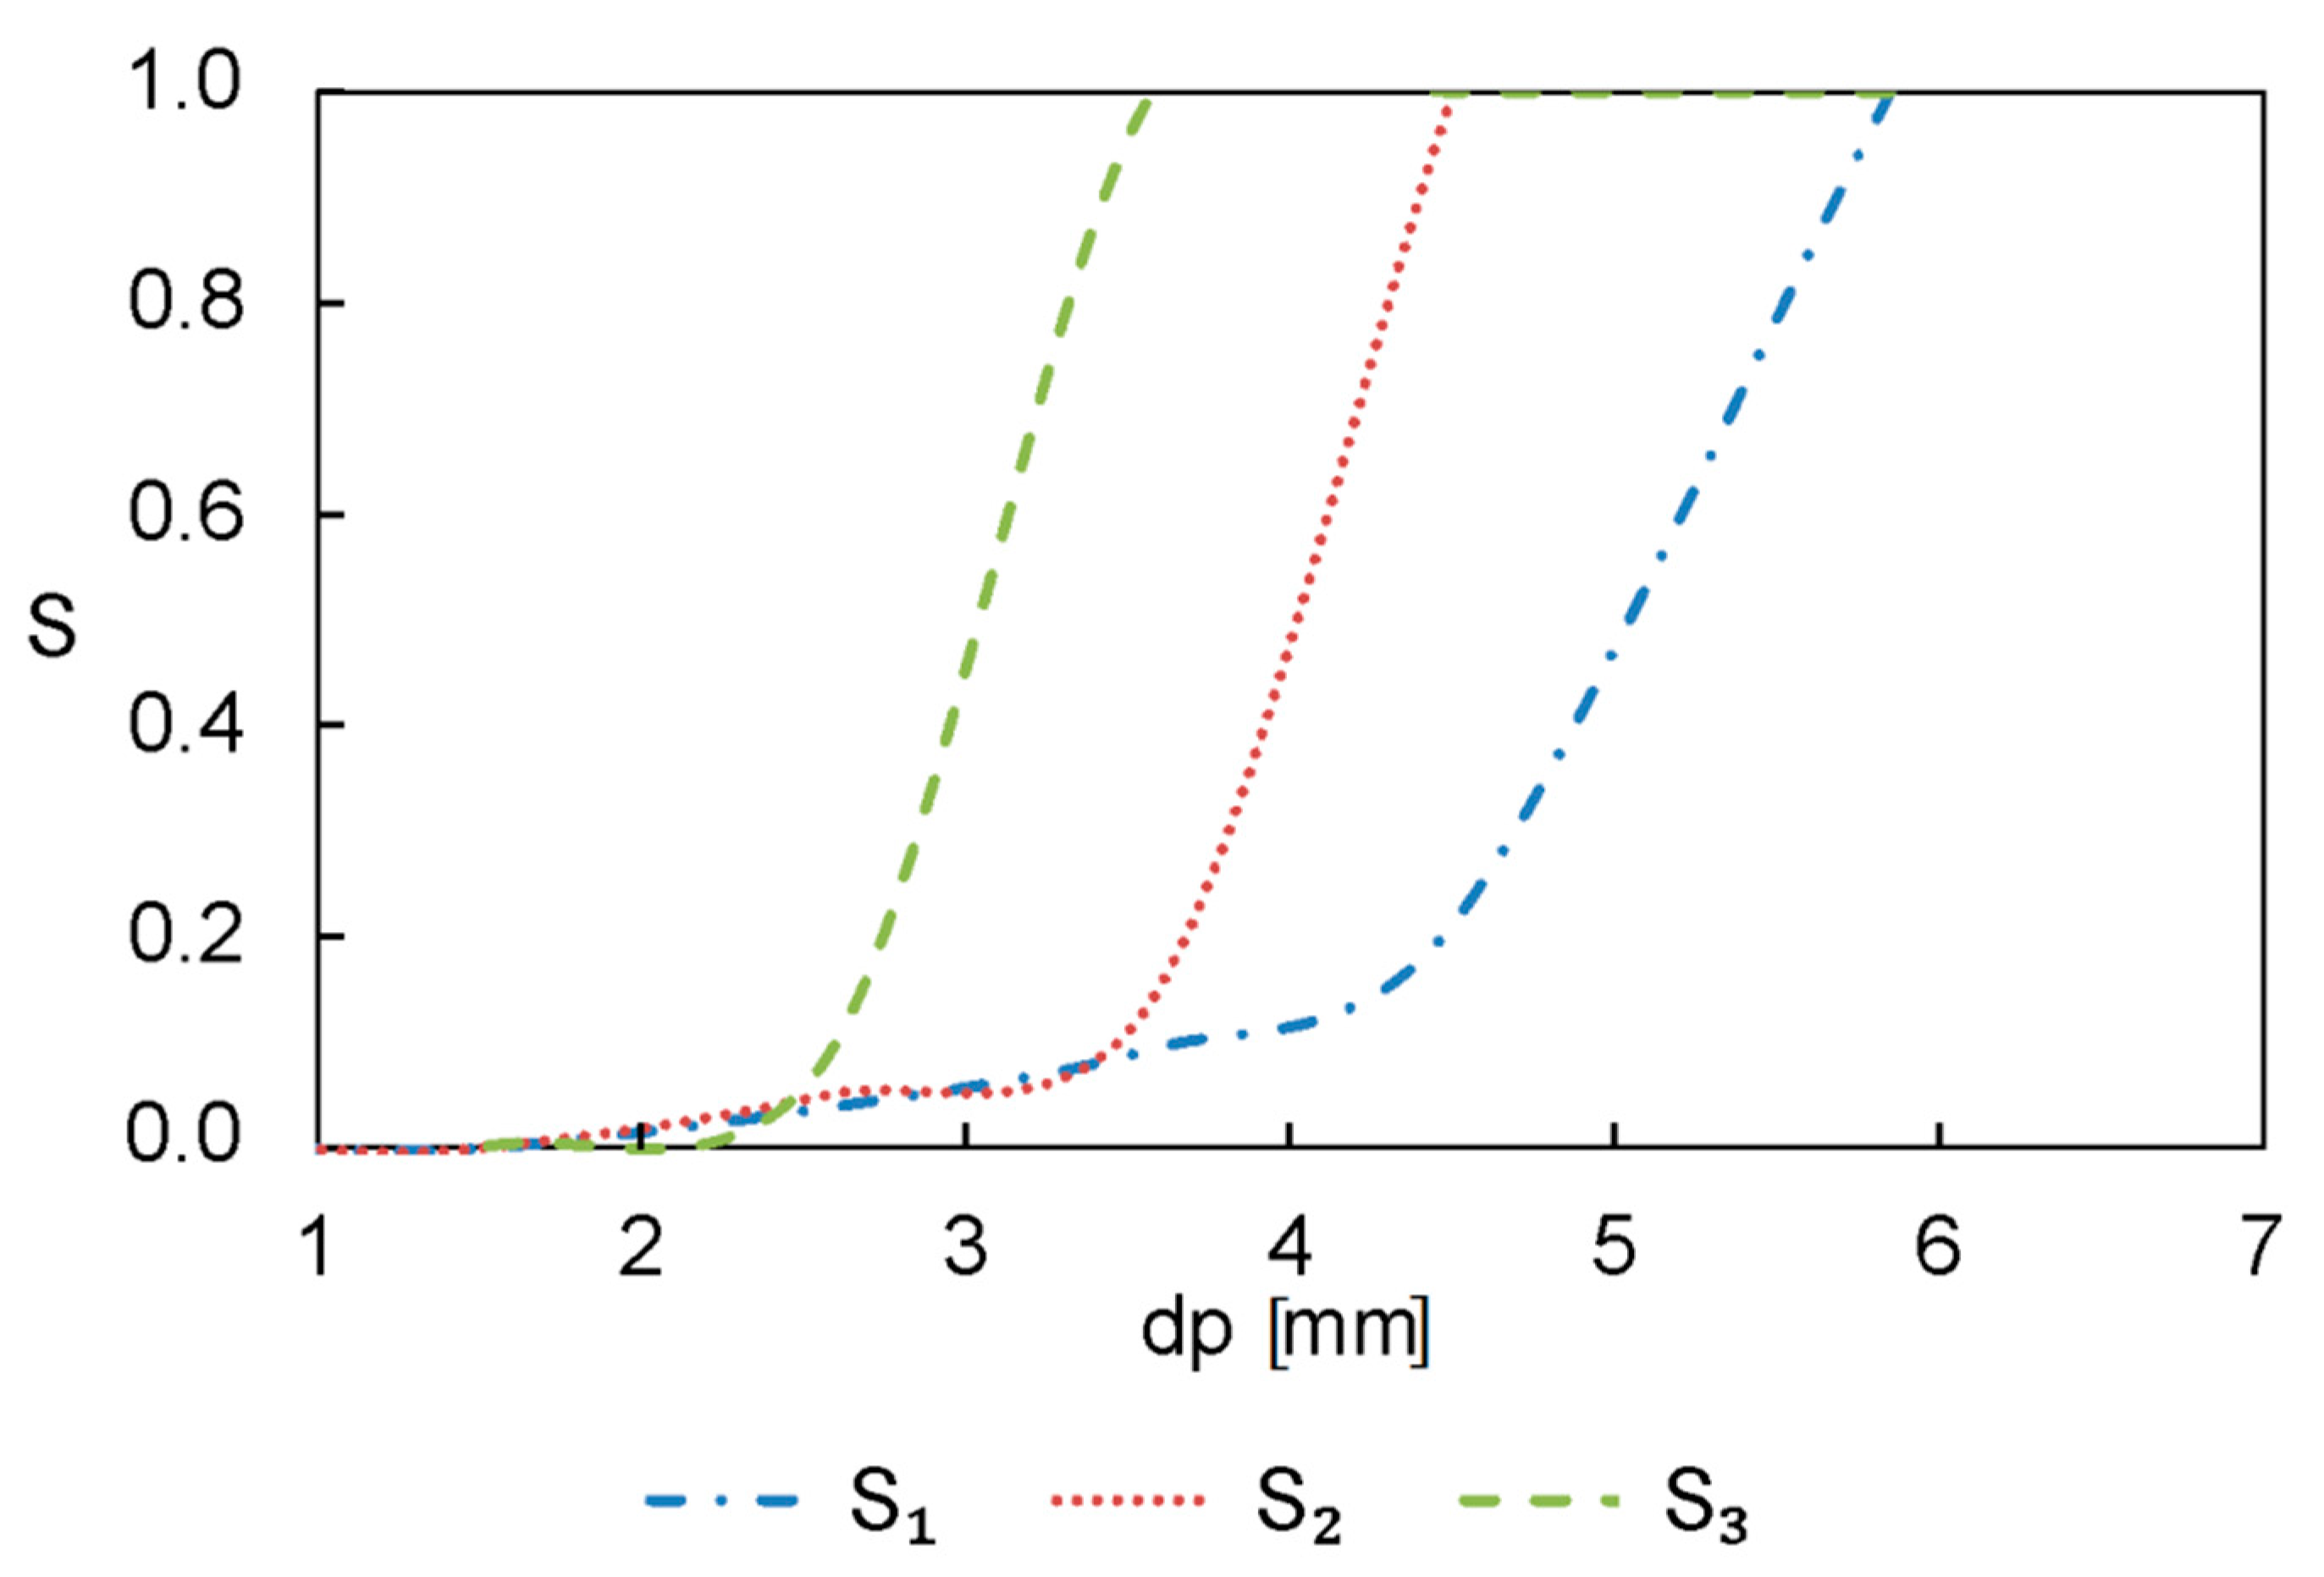
The selection function was executed using the calculated parameters from Table 4 and it indicates the probability of the particles being subjected to single particle compression or bed compression (Figure 12). It was observed that the values of S1, representing the selection function for the first stage, show an 80% probability of single particle compression for particles over 5.7 mm, 4.1 mm for the second stage S2, and then, this probability is applied to particles below 3.2 mm in the third stage S3. This means that all particles larger than the distance xn have a maximum probability of being broken under single particle compression. The displacement of the curves indicates the decrease in the possibility of being submitted under the pre-grinding zone and going directly to the compression condition of the particle bed. If these particles were put under a roll crusher, the finer particles could bypass each step and become direct products of the primary crushing.
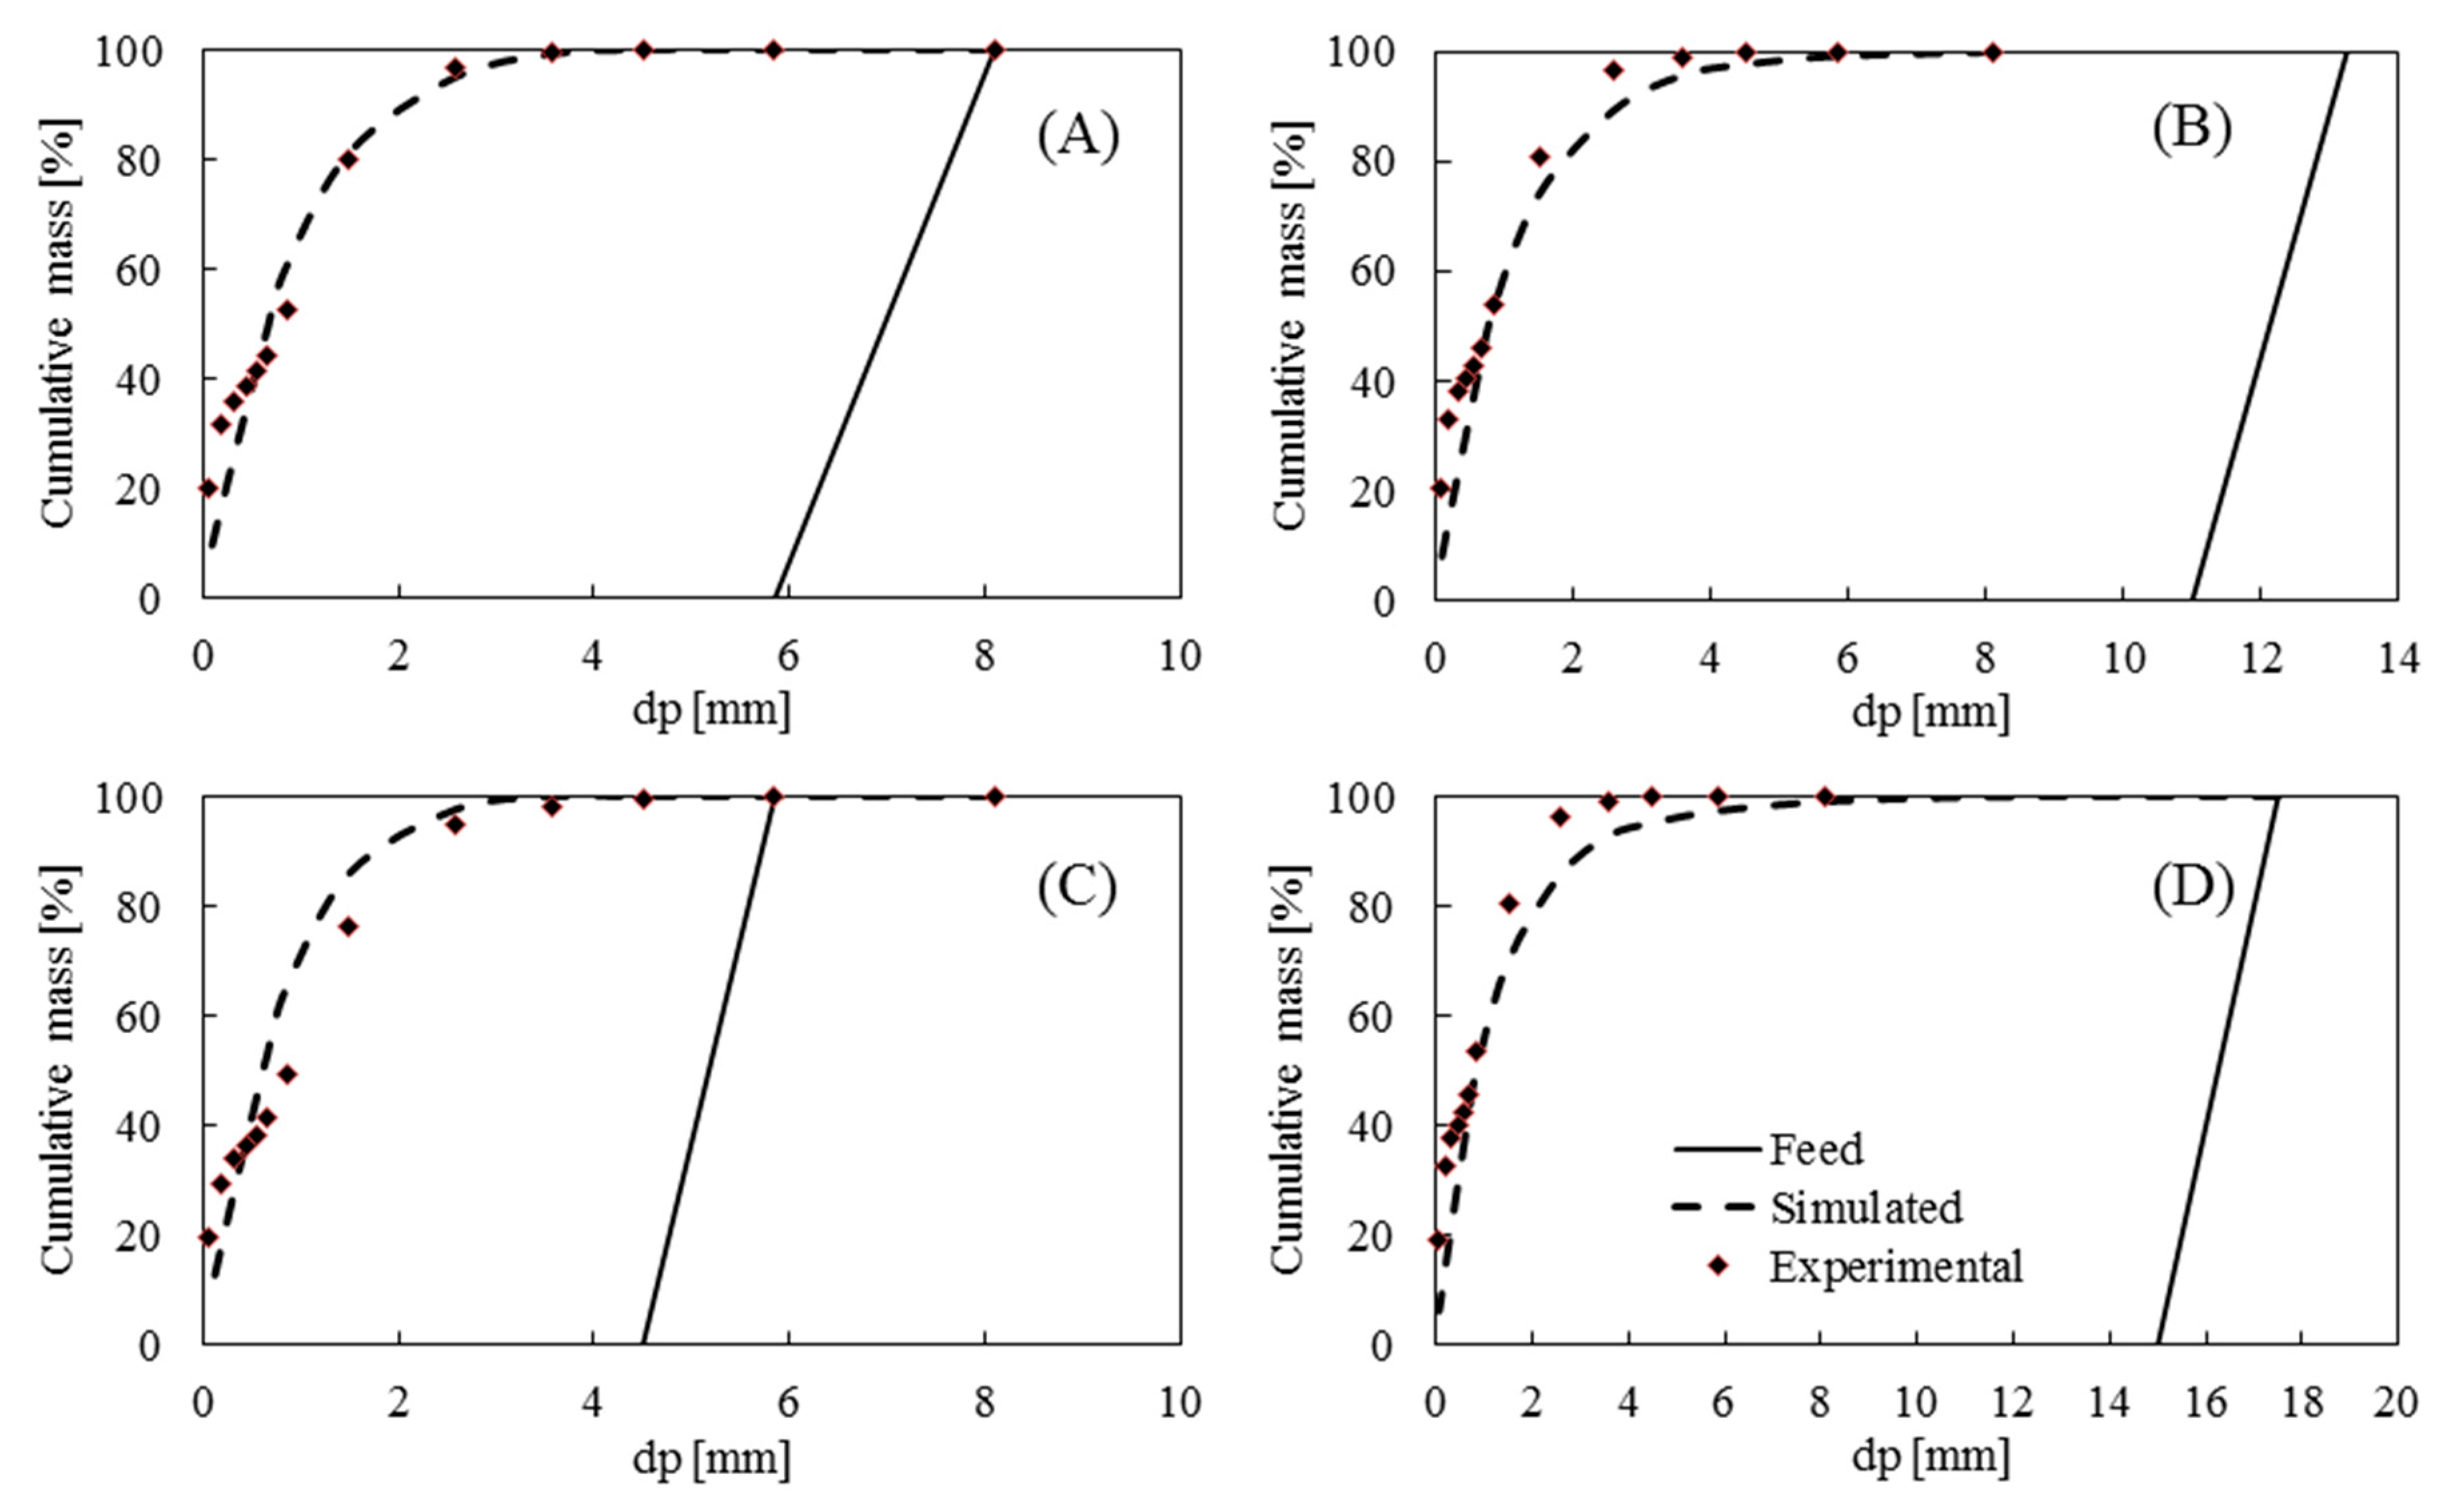
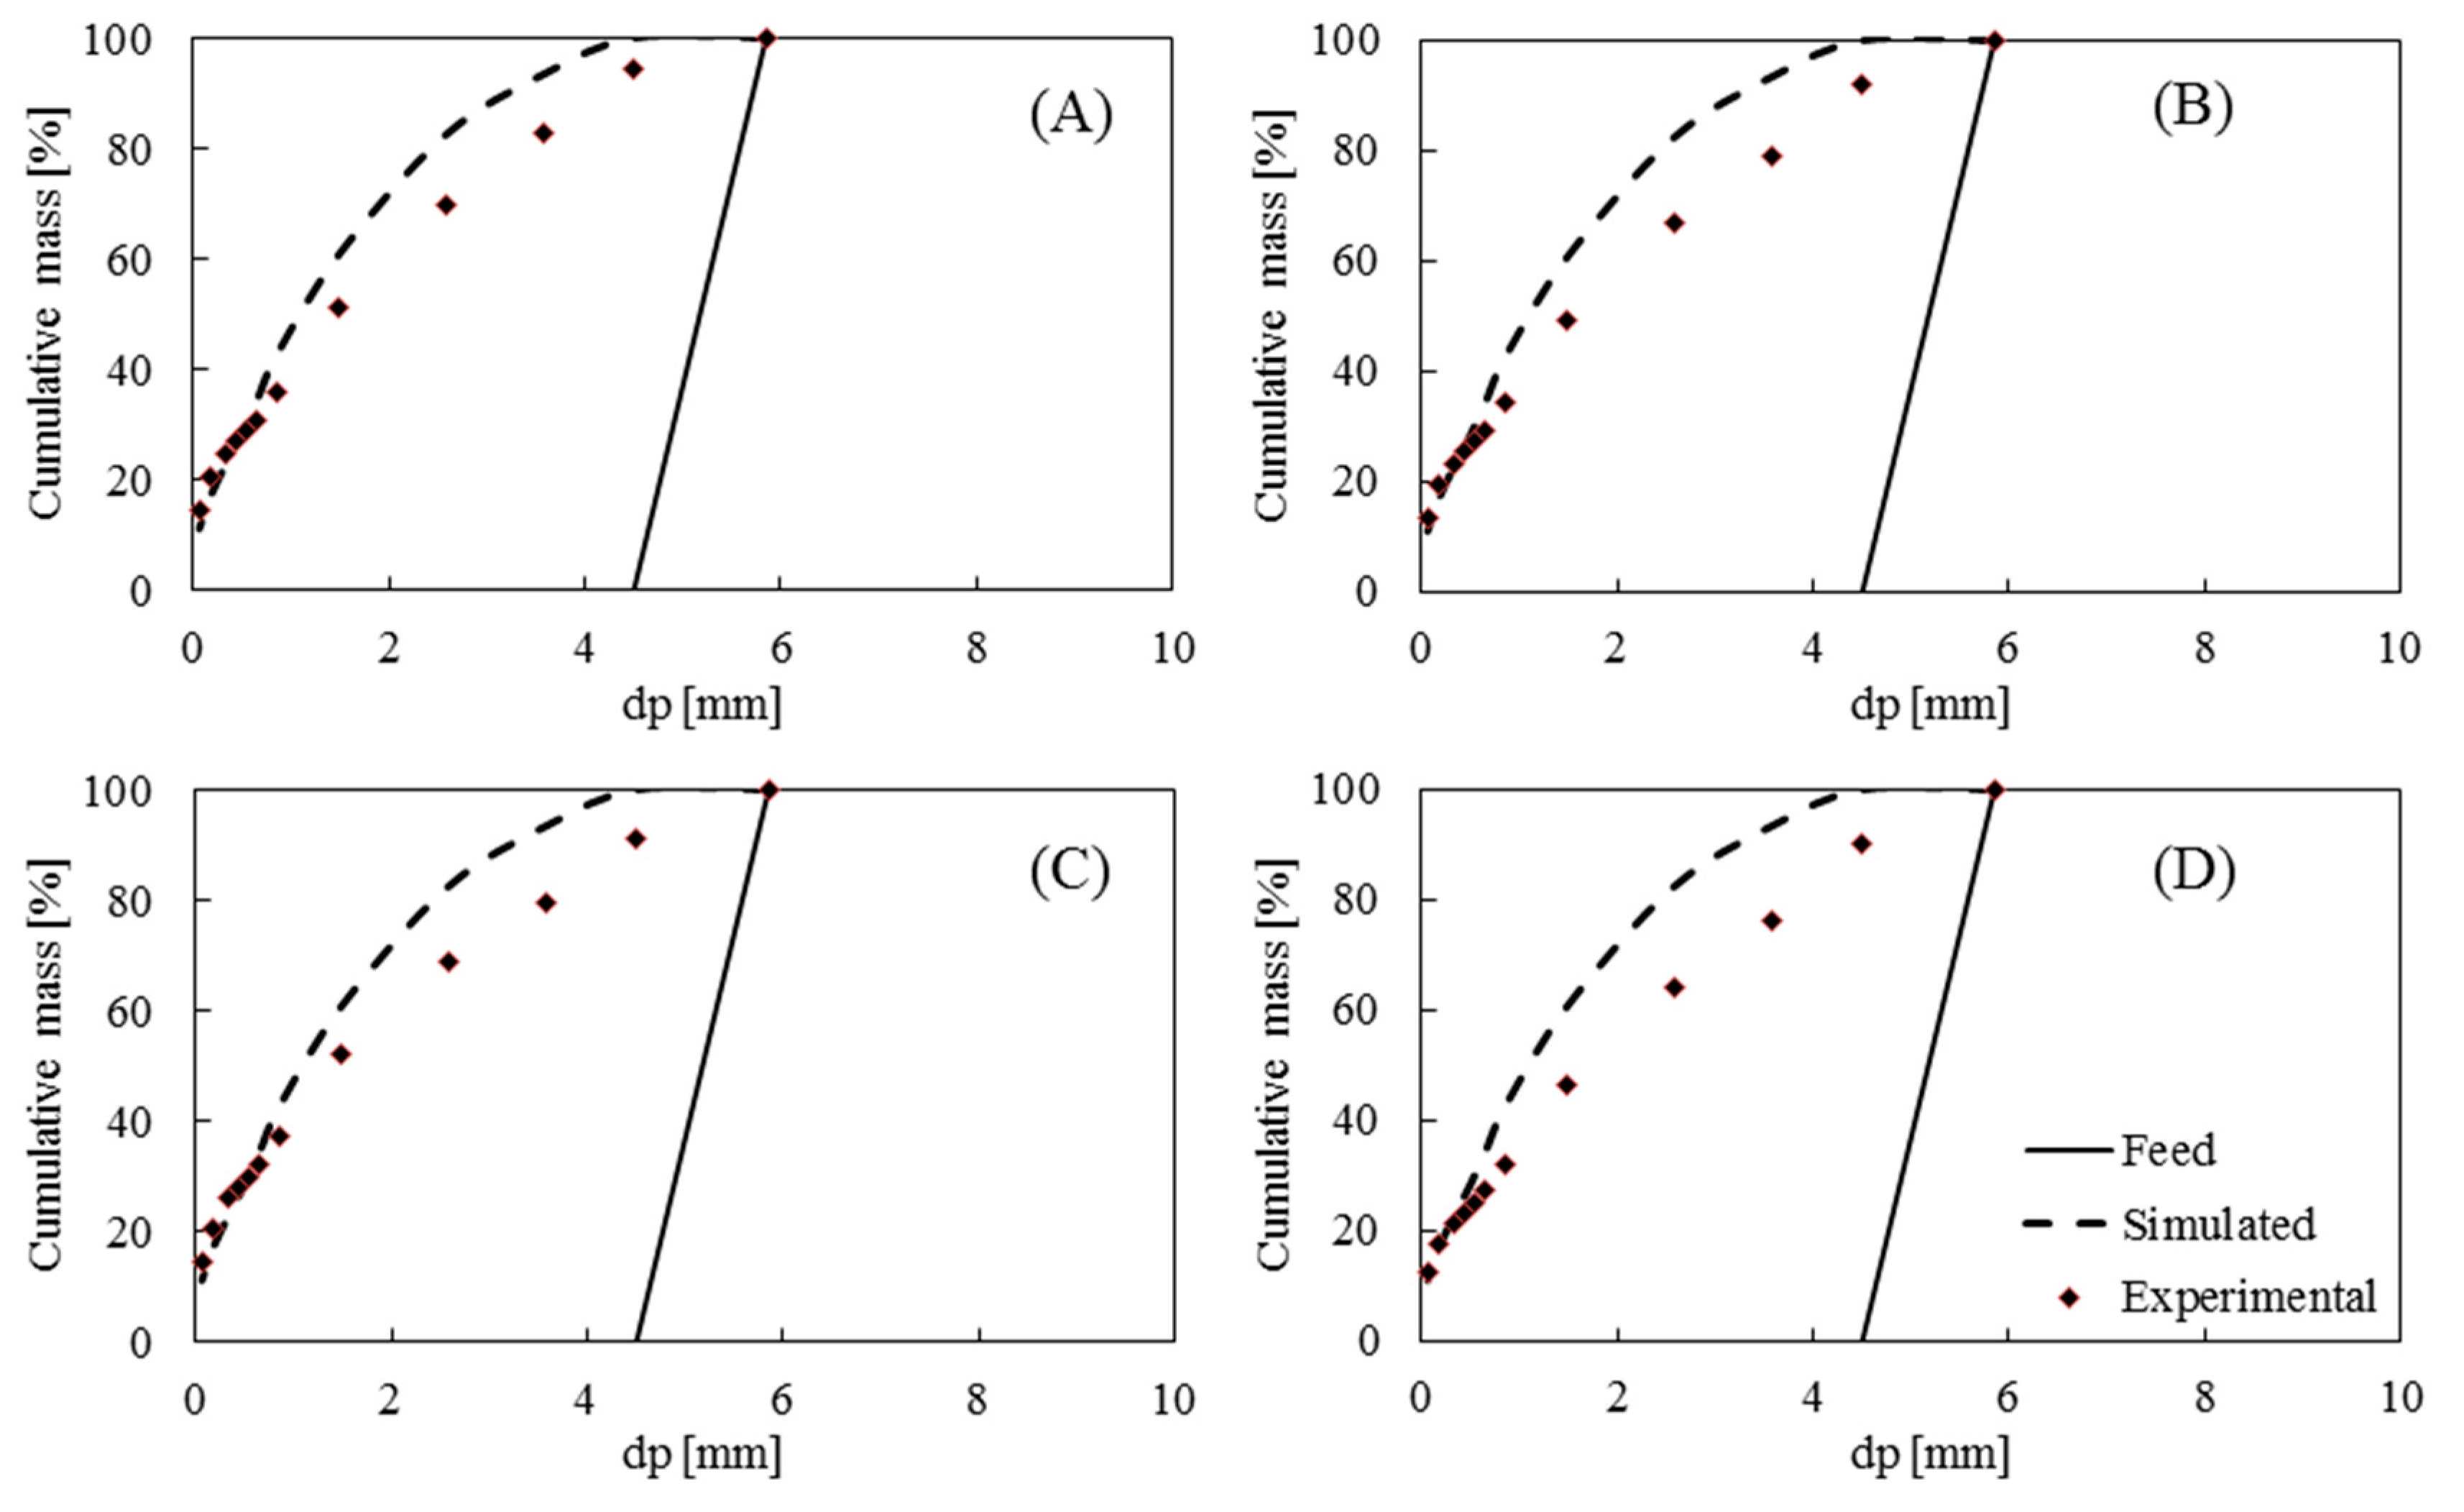
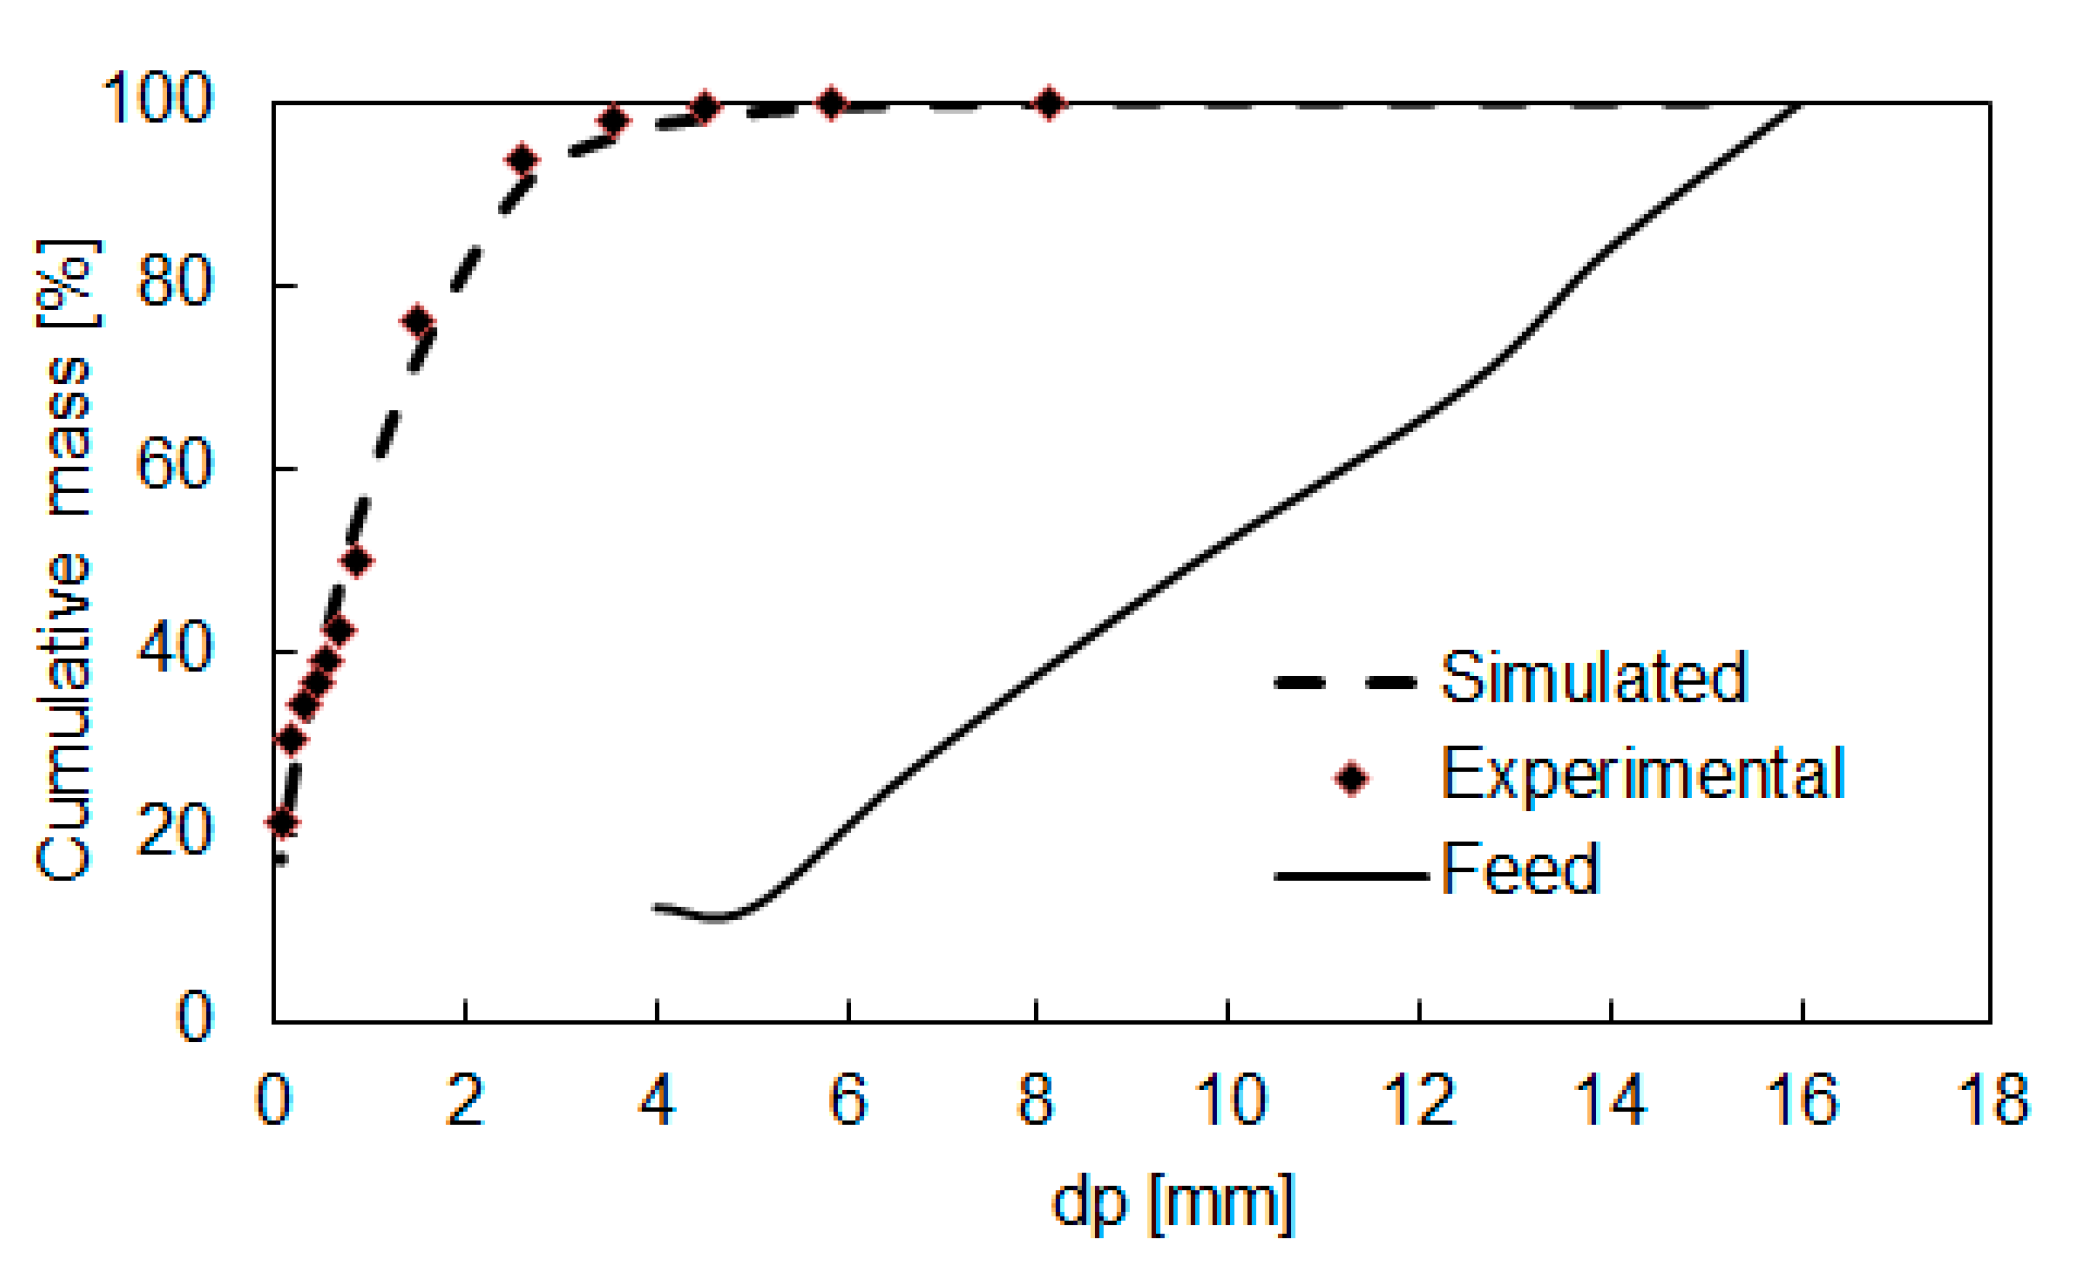
The predicted product particle size distributions for all experiments were plotted against the experimental results in Figure 13, which shows that there is an excellent fit with an overall RMSE of 6.4 in the PF-1 experiment (Table 5, Figure 13A). The coarse particle prediction zone was especially accurate, reaching only 3.2 RMSE. The calculation for the fine particle zone was also acceptable, with some discordance in the last stage of the curve, with an error of 8.5. In the case of the PF-2 experiment (Figure 13B), the RMSE comparing the predicated and the experimental results was 7.8. For the coarse particles, the error went up to 3.6, but in the fine particle range, where the average diameter was less than 855 microns, the RMSE increased by about 11.1. The fit was also acceptable for the PF-3 experiment (Figure 13C) with a 7.9 RMSE.
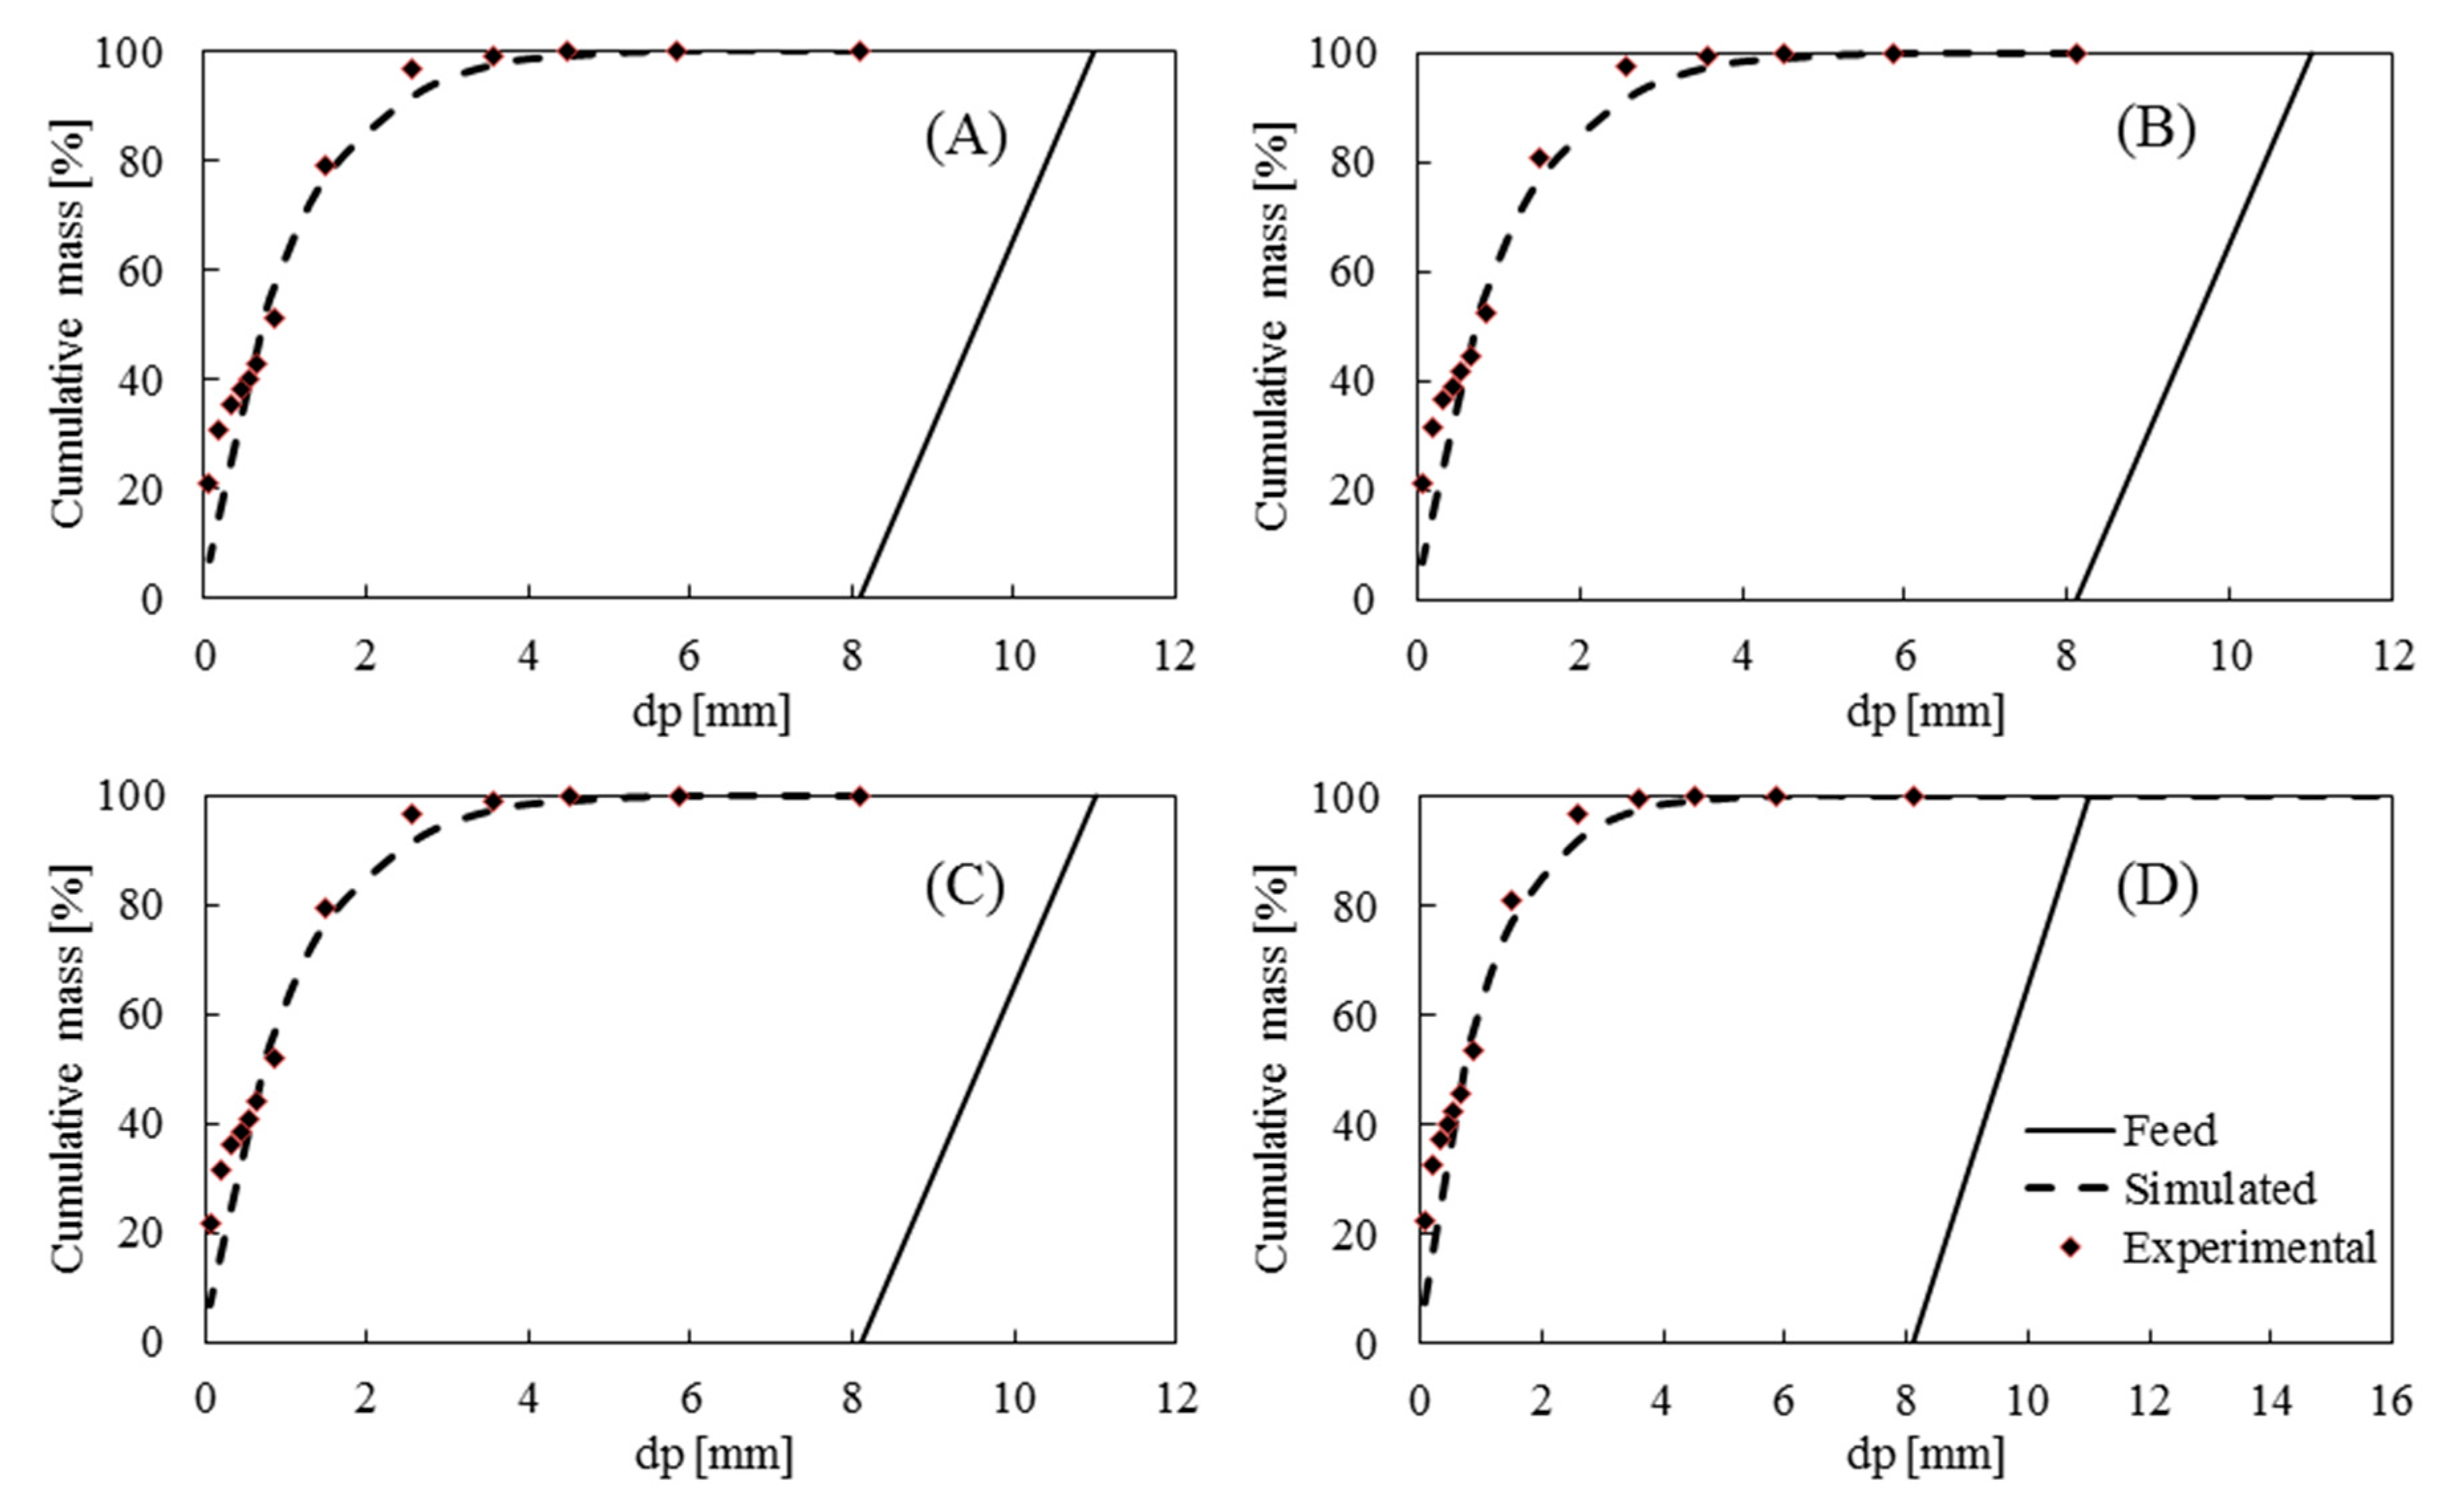
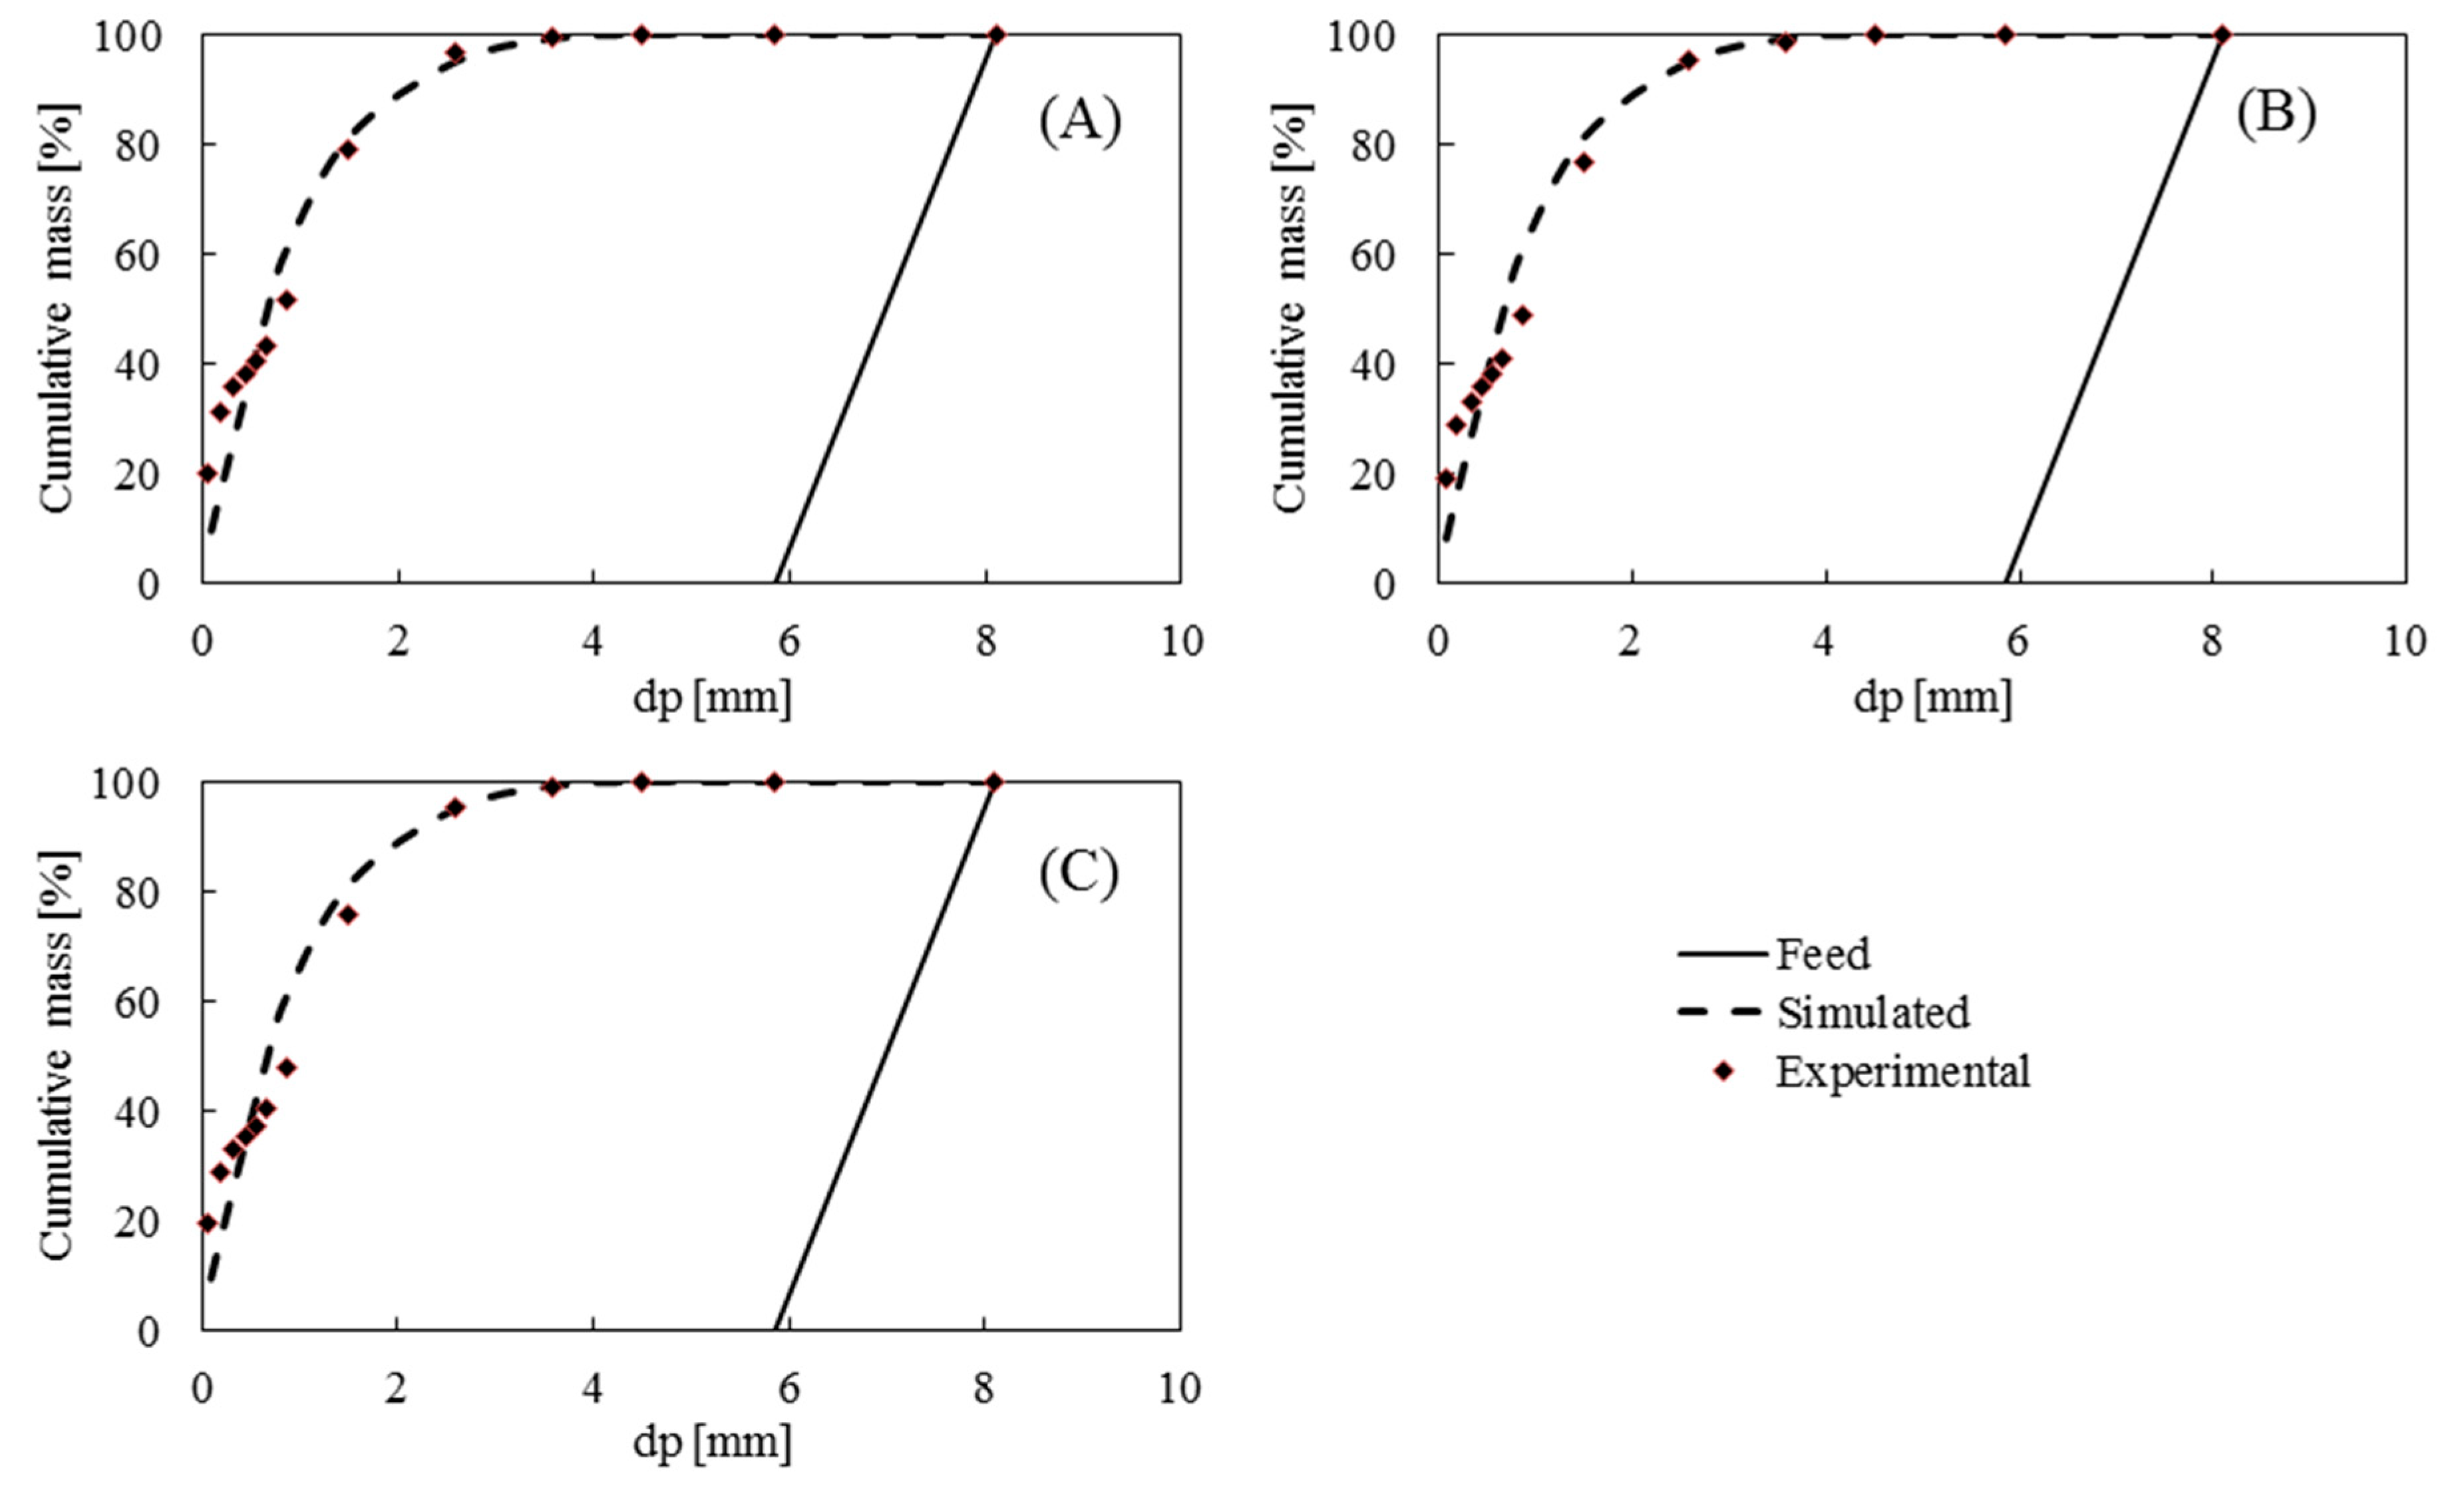
It can be noted that the variations in the final product when changing the rolls’ speed are not significant (Figure 14). The narrow variations observed in the simulations may be due to the differences between the measurements of the resulting densities (Table 2). It is important to take into account that in industrial HPGR applications, the gap is not actually static. However, in the laboratory-scale model presented here, the maximum specific pressing force was determined and used in order to have pure compression without any influence from variations in the working gap (Figure 2). Experiment PG-3 (Figure 15C) showed the most difference in terms of product particle size generation compared with gap variations, but despite this, the prediction was quite good with around 8.4 RMSE. The experiments in which the specific pressing force was changed showed no significant variations, and the predicted particle size distributions correlated well with experimental data (Figure 16).
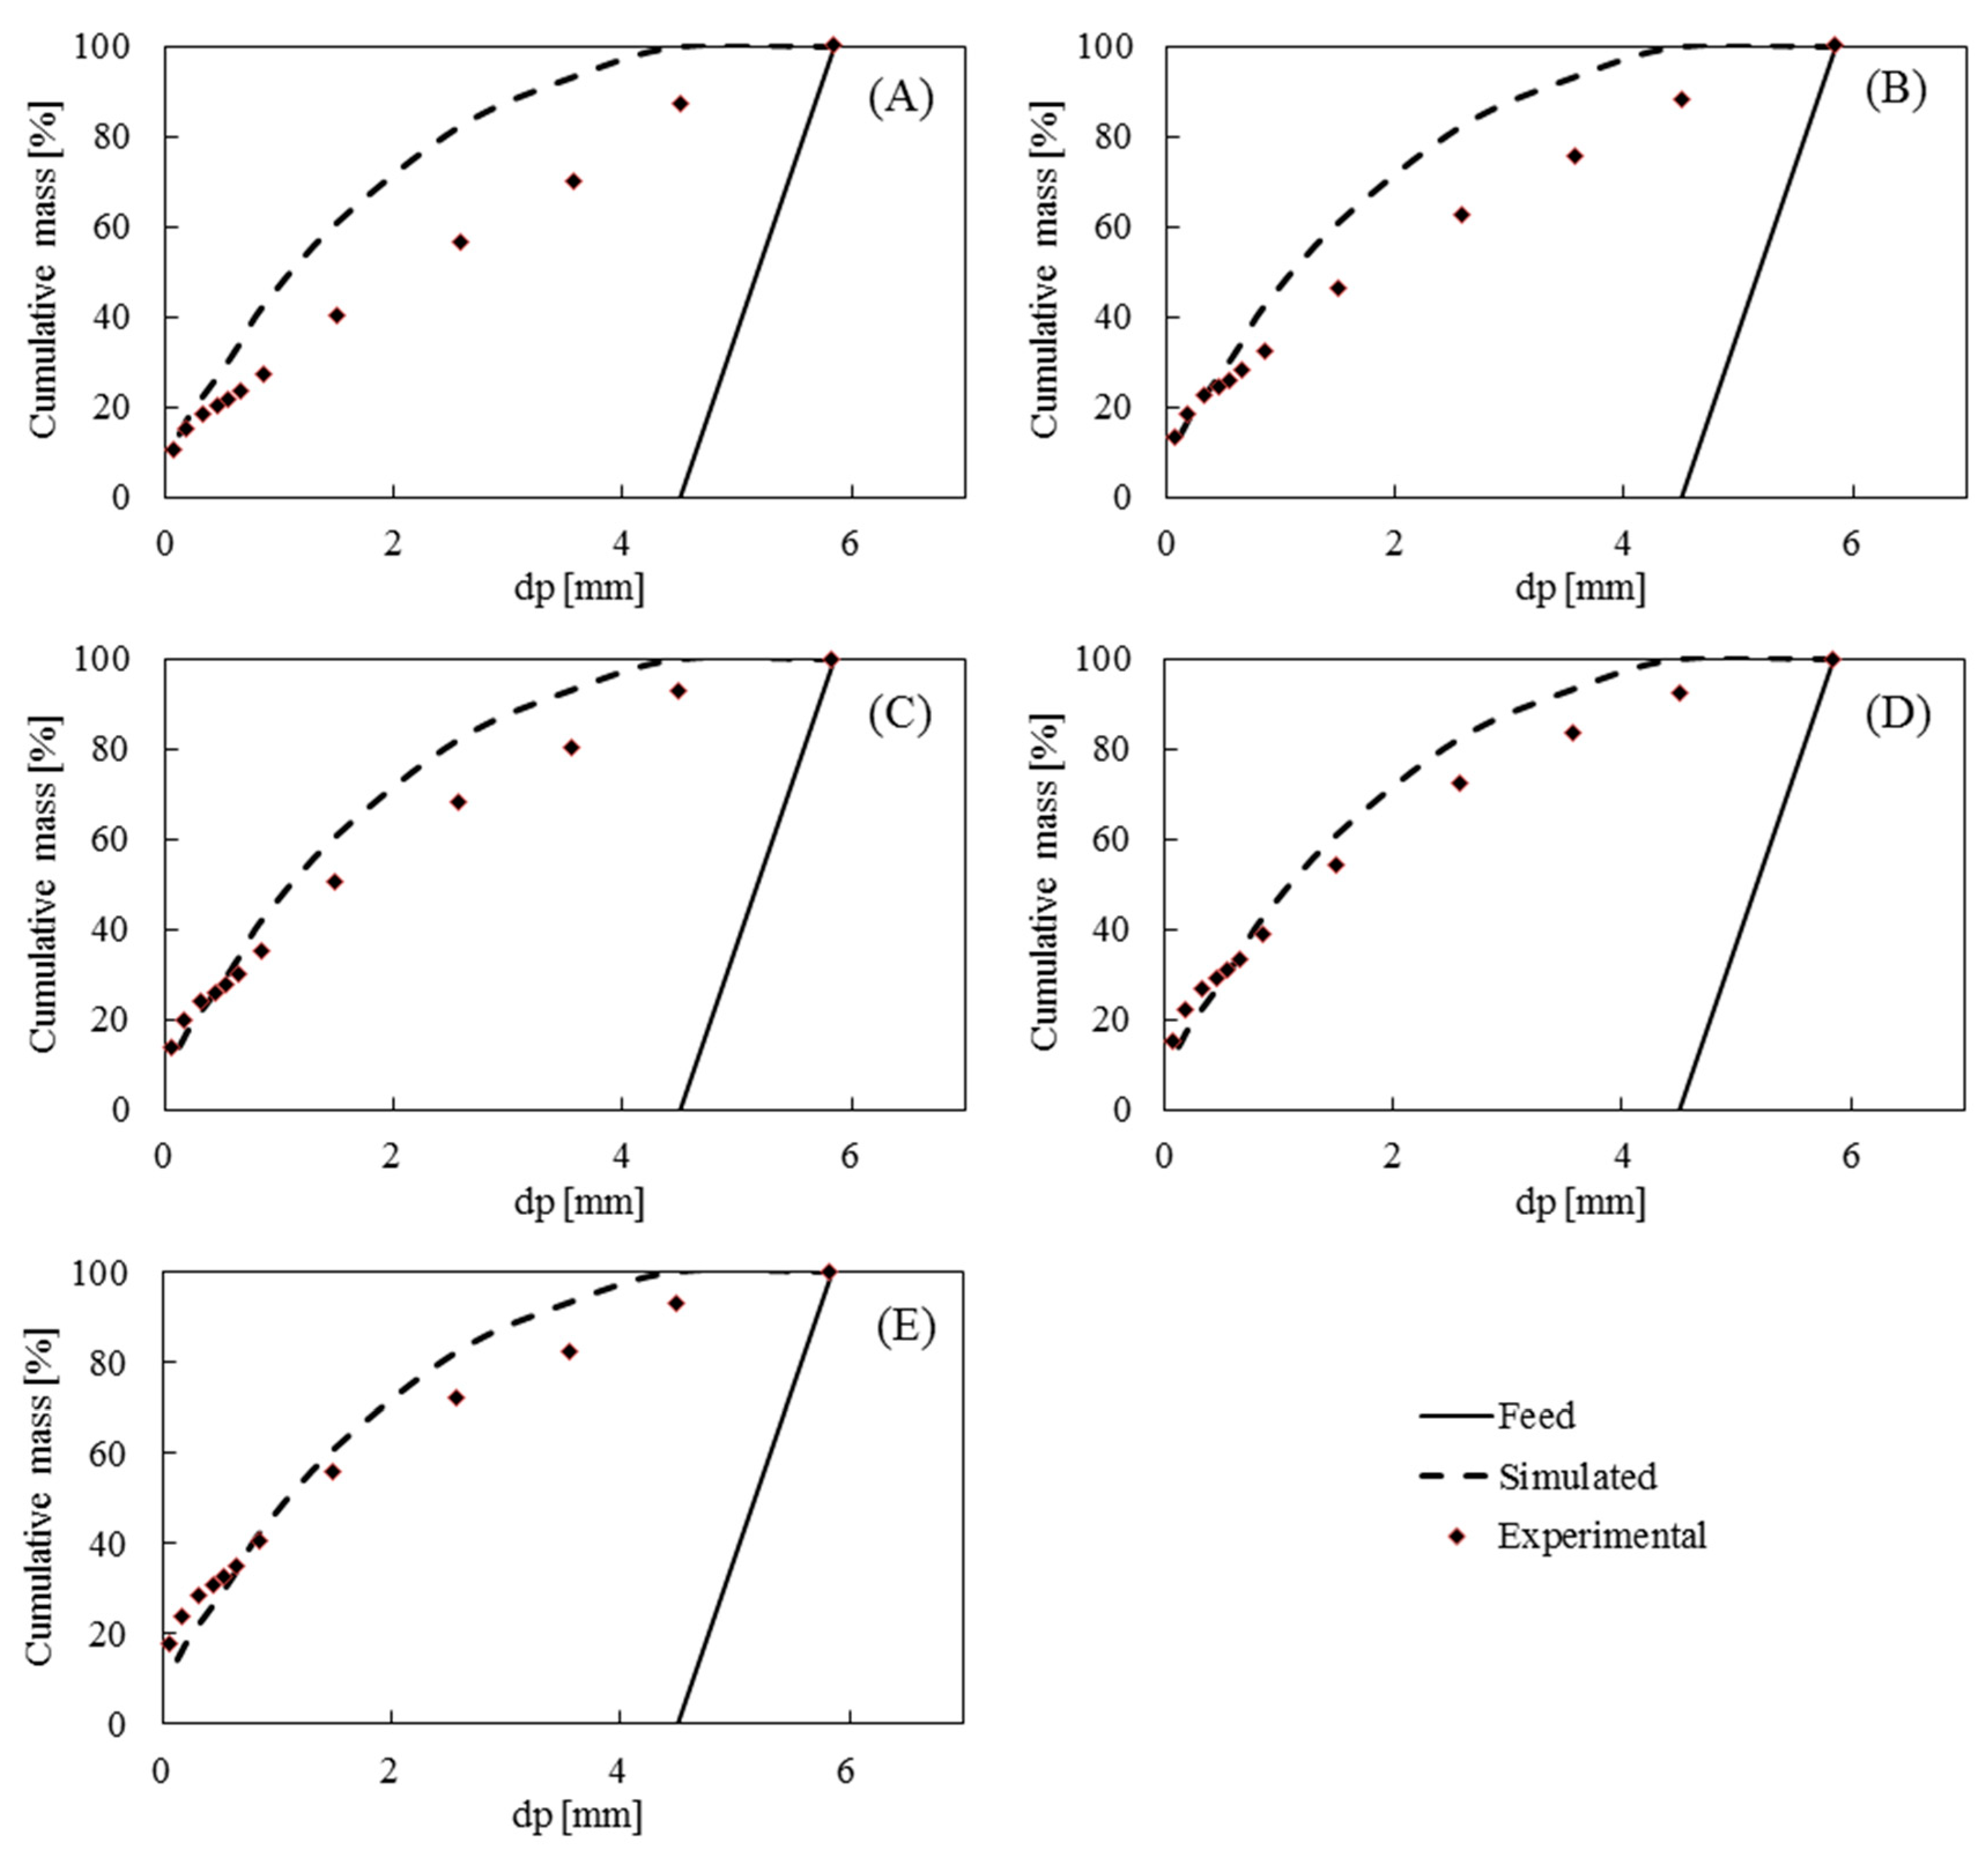
The experiments with the calc-silicate rock were performed by varying the rotational speed, with no significant differences between the curves (Figure 17). The RMSE presented for MV-1 (Figure 17A) and MV-2 experiments (Figure 17B) were 6.4 and 8.0, respectively. Important differences in prediction and experimental values were found when the specific pressing force was changed in the case of the calc-silicate material. From experiment MP-1 to MP-5 (Figure 18) the specific pressing force varied from 1.25 MPa to 4.5 MPa, showing an RMSE ranging from 14.1 to 5.5. The most affected zone was the coarse phase, where it reached a maximum RMSE of 19.3 in experiment MP-1 (Figure 18A). However, the fine phases showed good adjustment, from 3.5 RMSE in the case of experiment MP-4 (Figure 18D) to 8.7 RMSE in experiment MP-1.
Experiments PT-1 and MT-1 (Figure 19) were carried out with a different static gap and a heterogeneous particle size distribution, in contrast to the previous mono-sized experiments. They showed the best adjusted predictions compared to the experimental data, with an overall RMSE of around 6.5 when using granite feed and 3.8 RMSE in the case of the calc-silicate rock. Note that the MT-1 test was also performed with a different gap size, which was introduced into the calculation, resulting in an excellent fit with the experimental data (Figure 19B), being 1.9 RMSE for the fine phase and 5.1 RMSE in the coarse particle phase.
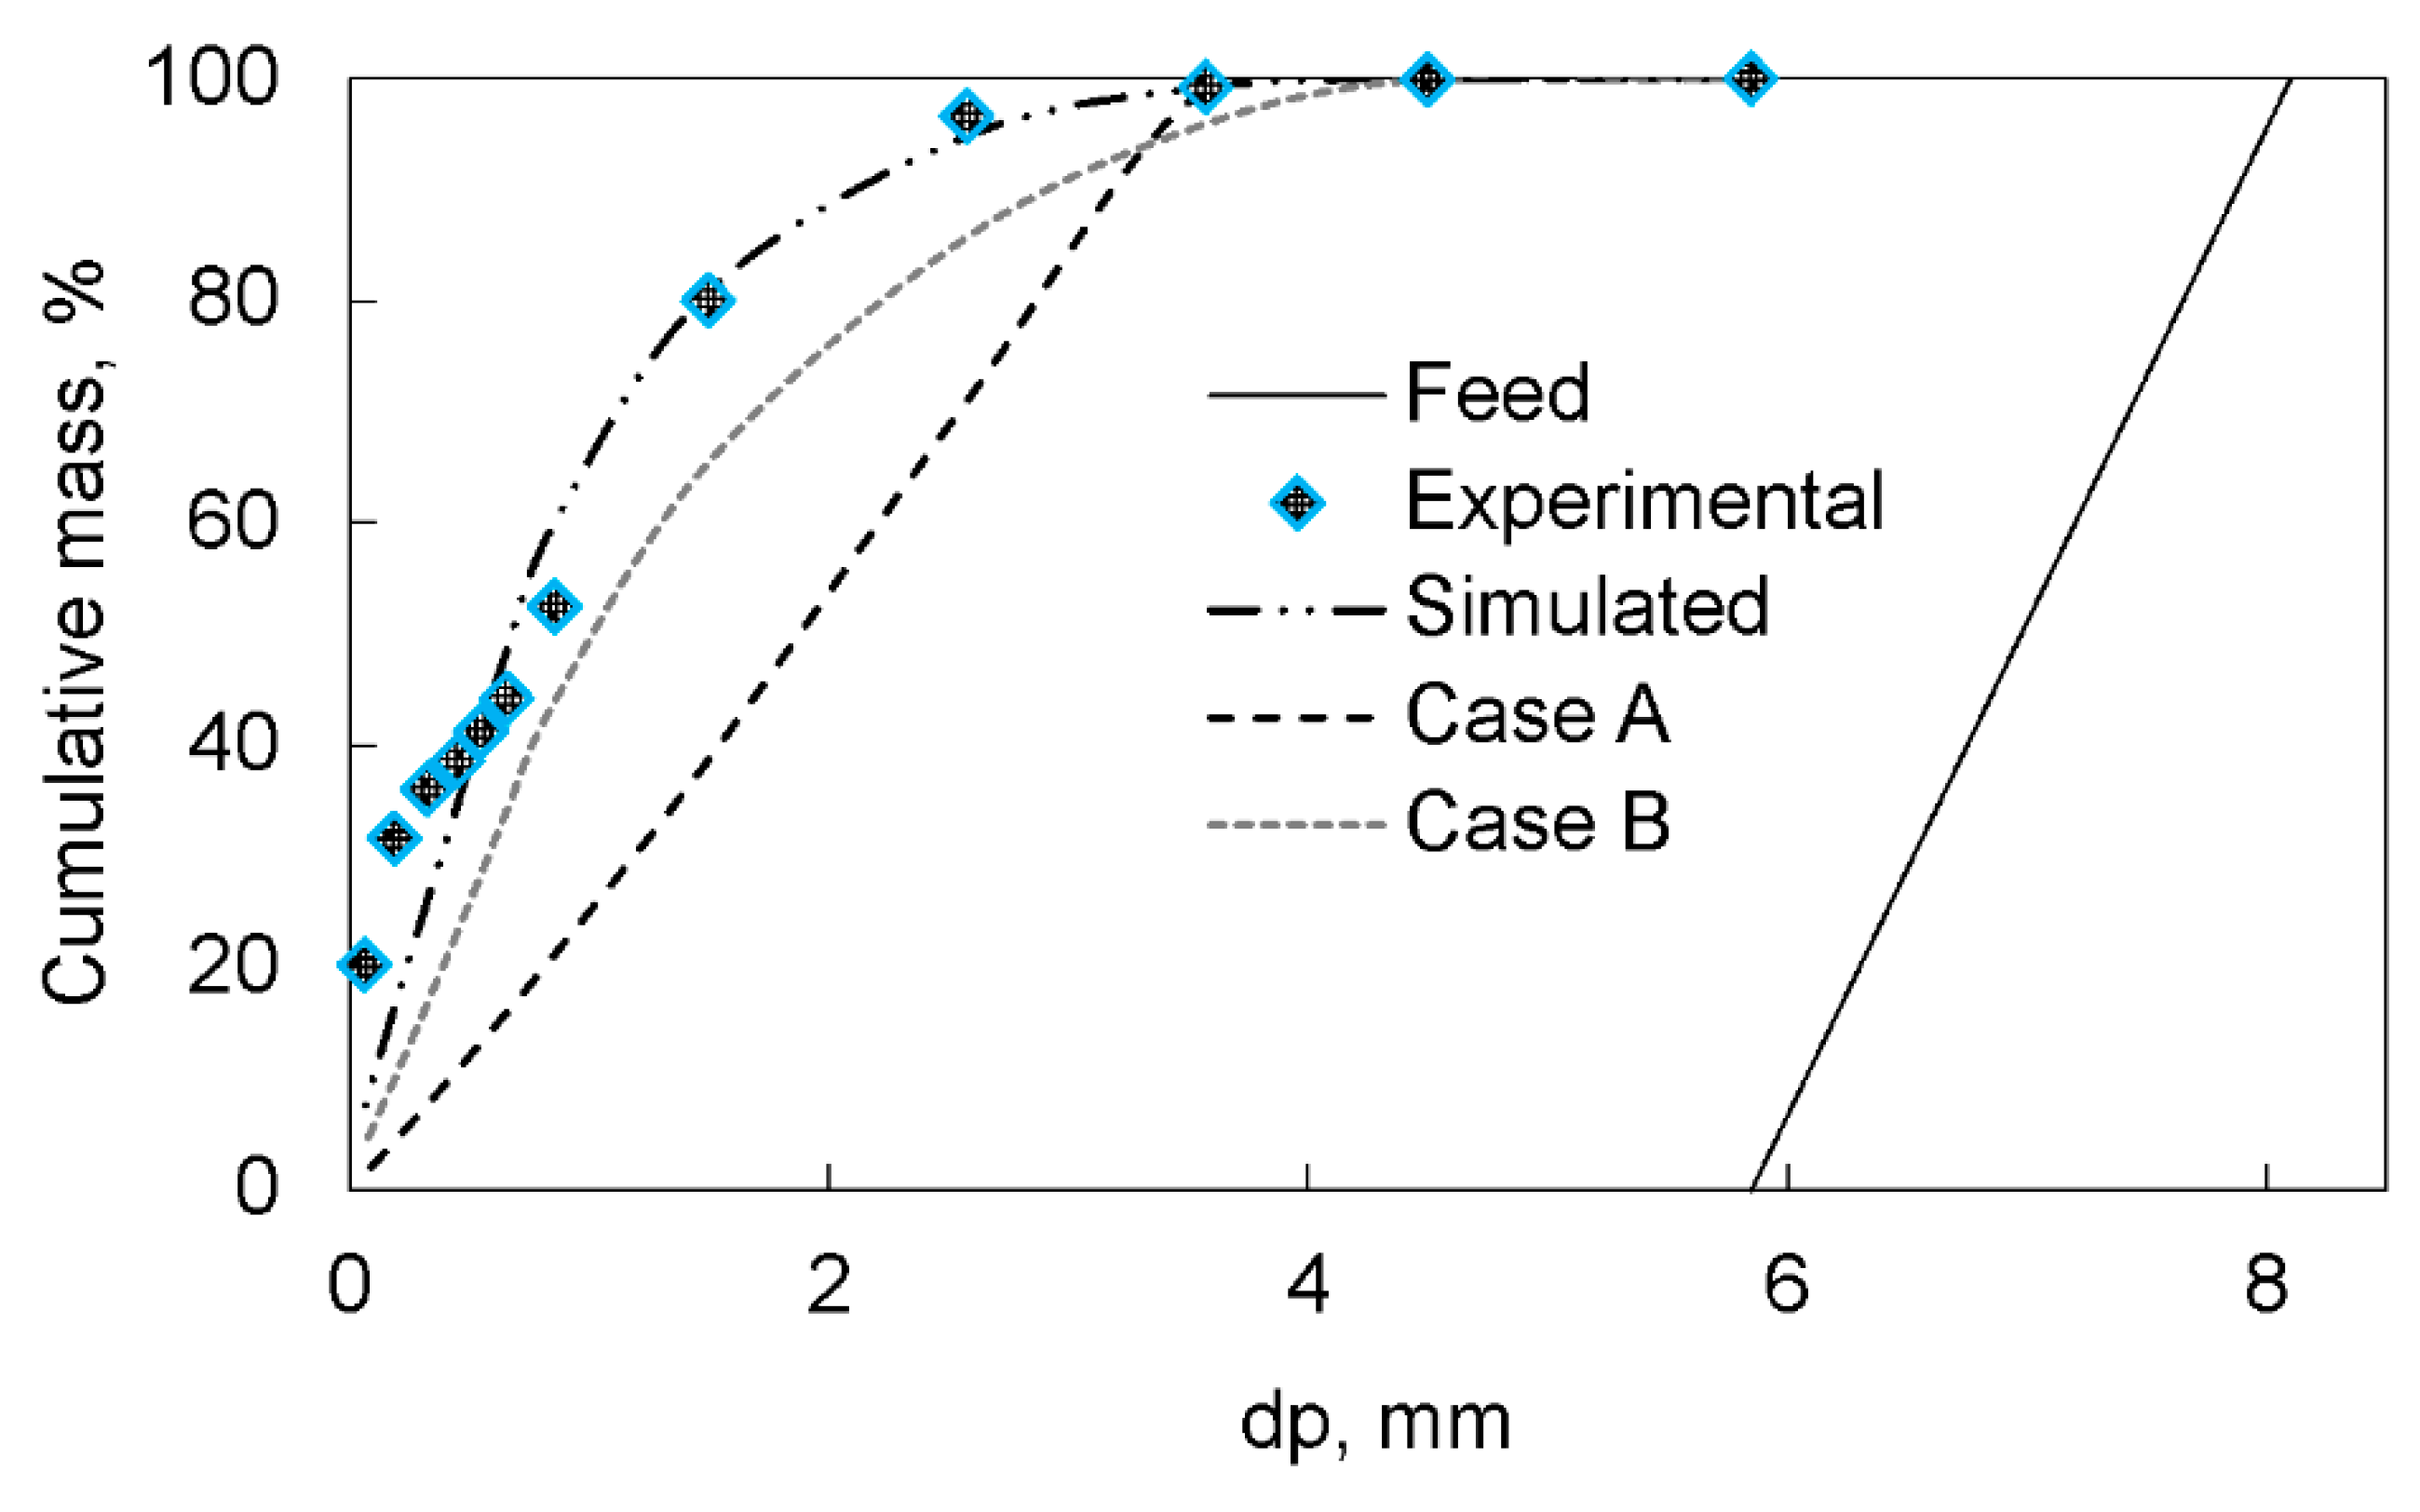
The proposed model was tested under other conditions or with varying values of the function parameters (Figure 20). Two particular cases are presented: (A) the PF-1 experiment was simulated using only the breakage distribution of single compression for three stages and the fine particles that were not subjected to single compression action were bypassed. This function was not suitable for an accurate breakage prediction of the coarse particles product and the fine generation was also poorly simulated. On the other hand, in case (B), the experiment used bed compression parameters in all single particle and bed compressions. The obtained prediction curve did not fit with the experimental data.
Reverse simulation back-calculation methodology is often used to fit a model by searching for adjusted parameters among the experimental data. The experiment PT-1 was used in this case to find all of the model function parameters (Table 5). Once these parameters were determined (Table 6), the PT-1 experiment was predicted. The results of this comparison are shown in Figure 21. This simulation shows an overall 1.79 RMSE, 0.87 in the fine zone and 2.27 in the coarse phase.
As is shown in Table 6, as well as in previous work [24], the back-calculated parameters have the ability to adjust any experimental curves. However, their parameters are not related to any mineral characteristic or operative conditions.

4. Conclusions

An improved approach was presented to model particle size distribution of a high-pressure roll crusher product, using a previously established methodology for determining the breakage distribution function. For the lab-work, the operational conditions were selected to observe their influence on the resulting product particle size distributions. The experimental results on granite and calc-silicate materials demonstrated the high performance of the high-pressure roll crusher in terms of throughput and size reduction when running under optimal conditions. Other mineral characteristics, such as shape and morphology, were also analysed and were decisive in the determination of the correct performance of the model. In terms of operational conditions, some experiments were performed with a constant feed size range, while the rotational speed of the rolls was varied. The results indicated that there was no influence on the particle size distribution of the product, although the throughput increases considerably.
The model was used to predict the product size distribution, and it showed a great fit when compared to experimental data, in the case of the altered granite feed. The static gap, which control the product top-size, was selected in order to perform comminution in pure compression. When the model was tested with the multi-size particle size distribution feed and with a different gap size, the fitting showed excellent adjustment.
The calc-silicate product simulation was appropriate in the case of varying the roll speed, but when it was run using different specific pressing forces, the prediction was not accurate in terms of coarse particles phase simulation, but was acceptable in the fine phases. Although the procedure to determine the specific pressing force has a 95% confidence interval between 1.94 N/mm2 and 5.4 N/mm2, there is a possibility that even with the maximum pressure used in the experiments it was not possible to work at a pressure able to avoid a variable gap. This could be one of the reasons for the imprecise performance of the model under the mentioned conditions.
In general terms, the hypothesis of simultaneous single particle compression and bed compression for different size ranges and with different distribution function parameters was confirmed. This assumption was also reinforced by the different simulations that exchange bed compression parameters in the single particle compression distribution function and vice versa. However, the concept of non-normalization of the breakage distribution function should be extended to different pressure conditions.
In future work, validation of industrial HPGR will be carried out, introducing the scale factors of the current model and determining the influence of the pressure on operative conditions or the influence of moisture on the floating gap.

Author Contributions

H.A. designed and performed the experiments, analysed the data and wrote the paper; P.A. designed the mineralogical analyses and helped in the writing of the paper; E.G. helped in the experimental laboratory and in the review of manuscripts; S.A.H. curated the date; J.O. critically reviewed the experimental design, the analysis of the results and conclusions; M.B. helped in the writing of the manuscript and L.S. performed the sampling management and reviewing final version of the manuscript. T.E., R.A. and A.E. have helped in the script and algorithm for the MATLAB program; D.P. and E.P.-P. established the base model for the experimental design. J.J.d.F. helped with the design of the reformed roll crusher.

Funding

This research was funded by the European Commission research and innovation programme Horizon 2020 grant number 642201.

Acknowledgments

The authors would like to thank to The Valentí Masachs Geology Museum and Professor Joaquim Sanz for the help with the photographic work.

Conflicts of Interest

The authors declare no conflict of interest.

References

  1. Abouzeid, A.Z.M.; Fuerstenau, D.W. Grinding of mineral mixtures in high-pressure grinding rolls. Int. J. Miner. Process. 2009, 93, 59–65. [Google Scholar] [CrossRef]
  2. Kellerwessel, H. High pressure material bed comminution in practice. Zement-Kalk-Gips 1990, 2, 57–64. [Google Scholar]
  3. Hasanzadeh, V.; Farzanegan, A. Robust HPGR model calibration using genetic algorithms. Miner. Eng. 2011, 24, 424–432. [Google Scholar] [CrossRef]
  4. Genç, Ö.; Benzer, A.H. Effect of High Pressure Grinding Rolls (HPGR) pre-grinding and ball mill intermediate diaphragm grate design on grinding capacity of an industrial scale two-compartment cement ball mill classification circuit. Miner. Eng. 2016, 92, 47–56. [Google Scholar] [CrossRef]
  5. Aydogan, N.; Ergun, L.; Benzer, H. High pressure grinding rolls (HPGR) applications in the cement industry. Miner. Eng. 2006, 19, 130–139. [Google Scholar] [CrossRef]
  6. Austin, L.G.; Weller, K.R.; Lim, I.L. Phenomenological Modelling of the High Pressure Grinding Rolls. In Proceedings of the XVIII International Mineral Processing Congress, Sydney, Australia, 23–28 May 1993; pp. 87–95. [Google Scholar]
  7. Kodali, P.; Dhawan, N.; Depci, T.; Lin, C.; Miller, J. Particle damage and exposure analysis in HPGR crushing of selected copper ores for column leaching. Miner. Eng. 2011, 24, 1478–1487. [Google Scholar] [CrossRef]
  8. Torres, M.; Casali, A. A novel approach for the modelling of high-pressure grinding rolls. Miner. Eng. 2009, 22, 1137–1146. [Google Scholar] [CrossRef]
  9. Saramak, D. Technological issues of high-pressure grinding rolls operation in ore comminution processes. Arch. Min. Sci. 2011, 56, 517–526. [Google Scholar]
  10. Numbi, B.P.; Xia, X. Systems optimization model for energy management of a parallel HPGR crushing process. Appl. Energy 2015, 149, 133–147. [Google Scholar] [CrossRef] [Green Version]
  11. Barrios, G.; Tavares, L.M. A preliminary model of high pressure rolls grinding using the discrete element method and multi-body dynamics coupling. Miner. Eng. 2016, 156, 32–42. [Google Scholar] [CrossRef]
  12. Morrel, S.; Lim, W.; Tondo, L. Modelling and scale up of the high pressure grinding rolls. In Proceedings of the XX International Mineral Congress, Aachen, Germany, 21–26 September 1997; pp. 117–126. [Google Scholar]
  13. Ghorbani, Y.; Mainza, A.N.; Petersen, J.; Becker, M.; Franzidis, J.P.; Kalala, J.T. Investigation of particles with high crack density produced by HPGR and its effect on the redistribution of the particle size fraction in heaps. Miner. Eng. 2013, 43–44, 44–51. [Google Scholar] [CrossRef] [Green Version]
  14. Fernandez, M.G.; Brochot, S. HPGR modelling with mineral liberation for plant optimization. In Proceedings of the XXVII International Mineral Processing Congress, Santiago, Chile, 20–24 October 2014; pp. 21–31. [Google Scholar]
  15. Yin, W.; Tang, Y.; Ma, Y.; Zuo, W.; Yao, J. Comparison of sample properties and leaching characteristics of gold ore from jaw crusher and HPGR. Miner. Eng. 2017, 111, 140–147. [Google Scholar] [CrossRef]
  16. Hamid, S.; Alfonso, P.; Anticoi, H.; Guasch, E.; Oliva, J.; Dosbaba, M.; Garcia-Valles, M.; Chugunova, M. Quantitative mineralogical comparison between HPGR and ball mill products of a Sn-Ta ore. Minerals 2018, 8, 151. [Google Scholar] [CrossRef]
  17. Saramak, D.; Mlynarczykowska, A.; Krawczykowska, A. Influence of a high pressure comminution technology on concentrate yields in copper ore flotation process. Arch. Metall. Mater. 2014, 59, 951–955. [Google Scholar] [CrossRef]
  18. Saramak, D.; Wasilewski, S.; Saramak, A. Influence of copper ore comminution in HPGR on downstream minerallurgical process. Arch. Metall. Mater. 2017, 62, 1689–1694. [Google Scholar] [CrossRef]
  19. Austin, L.G.; Van Orden, D.R.; Pérez, J.W. A preliminary analysis of smooth roll crushers. Int. J. Miner. Process. 1980, 6, 321–336. [Google Scholar] [CrossRef]
  20. Austin, L.G.; Trubelja, P.M. The capacity and product size distribution of high pressure grinding rolls. In Proceedings of the IV Meeting of the Southern Hemisphere of Mineral Technology, Concepción, Chile, 20–23 November 1994; pp. 49–67. [Google Scholar]
  21. Schneider, C.; Alves, V.; Austin, L. Modelling the contribution of specific grinding pressure for the calculation of HPGR product size distribution. Miner. Eng. 2009, 22, 642–649. [Google Scholar] [CrossRef]
  22. Kronemberger, V. Metodologia para Simulação e Escalonamento de Prensas de Rolos. Ph.D. Thesis, Universida de Federal de Minas Gerais, Belo Horizonte, Brazil, 2012. (In Portuguese). [Google Scholar]
  23. Dundar, H.; Benzer, H.; Aydogan, N. Application of population balance model to HPGR crushing. Miner. Eng. 2013, 50–51, 114–120. [Google Scholar] [CrossRef]
  24. Anticoi, H.; Guasch, E.; Hamid, S.A.; Alfonso, P.; Oliva, J.; Bascompta, M.; Sanmiquel, L.; Escobet, A.; Argelaguet, R.; Escobet, T.; et al. Mineral and mechanical characterization of tantalum and tungsten ores. Minerals 2018, 8, 170. [Google Scholar] [CrossRef]
  25. Alfonso, P.; Hamid, S.; Garcia-Valles, M.; Llorens, T.; López Moro, J.; Tomasa, O.; Calvo, D.; Guasch, E.; Anticoi, H.; Oliva, J. Textural and mineral-chemistry constraints on columbite-group minerals in the Penouta deposit: Evidence from magmatic and fluid-related processes. Mineral. Mag. 2018. [Google Scholar] [CrossRef]
  26. Evertsson, C.M.; Bearman, R.A. Investigation of inter-particle breakage as applied to cone crushing. Miner. Eng. 1997, 10, 199–214. [Google Scholar] [CrossRef]
  27. Whiten, W.J.; Walter, G.W.; White, M.E. A breakage function suitable for crusher models. In Proceedings of the IV Tewkesbury Symposium, Melbourne, Australia, 12–14 February 1979; pp. 19.1–19.3. [Google Scholar]
  28. Nikolov, S. Modelling and simulation of particle breakage in impact crushers. Int. J. Miner. Process. 2004, 74S, S219–S225. [Google Scholar] [CrossRef]
  29. Willmott, C.; Matsuura, K. Advantages of the mean absolute error (MAE) over the root mean square error (RMSE) in assessing average model performance. Clim. Res. 2005, 30, 79–82. [Google Scholar] [CrossRef] [Green Version]
  30. Roy, K.; Das, R.N.; Ambure, P.; Aher, R. Be aware of error measures. Further studies on validation of predictive QSAR models. Chem. Intell. Lab. Syst. 2016, 152, 18–33. [Google Scholar] [CrossRef]
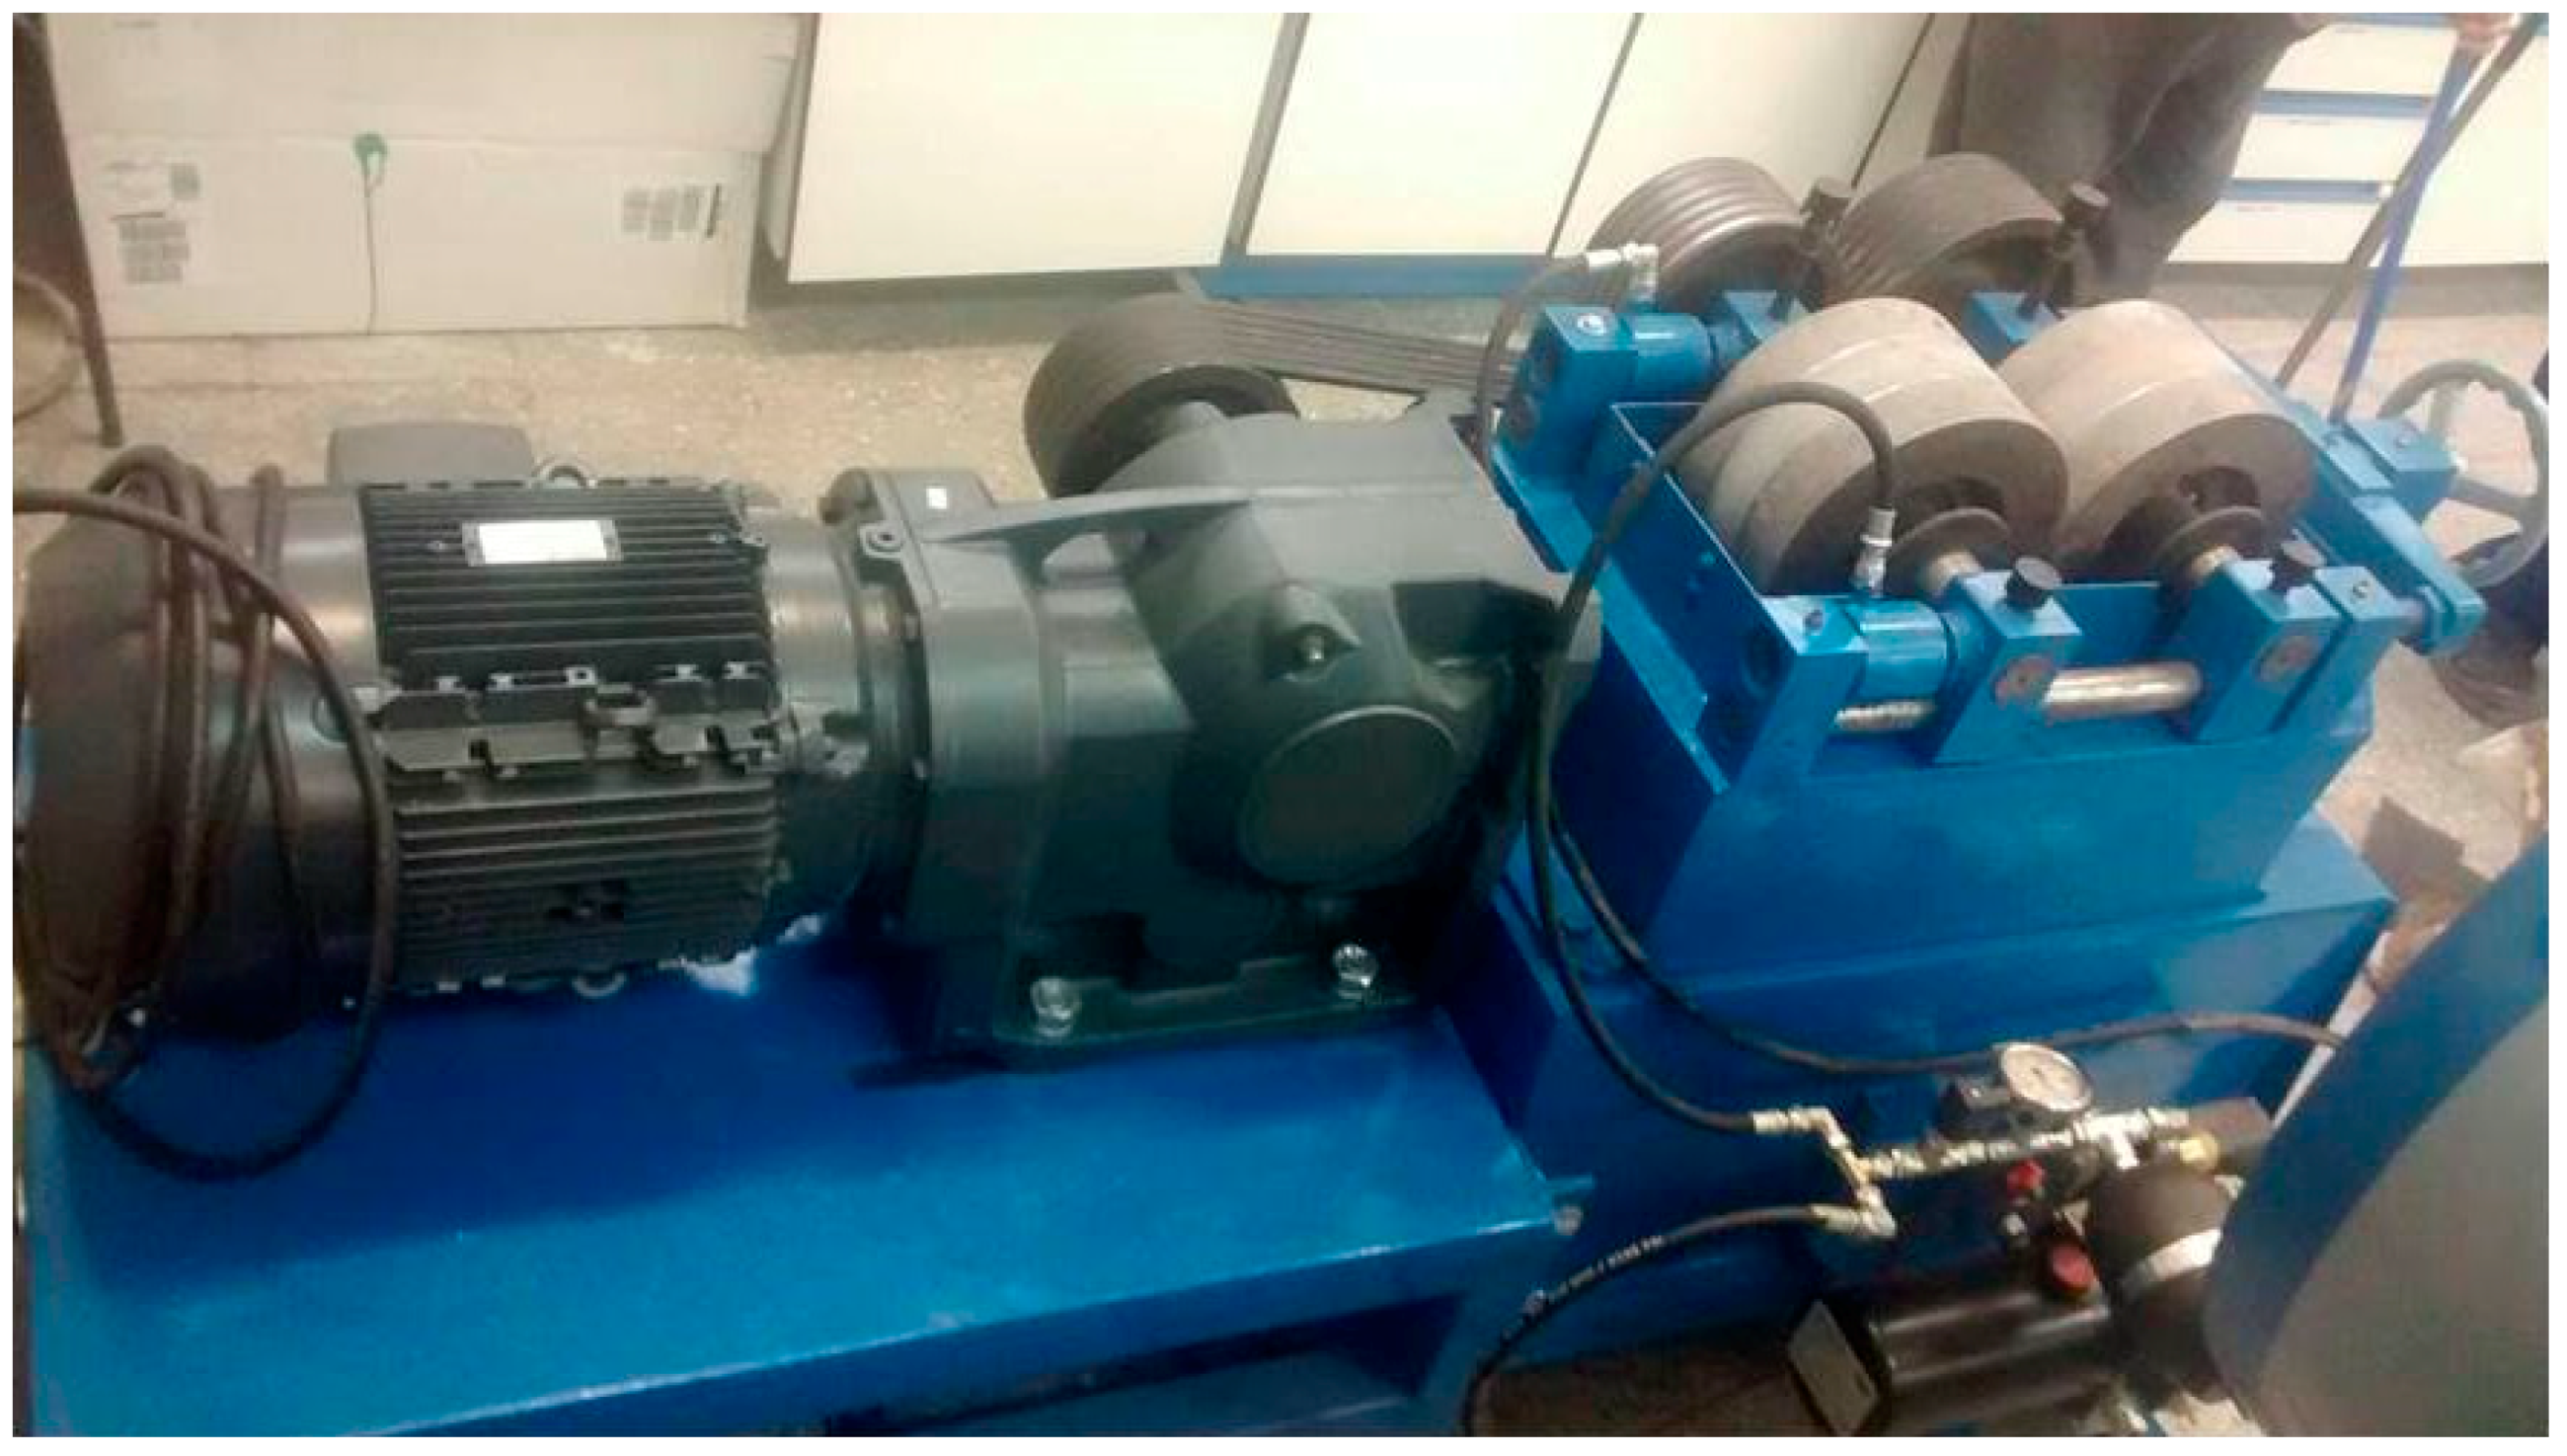
Figure 1. Roll crusher transformed into a high-pressure grinding roller with a 15 kW engine and full hydraulic piston system.
Minerals 08 00483 g001
Figure 2. The compression strength test was performed in order to determine the optimal specific pressing force for all tests.
Minerals 08 00483 g002
Figure 3. The two materials used in this study were different in terms of their mechanical response to comminution: altered granite and a calc-silicate. (A) Altered granite particles being comminuted between the rolls in single particle and bed compression; (B) Calc-silicate particles in a compressed cake; (C) Altered granite in a compressed cake; (D) Magnification of the calc-silicate cake, showing the particles after comminution under a high-pressure roll crusher.
Minerals 08 00483 g003
Figure 4. Block scheme of the reformed Austin model [6,19] for several steps of comminution in high pressure roll crusher. f i j represents the feed for each sub-process, with i = 1 … n, and n is the particle size distribution (PSD) vector length: Furthermore, j = 1 … Nt, and Nt is the number of stages of the whole process. S i is the selection function for each sub-process, with i = 1 … Nt. Finally, p i is the final product of the high-pressure roll crusher.
Minerals 08 00483 g004
Figure 5. Calculation methodology for the parameter xn, which is necessary for the selection function.
Minerals 08 00483 g005
Figure 6. Notation of the breakage function, the selection function and the identity matrix.
Minerals 08 00483 g006
Figure 7. Product particle size distribution for experiments using the altered granite material. (A) Experiments PV-1 to PV-4, showing the effect of varying roll speed; (B) experiments PF-1 to PF-4, showing the effect of top feed size; (C) experiments PP-1 to PP-2, varying the specific pressing force; (D) experiments PG-1 to PG-3, varying the static gap and (E) experiment PT-1 using a heterogeneous feed particle size distribution.
Minerals 08 00483 g007
Figure 8. Product particle size distribution for experiments using the calc-silicate material. (A) Experiments MV-1 toMV-4, showing the effect of varying roll speed; (B) experiments MP-1 to MP-5, changing the specific pressing force and (C) experiment MT-1, performed with a heterogeneous feed particle size distribution.
Minerals 08 00483 g008
Figure 9. Particles of the altered granite presented an ellipsoid shape, being classified as a larger top-size but with the ability to sneak between the rolls. Using the breakage distribution function as an evaluator, three stages were necessary for the particles to be ground into a size smaller than the gap and subsequently released as a product.
Minerals 08 00483 g009
Figure 10. Size distribution analysis of the cumulative altered granite particles, capable of passing through the gap using the breakage distribution function. P1, P2 and P3 represent the three stages necessary to obtain less than 5% of particles above the gap size. dp is the arithmetic average of the mesh size intervals.
Minerals 08 00483 g010
Figure 11. Different views of the calc-silicate particles in the size range of 5 mm to 6.7 mm. (A) Feed in profile view; (B) feed in front view (C) product in profile view and (D) product in front view.
Minerals 08 00483 g011
Figure 12. Selection function performance for the PF-1 experiments, using the variables previously calculated (Table 4).
Minerals 08 00483 g012
Figure 13. Feed, experimental and predicted curves in the altered granite showing the effect of varying the feed size. (A) PF-1; (B) PF-2; (C) PF-3 and (D) PF-4.
Minerals 08 00483 g013
Figure 14. Feed, experimental and predicted curves in the altered granite showing the effect of varying roll speed. (A) PV-1; (B) PV-2; (C) PV-3 and (D) PV-4.
Minerals 08 00483 g014
Figure 15. Feed, experimental and predicted curves in the altered granite showing the effect of varying the static gap. (A) PG-1; (B) PG-2 and (C) PG-3.
Minerals 08 00483 g015
Figure 16. Feed, experimental and predicted curves of the altered granite showing the effect of varying the specific pressing force. (A) PP-1; (B) PP-2 and (C) PP-3.
Minerals 08 00483 g016
Figure 17. Feed, experimental and simulated curves using the calc-silicate material showing the effect of varying the roll speed; (A) MV-1; (B) MV-2, (C) M V-3 and (D) MV-4.
Minerals 08 00483 g017
Figure 18. Feed, experimental and simulated curves using the calc-silicate material showing the effect of varying the specific pressing force; (A) MP-1; (B) MP-2; (C) M P-3; (D) MP-4 and (E) MP-5.
Minerals 08 00483 g018
Figure 19. Feed, experimental and simulated curves using the calc-silicate material experiment with a different static gap and a heterogeneous particle size distribution (A) PT-1 and (B) MT-1.
Minerals 08 00483 g019
Figure 20. Example of simulation using different breakage function parameters.
Minerals 08 00483 g020
Figure 21. Simulation results of the test PT-1 using back-calculated model parameters.
Minerals 08 00483 g021
Table 1. Device features and test conditions used in this work.
Roll diameter (mm)250
Roll length (mm)50
Rolls surface typeSmooth
Quantity of piston2
Piston diameter (mm)60
Engine power (kW)15
Table 2. Operative conditions for all experiments.
ParameterFeed SizeFeed DensityProduct DensityFrequencySurface SpeedSpecific Pressing ForceThroughputStatic Gap
Unitsmmt/m3t/m3Hzm/sMPat/hmm
SymbolFeρδfUFspThS0
PV-1+9.5–12.01.221.65500.732.500.523
PV-2+9.5–12.01.211.62400.582.500.493
PV-3+9.5–12.01.191.65300.442.500.523
PV-4+9.5–12.01.181.59200.292.500.493
PF-1+6.7–9.51.201.58400.582.500.523
PF-2+12.5–14.01.121.51400.582.500.493
PF-3+4.5–6.71.211.60400.582.500.523
PF-4+16.0–19.01.151.52400.582.500.493
PP-1+6.7–9.51.181.59400.582.500.593
PP-2+6.7–9.51.211.54400.581.500.523
PP-3+12.5–14.01.191.56400.581.300.493
PG-1+6.7–9.51.121.60400.581.300.522
PG-2+6.7–9.51.121.50400.582.500.493
PG-3+6.7–9.51.221.50390.582.500.474
PT-1PSD1.241.54400.582.500.455
MV-1+4.5–6.71.461.94500.732.500.463
MV-2+4.5–6.71.461.85400.582.500.483
MV-3+4.5–6.71.461.67450.652.500.483
MV-4+4.5–6.71.461.79350.512.500.513
MP-1+4.5–6.71.461.81500.731.250.463
MP-2+4.5–6.71.461.72500.731.750.483
MP-3+4.5–6.71.461.77500.732.500.513
MP-4+4.5–6.71.461.75500.733.250.523
MP-5+4.5–6.71.461.79500.734.500.493
MT-1PSD1.461.81500.732.500.525
Table 3. Parameters of the breakage function used for simulation [22]. The values of k, n1, n2 and n3 are dimensionless, and Y0 is in m. SC is the abbreviation for single particle compression, and BC is the abbreviation for bed particle compression.
MaterialConditionkn1n2n3Y0
Altered graniteSC0.680.371.950.640.0036
BC0.470.662.160.450.0045
Calc-silicateSC0.600.612.32--
BC0.190.624.37--
Table 4. Calculated parameters for the high-pressure roll crusher model and the selection function for the PF-1 test. The angles are in degrees and the factor γ is dimensionless.
αxn (mm)d1 (mm)γ
6.94.81.50.1
4.63.81.50.1
2.33.21.50.1
Table 5. Root mean square error (RMSE) results for all experiments. In this work, the fine phase was considered as all particles under 855 microns and coarse phase was over this cut-size.
ExperimentPV-1PV-2PV-3PV-4PF-1PF-2PF-3PF-4
Total6.87.27.17.56.47.87.98.6
Fine9.39.89.810.38.511.18.211.7
Coarse2.22.82.22.53.23.67.75.4
ExperimentPP-1PP-2PP-3PG-1PG-2PG-3PT-1MT-1
Total6.76.66.96.96.98.46.53.8
Fine9.08.89.29.39.310.39.41.9
Coarse1.12.02.21.01.15.31.65.1
ExperimentMV-1MV-2MV-3MV-4MP-1MP-2MP-3MP-4MP-5
Total6.48.07.19.714.110.47.25.56.1
Fine3.54.13.15.38.75.23.73.54.5
Coarse8.911.510.313.619.315.010.27.57.8
Table 6. Back-calculated parameters of the model, in order to fit with the experimental values. The values of k, n1, n2 and n3 are dimensionless, and Y0 is in m. SC is the abbreviation for single particle compression, and BC is the abbreviation for bed particle compression.
MaterialConditionkn1n2n3Y0
Altered graniteSC0.990.922.531.000.21
BC0.890.002.280.430.50