Article

Nano Precipitates Formed during the Dissolution of Calcite Incorporated with Cu and Mn †

1
CAS Key Laboratory of Mineralogy and Metallogeny and Guangdong Provincial Key Laboratory of Mineral Physics and Materials, Guangzhou Institute of Geochemistry, Chinese Academy of Sciences, Guangzhou 510640, China
2
University of Chinese Academy of Science, Beijing 100049, China
*
Author to whom correspondence should be addressed.
The paper is an extended version of our paper published in 1st International Electronic Conference on Mineral Science.
Minerals 2018, 8(11), 484; https://doi.org/10.3390/min8110484
Submission received: 24 August 2018 / Revised: 21 October 2018 / Accepted: 23 October 2018 / Published: 25 October 2018

Abstract

:
Calcite is often doped with impurity ions that affect its dissolution behavior. In the present investigation, solid solutions of (Ca, Mn)CO3 and (Ca, Cu)CO3 were synthesized by coprecipitation to study their dissolution in an acidic solution (pH = 5) at 25 °C. The solution chemical analysis results showed that the concentrations of aqueous Cu2+ and Mn2+ first increased and then decreased with the extension of dissolution time. Scanning electron microscope (SEM) and transmission electron microscope (TEM) observations revealed that rhodochrosite (MnCO3) and malachite (Cu2(OH)2CO3) formed during the dissolution. This suggested that the impurities in calcite might impact the dissolution and precipitation of carbonates in the environment.

1. Introduction

Calcite is the thermodynamically stable polymorph of calcium carbonate (CaCO3), and one of the most abundant and reactive minerals in Earth surface environments [1]. Through dissolution and precipitation in aqueous environments, calcite plays a critical role in regulating geochemical cycles, and in oceanic and atmospheric chemistry [2]. It is well-known that the dissolution process of calcite is related to temperature, pH, pCO2, solid composition, and solution composition [1,3,4]. For example, Gong et al. reported that the calcite dissolution rate firstly increased and then decreased between 50–250 °C [5]. Alkattan et al. concluded that the calcite dissolution rate was positively related to the hydrogen ion activity in the solution [6]. Meanwhile, the inhibition effects of aqueous cationic and anionic ions, such as Mg2+, Cd2+, Mn2+, and Sr2+, on the dissolution of calcite, have also been observed [7,8,9].
It is well-known that Mn2+, Mg2+, Cd2+, Co2+, Fe2+, and Zn2+ can substitute for Ca2+ in calcite to form CaCO3-MCO3 (M = Mn2+, Mg2+, Cd2+, Co2+, Fe2+, Zn2+) solid solutions [10]. Additionally, other heavy metal ions (e.g., Pb2+, Cu2+, and Ni2+), radionuclides (e.g., UO22+), and rare earth elements (REEs, e.g., Nd3+, Eu3+, and Ce3+) can also be incorporated into a calcite structure via substitution, precipitation/coprecipitation, adsorption, and absorption/solid-state diffusion [11,12,13,14]. Therefore, ionic substitution (and, consequently, the formation of solid solutions) might control the environmental behavior of heavy metals where calcite is present. According to Prieto, the stoichiometric solubility product of an ideal solid solution (BxC1−xA) is a function of its composition; that is, Ksp = [Bn+]x[Cn+]1−x[An−] (the activity of a single-component solid was assumed to be one) [15]. For example, Böttcher studied the dissolution of CaCO3-MnCO3 solid solutions in CO2-H2O solutions at 20 °C, and received a stoichiometric solubility constant that was positioned between the respective values for the end-member solids [16]. Based on atomic force microscopy (AFM) observations, Harstad and Stipp discovered that Fe2+, Mg2+, Mn2+, and Sr2+, which are naturally present in Iceland spar calcites, inhibited its dissolution [17]. However, due to the numerous impurities in natural calcite samples, it is difficult to identify the influence of a single component on its dissolution.
Therefore, a series of calcite samples doped with varying contents of heavy metals were prepared by coprecipitation and characterized by X-ray diffraction (XRD), a Brunauer–Emmett–Teller (BET) surface area instrument, and scanning electron microscope (SEM). A batch experiment was performed to study the kinetic dissolution of the solid solutions. The main objective was to confirm the effect of impure heavy metals in calcite on its dissolution process. Herein, we report the synthesis, characterization, and dissolution behavior of Cu and Mn containing calcite. The highlight of our findings is the observation of new nanoprecipitates enriched in Cu and Mn, respectively, during the dissolution of calcite.

2. Materials and Methods

2.1. Solid Preparation and Characterization

2.1.1. Coprecipitation Procedures

Solid solutions of (Ca, M)CO3 (M = Mn, Cu) were prepared according to the following reaction: xM 2 + + ( 1 x ) Ca 2 + + CO 3 2 Ca ( 1 x ) M x CO 3 . Given volumes of 0.1 M of MCl2 were mixed together with 150 mL of 1-M CaCl2 solutions with molar ratios of M/Ca = 0, 0.02, 0.04, and 0.1, and diluted with deionized water to 500 mL. A solution of 150 mL of 1 M of Na2CO3 was also diluted with deionized water to 500 mL. A 500-mL Na2CO3 solution was delivered into a vessel containing a mixture of 500 mL of CaCl2 and MCl2 at a constant rate, using a peristaltic pump and under continuous stirring. The precipitates were aged in situ for 72 h without stirring, and then centrifuged and dried in an oven at approximately 80 °C. All of the experiments were performed at room temperature and atmospheric pressure.

2.1.2. Characterization

Powder XRD (BRUKER D8 ADVANCE, Bruker Corporation, Billerica, MA, USA) was employed to confirm the crystalline phases. Partial precipitate was decomposed by HNO3 and used to analyze the Ca, Cu, and Mn contents by inductively coupled plasma-optical emission spectrometry (ICP-OES) (VARIAN VISTA PRO, Varian, Inc., Palo Alto, CA, USA). Furthermore, a ZEISS Gemini 500 (ZEISS, Birkerød, Denmark) field emission SEM (FE-SEM) was used to obtain images of the precipitates and the approximate sizes of the crystalline samples. A BET surface area instrument (Micromeritics ASAP2020M, Micromeritics, Norcross, GA, USA) was used to measure the specific surface area of these solid solutions.

2.2. Dissolution Experiments

A series of 15-mL polyethylene centrifuge tubes containing 10 mL of hydrochloric acid solution (pH = 5.0) were firstly prepared. A solid of 0.1250 g was added into each tube, and all of the tubes were capped and shaken using an overhead shaker in an incubator chamber at 25 °C. The solution pH was not controlled, and was allowed to automatically vary. At a specified time, the solution in one tube was sampled and filtered with 0.22-μm pore filters. Aqueous pH was immediately measured using a pH meter (Sartorius PB-10, The Sartorius group, Göttingen, Germany). The concentration of carbonate was measured according to the Chinese national standard method (GB/T 11064.12-2013). The concentrations of Ca, Cu, and Mn were analyzed using ICP-OES (VARIAN VISTA PRO). The solids were sampled from the bottles after centrifugation, dried, and investigated by SEM (ZEISS Gemini 500) and transmission electron microscope (TEM) (FEI Talos F200S, Thermo Fisher Scientific, Waltham, MA, USA). All of the experiments were run in duplicate, and an average was obtained for each metal concentration.

3. Results

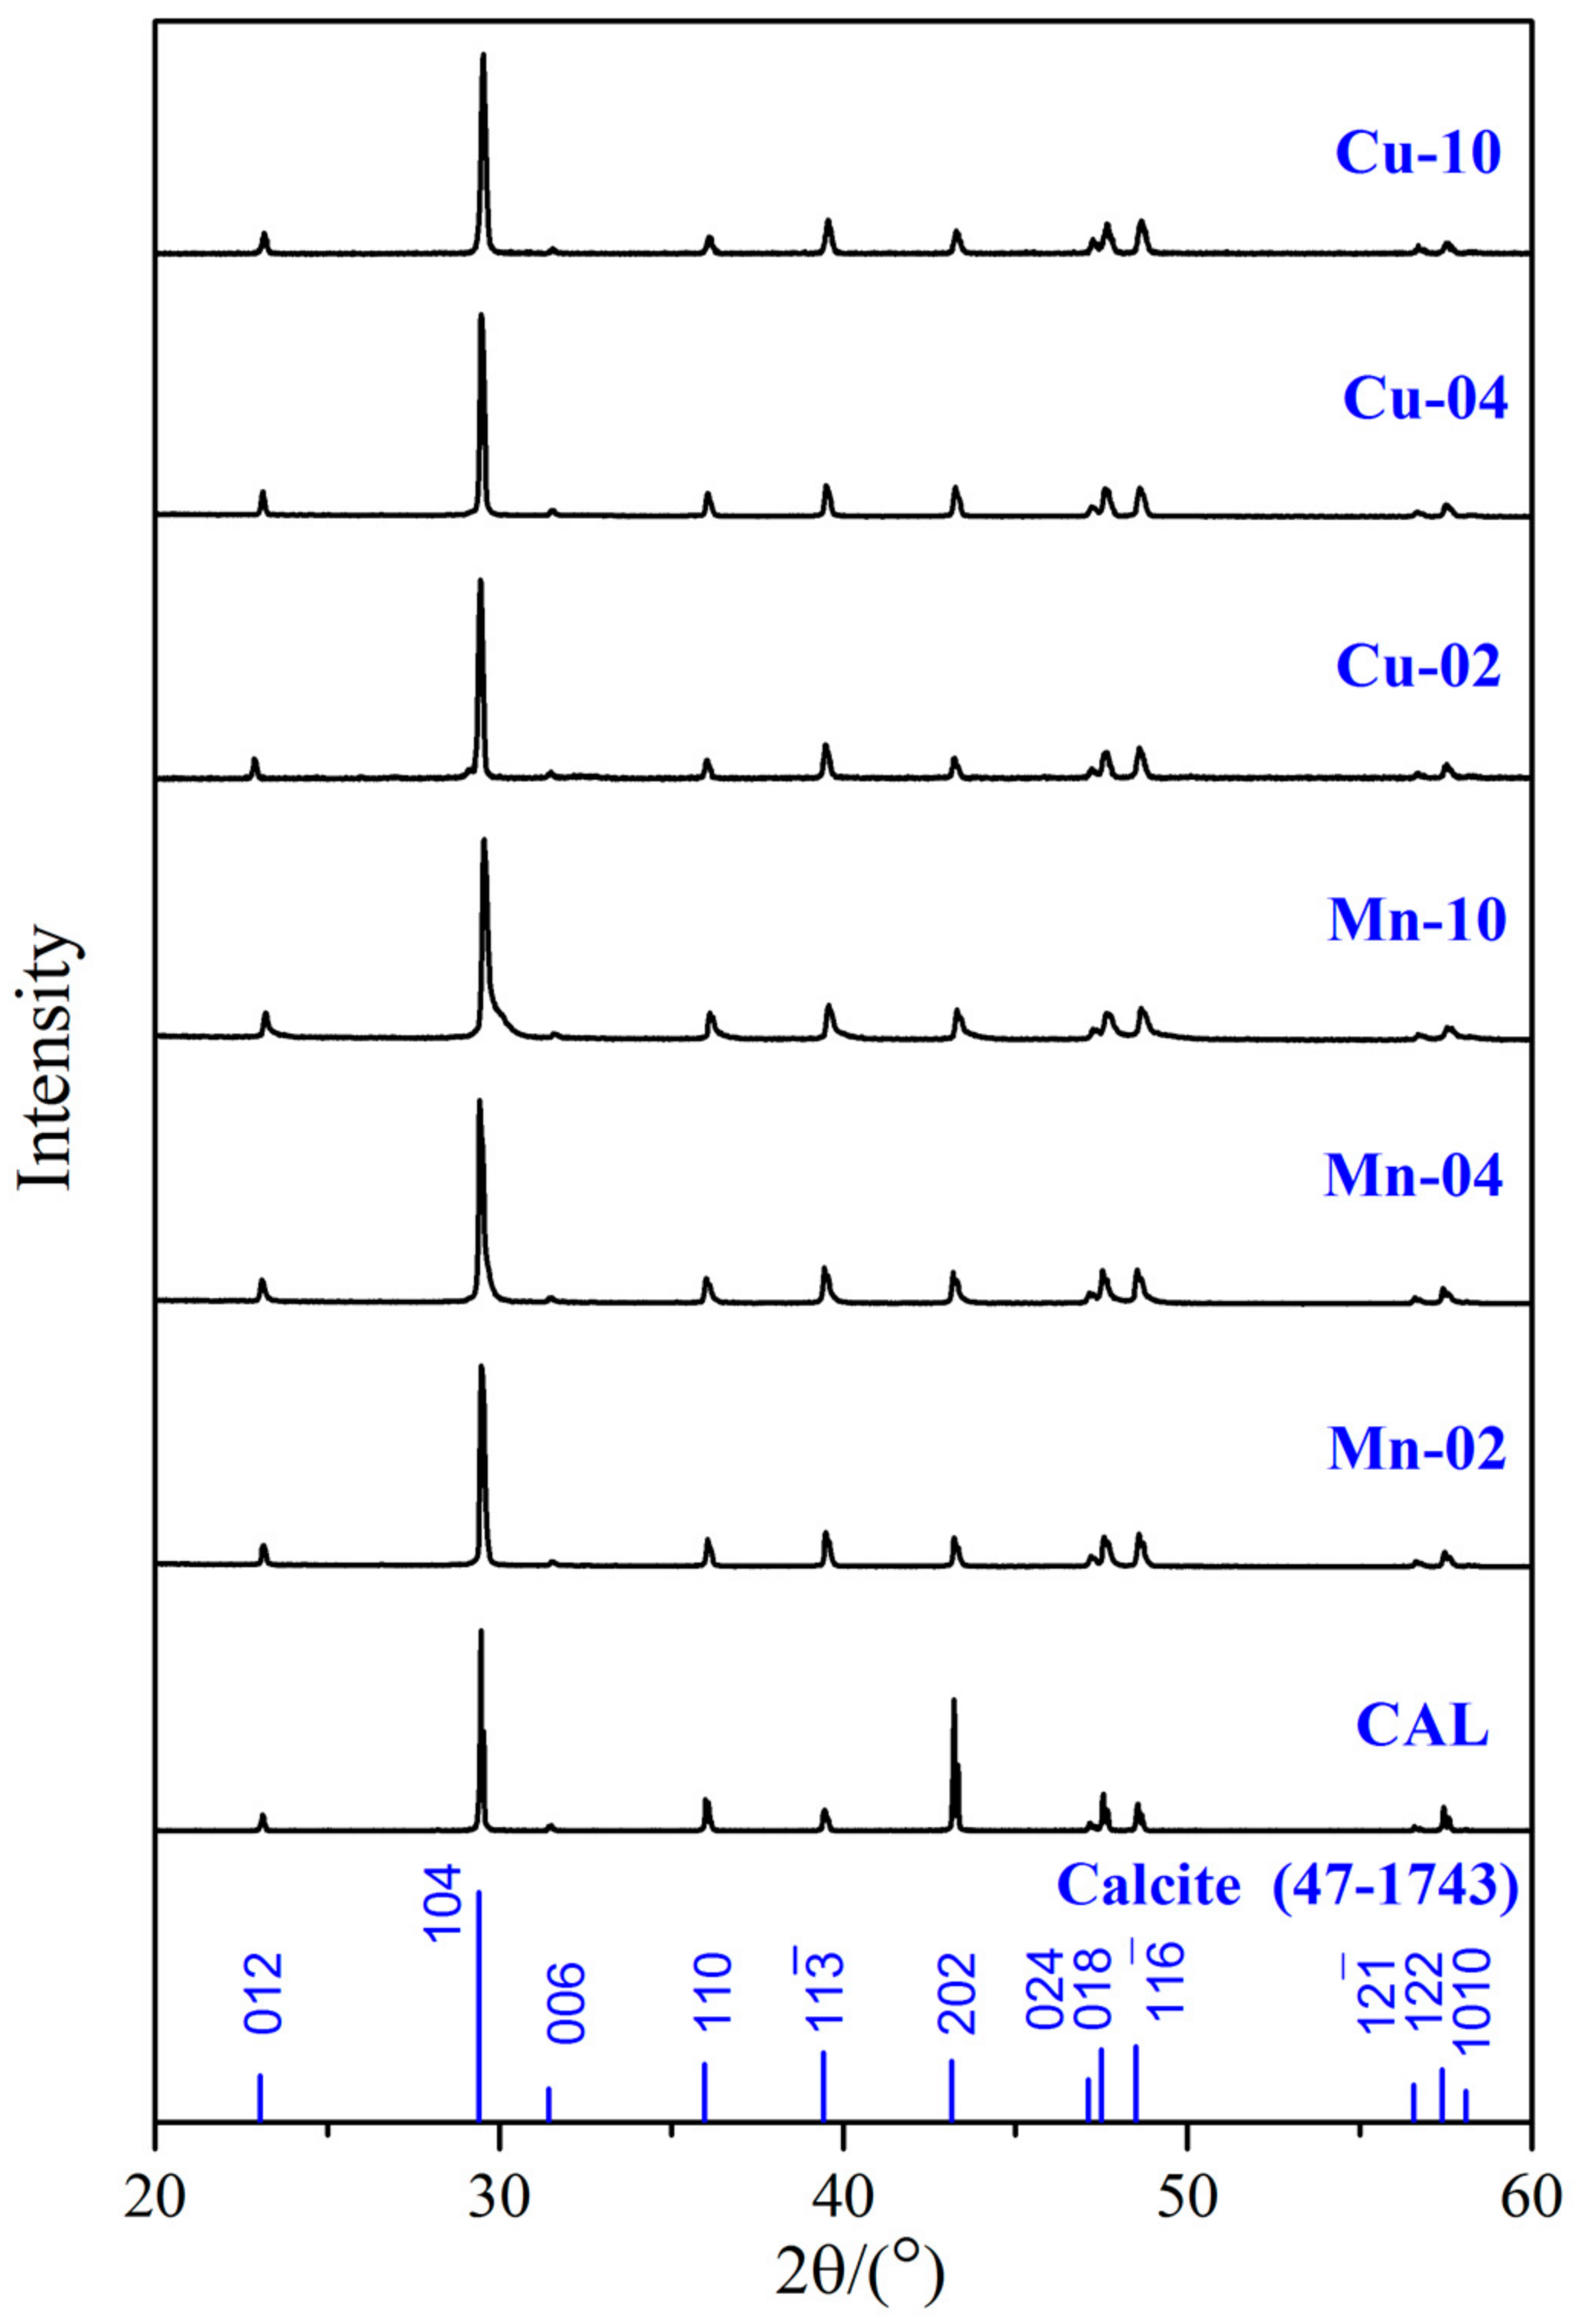
3.1. Structure and Chemical Compositions

Figure 1 shows the XRD patterns of the synthesized samples that agreed with the calcite reference pattern (JCPDS 47-1743), indicating that no other detected phases were present. With the incorporation of Mn and Cu, the reflections (especially (104)) shifted a little bit to higher angles, due to the smaller interplanar distances of solid solutions compared to the calcite sample without impurity incorporation (CAL). Since peak-broadening effects can reflect the compositional heterogeneity of the solid-solution crystals, the peak widths were analyzed by considering the full width at half maximum intensity values (FWHM) of the two most intense reflections (012 and 104). FWHM values were determined after performing a Kα2 stripping correction. Peak-broadening effects can be attributed to either compositional heterogeneities, the presence of small crystallites (the size of the coherently diffracting domain), or lattice distortions. Therefore, the FWHM values of the solid-solution precipitates and the corresponding two end members were compared to determine the occurrence of heterogeneity. The FWHM values of the 012 and 104 reflections for the samples CAL, Mn-02, Mn-04, Mn-10, Cu-02, Cu-04, and Cu-10 were 0.121, 0.132, 0.151, 0.168, 0.127, 0.131, and 0.135; and 0.100, 0.103, 0.125, 0.182, 0.127, 0.134, and 0.146, respectively. Based on previous research results [18], peak broadening varied in a regular way with composition, and this could most probably be attributed to crystallite size changes. Chemical analysis data demonstrated that the composition of the solids was almost the same as the M/Ca molar ratio of the mixing solutions (Table 1). BET results (Table 1) showed that the specific surface area of the sample increased with the increase of impurity content.

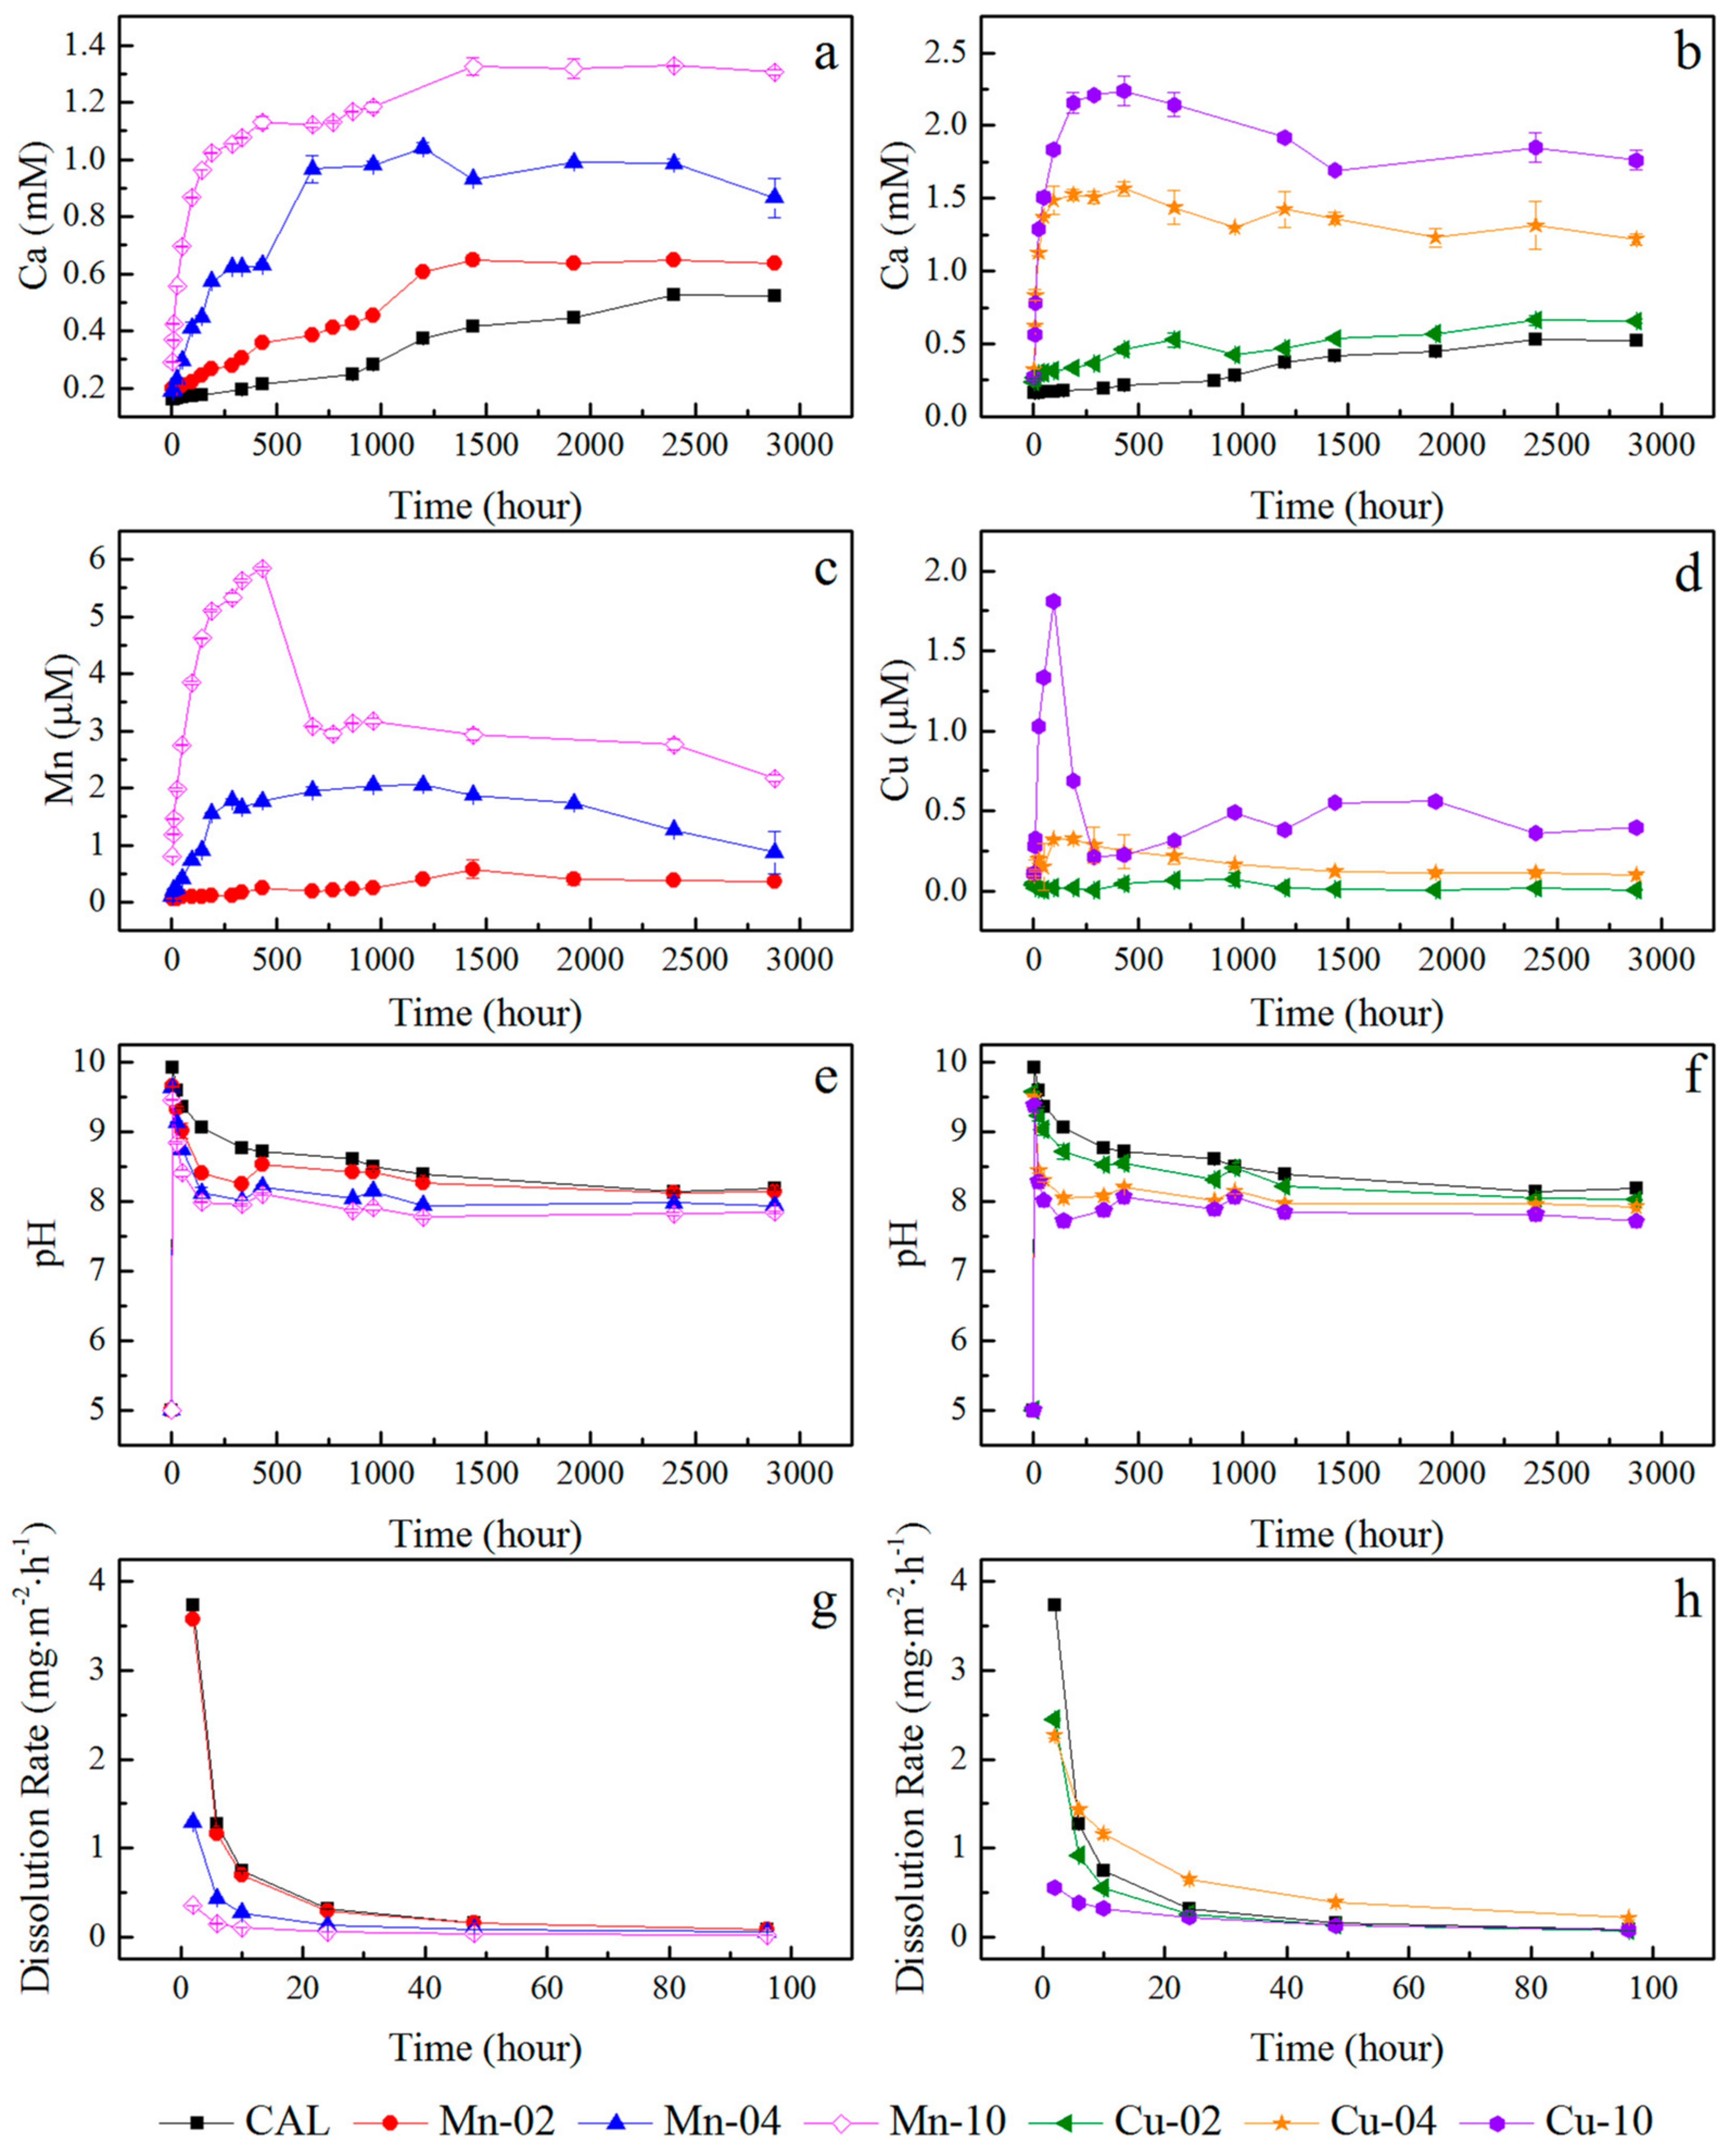
3.2. Release of Metals
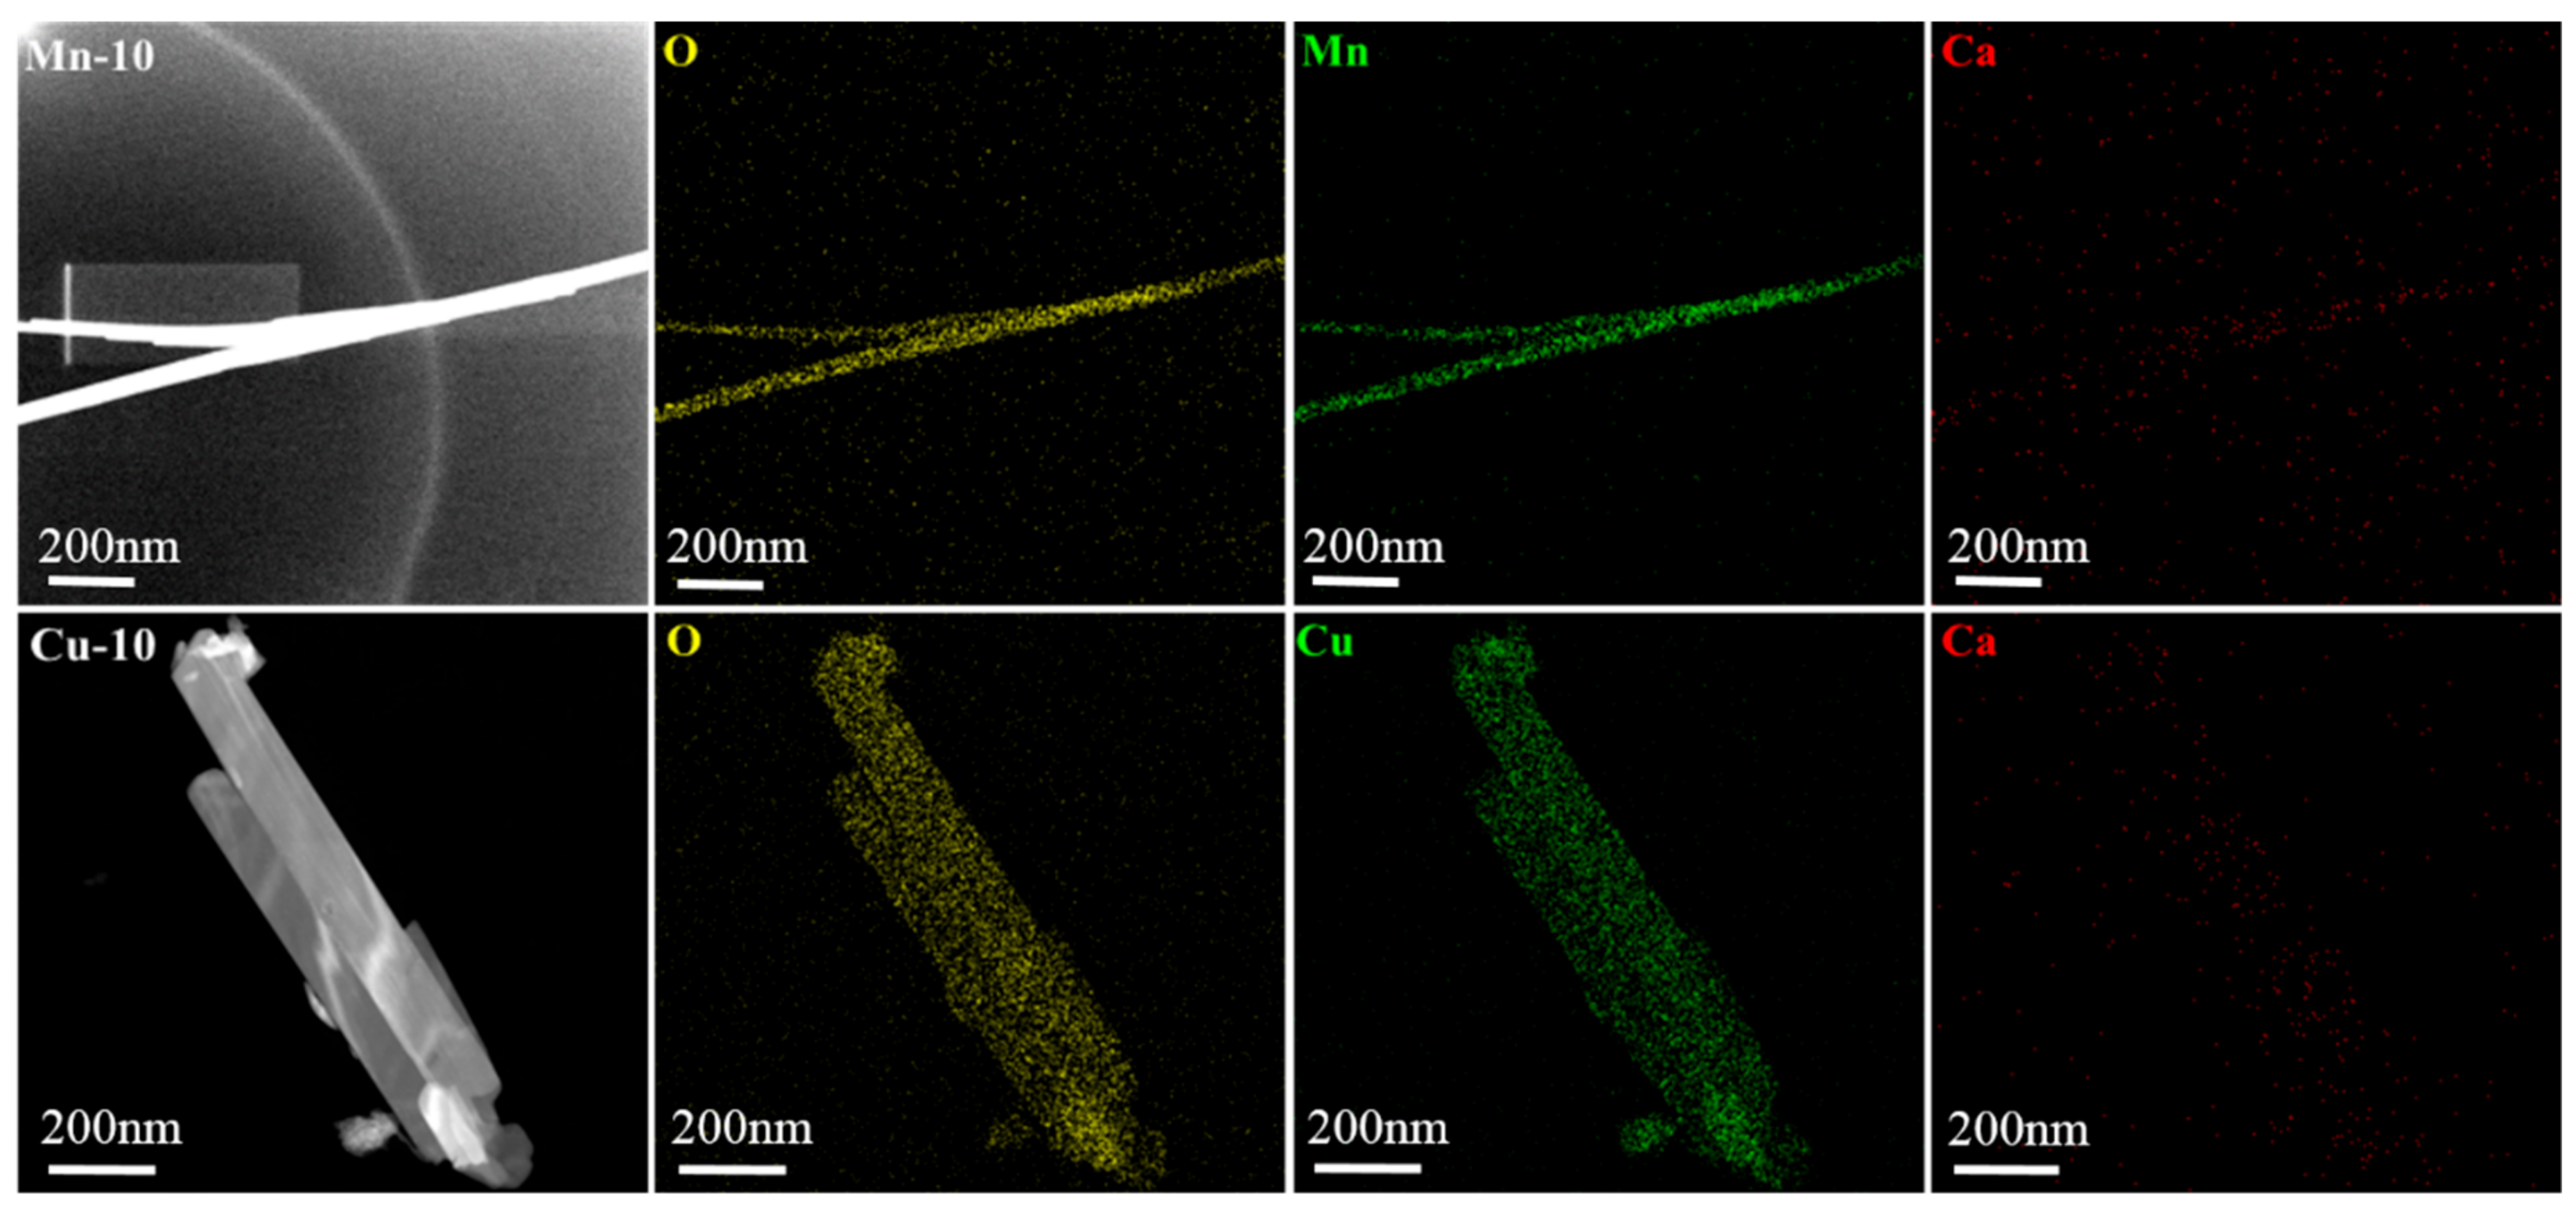
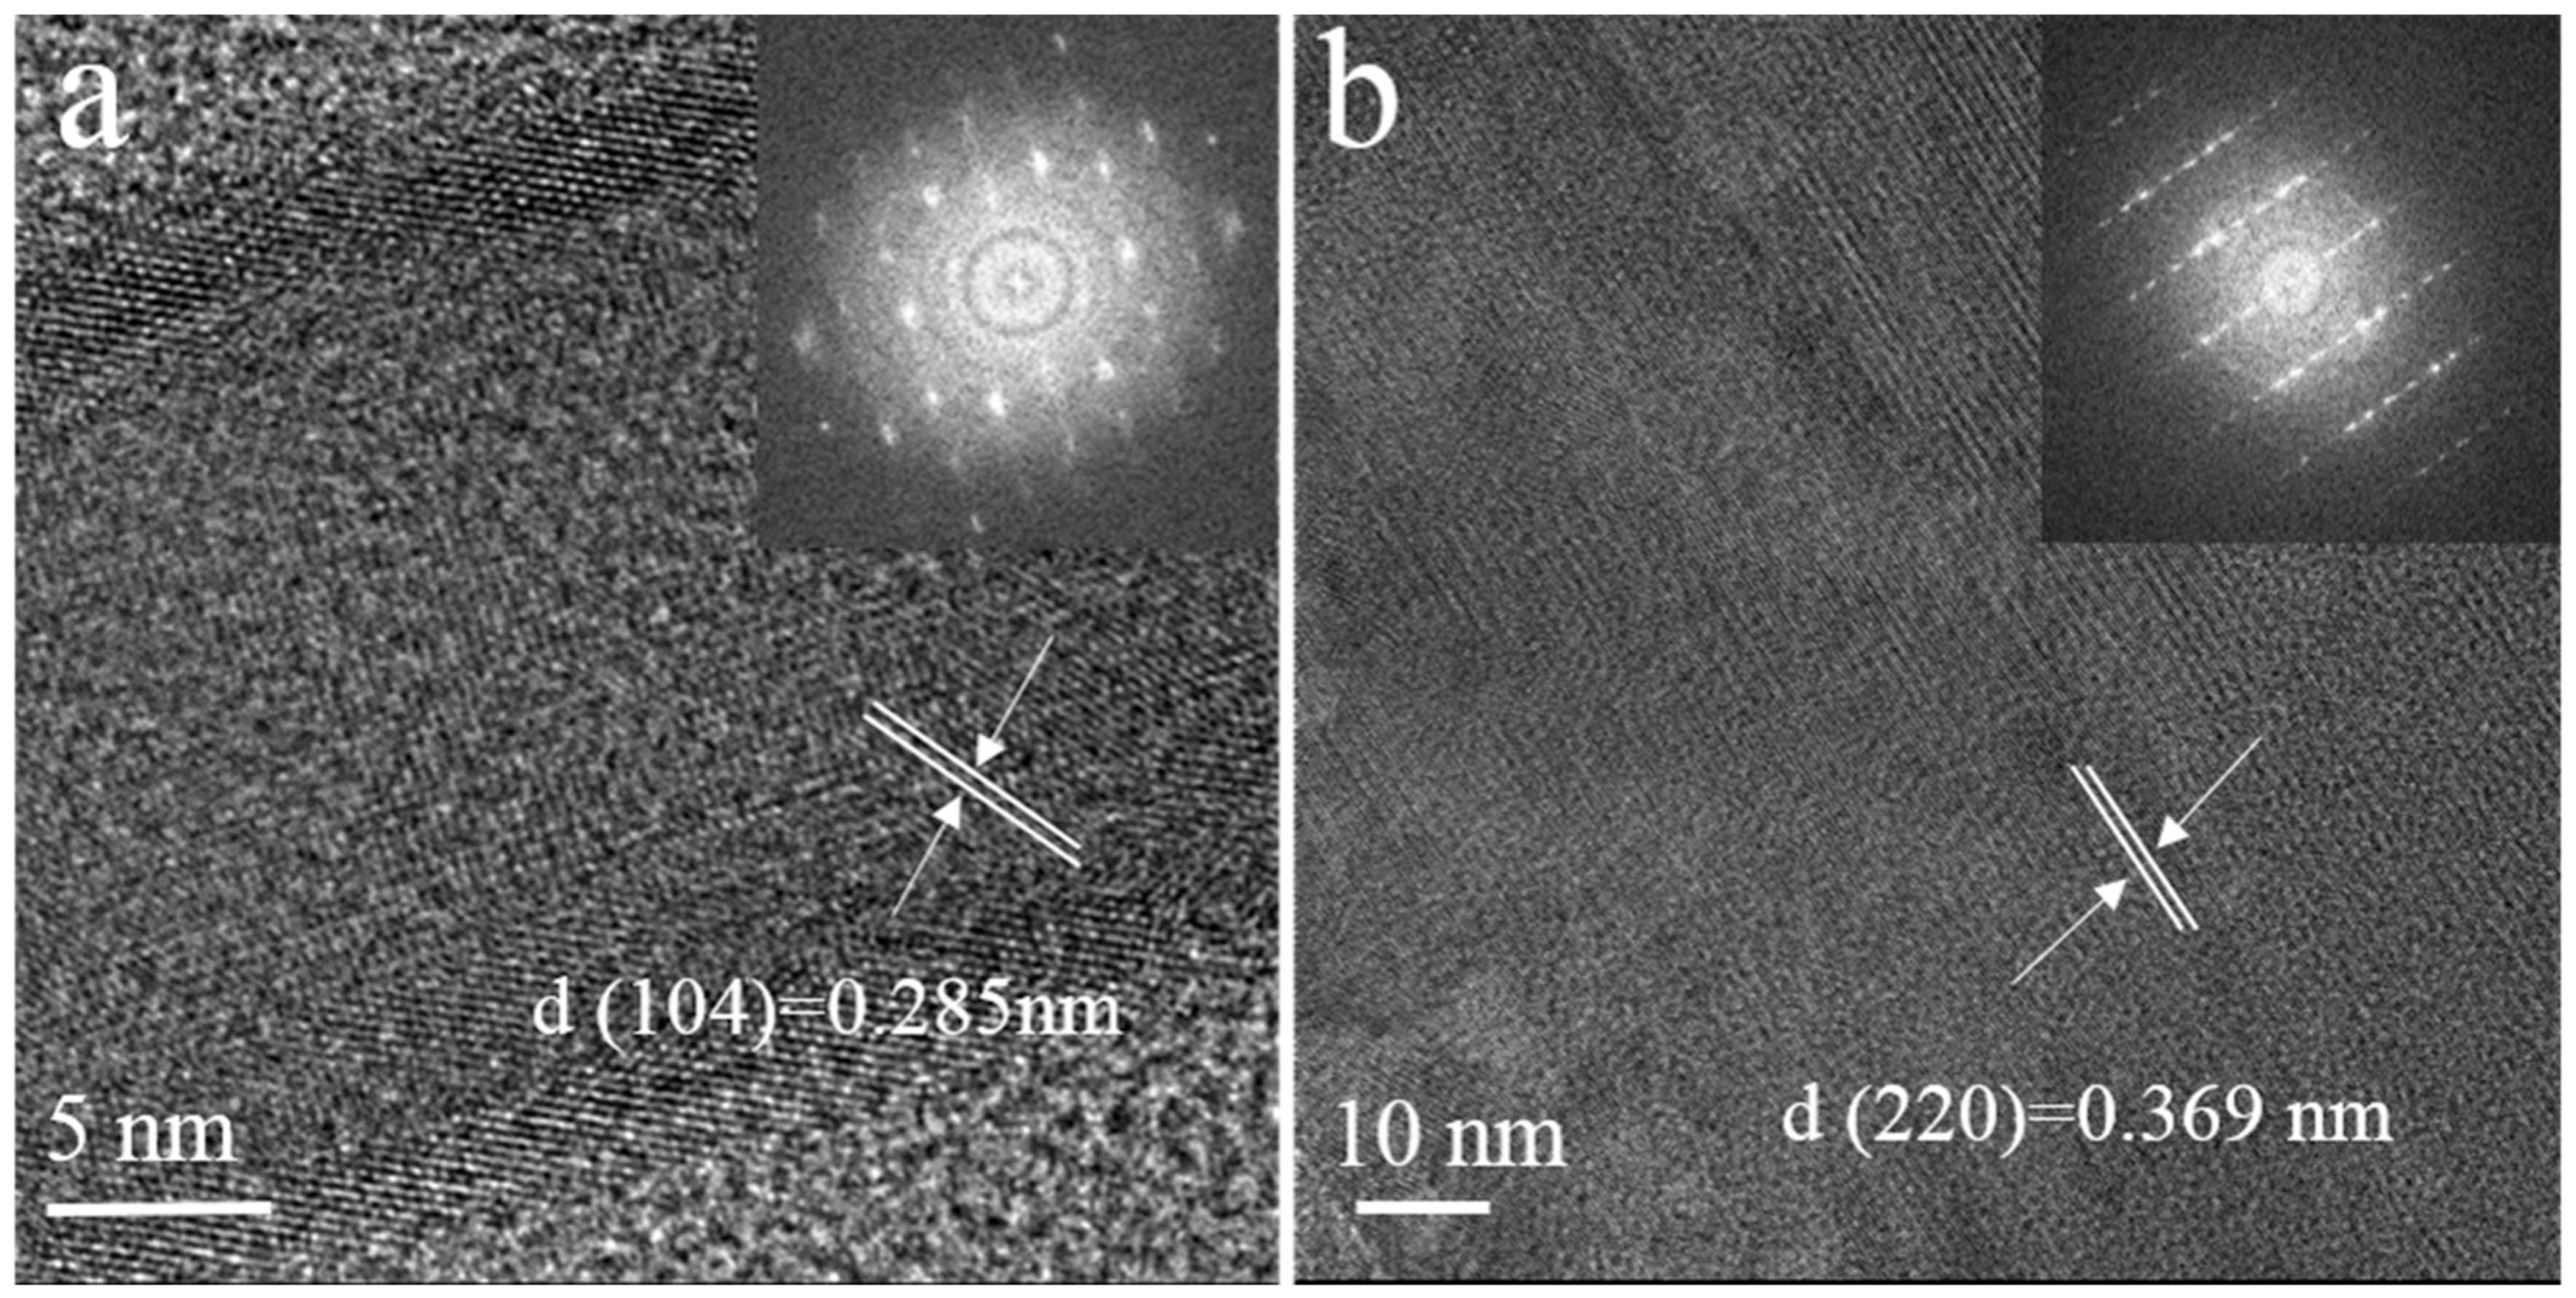
The kinetic evolutions of the aqueous metal concentrations during calcite dissolution are illustrated in Figure 2. The aqueous Ca concentrations increased with time and reached the maximum values at approximately 2400 h and 1440 h of dissolution for CAL and Mn-containing calcite, respectively. The final concentrations of calcium were ~0.52 mM, 0.64 mM, 0.87 mM, and 1.31 mM for CAL, Mn-02, Mn-04, and Mn-10, respectively, which correlated with the specific surface areas of the samples (Figure 3a). However, the aqueous Mn decreased after its peak values of 0.58 μM (1440 h), 2.05 μM (1220 h), and 5.84 μM (432 h) to 0.37 μM, 0.87 μM, and 2.17 μM at 2880 h for Mn-02, Mn-04, and Mn-10, respectively (Figure 2c). This indicates that up to 63% of the dissolved Mn was removed from solution, possibly by adsorption or precipitation. The molar ratios of aqueous Ca/Mn ranged from 190 to 3840, which were much higher than those in the solids, suggesting a nonstoichiometric release of Ca and Mn.
For the calcite incorporated with Cu, Cu-02 showed similar Ca release behavior to CAL. However, the released Ca reached its value peaks of 1.57 mM and 2.24 mM at 432 h, and then decreased slightly to 1.22 mM and 1.76 mM at 2880 h for Cu-04 and Cu-10 (Figure 2b). The released Cu reached the maximum values of 0.07 μM, 0.33 μM, and 1.81 μM at 960 h, 192 h, and 96 h for Cu-02, Cu-04, and Cu-10 (Figure 2d), respectively. The aqueous Ca/Cu molar ratios were in the range of 1000 to 150,000, which was much higher than that for the (Ca, Mn)CO3 solid solutions.
Figure 2e–f shows the aqueous pH evolution during dissolution, which increased from 5.0 to ~10 within two hours once the dissolution experiment was launched, and then declined slowly to 7.72~8.19. It is worth noting that the pH of the CAL sample was always higher than that of the (Ca, M)CO3 solid solutions.
As previously mentioned, the total dissolved mass was in the order of CAL < Mn-02 < Mn-04 < Mn-10 and CAL < Cu-02 < Cu-04 < Cu-10 (Figure 2a–d), which was the same as the order of the BET specific surface areas (Table 1). However, the order of the average dissolution rates was reversed once normalized by the initial BET values, especially within the first two hours. This result proved that Mn and Cu in calcite could inhibit its dissolution, which was consistent with the study on the effect of impurity ions in solution on calcite dissolution [19,20,21]. It can be seen from Figure 2g–h that rapid dissolution occurred in the early stage (0~24 h) of the reaction, after which the reaction rate decreased rapidly.

3.3. Morphology

The CAL sample (Figure 3a) showed a typical rhombohedral calcite structure with a size of ~40 μm, which is indicative of the morphology of calcite crystals grown and defined by the rhombohedral face of (104). The sizes of the calcite solid solutions decreased with the incorporation of Mn and Cu (Figure 3c–e,i–k). This phenomenon was consistent with the BET results showing the increase of FWHM values, as discussed previously. The morphology of the solid solutions remained rhombohedral for aggregations of Ca(1−x)MnxCO3, while it changed to dodecahedron (x = 0.02, Cu-02) and subidiomorphic (x = 0.04 and 0.11, Cu-04 and Cu-10) for Ca(1−x)CuxCO3 solid solutions. This indicated that Mn and Cu could affect calcite growth and change its morphology [22,23]. Davis et al. concluded that elongation along the c direction and the emergence of rough pseudofacets led to the development of a new crystallographic form in the presence of Mg2+ [24].
After dissolution, etch pits were observed on the calcite surface, while the crystal edges degenerated (Figure 3b). It was surprising that some new precipitates with needle or prism morphology were discovered on the surface of the (Ca, Mn)CO3 and (Ca, Cu)CO3 solid solutions at various times (Figure 3f–h,l–n). The first discovered precipitation times for Mn-02, Mn-04, Mn-10, Cu-02, and Cu-10 were (probally earlier than) 1920 h, 288 h, 96 h, 672 h, and 48 h, respectively (Table 1). Surface precipitation was occasionally found when Mn-04 was dissolved after 288 h. Needle-like precipitation was observed obviously on the surface of Mn-04 after 672 h. Clusters of precipitation were observed on the surface of Cu-10 at 48 h, which grew to a short prism or plate shape after 1920 h. After 2880 h, the size of both precipitates was ~10 μm in length and 10~20 nm in width for Mn-10, and 50~200 nm for Cu-10.
Selected transmission electron microscope-energy dispersive spectrometer (TEM-EDS) mapping of the new precipitates for Mn-10 and Cu-10 is presented in Figure 4. Mn-10 showed nanoscale needle-like crystals with a width of ~20 nm, while Cu-10 adopted a rod-like morphology with a length of 800 nm and width of 100 nm. The element mapping results demonstrated that the newly formed precipitates were enriched in Mn and Cu, respectively, with trace Ca. According to the high-resolution transmission electron microscopy (HRTEM) images shown in Figure 5a, the lattice fringes with a d-spacing of 0.285 nm corresponded to the (104) reflection of rhodochrosite (MnCO3). The high-resolution transmission electron microscopy and the correlated fast Fourier transform (FFT) analysis of Mn-10 (Figure 4a) indicated that the rhodochrosite precipitate was monocrystalline. Figure 5b shows a TEM image of lattice fringes with a d-spacing of 0.369 nm related to the (220) reflection of malachite (Cu2(OH)2CO3). The FFT pattern displayed that the malachite had a monocrystalline structure as well.

4. Discussion

The major related equations describing the dissolution are as follows:
CaCO 3 Ca 2 + + CO 3 2
Ca ( 1 x ) M x CO 3 xM 2 + + ( 1 x ) Ca 2 + + CO 3 2
CO 3 2 + H + HCO 3
HCO 3 + H + H 2 CO 3
H 2 O H + + OH
CO 2 ( g ) + H 2 O H 2 CO 3 ( aq )
Mn 2 + + CO 3 2 MnCO 3
2 Cu 2 + + CO 3 2 + 2 OH Cu 2 ( OH ) 2 CO 3
With the dissolution of calcite, the cations and the carbonate group were released into the aqueous solution (Equations (1) and (2)). For CAL, the aqueous pH increased from 5.0 to 9.92 within two hours, and then declined slowly and remained stable at around 8.1 (Figure 2e). The increase of aqueous pH was attributed to the formation of HCO3 and H2CO3(aq) (Equations (1)–(3)), which resulted in the depletion of H+ and the production of OH (Equation (4)). Thereafter, the decline of aqueous pH after 2 h might be due to the precipitation of MnCO3 and Cu2(OH)2CO3 consumed CO32− (Equations (7) and (8)), which promoted the generation of H+ (Equations (3) and (4)). Meanwhile, CO2 indiffusion would also lead to pH change (Equation (6)). The decomposition of partial HCO3 and H2CO3(aq) will release H+ into the solution again until equilibrium. In addition, the precipitation of Cu2(OH)2CO3 declined the concentration of OH (Equation (8)), which contributed to the generation of H+ (Equation (5)). The remarkable change of pH value at the early stage of the experiment indicated that the initial stage of dissolution of the solid solutions was controlled by pH [6].
According to Figure 2a–d, more Ca was released into the solution than Mn and Cu compared to the original solid materials, suggesting that the dissolution of (Ca, Mn)CO3 and (Ca, Cu)CO3 was nonstoichiometric. Putnis et al. provided a clear observation of the nonstoichiometric dissolution of dolomite, and suggested an interface-coupled dissolution–precipitation mechanism [25]. Walton predicted that the strong adsorption position on the crystal surface was more favorable for nucleation [26]. Thus, Mn(Cu) had stronger adsorption on the crystal surface, which was conducive to the nucleation and formation of new precipitates.
Based on the SEM, TEM, and ICP-OES results, the aqueous (Ca, M)CO3 dissolution was considered to have the following coincident steps or processes, as Putnis et al. suggested [25]:
(1)
Water contacts the solid surface and initiates dissolution.
(2)
Release of Ca2+, M2+, and CO32- ions from the crystal surface.
(3)
Reprecipitation of the chemicals from the solution back onto the solid surface.
The dissolution started once the acidic water contacted the solid (Ca, Mn)CO3 (Process 1). Thereafter, Ca2+, Mn2+, and CO32− ions were released from the solid surface into the aqueous solution (Process 2, Equation (1)). Since the solubility product of rhodochrosite (Ksp = 10−11.13) [27] is much smaller than that of calcite (Ksp = 10−8.48) [4], the system at the solid–fluid boundary became supersaturated with respect to MnCO3 (Process 3). These two processes were coupled at the calcite–water interface. SEM results showed that the new precipitates were first formed on the mineral surface, especially where defects were present. Therefore, it can be speculated that the initial stage of the surface precipitation reaction belonged to the interfacial reaction.
For sample Mn-10, Figure 2c shows that the Mn concentration reached the maximum at 432 h. According to the geochemical computer program (PHREEQC), the saturation indices (SI) of CaCO3 and MnCO3 were 0.09 and −0.33 at 96 h, 0.22 and 0.42 at 432 h, 0.07 and −0.78 at 2880 h, respectively. The SI of MnCO3 was consistent with the evolution of the aqueous Mn concentration. The SI value indicated that MnCO3 was unsaturated at 96 h, whereas new precipitation was generated on the surface of the solid. It showed that the dissolution–precipitation phenomena at the calcite–water interface occurred prior to the supersaturation of the bulk solution. With the interfacial reaction, the Mn would also be dissolved into the solution, so the time of precipitation that was observed was earlier than the time of the maximum Mn concentration.
Many possible reactions should be considered in the research on (Ca, Cu)CO3 dissolution due to the hydrolysis of Cu in an alkaline solution (via the formation of Cu(OH)2). For sample Cu-10, PHREEQC calculation results showed that the SI of CaCO3, CuCO3, Cu(OH)2, and Cu2(OH)2CO3 were 0.34, −3.84, −0.91, and −0.55 at 48 h; 0.39, −3.41, −0.81, and 0.12 at 96 h; and 0.18, −1.51, −4.10, and −1.42 at 2880 h. This suggested that the Cu2+ tended to separate out in the form of Cu2(OH)2CO3, which agreed with the TEM results. As mentioned in Section 3.3, new precipation was clearly observed on the surface of Cu-10 at 48 h, indicating that precipitation occurred earlier than the time of maximum Cu concentration. In a long-term Cu contaminated calcareous soil, malachite was also observed as the reaction product for Cu [28].

5. Conclusions

With the incorporation of Mn and Cu, the sizes of calcite crystals became smaller. The morphology of Mn-doped calcite remained rhombohedron, while it changed to dodecahedron and subidiomorphic for Cu-doped calcite. During the dissolution of the (Ca, M)CO3 (M = Mn, Cu) solid solutions, the released metal concentrations were considerably dependent on the amount of Mn (Cu) in the solids. The incorporation of Mn and Cu enhanced the solubility of calcite due to the smaller particle size. However, the dissolution rate of pure calcite is greater than that of calcite doped with Mn and Cu. Surprisingly, the initially dissolved Mn and Cu were observed to precipitate as new phases; that is, as rhodochrosite and malachite, which was demonstrated by the SEM and TEM results. Therefore, the dissolution of the (Ca, M)CO3 (M = Mn, Cu) solid solutions was nonstoichiometric due to the dissolution–precipitation at the calcite–water interface, which ‘trapped’ the Mn and Cu via forming new minerals. Our results suggest that the impurities in calcite can impact the dissolution process of calcite, and control the environmental behavior of heavy metals such as Mn and Cu.

Author Contributions

Conceptualization, S.W.; data curation, X.Z.; funding acquisition, S.W. and F.C.; investigation, X.Z.; supervision, S.W. and F.C.; writing—original draft, X.Z.; writing—review and editing, S.W. and F.C.

Funding

This research was funded by the National Natural Science Foundation of China (41573098, 41877135), the Natural Science Foundation of Guangdong Province (2017A030313223), the Science and Technology Planning Project of Guangdong Province (2017B020236003, 2017B030314175), the Science and Technology Planning Project of Guangzhou (201604020017), and the ‘One-Three-Five’ programs of the Guangzhou Institute of Geochemistry, Chinese Academy of Sciences (135PY201604).

Acknowledgments

S. Wu is grateful to the TU Guangchi Young Scholar Foundation of GIGCAS, Special Support Plan for Cultivation of High-Level Talents in Guangdong Province and Jiangsu Provincial Key Laboratory of Radiation Medicine and Protection (KJS1333). This is contribution No.IS-2599 from GIGCAS.

Conflicts of Interest

The authors declare no conflict of interest.

References

  1. Reeder, R.J. Crystal chemistry of the rhombohedral carbonates. In Carbonates: Mineralogy and Chemistry: Reviews in Mineralogy; Mineralogical Society of America: Chantilly, VA, USA, 1990; Volume 11, pp. 1–48. [Google Scholar]
  2. Berner, R.A. Kinetics of weathering and diagenesis. In Kinetics of Geochemical Processes: Reviews in Mineralogy and Geochemistry; Mineralogical Society of America: Chantilly, VA, USA, 1981; Volume 8, pp. 111–134. [Google Scholar]
  3. Plummer, L.N.; Wigley, T.M.L.; Parkhurst, D.L. The kinetics of calcite dissolution in CO2-water systems at 5 °C to 60 °C and 0.0 to 1.0 atm CO2. Am. J. Sci. 1978, 278, 179–216. [Google Scholar] [CrossRef]
  4. Plummer, L.N.; Busenberg, E. The solubilities of calcite, aragonite and vaterite in CO2-H2O solutions between 0 and 90 °C, and an evaluation of the aqueous model for the system CaCO3-CO2-H2O. Geochim. Cosmochim. Acta 1982, 46, 1011–1040. [Google Scholar] [CrossRef]
  5. Gong, Q.; Deng, J.; Wang, Q.; Yang, L.; She, M. Calcite dissolution in deionized water from 50 °C to 250 °C at 10 MPa: Rate Equation and Reaction Order. Acta Geol. Sin. 2008, 82, 994–1001. [Google Scholar] [CrossRef]
  6. Alkattan, M.; Oelkers, E.H.; Dandurand, J.-L.; Schott, J. An experimental study of calcite and limestone dissolution rates as a function of pH from −1 to 3 and temperature from 25 °C to 80 °C. Chem. Geol. 1998, 151, 199–214. [Google Scholar] [CrossRef]
  7. Arvidson, R.S.; Collier, M.; Davis, K.J.; Vinson, M.D.; Amonette, J.E.; Luttge, A. Magnesium inhibition of calcite dissolution kinetics. Geochim. Cosmochim. Acta 2006, 70, 583–594. [Google Scholar] [CrossRef]
  8. Lea, A.S.; Amonette, J.E.; Baer, D.R.; Liang, Y.; Colton, N.G. Microscopic effects of carbonate, manganese, and strontium ions on calcite dissolution. Geochim. Cosmochim. Acta 2001, 65, 369–379. [Google Scholar] [CrossRef]
  9. Cubillas, P.; Köhler, S.; Prieto, M.; Causserand, C.; Oelkers, E.H. How do mineral coatings affect dissolution rates? An experimental study of coupled CaCO3 dissolution-CdCO3 precipitation. Geochim. Cosmochim. Acta 2005, 69, 5459–5476. [Google Scholar] [CrossRef]
  10. Hazen, R.M.; Downs, R.T.; Jones, A.P.; Kah, L. Carbon Mineralogy and Crystal Chemistry. In Carbon in Earth: Reviews in Mineralogy and Geochemistry; Mineralogical Society of America: Chantilly, VA, USA, 2013; Volume 75, pp. 7–46. [Google Scholar]
  11. Elzinga, E.J.; Rouff, A.A.; Reeder, R.J. The long-term fate of Cu2+, Zn2+, and Pb2+ adsorption complexes at the calcite surface: An X-ray absorption spectroscopy study. Geochim. Cosmochim. Acta 2006, 70, 2715–2725. [Google Scholar] [CrossRef]
  12. Tang, Y.; Elzinga, E.J.; Jae Lee, Y.; Reeder, R.J. Coprecipitation of chromate with calcite: Batch experiments and X-ray absorption spectroscopy. Geochim. Cosmochim. Acta 2007, 71, 1480–1493. [Google Scholar] [CrossRef]
  13. Lakshtanov, L.Z.; Stipp, S.L.S. Experimental study of nickel (II) interaction with calcite: Adsorption and coprecipitation. Geochim. Cosmochim. Acta 2007, 71, 3686–3697. [Google Scholar] [CrossRef]
  14. Curti, E. Coprecipitation of radionuclides with calcite: Estimation of partition coefficients based on a review of laboratory investigations and geochemical data. Appl. Geochem. 1999, 14, 433–445. [Google Scholar] [CrossRef]
  15. Prieto, M. Thermodynamics of Solid Solution-Aqueous Solution Systems. Rev. Mineral. Geochem. 2009, 70, 47–85. [Google Scholar] [CrossRef]
  16. Böttcher, M. Experimental dissolution of CaCO3-MnCO3 solid solutions in CO2-H2O solutions at 20°C: I. Synthetic low-temperature carbonates. Solid State Ionics 1997, 101–103, 1263–1266. [Google Scholar] [CrossRef]
  17. Harstad, A.O.; Stipp, S.L.S. Calcite dissolution: Effects of trace cations naturally present in Iceland spar calcites. Geochim. Cosmochim. Acta 2007, 71, 56–70. [Google Scholar] [CrossRef]
  18. Katsikopoulos, D.; Fernández-González, Á.; Prieto, M. Precipitation and mixing properties of the “disordered” (Mn,Ca)CO3 solid solution. Geochim. Cosmochim. Acta 2009, 73, 6147–6161. [Google Scholar] [CrossRef]
  19. Salem, M.R.; Mangood, A.H.; Hamdona, S.K. Dissolution of calcite crystals in the presence of some metal ions. J. Mater. Sci. 1994, 29, 6463–6467. [Google Scholar] [CrossRef]
  20. Gutjahr, A.; Dabringhaus, H.; Lacmann, R. Studies of the growth and dissolution kinetics of the CaCO3 polymorphs calcite and aragonite II. The influence of divalent cation additives on the growth and dissolution rates. J. Cryst. Growth 1996, 158, 310–315. [Google Scholar] [CrossRef]
  21. Arvidson, R.S.; Ertan, I.E.; Amonette, J.E.; Luttge, A. Variation in calcite dissolution rates: A fundamental problem? Geochim. Cosmochim. Acta 2003, 67, 1623–1634. [Google Scholar] [CrossRef]
  22. Fernández-Díaz, L.; Astilleros, J.M.; Pina, C.M. The morphology of calcite crystals grown in a porous medium doped with divalent cations. Chem. Geol. 2006, 225, 314–321. [Google Scholar] [CrossRef] [Green Version]
  23. Astilleros, J.M.; Pina, C.M.; Fernndez-Daz, L.; Putnis, A. Molecular-scale surface processes during the growth of calcite in the presence of manganese. Geochim. Cosmochim. Acta 2002, 66, 3177–3189. [Google Scholar] [CrossRef] [Green Version]
  24. Davis, K.J.; Dove, P.M.; Wasylenki, L.E.; De Yoreo, J.J. Morphological consequences of differential Mg2+ incorporation at structurally distinct steps on calcite. Am. Mineral. 2004, 89, 714–720. [Google Scholar] [CrossRef]
  25. Putnis, C.V.; Ruiz-Agudo, E.; Hövelmann, J. Coupled fluctuations in element release during dolomite dissolution. Mineral. Mag. 2014, 78, 1355–1362. [Google Scholar] [CrossRef]
  26. Walton, A.G. The formation and properties of precipitates. In Chemical Analysis; Interscience Publishers: New York, NY, USA, 1967; Volume 23, pp. 1–232. [Google Scholar]
  27. Parkhurst, D.L.; Appelo, C.A.J. User’s Guide to PHREEQC (Version 2)—A Computer Program for Speciation, Batch-Reaction, One-Dimensional Transport, and Inverse Geochemical Calculations; USGS, Water Resource Investigations Report 99-4259; U.S. Geological Survey, Earth Science Information Center, Open-File Reports Section: Reston, VA, USA, 1999. [Google Scholar]
  28. McBride, M.B.; Bouldin, D.R. Long-term reactions of copper (II) in a contaminated calcareous soil. Soil Sci. Soc. Am. J. 1984, 48, 56–59. [Google Scholar] [CrossRef]
Figure 1. X-ray diffraction (XRD) patterns of the synthesized solid solutions.
Minerals 08 00484 g001
Figure 2. Evolution of aqueous metals and pH during the dissolution of the solid solutions and the corresponding dissolution rates. (a,b) Evolution of Ca concentration during the dissolution of the solid solutions; (c) Evolution of Mn concentration during the dissolution of Mn-02, Mn-04 and Mn-10; (d) Evolution of Cu concentration during the dissolution of Cu-02, Cu-04 and Cu-10; (e,f) Evolution of aqueous pH during the dissolution of the solid solutions; (g,h) Evolution of the dissolution rates during the dissolution of the solid solutions.
Minerals 08 00484 g002
Figure 3. Scanning electron microscope (SEM) images of the synthetic calcite solid solutions. (a) CAL; (b) CAL after dissolution for 2880 h; (c) Mn-02; (d) Mn-04; (e) Mn-10; and (f) Mn-02 after dissolution for 1920 h; (g) Mn-04 after dissolution for 672 h; (h) Mn-10 after dissolution for 1920 h; (i) Cu-02; (j) Cu-04; (k) Cu-10; and (l) Cu-02 after dissolution for 960 h; (m) Cu-04 after dissolution for 672 h; (n) Cu-10 after dissolution for 960 h.
Minerals 08 00484 g003
Figure 4. Energy dispersive spectrometer (EDS) mapping images of new precipitates from Mn-10 and Cu-10 after dissolution for 2880 h.
Minerals 08 00484 g004
Figure 5. High-resolution transmission electron microscopy (HRTEM) and fast Fourier transform (FFT) images (inset) of new precipitates from (a) Mn-10 and (b) Cu-10 after dissolution for 2880 h.
Minerals 08 00484 g005
Table 1. Composition, Brunauer–Emmett–Teller (BET) specific surface area of the solid solutions, and first time of new precipitation discovery.
SampleM2+/Ca2+ Ratio (in Mole)BET Specific Surface Area (m2/g)First Time of New Precipitation Discovery (h)
AddedMeasured
CAL//0.173/
Mn-020.020.020.2211920
Mn-040.040.040.583288
Mn-100.100.123.26996
Cu-020.020.020.389672
Cu-040.040.040.577/
Cu-100.100.121.95348

