Article

Quartz-Amethyst Hosted Hydrocarbon-Bearing Fluid Inclusions from the Green Ridge Breccia in the Snoqualmie Granite, North Cascades, WA, USA

1
Earth and Ocean Sciences, School of Natural Sciences, National University of Ireland, Galway H91 TK33, Ireland
2
Cascade Scepters, P.O. Box 1001, Maple Valley, WA 98038, USA
3
School of Geosciences, University of Aberdeen, Aberdeen AB24 3UE, UK
4
Centre for Microscopy & Imaging, National University of Ireland, Galway H91 TK33, Ireland
*
Author to whom correspondence should be addressed.
Minerals 2017, 7(9), 174; https://doi.org/10.3390/min7090174
Submission received: 14 July 2017 / Revised: 24 July 2017 / Accepted: 4 September 2017 / Published: 19 September 2017
(This article belongs to the Special Issue Fluid Inclusions: Study Methods, Applications and Case Histories)

Abstract

:
The Green Ridge Breccia cuts the composite Miocene Snoqualmie Batholith in King County, WA, USA. The granite was emplaced at ~5 km depth between ~17 and 20 Ma and the crosscutting NW trending breccia contains large angular blocks of the host granite (<1 m in longest dimension). The brecciated granite blocks are cemented by quartz-amethyst euhedra (<10 cm in longest dimension) bearing vugs. A notable feature is the presence of centimetric scale amber coloured oil inclusions within the quartz-amethyst crystals. Fluid inclusion studies using Transmitted Light Petrography, UV Microscopy, Microthermometry, Laser Raman Microspectroscopy and Gas Chromatography-Mass Spectrometry record the presence and the fluid composition of three fluid inclusion types hosted by the euhedra: primary Type 1 (liquid rich two-phase (L + V) aqueous inclusions) and secondary Type 2 bituminous two-phase (S + L) inclusions and Type 3 amber coloured oil bearing two-phase immiscible liquid inclusions. The Green Ridge Breccia was the locus for convective hydrothermal fluid flow that formed the quartz-amethyst vugs formed at T~390 °C assuming a trapping pressure of ~1.65 kb. Later, hydrocarbon fluids migrated downwards from the roof source rock (e.g., the Guye Sedimentary Member) and were trapped in the euhedra. This was followed by unroofing of the batholith and exposure of the Green Ridge Breccia. This study highlights the potential for other oil migrations into the Snoqualmie Batholith in areas where it forms the basement capped by the Guye Sedimentary Member.

1. Introduction

Studies of hydrocarbons, including hydrocarbon bearing fluid inclusions, trapped in igneous and metamorphic rocks conclude that they can be either abiogenic or biogenic in origin. Reference [1] reported on several occurrences of hydrocarbons considered to be abiogenic in origin, for example, (a) hydrocarbon bearing inclusions in the Ilimaussaq igneous complex of southern Greenland [2]; (b) gas seeps in the Zambales Ophiolite, Philippines [3]; (c) hydrocarbon inclusions in pegmatite quartz in granite at Strange Lake, Canada [4]; (d) methane-bearing fluid inclusions in igneous rocks of the Kola igneous province [5] and (e) hydrocarbon bearing fractures in crystalline rocks of the Canadian shield [6].
In contrast, the widespread occurrences of biogenic hydrocarbons in fractured granitic and other crystalline basement rocks are well documented in the literature [1,7,8,9]. Globally, productive oilfields hosted by fractured crystalline basement rocks (including granites) occur, for example, in Europe, North and South America, China, Eastern Siberia and Africa [7,9]. The petroleum system components of basement reservoirs comprising granites or metamorphic rocks are, according to [9], no different to those of conventional clastic reservoirs. The basement trap is typically a four-way dip closed structure, e.g., a fault block or the trap can be formed as the flank of a tilted fault block. Source rocks occur proximal to the trap as onlapping or capping successions. The reservoir’s poro-perm system comprises a network of faults and fractures. Basement reservoirs have geological histories that reflect fracture formation that resulted from tectonic, hydrothermal and epithermal processes. The Lancaster Lewisian basement reservoir, west of Shetlands, provides an excellent example of oil bearing fracture networks and their spatial relationship major fault zones [9].
Granite plutons are thermal foci and are often highly fractured and therefore are hosts to the migration of water and biogenic hydrocarbon fluids from outside of the plutons [7]. For example, hydrocarbons occur in several British granites and according to [7], they can be attributed to biogenic sedimentary source rocks and are related to hydrothermal mineralised veins. Thomson et al. [10] also attributed the source of hydrocarbon fluids, associated with granite related epithermal polymetallic mineral veins, to be from overlying biogenic sediments. Here, we report the discovery and composition of aqueous and hydrocarbon bearing fluid inclusions in quartz-amethyst from the Green Ridge Breccia in the Snoqualmie Granite, Washington State, USA (Figure 1).
Amethyst is the purple variety of quartz. The role of trace amounts of iron and radiation in the formation of its colour are generally established [11,12]. It is found in a variety of geological settings, e.g., epithermal veins, miarolitic cavities in granites and geodes in basaltic lavas. Gem quality amethyst, e.g., from Brazil and Uruguay come from geodes in basaltic rocks of the Parana Continental Flood Basalt Province [12]. Published crystallisation temperatures of amethyst cover a wide range, e.g., (1) 370 to 420 °C from fluid inclusion studies of Brazilian geodes [13]; (2) <50 °C fluid inclusion data from Brazilian amethyst [14]; (3) stable oxygen isotope data from amethyst and agate hosted in the Prana–Etendka volcanics [14] and in Devonian and Tertiary volcanics of Scotland [15,16] indicate temperatures <150 °C; (4) Granite hosted amethyst veins from Thunder Bay, Canada, are considered to have formed between 40 and 90 °C [17]; (5) amethysts from epithermal polymetallic veins have formation temperatures ranging between 150 and 250 °C based on fluid inclusion studies [18,19,20] and (6) higher fluid-inclusion homogenization temperatures (280–400 °C) were reported from amethyst in granite miaroles of the Eonyang deposit, South Korea [21]. Finally, such high temperatures are also used in laboratory-based hydrothermal amethyst synthesis [18].
We use a combination of fluid inclusion petrography, UV Microscopy, Microthermometry, Laser Raman Microspectroscopy and Gas Chromatography-Mass Spectrometry to investigate the source of the hydrocarbons trapped after crystallisation of the quartz–amethyst euhedra in contrast to the aqueous fluids trapped during crystallisation. The latter are used to constrain the temperature of crystallisation of the amethyst.

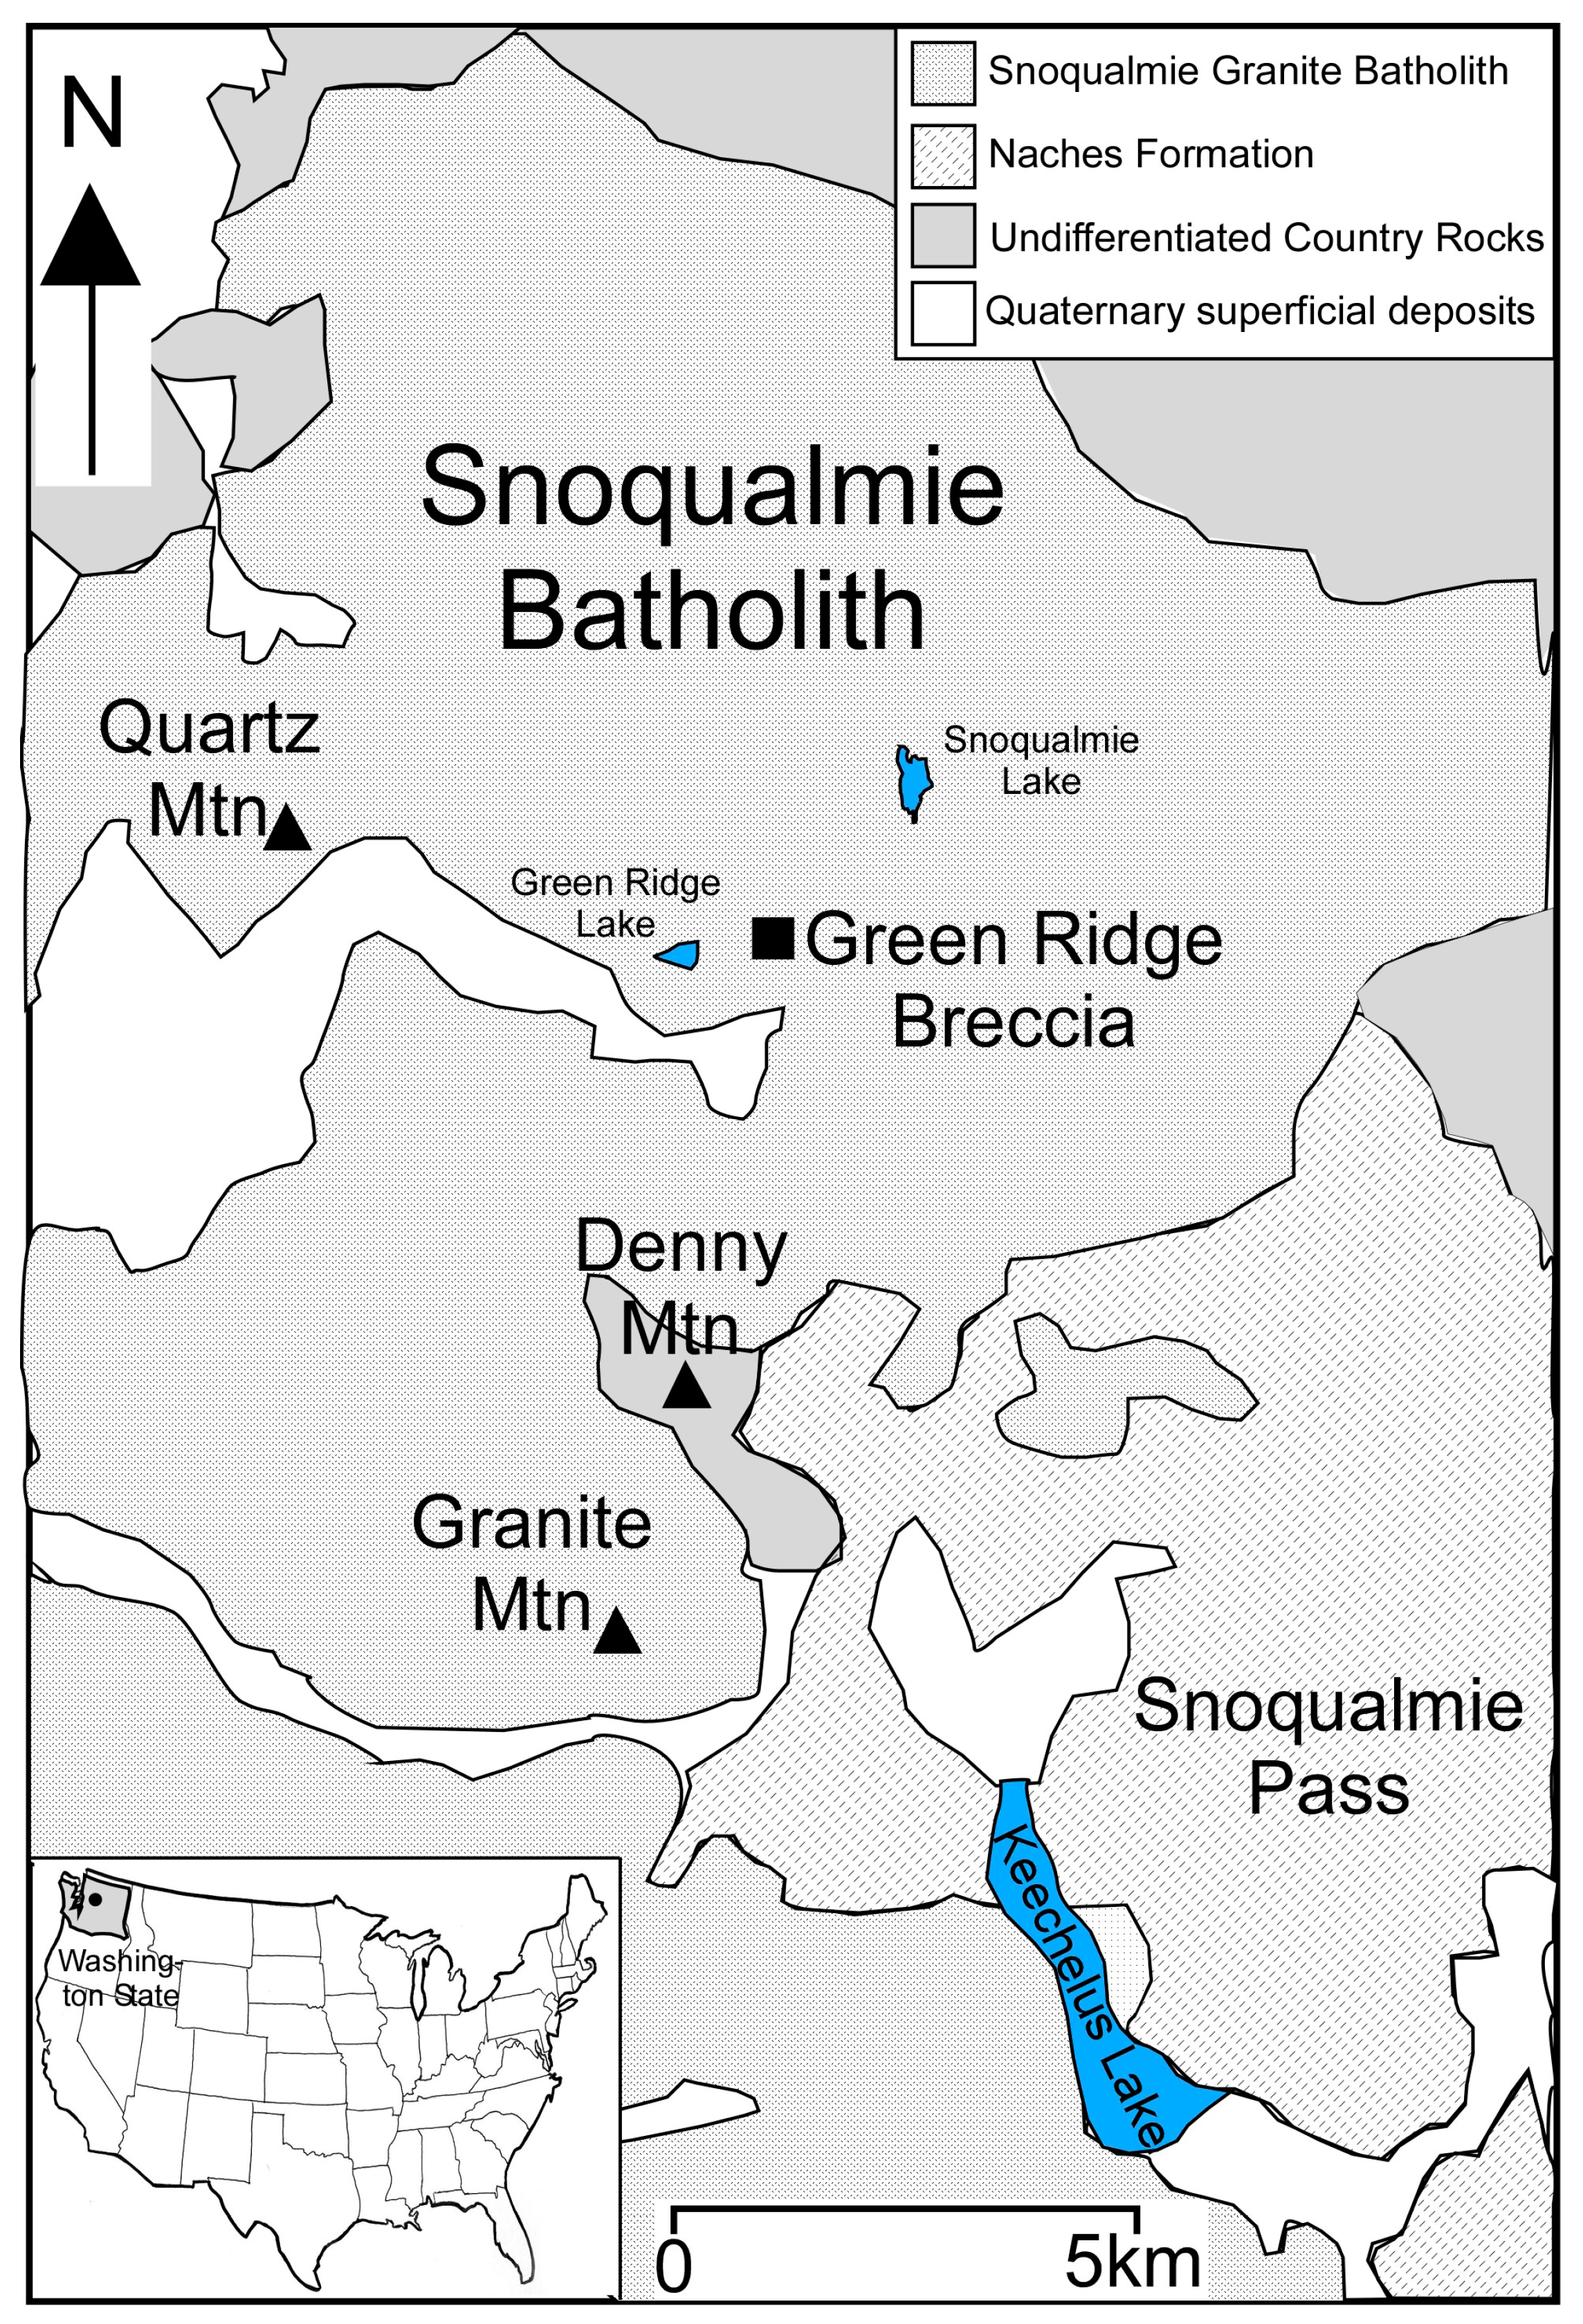
2. Geological Background

The Green Ridge breccia occurs in the Snoqualmie Batholith, the largest of all the granite plutons emplaced in the North Cascades occupying an area of ~700 km2. It occurs along Snoqualmie Pass [23] and forms a number of topographic highs including Granite Mountain [24]—Figure 1. The predominant lithology is a medium grained granodiorite, however, rock compositions range from gabbro to alaskite [25]. These were emplaced at ~17–24 Ma [26] into the Denny, Guye, Mt. Catherine Tuff, Naches and Denny Mountain formations [23]. Later, however, Grant [27] ranked the Guye Formation as the Guye Sedimentary Member of the Naches Formation. Interbedded leaf-bearing carbonaceous argillites characterise this member. The leaf fossils indicate an Eocene age for the unit and according to [26] the redefined Naches Formation is considered to be middle Eocene to early Oligocene in age. The contact between the batholith and the country rock is sharp. The country rocks display extensive folding and faulting that are pre-, syn- and post-granite emplacement [24,25]. The batholith produced an aureole <800 m wide with pyroxene-hornfels rocks developed at the contact; Erikson [25] concluded that the batholith was emplaced at a maximum depth of ~5 km. Sulphide mineralization occurs throughout the Snoqualmie batholith and zones of shearing, brecciation, and veining are characterized by copper porphyry-type deposits and have been described by [28,29,30,31,32]. Subsequently, during the mid to late Miocene (~10–8 Ma), episodes of faulting, uplift and erosion occurred. Several kilometers of roof rocks were eroded exposing the Snoqualmie batholith and its country rocks [24,33].
The Green Ridge Breccia is but one of a suite of breccias that occur in the Green Ridge Lake area (Figure 1; [32]). These breccias formed during the end stages of batholith emplacement and are associated with granite related sulphide mineralization noted above. McBirney [32] records the spatial relationship, in the Green Ridge area, between brecciation and a NW trending shear zone cutting the granite. These authors note that the quartz lined vugs in the breccias maybe indicative of hydrothermal activity. The Green Ridge Breccia is composed of angular blocks of granodiorite that range up to one metre in longest dimension. MacDonald et al. [34] describe the field setting of the Green Ridge Breccia noting that the breccia blocks have not been rotated (unlike other breccias in the region of Green Ridge Lake) and concluded that it is similar to a collapse breccia or shatter pipe. Vugs containing exceptional quartz-amethyst crystals cement the granite blocks [35]. The quartz–amethyst euhedra host a range of fluid inclusion types including newly discovered centimetric scale amber coloured oil inclusions (Figure 2).

3. Analytical Techniques

Five samples of quartz-amethyst euhedra were supplied by Cascade Scepters, Maple Valley, WA. The following describes the analytical techniques used to study the range of fluid inclusions encountered in the euhedra.
(1) Fluid inclusion petrography of five doubly polished wafers (~150 μm thick) of the quartz amethyst crystals was performed using a Nikon Eclipse E200 transmitted light microscope. This revealed the presence of three principal types, i.e., Type 1 (aqueous) and two (Type 2 and 3) hydrocarbon bearing fluid inclusions (Figure 2 and Figure 3).
(2) Ultra Violet (UV) Light Microscopy using a Nikon Eclipse E200 microscope with an epi-fluorescence attachment was used to record the fluorescence emission colours displayed by the hydrocarbon bearing fluid inclusions. The UV excitation was approximately 365 nm and was provided by a high-pressure mercury lamp. A 420 nm emission filter was also used.
(3) Microthermometric analysis was carried out using a Linkam THMSG 600 heating and freezing stage, mounted on an Olympus BX51 transmitted light microscope. Calibration of the stage was performed following the method outlined by MacDonald et al. [34] using synthetic fluid inclusion standards (pure CO2 and H2O). Precision is ±0.5 °C at 300 °C and ±0.2 °C at −56.6 °C.
(4) Laser Raman Microspectroscopy (LRM) of selected aqueous fluid inclusions was performed using a Horiba LabRam II which is coupled to an Olympus BX51 transmitted light microscope. Gas and liquid phases were analysed at room temperature using a 532 nm (green) laser focused through either a 50× or 100× microscope objectives. The spatial resolution of the laser is approximately 2 μm.
(5) Confocal Laser Raman Microscopy (CLRM) using a Witec Alpha 500 confocal laser Raman microscope in upright configuration was used to analyse and image selected hydrocarbon bearing fluid inclusions. A Toptica 785 nm laser was used with a 100 micron fibre (providing the confocal pinhole) from objective to detection system, a 600 grooves/mm diffraction grating and an Andor Idus CCD camera (Andor Technology Ltd., Belfast, Ireland). The spatial resolution of the laser was approximately 1 μm. The system was calibrated to the standard silicon peak of 520 cm−1. Spectral resolution for all measurements was 1.5 cm−1. Spectra were first treated for cosmic ray removal and then classified into clusters of matching spectra using k-means clustering (Witec Project 4 software version 4.1) [36]. The individual cluster sets were further processed using background subtraction and Savitzky–Golay smoothing.
(6) Gas Chromatograhy-Mass Spectrometry (GC-MS) was used at the School of Geosciences, Aberdeen University, UK, where the amber coloured oil was separated from the Type 3 centimetric scale fluid inclusions and analysed (Figure 3). The sample was prepared by rinsing twice with distilled water, and again with dichloromethane (DCM). The quartz was crushed and extracted using a soxhlet apparatus for 48 h. Solid bitumen and tar samples were ultrasonicated with DCM and methanol (MeOH). All glassware was thoroughly cleaned with a 93:7 mixture of DCM/MeOH. The crushed sample was weighed, recorded and transferred into pre-extracted thimbles. The extracts were then dried using a rotary evaporator, separated into aliphatic, aromatic and polar fractions via a silica column chromatography using hexane, hexane/DCM in the ratio 3:1 and DCM/MeOH respectively. Prior to the GC-MS analysis, an internal standard (5β-Cholane, Agilent Technologies, Santa Clara, CA, USA) was added to the saturate fraction before injection into the mass spectrometer. This was done using an Agilent 6890 N gas chromatograph fitted with a J&W DB-5 phase 50 m MSD (Mass Selective Detector) and a quadruple mass spectrometer operating in SIM (Selected-Ion Monitoring) mode (dwell time 0.1 s per ion and ionisation energy 70 eV). Samples were injected manually using a split/splitless injector operating in splitless mode (purge 40 mL min−1 for 2 min). The temperature programme for the GC oven was 80–295 °C, holding at 80 °C for 2 min, rising to 10 °C min−1 for 8 min and then 3 °C min−1, and finally holding the maximum temperature for 10 min−1.
Quantitative biomarker data were obtained for isoprenoids, hopanes, steranes and diasteranes by measuring responses of these compounds on m/z 85, 191, 217, 218, and 259 mass chromatograms and comparing them to the response of the internal standard. Diasteranes are formed by a rearrangement of steranes during diagenesis and thermal maturation. Biodegradation causes the breakdown of steranes at a faster rate than diasteranes, including in the shallow subsurface in aerobic conditions, thus the ratio can be used as a measure of shallow biodegradation [37]. Evidence for biodegradation was also sought in 25-norhopanes, which form near the oil–water contact [38] and have been recorded to be abundant in organic matter from veins in basement rocks elsewhere [39]. Thermal maturity was estimated from the 20S/20S + 20R ratio for C29 steranes, based on the increasing proportion of the S isomer with maturation [40]. Thermal maturity was also determined from the relative proportions of hopane peaks Ts (C27 18α (H)-22, 30-trisnorneohopane) and Tm (C27 17α(H)-22,30-trisnorhopane) peaks, and the C30 βα/αβ (moretane/hopane) ratio.

4. Results

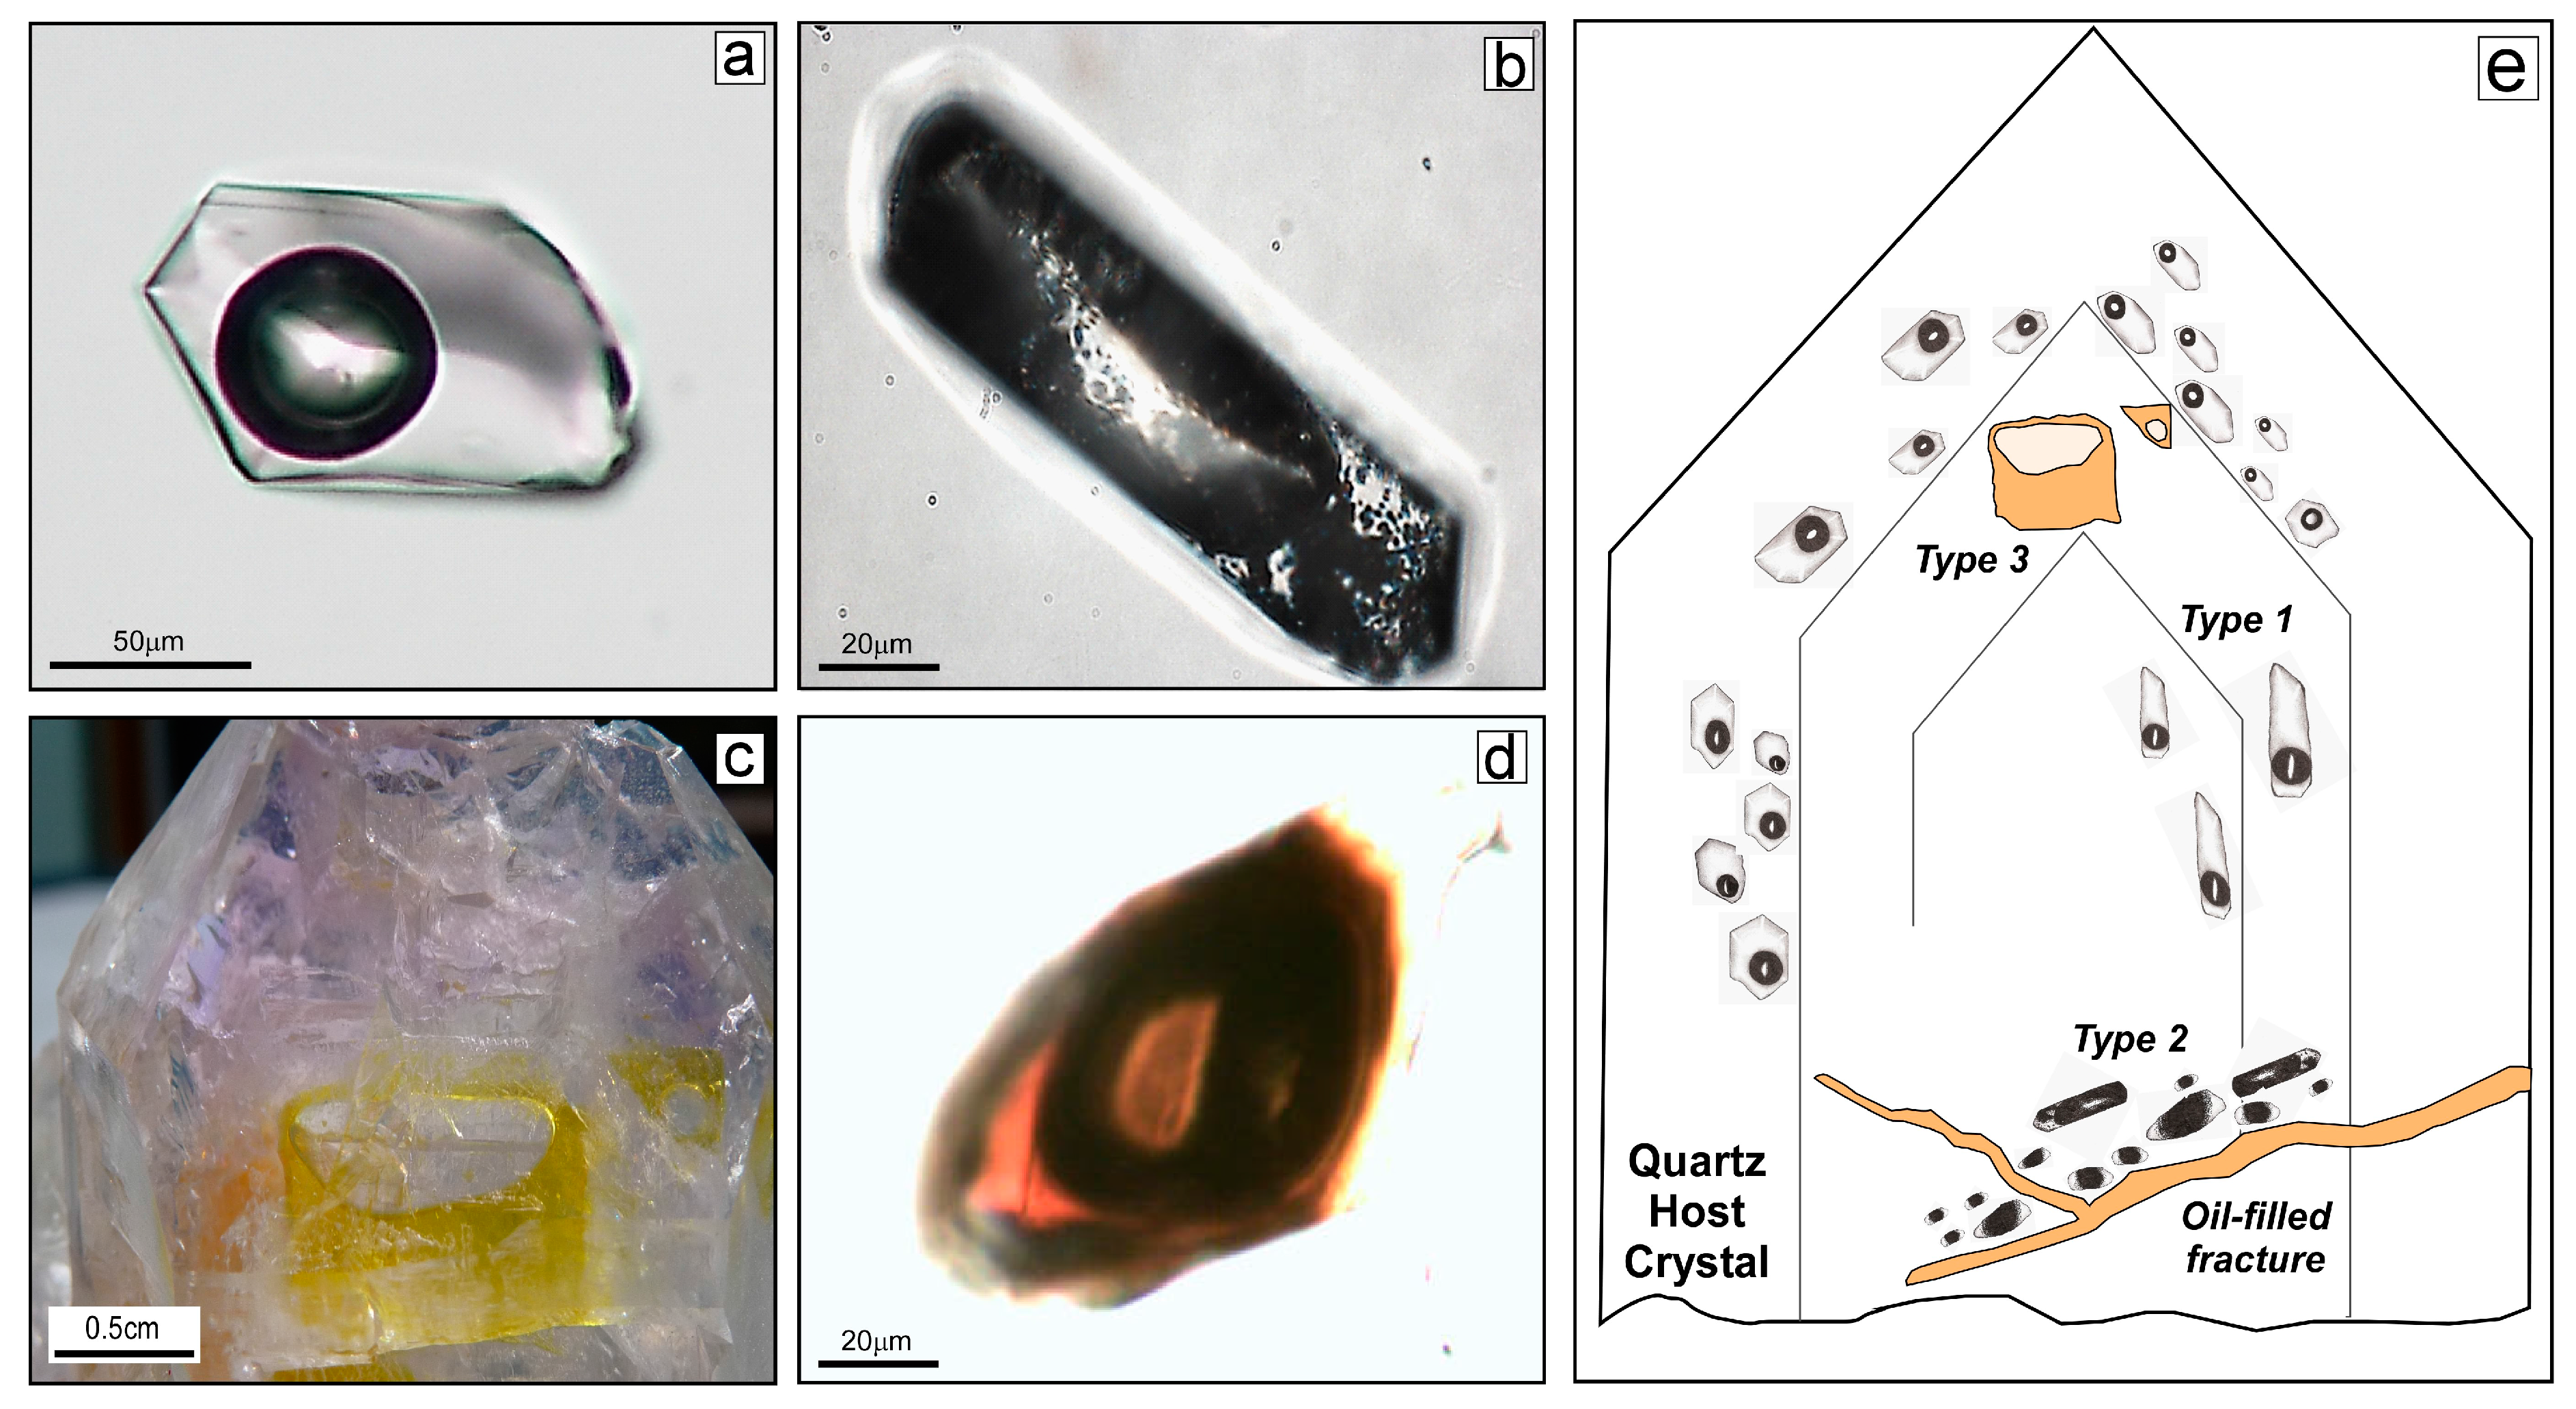
4.1. Fluid Inclusion Petrography

The fluid inclusion classification scheme presented here follows the petrographic criteria set out in [41]. Classification of the fluid inclusion types was determined using a combination of textural and petrographic criteria that include their distribution (e.g., aligned along crystal growth zones or in trails along crystal hosted annealed microfractures), phases (liquid (L) ± vapour (V) ± solid (S)) present at room temperature and if possible general fluid composition (e.g., aqueous and/or hydrocarbon compositions). Furthermore, the identification of hydrocarbon bearing fluid inclusions (HCFI) can be assisted by their colour in transmitted light (PPL) and in ultra violet (UV) light (i.e., fluorescence emission colour).
Three fluid inclusion types have been recorded:
Type 1 are liquid rich two-phase (L + V; L > V) aqueous inclusions displaying a high degree of fill (F =~0.80 to 0.90; degree of fill (F) = VL/VL + VV where VL + VV = VTOT). They commonly display negative crystal shapes and are aligned along crystal growth zones and range in size from 30 to 100 μm (Figure 3a,e). They are primary inclusions trapped during the crystallisation of the quartz-amethyst crystals.
Type 2 are two-phase (L + S) liquid and black solid bearing inclusions that range in size from ~30 to 50 μm (Figure 3b,e). They occur along annealed microfractures and are classified as pseudosecondary because their host fractures do not cut the crystals faces. The black solid material in some instances resembles aggregates of finer black needles or fibres surrounded or randomly attached to the liquid phase. These inclusions were subjected to heating-freezing cycles from +22 °C to −150 °C using the Linkam heating freezing stage however, no obvious phase changes were recorded.
Type 3 range in size from ~50 μm (Figure 3d and Figure 4c) to exceptional centimetric scale two-phase liquid inclusions containing amber coloured oil and a colourless liquid phase (Figure 3c). Noteworthy here is the presence of fractures (~ 50 μm), filled with amber coloured oil, that transect the crystals (Figure 3 and Figure 4). The “smaller” Type 3 inclusions are spatially related to these crosscutting fractures. However, these two-phase (L + L) inclusions display an overall darker amber colour and their central liquid phase is also darker contrasting with the colourless liquid phase of the centimetric scale Type 3 inclusions. Attempts to trigger phase changes in the smaller Type 3 inclusions failed despite lowering temperatures from +22 °C to −150 °C using the Linkam heating freezing stage. Both phases persisted without any obvious volume changes during this cycle.

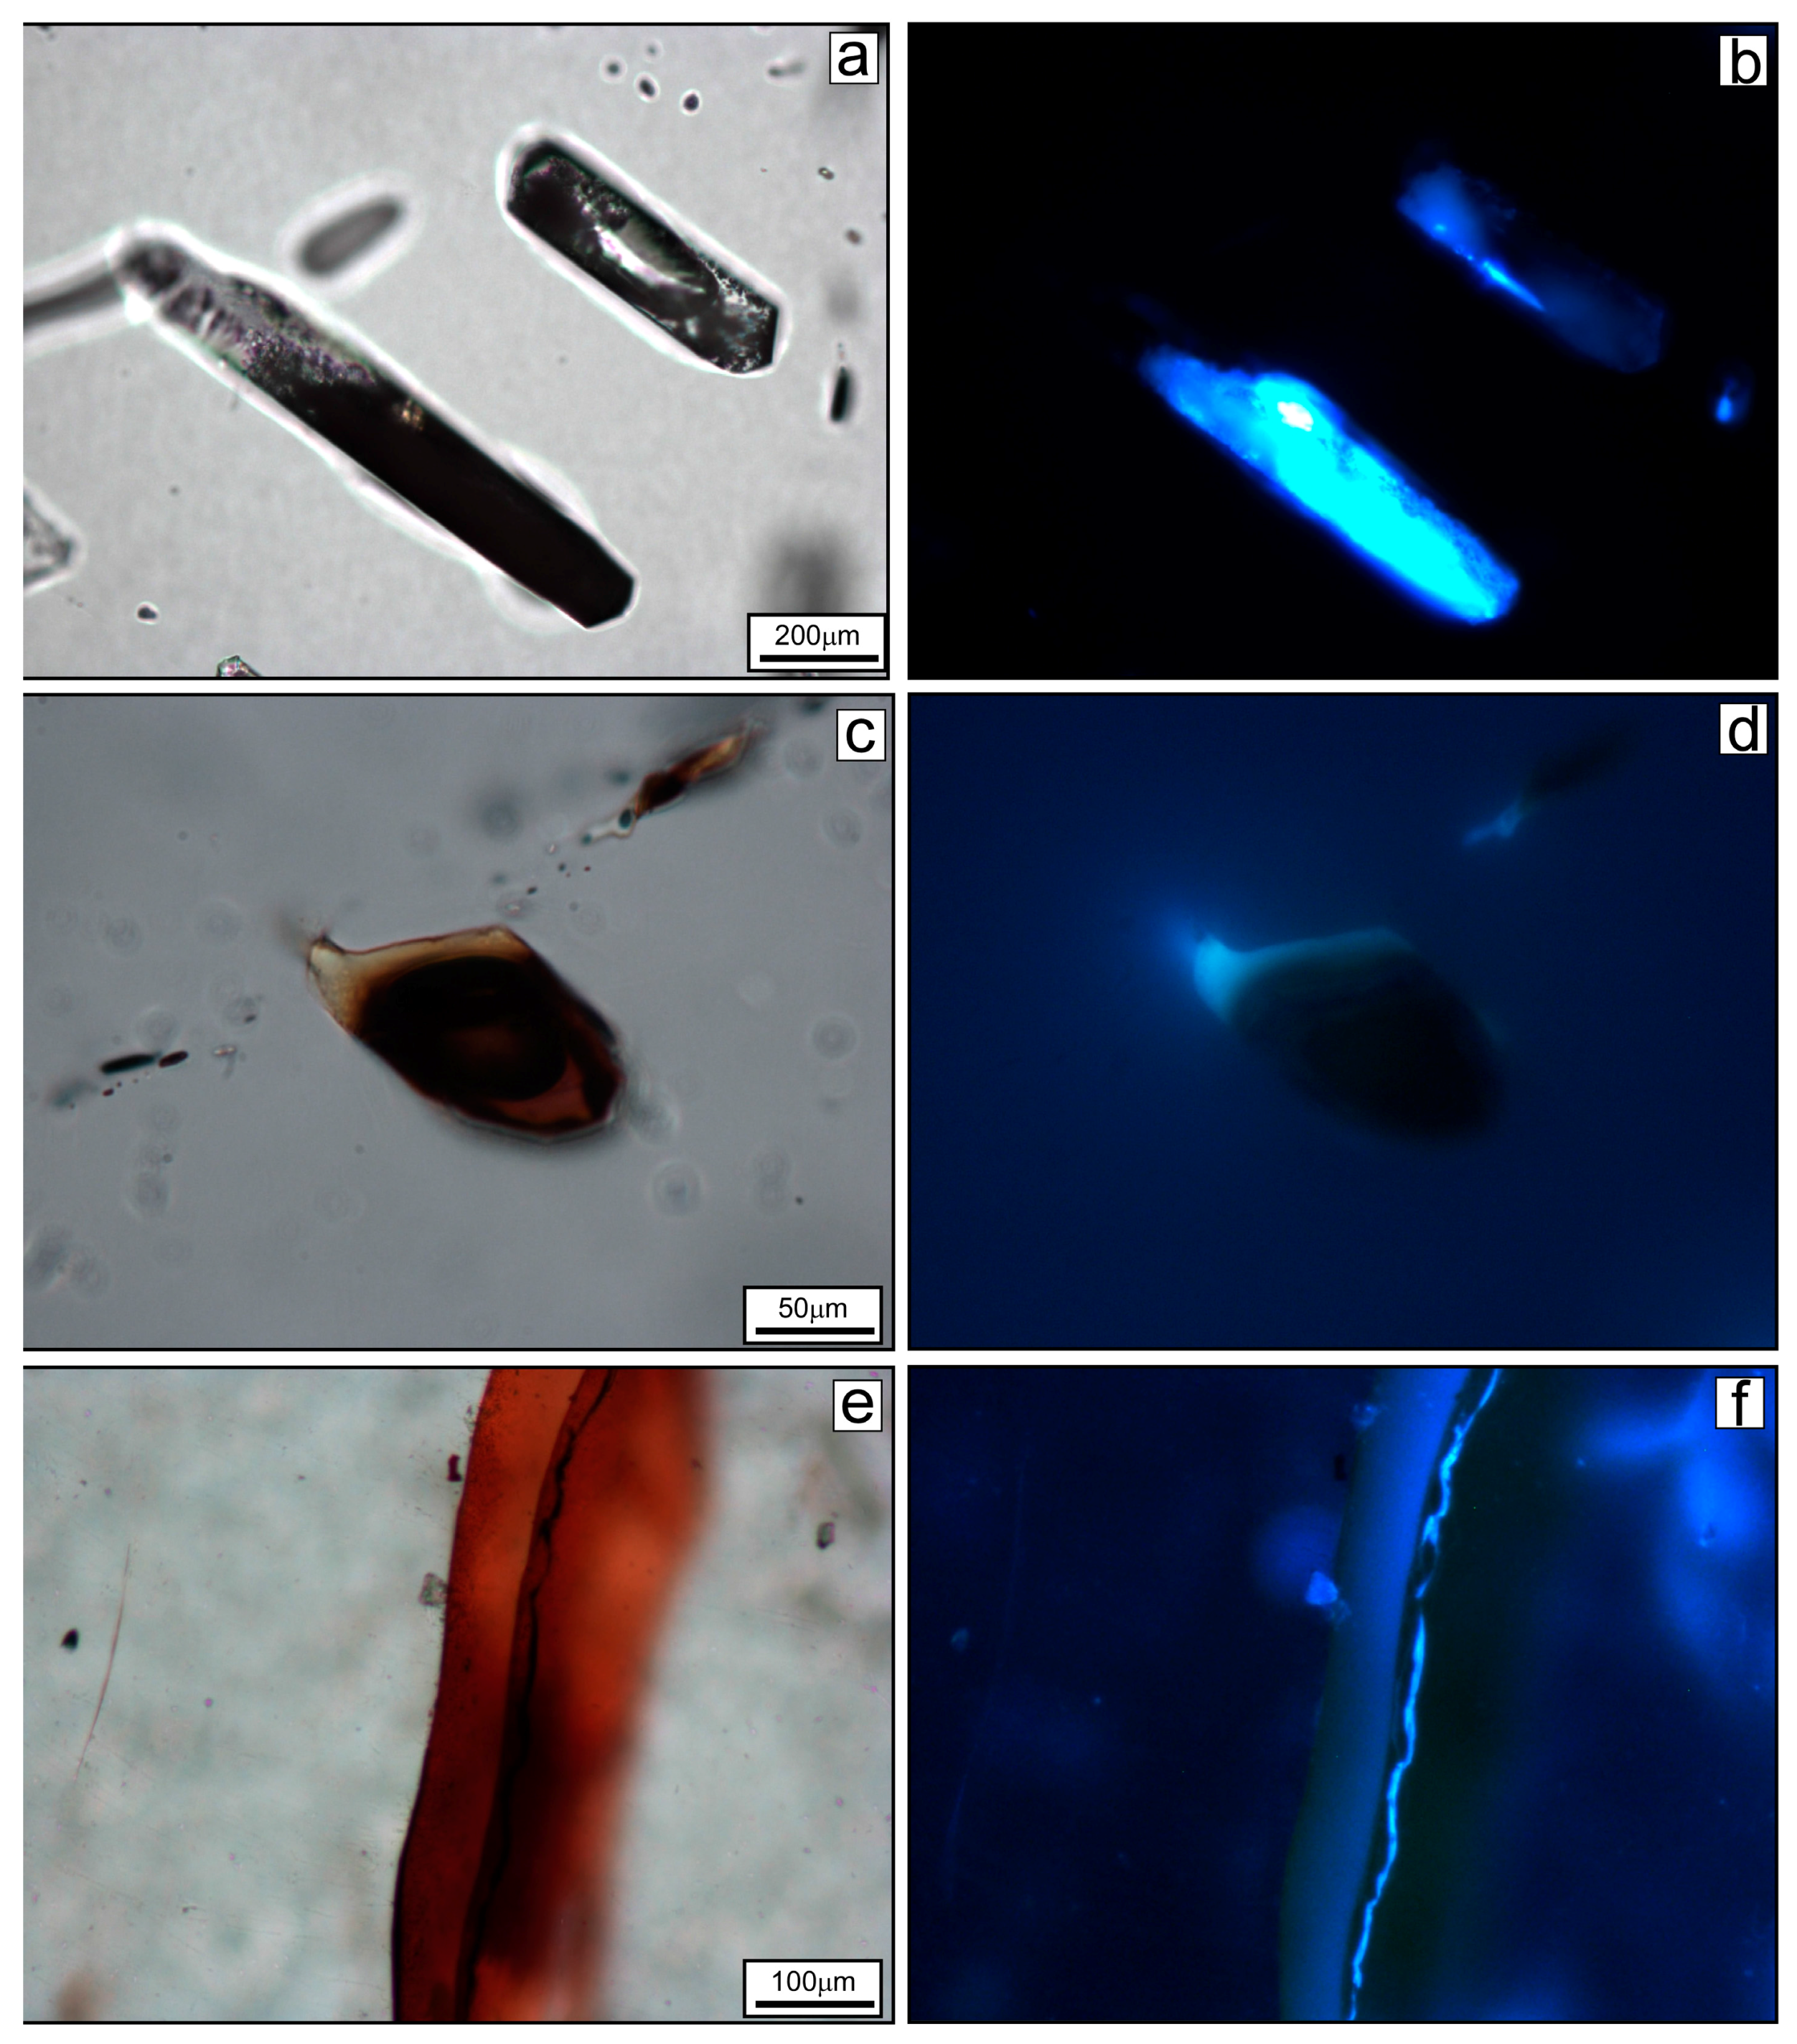
4.2. UV Light Microscopy

UV light microscopy of the fluid inclusions confirms the presence of hydrocarbons in Type 2 and Type 3. They show light to deeper shades of blue fluorescence emission colours. For example, Type 2 inclusions display two shades of blue fluorescence. The lighter shade of blue in Type 2 is associated with the area occupied by the solid material which in turn is surrounded by the deeper blue fluorescence of the liquid phase (Figure 4b). The Type 3 inclusion in Figure 4c displays a light blue fluorescence colour along its upper rim (Figure 4d). The oil filled fracture, which is oblique to the plane of the section (i.e., inclined to the right of the image), also displays variations in fluorescence colour. The body of the fracture displays a deep blue colour while the relatively thin marginal zone along its righthand side exhibits a brighter blue fluorescence (Figure 4e,f). In summary, the UV microscopy which highlights variations in the intensity of fluorescence colour, associated with the Type 2 and 3 inclusions and, the fracture, suggests a range of hydrocarbon compositions.

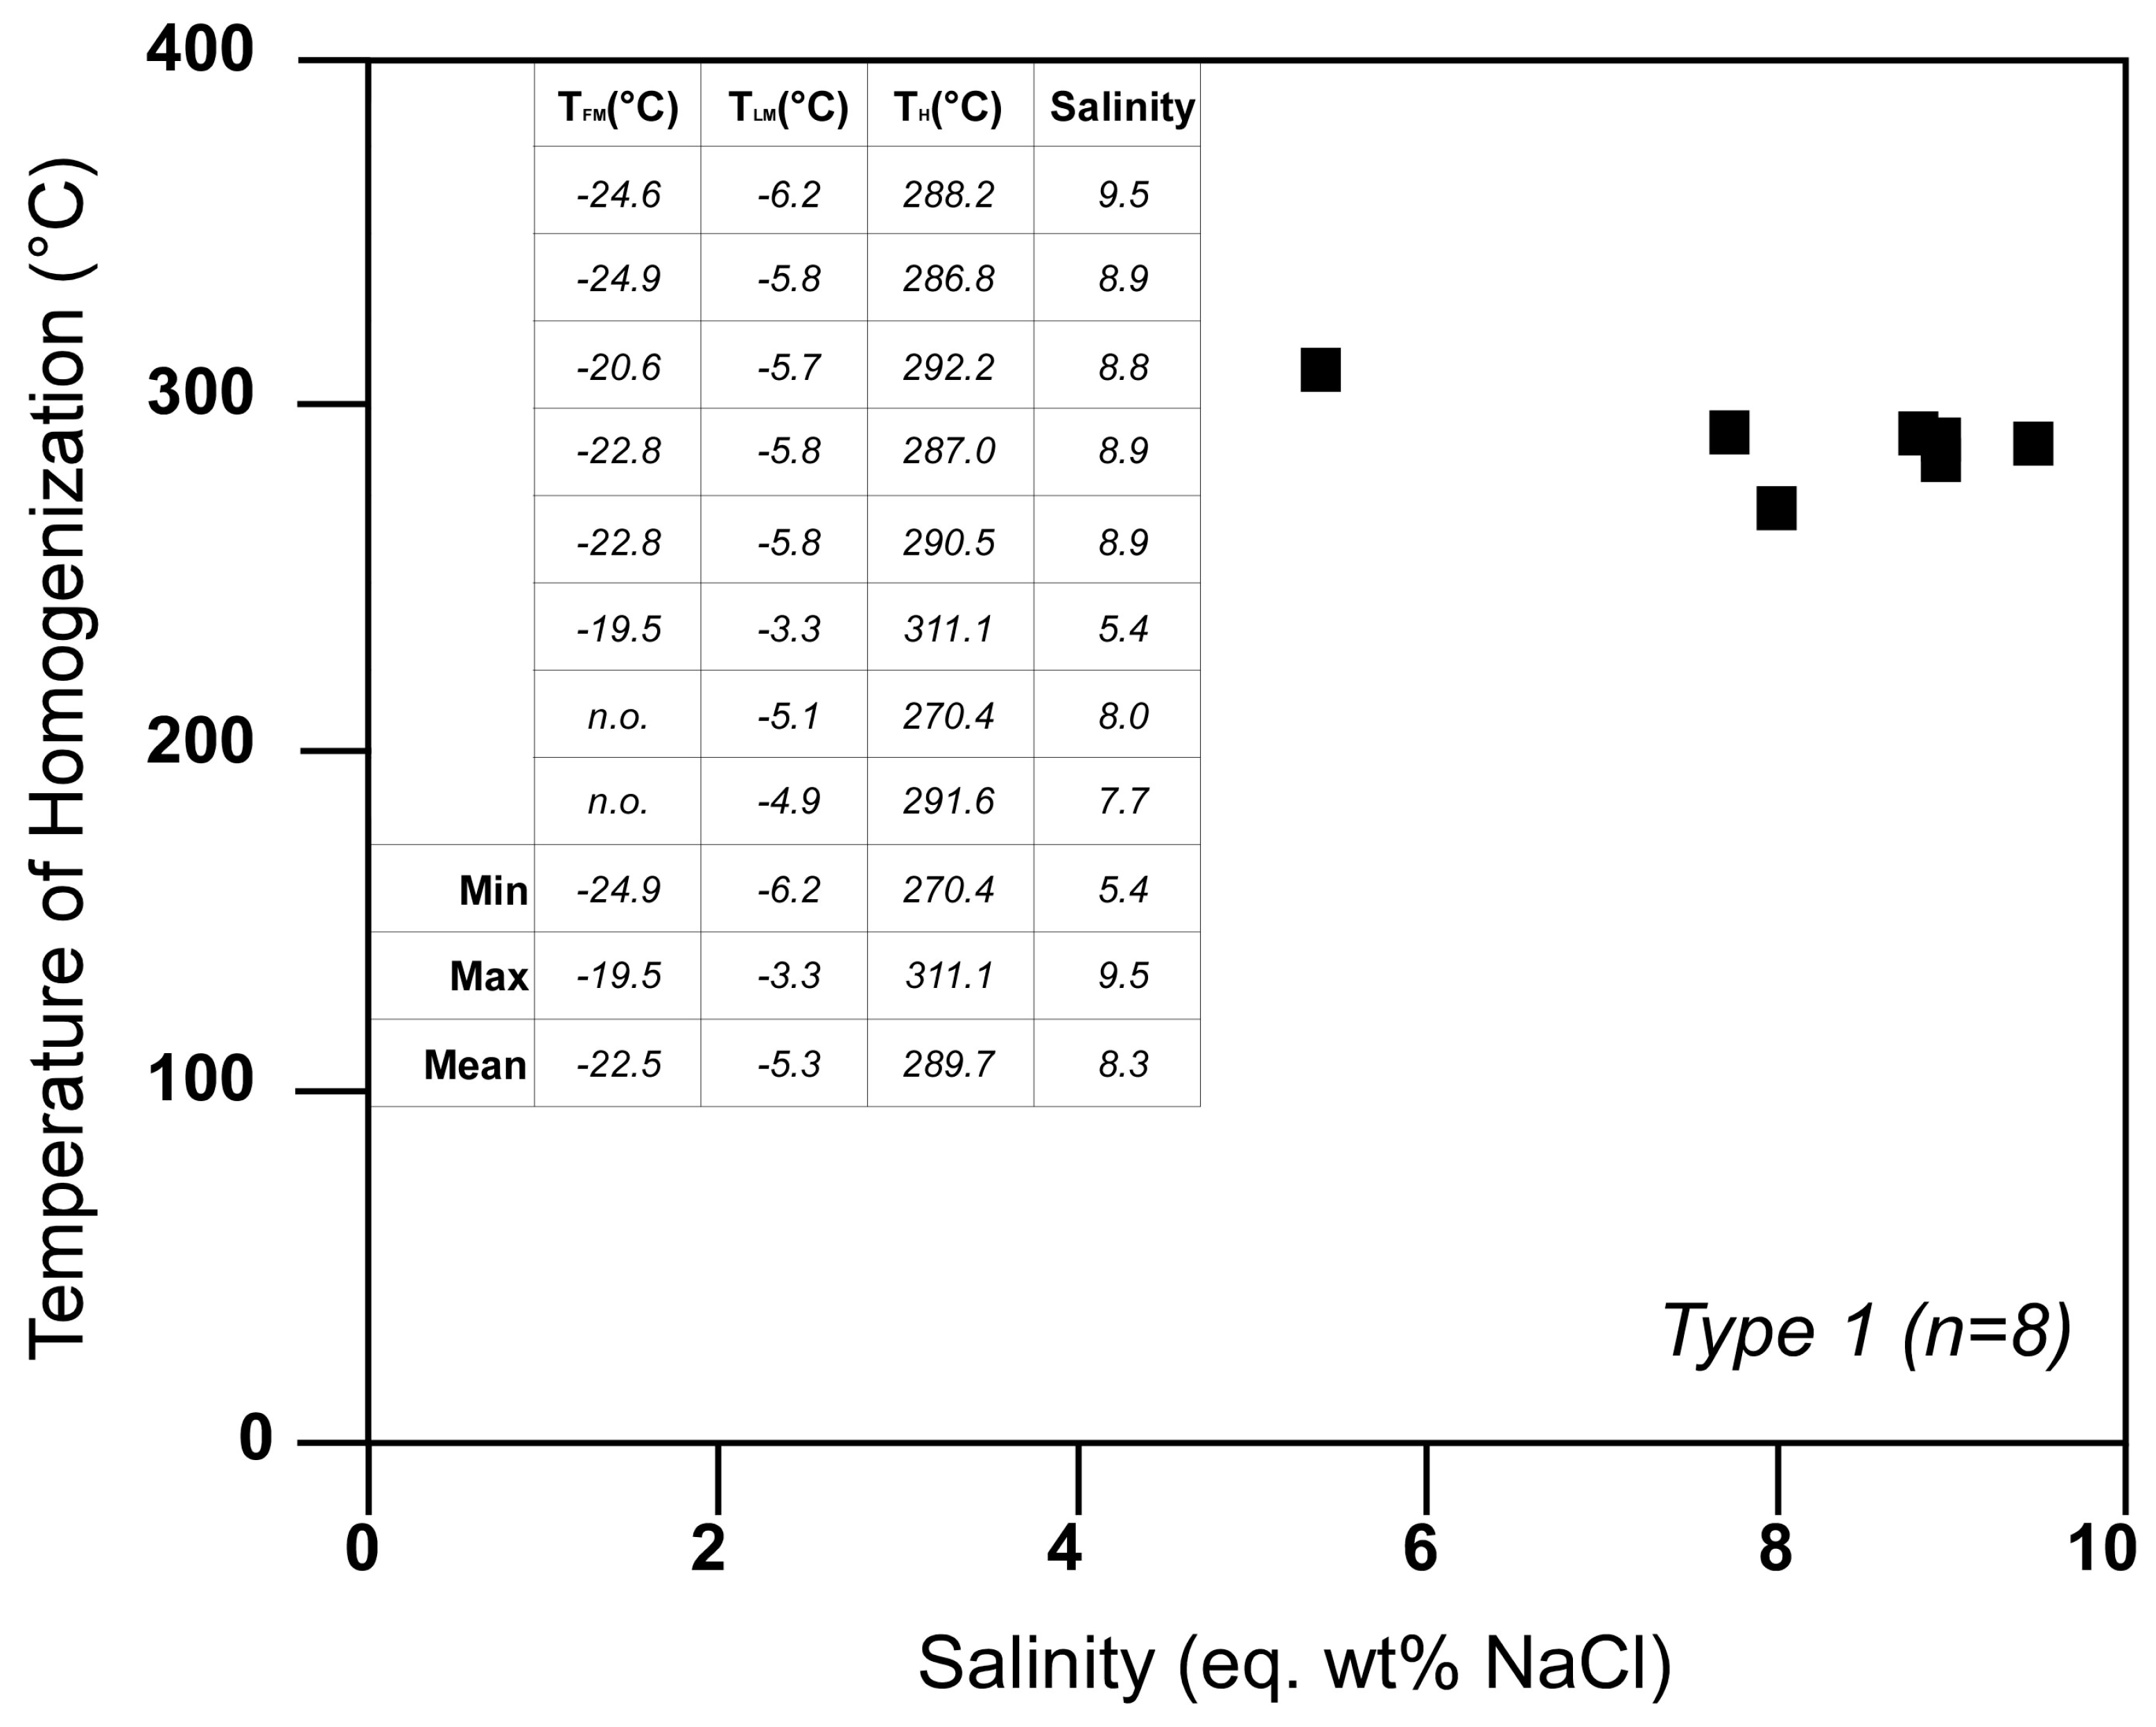
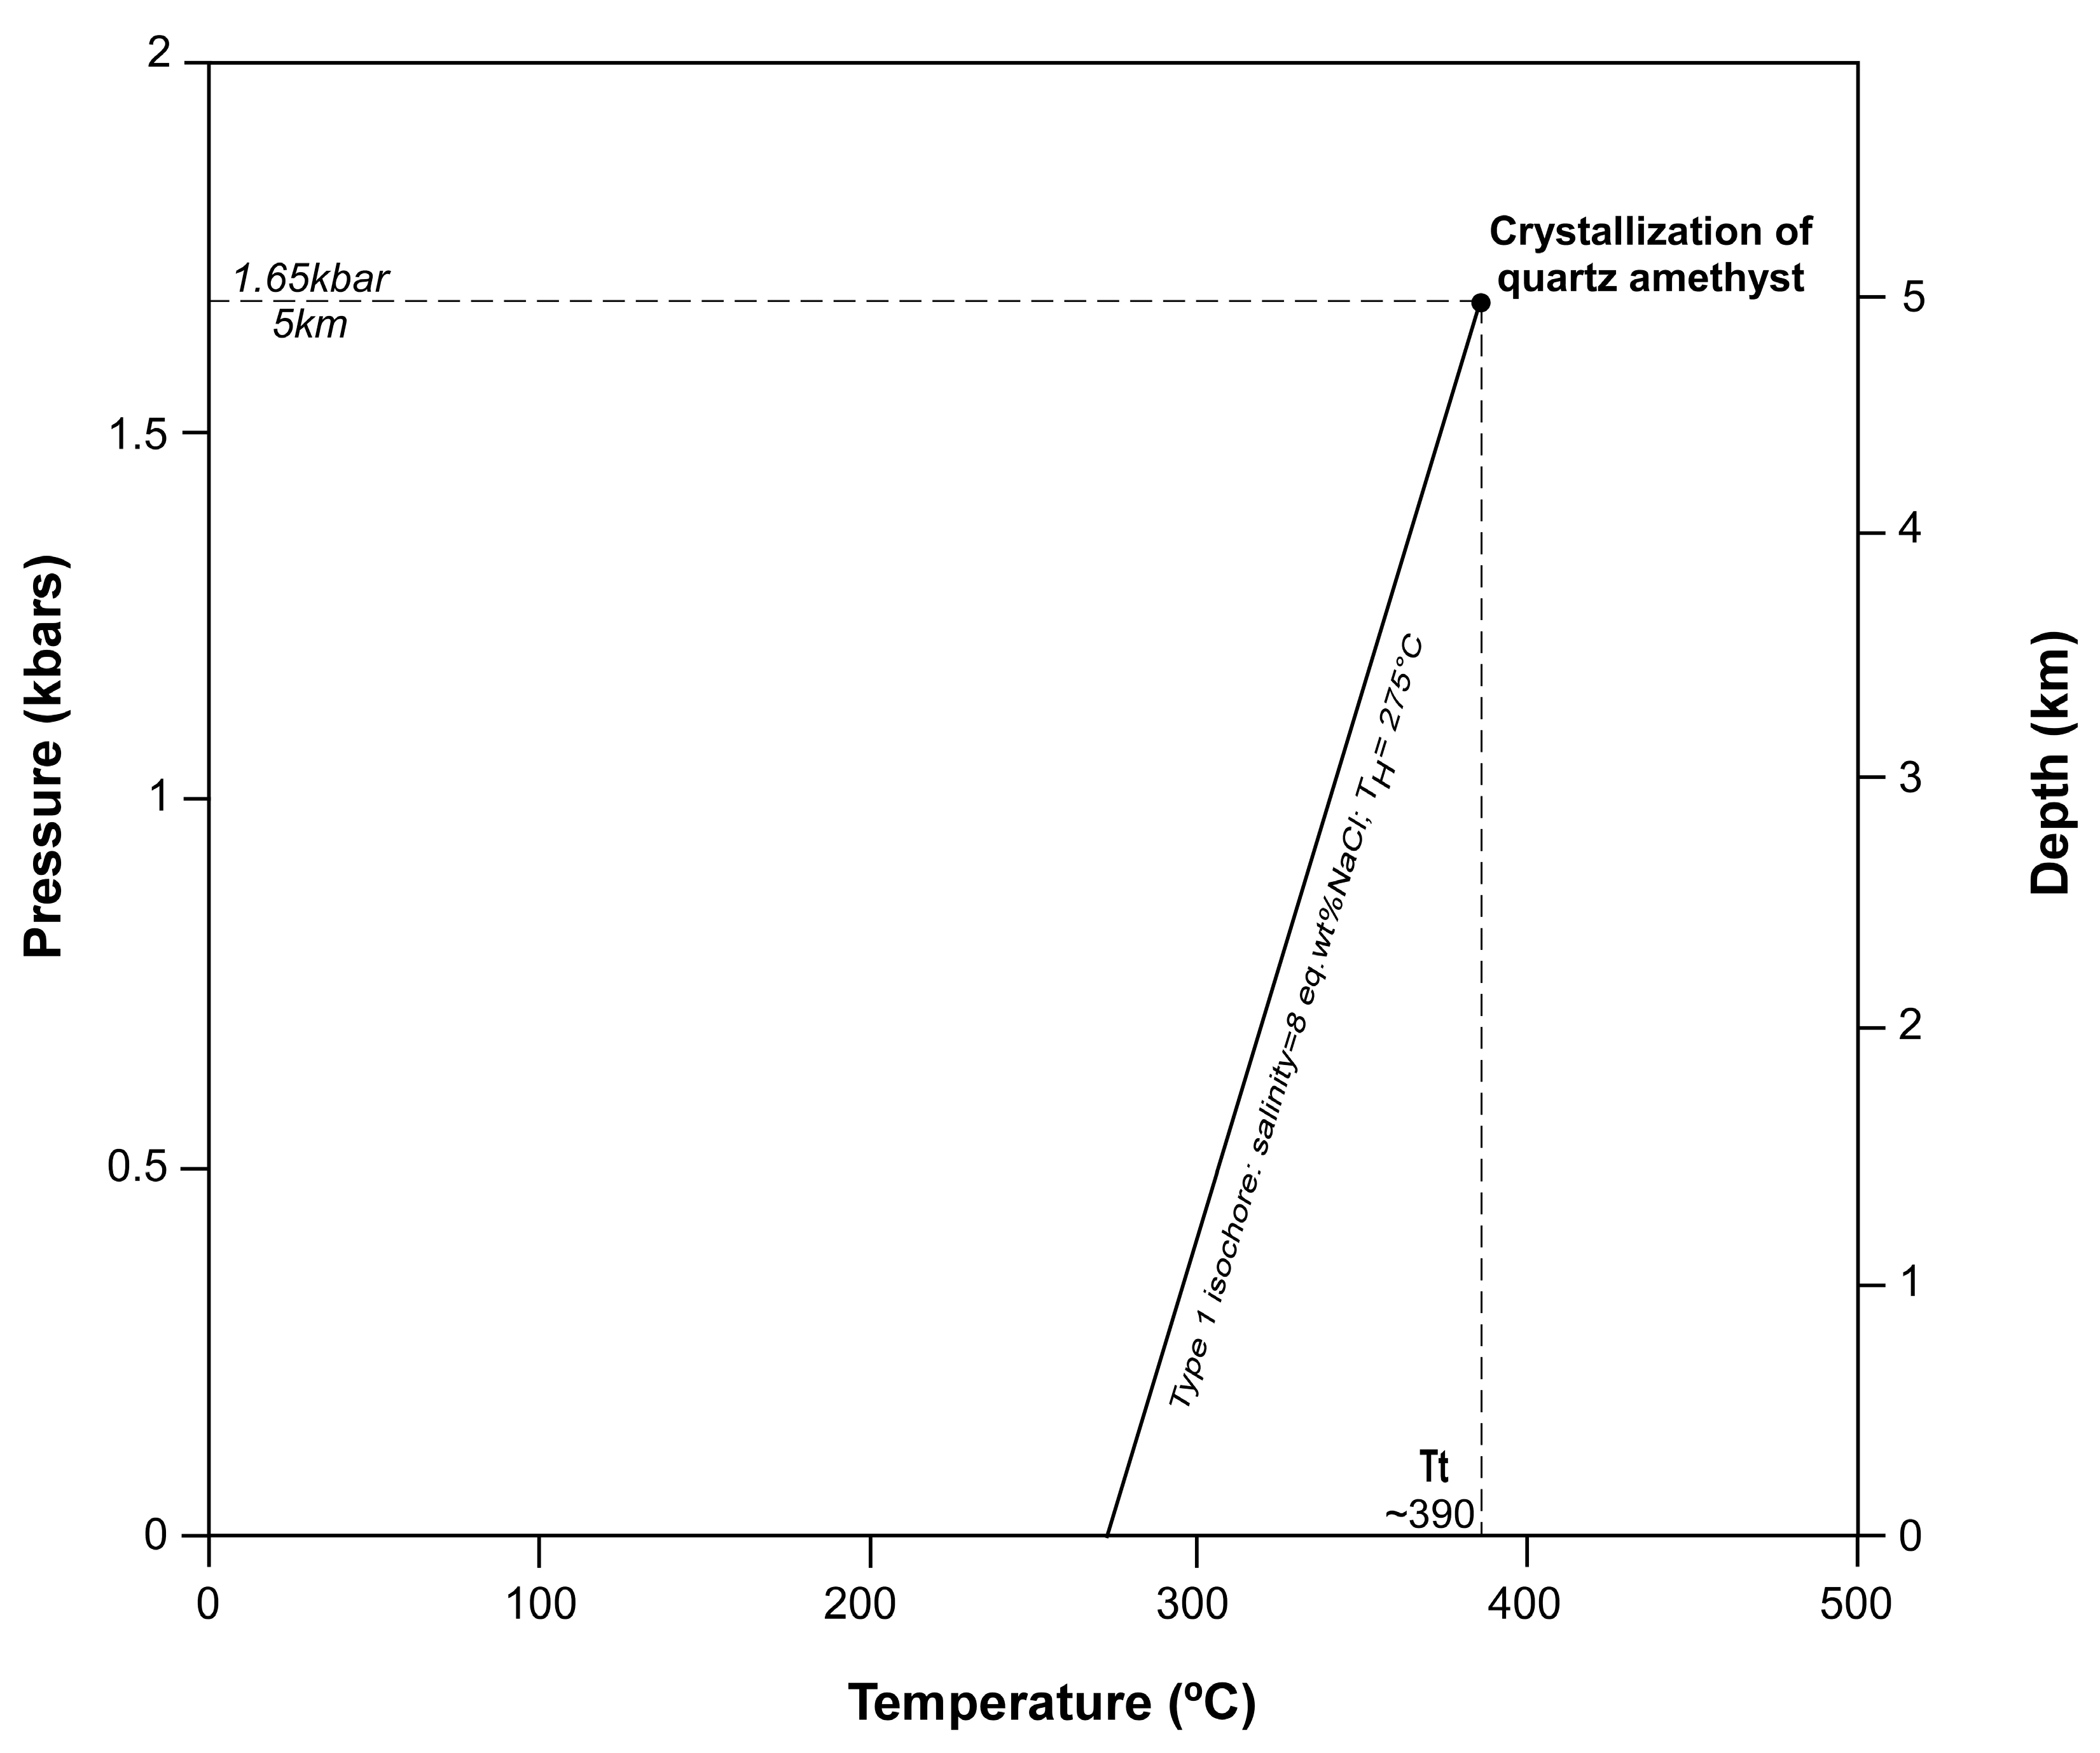
4.3. Microthermometry and LRM of Type 1 Fluid Inclusions

On freezing and reheating Type 1 inclusions yielded first ice melting temperatures in the range of ~ −25 °C to −20 °C indicating bulk fluid compositions of H2O-NaCl to H2O-NaCl-KCl. Last ice melting temperatures between −6 °C and −3 °C correspond to salinities of 5 to 10 eq. wt % NaCl [40]. On further heating, homogenisation to the liquid phase occurred between 270 °C and 310 °C. The narrow range of TH and salinity data for Type 1 fluids is highlighted in Figure 5 and this also reflects the lack of variation in the microthermometric data of Type 1 FIs from the margin to the interior of the crystals. LRM analysis of the liquid and vapour phases in Type 1 revealed traces of CO2 and CH4 in the vapour phase. Furthermore, during heating and freezing cycles microthermometry from −150 °C to 300 °C, no phase changes associated with the presence of these chemical species were noted.

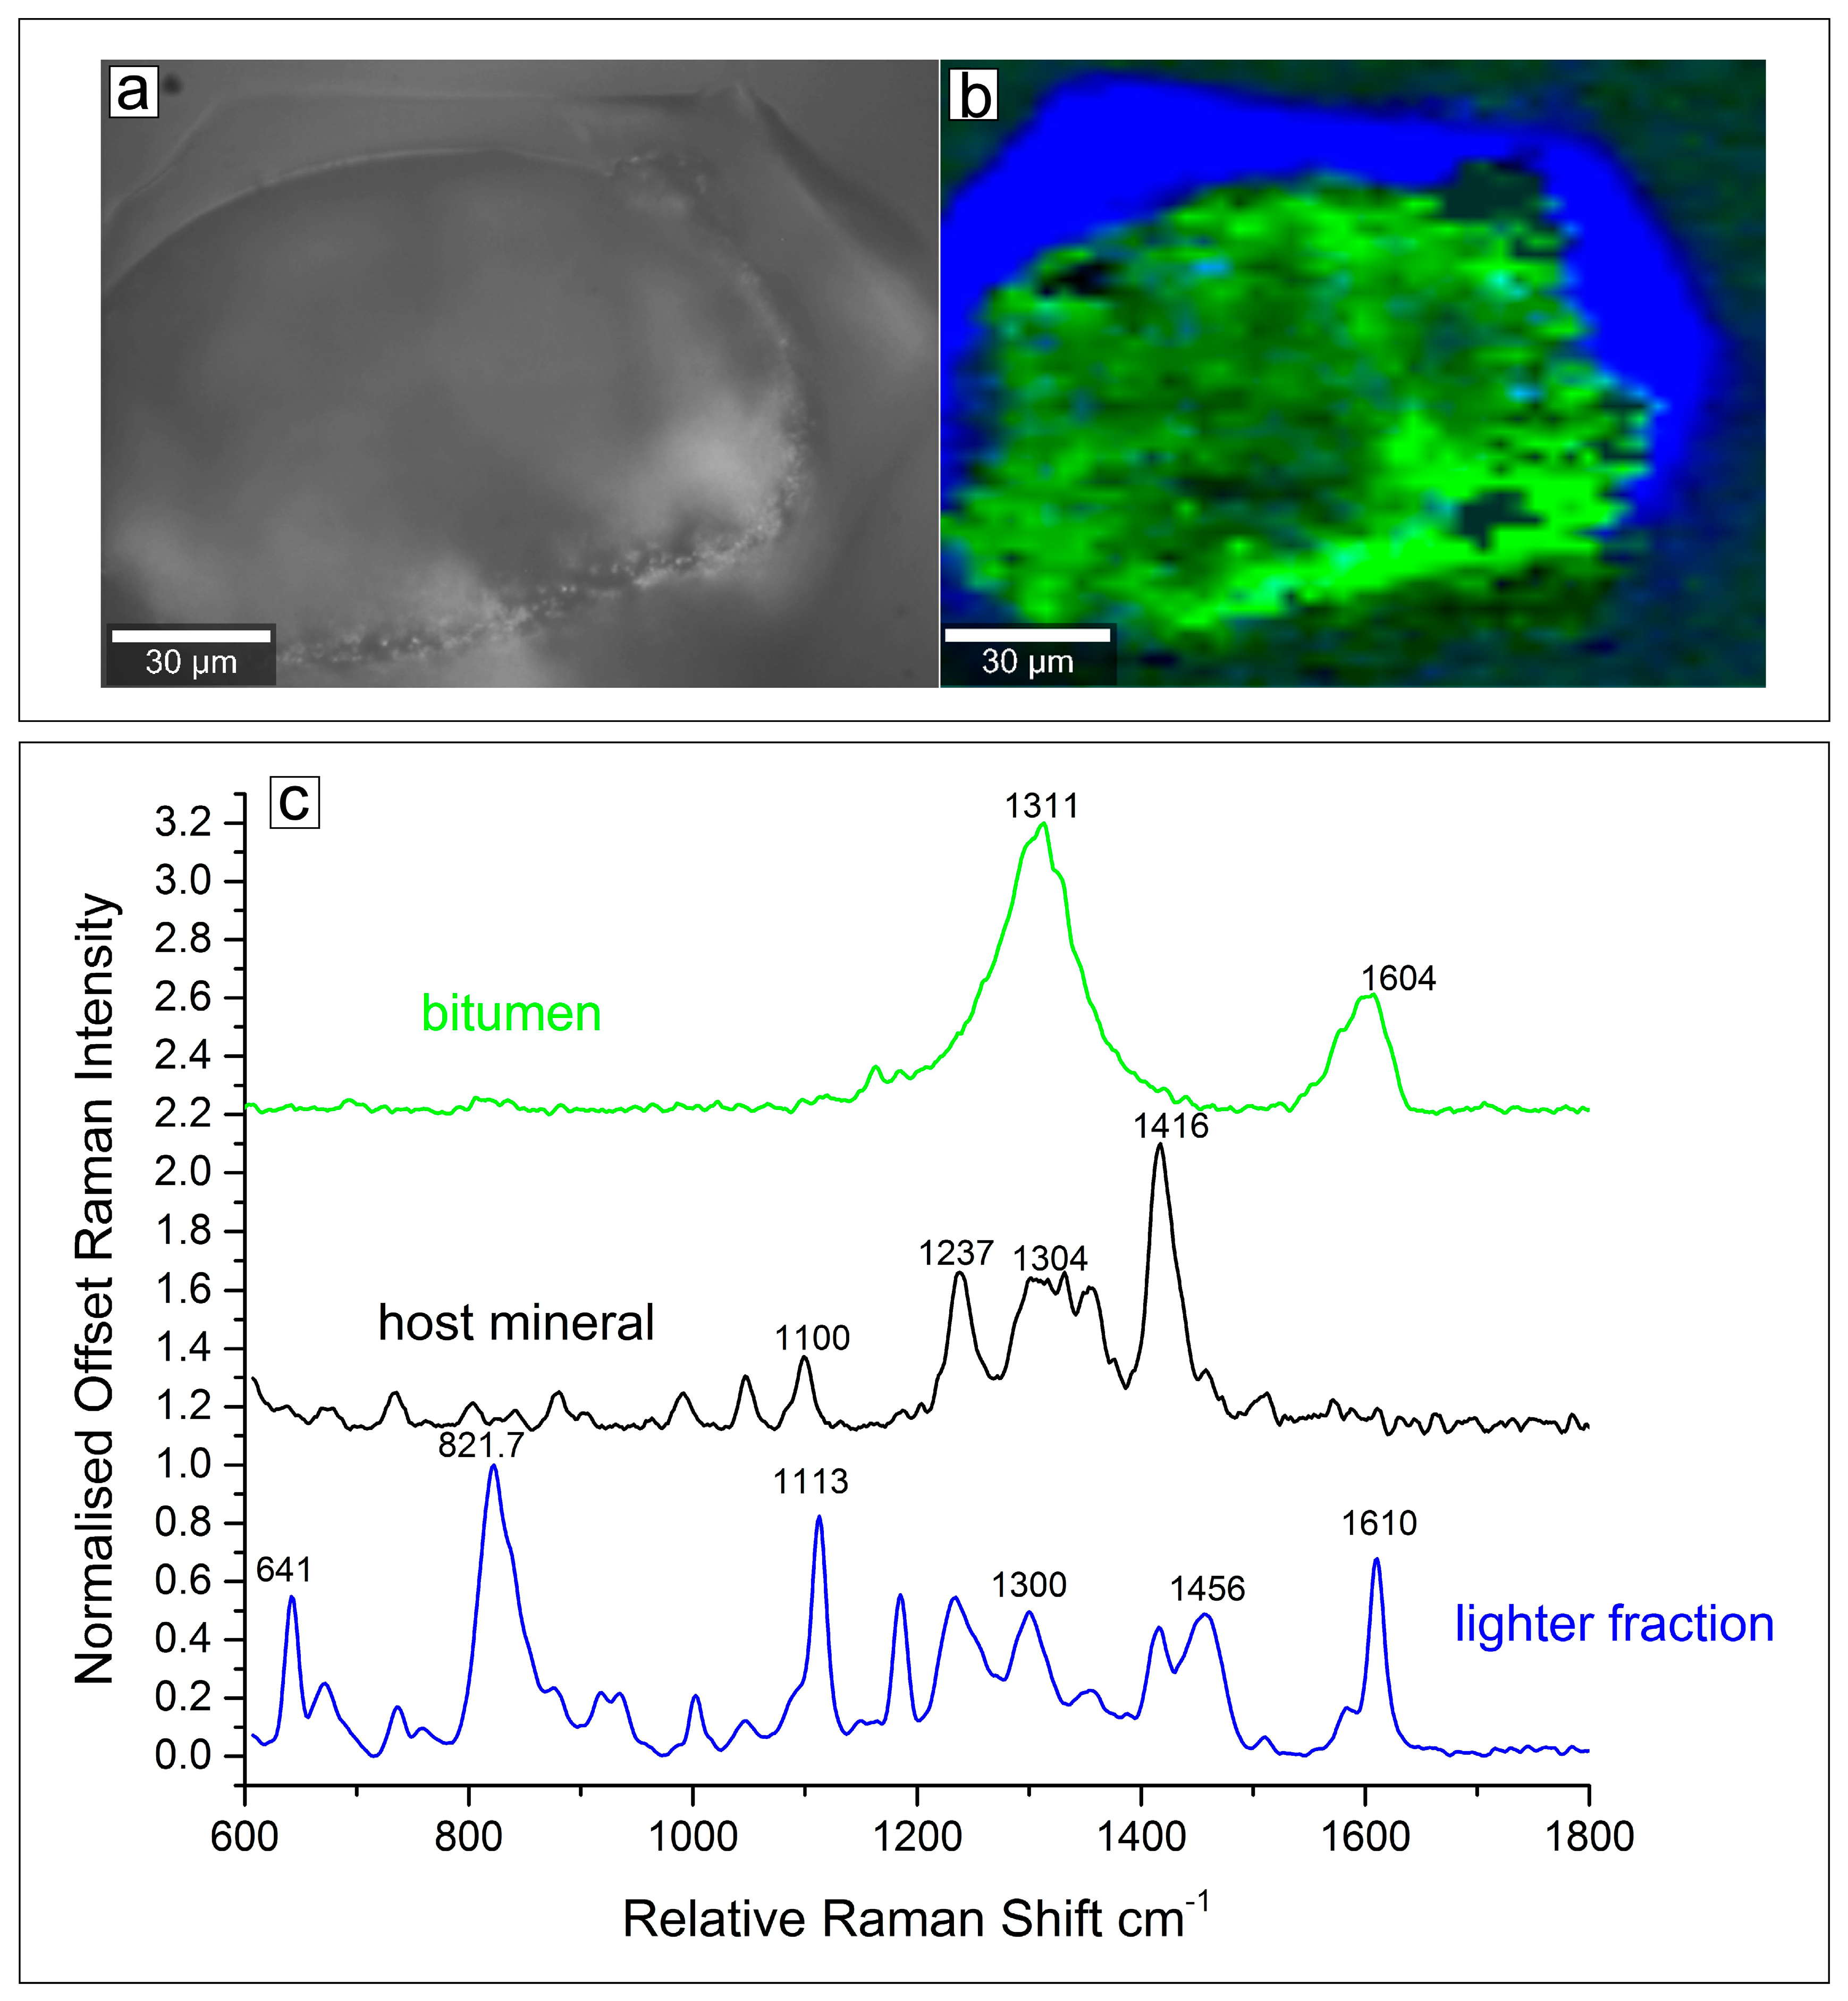
4.4. Confocal Laser Raman Microscopy (CLRM) of Type 2 Fluid Inclusions

The results of the CLRM analyses of a single Type 2 inclusion are shown in Figure 6. Here, three colour zones are recognised corresponding to the host mineral (black), a rim of light alkane/alkene (blue) and an inner core of bitumen (green). The spectral identity relating to these colour zones is shown in Figure 6c where the normalised plots are stacked with an offset. The Disorder (D) and Graphite (G) bands of bitumen are shown in the green trace, with principal peaks at 1311 and 1604 cm−1 respectively. These bands are directly related to carbonaceous materials which are red shifted with increasing bitumen maturity [42,43,44]. The blue spectrum shows the peaks originating from the surrounding lighter fraction with an overlay of peaks originating from the quartz host material (1100–1450 cm−1). Strong peaks at 821 and 1610 cm−1 relates to a lighter hydrocarbon fraction with n-alkane vibrational stretches [45] and also presence of the bitumen G peak red shifted by 6 cm−1. The black spectrum is attributed to the quartz amethyst host mineral as shown by the presence of peaks in the 1100 to 1450 cm−1 range.

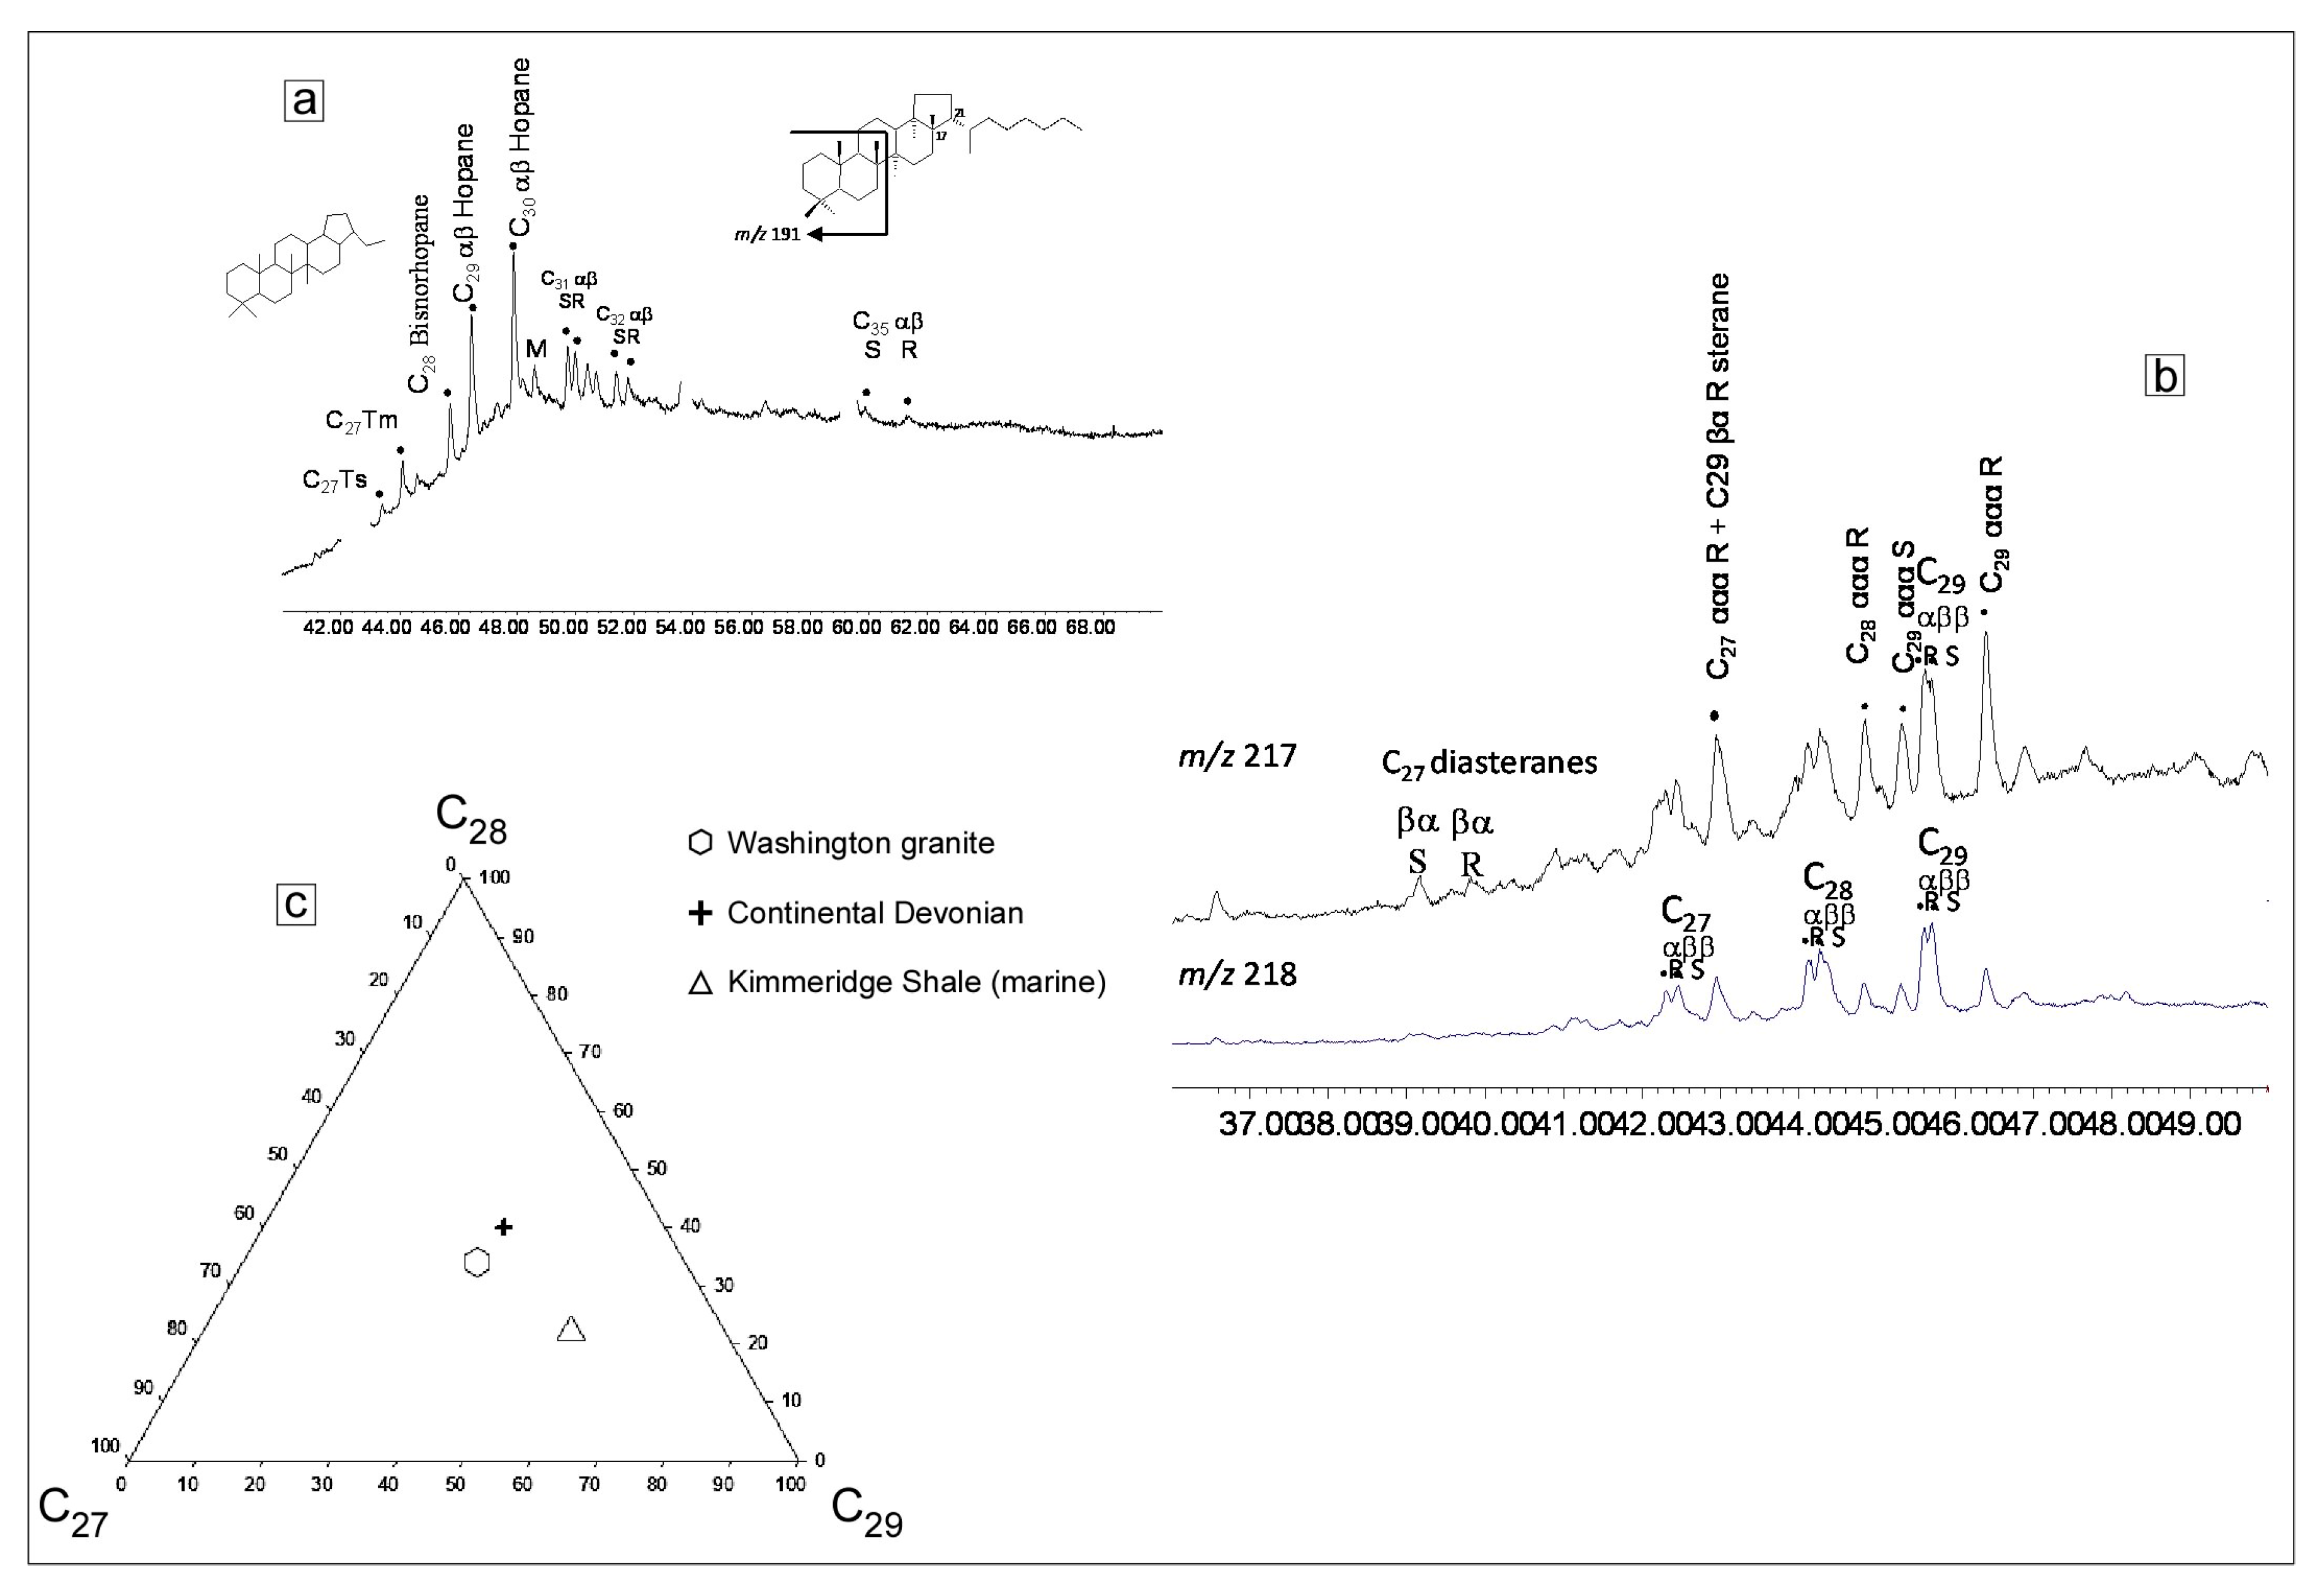
4.5. Gas Chromatograhy-Mass Spectrometry (GC-MS) of the Amber Coloured Oil in Type 3 Inclusions

The GC-MS analysis of the amber coloured oil yielded resolvable suites of hopanes (m/z 191) and steranes (m/z 217). Hopanes (Figure 7) allowed measurements of ratios to deduce thermal maturity. The Ts/Tm ratio was measured as 0.30, and the moretane/C30 hopane ratio was measured as 0.09. No norhopanes were detected.
Steranes (Figure 7) also allowed deduction of thermal maturity. The 20S/20S + 20R ratio for C29 steranes was measured as 0.42, and the ββ/ββ + αα ratio was measured as 0.47. The diasterane/sterane ratio is 0.44. The relative proportions of C27, C28 and C29 steranes were determined as 31%, 34% and 35% respectively, and plotted in a ternary diagram (Figure 7).

5. Interpretation of Results

5.1. Source of Type 1 Fluids

The NaCl-bearing aqueous Type 1 fluids are of low to moderate salinity (<10 eq. wt % NaCl) with the majority of TH values between ~270 °C and 310 °C. This fluid is similar to hydrothermal fluids recorded in granite quartz and their mineralised veins from granites throughout Great Britain and Ireland [46,47,48,49,50,51]. These fluids invariably involve mixing between late-stage magmatic fluids and meteoric fluids. We argue that the Type 1 fluids were trapped during quartz–amethyst formation and may reflect mixing of end-stage magmatic fluids with meteoric fluids. The presence of trace amounts of CO2 and CH4 may be related to either the end-stage magmatic fluids and/or indicative of a fluid source involving the suite of sedimentary rocks that formed part of the country rock at the time of breccia formation. Furthermore, the Green Ridge Breccia is a member of a suite of hydrothermal breccias and mineral deposits that are related to the end stages of the emplacement of Snoqualmie batholith [32].

5.2. The Bitumen Bearing Type 2 Inclusions

The presence of solid bitumens in the geological environment is generally considered to represent the relics of altered oils that have been exposed to severe biodegradation or that they are the result of the thermal cracking of oil or deasphalting processes [1,52,53,54]. In the Barrandian Basin, Czech Republic, for example, the occurrences of bitumen in veins may be due to the migration of liquid oil into fractures that were subsequently degraded to solid bitumen [52,55]. Indeed, Blanc [52] record the presence of pyrolysed oils in fluid inclusions from the Barrandian Basin, e.g., tar spots and solid bitumen segregations on the walls of inclusions. Therefore, the bitumen present in Type 2 inclusions probably represents the residue of an oil charge that was trapped in the fluid inclusions and subsequently thermally degraded to form the solid bitumen. Fluid inclusion petrography shows that the Type 2 inclusions postdate the formation of the quartz amethyst but predate the trapping of the amber oil bearing Type 3 and the formation of the oil filled microfractures. Furthermore, CLRM imaging and analysis of a Type 2 inclusion revealed the presence of, in addition to the bitumen, a light alkane/alkene liquid phase. Alkenes in petroleum inclusions are probably the product of natural pyrolysis of migrating oil [55].

5.3. Source of Amber Coloured Oil in Type 3 Inclusions

The GC-MS data showed a composition typical of oils derived from organic-rich sedimentary rocks. The detailed distributions of compounds provide information about the environment of deposition of the source rock, the maturity of the oil, and whether the oil has experienced biodegradation.
The maturity parameters derived from relative expressions of hopane and sterane peaks combine to indicate a maturity level in the early to peak stages of hydrocarbon generation. This is consistent with a sustained temperature up to 100 °C, or a higher temperature applied for a shorter period. The relative proportions of C27, C28 and C29 steranes indicates a probable continental environment for the parent organic matter. Organic matter from marine environments normally contains lower proportions of the C28 sterane [56]. Compositions for samples of known continental and marine origin (continental Devonian and marine Jurassic shale, North Sea) are plotted for comparison, and show that the amber coloured oil plots closer to hydrocarbons of continental origin (Figure 7).
The amber coloured oil may have its source in the Guye Sedimentary Member of the Naches Formation. According to reference [24], the presence of leaf fossils in the Guye Sedimentary Member, along with carbonaceous mud-shale, and primary bedding structures suggests a terrestrial depositional environment of meandering rivers, flood plains, freshwater swamps with lush vegetation, and shallow lakes with considerable plant life. It can be argued therefore, that the source rock for brownish-yellow oil is the Guye Sedimentary Member.
The diasterane/sterane ratio of 0.44 suggests some biodegradation. Also, homohopanes and tricyclic terpanes are more susceptible to biodegradation and appear to have been altered to a greater extent relative to C29 and C30 hopanes. This may indicate microbial degradation in this shallow environment [38].

5.4. Pressure–Temperature Modelling of Type 1 Fluid Inclusions

In order to constrain trapping pressures and temperatures of the primary Type 1 fluid trapped in the quartz-amethyst crystals, an isochore (a line of constant fluid density in Pressure Temperature—PT space) for Type 1 fluids was constructed using the software FLUIDS [57]. Additional PT and qualitative fluid timing constraints can be added to this space (Figure 8) derived from (a) fluid inclusion petrography: Type 1 fluids were trapped during crystal growth and (b) depth of granite emplacement: the maximum depth of granite emplacement is ~5 km equivalent to ~1.65 kb pressure; this allows for a maximum pressure for Type 1 fluid trapping (Figure 8). Therefore, the true trapping temperature (Tt) for Type 1 fluids is ~390 °C. This modelled crystallisation temperature is within the 370 °C to 420 °C range published by Thomas et al. [13] from fluid inclusion studies of Brazilian quartz amethyst geodes. Similar fluid inclusion studies by Yang et al. [21] reported temperatures of between 280 °C and 400 °C for amethyst crystallisation in granite miaroles of the Eonyang deposit, South Korea.

5.5. Biogenic Hydrocarbon Migration into the Quartz-Amethyst Euhedra of the Green Ridge Breccia

Parnell [7] states that biogenic hydrocarbon occurrences in granite basement rocks are linked to the role granites play as a thermal and/or structural focus. In general, biogenic hydrocarbons in granitic basement rocks come from organic rich source rocks lying above and/or flanking the buried granite. Heat of intrusion combined with hydrothermal convection and faulting can lead to the downward migration of hydrocarbons into granitic basement rocks. Chitwood [24] showed, using several E–W cross sections, that the fossil leaf bearing Guye Sedimentary Member of the Naches Formation forms the roof rock of the Snoqualmie batholith (Figure 9a). These cross sections were generated from a region of the batholith south of the Green Ridge Breccia, it is reasonable to assume that these roof rocks extended to the north and encompassed the region where the breccia formed. Breccia formation occurred during episodes of end-stage granite shearing, brecciation and mineralisation characterised by copper porphyry-type deposits [28,29,30,31,32]. Microthermometric data for Type 1 fluid inclusions indicate that the temperature of formation of the Green Ridge Breccia was ~390 °C assuming that the breccia was formed at ~5 km.
Tabor et al. [58] noted that hydrocarbons in the Cornubian granites of SW England owe their origins to convective flow during late mineralisation and that subsequent erosion removed the sedimentary cover that had provided the source for the hydrocarbons and mineralisation. We invoke a hydrothermal convective flow model, for the initial breccia formation at Green Ridge. This was followed by migration into the breccia of hydrocarbons possibly from the Guye Sedimentary Member after quartz amethyst crystallisation (Figure 9b). There are no absolute age constraints on the timing of the trapping of hydrocarbon bearing fluid inclusions in the quartz amethyst. However, the bitumen precursor oil trapped in Type 2 inclusions reflect a thermal event responsible for the cracking, decrepitation and bitumen precipitation. A second migration and trapping of oil occurred and is represented by Type 3 and the oil bearing microfractures. This event must have occurred after the thermal event that formed the bitumen in Type 2 inclusions. The maturity parameters derived from relative expressions of hopane and sterane peaks for the Type 3 amber oil combine to indicate a maturity level in the early to peak stages of hydrocarbon generation. This is consistent with a sustained temperature up to 100 °C, or a higher temperature applied for a shorter period.

6. Summary and Conclusions

This study demonstrates that the Green Ridge Breccia was a locus for a number of fluid trapping events: (a) primary Type 1 fluid inclusions record quartz-amethyst euhedra crystallisation temperatures of ~390 °C assuming trapping pressures of ~1.65 kb; (b) secondary Type 2 and 3 fluid inclusions in the quartz-amethyst euhedra record post-crystallisation migration and trapping of hydrocarbon fluids. A bitumen precursor oil trapped in Type 2 inclusions reflects thermal degradation to bitumen. A later migration of oil (formed at ~100 °C) is reflected by the Type 3 inclusions and by microfractures both containing amber oil inclusions. The Green Ridge Breccia formed at the end stages of emplacement of the Snoqualmie Granite. Hydrocarbon fluids later migrated downwards from the roof source rock and were trapped in the quartz amethyst euhedra. This was followed by unroofing of the batholith and the exposure of the Green Ridge Breccia.
Finally, it is interesting to speculate upon the potential for other oil migrations into the Snoqualmie Batholith in particular, although not exclusively, in areas where it is capped by the Guye Sedimentary Member.

Acknowledgments

We wish to acknowledge the constructive criticisms made by the three anonymous reviewers. Their suggestions and comments greatly improved the first version of the manuscript.

Author Contributions

M.F. and A.C. were principal investigators, coordinated the experimental procedures and textual contributions from other authors; F.L. performed the microthermometric experiments; J.G. carried out the fieldwork and provided the samples; J.P., S.B. and M.B. carried out the GCMS on oil samples; P.O. carried out confocal laser raman analyses of single bitumen-bearing fluid inclusions.

Conflicts of Interest

The authors declare no conflict of interest.

References

  1. Dutkiewicz, A.; Volk, H.; Ridley, J.; George, S.C. Geochemistry of oil in fluid inclusions in a middle Proterozoic igneous intrusion: Implications for the source of hydrocarbons in crystalline rocks. Org. Geochem. 2004, 35, 937–957. [Google Scholar] [CrossRef]
  2. Konnerup-Madsen, J.; Larsen, E.; Rose-Hansen, J. Hydrocarbon-rich fluid inclusions in minerals from the alkaline Ilimaussaq intrusion, South Greenland. Bull. Miner. 1979, 102, 642–653. [Google Scholar]
  3. Abrajano, T.A.; Sturchio, N.C.; Bohlke, J.K.; Lyon, G.L.; Poreda, R.J.; Stevens, C.M. Methane–hydrogen gas seeps, Zambales Ophiolite, Philippines: Deep or shallow origin? Chem. Geol. 1988, 71, 211–222. [Google Scholar] [CrossRef]
  4. Salvi, S.; Williams-Jones, A.E. Fischer–Tropsch synthesis of hydrocarbons during sub-solidus alteration of the Strange Lake peralkaline granite, Quebec/Labrador, Canada. Geochim. Cosmochim. Acta 1997, 61, 83–99. [Google Scholar] [CrossRef]
  5. Potter, J.; Rankin, A.H.; Treloar, P.J.; Nivin, V.A.; Ting, W.; Ni, P. The preliminary study of methane inclusions in alkaline igneous rocks of the Kola igneous province, Russia: Implications for the origin of methane in igneous rocks. Eur. J. Miner. 1998, 10, 1167–1180. [Google Scholar] [CrossRef]
  6. Sherwood Lollar, B.; Westgate, T.D.; Ward, J.A.; Slater, G.F.; Lacrampe-Couloume, G. Abiogenic formation of alkanes in the Earth’s crust as a minor source of global hydrocarbon reservoirs. Nature 2002, 416, 522–524. [Google Scholar] [CrossRef] [PubMed]
  7. Parnell, J. Migration of biogenic hydrocarbons into granites: A review of hydrocarbons in British plutons. Mar. Pet. Geol. 1988, 5, 385–396. [Google Scholar] [CrossRef]
  8. Petford, N.; McCaffrey, K. Hydrocarbons in crystalline rocks: An introduction; Geological Society: London, UK, Special Publications; 2003; Volume 214, pp. 1–5. [Google Scholar]
  9. Trice, R. Basement exploration, West of Shetlands: Progress in opening a new play on the UKCS. In Hydrocarbon Exploration to Exploitation West of Shetlands; Cannon, S.J.C., Ellis, D., Eds.; Geological Society: London, UK, Special Publications; 2014; Volume 397, pp. 81–105. [Google Scholar]
  10. Thomson, M.L.; Mastalerz, M.; Sinclair, A.J.; Bustin, R.M. Fluid source and thermal history of an epithermal vein deposit, Owen Lake, central British Columbia: Evidence from bitumen and fluid inclusions. Miner. Depos. 1992, 27, 219–225. [Google Scholar] [CrossRef]
  11. Rossman, G.R. Colored varieties of the silica minerals. Rev. Miner. 1994, 29, 433–467. [Google Scholar]
  12. Gilg, H.A.; Morteani, G.; Kostitsyn, Y.; Preinfalk, C.; Gatter, I.; Strieder, A.J. Genesis of amethyst geodes in basaltic rocks of the Serra Geral Formation (Ametista do Sul, Rio Grande do Sul, Brazil): A fluid inclusion, REE, oxygen, carbon, and Sr isotope study on basalt, quartz, and calcite. Miner. Depos. 2003, 38, 1009–1025. [Google Scholar] [CrossRef]
  13. Thomas, R.; Blankenburg, H.J. Erste Ergebnisse uÅN ber Einschlussuntersuchungen an Quarzen aus Achatmandeln und Kugeln basischer und sauerer Vulkanite. Z. Geol. Wiss. 1981, 9, 625–633. (In German) [Google Scholar]
  14. Juchem, P.L.; Fallick, A.E.; Bettencourt, J.S.; Svisero, D.P. Geoquímica isotó pica de oxigênio em geodos mineralizados a ametista da região do Alto Uruguaí, RS—Um estudo preliminar. 1. In Símposio Sobre Vulcanismo e Ambientes Asociados; Cidade Universitária: Gramado, Brazil, 1999. [Google Scholar]
  15. Fallick, A.E.; Jocelyn, J.; Donnelly, T.; Guy, M.; Behan, C. Origin of agates in volcanic rocks from Scotland. Nature 1985, 313, 672–674. [Google Scholar] [CrossRef]
  16. Fallick, A.E.; Jocelyn, J.; Hamilton, P.J. Oxygen and hydrogen stable isotope systematics in Brazilian agates. In Geochemistry and Mineral Formation in the Earth Surface; Rodriguez-Clemente, R., Tardy, Y., Eds.; Consejo Superiór de Investigaciónes Científicas: Madrid, Spain, 1987; pp. 99–117. [Google Scholar]
  17. McArthur, J.R.; Jennings, E.A.; Kissin, S.A.; Sherlock, R.L. Stable isotope, fluid-inclusion and mineralogical studies relating to the genesis of amethyst, Thunder Bay, Amethyst Mine, Ontario. Can. J. Earth Sci. 1993, 30, 1955–1969. [Google Scholar] [CrossRef]
  18. Balitsky, V.S. Les conditions de formation des améthystes et leur croissance artificielle. Bull Minér. 1978, 101, 383–386. (In French) [Google Scholar]
  19. Robinson, R.W.; Norman, D.I. Mineralogy and fluid inclusion study of the Southern Amethyst vein system, Creede mining district, Colorado. Econ. Geol. 1984, 79, 439–447. [Google Scholar] [CrossRef]
  20. Gatter, I. Fluid inclusion studies in the polymetallic ores of Gyo ngyo soroszi (North Hungary)—Spatial and temporal evolution of ore-forming fluids. Chem. Geol. 1987, 61, 169–181. [Google Scholar] [CrossRef]
  21. Yang, K.H.; Yun, S.H.; Lee, J.D. A fluid inclusion study of an amethyst deposit in the Cretaceous Kyongsan Basin, South Korea. Miner. Mag. 2001, 64, 477–487. [Google Scholar] [CrossRef]
  22. Dragovich, J.D.; Logan, R.L.; Schasse, H.W.; Walsh, T.J.; Lingley, W.S., Jr.; Norman, D.K.; Gerstel, W.J.; Lapen, T.J.; Schuster, J.E. Geological map of Washington-Northwest Quadrant. In Washington Division of Geology and Earth Resources Geologic Map; GM-50, 72 p. Pamphlet, 3 Sheets, Scale 1:250,000; Washinton State Department of Natural Resources: Olympia, WA, USA, 2002. [Google Scholar]
  23. Foster, R.J. Tertiary Geology of a portion of the Central Cascade Mountains, Washington. Bull. Geol. Soc. Am. 1960, 71, 99–126. [Google Scholar] [CrossRef]
  24. Chitwood, L.A. Stratigraphy, Structure and Petrology of the Snoqualmie Pass Area, Washington. Ph.D. Thesis, Portland State University, Portland, OR, USA, 1976. [Google Scholar]
  25. Erikson, E.H. Petrology of the Composite Snoqualmie Batholith, Central Cascade Mountains, Washington. Geol. Soc. Am. Bull. 1969, 80, 2213–2236. [Google Scholar] [CrossRef]
  26. Tabor, R.W.; Frizzell, V.A., Jr.; Booth, D.B.; Waitt, R.B. Geologic map of the Snoqualmie Pass 30–60 Min Quadrangle, Washington, U.S. In Geological Survey, Geologic Investigations; Series I-2538, Online Version 1.0; DGGS: Fairbanks, AK, USA, 1995. [Google Scholar]
  27. Grant, A.R. Chemical and Physical Controls for Base Metal Deposition in the Cascade Range of Washington; State of Washington, Department of Natural Resources Bulletin 58; Washinton State Department of Natural Resources: Olympia, WA, USA, 1969.
  28. Gualtieri, J.L.; Simmons, G.C.; Thurber, H.K.; Miller, M.S.; Davis, W.E. Mineral resources of the Alpine Lakes study area, Chelan, King, and Kittitas Counties, Washington: U.S. In Geological Survey Open-File Report; United States Geological Survey: Reston, VA, USA, 1973; p. 132. [Google Scholar]
  29. Gualtieri, J.L.; Thurber, H.K.; Miller, M.S.; McMahan, M.C.; Federspiel, M.S. Mineral resources of additions to the Alpine Lakes Study Area, Chelan, King, and Kittitas Counties, Washington: U.S. In Geological Survey Open-File Report 75-3; United States Geological Survey: Reston, VA, USA, 1975; p. 162. [Google Scholar]
  30. Church, S.E.; Tabor, R.W.; Johnson, F.L. Mineral resource potential map of the Glacier Peak Roadless Area, Snohomish County, Washington: U.S. In Geological Survey Miscellaneous Field Studies Map; MF-1380-C 15p, scale 1:50,000; United States Geological Survey: Reston, VA, USA, 1983. [Google Scholar]
  31. Thurber, H.K.; Miller, M.S.; McMahan, A.B.; Federspiel, F.E. Economic appraisal of the alpine lakes study area and addition, Washington. U.S. In Geological Survey; Bulletin 1542-E; United States Geological Survey: Reston, VA, USA, 1989. [Google Scholar]
  32. McBirney, A.R. Volcanic Evolution of the Cascade Range. Ann. Rev. Earth Planet Sci. 1978, 6, 437–456. [Google Scholar] [CrossRef]
  33. Dillhoff, R.; George, J. The Purple Hope Claims: Green Ridge, Middle Fork of the Snoqualmie River, King County, Washington. Rocks Miner. 2016, 91, 498–517. [Google Scholar] [CrossRef]
  34. MacDonald, A.J.; Spooner, E.T.C. Calibration of a Linkam TH 600 programmable heating-cooling stage for microthermometric examination of fluid inclusions. Econ. Geol. 1981, 74, 1248–1258. [Google Scholar] [CrossRef]
  35. Dieing, T.; Hollricher, O.; Toporski, J. Confocal Raman Microscopy. In Optical Sciences; Springer: Berlin, Germany, 2011; Volume 158. [Google Scholar]
  36. Seifert, W.K.; Moldowan, J.M. The effect of biodegradation on steranes and terpanes in crude oils. Geochim. Cosmochim. Acta 1979, 43, 111–126. [Google Scholar] [CrossRef]
  37. Bennett, B.; Fustic, M.; Farrimond, P.; Huang, H.; Larter, S.R. 25-Norhopanes: Formation during biodegradation of petroleum in the subsurface. Org. Geochem. 2006, 37, 787–797. [Google Scholar] [CrossRef]
  38. Parnell, J.; Baba, M.; Bowden, S.; Muirhead, D. Subsurface Biodegradation of Crude Oil in a Fractured Basement Reservoir, Shropshire, UK. J. Geol. Soc. 2017, 174, 655–666. [Google Scholar] [CrossRef]
  39. Peters, K.E.; Moldowan, J.M. The Biomarker Guide: Interpreting Molecular Fossils in Petroleum and Ancient Sediments; Prentice Hall: Englewood Cliffs, NJ, USA, 1993. [Google Scholar]
  40. Shepherd, T.J.; Rankin, A.H.; Alderton, D.H.M. A Practical Guide to Fluid Inclusion Studies; Blackie Academic & Professional: New York, NY, USA, 1985. [Google Scholar]
  41. Bodnar, R.J. Revised equation and table for determining the freezing point depression of H2O-NaCl solutions. Geochim. Cosmochimi. Acta 1993, 57, 683–684. [Google Scholar] [CrossRef]
  42. Muirhead, D.K.; Parnell, J.; Spinks, S.; Bowden, S.A. Characterization of organic matter in the Torridonian using Raman spectroscopy. In Geological Society; Special Publications: London, UK, 2016; p. 448. [Google Scholar]
  43. Zhou, Q.; Xiao, X.; Pan, L.; Tian, H. The relationship between micro-Raman spectral parameters and reflectance of solid bitumen. Int. J. Coal Geol. 2014, 121, 19–25. [Google Scholar] [CrossRef]
  44. Hurai, V.; Huraiová, M.; Slobodník, M.; Thomas, R. Geofluids: Developments in Microthermometry, Spectroscopy, Thermodynamics, and Stable Isotopes; Elsevier: London, UK, 2015; p. 504. [Google Scholar]
  45. O’Reilly, C.; Jenkin, G.R.T.; Feely, M.; Alderton, D.H.M.; Fallick, A.E. A fluid inclusion and stable isotope study of 200 Ma of fluid evolution in the Galway Granite, Connemara, Ireland. Contrib. Miner. Petrol. 1997, 129, 120–142. [Google Scholar] [CrossRef]
  46. Conliffe, J.; Feely, M. Microthermometric characteristics of fluids associated with granite and greisen quartz, and vein quartz and beryl from the Rosses Granite Complex, Donegal, NW Ireland’. J. Geochem. Explor. 2006, 89, 73–77. [Google Scholar] [CrossRef]
  47. Feely, M.; Selby, D.; Conliffe, J.; Judge, M. Re–Os geochronology and fluid inclusion microthermometry of molybdenite mineralisation in the late-Caledonian Omey Granite, western Ireland Applied Earth Science. Trans. Inst. Min. Metall. B 2007, 116, 143–149. [Google Scholar]
  48. Selby, D.; Conliffe, J.; Crowley, Q.G.; Feely, M. Geochronology (Re–Os and U–Pb) and fluid inclusion studies of molybdenite mineralisation associated with the Shap, Skiddaw and Weardale granites, UK D. Applied Earth Science. Trans. Inst. Min. Metall. B 2008, 117, 11–28. [Google Scholar]
  49. Conliffe, J.; Feely, M. Fluid inclusions in Irish granite quartz: Monitors of fluids trapped in the onshore Irish Massif. Earth Environ. Sci. Trans. R. Soc. Edinb. 2010, 101, 53–66. [Google Scholar] [CrossRef]
  50. Holdsworth, B.; Dempsey, E.D.; Selby, D.; Darling, J.; Feely, M.; Costanzo, A.; Strachan, R.; Waters, P.; Finlay, A.; Porter, S.J. Silurian to Devonian magmatism, molybdenite mineralization, regional exhumation and brittle strike-slip deformation along the Loch Shin Line, NW Scotland. J. Geol. Soc. Lond. 2015, 172, 748–762. [Google Scholar] [CrossRef] [Green Version]
  51. Suchý, V.; Dobeš, P.; Sýkorová, I.; Machovič, V.; Stejskal, M.; Kroufek, J.; Chudoba, J.; Matějovský, L.; Havelcová, M.; Matysová, P. Oil bearing inclusions in vein quartz and calcite and, bitumens in veins: Testament to multiple phases of hydrocarbon migration in the Barrandian basin (lower Paleozoic), Czech Republic. Mar. Pet. Geol. 2010, 27, 285–297. [Google Scholar] [CrossRef]
  52. Blanc, P.; Connan, J. Preservation, degradation, and destruction of trapped oil. In The Petroleum System—From Source to Trap; Mogoon, L.B., Dow, W.G., Eds.; American Association of Petroleum Geologists Memoir: Tulsa, OK, USA, 1994; pp. 237–247. [Google Scholar]
  53. Mossman, D.J.; Nagy, B. Solid bitumens: An assessment of their characteristics, genesis, and role in geological processes. Terra Nova 1996, 8, 114–128. [Google Scholar] [CrossRef]
  54. Volk, H.; Horsfield, B.; Mann, U.; Sucký, V. Variability of petroleum inclusions in vein, fossil and vug cements—A geochemical study in the Barrandian Basin (Lower Paleozoic, Czech Republic). Org. Geochem. 2002, 33, 1319–1341. [Google Scholar] [CrossRef]
  55. Peters, K.E.; Walters, C.C.; Moldowan, J.M. The Biomarker Guide, 2nd ed.; Cambridge University Press: Cambridge, UK, 2005. [Google Scholar]
  56. Bakker, R.J. Clathrates: Computer programs to calculate fluid inclusion V-X properties using clathrate melting temperatures. Comput. Geosci. 2003, 23, 1–18. [Google Scholar] [CrossRef]
  57. Selley, R.C. Elements of Petroleum Geology, 2nd ed.; Academic Press: San Diego, CA, USA, 1997; p. 470. [Google Scholar]
  58. Tabor, R.W.; Frizzell, V.A., Jr.; Vance, J.A.; Naeser, C.W. Ages and stratigraphy of lower and middle Tertiary sedimentary and volcanic rocks of the Central Cascades, Washington: Applications to the tectonic history of the Straight Creek Fault. Geol. Soc. Am. 1984, 95, 26–44. [Google Scholar] [CrossRef]
Figure 1. Simplified geological map of the Snoqualmie Batholith and its country rock showing the location of the Green Ridge Breccia (after [22]).
Minerals 07 00174 g001
Figure 2. Photographs of a quartz-amethyst crystals with centimetric scale amber coloured oil inclusions (Type 3). The amber coloured phase in the inclusion is the liquid oil and it surrounds the colourless liquid phase.
Minerals 07 00174 g002
Figure 3. Photomicrographs in plane polarised light (PPL, (a,b,d)) and a photograph of a hand sample (c) of the different fluid inclusion (FI) types observed (a) Type 1 inclusion; (b) Type 2; (c,d) Type 3; (e) Schematic representation of a quartz amethyst crystal showing the spatial relationships between the FI types and the crystal growth zones. An amber coloured oil-filled fracture crosscutting Type 2 FIs is also shown.
Minerals 07 00174 g003
Figure 4. Photomicrographs of Type 2, Type 3 and an amber coloured oil-filled fracture spatially related to Type 3 all showing blue fluorescence under ultraviolet (UV) light. (a) Two large Type 2 inclusions in transmitted plane polarised light (TPPL) and (b) same view under UV light; (c) Amber coloured oil-bearing two-phase Type 3 inclusion in TPPL and (d) same view under UV light; (e) An amber coloured oil-filled fracture and (f) same view under UV light.
Minerals 07 00174 g004
Figure 5. TH–salinity bivariate plot for Type 1 aqueous fluid inclusions showing the narrow range of TH (270–310 °C) and salinity (5 to 10 eq. wt % NaCl). On the left is a table of microthermometric data. Temperature of first ice melting (TFM), temperature of last ice melting (TLM), temperature of homogenization (TH) and salinity (eq. wt % NaCl). n.o.: not observed.
Minerals 07 00174 g005
Figure 6. Bright field image of a Type 2 FI (a) and its corresponding Raman cluster map (b); The inclusion is defined by two coloured coded clusters. The green core corresponds to the bitumen; the surrounding blue zone relates to a lighter alkane–alkene phase; (c) Confocal Laser Raman Microscopy (CLRM) spectra for the Type 2 inclusion in (a,b) showing the principal peaks of bitumen and the lighter alkane–alkene phase as well as the host mineral.
Minerals 07 00174 g006
Figure 7. (a) Portion of m/z 191 chromatogram from extract of brownish-yellow oil, showing distribution of hopanes; (b) Portion of m/z 217 and 218 chromatograms from extract of oil, showing distribution of steranes; (c) Ternary plot of relative proportions of C27, C28 and C29 steranes in the oil sample. Compositions for samples of known continental and marine origin (continental Devonian and marine Jurassic shale, North Sea) plotted for comparison.
Minerals 07 00174 g007
Figure 8. A pressure–temperature model for the formation of the quartz-amethyst vugs using microthermometric data from the primary Type 1 aqueous inclusions. The intersection of the isochore for the primary Type 1 fluid with the estimated maximum pressure for granite emplacement (i.e., ~1.65 kbar) indicates a true trapping temperature (Tt) indicating a crystallization temperature of ~390 °C.
Minerals 07 00174 g008
Figure 9. (a) An East–West cross section from an area to the south of the studied area (adapted from Chitwood, 1976) showing the emplacement of the Snoqualmie Granite into the Guye Sedimentary Member; (b) Schematics (1 and 2) showing the emplacement of the Snoqualmie Granite into the Guye Sedimentary Member and the subsequent formation of the Green Ridge Breccia. Convective flow vectors mark the migration of hydrocarbon bearing fluids into the Green Ridge Breccia (1). This is followed by uplift and erosion to expose the roof of the batholith and the breccia (2).
Minerals 07 00174 g009

