Article

Sustainable Reuse of Mine Tailings and Waste Rock as Water-Balance Covers

by
Mohammad H. Gorakhki
and
Christopher A. Bareither
*
Civil & Environmental Engineering, Colorado State University, Fort Collins, CO 80523, USA
*
Author to whom correspondence should be addressed.
Minerals 2017, 7(7), 128; https://doi.org/10.3390/min7070128
Submission received: 1 June 2017 / Revised: 7 July 2017 / Accepted: 18 July 2017 / Published: 24 July 2017
(This article belongs to the Special Issue Minerals in Mine Wastes: Contributions to the Circular Economy)

Abstract

:
The focus of this study was to evaluate the potential reuse of mixed mine tailings and waste rock in water-balance covers (WBCs). Reuse of mine waste in geoengineering applications can provide an economic advantage via offsetting raw material requirements and reducing waste volumes to manage. Water-balance covers are designed to minimize percolation and/or oxygen ingress into underlying waste via moisture retention while also providing resistance against slope failure and erosion of cover materials. Water-balance simulations were conducted using a variably-saturated one-dimensional numerical model to assess hydrologic behavior of an actual WBC as well as hypothetical mixed mine waste WBCs. The actual water balance cover included a 1.22-m-thick silty-sand storage layer and a 0.15-m-thick topsoil layer. Three scenarios were evaluated via hydrologic modeling that focused on replacing the actual storage layer with a layer of mine waste: (1) storage layers were simulated as 1.22-m-thick layers of pure mine tailings (i.e., copper, gold, coal, and oil sand tailings); (2) storage layers were simulated as 1.22-m-thick layers of mixed mine tailings and waste rock; and (3) mixed mine tailings and waste rock storage layer thicknesses were redesigned to yield comparable percolation rates as the actual cover.

1. Introduction

The increased consumption of raw materials due to population growth has increased demand on natural resources. In turn, the generation of mine waste has increased, which require innovative and sustainable waste management considerations. In the mining industry, waste materials include waste rock discarded from mining operations and fine-grained tailings produced during ore extraction processes. The Mining, Minerals, and Sustainable Development Project (MMSD) reports that approximately 3500 active mine waste facilities exist worldwide. Disposal and management of mine tailings in impoundments and waste rock in gravity piles can be challenging due to variability in physical and chemical properties of the mine waste. Using mine tailings and waste rock as earthwork materials (e.g., water balance cover) can provide a sustainable and cost effective alternative to mitigate disposal and management challenges.
Mine waste is categorized as a non-hazardous material based on Subtitle D of the Resource Conservation and Recovery Act [1]. Non-hazardous waste facilities are required to have covers to minimize percolation into the underlying waste. Permeability of cover soils must be less than or equal to the permeability of the liner system or ≤10−5 cm/s [2], such that water passing through a cover does not exceed the volume of water exiting through the liner. Considerably higher cover permeability can lead to a “bathtub effect” [2], whereby water ponds inside the waste on the liner and increases leachate generation. There are two main types of cover systems used to close waste facilities: (i) conventional covers and (ii) water-balance covers (WBCs). Conventional cover systems rely on low-permeability soil layers and/or impermeable geomembranes to minimize percolation [3,4]. Water-balance covers (also known as store-and-release, evapotranspirative, or alternative covers) rely on a balance between precipitation, soil water storage, evaporation, and transpiration to limit percolation. Thus, WBCs function based on principles of unsaturated flow to control percolation into underlying waste [5,6,7,8]. These covers are viable for long-term isolation of waste, particularly in semi-arid and arid regions where precipitation is balanced by evaporation and transpiration. The costs associated with WBCs are typically less than conventional covers when suitable soil is available; for example, constructing a 1200-mm-thick WBC in OR, USA resulted in 64% cost savings relative to a 460-mm-thick compacted clay cover [2].
Water-balance covers are intrinsically sustainable as they employ natural hydrologic processes congruent with the surrounding landscape, which reduces long-term maintenance requirements. Local materials are typically employed to minimize transportation costs, which can reduce energy consumption and emissions. An additional opportunity to enhance the sustainability of WBCs is to use waste materials or industrial by-products in the cover system. Mining provides an opportunity to reuse waste materials in cover systems considering that (i) enormous volumes of mine wastes are generated during ore extraction processes and (ii) mine waste management facilities (e.g., tailing storage facilities, waste rock piles, heap leach pads) require covers for site closure.
The two predominant mine wastes that require short- and long-term management are tailings and waste rock [9,10]. Tailings typically are fine grained and have high water contents (low solids contents), whereas waste rock generally is gravel- to cobble-sized material with sand and fines. Mine tailings have been shown to have moisture retention characteristics comparable with naturally occurring fine sand, silt, and clay [11,12,13] and field-scale studies have documented the effectiveness of using mine tailings in the water storage layers of WBCs [14,15,16]. An effective WBC for a mine waste management facility shall provide long-term resistance against percolation of precipitation and ingress of oxygen into underlying waste (hydrologic performance) as well as resistance against slope failure and erosion of the cover materials (mechanical performance). The potential leaching of contaminants (e.g., heavy metals) from mine wastes used in WBCs is also a concern. However, mine wastes with the propensity to generate contaminated leachate are not candidate materials for use in WBCs. The focus herein is on the hydraulic behavior of WBCs composed of mixed mine waste, and the mine waste considered in this study are assumed to have negligible leaching concerns.
Fine-grained soils and mine tailings can have low shear strength and high susceptibility to erosion that can preclude their use in cover systems; however, these materials also have ideal hydrologic properties for use as water storage layers in WBCs [15,16]. Mine waste rock has been shown to have shear strength parameters comparable with naturally occurring gravels [13]. The addition of waste rock to mine tailings, known as co-mixed waste rock and tailings (WR&T), has been proposed as an alternative mine waste management approach to enhance impoundment stability, reduce acid rock drainage, reduce storage volume and land required for waste management facilities, and reduce liquefaction potential of tailings [13,17,18]. Waste rock and tailings can be mixed proportionately to develop a material with enhanced strength via waste rock and lower hydraulic conductivity via mine tailings [9,19].
The use of mine tailings in cover systems at mine facilities has been evaluated on a trial basis [14,20], but broad-scale adoption has not occurred. Cover test sections consisting of co-mixed WR&T have not been evaluated due to uncertainty in hydrologic behavior of the co-mixed material as well as mixing and deployment of the material as a homogeneous layer in a cover system. The objective of this study was to assess the viability of using a co-mixed layer of WR&T as the storage layer in a WBC via hydrologic modeling. Three tasks were completed to address this objective: (i) evaluate theoretical WBCs containing mine tailings; (ii) evaluate the effect of waste rock addition on hydrologic behavior; and (iii) evaluate storage capacity of co-mixed WR&T covers that have the potential to yield comparable percolation rates to covers with no waste rock inclusions. Water-balance modeling was completed using meteorological data for a semi-arid site in the Western U.S. where an actual WBC test section has been constructed [21]. This actual WBC was used for comparison to all theoretical WBCs created with mine tailings and waste rock.

2. Materials and Methods

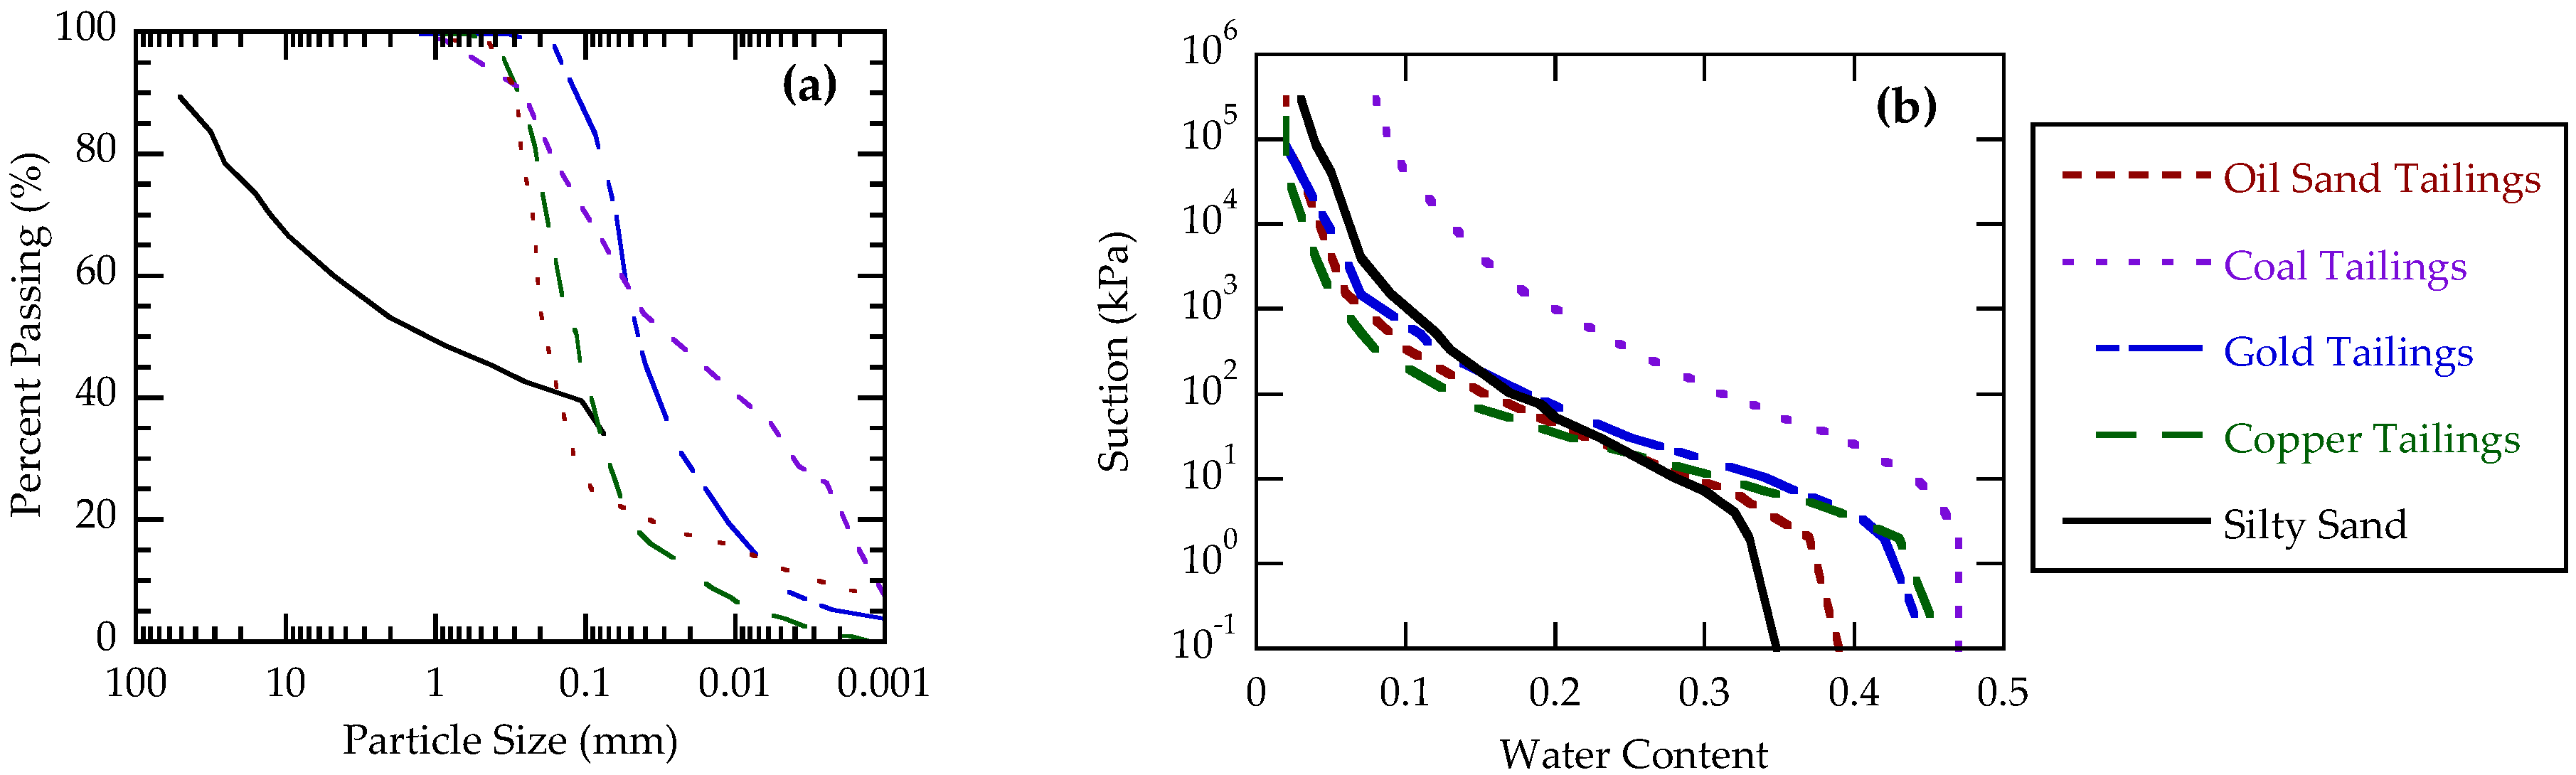
2.1. Soils and Mine Tailings

Geotechnical properties of the cover soils from Benson and Bareither [21] and mine tailings from Qiu and Sego [12] are summarized in Table 1. The particle-size distribution (PSD) of the silty-sand storage layer soil and four mine tailings are shown in Figure 1a. The silty-sand contained 33% gravel; however, all mine tailings contained only sand and fine-grained particles (Table 1). The fines content (particles < 0.075 mm) of the mine tailings ranged from 21% for oil sand tailings to 77% for gold mine tailings. Soil water characteristic curves (SWCCs) of the cover soils and mine tailings are shown in Figure 1b. These SWCCs were obtained from Qiu and Sego [12] and Benson and Bareither [21], and are shown in Figure 1b as SWCCs fitted with the van Genuchten [22] equation:
θ = θ r + ( θ s θ r ) [ 1 1 + ( α Ψ ) n ] m
where θ is volumetric water content, θs is saturated volumetric water content, θr is residual volumetric water content, Ψ is soil suction, α and n are fitting parameters, and m = (1 − 1/n). All van Genuchten parameters for the SWCCs shown in Figure 1b are compiled in Table 1.
The θs (which is equivalent to porosity) of copper, gold, and coal mine tailings were similar (0.45 to 0.47), whereas θs of the silty-sand and oil sand tailings were lower (Table 1). These lower θs were due to higher coarse-grained contents (i.e., sand and gravel). The air entry pressure (Ψa) of the silty sand, oil sand, gold, and copper mine tailings were similar and ranged from 5 to 6.9 kPa; however, the Ψa of coal mine tailings and top soil were higher (Table 1) due to the higher clay content of the coal tailings and high fines-fraction of the top soil.
Saturated hydraulic conductivity (ks) of the soils and mine tailings are also in Table 1. The ks of the silty sand, copper, and gold mine tailings were in a close range of 4.3 × 10⁻⁵ to 7.6 × 10⁻⁵ cm/s. The ks of coal mine tailings and top soil were approximately one order of magnitude lower (~2 × 10⁻⁶ cm/s) and ks of the oil sand mine tailings was two orders of magnitude lower (3 × 10⁻⁷ cm/s). The lower ks of coal and oil sand mine tailings is due to the higher clay fraction of these mine tailings (Figure 1a and Table 1). Saturated hydraulic conductivity was increased by one order of magnitude (modified ks) to be the representative of in-service, post-construction covers [23]. Details on the SWCC and ks measurements are provided in [12,21,24].

2.2. Water Balance Cover Design and Modeling

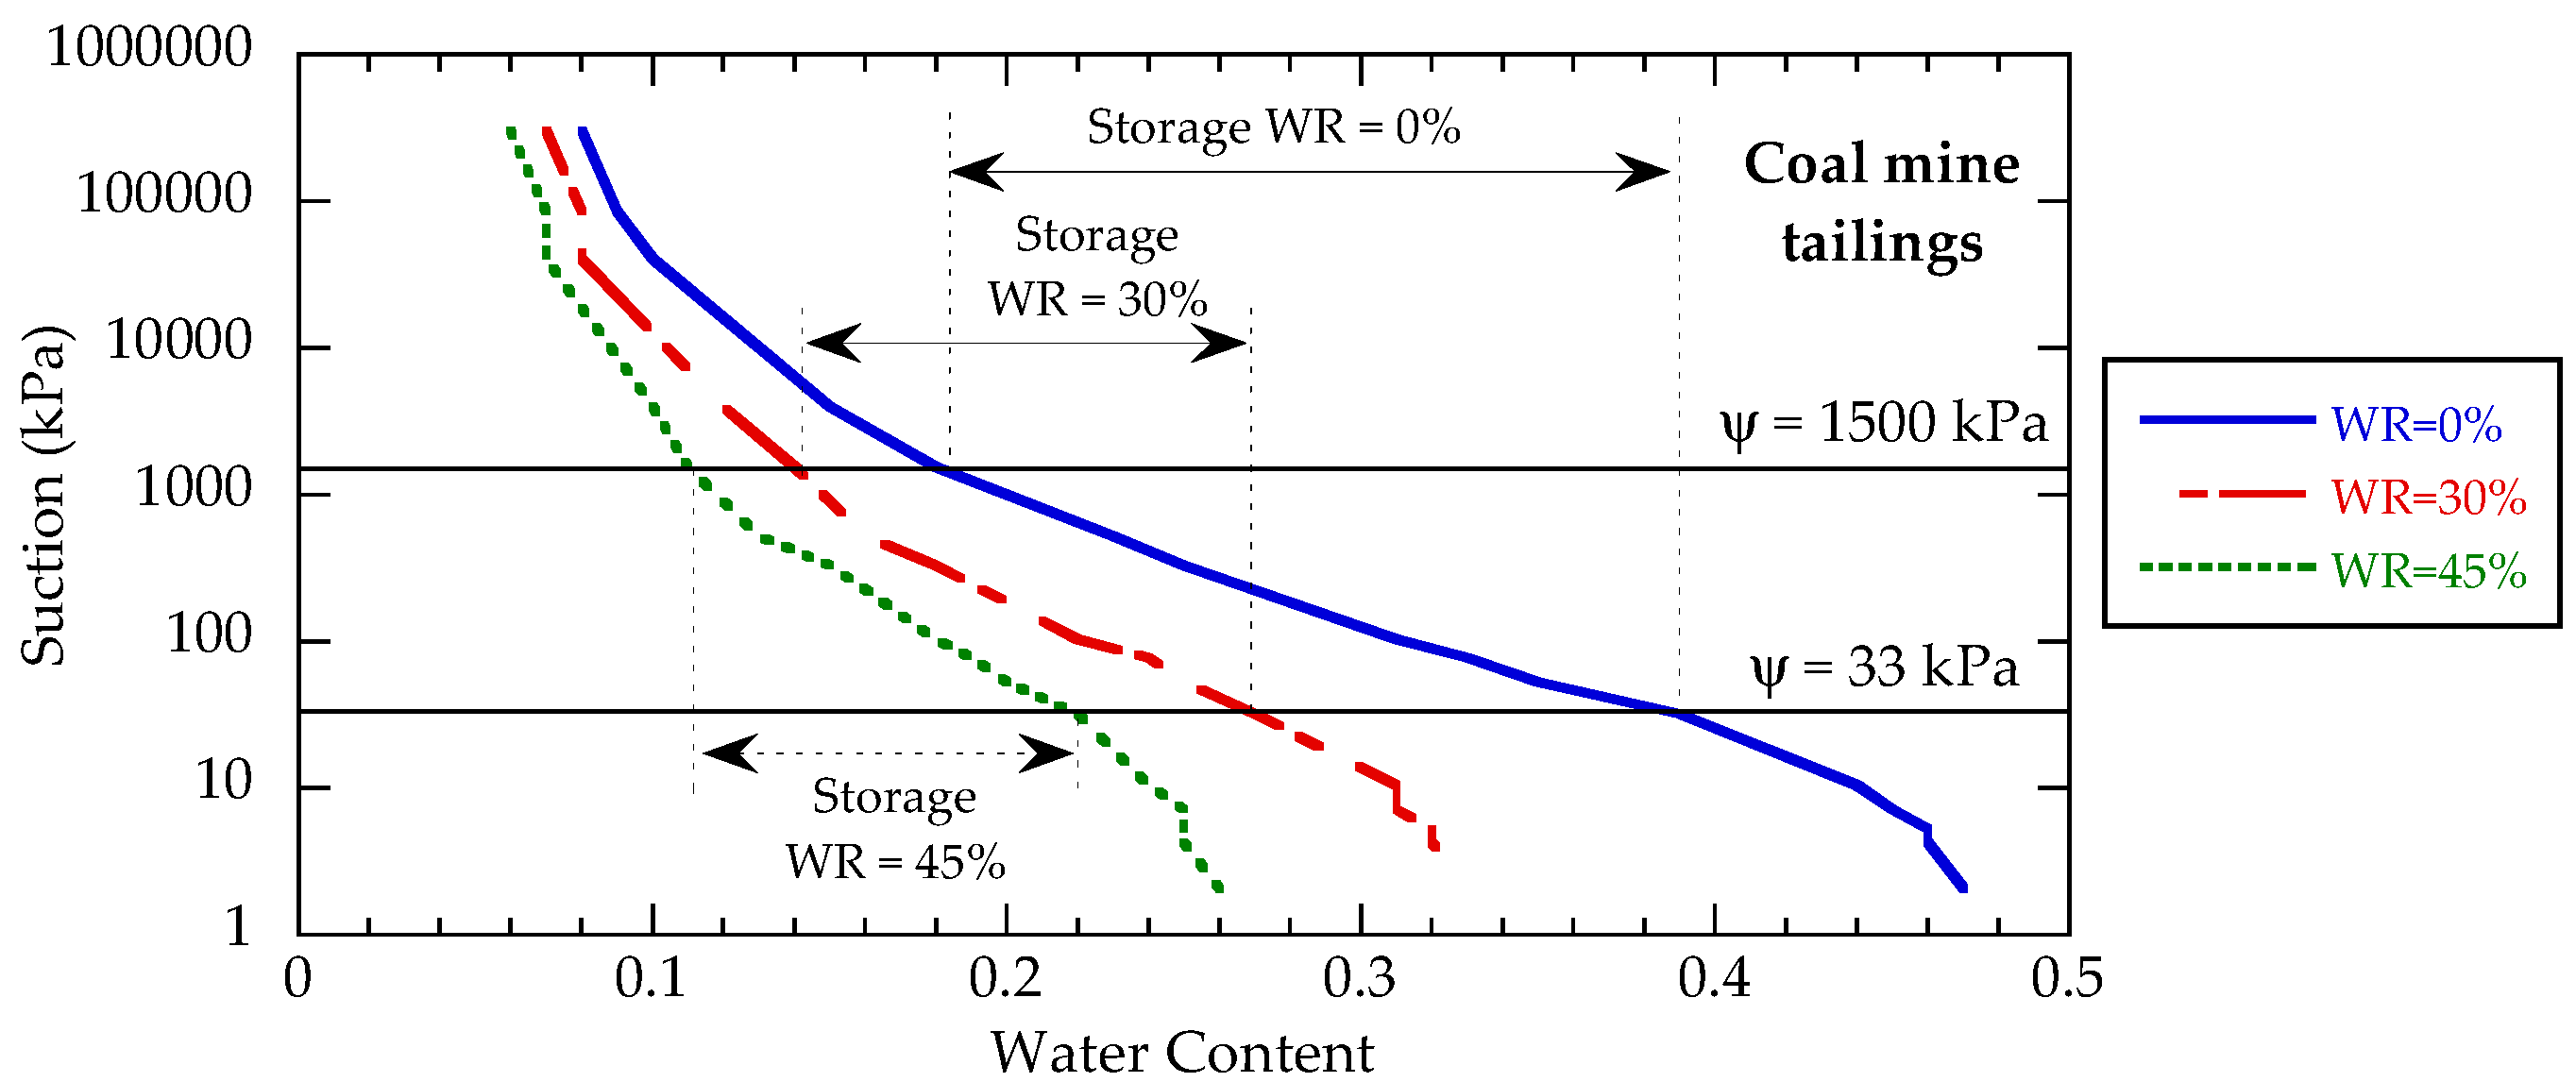
2.2.1. Storage Assessment

Design of a WBC includes (i) preliminary design and (ii) numerical modeling [2]. Preliminary design is completed to estimate the required cover thickness from a water storage analysis:
Δ S = P R β P E T L P r
where ∆S is soil water storage, P is precipitation, R is surface runoff, β is ET/PET ratio, PET is potential evapotranspiration, L is lateral drainage, and Pr is percolation. The required storage (Sr) for a WBC can be computed via summing storage (∆S in Equation (2)) for months where ∆S > 0 [2].
The available water storage (SA) in a given soil layer is computed as the difference between water content at field capacity and wilting point:
S A = H ( θ c θ m )
where θc is volumetric water content at field capacity (Ψ = 33 kPa), θm is volumetric water content at the wilting point (Ψ = 1500 kPa), and H is thickness of the water storage layer. The H in Equation (3) is optimized in a WBC design to determine a water storage layer meeting the requirement of SASr.

2.2.2. Water-Balance Modeling

Prior to construction of a WBC, water-balance modeling is completed to evaluate hydrologic behavior of the proposed WBC design. Water-balance modeling was completed in this study using the code WinUNSAT-H, which simulates variably saturated flow, root water uptake, and climatic interaction [24,25,26,27]. WinUNSAT-H is an implementation of the variably-saturated flow code UNSAT-H [28] used for near surface hydrology. When properly parameterized, WinUNSAT-H provides a reliable prediction of hydrology for WBCs, and modestly overpredicts percolation [26,27,29]. Water-balance modeling is typically completed for climate conditions representative of the wettest years or wettest periods (i.e., 5 to 10 sequential years) on record [2]. Water-balance metrics considered in the hydrologic performance of a WBC include runoff, evapotranspiration (ET), soil water storage (SWS), and percolation. Percolation often is the main parameter of interest to compare with prescribed percolation rates or regulatory thresholds for a given site. For example, the WBC at the solid waste site described in Benson and Bareither [21] has a maximum percolation rate of 4 mm/year. In general, an average annual percolation rate <3 mm/year is required for a WBC [21].
Variably-saturated flow in UNSAT-H is simulated via the modified-Richards’ Equation [25,28]:
θ Ψ Ψ t = z [ k T θ Ψ + k u + q v t ] S ( z , t )
where t is time, z is the vertical coordinate, ku is unsaturated hydraulic conductivity, kT = ku + k, where k is isothermal vapor conductivity, qvt is thermal vapor flux density, and S(z,t) is a sink term representing water uptake by vegetation. The relationship between θ and time at each node in a numerical simulation is obtained from Equation (4). The sink term was simulated by applying the transpiration demand among nodes in the root zone in proportion to the root density profile. Potential evapotranspiration (PET) is computed in WinUNSAT-H via the Penman [30] equation:
P E T = ( Δ R n Δ + γ ) + [ ( γ Δ + γ ) ( 0.27 ( 1 + U 100 ) ) ( e a e d ) ]
where Δ is the slope of the saturation vapor pressure–temperature curve, γ is the psychrometric constant, Rn is net solar radiation, U is average 24-h wind speed measured at 2 m above the ground surface, ea is saturation vapor pressure at mean air temperature, and ed is actual vapor pressure.
The θ-Ψ relationship (i.e., SWCC) and θ-ku relationship are required for variably-saturated flow. The θ-Ψ relationship was represented with Equation (1) and model parameters summarized in Table 1. The θ-ku relationship was simulated with the van Genuchten–Mualem function as:
k u = k s ( [ 1 1 + ( α Ψ ) n ] m ) λ [ 1 ( 1 [ 1 1 + ( α Ψ ) n ] ) m ] 2
where λ is the pore interaction term, which was assumed −2 for all simulations [31], and m = (1 − 1/n).

2.2.3. Test Site, Vegetation Characteristics, and Meteorological Data

The baseline WBC used in this study for comparison to covers composed of tailings and co-mixed WR&T is a monolithic cover located at a disposal site in the Western U.S. [21,24]. This WBC consisted of a 150-mm-thick top soil layer overlaying a 1220-mm-thick storage layer composed of silty sand (Table 1). Average annual precipitation for this site was 337 mm for 1949 to 2010 and average potential evapotranspiration was 842 mm [24]. Thus, the ratio of precipitation to potential evapotranspiration (P/PET) was 0.40, which is representative of a semi-arid climate in the Western U.S. and is comparable to a broad range of mining sites in the U.S. and throughout the world.
Vegetation characteristics for water-balance modeling were obtained from site-specific measurements reported in Benson and Bareither [21]. A leaf area index (LAI) of 1.42 and root density function from Bareither et al. [24] were used in all hydrologic models. The wilting point was set at 3532 kPa, the anaerobiosis point at 32 kPa, and the limiting point at 146 kPa [24,32].

2.2.4. Boundary and Initial Conditions

Boundary conditions included an atmospheric flux boundary for the cover surface and a unit gradient boundary at the base of the cover [24]. An initial water balance simulation was conducted with data from 2004 that was run 5-year sequentially to develop an initial θ-Ψ distribution for the cover profile to use as an initial condition [2]. Data from 2004 were used to represent a typical year within the 20-year period from 1990 to 2010 (period evaluated for this study) and favor a wetter initial soil profile such that percolation would not be underestimated.
An initial distribution of θ-Ψ was obtained for each model simulation that incorporated a different material used to represent the storage layer (e.g., mine tailings or WR&Ts). Each model conducted for this study included yearly simulations for each year in the 20-year data set from 1990 to 2010. Following the simulation in Year 1, initial conditions for each subsequent year (e.g., Year 2, 3, 4, etc.) were obtained from the final soil moisture profile at the end of the previous year. The 20-year water-balance model completed for the actual WBC was adopted from Bareither et al. [24] and is referred to herein as the Natural Cover. Full 20-year simulations were completed for each of the mine tailings used as a replacement material for the silty-sand water storage layer.

2.3. Water-Balance Covers Composed of Mine Waste

Water-balance models consisting of 20-year simulations for 1990–2010 were completed for the following scenarios: (i) mine tailings used to replace the 1220-mm-thick storage layer in the Natural Cover; (ii) co-mixed WR&T with different fractions of waste rock used to replace the 1220-mm-thick storage layer in the Natural Cover; and (iii) co-mixed WR&T with storage layer thickness adjusted to compensate for reduced storage due to waste rock particle inclusions. Storage layers in the water-balance models that consisted of pure tailings incorporated the hydrologic properties in Table 1. The ks of mine tailings storage layers were assumed unchanged by the inclusion of waste rock particles since the tailings fraction controls flow through the mixed material. The SWCC parameters were modified to account for a reduction in water storage capacity of the tailings fraction via inclusion of solid waste rock particles following recommendations in Bareither and Benson [33].
The effect of gravel content on ks of a fine-grained material was evaluated in Shelley and Daniel [34]. They reported that gravel addition did not considerably change ks of mixtures for gravel contents up to 50%, by mass. However, the addition of ≥60% gravel content increased ks 5 to 6 orders of magnitude. Wickland et al. [19] compared ks of tailings and WR&T mixtures that contained 80% waste rock, and reported similar ks for effective stress ≤20 kPa. This magnitude of effective stress is representative of WBCs [2]. Thus, ks was assumed unchanged by the addition of waste rock particles such that the finer, tailings matrix controlled flow for all water-balance simulations completed for this study.
Bareither and Benson [33] investigated the influence of gravel inclusions on the SWCC of sandy soils. They reported that the SWCC of material containing a coarser and finer fraction can be approximated based on (i) modifying θs of the mixed material in accordance with the Bouwer–Rice method [35] and (ii) using van Genucthen SWCC parameters (α and n) of the finer fraction. The Bouwer–Rice equation used to compute the corrected θs (θs-c) is
θ s - c = ( 1 V R ) θ s - f i n e
where θs-fine is θ of the finer soil fraction and VR is the volumetric fraction of coarse particles. Thus, for all co-mixed WR&T water storage layers simulated in this study, van Genuchten parameters tabulated for the mine tailings in Table 1 were used with θs-c computed based on Equation (7).
Waste rock and mine tailings mixtures can range from fine-dominated mixtures that consist predominantly of the tailings fraction, to coarse-dominated mixtures that consist predominantly of the waste rock fraction. The mixture ratio (R) commonly used for WR&T mixtures is defined as
R = M w r / M t
where Mwr is dry mass of waste rock and Mt is dry mass of tailings. The optimum mixture ratio (Ropt) is defined as a mixture where the finer fraction (tailings) just fills the void space between the coarse particles (waste rock). Co-mixed WR&T prepared at Ropt have been reported to have shear strength representative of the waste rock and hydrologic behavior representative of the tailings fraction [18]. An equation for Ropt is
R o p t = ( 1 + e t ) / e W R
where et is the tailings void ratio and eWR is waste rock void ratio. Equation (9) was developed assuming that the specific gravity of tailings and waste rock are the same and density of water = 1 g/cm3. Optimum mixture ratios were computed for each mine tailings via determining et that corresponded to θs and accounting for an eWR = 0.76, which was reported for a crushed gravel with a PSD representative of hard rock mine waste rock in a loose particle arrangement [18].
Two methods were evaluated in this study to redesign the water storage layer thickness for a co-mixed WR&T cover. In both methods, Sr was assumed constant since this was computed based on historical MET data, and SA was re-calculated. The first method, referred to as Method 1, followed the same design criteria as recommended in Albright et al. [2] with SA computed via Equation (3). Thickness of the storage layer including waste rock (HWR) was computed as
H W R = H N W R ( θ c - N W R θ m - N W R ) ( θ c - W R θ m - W R )
where HNWR is thickness of the storage layer with no waste rock, θc-NWR is volumetric water content of soil with no waste rock at field capacity, θm-NWR is volumetric water content of soil with no waste rock at the wilting point, θc-WR is volumetric water content of soil with waste rock at field capacity, and θm-WR is volumetric water content of soil with waste rock at the wilting point.
The second method, referred to as Method 2, was developed to maintain a consistent void volume between the pure tailings storage layers and storage layers consisting of WR&T. The redesigned storage layer thickness based on Method 2 was computed as
H N W R θ s - N W R = ( H W R ( 1 V R ) ) θ s - N W R H W R = H N W R 1 V R
where θs-NWR is saturated volumetric water content of a tailings layer with no waste rock and VR is the volumetric fraction of coarse material (i.e., waste rock).
A summary of the co-mixed WR&T storage layers redesigned following Methods 1 and 2 is in Table 2. Methods 1 and 2 were applied to redesign storage layers containing coal mine tailings with VR = 30% and 45%, whereas only Method 2 was used to redesign storage layers containing copper mine tailings with VR = 30% and 45%. An example of the Method 1 redesign procedure for coal mine tailings is shown in Figure 2. The difference in volumetric water contents used to compute SA (θcθm) for the storage layer with only coal mine tailings was 0.20 (Figure 3). This difference (θcθm) decreased to 0.135 and 0.102 for coal mine tailings with 30% and 45% waste rock addition, respectively (Figure 2). The storage layer thickness for each of the 30% and 45% waste rock additions was computed via Equation (11) to yield thicknesses reported in Table 2. As anticipated, higher waste rock content led to an increase in storage layer thickness due to reduced water storage of the material.
The Method 2 redesign procedure is independent of soil type in the storage layer and only depends on waste rock content and initial θs (Equation (11)). The redesigned storage layer thickness with coal mine tailings based on Method 2 with 30% waste rock was 1740 mm and with 45% waste rock was 2220 mm. Method 2 yielded thinner cover thicknesses in comparison with Method 1 (i.e., reduced thickness by 70 and 170 mm) for both waste rock contents simulated with the coal tailings.

3. Results

3.1. Fixed Storage Layer Thickness Composed of Mine Tailings

Water-balance metrics predicted by WinUNSAT-H for the 20-year simulations on the Natural Cover and WBCs that included pure mine tailings are compiled in Table 3. Annual average precipitation was 331.8 mm for the 20-year period, which was higher than the annual average evapotranspiration (ET) for all five simulated WBCs. The higher precipitation relative to ET resulted in runoff, percolation, and/or an increase in average soil water storage (SWS).
Relationships between ks and annual average runoff, ET, and percolation for the silty-sand cover and four WBCs with mine tailings are shown in Figure 3. The higher annual runoff predicted for the oil sand tailings cover resulted from a low ks (Figure 3a) combined with large precipitation events that occurred over a short time. Runoff was relatively low since the models were designed to be conservative, which led to reduced runoff and increased percolation and SWS. Runoff was <0.7% of total precipitation in the oil sand tailings cover and runoff was <0.07% for all other models. Thus, the effect of runoff on hydrologic performance of the WBCs in this study was considered negligible.
Annual average ET of the Natural Cover and four WBCs with mine tailings ranged from 314.9 to 329.6 mm/year (Table 3) and increased with decreasing ks (Figure 3b). The potential ET for each simulation was independent of cover soil and calculated with the Penman–Monteith equation in WinUNSAT-H. Evapotranspiration for the different covers was a function of how fast water could be delivered to the soil surface via evaporation and the accessibility of water to plant roots for transpiration. Evapotranspiration was in a similar range for the Natural Cover, gold tailings, and copper tailings since these materials had comparable ks (Figure 3b). The trend line in Figure 3b suggests that a modest decrease in ET can be anticipated with a decrease in ks when all other water-balance modeling factors are held constant (e.g., meteorological data, vegetation data, etc.).
The relationship between average annual percolation and ks in Figure 3c suggests that larger ks facilitated water movement from the top to the bottom of the cover profile that led to higher percolation rates. These results are in agreement with Zornberg et al. [6].
Temporal trends of percolation during the 20-year simulation period for the Natural Cover and four WBCs that included pure mine tailings are shown in Figure 4. The 3 mm/year percolation rate line in Figure 4 corresponds to a typical upper-bound percolation rate [2] and the 4 mm/year line corresponds to the regulatory threshold for the Natural Cover. All WBCs simulated with mine tailings for the 1220-mm-thick storage layer met the 4 mm/year percolation rate, and only copper tailings exceeded the 3 mm/year percolation line for the 20-year simulation. The other three mine tailings WBCs (i.e., gold, coal, and oil sand tailings), as well as the Natural Cover, all met the 3 mm/year percolation rate threshold for the 20-year simulation period.
Pronounced periods of percolation occurred in Years 6 and 9 (Figure 4) for the Natural Cover and WBCs with gold and copper tailings. These periods of high percolation were preceded by years of high precipitation (i.e., precipitation = 412 mm in Year 5 and 526 mm in Year 8) that resulted in a higher degree of saturation in the water storage layers. Higher saturation yields less available water storage capacity and leads to increased percolation with subsequent precipitation events [24].
Cumulative percolation from the WBC simulated with oil sand tailings as the storage layer was 0 mm (Table 3). Although oil sand tailings had the lowest storage capacity (θs in Table 1), the one- to two-order of magnitude lower ks for oil sand tailings (2.7 × 10⁻⁷ cm/s) compared to all other materials (Table 3) contributed to the zero percolation. The influence of ks on percolation was also observed in percolation predicted from WBCs with coal and copper tailings. These two materials had nearly identical volumetric storage capacity (θs = 0.46 and 0.47); however, ks for coal tailings was over 60 times smaller than ks for copper tailings. Additionally, coal tailings had a high Ψa, which when combined with the lower ks resulted in a storage layer with reduced ability to convey water. This comparison highlights the importance of variation in hydraulic parameters between storage layer materials that have similar volumetric storage capacity.
The relationship between Ψa and n (van Genuchten fitting parameter) versus average soil water storage and average saturation of in the cover soil is shown in Figure 5. Water storage and saturation increased with an increase in Ψa and/or decrease in n. Air entry pressure is the minimum applied pressure required to drain the largest pores in the soil, and n is related to the pore size distribution in the soil. A larger Ψa and lower n mean that the soil has a higher moisture holding capacity via smaller and more uniformly-sized pores. A soil with low moisture capacity results in lower storage in the storage layer and a greater ability to drain water at the bottom of the cover. Coal mine tailings had the highest storage capacity and average saturation due to the highest air entry pressure and lowest n. Copper mine tailings had the lowest soil water storage and average saturation due to a high sand content (≈70%) and no clay, which results in a lower field capacity water content.
An average percolation rate ranging between 0.0 and 3.2 mm/year suggests that the mine tailings considered in this study meet the percolation requirement for WBCs. Hard rock mine tailings (e.g., copper and gold mine tailings in this study) typically classify as low plasticity silt and contain 33% to 100% fine-grained particles [36], which are similar characteristics to materials typically used in WBCs. Covers simulated with coal and oil sand tailings had low percolation rates due to higher clay contents (clay = 26% for coal tailings and 9% for oil sand tailings). In general, WBCs constructed with tailings with high clay contents (e.g., coal and oil sand tailings in this study) result in low percolation rates. However, post-construction changes (biota intrusion, freeze-thaw, and wetting-drying cycles) should be considered due to the propensity for clayed materials to change with time [23].

3.2. Fixed Storage Layer Thickness Composed of Tailings and Waste Rock

The second task in this water-balance model analysis was to replace the storage layer soil of the Natural Cover with WR&T. These models were completed with a fixed storage layer thickness of 1220 mm that was simulated with WR&T. Waste rock and gravel particles were assumed to act as inclusions in the finer fraction with zero water retention capacity to correct SWCCs of the mine tailings and silty-sand storage layers [33]. Hydraulic conductivity of the WR&T and silty-sand with additional gravel content were assumed constant based on literature [19,34].
A summary of the water-balance models completed for the evaluation with a fixed storage layer thickness of 1220 mm is in Table 4. Each model simulation that included a waste rock content (or gravel for the silty-sand cover) above the baseline content (i.e., 0% for all mine tailings and 33% for the silty-sand cover) required a corrected SWCC. Examples of corrected SWCCs for coal mine tailings with 0, 15, 30, 45, and 71.3% waste rock addition are shown in Figure 6. These corrected SWCCs include the same van Genuchten fitting parameters (α and n) as the baseline SWCC with 0% waste rock, but with θs corrected in accordance with Equation (7). An increase in waste rock content yielded a decrease in θs that also decreased the available storage capacity for a constant thickness (Equation (3)).
Average annual water-balance metrics for the 20-year model simulations summarized in Table 4 include runoff, ET, percolation, average SWS, and average degree of saturation of the storage layer soil. The addition of waste rock particles decreased porosity and correspondingly reduced storage capacity. Thus, the simulations summarized in Table 4 indicate a reduction in average SWS, increase in saturation, and increase in percolation with increase in waste rock content. However, percolation of oil sand tailings WBCs remained negligible with increasing waste rock content for all simulations.
The relationships between average annual ET and waste rock content for the silty-sand cover and all co-mixed WR&T WBCs are shown in Figure 7. The annual average ET was approximately constant with varying waste rock content (315 to 334 mm/year). As discussed previously, the potential ET was constant for each model as this was a function of MET data, and the actual ET varied as a function of ks (Figure 3b). Considering ks of the storage layer was assumed constant for varying waste rock content, there was no observable trend between ET and waste rock content (Figure 7).
Temporal trends of percolation for the WBC simulations on the Natural Cover, copper mine tailings cover, and coal mine tailings cover with different waste rock contents are shown in Figure 8. Percolation increased with an increase in waste rock content when the storage layer thickness was fixed. This was attributed to reduced storage capacity when fine-grained, water-retaining material is replaced with waste rock particle inclusions with zero water retention capacity. However, addition of waste rock to the WBCs did not considerably affect percolation rate in the first 5 year.
The influence of waste rock addition on percolation was more pronounced from Year 6 to the end of the 20-year simulation period (Figure 8). The percolation in Year 6 followed a year when SWS increased, resulting in elevated saturation and higher propensity for percolation [24]. From Year 6 to the end of the 20-year simulation, higher saturation within the storage layers combined with reduced storage capacity via waste rock addition increased percolation. These observations suggest that the addition of waste rock to the storage layer of a WBC may become detrimental to meeting percolation rates in years following high precipitation that can leave little remaining SWS capacity.
Water-balance simulations on oil sand tailings with varying waste rock content did not follow these observed relationships between reduced SWS and increased percolation (Table 4). Total percolation in the oil sand tailings simulations was 0 mm for all waste rock contents evaluated (Table 4). This exception in observed behavior was attributed to the low ks of the soil sand tailings that compensated for the reduced storage capacity such that no percolation was simulated.
Relationships between annual average percolation and waste rock content for the silty-sand cover and three mine tailings WBCs simulated with co-mixed WR&T are shown in Figure 9a. Data in Figure 9a support the observation of an increase in percolation with increase in waste rock content for WBCs simulated with a fixed storage layer thickness. The linear trend lines fitted for the Natural Cover, copper tailings cover, and coal tailings cover, all yielded coefficients of determination (R2) > 0.83, which supports the observed effect of increased percolation with reduced SWS capacity due to the addition of waste rock.
Although the addition of waste rock to the storage layer of WBCs increases percolation, numerous of the water-balance simulations that included waste rock met the 3 and 4 mm/year percolation thresholds (Figure 9a). The rate of increase in percolation with waste rock addition (i.e., slopes of trend lines in Figure 9a) can be used to assess the amount of waste rock addition that is reasonable to meet a prescribed percolation. Larger trend line slopes in Figure 9a suggest a higher sensitivity of percolation with waste rock addition. Slopes of the trend lines in Figure 9a are plotted versus ks of the fine-grained fraction in Figure 9b. Data in Figure 9b and the logarithmic trend line suggest that the rate of increase in percolation with addition of waste rock is larger for storage layer materials that have higher ks. As a result, percolation in WBCs with finer-grained particles (e.g., oil sand tailings and coal mine tailings) that typically have lower ks are less sensitive to waste rock addition in comparison with covers constructed with coarser-grained materials (e.g., copper and silty-sand soil).

3.3. Adjusted Storage Layer Thickness Composed of Tailings and Waste Rock

An alternative approach to meeting a prescribed percolation rate with the addition of waste rock to a storage layer with WR&T is to redesign the storage layer thickness to meet the required percolation rate. As discussed previously, the storage layer thickness of WBCs created from coal and copper tailings were redesigned following two methods: Method 1—thickness re-computed via Equation (3) to maintain a constant SA with modified SWCC parameters, and Method 2—thickness recomputed to maintain a constant void volume to the waste rock-free storage layer (Table 2). A summary of the redesigned WBCs for coal tailings and copper tailings is in Table 2 along with average annual percolation obtained from the 20-year simulations. Water-balance covers redesigned for copper tailings only are included for Method 2 since both methods yielded similar storage layer thicknesses.
Temporal trends of percolation for WBCs simulated with only coal mine tailings (height = 1220 mm), with 30% and 45% waste rock plus fixed height (height = 1220 mm), and with 30% and 45% waste rock plus adjusted height with Method 1 (height = 1810 mm and 2390 mm, respectively) and Method 2 (height = 1740 mm and 2220 mm, respectively) are shown in Figure 10a,b. The total percolation for coal mine tailings with no waste rock was 4.0 mm and percolation increased with waste rock addition and no change to the thickness of the storage layer (i.e., percolation = 5.2 mm for 30% waste rock and 16.6 mm for 45% waste rock). The redesigned WBC thickness following with both Method 1 and Method 2 decreased percolation relative to the constant thickness WBC with waste rock (Figure 10a,b). Results from coal mine tailings suggest that the redesigned WBCs can yield comparable low percolation rates in comparison with WBCs containing no waste rock.
Temporal trends of percolation for WBCs simulated with only copper mine tailings (height = 1220 mm), with 30% waste rock plus fixed height (height = 1220 mm), and with 30% and 45% waste rock plus adjusted height with Method 2 (height = 1770 mm and 2350 mm, respectively) are shown in Figure 10a,b. The redesigned WBCs thicknesses with coal mine tailings and waste rock yielded lower total percolation relative to WBCs with waste rock and a fixed thickness. Results from copper mine tailings analysis further support that comparable percolations rates can be achieve with WR&T WBCs when the storage layer is redesigned to account for the reduced storage capacity due to the waste rock inclusions.

3.4. Contribution to the Circular Economy and Mining Sustainability

The U.S. EPA has outlined the following waste management hierarchy that progresses with decreasing impact on sustainability: (i) prevention of waste generation, (ii) reuse of waste, (iii) recycling of waste, (iv) recovery from waste, and (v) disposal of waste [37]. In applying this hierarchy to mine tailings and waste rock, the prevention of mine waste generation is the most sustainable option. Preventing the generation of mine waste reduces costs associated with transferring waste, reduces the land area required for waste disposal, and reduces costs associated with monitoring the closed waste impoundment. Preventing waste generation is not always a viable option, and implementing measures to reuse and recycle mine waste are more practical options to enhancing sustainability of mine waste management. McLellan et al. [38] emphasized the role of reuse and recycling in mine waste management and considered reuse and recycling of mine waste as a “key elements” for a sustainable waste management practice in mineral industry. The reuse opportunity central to this paper is the reuse of mixed WR&T in WBCs, which can be financially beneficial and reduce landfilled waste via offsetting the amount of waste to be managed. Creating WBCs from mixed mine waste can also create employment in new industries and raise a given mine’s image in society for protecting the environment. Recovery of mine waste is also a sustainable option that involves recovery of economically viable minerals from older mine waste that been processed [39].
Lottermoser [37] listed the following potential reuse and recycling options for mine waste rock: (i) resource for additional extraction of minerals and metals; (ii) backfill material for open voids; (iii) landscaping materials; and (iv) additive to asphalt. Lottermoser [37] and Corder [40] identified the following potential reuse and recycling options for tailings: (i) resource for additional extraction of minerals and metals; (ii) cement-amended tailings for use as backfill in underground mines; and (iii) clay-rich tailings amendment for sandy soils for manufacturing of bricks, cement, floor tiles, sanitary ware, and porcelain. Many of these applications are not located on the mine site, which can limit their economic benefit and overall impact on mining sustainability and the circular economy.
The possibility of reusing mixed WR&T as the storage layer in WBCs was evaluated in this study. When compared to the other reuse and recycling applications listed previously, WBCs that employ mixed WR&T focus on waste reuse at the mine site, which limits potential off-site contamination and exposure to humans and the environment. On-site reuse reduces costs associated with transporting and handling these waste sources off-site for other uses and reduces costs associated with acquiring raw materials for site closure. Additional investigations are needed to evaluate the leaching of contaminants from WR&T mixtures, mechanical properties of WR&T mixtures, and potential to sustain vegetation in WR&T. These investigations need to be coupled with full-scale cover tests sections to transform the potential reuse of mixed WR&T in cover systems to a viable solution for sustainable mine closure.

4. Conclusions

Water-balance modeling was conducted to evaluate the viability of using mixed waste rock and tailings (WR&T) as the water storage layer in water balance covers (WBCs). Theoretical WBCs were created with (i) mine tailings and (ii) mixed WR&T to assess the effect of waste rock addition on hydrologic performance. Two methods for redesigning the storage layer of a WBC were evaluated that consist of mixed WR&T to yield comparable percolation rate as covers with no waste rock inclusions. The following conclusions were drawn from this study.
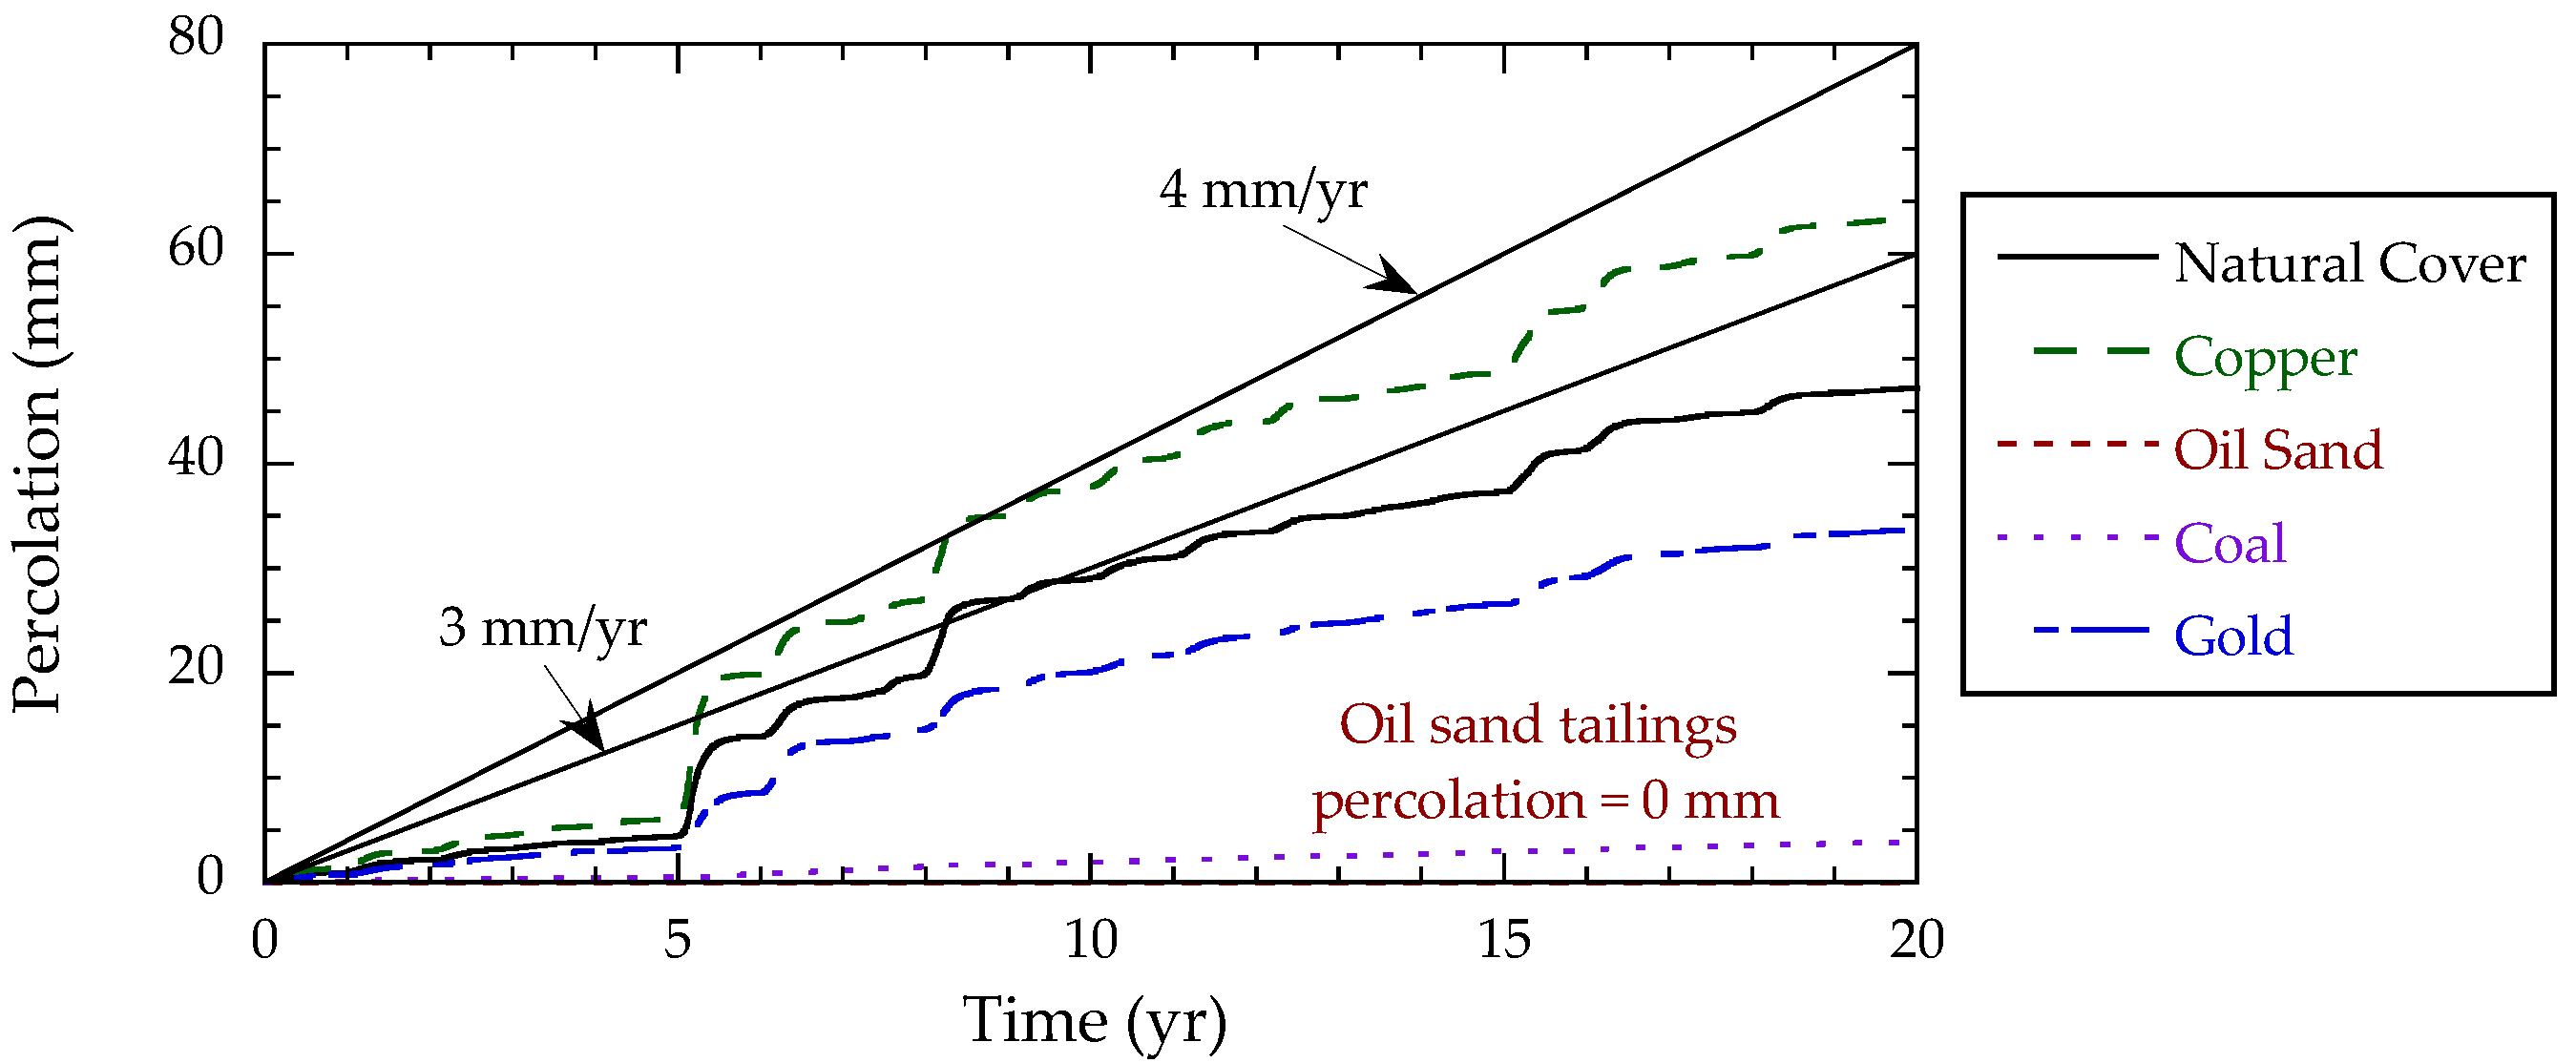
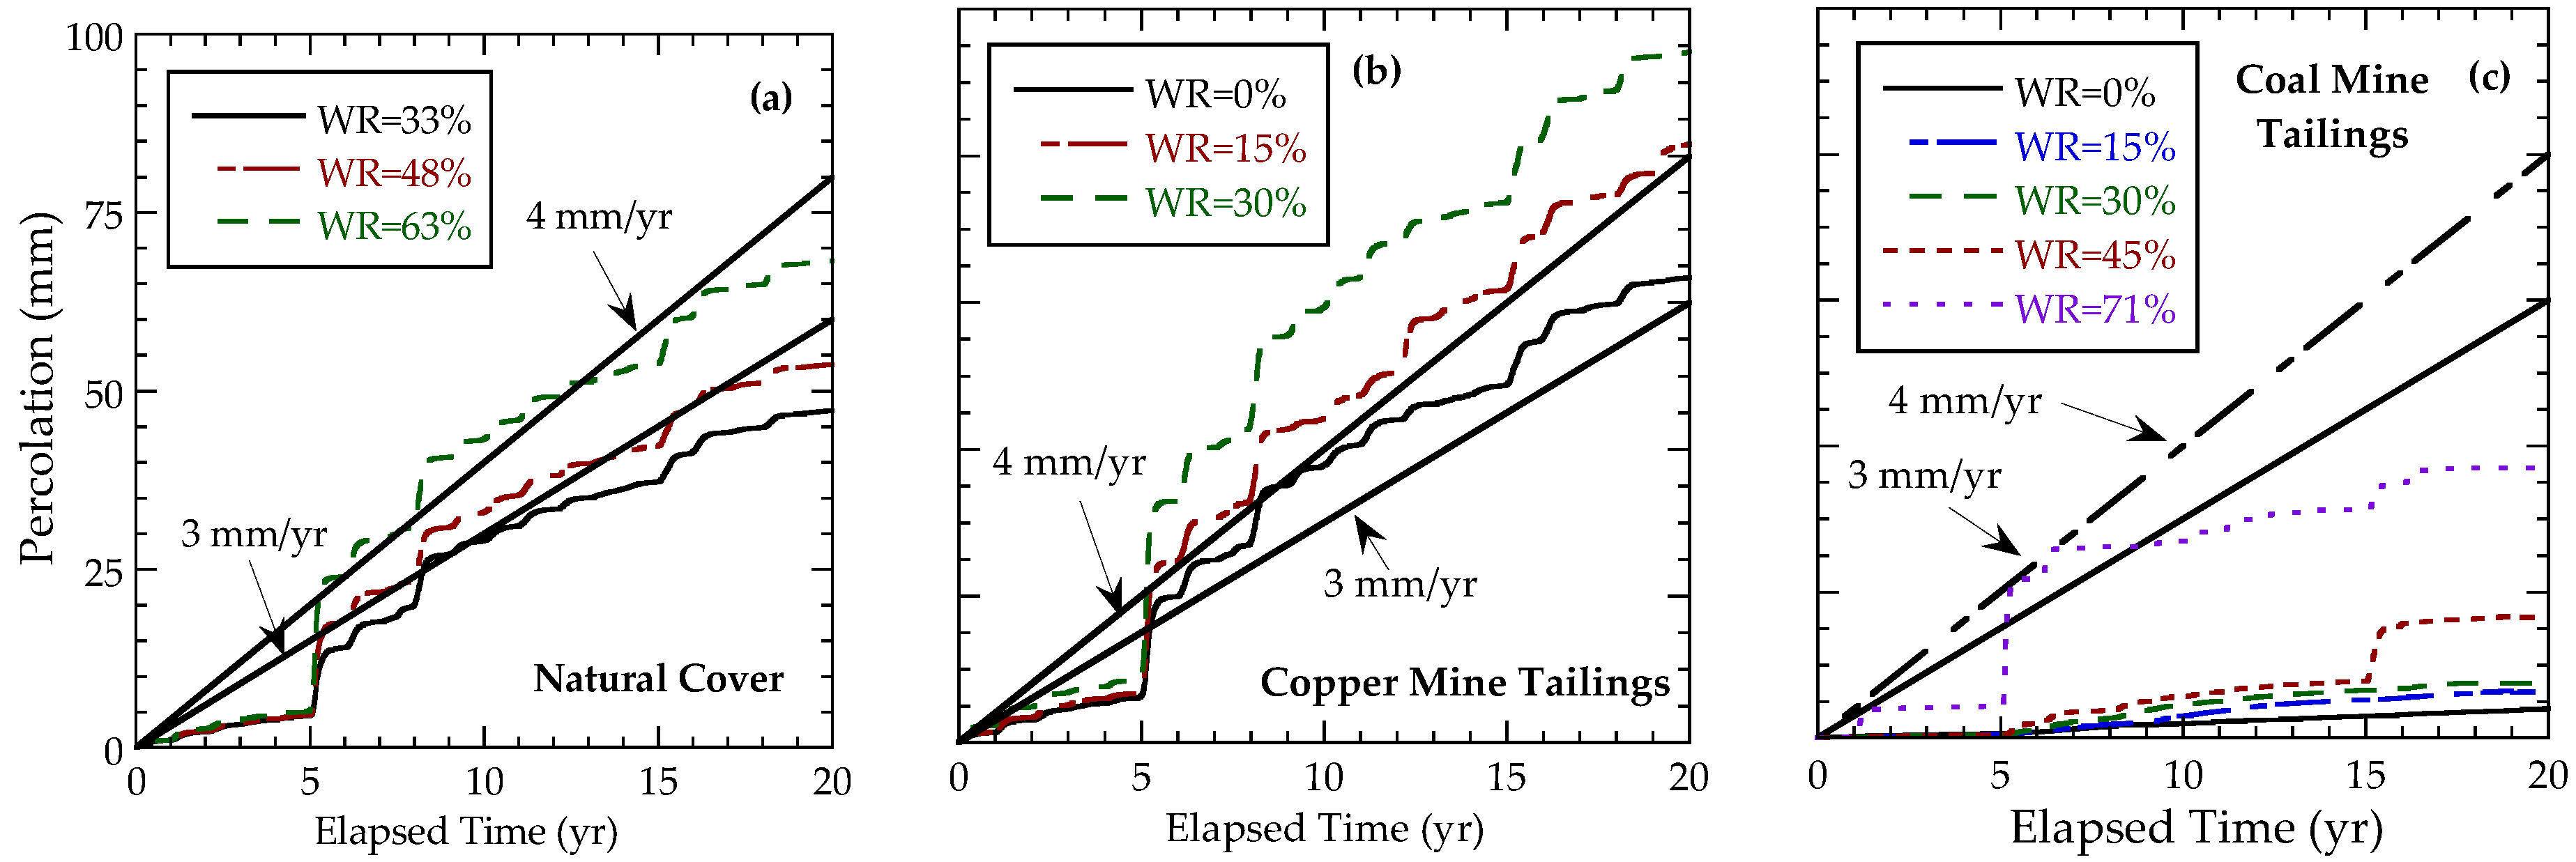
  • Percolation rates for WBCs simulated with hard rock mine tailings met the prescribed percolation rate of the Natural Cover (i.e., 4 mm/year). Lower percolation rates were representative of tailings with higher clay content and lower hydraulic conductivity (ks).
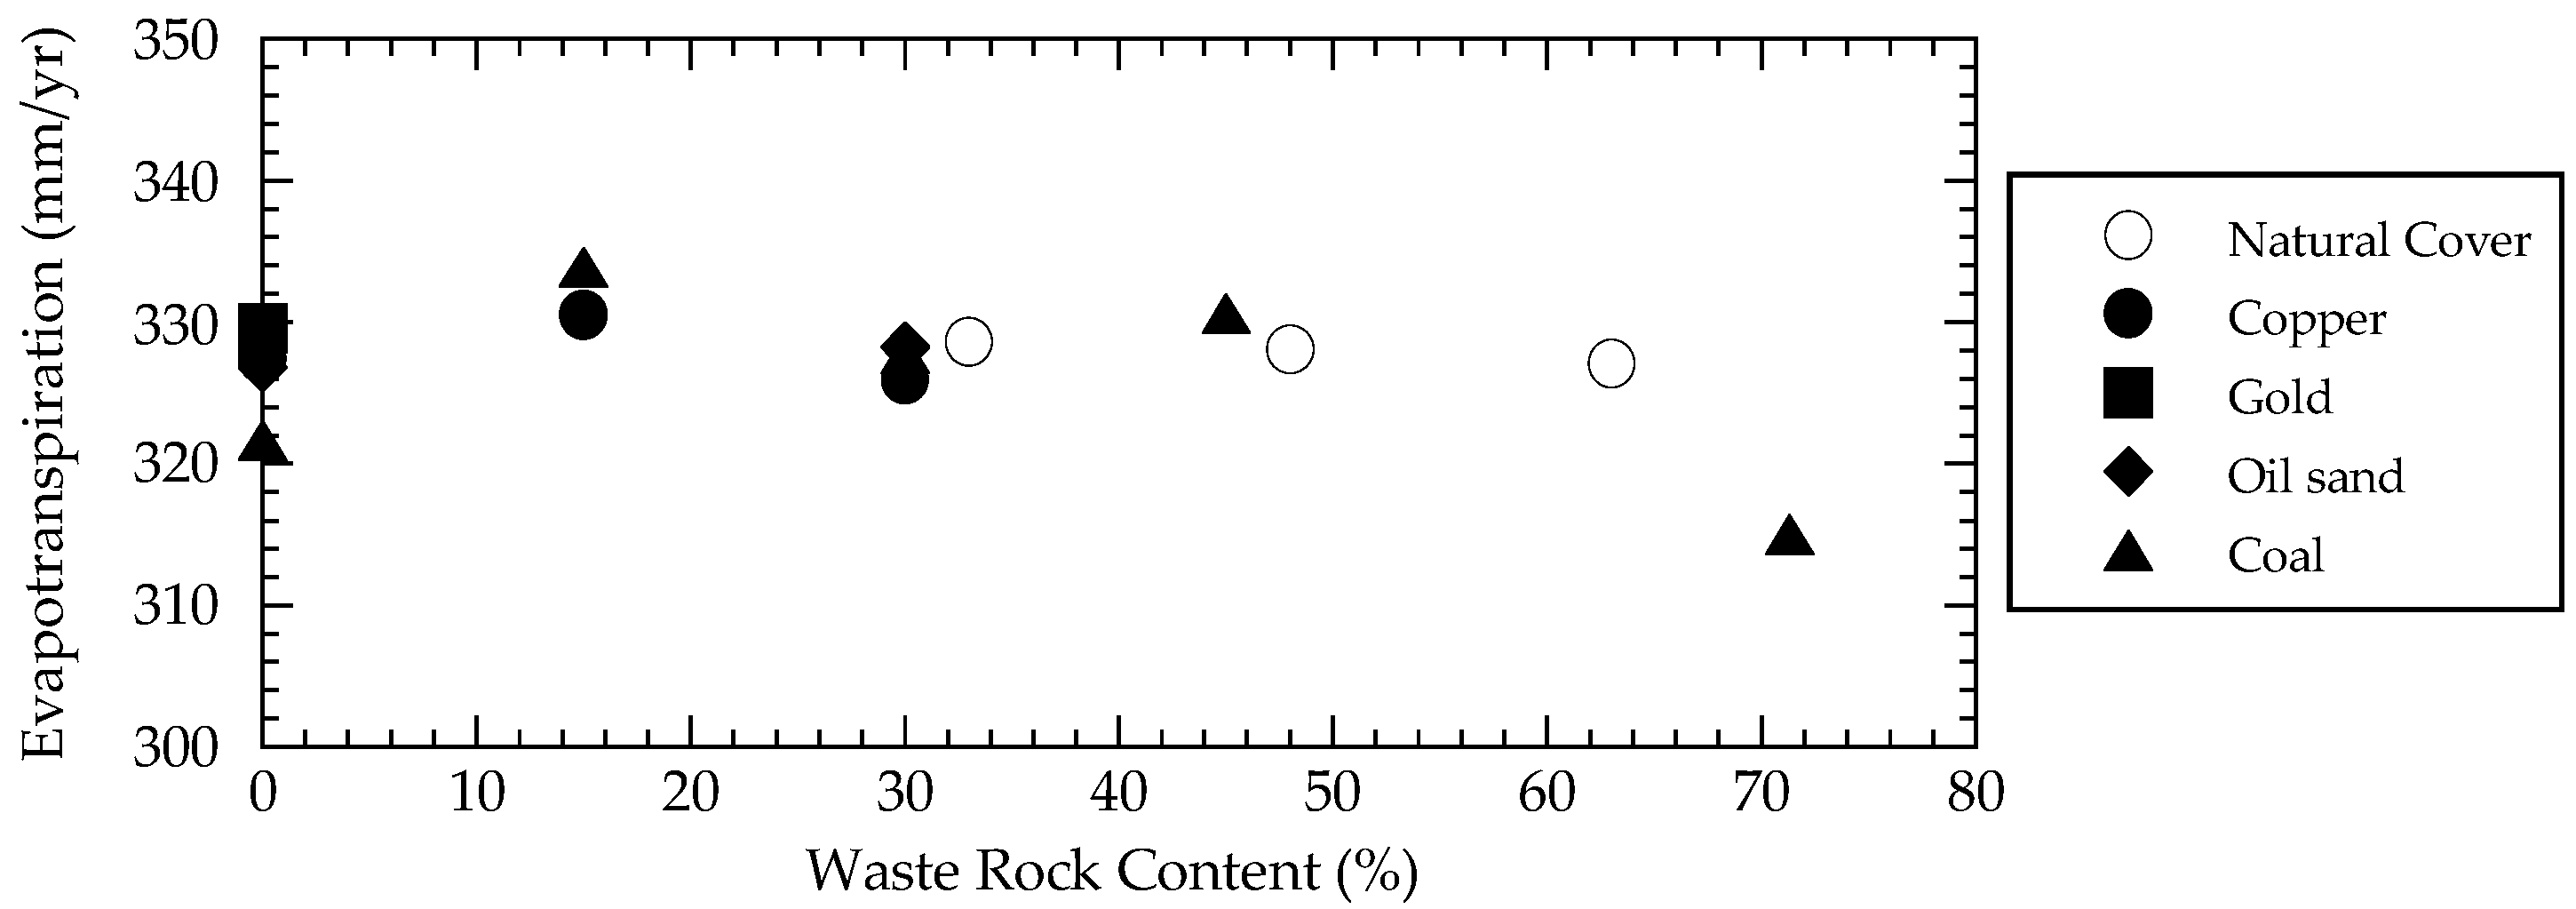
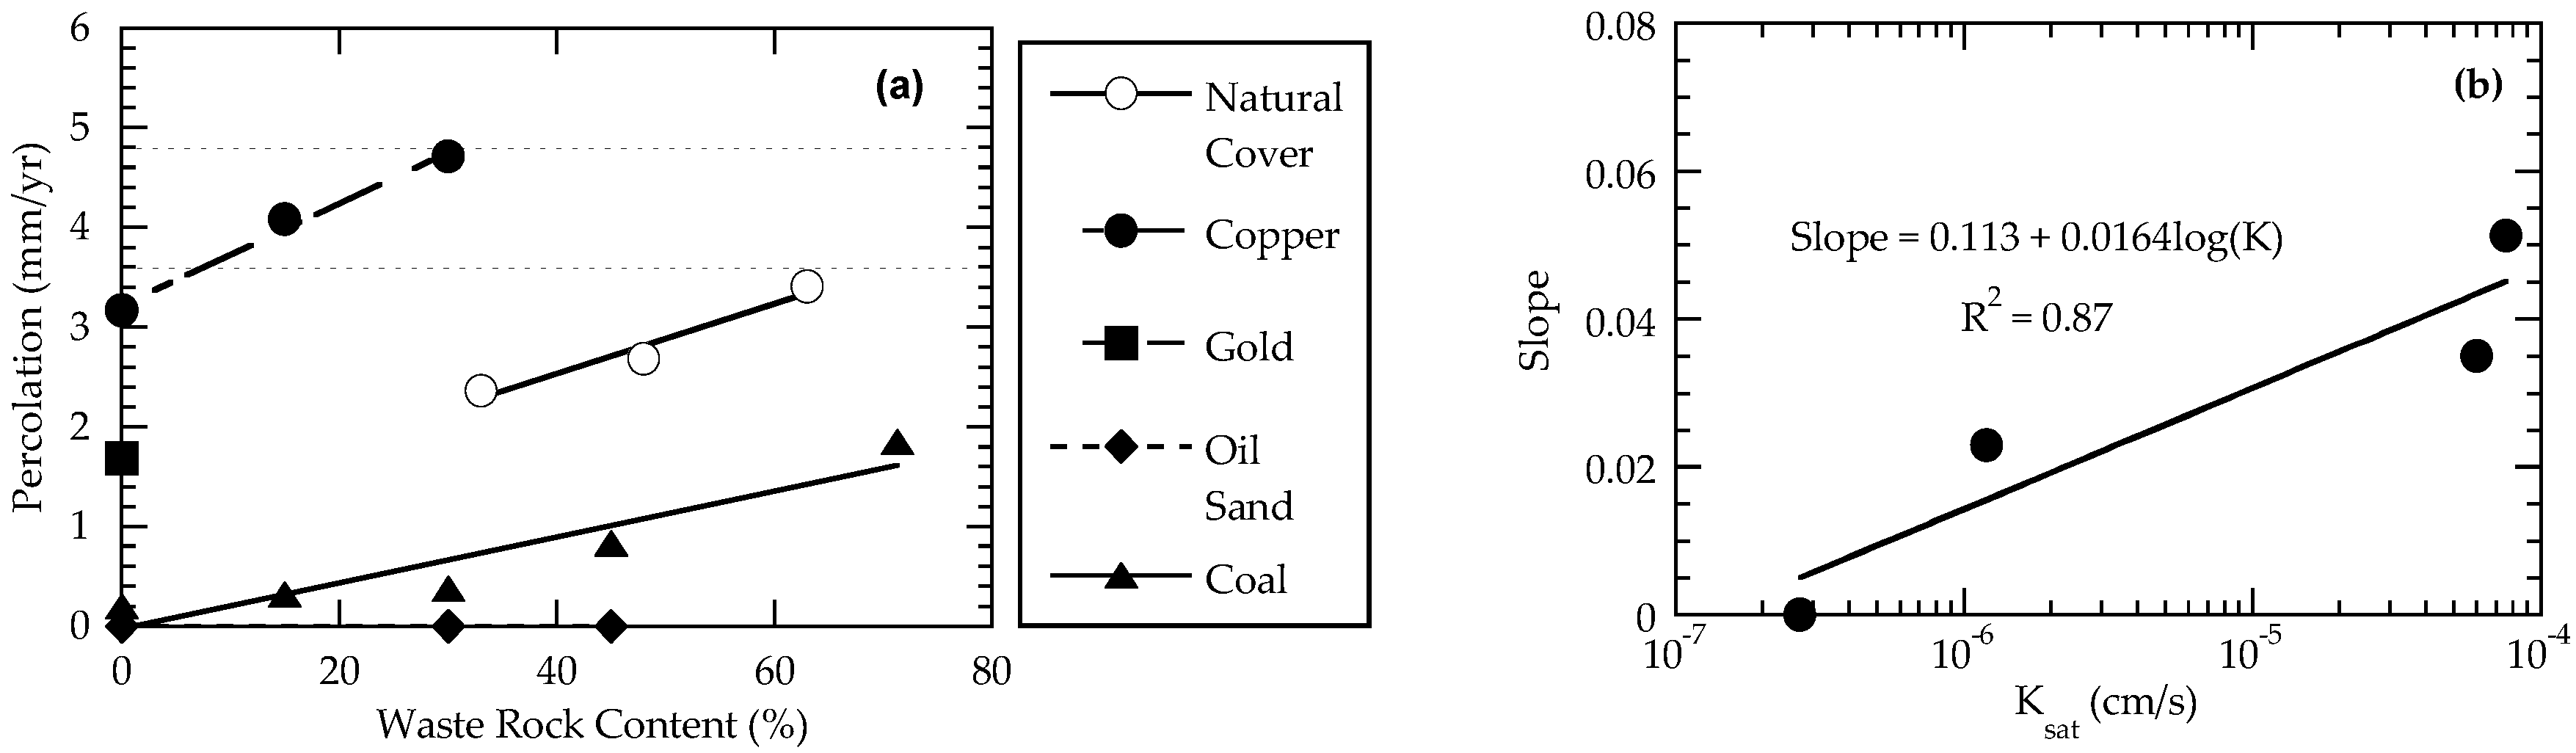
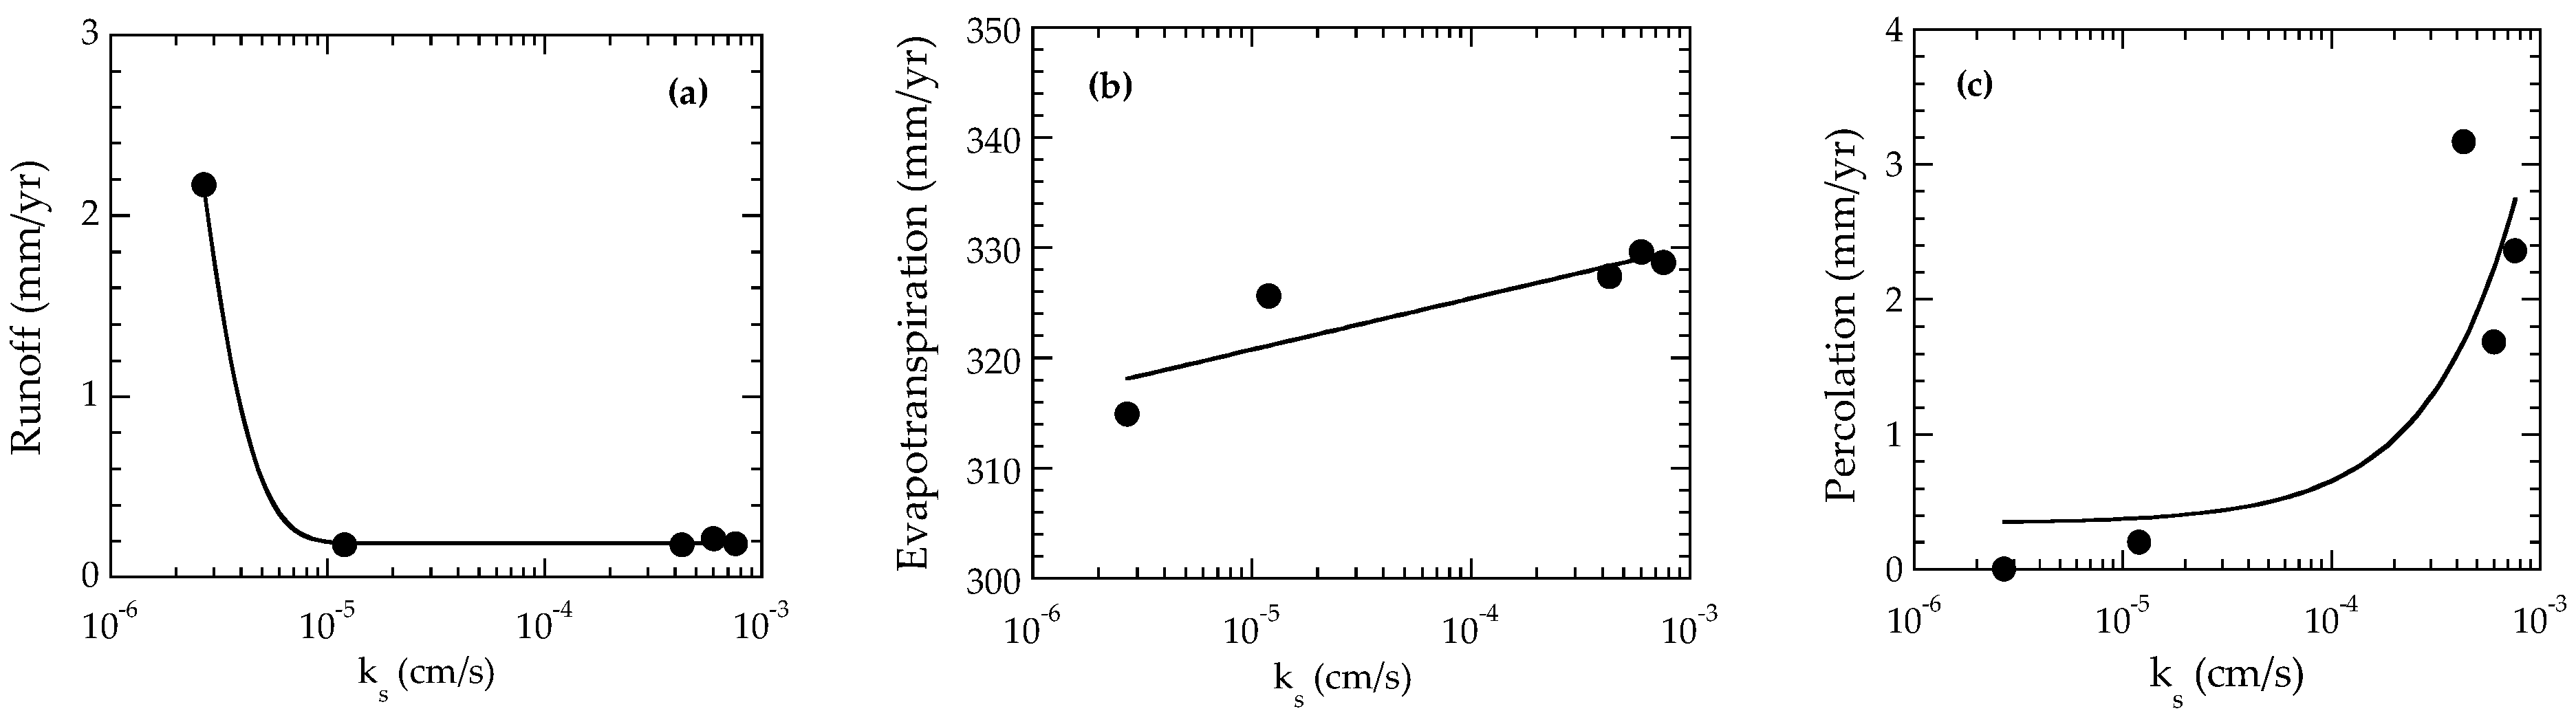
  • Evapotranspiration and percolation increased and runoff decreased with an increase in ks of the storage layer. Storage layers with larger ks results in faster infiltration through the cover (percolation) and faster transfer of water out of the soil via evapotranspiration.
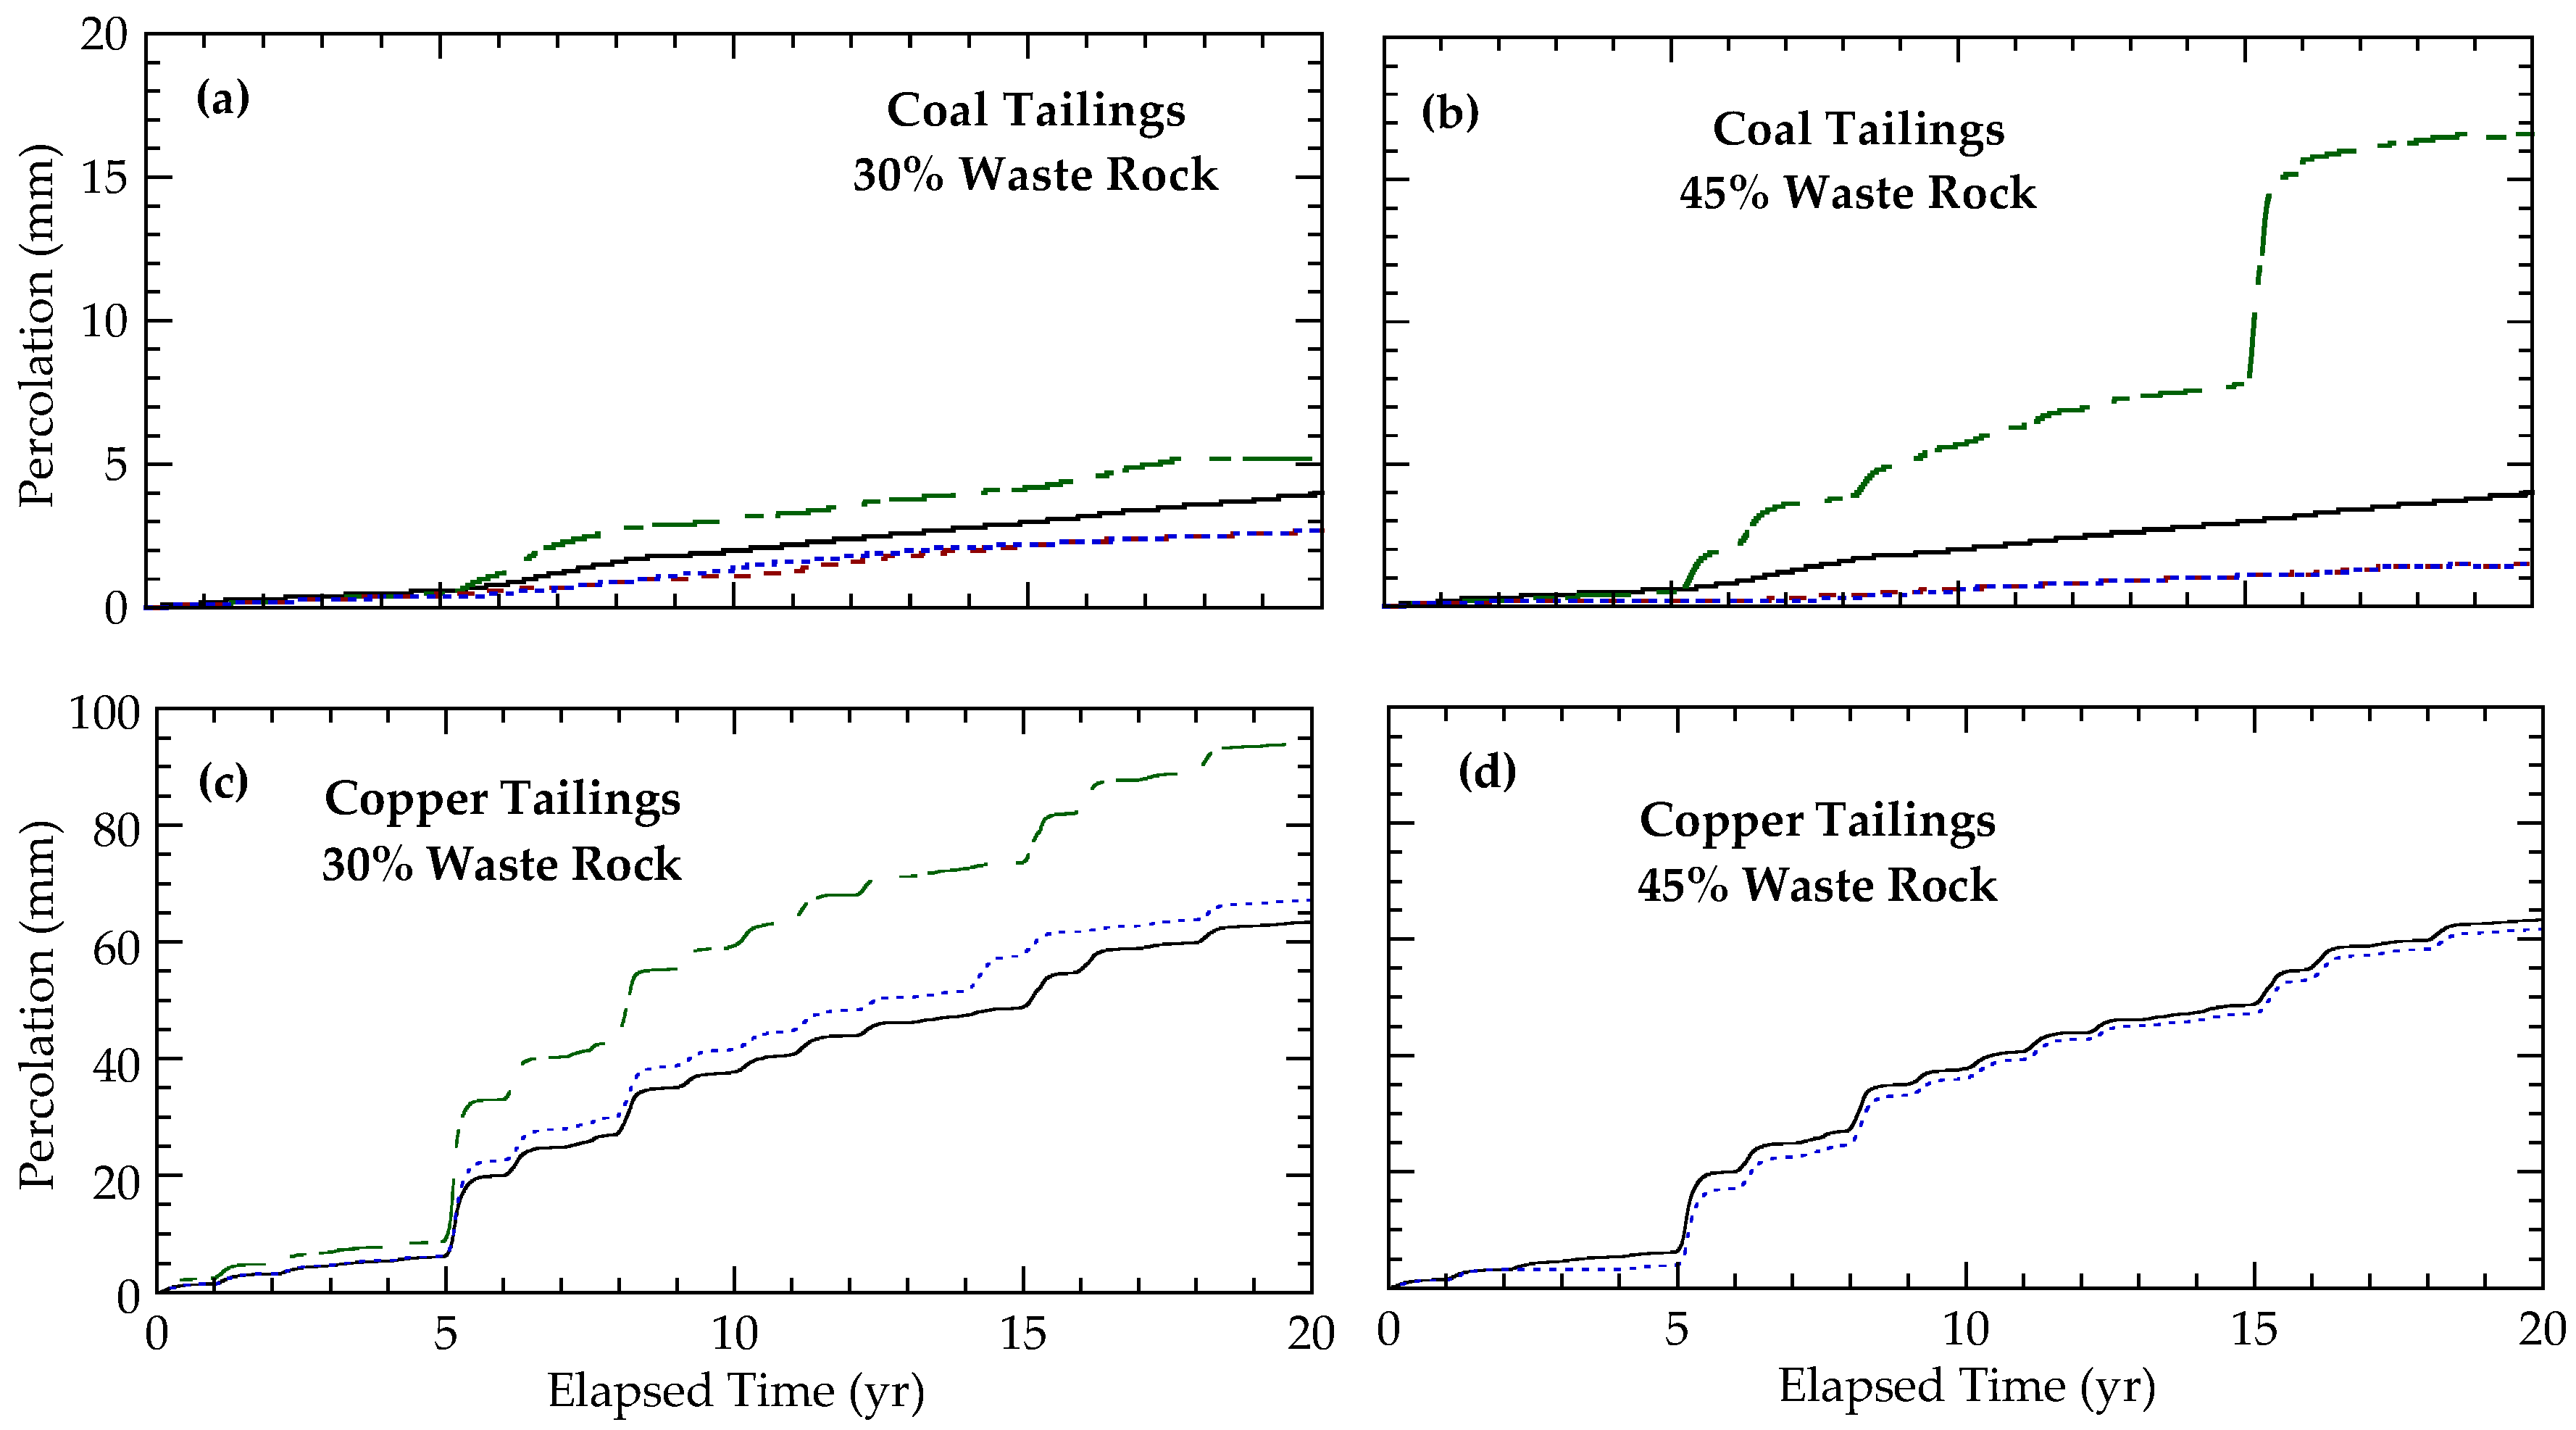
  • Addition of waste rock to WBCs increased percolation when the storage layer thickness was fixed due to reduced storage capacity. The effect of waste rock addition was more pronounced in WBCs that included tailings with higher ks.
  • Two methods were presented to redesign the storage layer thickness in a WBC that includes mixed WR&T: Method 1—redesign for the constant available storage and Method 2—redesign for the constant void volume. Both methods yielded similar WBC thicknesses and similar percolation rates that compared favorable to the percolation rate with no waste rock.
  • Reuse of mixed WR&T in on-site WBCs provides an opportunity to enhance mine site sustainability via reduced costs associated the acquisition of raw materials required for closure as well as reduced waste volumes requiring storage.

Acknowledgments

Financial support for this study was provided in part by National Science Foundation to Colorado State University. Support also was provided by Colorado State University. The opinions, findings, conclusions, or recommendations expressed herein are those of the authors and do not necessarily represent the views of the National Science Foundation, or Colorado State University. Funds were made available at Colorado State University to publish in open access.

Author Contributions

Christopher A. Bareither and Mohammad H. Gorakhki conceived and designed the water-balance models for this study and Mohammad H. Gorakhki completed all model simulations. Christopher A. Bareither and Mohammad H. Gorakhki collaborated on data analysis, preparation of figures and tables, and writing the manuscript.

Conflicts of Interest

The authors declare no conflict of interest.

References

  1. Resource Conservation and Recovery Act (RCRA); Publication Law 94-580; 94th United States Congress: Washington, DC, USA, 1976.
  2. Albright, W.H.; Benson, C.H.; Waugh, W.J. Water Balance Covers for Waste Containment: Principles and Practice; American Society of Civil Engineers: Reston, VA, USA, 2010. [Google Scholar]
  3. Meer, S.R.; Benson, C.H. Hydraulic conductivity of geosynthetic clay liners exhumed from landfill final covers. J. Geotech. Geoenviron. 2007, 133, 550–563. [Google Scholar] [CrossRef]
  4. Albright, W.H.; Benson, C.H.; Gee, G.W.; Abichou, T.; McDonald, E.V.; Tyler, S.W.; Rock, S.A. Field performance of a compacted clay landfill final cover at a humid site. J. Geotech. Geoenviron. 2006, 132, 1393–1403. [Google Scholar] [CrossRef]
  5. Khire, M.V.; Benson, C.H.; Bosscher, P.J. Capillary barriers: Design variables and water balance. J. Geotech. Geoenviron. 2010, 126, 695–708. [Google Scholar] [CrossRef]
  6. Zornberg, J.G.; LaFountain, L.; Caldwell, J.A. Analysis and design of evapotranspirative cover for hazardous waste landfill. J. Geotech. Geoenviron. 2003, 129, 427–438. [Google Scholar] [CrossRef]
  7. Albright, W.H.; Benson, C.H.; Gee, G.W.; Roesler, A.C.; Abichou, T.; Apiwantragoon, P.; Lyles, B.F.; Rock, S.A. Field water balance of landfill final covers. J. Environ. Qual. 2004, 33, 2317–2332. [Google Scholar] [CrossRef] [PubMed]
  8. Malusis, M.A.; Benson, C.H. Lysimeters versus water-content sensors for performance monitoring of alternative earthen final covers. In Unsaturated Soils 2006, Proceedings of the Fourth International Conference on Unsaturated Soils, Carefree, AZ, USA, 2–6 April 2006; American Society of Civil Engineers: Reston, VA, USA, 2006; pp. 741–752. [Google Scholar]
  9. Bussiere, B. Colloquium 2004: Hydrogeotechnical properties of hard rock tailings from metal mines and emerging geoenvironmental disposal approaches. Can. Geotech. J. 2007, 44, 1019–1052. [Google Scholar] [CrossRef]
  10. Blight, G. Geotechnical Engineering for Mine Waste Storage Facilities; Taylor & Francis: London, UK, 2009. [Google Scholar]
  11. Aubertin, M.; Ricard, J.F.; Chapuis, R.P. A predictive model for the water retention curve: Application to tailings from hard-rock mines. Can. Geotech. J. 1998, 35, 55–69. [Google Scholar] [CrossRef]
  12. Qiu, Y.; Sego, D.C. Laboratory properties of mine tailings. Can. Geotech. J. 2001, 38, 183–190. [Google Scholar] [CrossRef]
  13. Williams, D.J.; Wilson, G.W.; Panidis, C. Waste rock and tailings mixtures as a possible seal for potentially acide forming waste rock. In 6th International Conference on Acid Rock Drainage; The Australasian Institute of Mining and Metallurgy: Melbourne, Australia, 2003; Volume 400, pp. 427–435. [Google Scholar]
  14. Bussière, B.; Aubertin, M. Clean tailings as cover material for preventing acid mine drainage: An in situ experiment. In Proceedings of Sudbury; Laurentian University: Sudbury, ON, Canada, 1999; Volume 99, pp. 19–28. [Google Scholar]
  15. Bossé, B.; Bussière, B.; Hakkou, R.; Maqsoud, A.; Benzaazoua, M. Assessment of phosphate limestone wastes as a component of a store-and-release cover in a semiarid climate. Mine Water Environ. 2013, 32, 152–167. [Google Scholar] [CrossRef]
  16. Bossé, B.; Bussière, B.; Hakkou, R.; Maqsoud, A.; Benzaazoua, M. Field experimental cells to assess hydrogeological behaviour of store-and-release covers made with phosphate mine waste. Can. Geotech. J. 2015, 52, 1255–1269. [Google Scholar] [CrossRef]
  17. Wickland, B.E.; Wilson, G.W. Self-weight consolidation of mixtures of mine waste rock and tailings. Can. Geotech. J. 2005, 42, 327–339. [Google Scholar] [CrossRef]
  18. Jehring, M.M.; Bareither, C.A. Tailings composition effects on shear strength behavior of co-mixed mine waste rock and tailings. Acta Geotech. 2016, 11, 1147–1166. [Google Scholar] [CrossRef]
  19. Wickland, B.E.; Wilson, G.W.; Wijewickreme, D. Hydraulic conductivity and consolidation response of mixtures of mine waste rock and tailings. Can. Geotech. J. 2010, 47, 472–485. [Google Scholar] [CrossRef]
  20. Kabambi, A.K.; Bussière, B.; Demers, I. Hydrogeological Behaviour of Covers with Capillary Barrier Effects Made of Mining Materials. Geotech. Geol. Eng. 2017, 35, 1199–1220. [Google Scholar] [CrossRef]
  21. Benson, C.H.; Bareither, C.A. Designing water balance covers for sustainable waste containment: Transitioning state of the art to state of the practice. In Geotechnical Engineering State of the Art and Practice: Keynote Lectures from GeoCongress 2012; American Society of Civil Engineering: Reston, VA, USA, 2012; pp. 1–33. [Google Scholar]
  22. Van Genuchten, M.T. A closed-form equation for predicting the hydraulic conductivity of unsaturated soils. Soil Sci. Soc. Am. J. 1980, 44, 892–898. [Google Scholar] [CrossRef]
  23. Benson, C.H.; Sawangsuriya, A.; Trzebiatowski, B.; Albright, W.H. Postconstruction changes in the hydraulic properties of water balance cover soils. J. Geotech. Geoenviron. 2007, 133, 349–359. [Google Scholar] [CrossRef]
  24. Bareither, C.A.; Foley, J.C.; Benson, C.H. Using surrogate meteorological data to predict the hydrology of a water balance cover. J. Geotech. Geoenviron. 2015, 142, 1–16. [Google Scholar] [CrossRef]
  25. Benson, C.H. Modeling unsaturated flow and atmospheric interactions. In Theoretical and Numerical Unsaturated Soil Mechanics; Springer: Berlin, Germany, 2007; pp. 187–201. [Google Scholar]
  26. Ogorzalek, A.S.; Bohnhoff, G.L.; Shackelford, C.D.; Benson, C.H.; Apiwantragoon, P. Comparison of field data and water-balance predictions for a capillary barrier cover. J. Geotech. Geoenviron. 2008, 134, 470–486. [Google Scholar] [CrossRef]
  27. Bohnhoff, G.L.; Ogorzalek, A.S.; Benson, C.H.; Shackelford, C.D.; Apiwantragoon, P. Field data and water-balance predictions for a monolithic cover in a semiarid climate. J. Geotech. Geoenviron. 2009, 135, 333–348. [Google Scholar] [CrossRef]
  28. Fayer, M.J. UNSAT-H Version 3.0: Unsaturated Soil Water and Heat Flow Model. Theory, User Manual, and Examples; Pacific Northwest National Laboratory: Richland, WA, USA, 2000. [Google Scholar]
  29. Khire, M.V.; Benson, C.H.; Bosscher, P.J. Water balance modeling of earthen final covers. J. Geotech. Geoenviron. 1997, 123, 744–754. [Google Scholar] [CrossRef]
  30. Penman, H.L. Natural evaporation from open water, bare soil and grass. Proc. Soc. Lond. A Math. Phys. Eng. Sci. 1948, 193, 120–145. [Google Scholar] [CrossRef]
  31. Schaap, M.G.; Leij, F.J. Improved prediction of unsaturated hydraulic conductivity with the Mualem-van Genuchten model. Soil Sci. Soc. Am. J. 2000, 64, 843–851. [Google Scholar] [CrossRef]
  32. Roesler, A.C.; Benson, C.H.; Albright, W.H. Field Hydrology and Model Predictions for Final Covers in the Alternative Cover Assessment Program-2002; Geo Engineering Report; University of Wisconsin-Madison: Madison, WI, USA, 2002; pp. 2–8. [Google Scholar]
  33. Bareither, C.A.; Benson, C. Evaluation of Bouwer-Rice large-particle correction procedure for soil water characteristic curves. Geotech. Test. J. 2013, 36, 680–694. [Google Scholar] [CrossRef]
  34. Shelley, T.L.; Daniel, D.E. Effect of gravel on hydraulic conductivity of compacted soil liners. J. Geotech. Eng. 1993, 119, 54–68. [Google Scholar] [CrossRef]
  35. Bouwer, H.; Rice, R.C. Renovation of wastewater at the 23rd Avenue rapid infiltration project. J. Water Pollut. Control Fed. 1984, 56, 76–83. [Google Scholar]
  36. Gorakhki, M.H.; Bareither, C.A. Unconfined compressive strength of synthetic and natural mine tailings amended with fly ash and cement. J. Geotech. Geoenviron. Eng. 2017, 143, 1–14. [Google Scholar] [CrossRef]
  37. Lottermoser, B.G. Recycling, reuse and rehabilitation of mine wastes. Elements 2011, 7, 405–410. [Google Scholar] [CrossRef]
  38. McLellan, B.C.; Corder, G.D.; Giurco, D.; Green, S. Incorporating sustainable development in the design of mineral processing operations–Review and analysis of current approaches. J. Clean. Prod. 2009, 17, 1414–1425. [Google Scholar] [CrossRef] [Green Version]
  39. McLellan, B.C.; Corder, G.D.; Ali, S.H. Sustainability of rare earths—An overview of the state of knowledge. Minerals 2013, 3, 304–317. [Google Scholar] [CrossRef]
  40. Corder, G.D. Insights from case studies into sustainable design approaches in the minerals industry. Miner. Eng. 2015, 76, 47–57. [Google Scholar] [CrossRef]
Figure 1. Particle-size-distributions (a) and soil water characteristic curves (b) for silty-sand in the Natural Cover from Benson and Bareither [21] and gold, copper, coal, and oil sand tailings from Qiu and Sego [12].
Minerals 07 00128 g001
Figure 2. Method 1 redesign for water balance cover height with waste rock addition to coal mine tailings.
Minerals 07 00128 g002
Figure 3. Relationships between annual average (a) runoff; (b) evapotranspiration; and (c) percolation versus saturated hydraulic conductivity (ks) of silty sand and mine tailings.
Minerals 07 00128 g003
Figure 4. Temporal trends of percolation for the Natural Cover and WBCs simulated with copper, oil sand, coal, and gold mine tailings over the 20-year model simulation period.
Minerals 07 00128 g004
Figure 5. Relationships of average soil water storage versus (a) air entry pressure (Ψa) and (b) van Genuchten’s n parameter, and relationships of average saturation of the soil water storage layer versus (c) Ψa and (d) n.
Minerals 07 00128 g005
Figure 6. Soil water characteristic curve for coal mine tailings (solid line), and 15%, 30%, 45% and 71.3% waste rock addition. The mixture ratio (R) is the optimum mixture ratio in WR = 71.3%.
Minerals 07 00128 g006
Figure 7. Relationship between average annual evapotranspiration and waste rock content for the 20-year simulations with the Natural Cover and copper, gold, oil sand, and coal mine tailings.
Minerals 07 00128 g007
Figure 8. Temporal trends of percolation for the (a) Natural Cover, (b) copper tailings, and (c) coal mine tailings with varying waste rock (WR) content.
Minerals 07 00128 g008
Figure 9. Relationships between (a) average annual percolation and waste rock content for fixed-height water storage layers containing waste rock; and (b) the rate of percolation increase with increase in waste rock content and saturated hydraulic conductivity of the water storage layer.
Minerals 07 00128 g009
Figure 10. Temporal trends of percolation for water balance covers with (a) coal tailings +30% waste rock, (b) coal tailings +45% waste rock, (c) copper tailings +30% waste rock, and (d) copper tailings +45% waste rock.
Minerals 07 00128 g010aMinerals 07 00128 g010b
Table 1. Characteristics of soils and mine tailings evaluated for water balance covers.
Soilθsθrα, 1/cmnΨa (cm)Sand (%)Silt (%)Clay (%)ks (cm/s) (Actual)ks (cm/s) (Modified)Ropt
Top Soil0.500.000.00491.33205.76------2.8 × 10−62.8 × 10−5-
Silty-Sand0.350.000.01421.2770.2734----6.0 × 10−56.0 × 10−42.01
Copper0.460.010.01961.45350.99693017.6 × 10−57.6 × 10−42.43
Gold0.450.000.01631.3361.1823.571.554.3 × 10−54.3 × 10−42.38
Coal0.470.040.00541.249183.503539261.2 × 10−61.2 × 10−52.49
Oil Sand a0.390.000.01671.3461.18672492.7 × 10−72.7 × 10−62.16
Note: θs = saturated volumetric water content; θr = residual volumetric water content; α and n = Van Genuchten fitting parameters, Ψa = air entry pressure; ks = saturated hydraulic conductivity; and Ropt = optimum mixture ratio. a Low ks of oil sand tailings attributed to presence of bitumen [12].
Table 2. Water balance covers simulated with coal and copper mine tailings that had varying waste rock contents. Cover thicknesses were fixed and adjusted following Methods 1 and 2.
Soil/TailingsWaste Rock Content (%)Modeling ConditionStorage Layer Height (mm)Percolation Rate (mm/year)
Coal mine tailings0-12200.200
30Fixed height12200.260
30Adjusted height-Method 118100.135
30Adjusted height-Method 217400.135
45Fixed height12200.830
45Adjusted height-Method 123900.075
45Adjusted height-Method 222200.075
Copper mine tailings0-12203.17
30Fixed height12204.71
30Adjusted height-Method 217703.36
45Adjusted height-Method 223503.09
Table 3. Water-balance metrics for the Natural Cover and WBCs with copper, gold, coal, and oil sand tailings.
Simulated Water Balance CoverEvapo- Transpiration (mm/year)Runoff (mm/year)Average Soil Water Storage (mm)Average Saturation Degree (%)Percolation (mm/year)
Natural Cover328.60.215151.630.32.36
Copper Tailings327.40.18591.118.33.17
Gold Tailings329.60.18144.128.91.69
Coal Tailings325.60.18303.760.90.20
Oil Sand Tailings314.92.17120.424.10.00
Table 4. Water balance metrics for the Natural Cover and WBCs simulated copper, gold, coal, and oil sand tailings with varying waste rock inclusions for the 20-year simulation period.
Soil/TailingsWaste Rock (%)Runoff (mm/year)Evapotranspiration (mm/year)Percolation (mm/year)Average Soil Water Storage (mm)Average Saturation Degree (%)
Natural Cover330.215328.62.36151.130
480.170328.12.69139.432
630.190327.13.41112.830
Copper Tailings00.185327.43.1791.114
150.180330.54.0880.315
300.180325.94.7175.316
Oil Sand Tailings02.170314.90.00120.422
302.140328.30.0093.523
451.040301.00.0071.824
Coal Tailings00.180321.70.20303.747
150.190333.90.32274.049
300.320317.80.26212.445
450.265328.90.83215.055
71.30.525315.01.85124.452

