1. Introduction
A methane explosion is one of the most violent mine accidents which could result in a high death toll and devastating financial losses. In 1906, 1099 miners were killed in the Courrieres Coal Mine explosion in France. In December 1907, the Monongah Numbers Six and Eight explosions in West Virginia, USA, claimed 362 lives, which was the worst American mine disaster. Moreover, in May 1928, 195 miners were killed in the Mather Number One mine explosion in Pennsylvania, USA. The most catastrophic explosion ever recorded was the Honkeiko Colliery disaster of 1942, in China, in which 1549 miners lost their lives [
1]. Despite the attention to mining safety brought by methane explosions, accidental deaths in the coal industry continued through the mid-20th Century. For example, in December 1951, a methane explosion in Orient Number Two Mine, Illinois, resulted in 119 fatalities. From 1900 to 2010, 10,390 miners lost their lives in 420 explosions in the USA alone. Methane explosions continue to be the number one killer amongst all mining accidents [
2].
The major destructiveness of methane explosions result from the extremely high overpressure and temperature during an event. It includes rapid combustion reactions when the methane/air mixture is ignited by an unexpected energy release, such as sparks, electrical arc, or lightning in a confined space. A transition from laminar to turbulent combustion enables a positive feedback process which leads to obvious flame acceleration and extremely high blast overpressure [
3,
4,
5]. Geometric changes on an airway could have a significant impact on the propagation of the blast-wave induced by a methane explosion. The influences should be understood and quantified when investigating an explosion in an underground ventilation system (airway network). The most representative geometric changes in longwall and room-and-pillar airway systems are bends, obstacles, and branches [
3]. These geometric changes’ influences have been investigated experimentally under different experimental conditions and qualitative results were provided [
6,
7,
8]. Some distinctive studies demonstrated that the bend of a duct would result in two opposite effects on the overpressure produced by an explosion. It could increase the overpressure if it is located in a gas-filled region and otherwise attenuates it [
9,
10]. Branching of a duct and sudden area increase in cross-sections will decrease the flame speed induced by the methane explosion, as well as overpressure [
11]. The impacts of obstacles are similar to bends; hence, the presence of obstacles in a methane-filled site could increase overpressure, but decreases it during blast-wave propagation [
8]. In summary, qualitatively speaking, geometric changes at an explosion site will either accelerate the flame and strengthen the overpressure or attenuate the blast-wave which passes through them. In this article, a numerical model using an unsteady 2D compressible Euler scheme has been developed and aims to characterize and quantify these influences. A series of lab-scale explosion experiments have also been conducted to validate the model and will be introduced in the next section.
3. Numerical Modeling
The modeling of methane explosions is based on conservation equations which are known as governing equations in fluid mechanics. In a methane explosion, Mach number can reach as high as 2 [
14]. The variation of density should be taken into account. The compressibility adds considerable complexities to the work. Therefore, assumptions are required to simplify the simulation. Based on the two-region theory, the explosion is divided into two relatively independent sections. In this study, only the pure blast-wave region will be simulated [
15]. All of the reaction in the flame-dominated region (
Figure 2) will not be considered. Instead, the boundary conditions of scenarios will be assigned by experimental results. The simulations seek to repeat the experiment and validate the modeling.
Governing Equations. In the numerical studies of the driver section, 3D Navier-Stokes (NS) conservation equations, turbulence, and chemical reactions were used. However, when attempting to model a blast-wave propagating through a geometric change, a 2D Euler model is considered appropriate if turbulence and reaction are no longer factors. The flow should be considered as both transient and compressible since a blast-wave propagation is highly time dependent. According to the above assumptions, the trimmed equations used in this study are shown as the following:
The equation system above are called Euler equations, and are assumed to be inviscid. Note that in the Euler equations, the viscous terms in momentum equations are eliminated due to turbulent shear being ignored in the blast-wave section. The unsteady terms are retained to capture the transient nature of the blast-wave propagation. All of the terms in the z direction are also eliminated due to the 2D assumption.
Density Based Solver. The density-based method was used for simulations including geometric changes. A density-based solution is an alternative to the pressure-based solution employed by ANSYS Fluent (ANSYS, Canonsburg, PA, USA). It solves Equations (1) to (4) simultaneously in vector form [
16]. The advantage is its ability to resolve transient flows when density changes significantly with respect to time, such as blast-wave propagation. Specifically, the primitive flow parameters are solved by the following four steps listed below:
- (a)
To update the primitive flow parameters from the last solution or given initial conditions;
- (b)
To solve the continuity, momentum, and energy equations simultaneously to get flow parameters for the next time step;
- (c)
To use the updated flow parameters to solve separate scalars if appropriate; and
- (d)
To check the convergence of the solution
Another feature of this numerical scheme is the usage of an explicit temporal scheme. An explicit scheme is different from the implicit schemes used by the 3D and 1D models, respectively. Its expression can be shown as:
where the superscripts represent the time level belonging to a flow parameter.
n means the current time step, while
n + 1 means the next time step.
Meshing. To model the blast-wave propagation through a geometric change, geometrical models should be developed and meshed (spatially discretized) before implementing a numerical simulation. The pre-process software ANSYS Gambit version 2.4.6 (ANSYS) is used to develop the geometric models and to mesh them. Unstructured quadrilateral meshing is used in all bends except for the 90° geometric change, which requires a quadrilateral mapping structural mesh. For the obstacles and T-branches, quadrilateral mapping is used.
Numerical Details. After the meshing, the governing equations can be solved in the discretized domains. The CFD (Computational Fluid Dynamics) general code ANSYS Fluent Cortex version 14.5.0 was employed as the solver. A density-based solution was used in all selected scenarios. Explicit schemes were used to discretize the computational domain and the time duration as well. Courant number (CFL) is set to be one to ensure that numerical calculations are stable for an explicit temporal discretization. A least squares cell-based method is used for gradient treatment and third-order monotonic upstream-centered scheme for conservation laws (MUSCL) method is used for primitive flow parameters. The time step size can be calculated by Equation (7) given CFL equal to 1.
where
V is characteristic flow velocity magnitude
c is sound of speed, and ∆
x is characteristic cell size.
CFD calculations were conducted using computer with a quad-core i7 3770K and 16 GB RAM. Two parallel processors were used. The residuals are generally at the 10−1 level.
Geometry and Initial Condition. In this study, the blast-wave passing through twelve different geometrical considerations are simulated. The portion of the experimental explosion duct with the geometric changes is selected to be the computational domain of the model. The length of the arms of each bend is 0.35 m. Their diameter (width of the duct) is 0.08 m. The pressure sensor upstream is placed a distance of 0.12 m from the inlet, along the centerline of the duct. The sensor downstream the bend is placed 0.12 m from the outlet, along the duct centerline.
The experiment results are assigned in corresponding locations to maintain consistency, where upstream pressure sensors are situated. For example, in the T-branch case, if the measurement of the eleventh overpressure sensor (P11) of a methane explosion is 0.05 MPa, the region in red will be assigned as 0.05 MPa overpressure throughout this region (
Figure 3). The inlet (the left boundary) will be considered as the pressure inlet, which has a constant overpressure of 0.05 MPa. Constant pressure of one atm (0.101325 MPa) is imposed to the outlet boundaries at the top and right ends. The scenarios selected are considered as supersonic flows with the average Mach number of the shock front upstream of the geometric change as 1.35. This setup is another simplification from a real blast-wave to an ideal shockwave. A blast-wave will decay after its wave front, while a shockwave does not. Under this assumption, the predicted overpressure will be relatively higher and more sustainable than the real case. The simulation results of all twelve cases will be demonstrated as follows.
4. Simulation Results
Simulation results processed by CFD-post imbedded in ANSYS are provided below. There are two types of demonstrations, pressure gradient contour and overpressure history. The former presents the blast-wave front location and high pressure regions; the latter illustrates the pressure variations on the two selected monitor surfaces (
Figure 4a).
4.1. Bends
Comparing the four bend scenarios in the experiments, seven angles; i.e., 30°, 40°, 50°, 90°, 120°, 140°, and 160°, are selected in the numerical study. Their overpressure contours during propagation and overpressure histories, upstream and downstream of the bend, will be demonstrated.
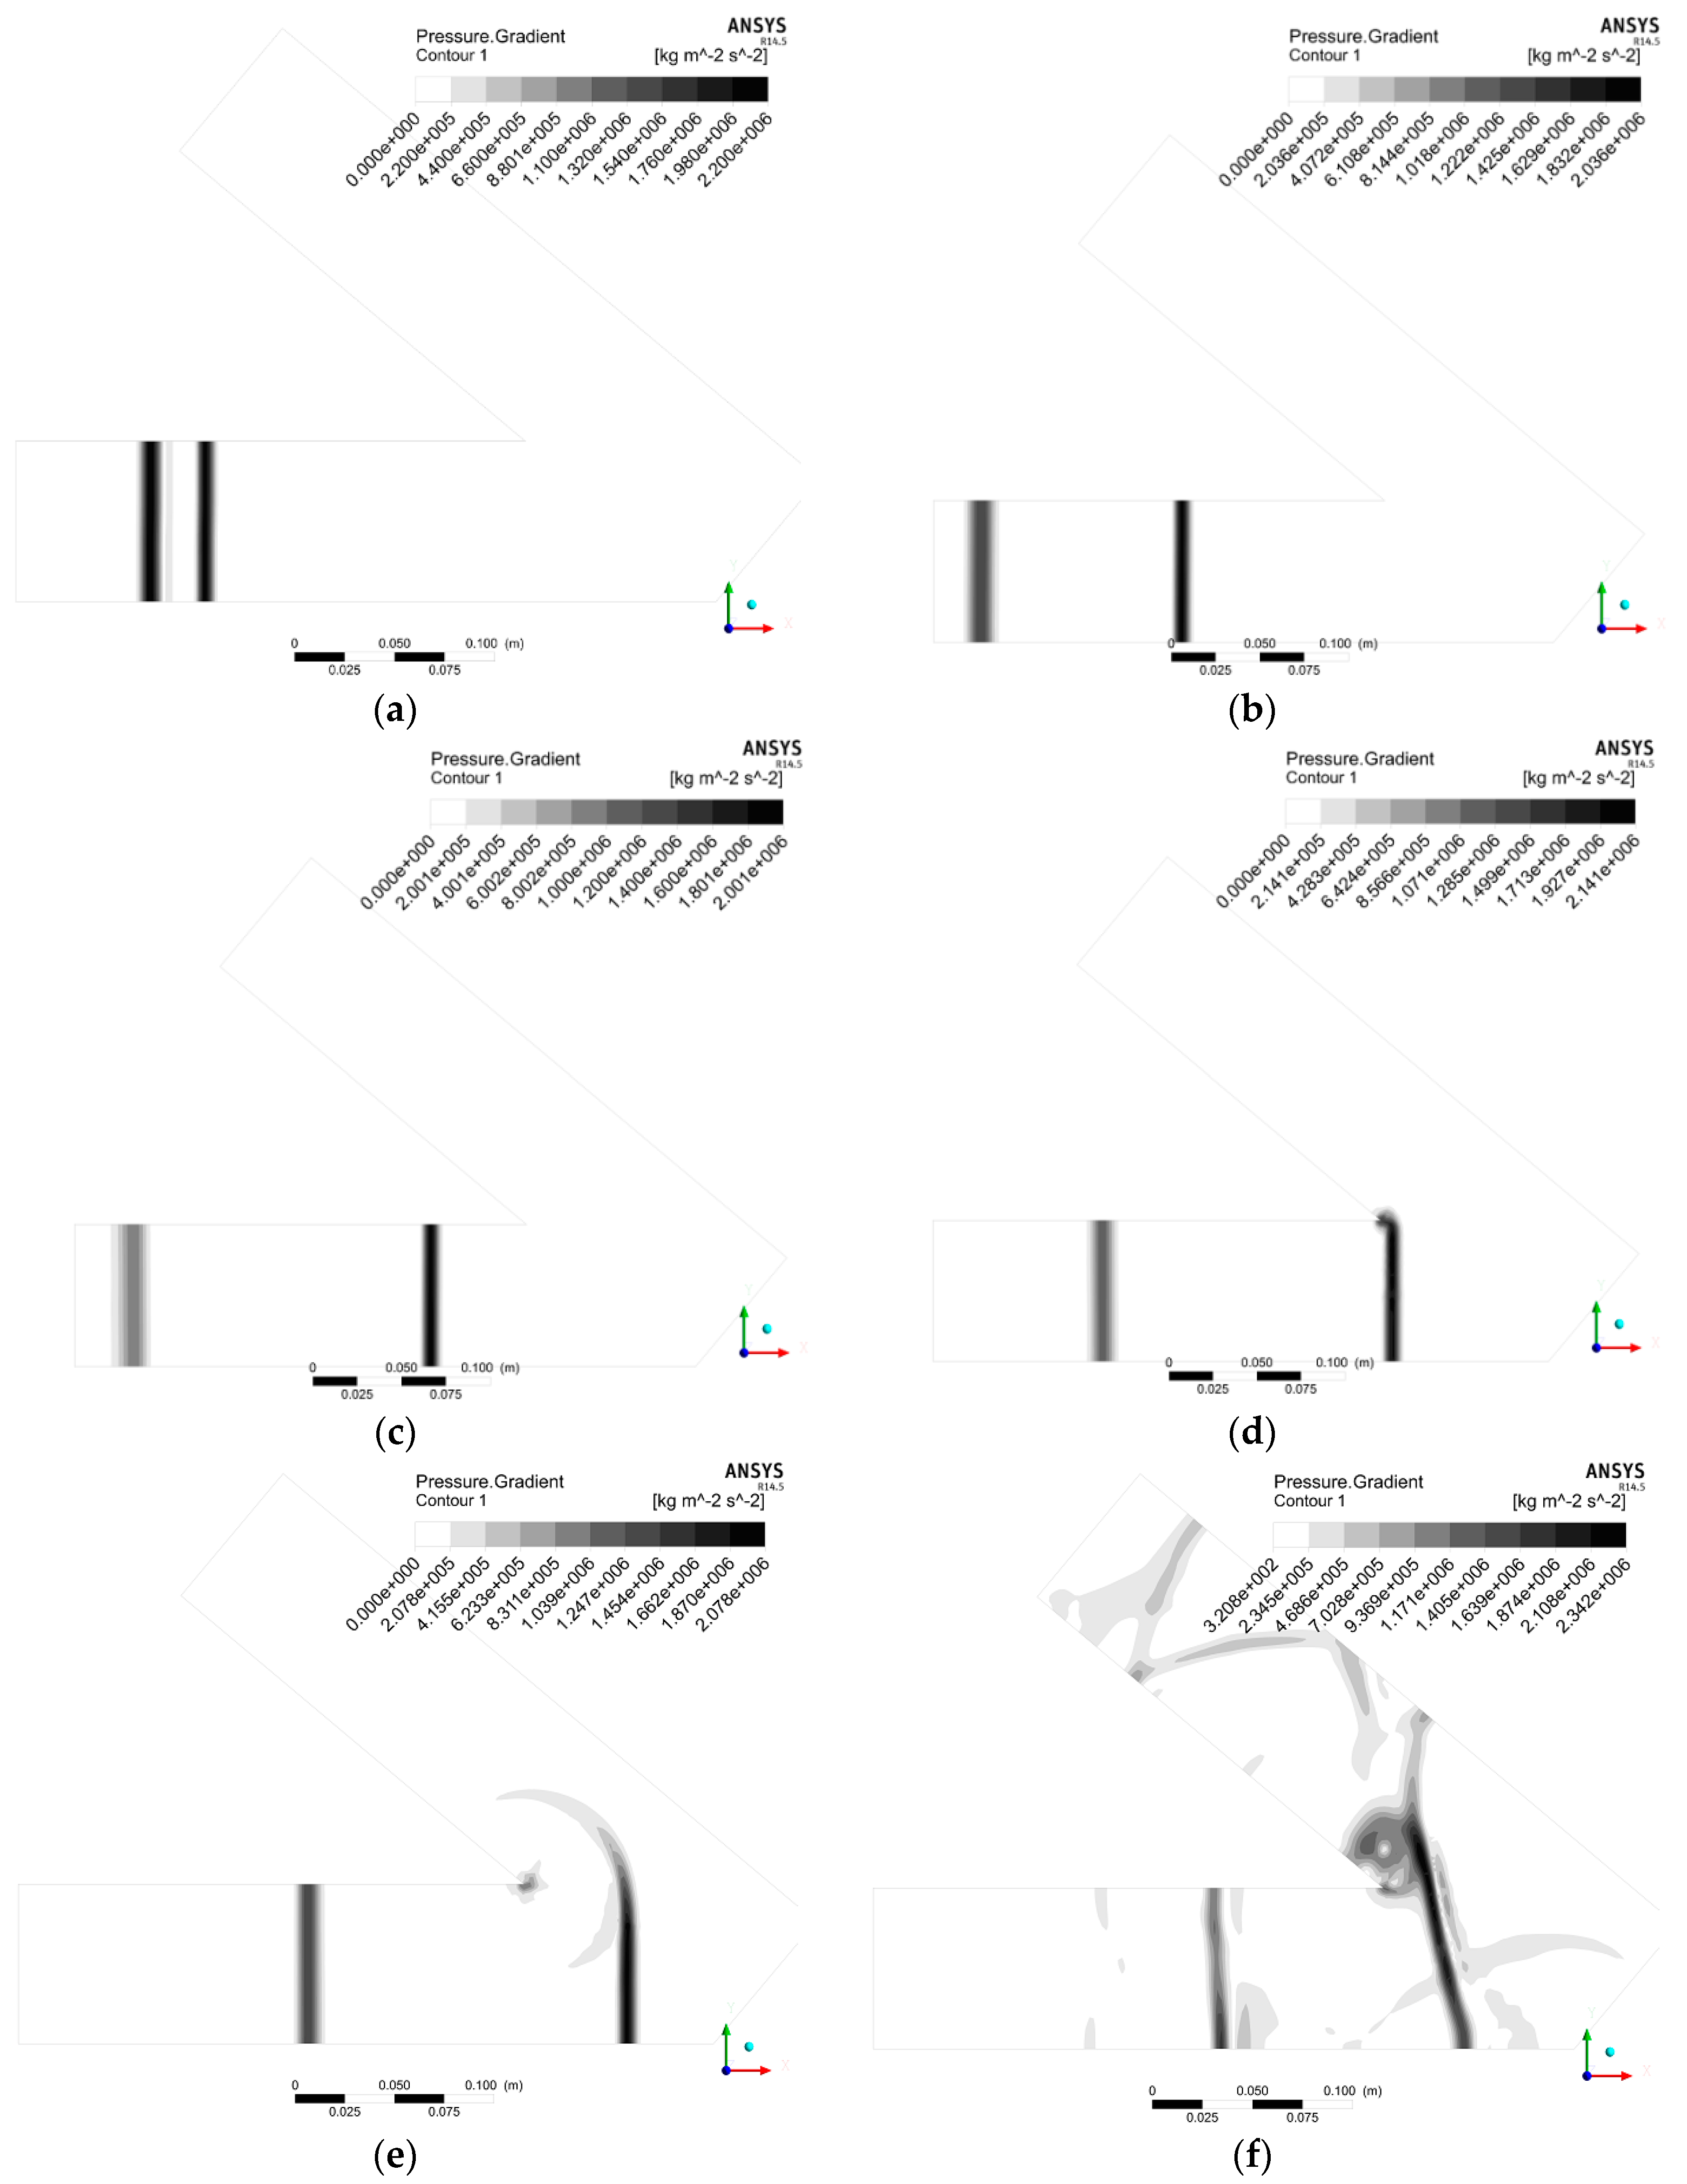
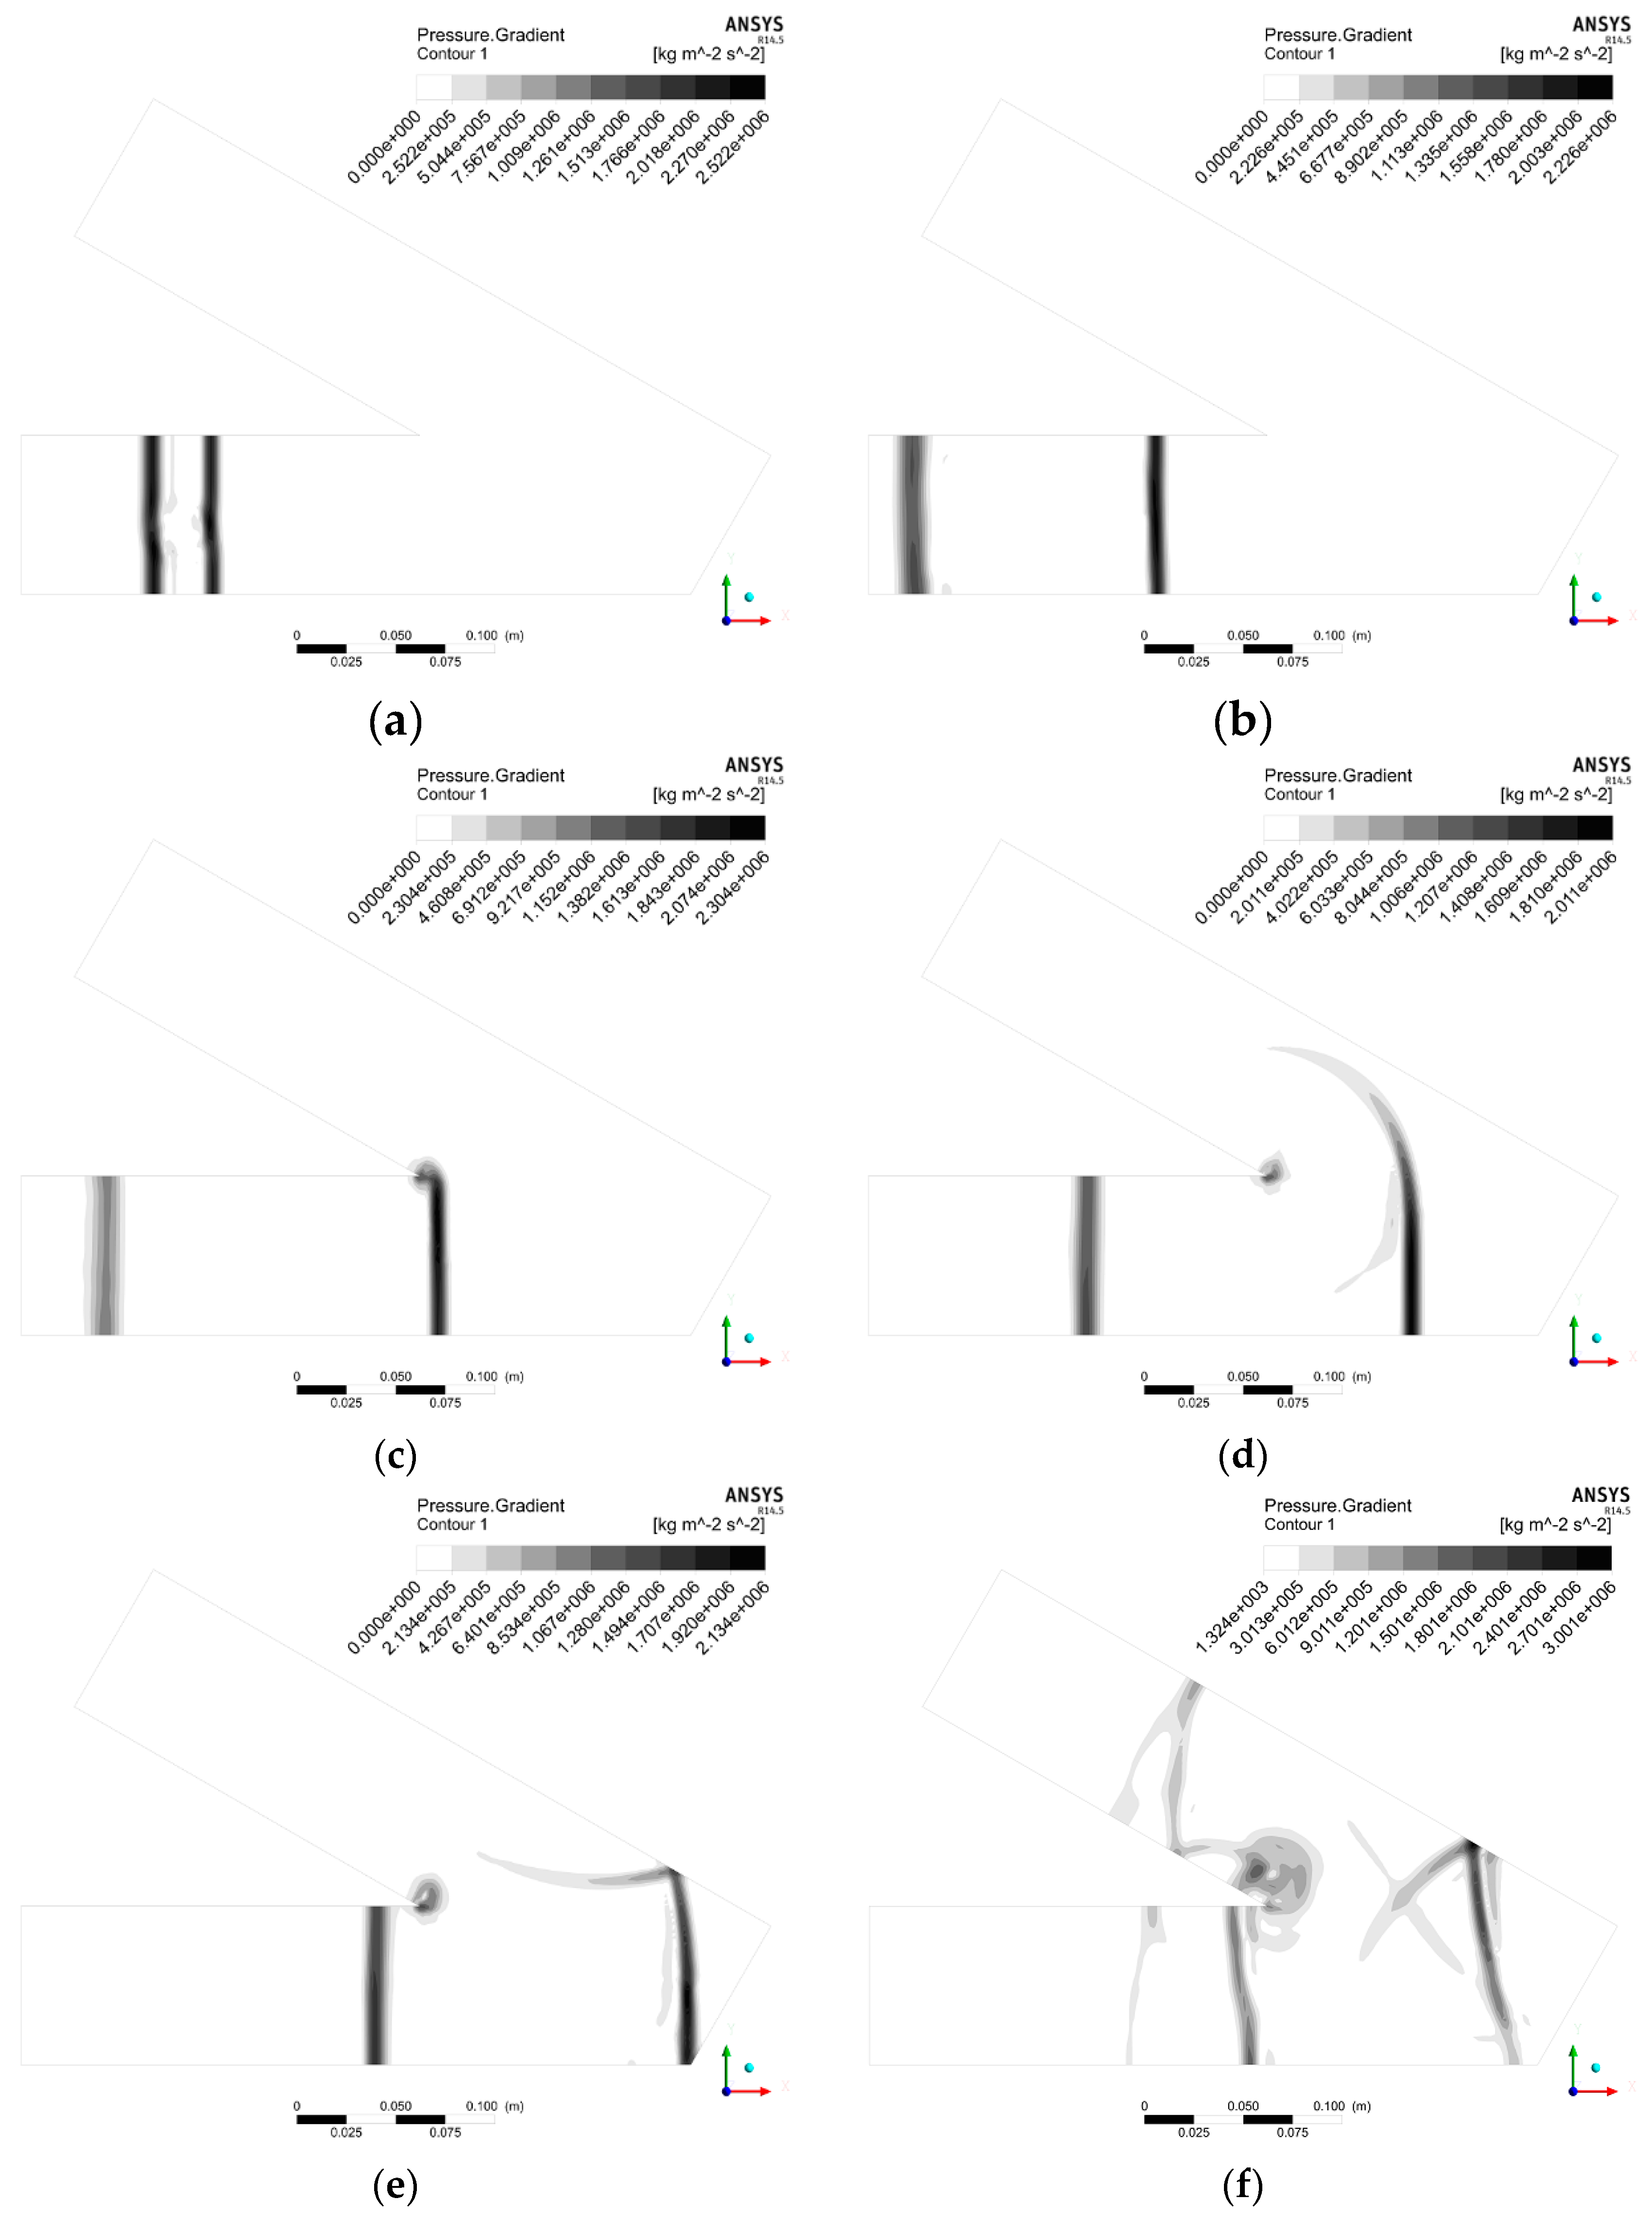
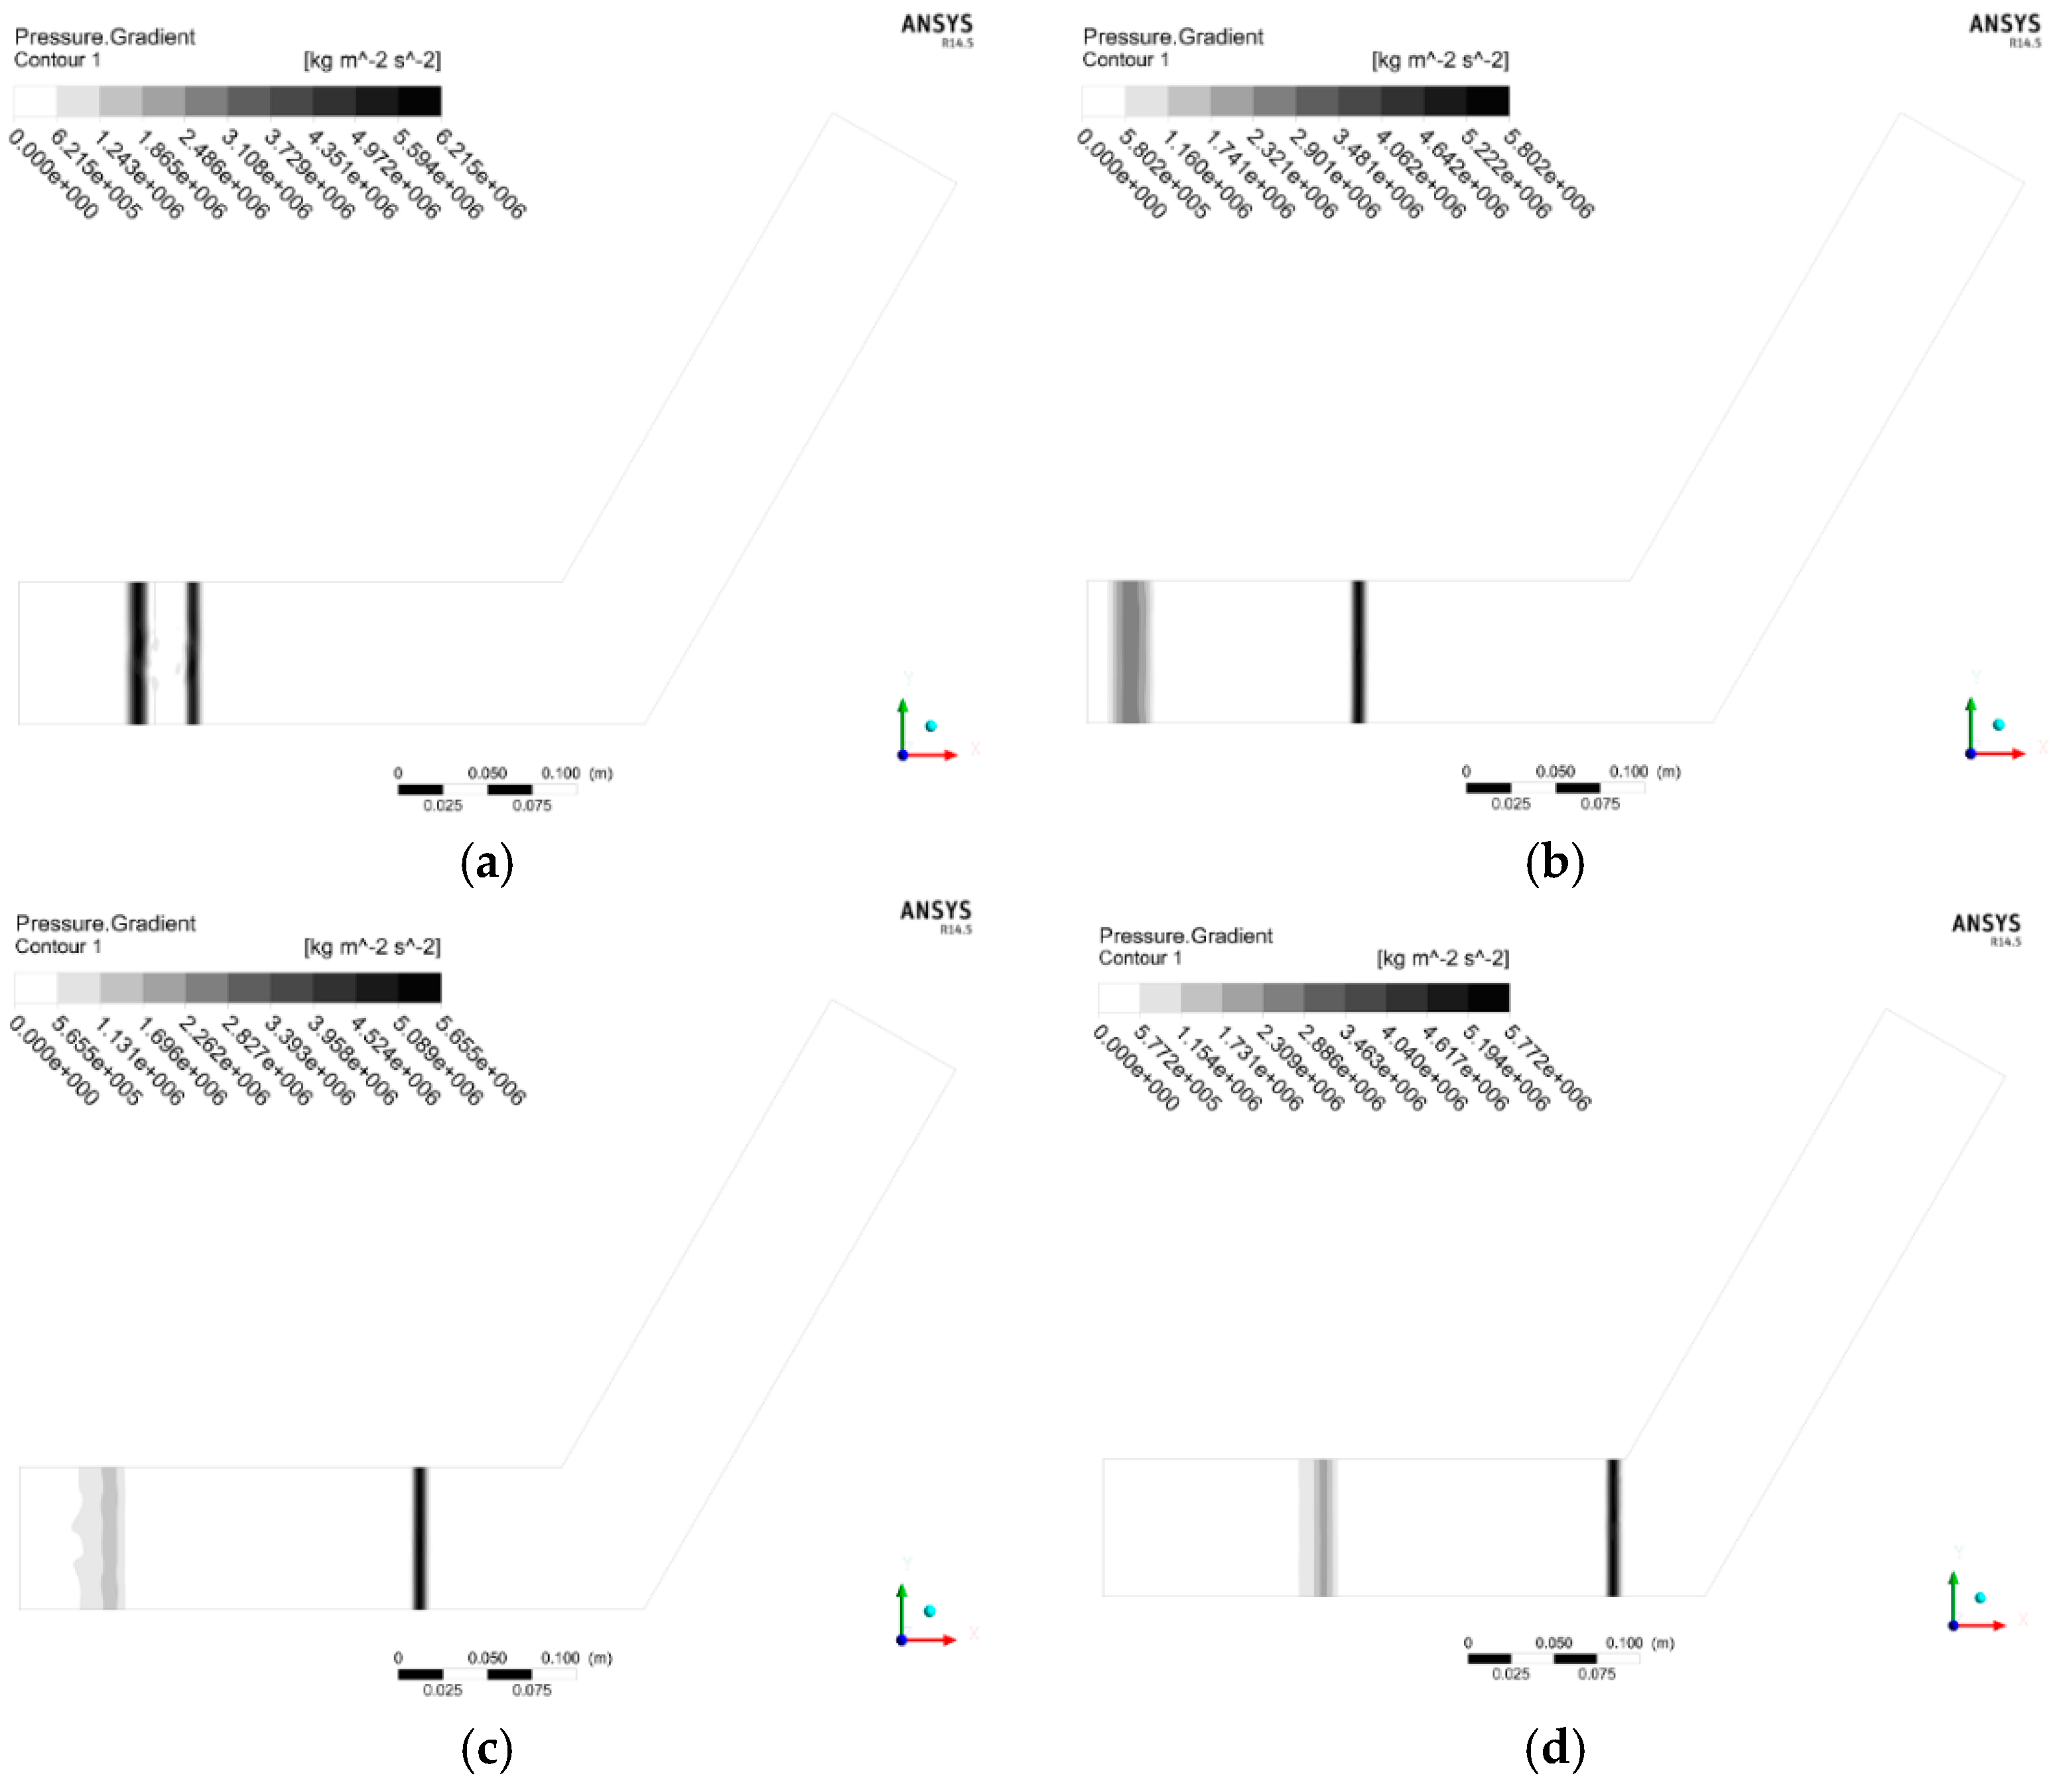
30° Bend. The predicted overpressure gradient contours after 25, 100, 200, and 300 time steps when the blast-wave is passing through the 30° bend are shown in
Figure 4a–d.
Figure 4e,f illustrate the overpressure contour at 0.000682 and 0.00137 s when maximum overpressure of the first impulse is obtained by the upstream and downstream sensors, respectively. The convergence is normally of a magnitude of 10
−1 for the continuity equation, and 10
−3 for other equations.
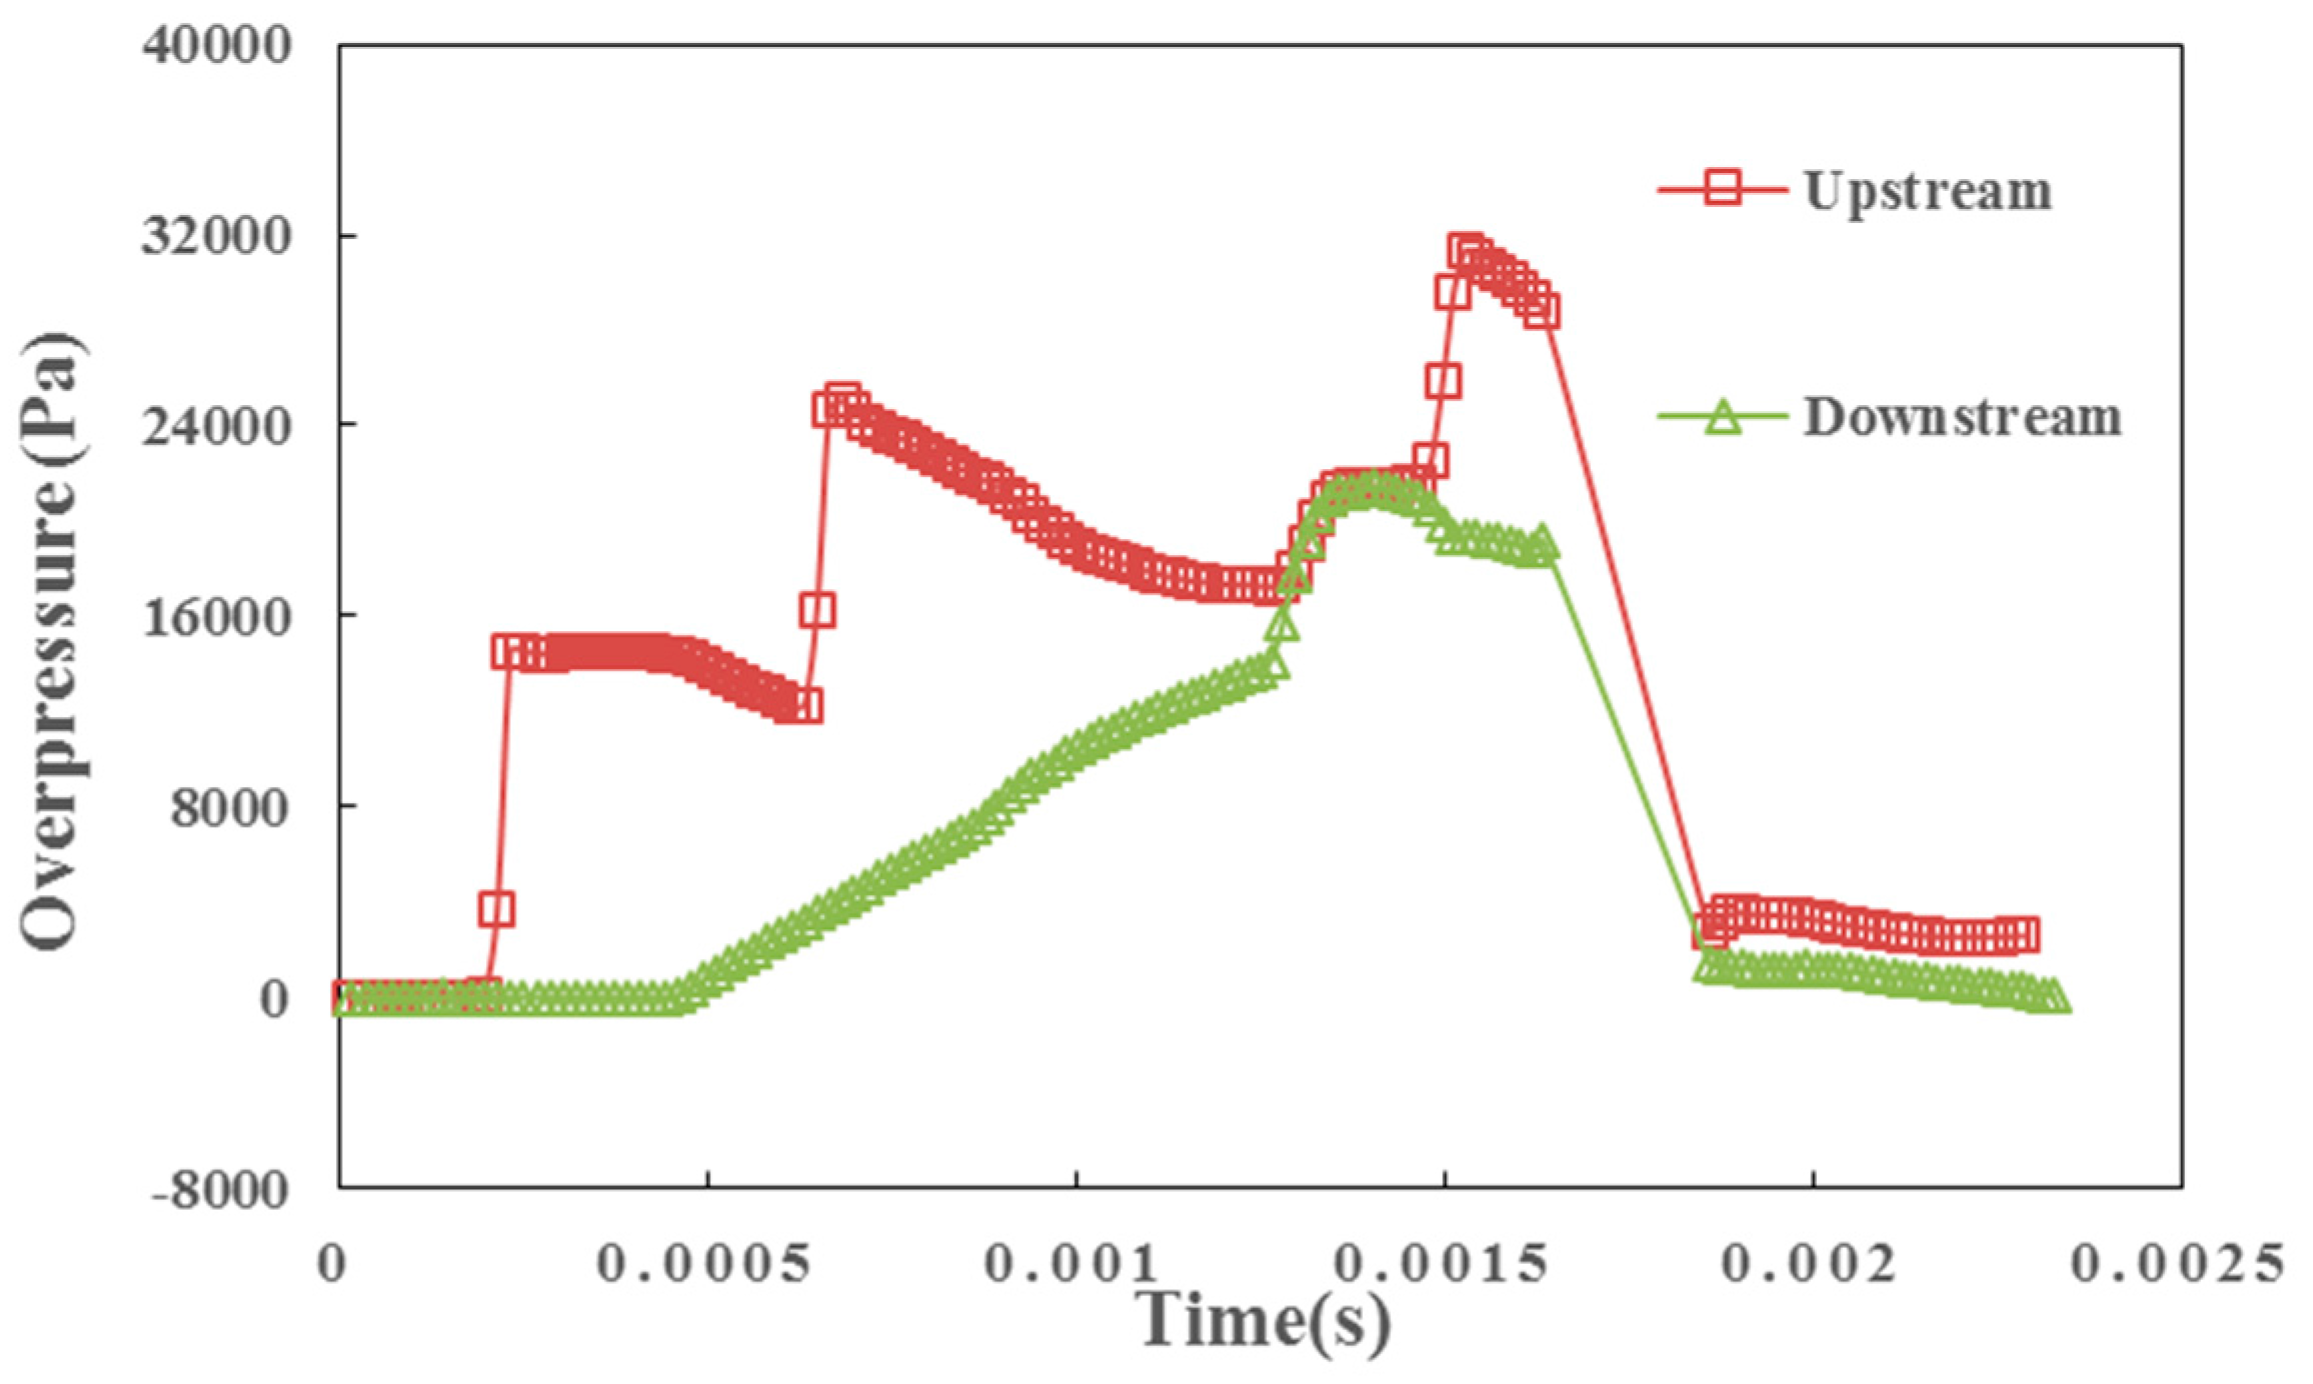
The overpressure histories upstream and downstream of the bend are demonstrated in
Figure 5. The maximum overpressure for the first impulse upstream the bend is 24,616 Pa at 0.000682 s, while the attenuated maximum overpressure for the first impulse downstream the bend is 21,400 Pa at 0.00137 s, the attenuation factor η is 1.15.
As illustrated in
Figure 4 and
Figure 5, the maximum overpressure of shock-wave recorded is obtained when the incident wave front is passing through the upstream pressure sensor (at 0.000682 s). At this instant, the total energy has not been dissipated by the interaction by being reflected in the vicinity of the bending corner. A high overpressure gradient region is observed within the outer corner of the bend where the shockwave is reflected (
Figure 4e) and on the tip of the sharp angle where a vortex start to develop (
Figure 4d). The presence of diffraction-reflection interaction leads to a pressure increase downstream of the bend. The shock retained a relatively high level for less than 0.0005 s until a sudden decline at 0.0017 s. This decrement of overpressure shown in
Figure 5 of both upstream and downstream sensors is due to the shock front having gone through the duct.
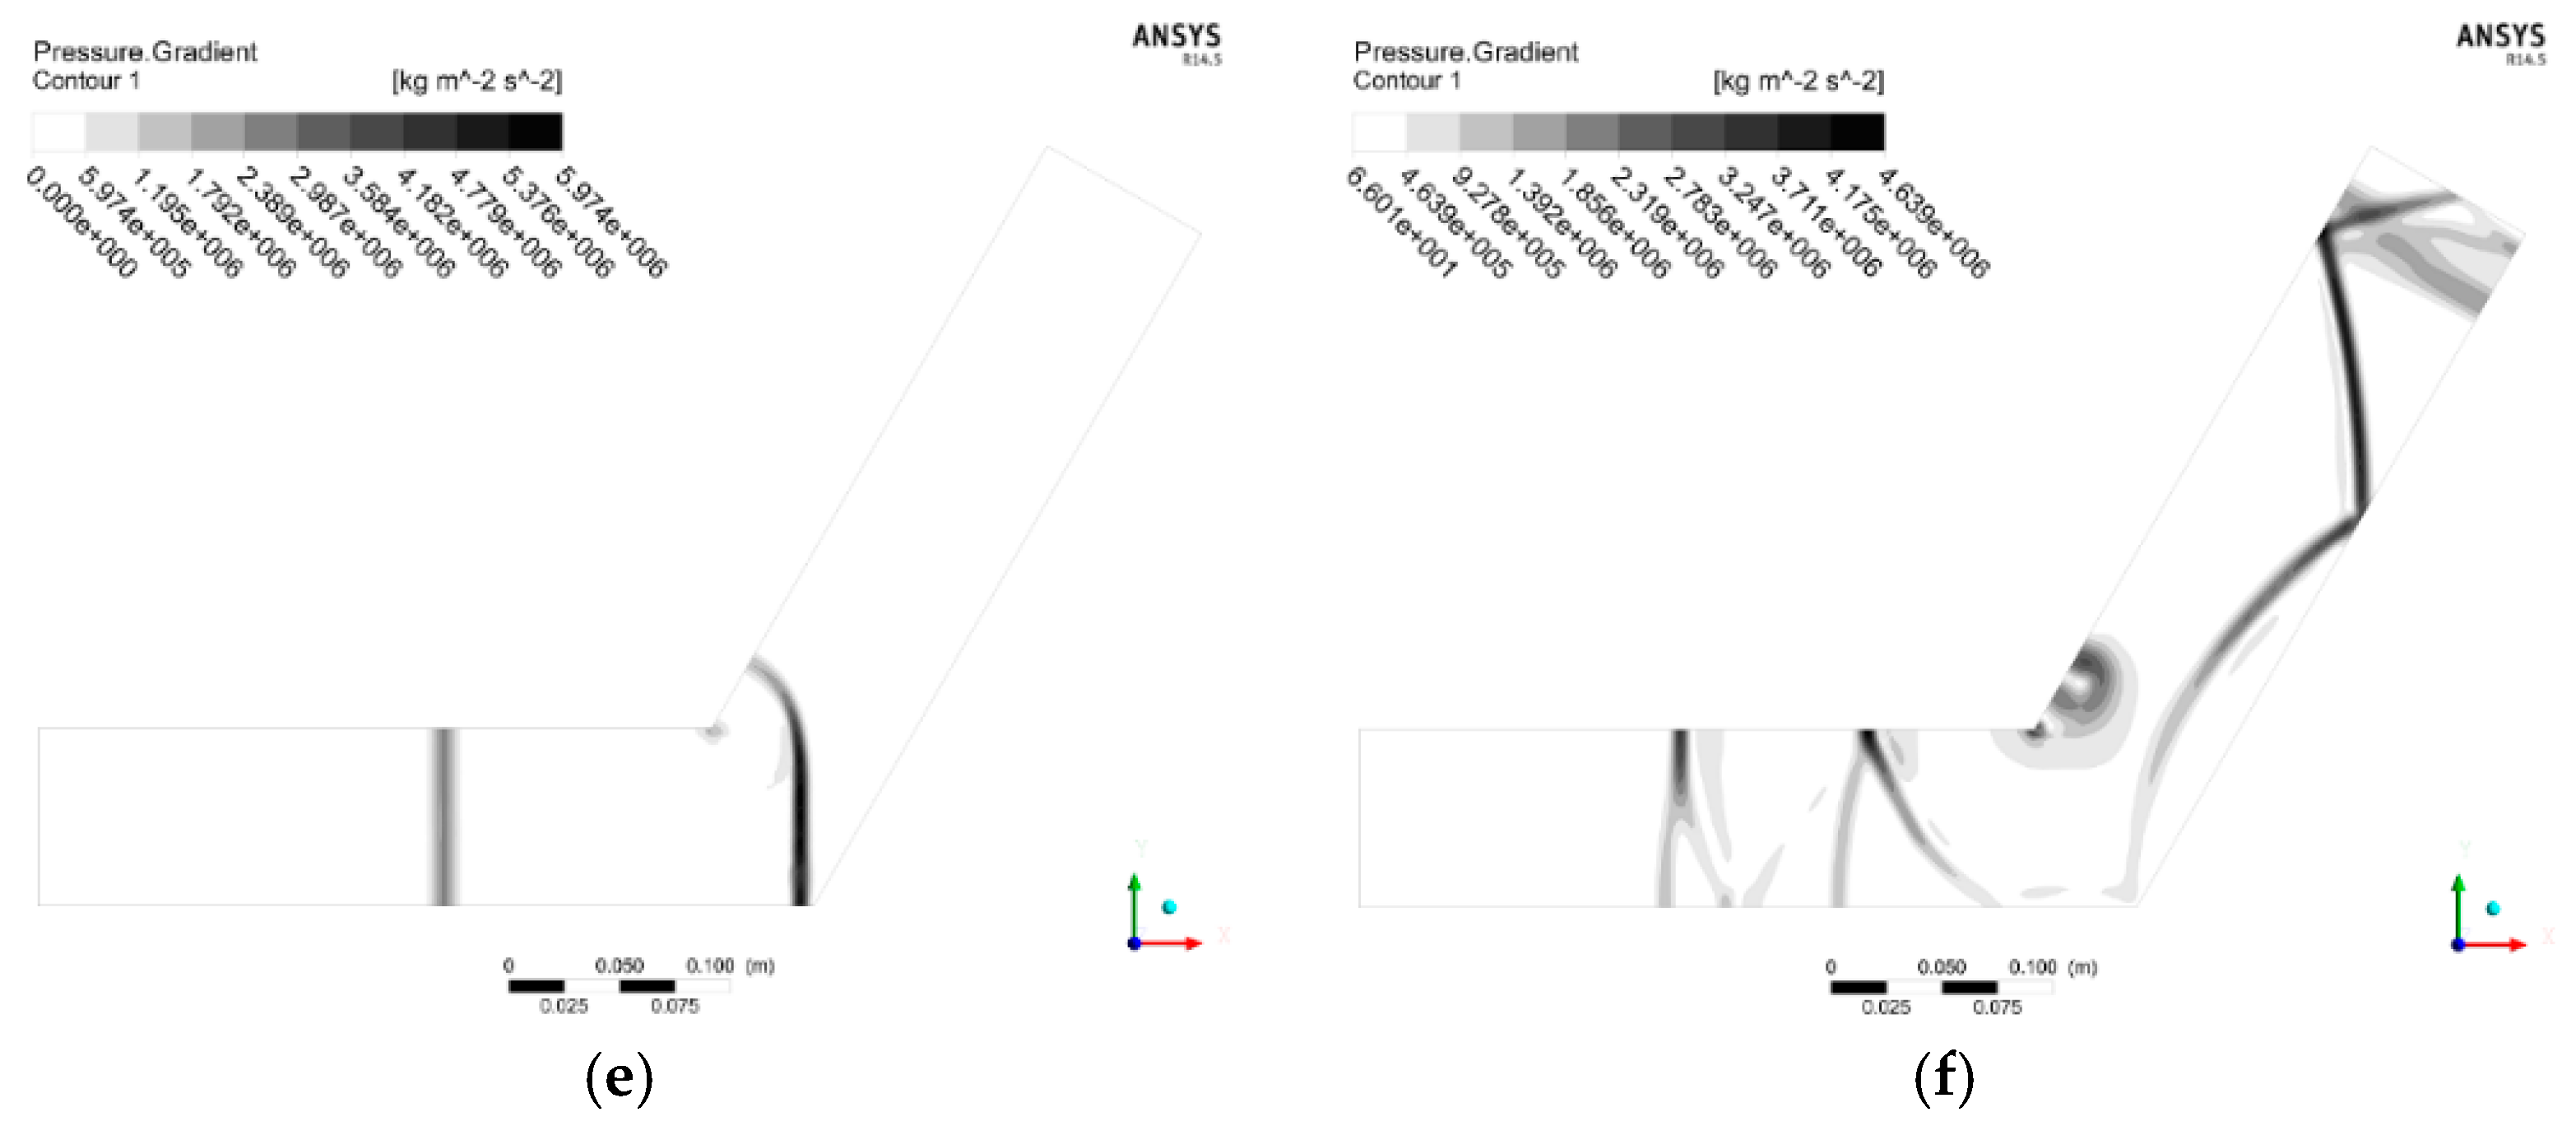
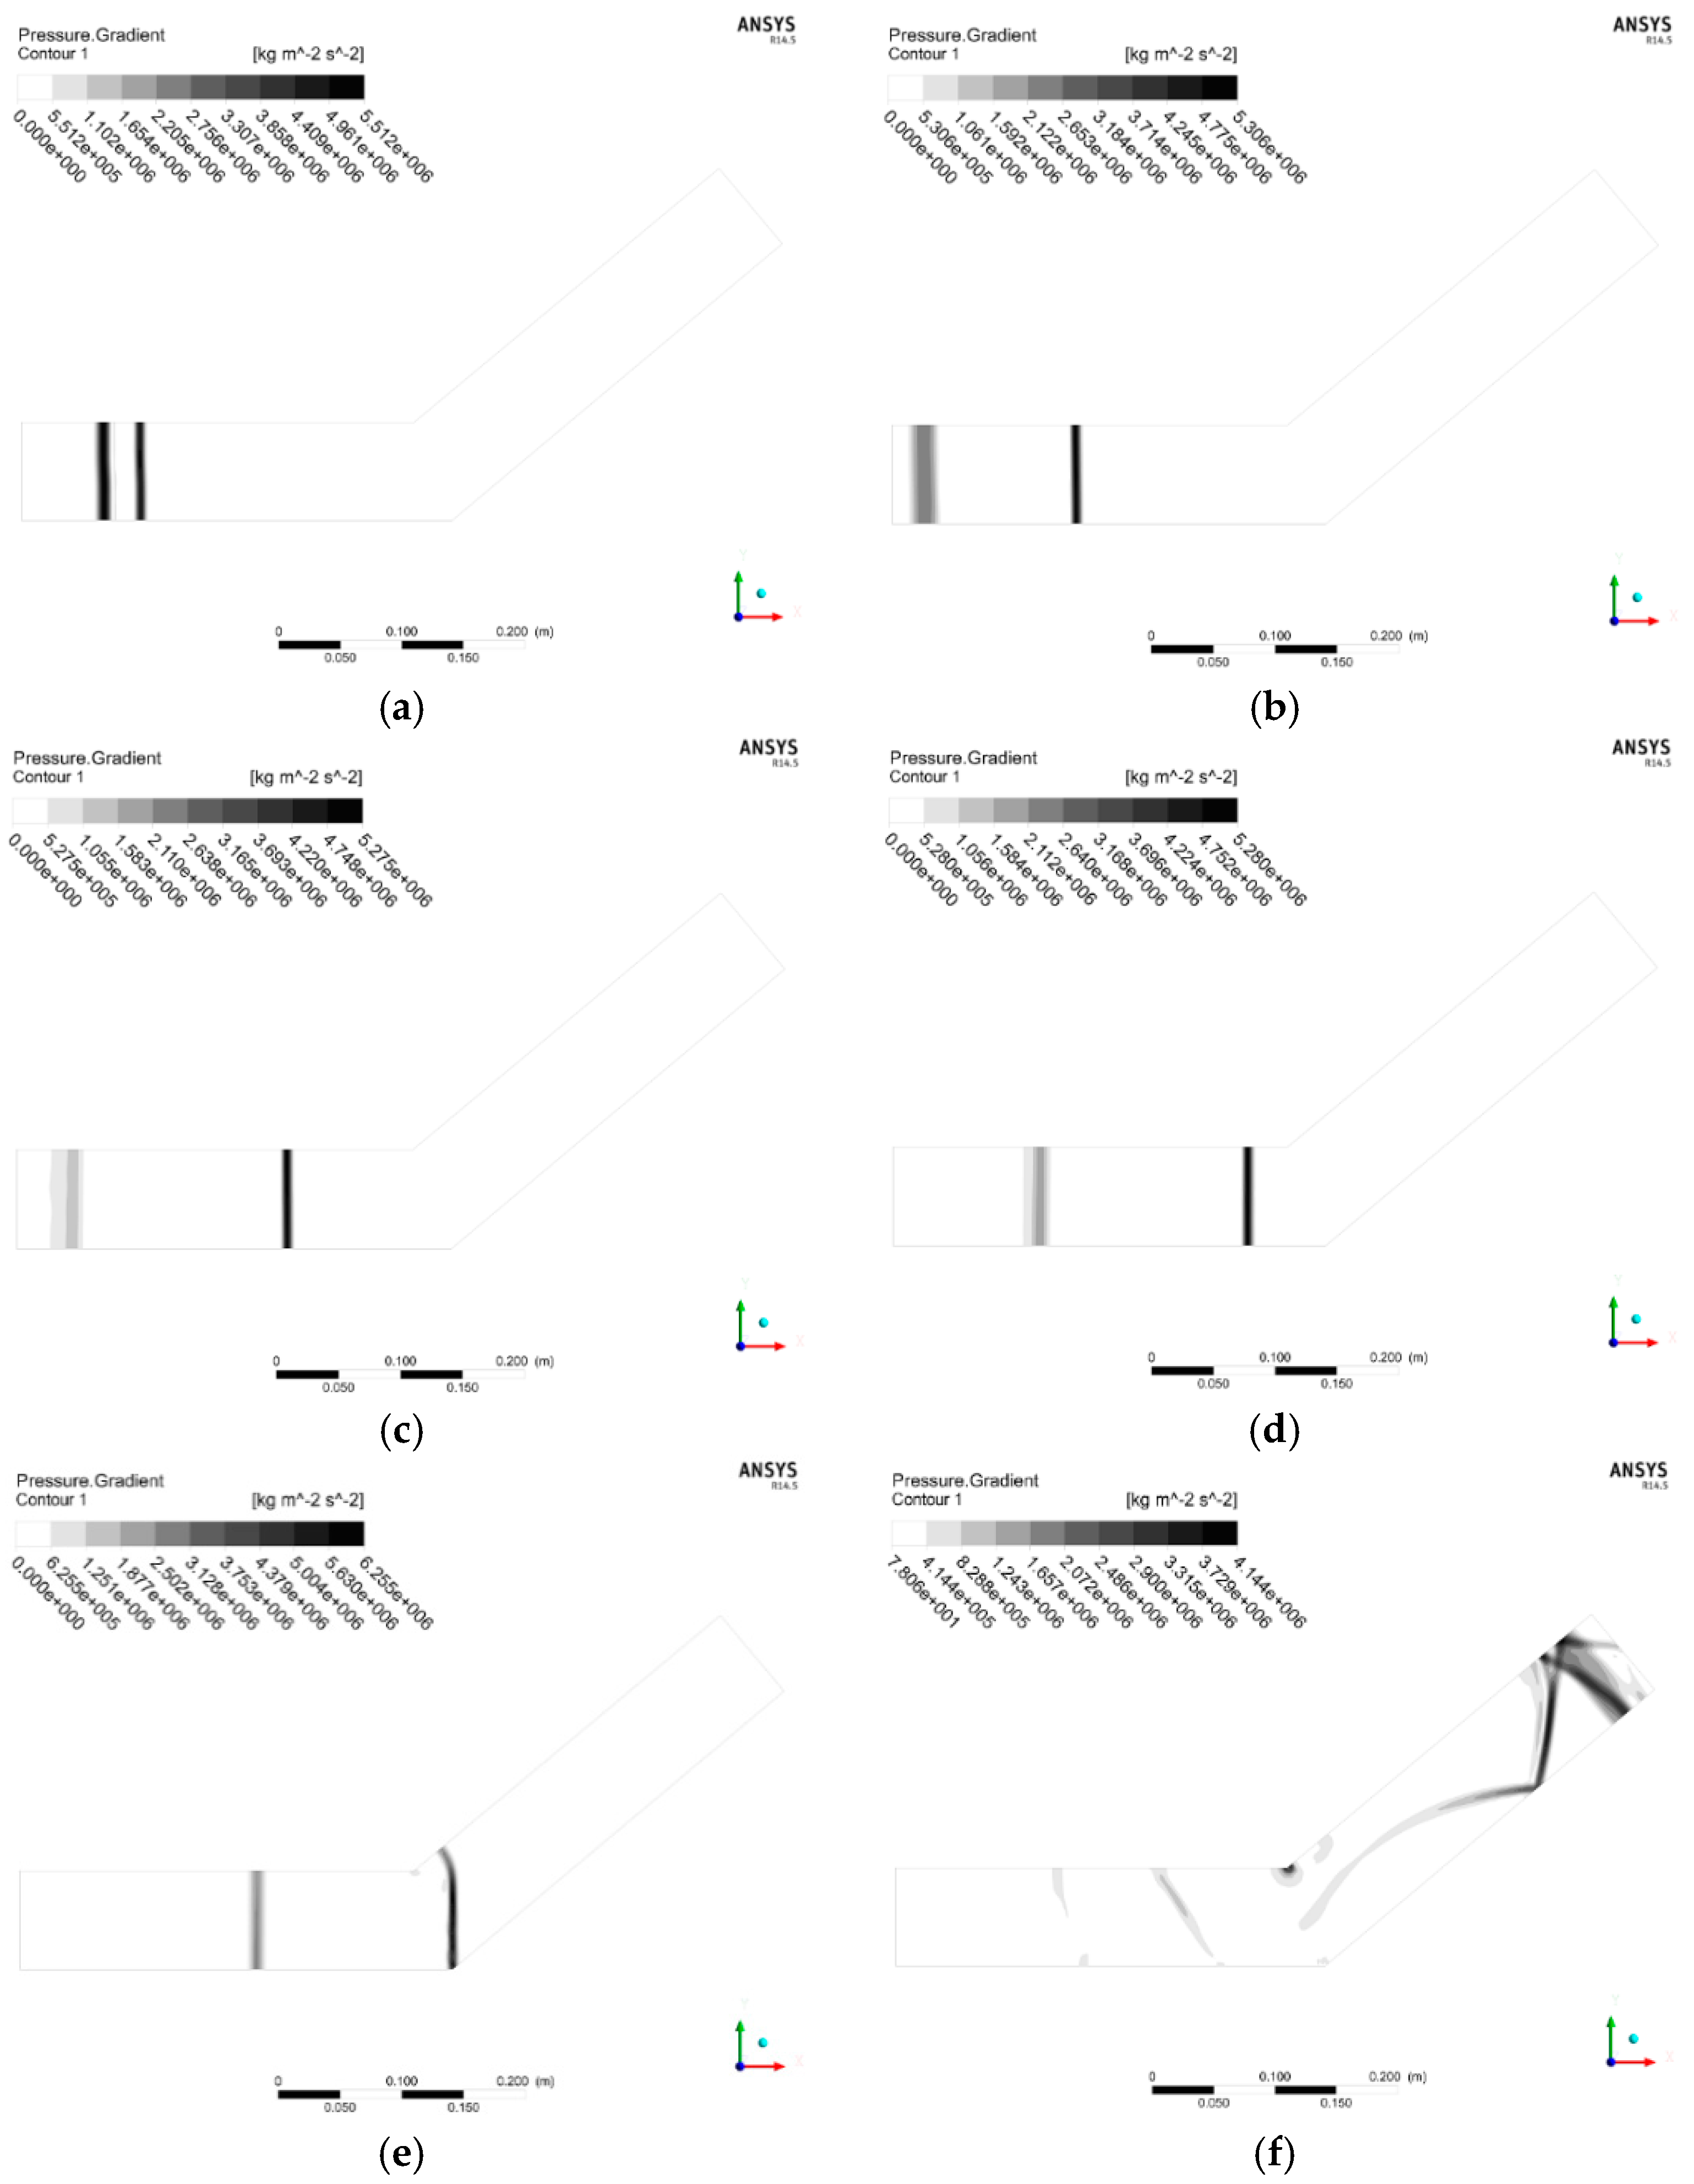
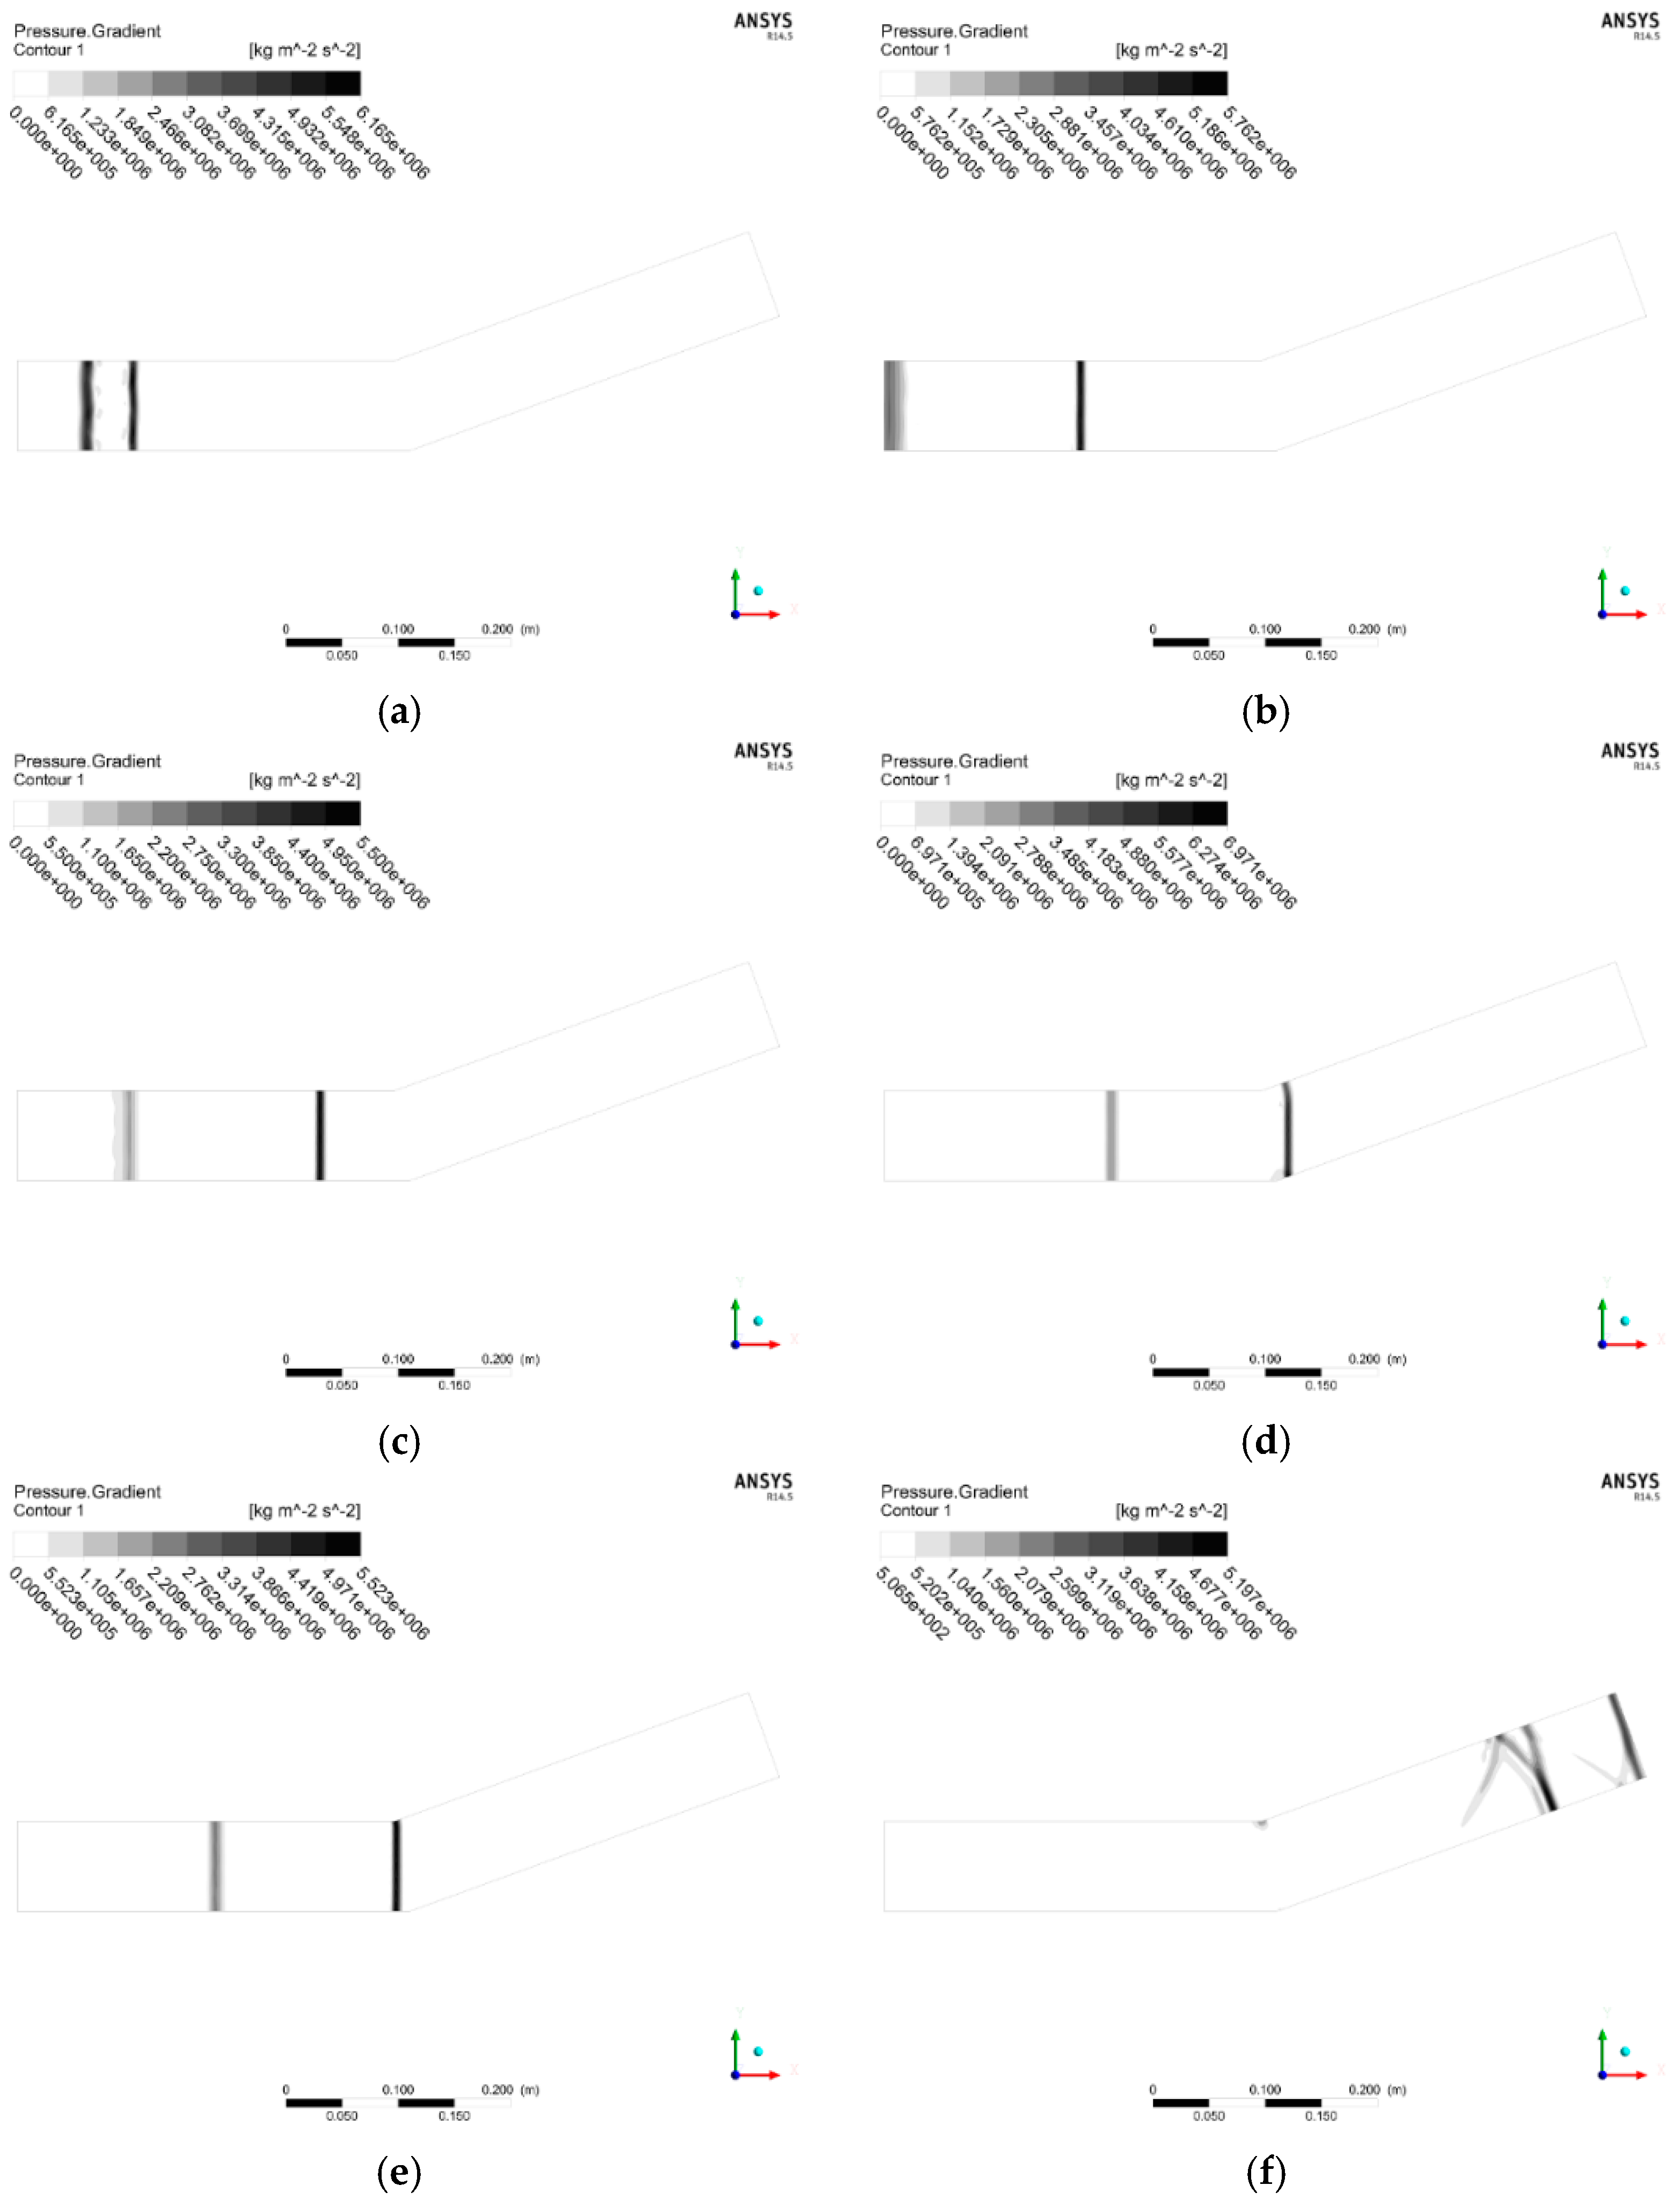
Other Bends. Similar to the 30° bend, blast-wave propagation over time and the overpressure histories of two monitor surfaces are used for analyzing the attenuation effect of the other six bend cases.
Figure 6,
Figure 7,
Figure 8,
Figure 9,
Figure 10 and
Figure 11 show the process of a blast-wave passing through the explosion duct, predicting overpressure gradient contours after 25, 100, 200, and 300 time steps and at the instance of the maximum overpressures of the bending scenarios of 40°, 50°, 90°, 120°, 140°, and 160° were obtained by upstream and downstream sensors.
The predictions of pressure gradient contours over the bends with angles of 40°, 50°, 90°, 120°, 140°, and 160° shows similar propagation patterns as the 30° case. High pressure gradient regions are detected in the vicinity of the inner angle of the bends where a vortex forms. Incident waves propagate through the turn and then are reflected between the walls of the downstream gallery. Cases where the angle is greater than 90° show a greater number of reflections and likely maintain longer peaks than acute angle cases. However, the reflected first shock front from the downstream leg becomes vaguer as the degree increases due to the incident waves and as the reflected waves are counteracted by each other, the pressure gradient vanishes gradually.
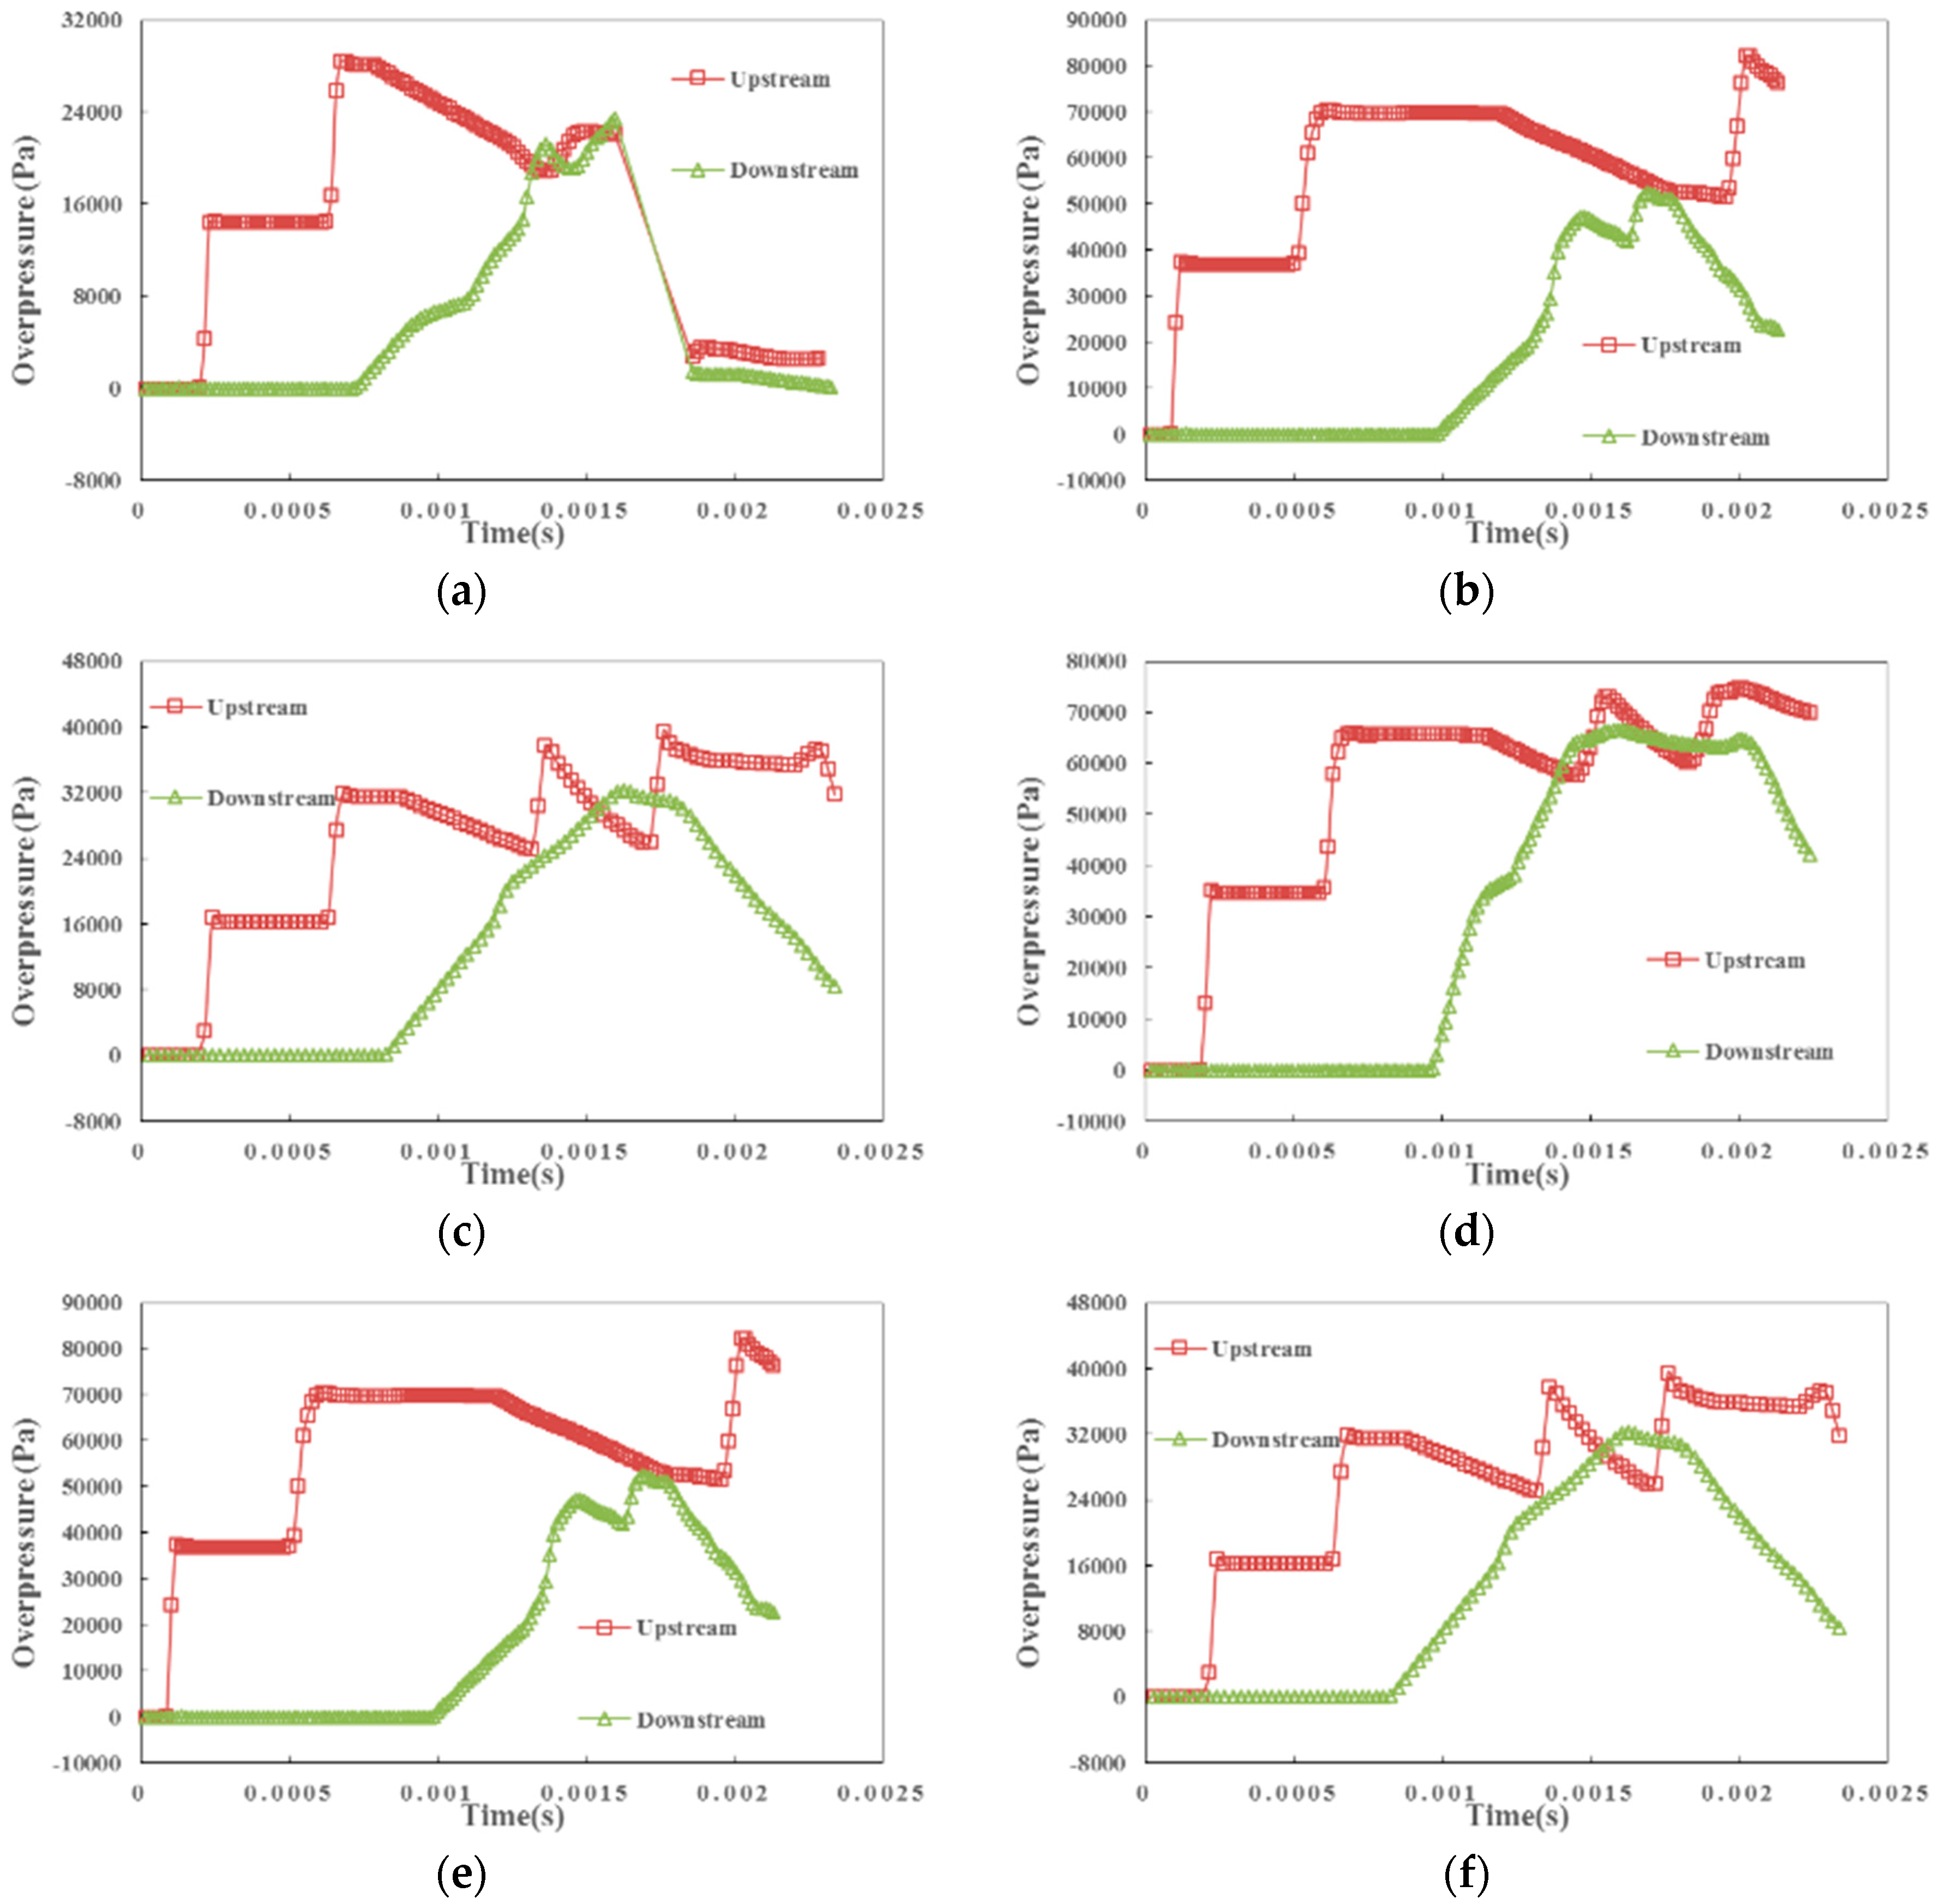
Figure 12 provides a clear picture of the predicted upstream and downstream overpressure histories of bends with the angle of 40°, 50°, 90°, 120°, 140°, and 160°. As has been discussed before, the obtuse angle scenarios show a longer peak and the attenuation effect is not obvious (
Figure 12d–f). For the 40°, 50°, and 90° cases, however, a sharp decrease of overpressure around 0.0016 s from the downstream monitor surface is observed.
4.2. Obstacles
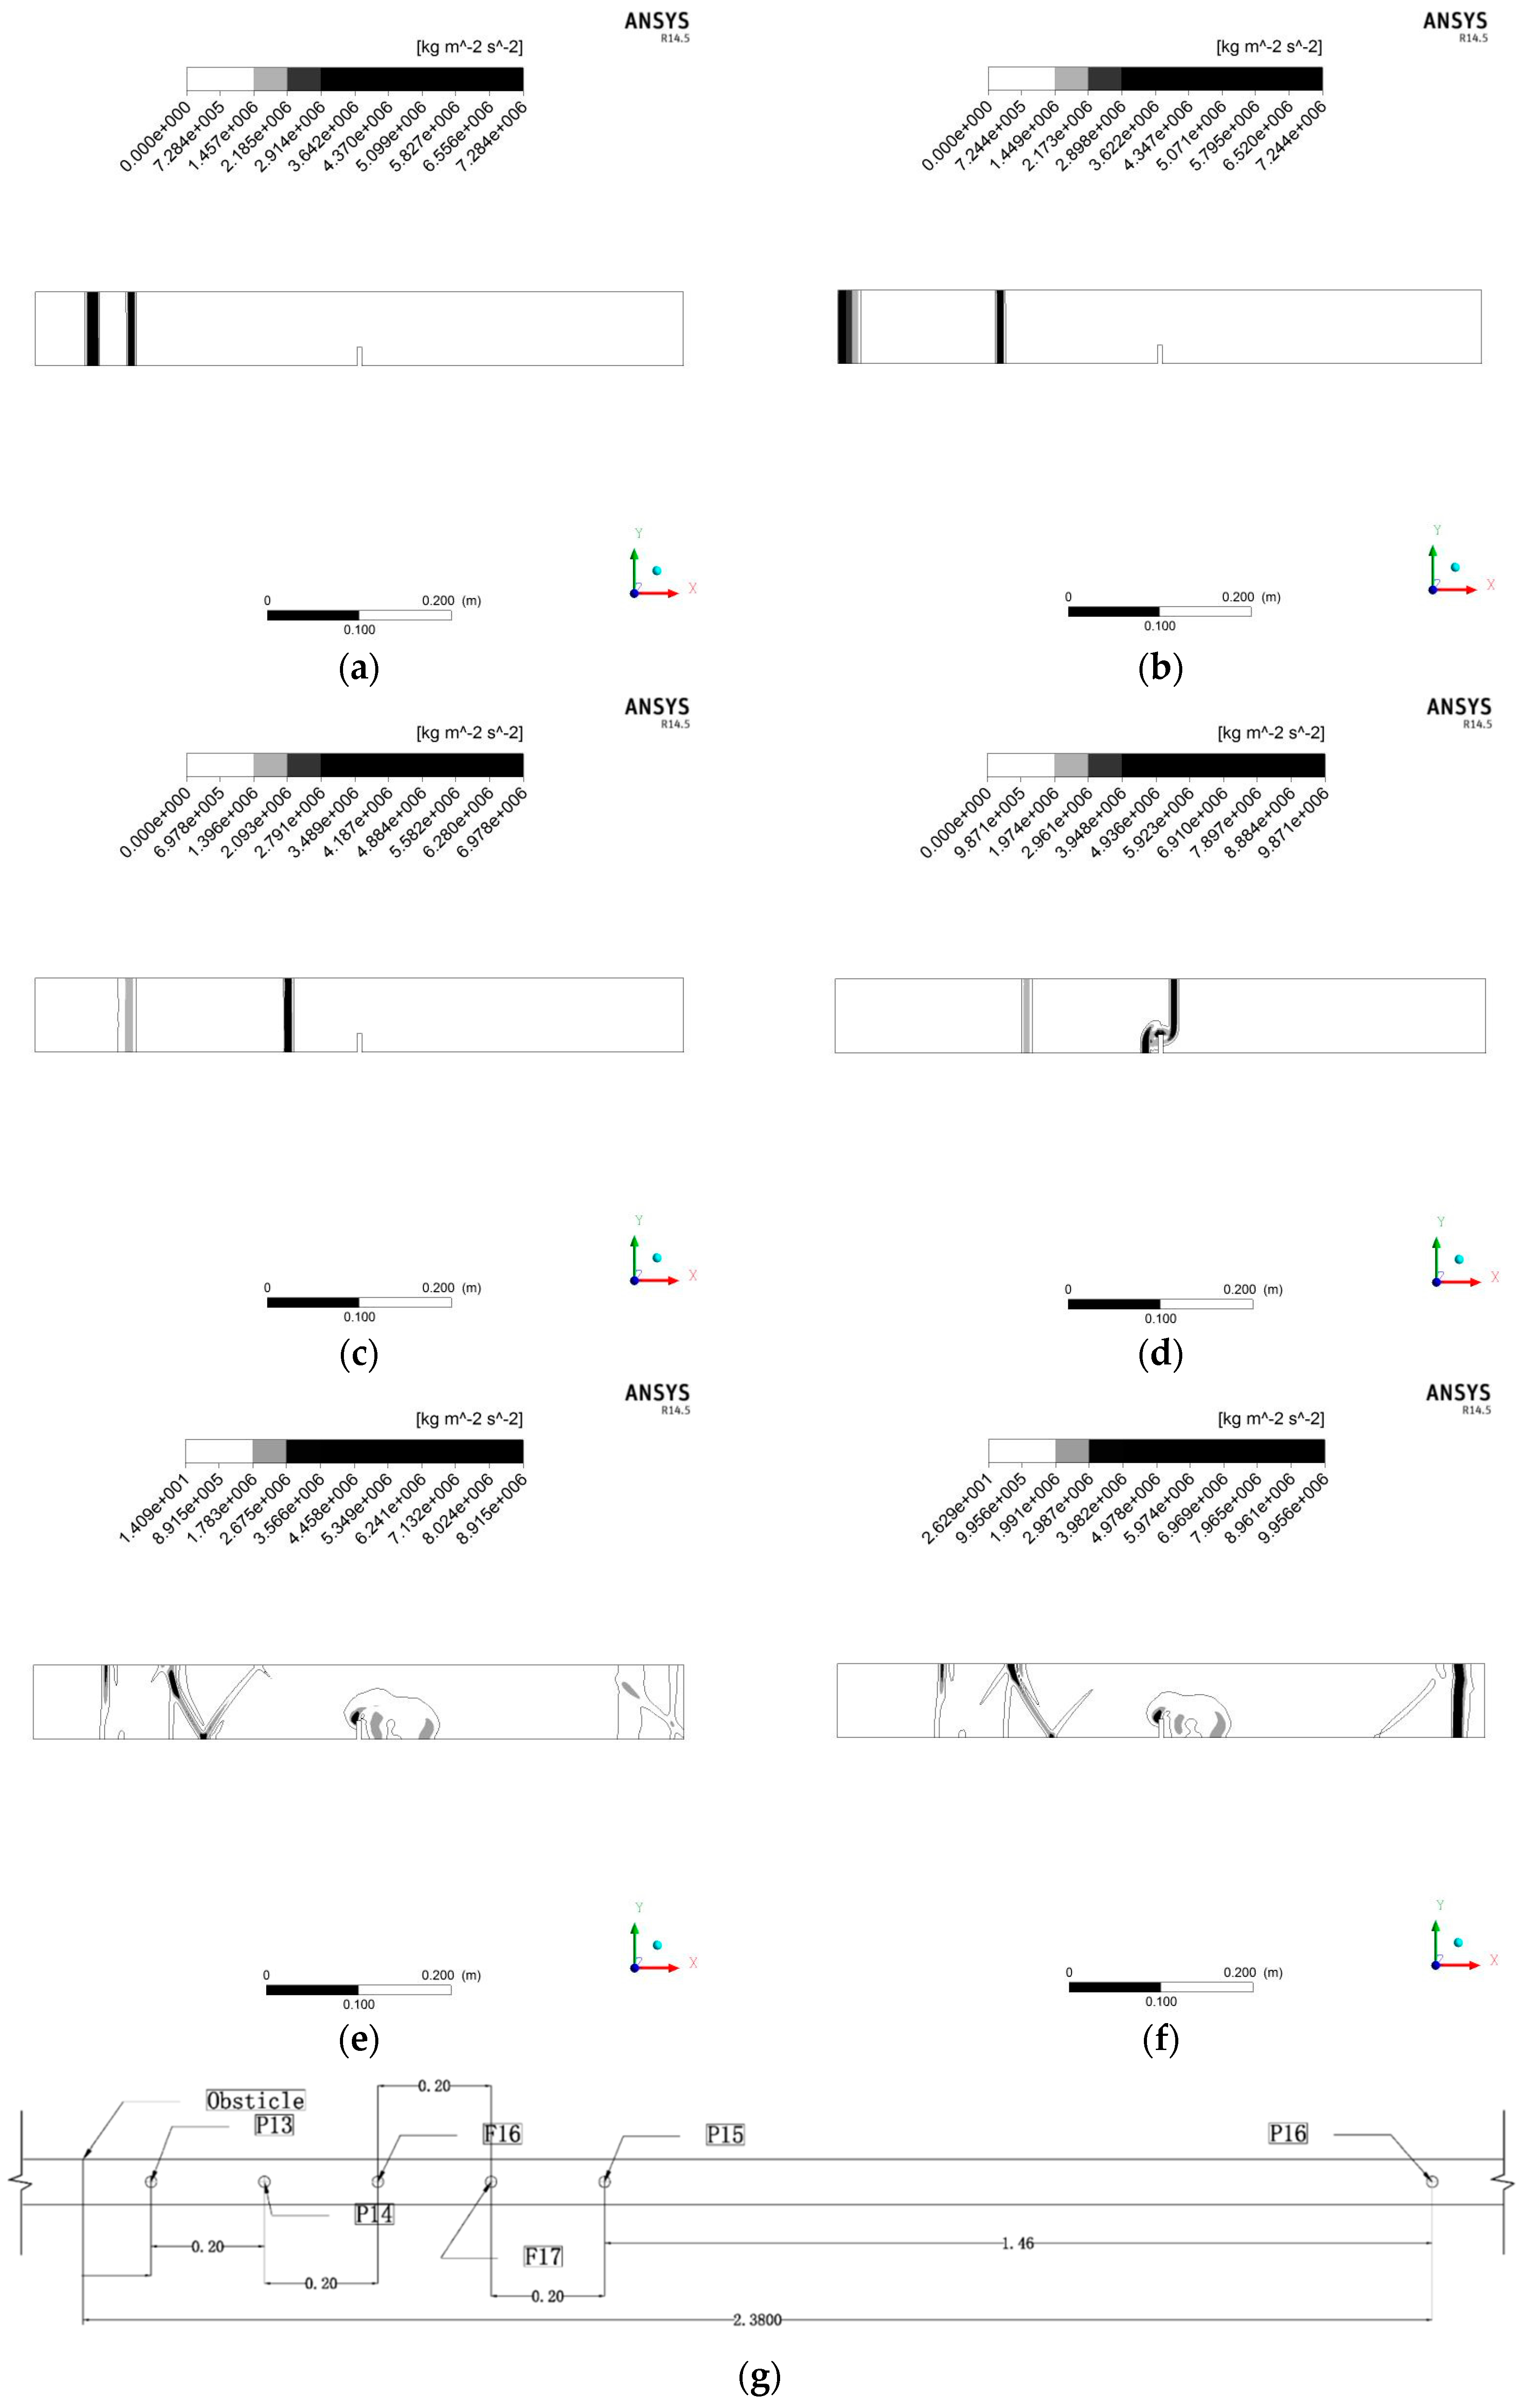
Blast-waves propagate through obstacles with blockage ratios (BR) of 25%, 50%, and 75% are simulated and analyzed using the same strategy as the bend cases. BR is calculated as the blocked area divided by the total area of the cross-section. The total length of the selected gallery is 0.705 m. The obstacle is located at 0.35 m downstream of the inlet and is 0.005 m thick. The location of the obstacle in the experimental explosion duct is shown in
Figure 13g, right after the 9.45 m pre-duct shown in
Figure 1. The diameter of the duct is also 0.08 m. The pressure sensor upstream of the bend is placed along the centerline of the duct, 0.12 m apart from the inlet. The sensor downstream of the bend is placed along the duct centerline, 0.12 m from the outlet.
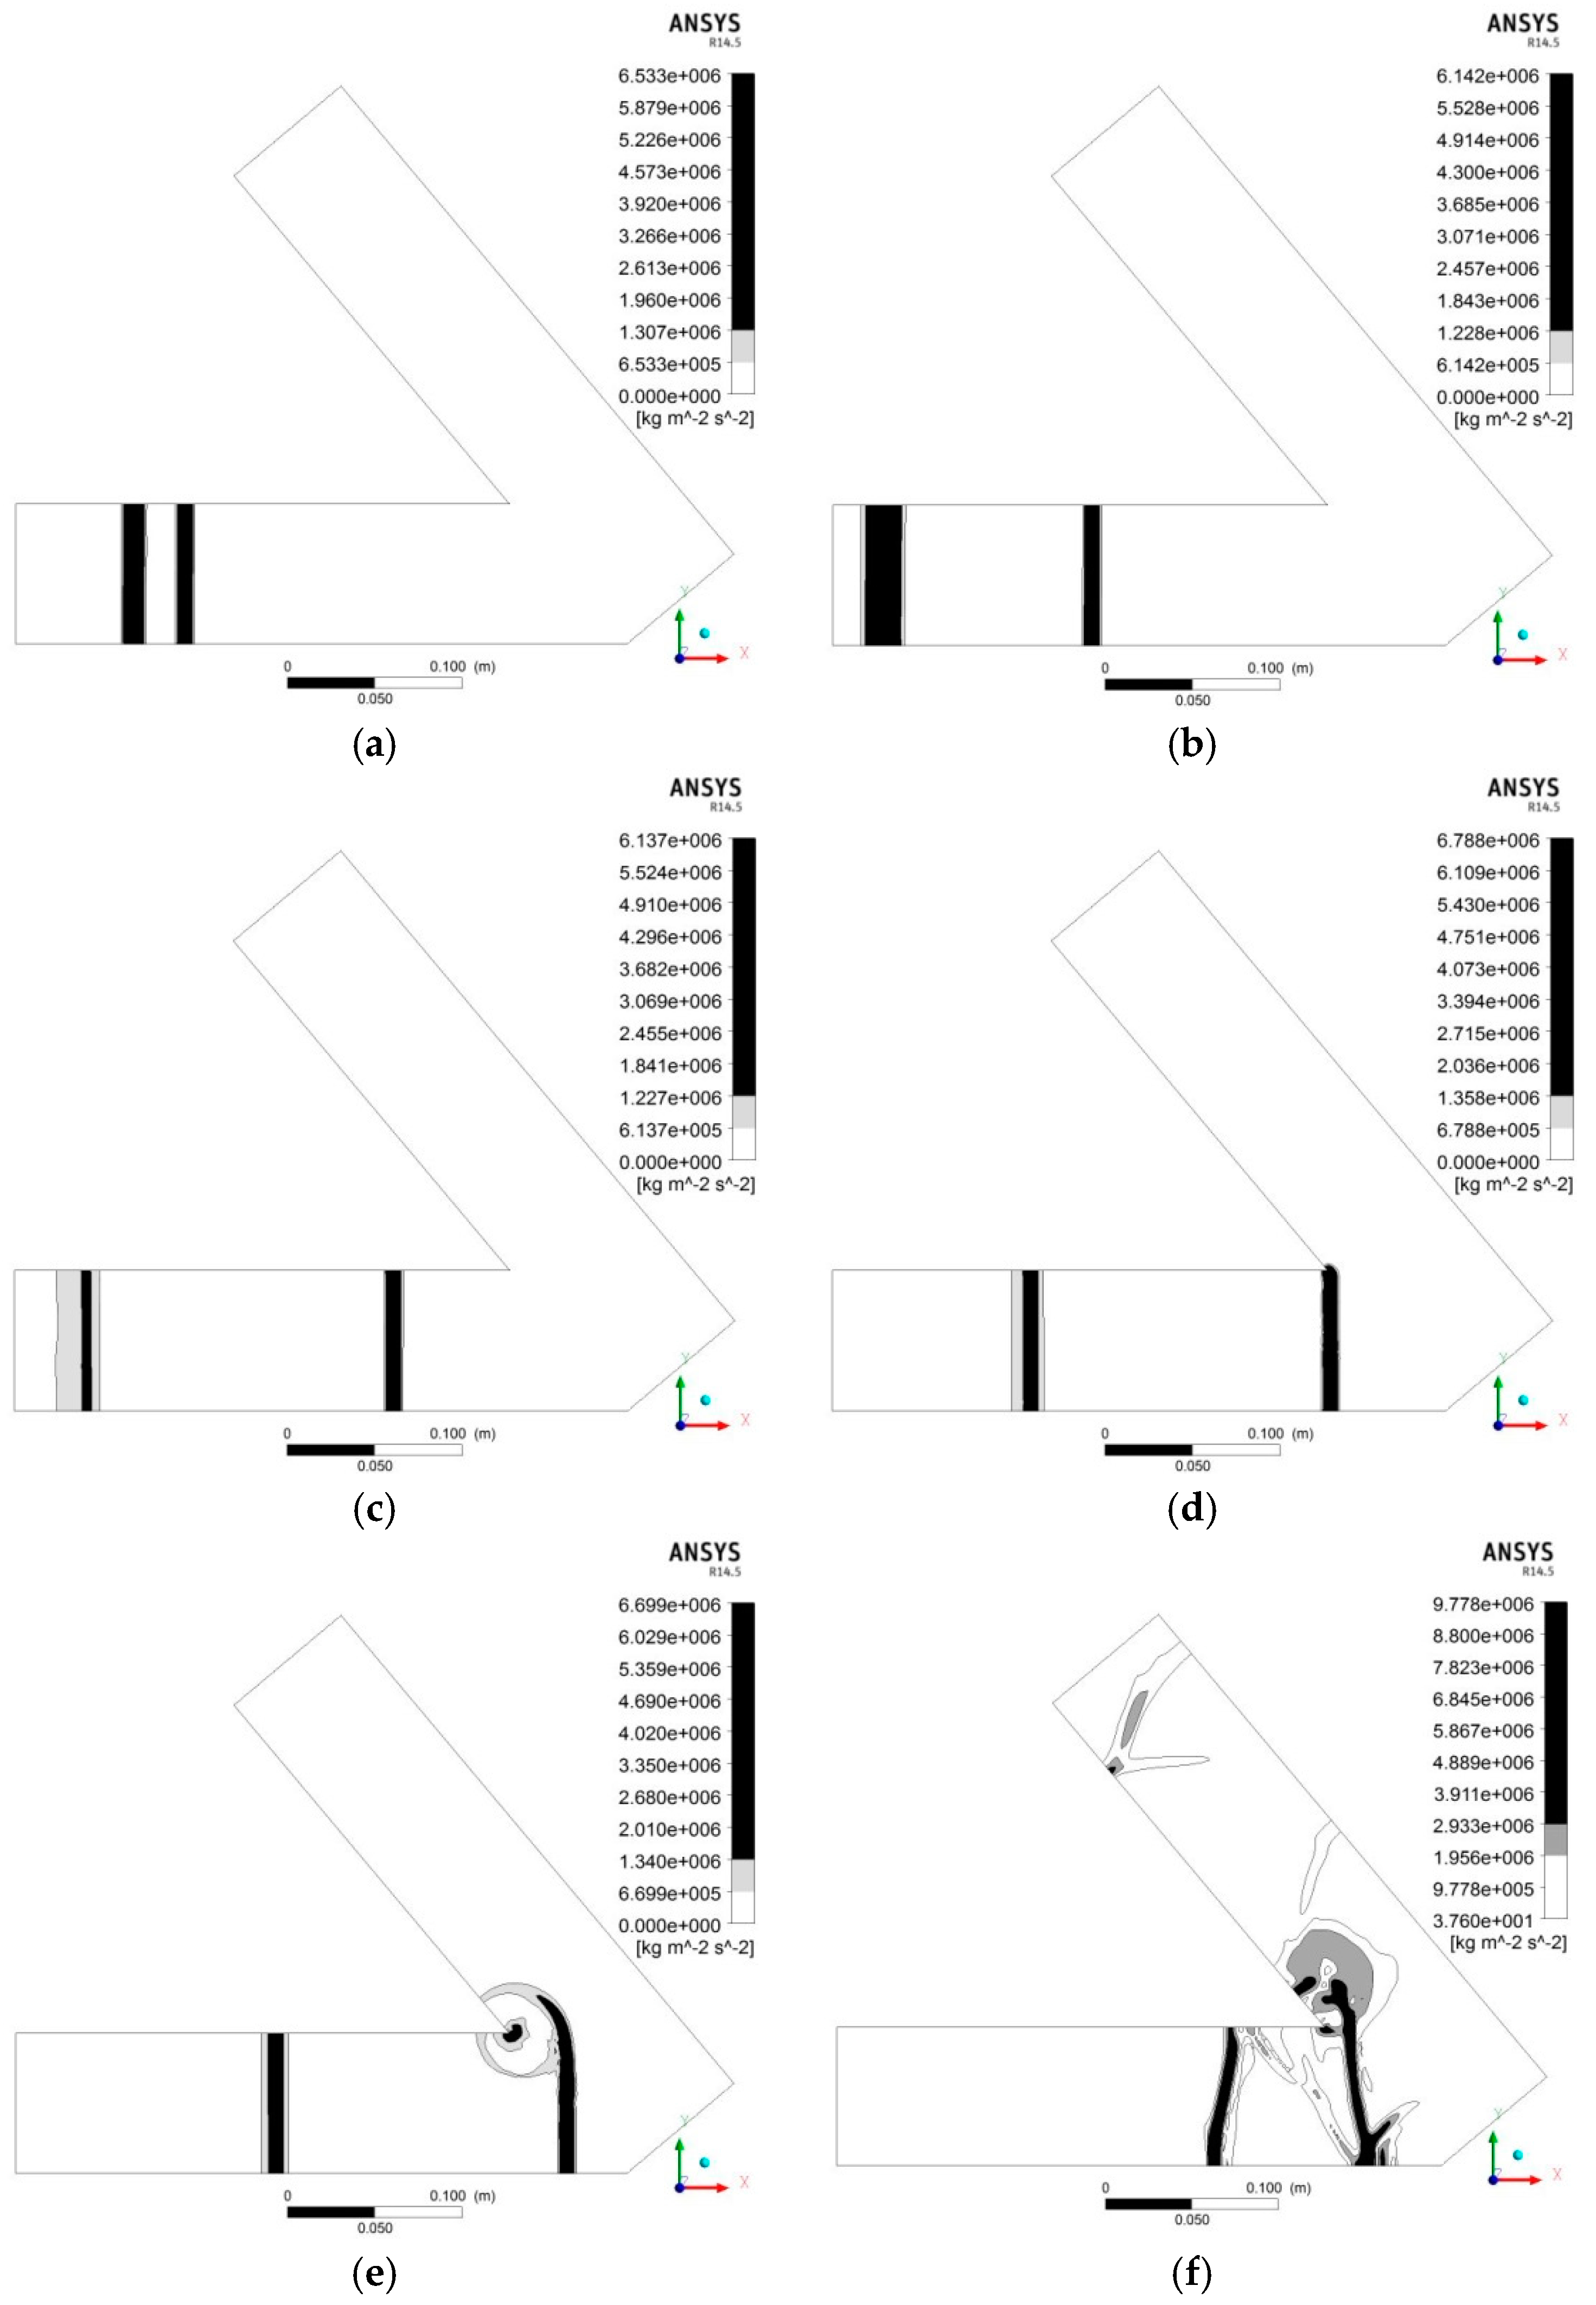
BR 25%. The predicted overpressure gradient contours after 25, 100, 200, and 300 time steps when the blast-wave was passing through an obstacle with a blockage ratio of 25% are shown in
Figure 13a–d.
Figure 13e,f show the overpressure contours at the instants of 0.00183 s and 0.00215 s, when maximum overpressures of the first impulse were obtained by the upstream and downstream sensors.
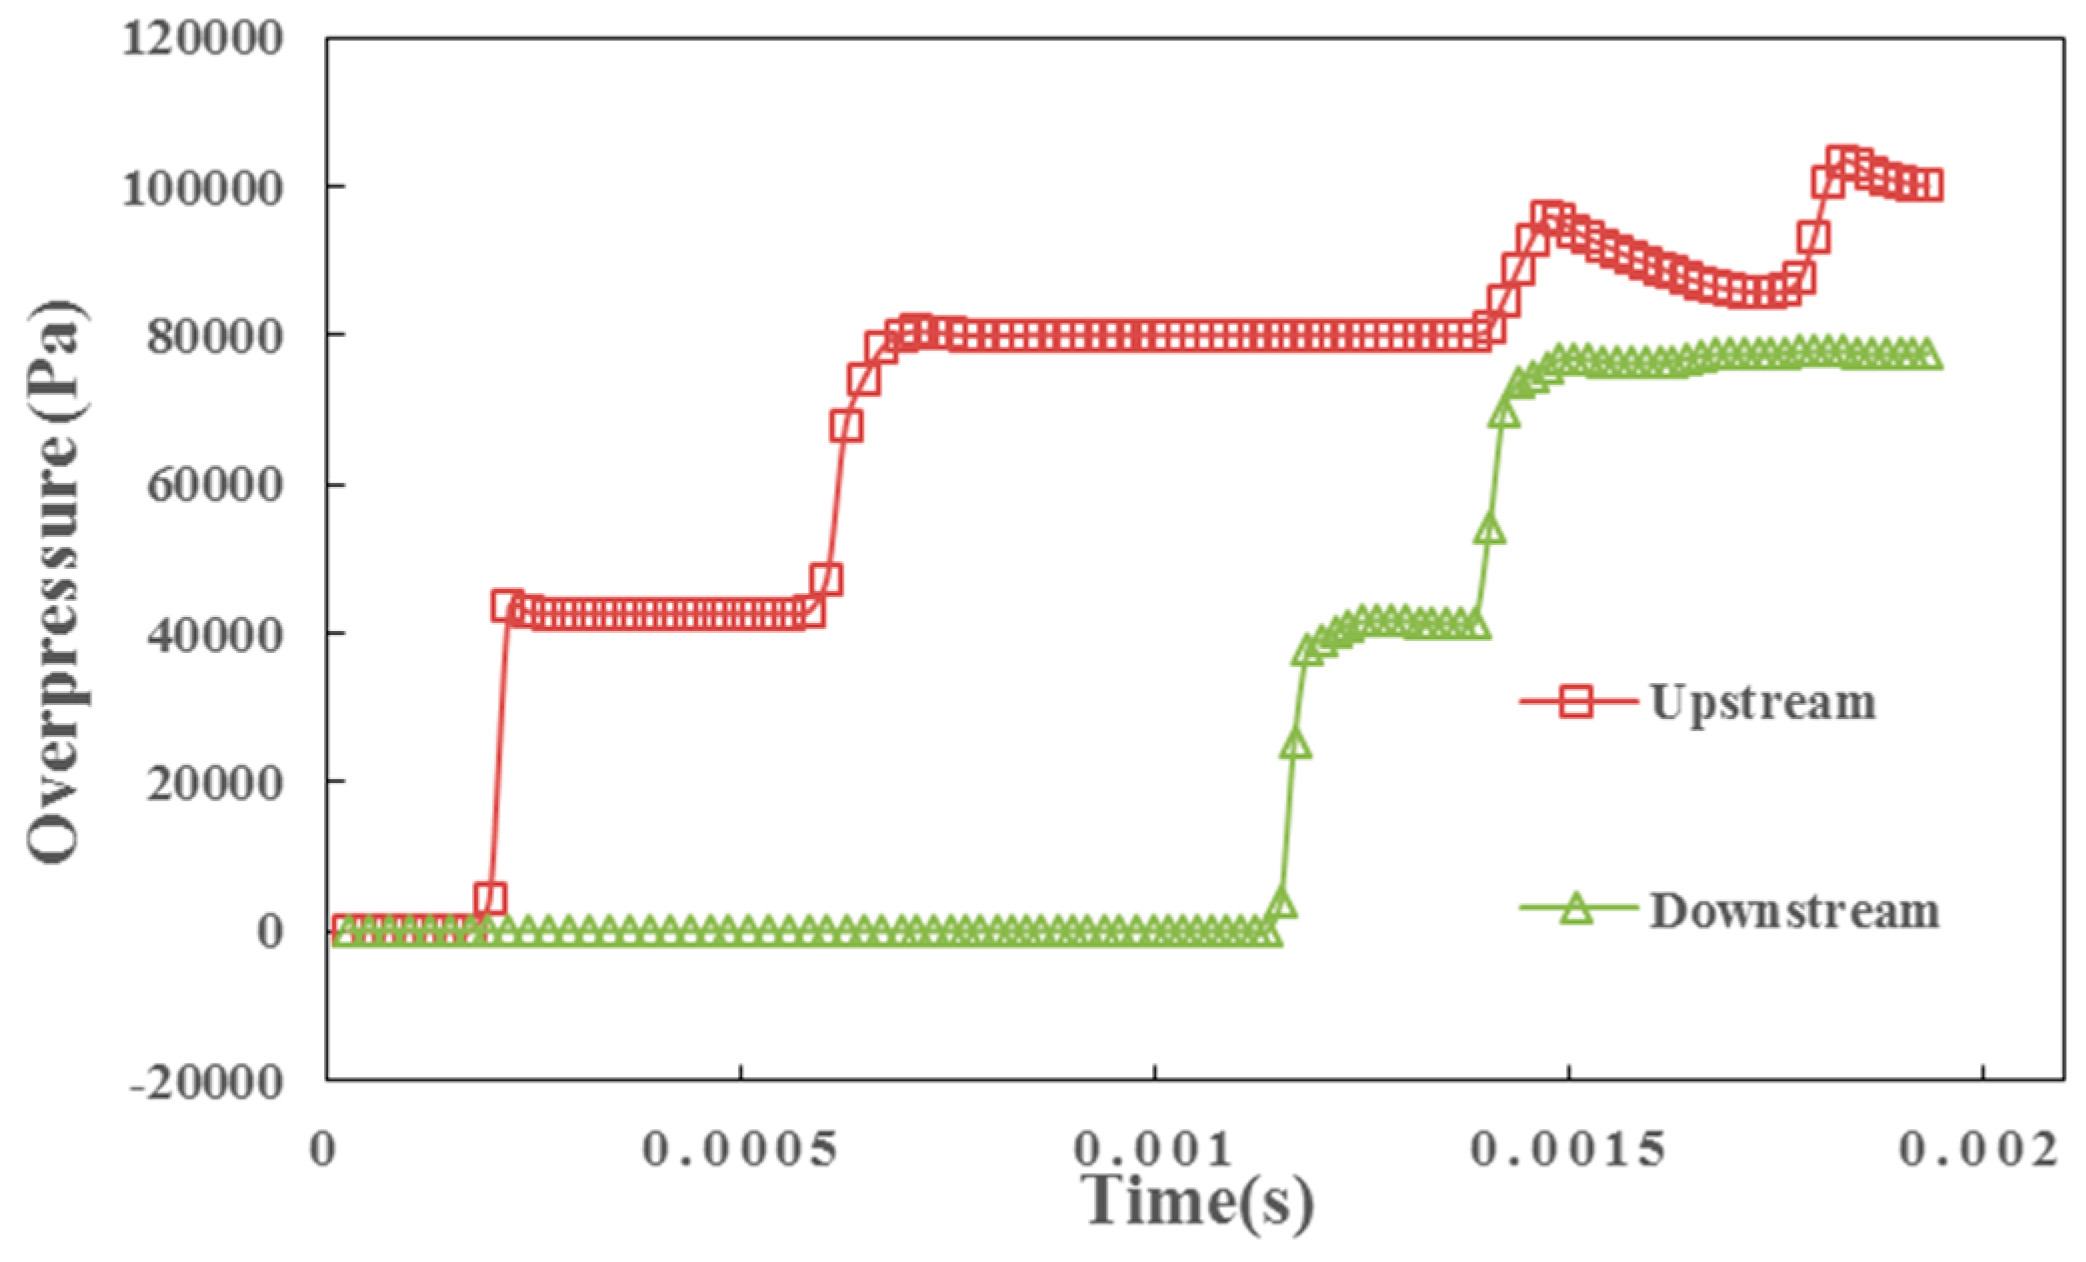
Figure 14 shows the overpressure histories upstream and downstream of an obstacle with a BR of 25%. The maximum overpressure for the first impulse upstream of the bend is 103,392 Pa at 0.00183 s, while the attenuated maximum overpressure for the first impulse downstream the bend is 77,866 Pa at 0.00215 s, the attenuation factor η is 1.328.
BR 50% and 75%. The overpressure gradient contours with blockage ratios of 50% and 75% are similar as the BR 25% case and, therefore, will not be demonstrated. However, their attenuation capability varies significantly. The details will be discussed in
Section 5.
The comparison of overpressure histories between the BR 50% and 75% scenarios are shown in
Figure 15. Similar to the BR 25% case, the downstream overpressure maintains relatively high levels with the predicted η of 1.559 and 1.959, respectively. This pattern of downstream overpressure histories is also seen in the bend cases with obtuse angles; however, obstacles provide more remarkable attenuation effects on a blast-wave propagation.
4.3. T-Branches
The last category of geometric changes selected for this study include two T-branch cases. The length of the three arms, perpendicular to each other, of the T-branch is 0.35 m. The diameter of the duct is 0.08 m. The pressure sensor upstream of the T-branch was placed along the centerline of the duct, 0.12 m apart from the inlet. The sensors downstream were placed along the duct centerline, 0.12 m from the outlet.
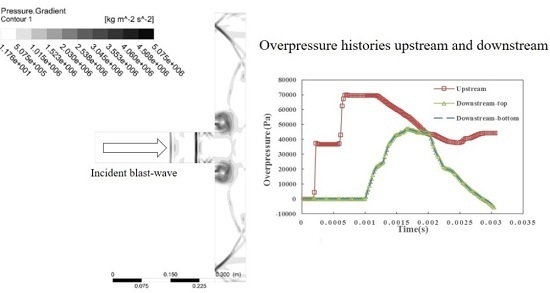
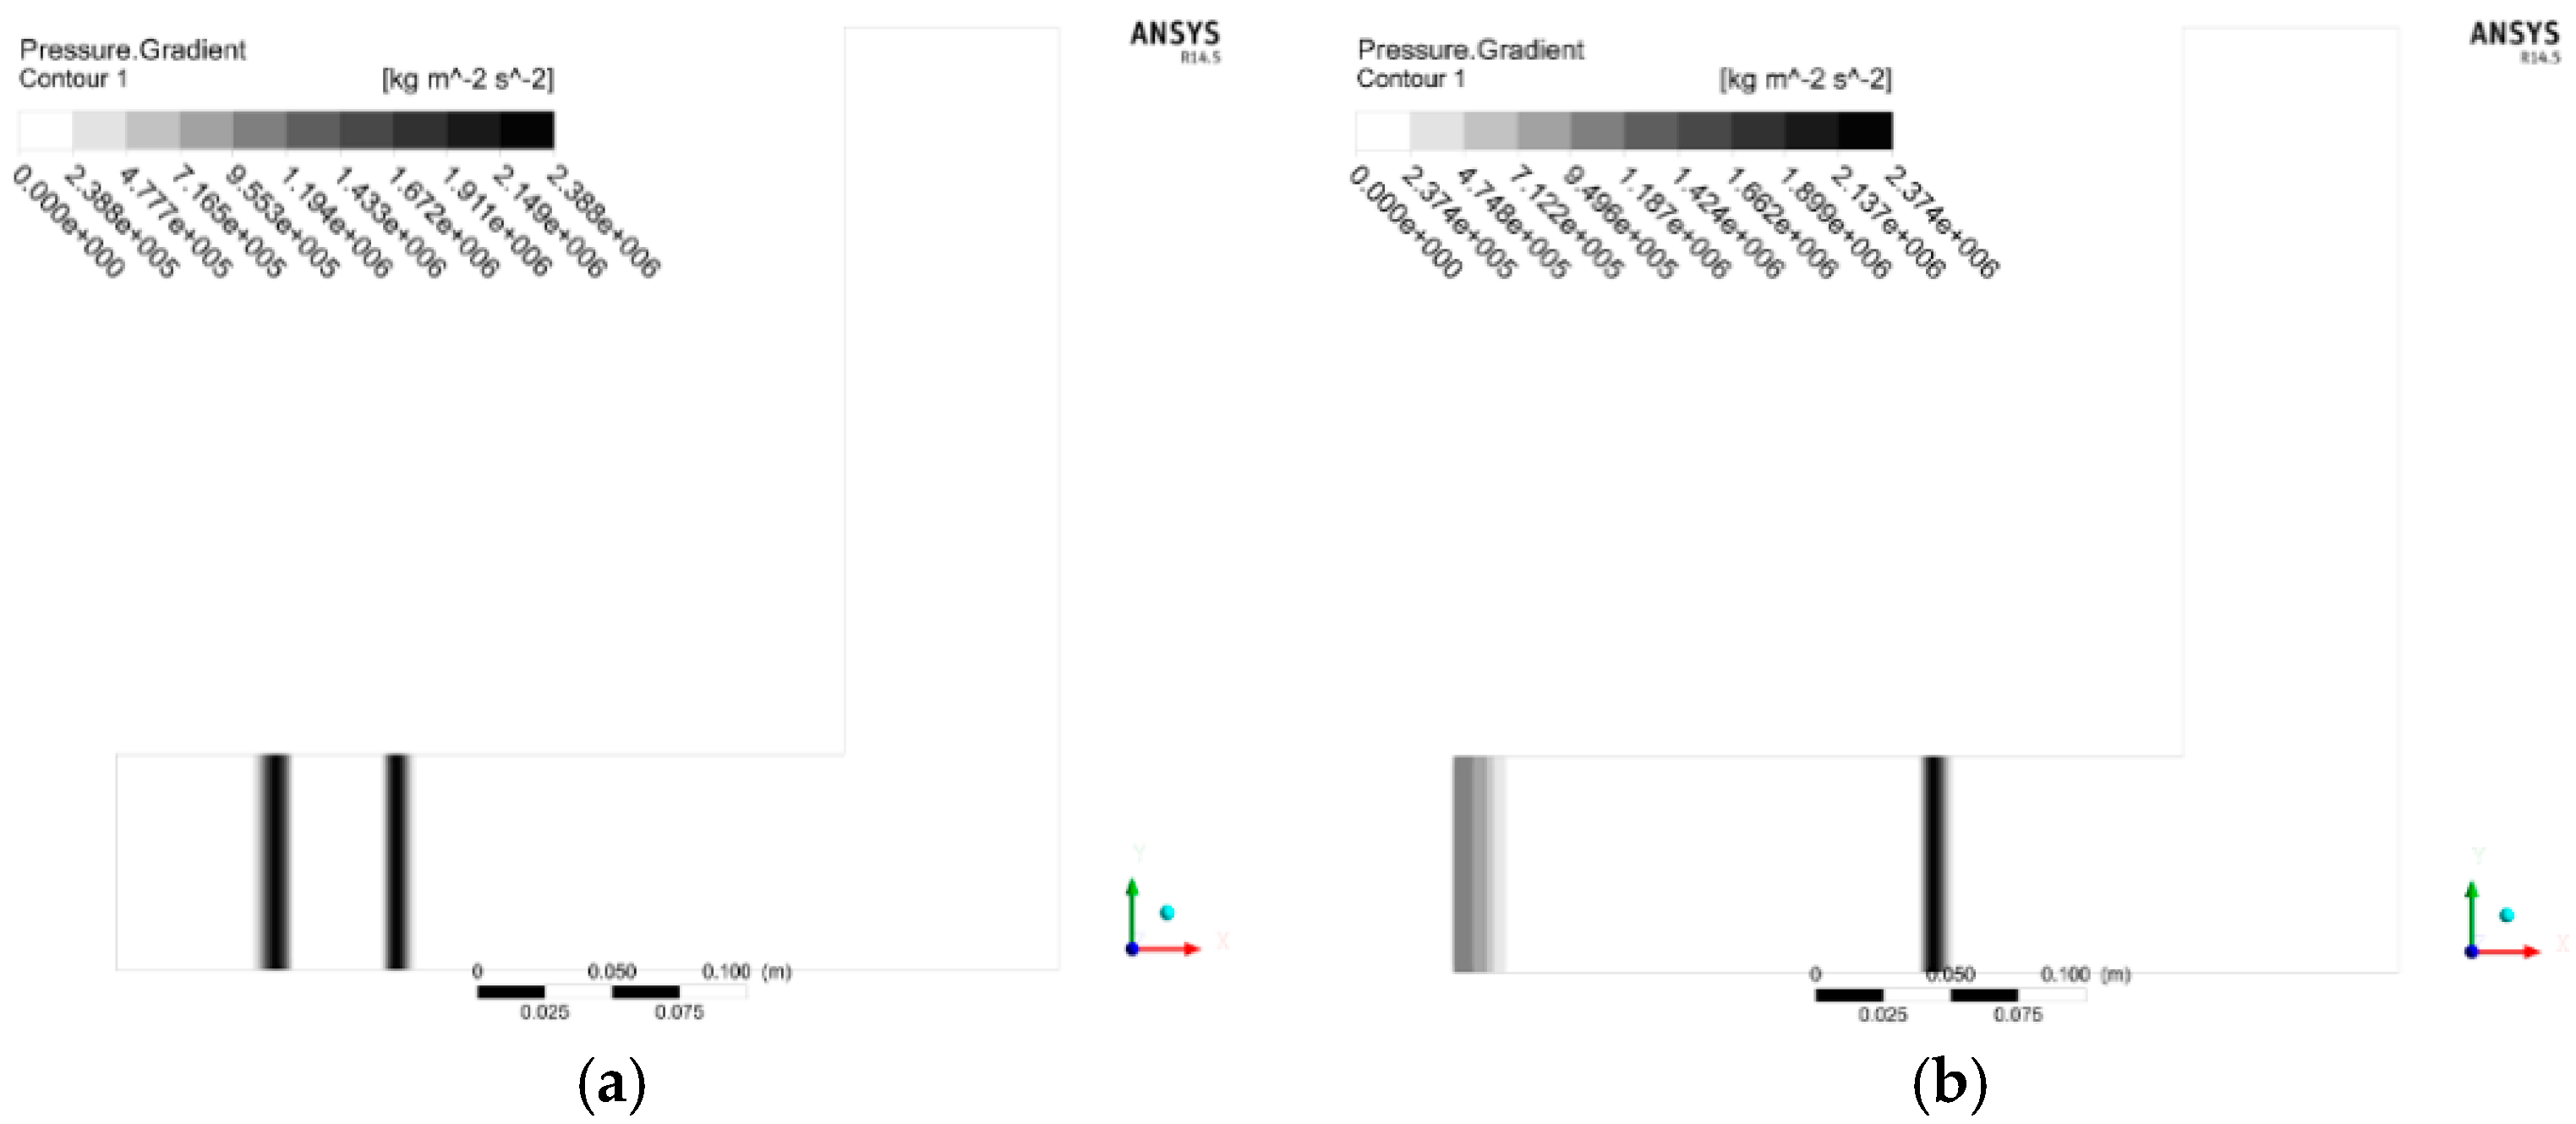
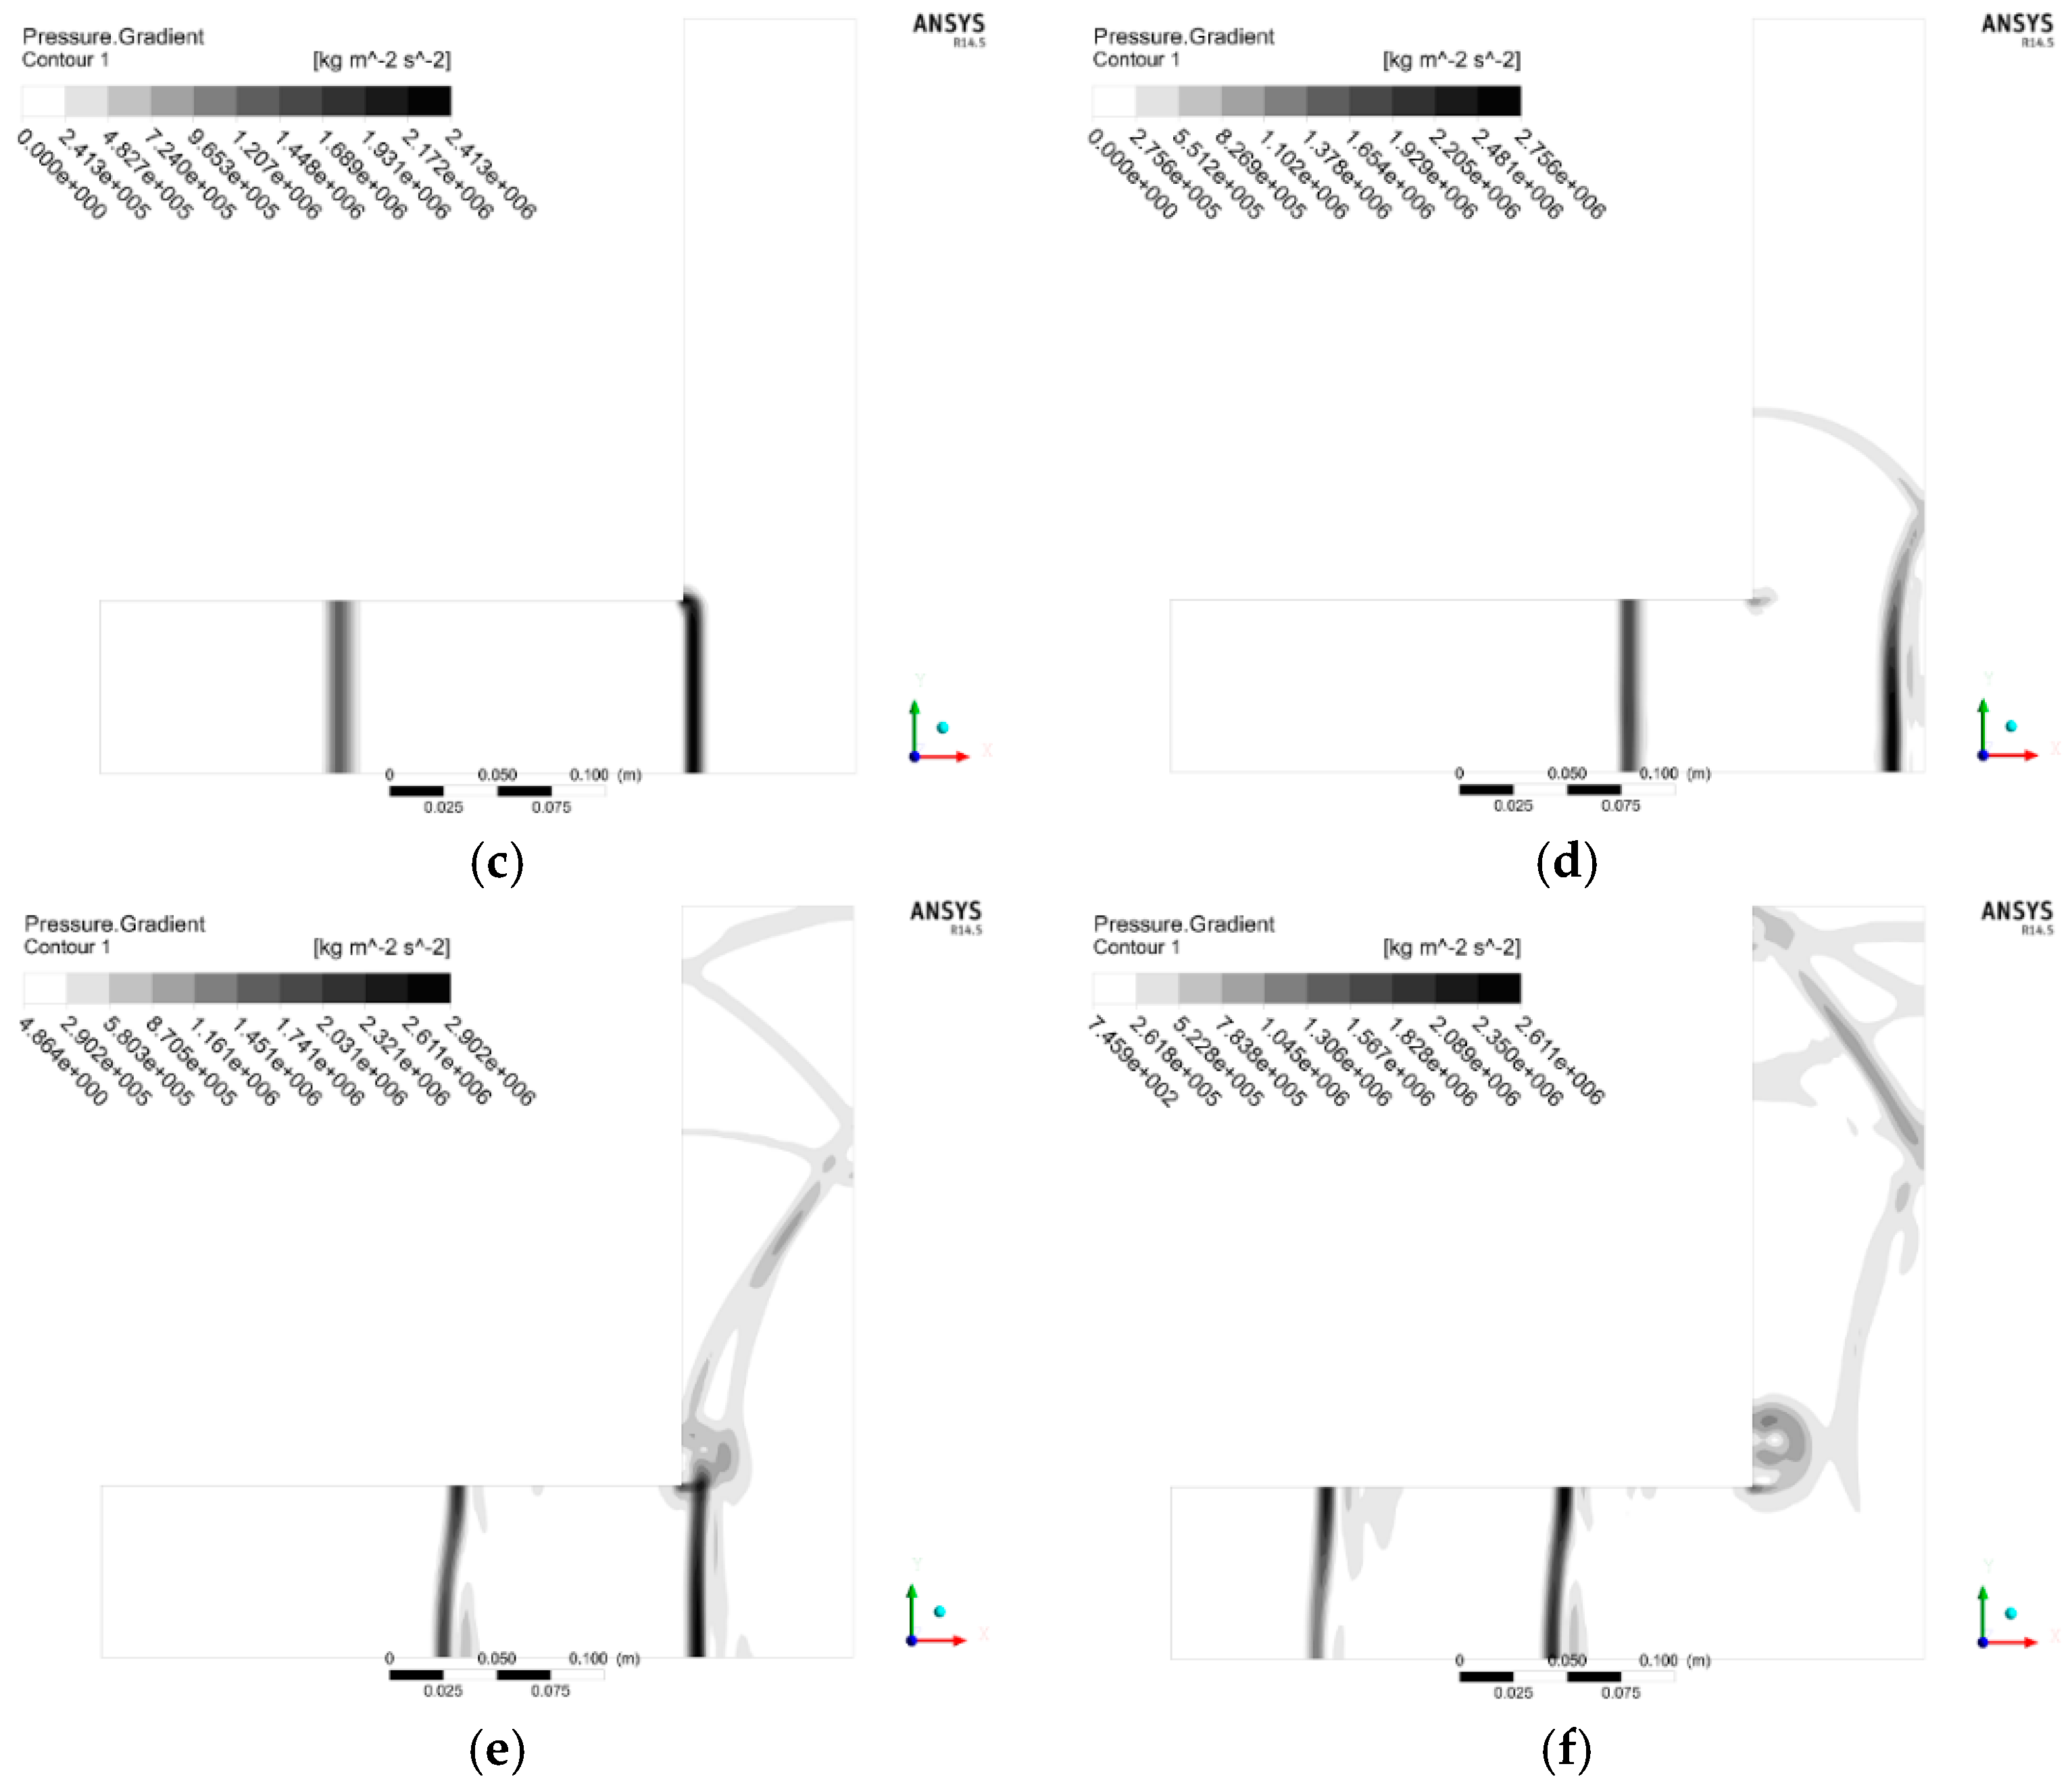
The predicted overpressure gradient contours, and where it flowed from the main arm to the branch arm, are shown in
Figure 16 when maximum overpressures of the first impulse were obtained by the downstream sensors.
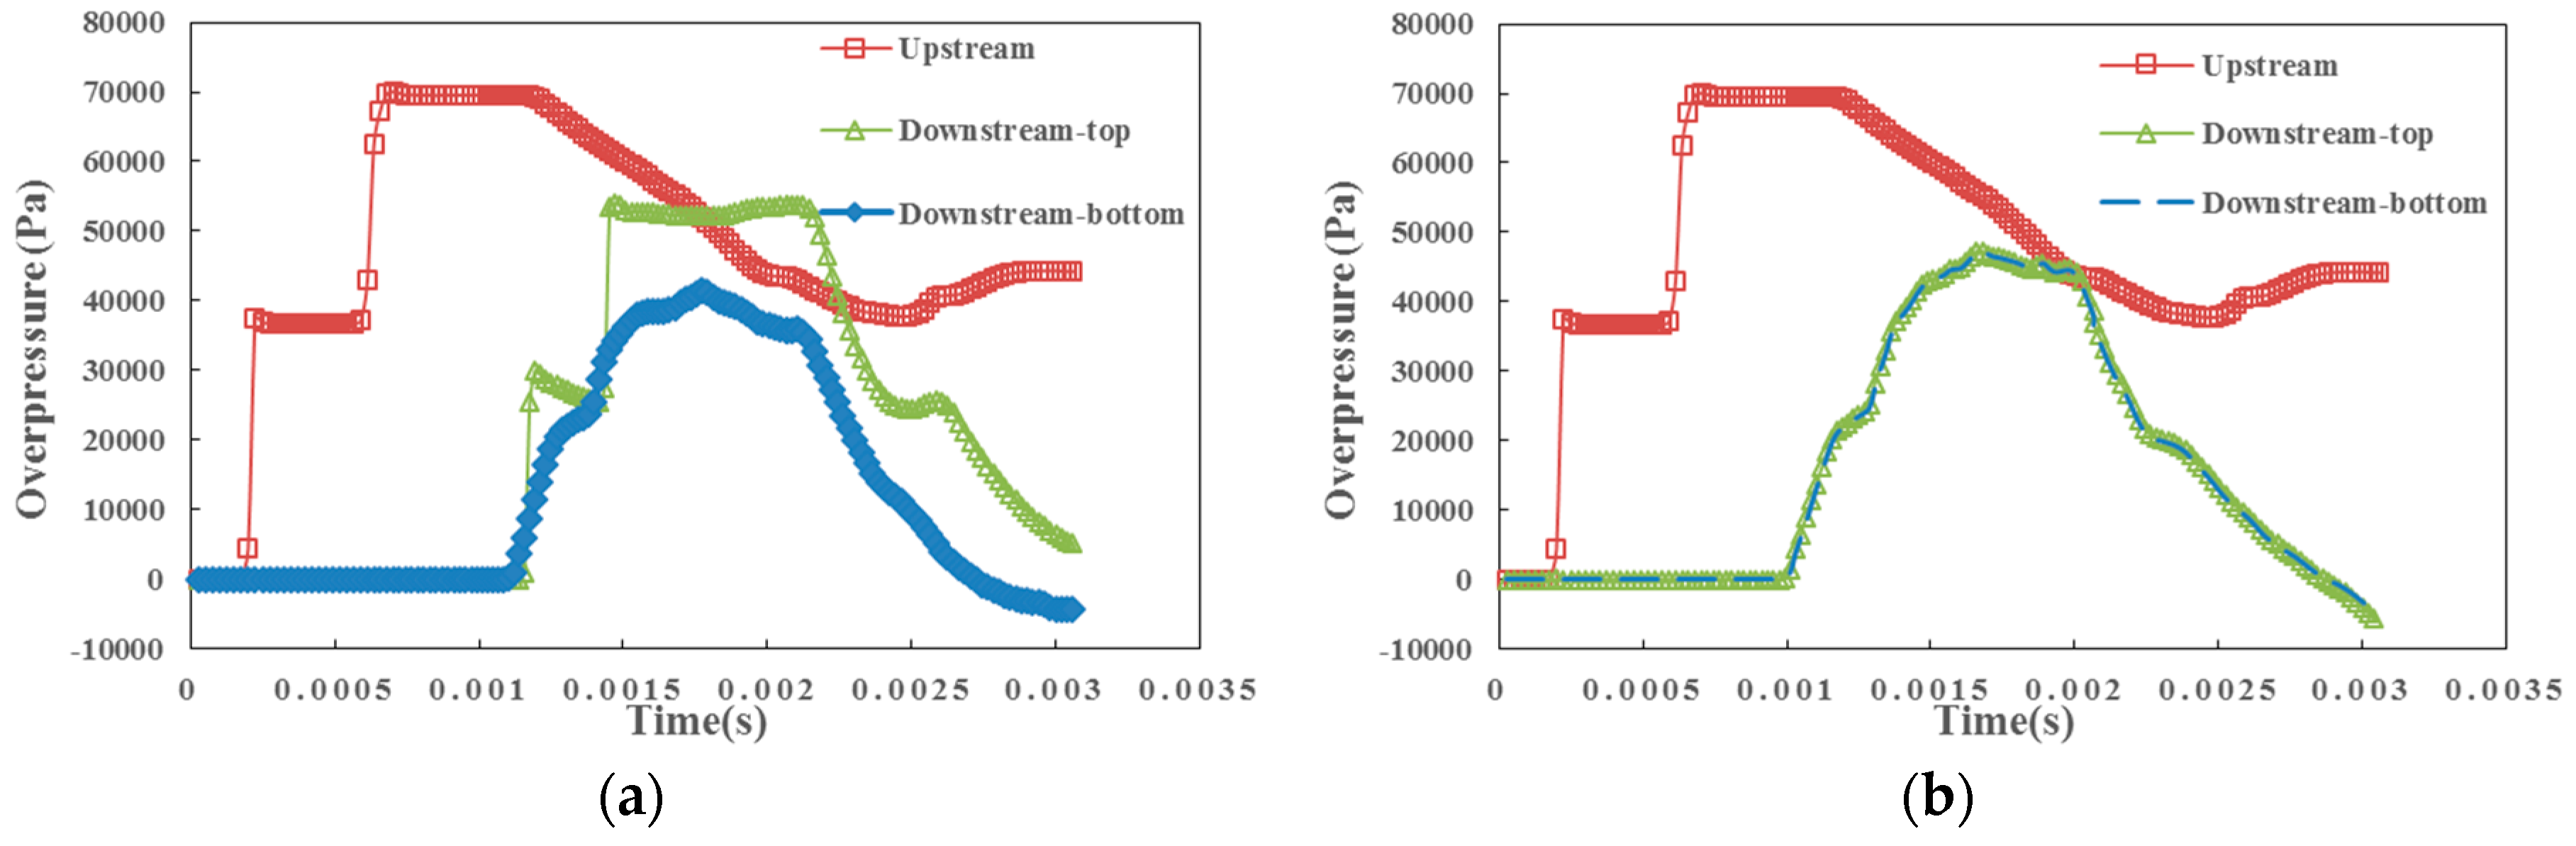
The overpressure histories upstream and downstream of the two T-branch scenarios are demonstrated in
Figure 17.
For the case where the incident wave propagates from the main arm (
Figure 17a), the maximum overpressure for the first impulse upstream of the bend was 69,651 Pa at 0.000658 s, while the attenuated maximum overpressure for the first impulse of the downstream-top and downstream-bottom were 41,383 Pa at 0.00177 s and 53,974 Pa at 0.00147 s. The attenuation factor η for the top branch is 1.683 while for the bottom main arm is 1.29. For the other case, the upstream and downstream overpressure histories are demonstrated in
Figure 17b with the overpressure gradient contour shown in
Figure 16b. In this case, the maximum overpressure for the first impulse upstream the bend is 70,037 Pa at 0.000702 s and the attenuated maximum overpressure for the first impulse of the downstream-top and downstream-bottom are 47,353 Pa at 0.00171 s and 473,285 Pa at 0.00171 s, respectively. Attenuation factors η for the top and bottom branches are 1.479 and 1.481, which are almost identical due to its symmetrical shape. The case of incident wave input from the branch arm is validated by the experimental data, which present η values of 1.86 (predicted as 1.683) and 1.344 (predicted as 1.29) for the top and bottom arms, respectively. The accuracy of the numerical prediction is acceptable.
The attenuation effect of bend and obstacle cases on the overpressure of the blast-wave will be discussed in the next section. As there is an absence of experimental data for T-branch cases when the incident wave is induced from the main arm, this case will be excluded from further discussion.
6. Conclusions
In this study, the attenuation effect of seven types of bends, three obstacles, and two T-branches are investigated numerically. Three main conclusions have been drawn from the preceding analysis: (1) as a bending angle increases from 0° to 180° the attenuation factor increases at 30° until the maximum value is obtained at 50°. Then, it decreases to around 1.14 in the 90° case. The bends with angles greater than 90° tend to slightly strengthen blast-waves; (2) for the obstacles with different blockage ratios, the attenuation factor increases as BR increases; (3) the compressible, and unsteady numerical Euler scheme used in this research tends to overestimate the attenuation factors in the 120° bend; and the obstacles with BR 25%, BR 50%, and BR 75% were in reasonable agreement with experimental results.
The attenuation factor is a rudimentary indicator of the influence of a geometric change, but it has been suggested that the overpressure history curves and its trend should also be considered when dealing with practical problems. Numerical models are simplifications of real cases; the predictions of this research that deviated from the experimental values should be used with extra care. The results of this work could be applied in global overpressure distribution prediction for gas explosions occuring in a full-size underground airway network if the fluid dynamic parameters and the gallery dimensions are reasonably justified.


