Article

Leaching Behavior and Potential Environmental Effects of Trace Elements in Coal Gangue of an Open-Cast Coal Mine Area, Inner Mongolia, China

1
College of Geoscience and Surveying Engineering, China University of Mining and Technology, Beijing 100083, China
2
Branch of Resources and Environment, China National Institute of Standardization, Beijing 100088, China
3
Institute of Geographic Sciences and Natural Resources Research, Chinese Academy of Sciences, Beijing 100101, China
*
Author to whom correspondence should be addressed.
Minerals 2016, 6(2), 50; https://doi.org/10.3390/min6020050
Submission received: 28 February 2016 / Revised: 5 May 2016 / Accepted: 6 May 2016 / Published: 27 May 2016
(This article belongs to the Special Issue Minerals in Coal)

Abstract

:
In order to better understand the role of coal gangue in potential environmental and ecological risks, the leaching behavior of trace elements from coal gangue has been investigated in an open-cast coal mine, Inner Mongolia, China. Four comparative column leaching experiments were conducted to investigate the impacts of leaching time, pH values and sample amount on the leaching behavior of trace elements. Enrichment factors (EF), maximum leached amount (Lam), maximum leachability (Lrm), effects range low (ERL) and effects range median (ERM) were employed to evaluate potential environmental and ecological hazards resulting from the leaching behavior of environment-sensitive trace elements from coal gangue. Leaching time and sample amount display important effects on trace element concentrations, leached amounts and leachability. The pH values exhibit a weak influence on the leaching behavior of the selected trace elements (e.g., As, V, Cr, Co, Ni, Cu, Zn, Se, Cd, Sn, Pb and Hg). The coal gangue are enriched in As, Co, Se and Pb and, in particular, show higher environmental pollution levels of As and Se (EF > 2). Lam values suggest that all of the elements investigated do not show potential risk to soils and vegetation, but have a high hazard risk for ground water. Elements including Ni, As, Cr and Zn are inclined to show high or moderate biological toxicity.

Graphical Abstract

1. Introduction

In recent years, coal has accounted for 74% of China’s total primary energy consumption and will continue to be the major energy source in the next decades [1]. However, environmental hazards were caused as a result of the release and dispersal of harmful trace elements contained in coal, coal gangue and coal combustion residues [2,3,4,5]. The rapid development of coal mining in China over the last twenty years has led to a huge coal gangue accumulation in coalfields. According to the incomplete statistics of 2010, there were more than 4.5 billion tons of coal gangue, which covered approximately 1.5 thousands square kilometers of land in China [6]. This could result in substantial environmental hazard and ecological risk, such as soil and water pollution and ecological deterioration, if reasonable precautions are not taken [7,8].
Coal gangue, a mixture of rocks derived from coal bed’s roof, floor, partings and coal itself, is mainly produced from coal mining and, in some cases, is enriched in some toxic trace elements [9,10,11]. Trace elements are defined as elements with concentrations lower than 0.1% in coal gangue [12]; they have become a hot topic due to the complex changes of their particles, inability to decompose in natural processes and high toxicity to ecosystems following their release and dispersal into the atmosphere, soils, water and vegetation through the pathways of leaching, weathering and spontaneous combustion [6,9,13,14]. Leaching has proven to be one of the primary pathways for trace elements entering into the ecosystem. Extensive studies on the leaching behavior of trace elements from coal, coal fly ash and bottom ash have been conducted [13,15,16,17]. However, studies focused on the leaching behavior of trace elements from coal gangue are relatively rare [6,18], especially from coal gangue piles. Nevertheless, “leaching behavior” and its impact factors are not clearly defined in these current investigations.
Time is one of the important impact factors on the leaching behavior of trace elements from coal gangue [4,19,20]. The integrative efforts to determine the leaching behavior of the selected trace elements from coal gangue piles indicated that it is a very complex process in terms of the leaching pathways, which might be influenced by various factors. Moreover, the potential environmental impacts of the resulting leachates from coal gangue should be given more attention and studied extensively using quantitative assessment methods due to their emergent potential pollution and toxicity.
Therefore, this study was conducted to focus on investigations on the leaching behavior of trace elements from coal gangue piles and their environmental effects. Based on the comparative column leaching experiments, the environmental and ecological risks generated by the trace elements of the resulting leachates from coal gangue piles were evaluated in detail by different semi-quantitative methods. The leaching behavior of the trace elements from coal gangue piles, in this study, mainly refers to the leached concentrations of trace elements, leached amount, leachability, maximum leached amount (Lam) and maximum leachability (Lrm). The roles of the impact factors, including leaching time, pH of the leaching solution and sample amount, were simultaneously analyzed.
Twenty-six trace elements in coal, proposed by Swaine [12], could lead to potential environmental impacts, including As, Cr, Cd, Hg, Pb, Se, B, Mn, Ni, Cu, V, Zn, Co, Sn, Cl, F, Mo, Bo, P, Th, U, Ba, I, Ra, Sb and Tl. Particularly, elements As, Cd, Cr, Hg, Pb and Se are of most environmental importance [12], while elements Ni, Cu, V, Zn, Co and Sn have generally been analyzed in other leaching experiments [6,8]. Twelve trace elements, including As, V, Cr, Co, Ni, Cu, Zn, Se, Cd, Sn, Pb and Hg, were therefore selected for investigation in this study, to assess their leaching behavior in coal gangue piles and the corresponding environmental and ecological hazards levels.

2. Materials and Methods

2.1. Study Area

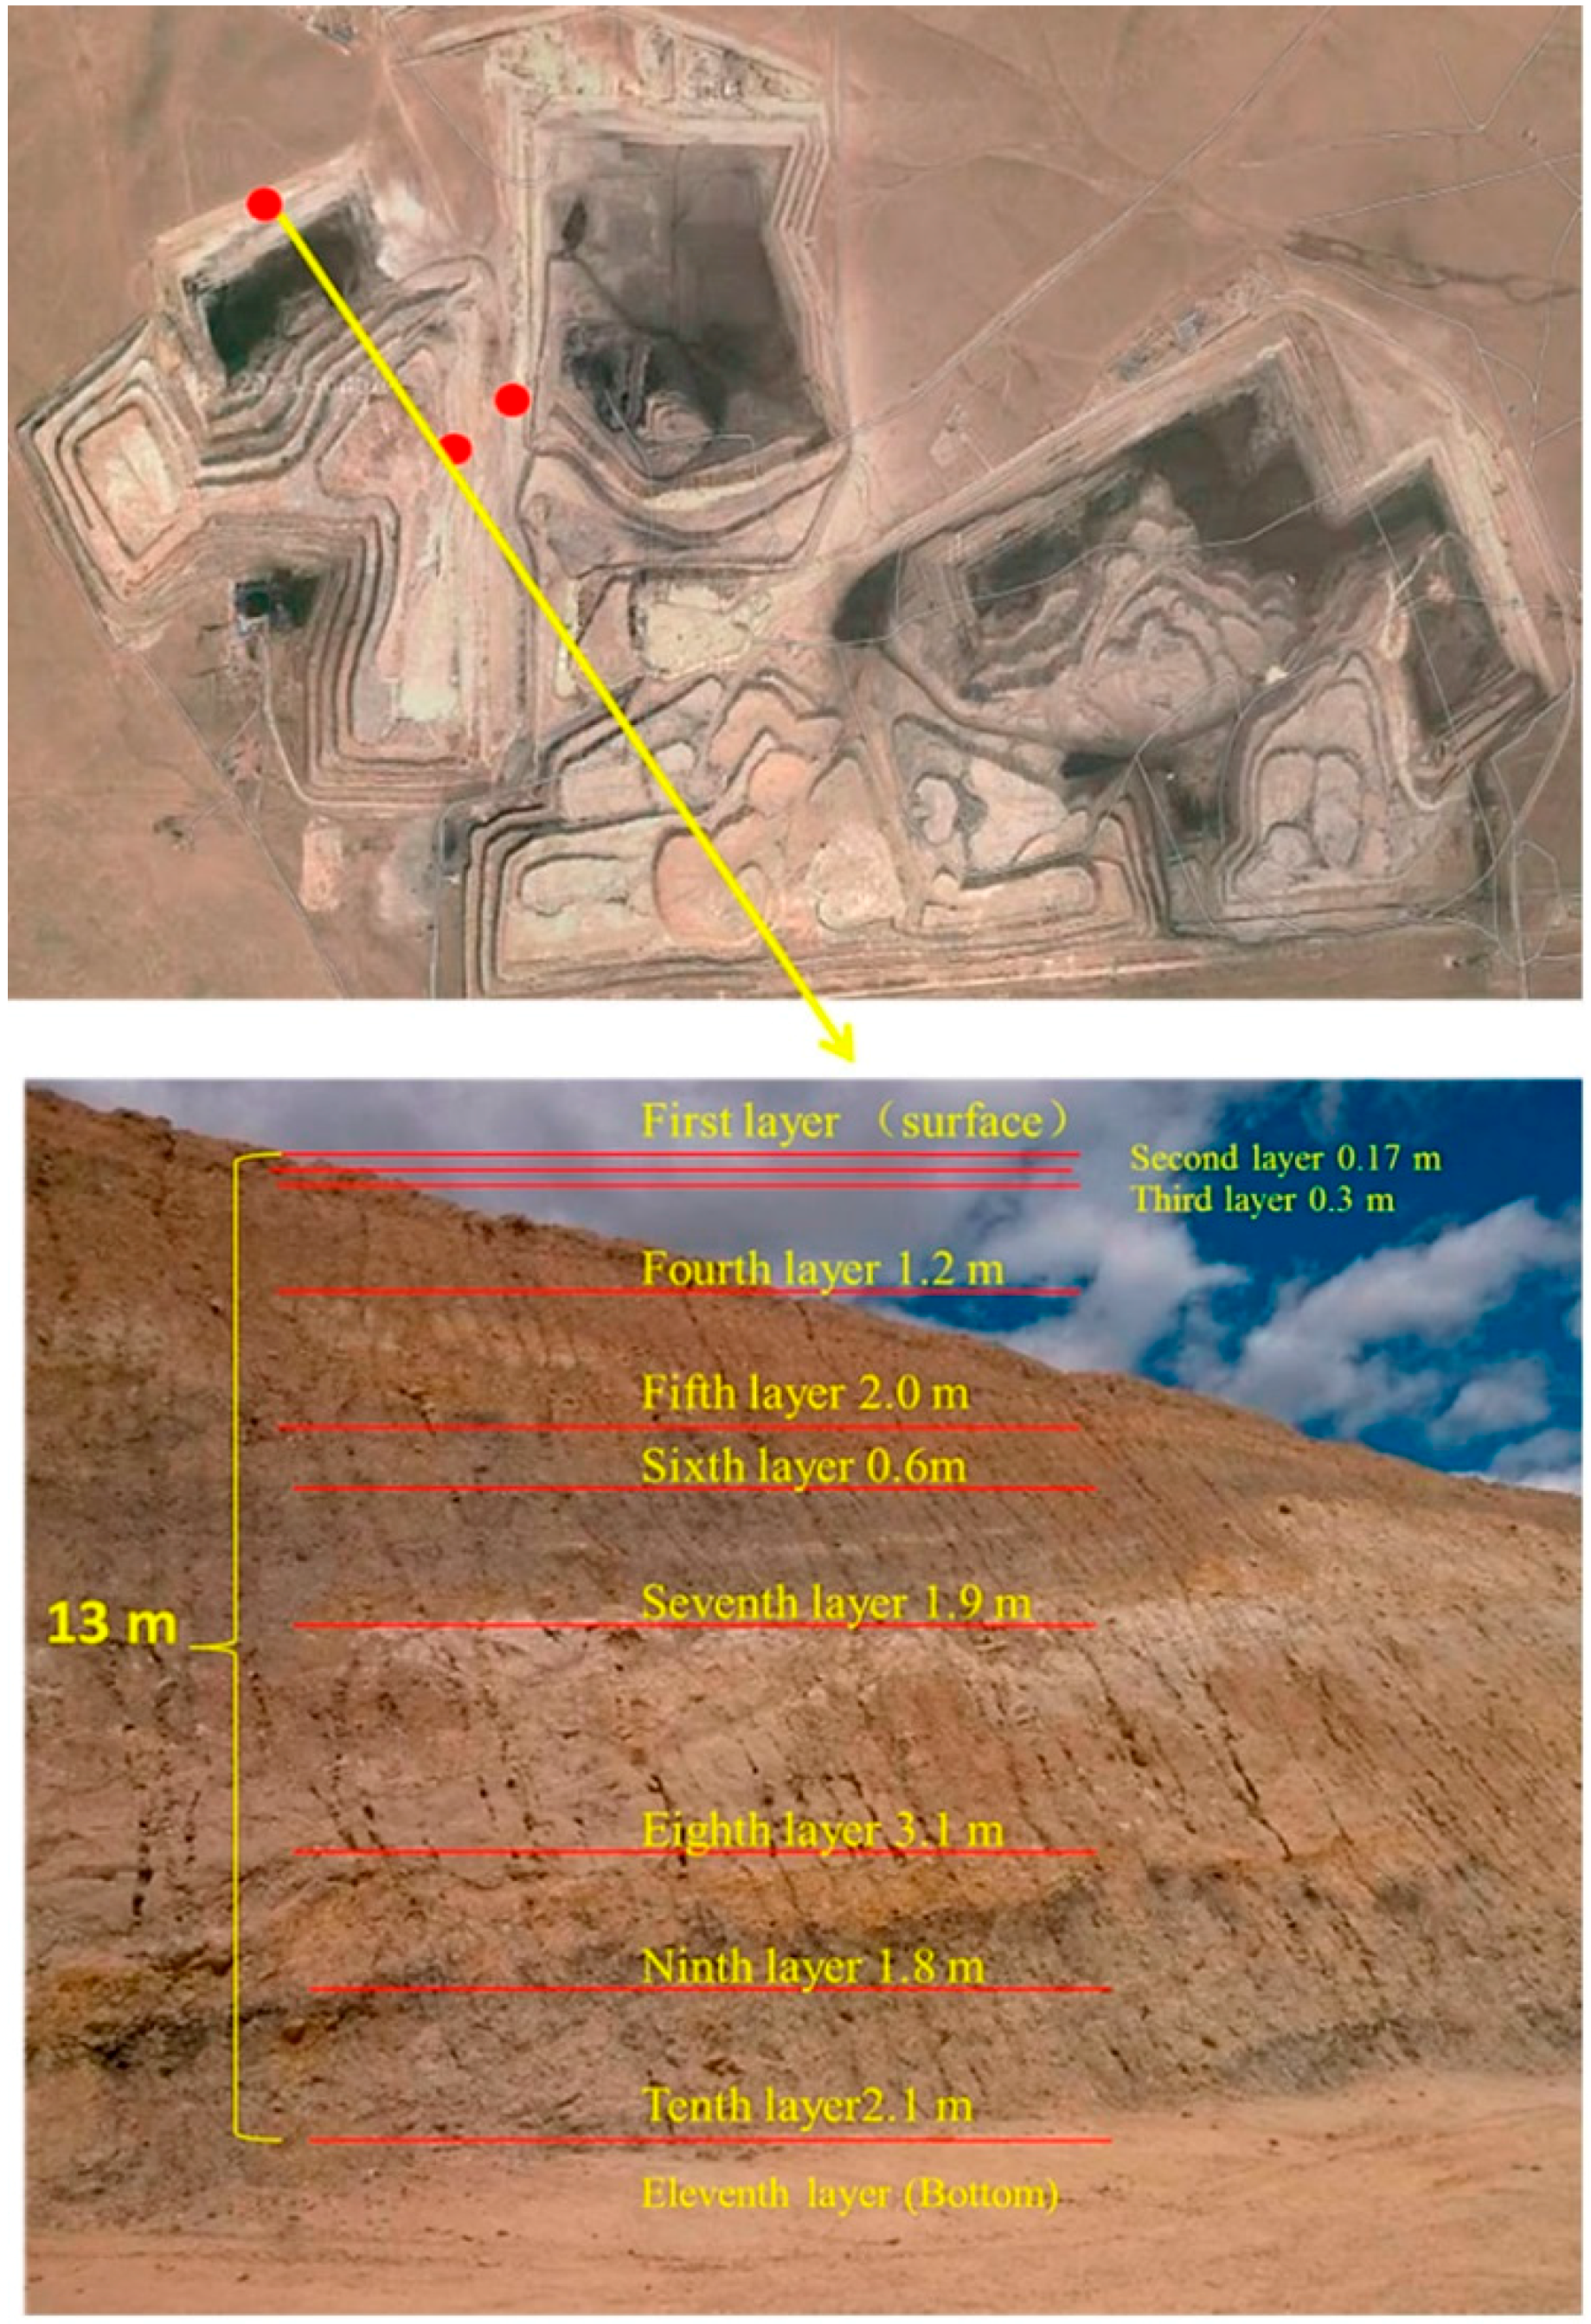
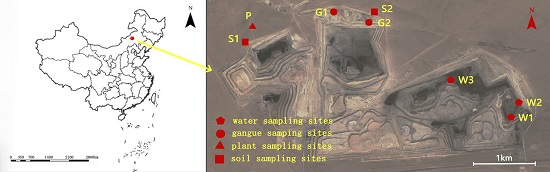
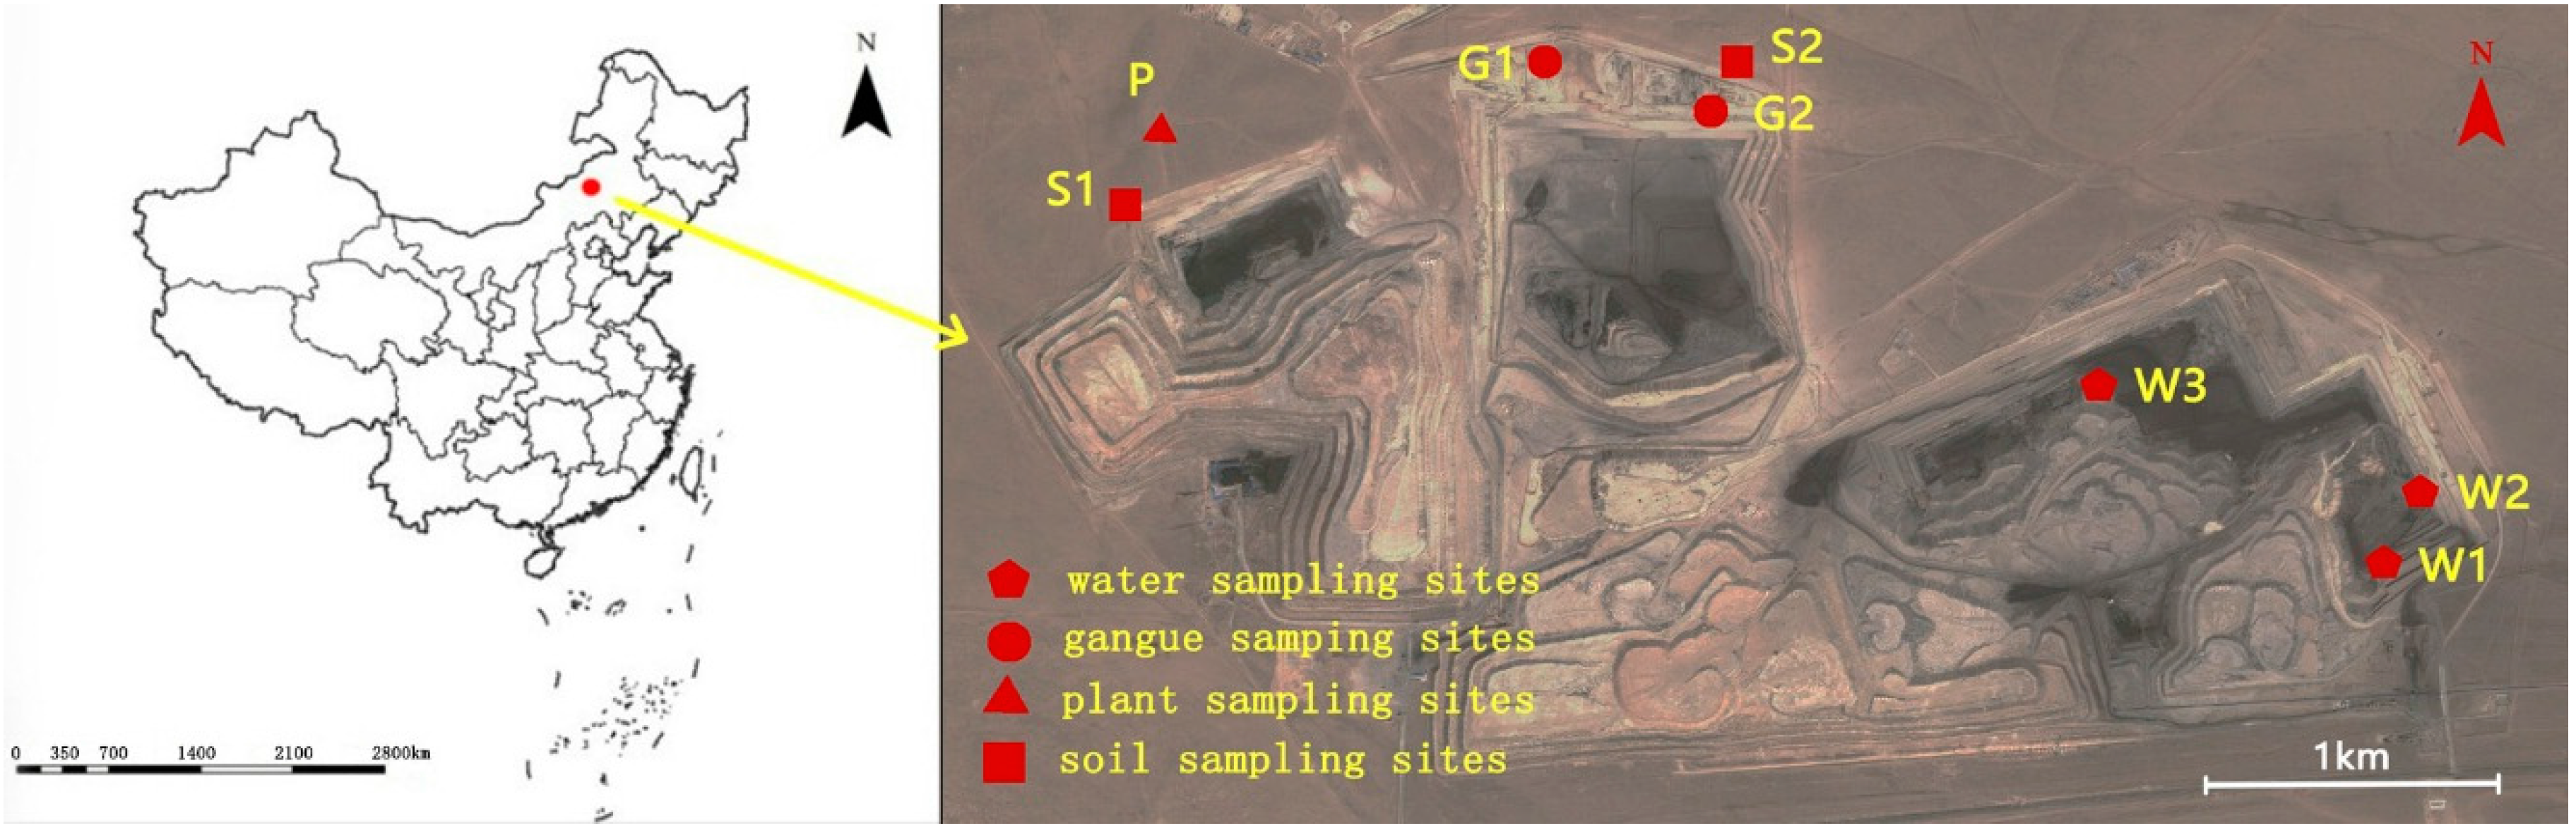
The Wulantuga open-cast germanium coal mine area (43°56′57.86″ N, 115°54′37.36″ E), covering an area of 2.2 km2 [21,22], is located in the southwest of the Shengli Coalfield (with a total area of 342 km2 [21]) in northeastern Inner Mongolia, northern China (Figure 1). The germanium-rich coal in the open-cast mine has been mined since 1997. The production of raw coal was 7.3 million tons in 2014, resulting in approximately 0.7 million tons of coal gangue accumulation [23]. The coal properties and the geological setting have previously been described in a great detail [21,22,24,25,26].
The study area has a semi-arid continental climate of the middle temperate zone. The annual average temperature is 0–3 °C, and the mean annual rainfall is approximately 276.3 mm. The soil type is chestnut soil, and the vegetation type is typical grassland, with 50% coverage. There is a seasonal river named the Xilin River flowing northward, 12 km from the east of the open-cast coal mine area, which has no direct hydraulic connection to the coal mine. The terrain of the Shengli Coalfield is gentle, with a slope of no more than 7° and an elevation of 1061–1196 m. The germanium coal mine area belongs to an approximate level-slight inclination monocline structure, with a formation dip of less than 5°.

2.2. Sample Collection

To investigate the mineral and chemical compositions in coal gangue and their potential environmental effects, coal gangue samples were collected in the open-cast germanium coal mine in July 2014, as well as the soils, water and plant samples around the mine area (Figure 1).
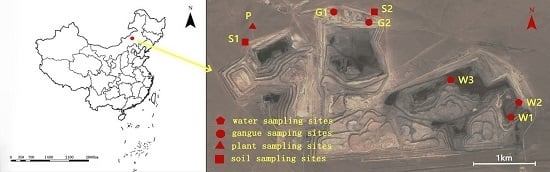
Coal gangue samples were selected from two sites of coal gangue piles in study area (Figure 1). Three samples were taken by hand and were immediately stored in individual sealed plastic bags in order to avoid any contamination and oxidation. Soil samples were collected from two sites in the north of the open-cast coal mine area using a geotome at a depth of 0–15 cm of each layer (Figure 2), and three sampling points were set in each layer, according to the sample collection methods described in detail by Jia et al. [23]. Background soil samples were taken from the grassland located approximately 15 km to the northeast of Xilinhaote city. All of the soil samples were also stored in sealed plastic bags in a portable freezer to minimize possible changes and contaminations. Three water samples were taken using a glass water sampler with 2 L capacity from the water pools in the open-cast germanium coal mine area. Two background samples were collected from the Jiuquwan Reservoir, which is situated approximately 20 km from the southeast of the coal mine area. The samples were immediately put into polyethylene terephthalate (PET) bottles and stored in the portable freezer. Four plant samples (Filifolium Kitam, Artemisia lavandulaefolia, Allium tuberosum Rottler and Leymus chinensis (Trin.) Tzvel) were selected in the grassland located in the north of the coal mine area. The leaves and trunks of plant samples were collected and immediately stored in sealed plastic bags.

2.3. Analytical Methods

The contents of major-element oxides, including SiO2, TiO2, Al2O3, Fe2O3, MgO, CaO, MnO, Na2O, K2O and P2O5, in coal gangue samples were analyzed by X-ray fluorescence spectrometry (XRF, ARL ADVANT′XP+, ThermoFisher, Waltham, MA, USA) as outlined by Dai et al. [27]. The mineralogical compositions were determined on a D/max-2500/PC powder diffractometer with Ni-filtered Cu-Kα radiation and a scintillation detector. Each XRD pattern was recorded over a 2θ interval of 2.6°–70°, with a step size of 0.01° [27]. The selected environmentally-sensitive trace elements were As, V, Cr, Co, Ni, Cu, Zn, Se, Cd, Sn, Pb and Hg. The trace element contents of V, Cr, Co, Ni, Cu, Zn, Cd, Sn and Pb in the coal gangue, soil, water and plant samples and those in the resulting leachates of the following experiments of coal gangue were all determined by inductively-coupled plasma mass spectrometry (X series II ICP-MS, ThermoFisher), according to the procedures described in detail by Dai et al. [28]. Arsenic and Se were determined by ICP-MS using collision cell technology (CCT), as described by Li et al. [29]. The concentration of Hg was determined by a Milestone DMA-80 Hg analyzer (Milestone, Sorisole, Italy). The detection limit of Hg is 0.005 ng; the relative standard deviation from eleven runs on Hg standard reference is 1.5%; and the linearity of the calibration is in the range 0–1000 ng [30]. The handling methods of soil samples were described in detail by Jia et al. [24]. Four plant samples were mixed and were cleaned by deionized water. They were dried in a drying oven (60 °C) and crushed to 100 mesh size for testing.

2.4. Leaching Experiments

Coal gangue samples were air-dried and crushed to 200 mesh. They were blended by the method of repeated division into four equal portions to mix thoroughly (four times) and prepared for the leaching experiments (5 kg). Then, three 30-g sub-samples and one 45-g sub-sample were obtained by an analytical balance of 0.01-mg precision, accurate to four decimal places.
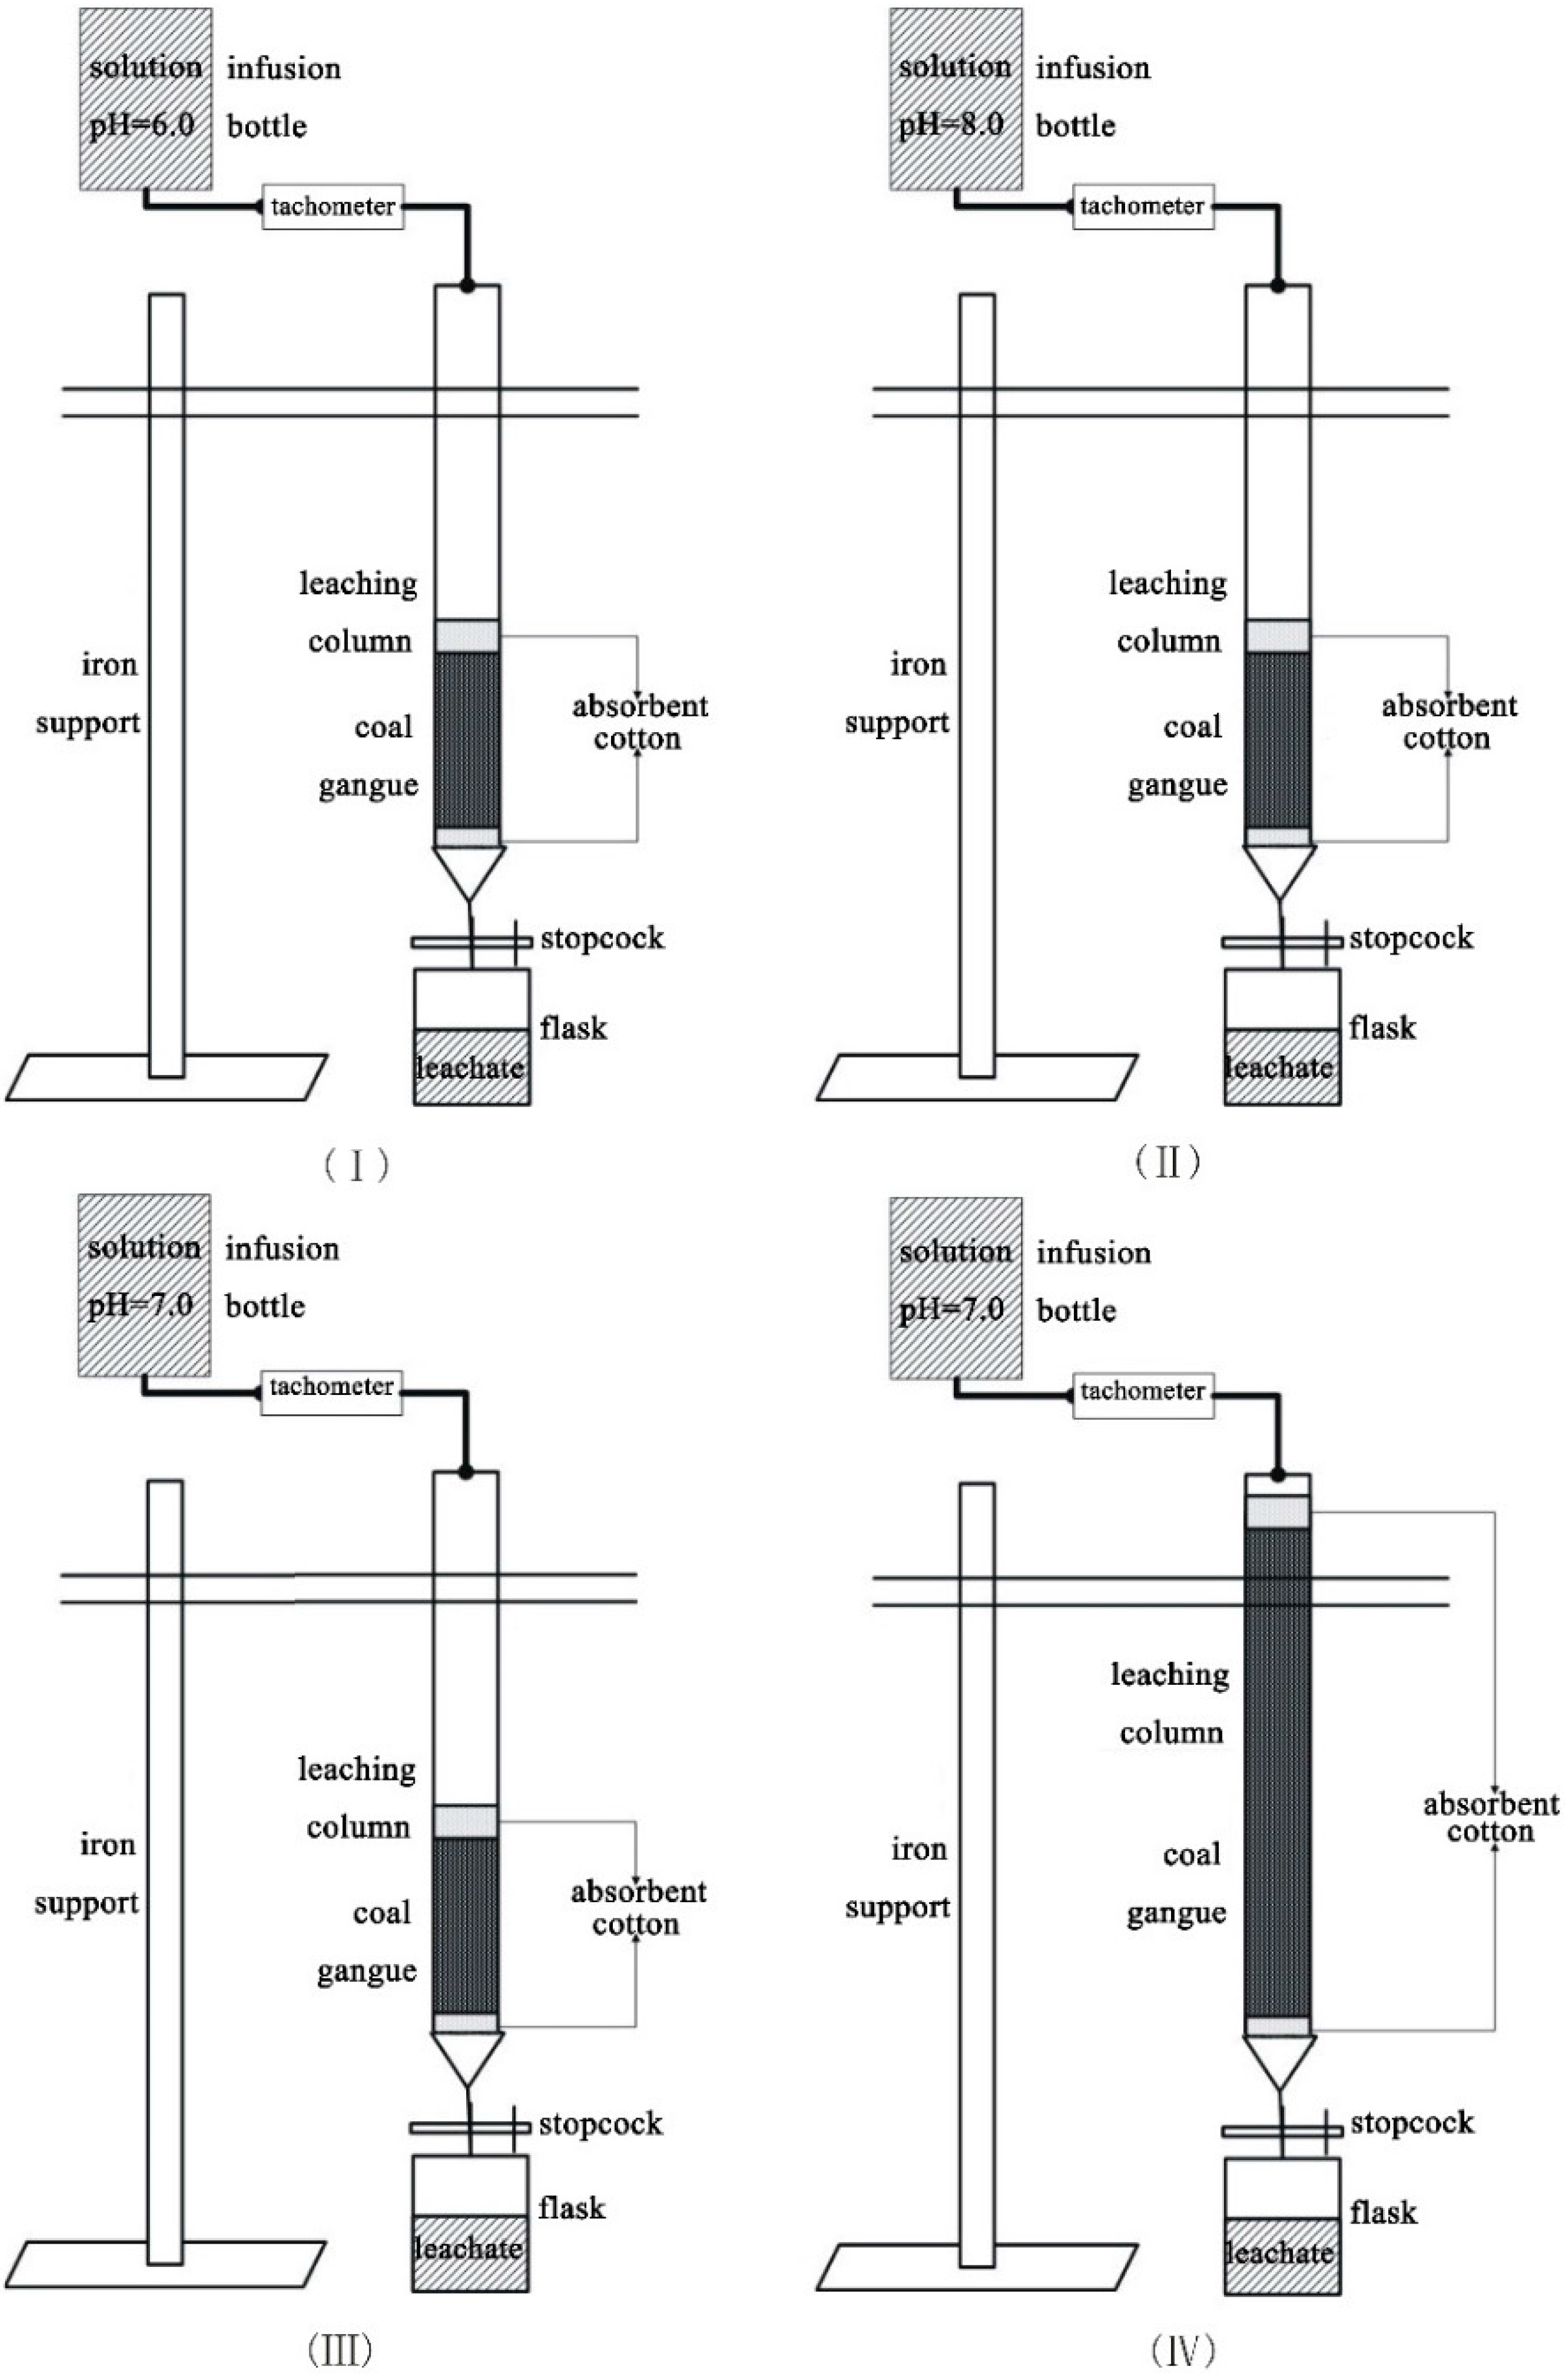
To investigate the impacts of different pH values and sample quantities on the leaching behavior of the selected trace elements in the coal gangue, four column leaching experimental groups were determined in this study (Table 1). The pH of the rainfall in the study area is approximately 6.60–8.19, slightly alkaline, with no acid rain. The concentration ratio between SO42− and NO3 in the rainfall is approximately 2.3–29.0, suggesting sulfate precipitation [19,31]. According to the rainfall characteristics, distilled water (pH = 7.0 ± 0.3), acidic solution (pH = 6.0 ± 0.3, using distilled water with H2SO4) and alkaline solution (pH = 8.0 ± 0.3, using distilled water with NaOH) were prepared for the leaching experimental groups. In this study, Experiments I, II and III were set for detecting the effects of solution pH on leaching behavior, with the same sample weight of 30-g, and different solutions of acid, alkaline and neutral pH, respectively. All of the test utensils were soaked in a 14% HNO3 solution for 24 h and rinsed by distilled water before the leaching experiments [19].
Each coal gangue sample was transferred into a fixed glass column, which was 30 mm in internal diameter and 50 cm in length (
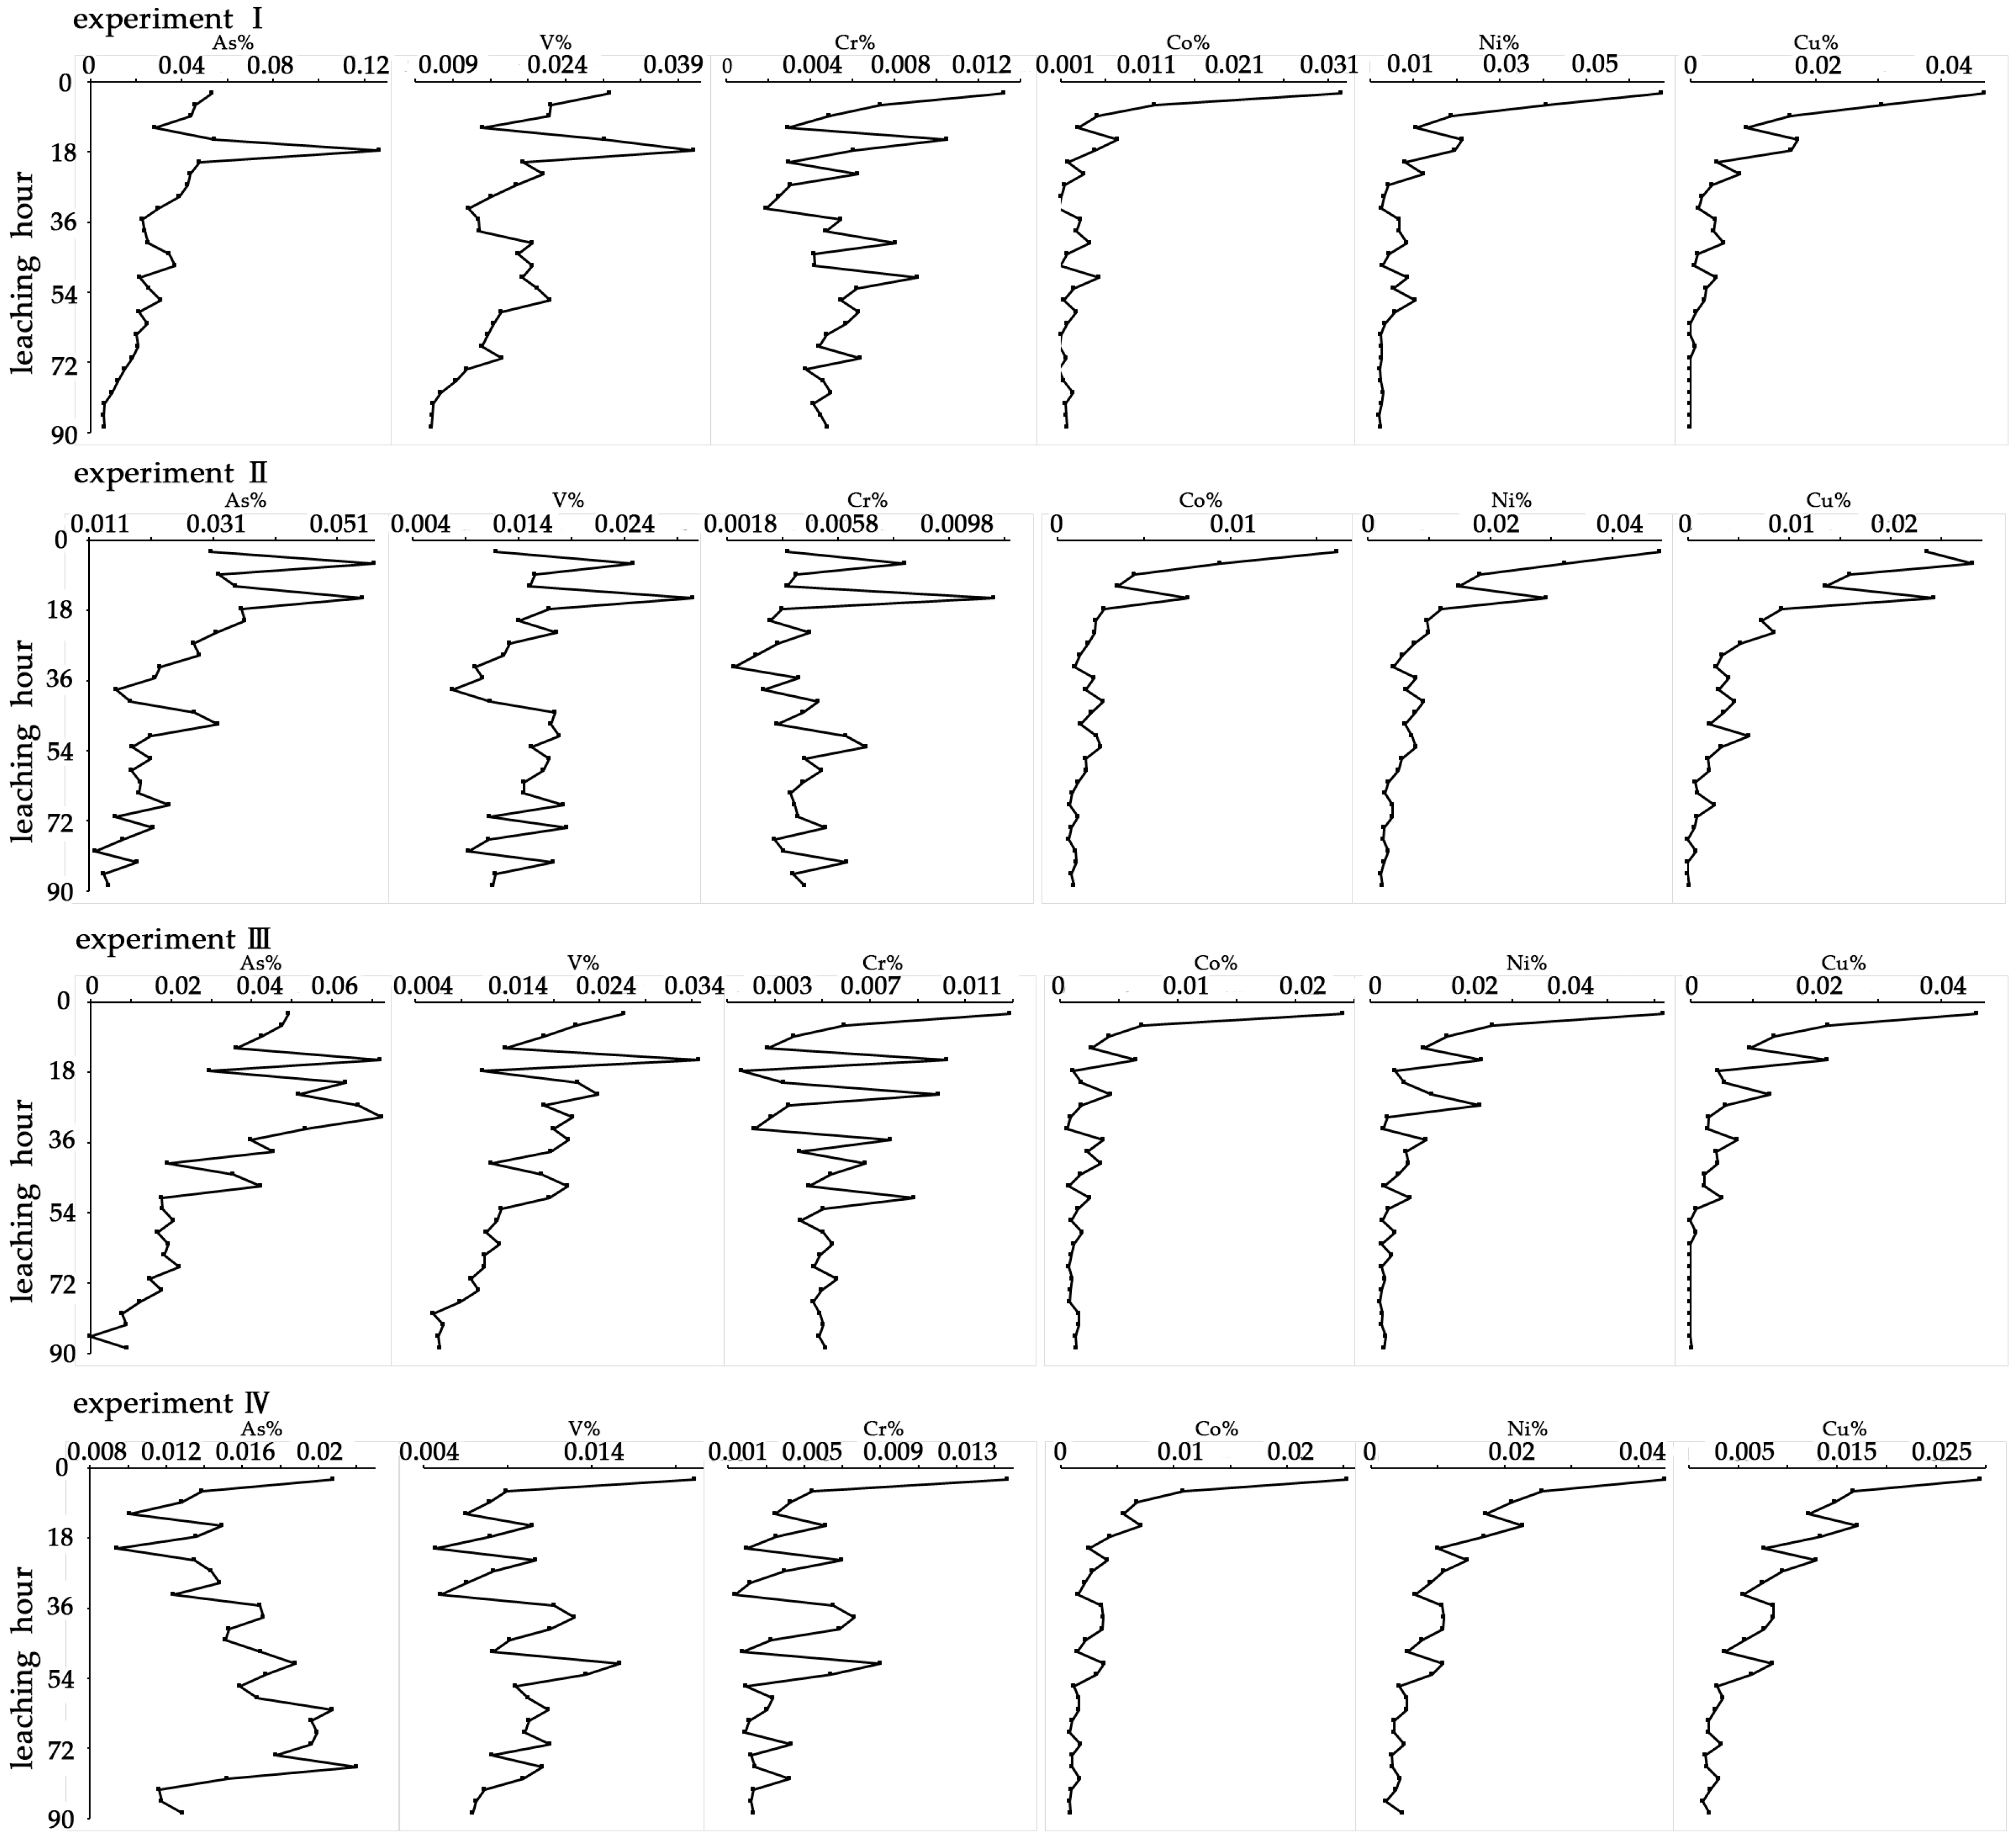
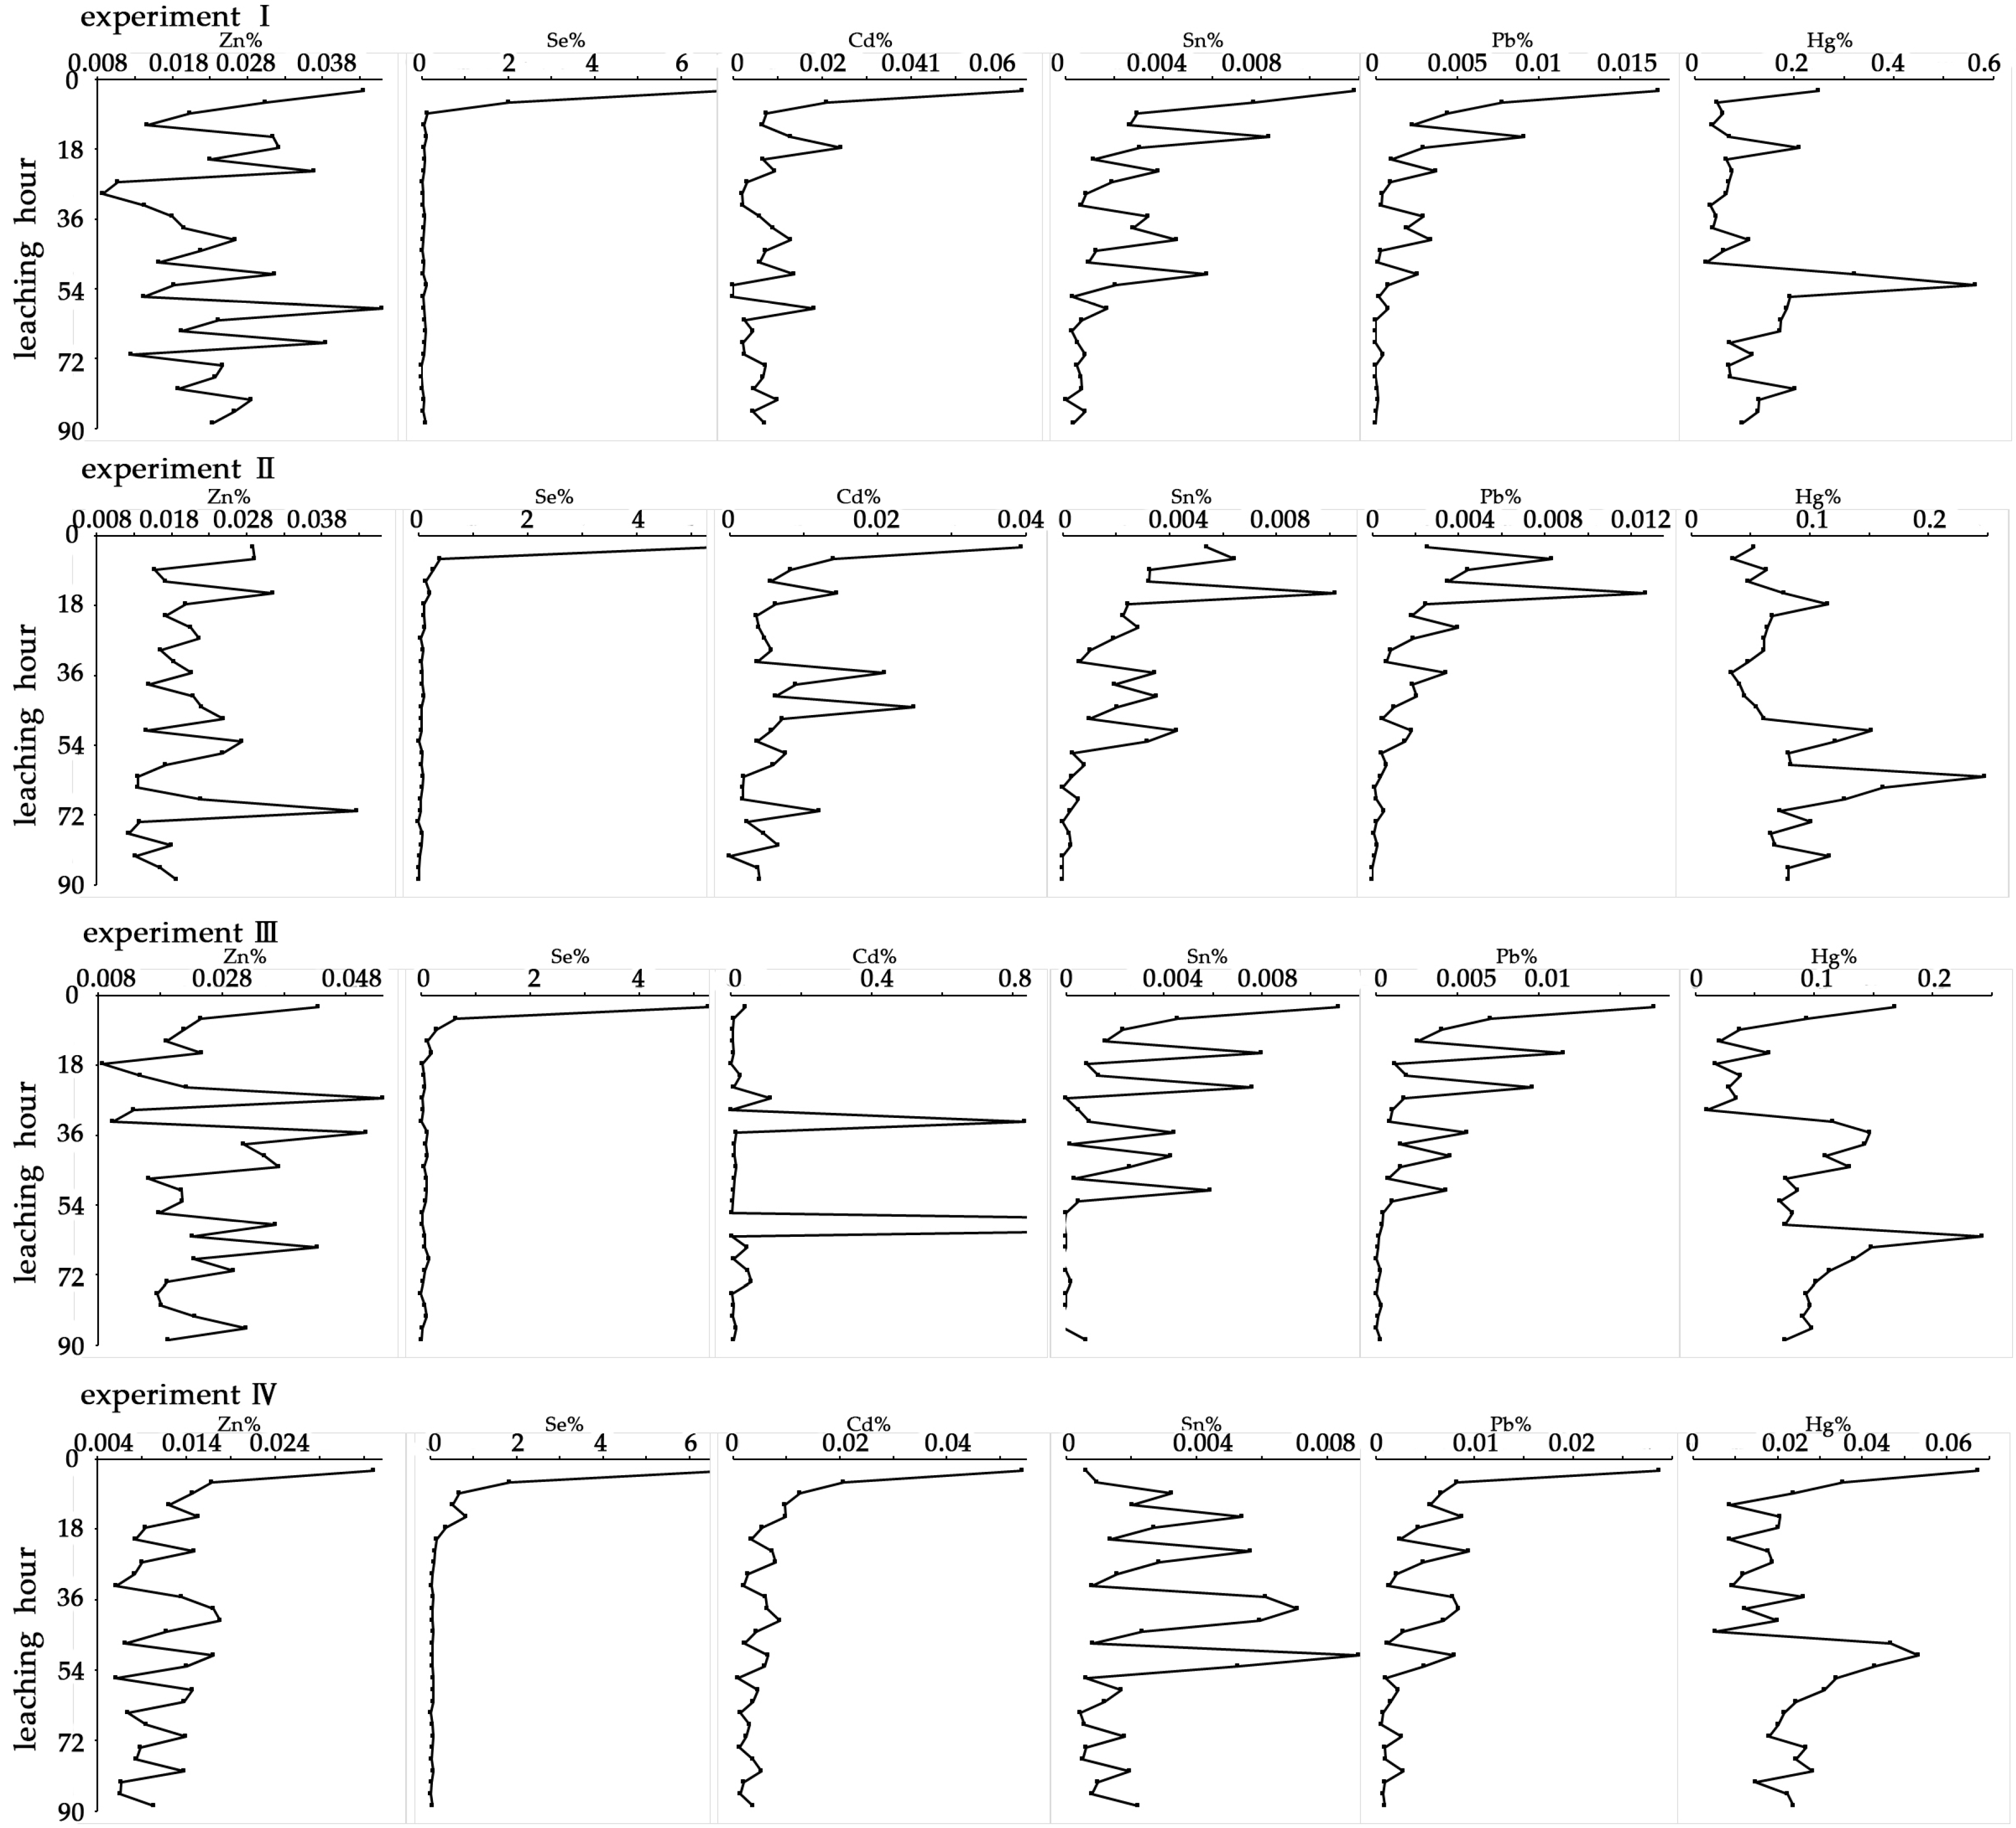
Figure 3). Quartz sand (10 g, particle size < 0.83 mm) was packed into the bottom of the column in Experiments I, III and IV, respectively, to prevent fine particle loss during leaching. It was also packed at the top of the sample to make the solution disperse uniformly. However, a small amount of absorbent cotton, instead of quartz sand, was used at the top and bottom of the column in Experiment II. This was to prevent the quartz sand from reacting with the alkaline solution, in which absorbent cotton could not be dissolved. The four solutions were controlled in terms of influx into the columns at room temperature. The experiments lasted for 90 h. The resulting leachates were sampled once every 3 h and then put into 50-mL volumetric tubes for element analysis. Thirty samples were obtained from each experimental group. As a matter of convenience for displaying and analyzing the results, the concentrations of the 30 samples were averaged over 10 time units, i.e., 0–9 h, 9–18 h, 18–27 h, 27–36 h, 36–45 h, 45–54 h, 54–63 h, 63–72 h, 72–81 h and 81–90 h.
The “leachability (Lr)”, “leached concentration (Cl)” and “maximum leached concentration (Clm)” were used to analyze the leaching behavior of the coal gangue during the four experimental groups. Lr (%) is calculated by Equation (1), and Clm (μg/L) was calculated by Equation (2):
L r = 100 C l x × V x M x
C l m = M a x ( C l x )
where Clx (μg/L) and Vx (L) represent the concentration of an element and the volume of the resulting leachates, respectively, during a period of leaching time. Mx (μg) is the total mass of an element in the coal gangue samples.

2.5. Environmental Effect Indicators

To compare the concentrations of an element in coal gangue with black shales, Clarke values were used as a practical method of assessing trace element enrichment [6]. The enrichment factor (EF) was then an important parameter to evaluate the pollution level of an element [6,32,33,34]. EF values of elements in coal gangue, coal, soil, water and vegetation of the Wulantuga open-cast coal mine were applied to assess the pollution degrees of the 12 trace elements. The EF value is expressed as follows:
E F = A i / C B i / D
where Ai (μg/g) is an element’s concentration; Bi (μg/g) is the background value of an element (Clarke value); C (μg/g) is the reference element concentration; D (μg/g) is the Clarke value of the reference element. Scandium is usually used as the reference element due to its stable concentration, and it was also applied in this study.
“Maximum leached amount” (Lam) and “maximum leachability” (Lrm) are important indicators for trace element environmental risk assessment, which could provide valuable information of the maximum extent of element migrating ability [4,33]. The value of Lam is defined here as the ratio of all amounts of an element in the leachates of 90 h to the mass of the coal gangue sample. The value of Lrm is based on the ratio of the amount of the trace element in the leachates after 90 h to the mass of the trace element in the coal gangue sample.
Aimed at further evaluating the environmental threat of the 12 environmentally-sensitive elements, the concentration limits of the trace elements in groundwater, soil and food were also compared in this research. Furthermore, the effects range low (ERL) and effects range median (ERM), defined in international sediment quality guidelines (SQGs), were adopted in this study to assess the ecological risk, namely the biological toxicity of trace elements in coal gangue. ERL values are the concentrations below which adverse effects on sediment-dwelling fauna would be unlikely, and ERM values were, in contrast, the concentrations above which adverse effects are likely [5,34]. The existence of biological toxicity could be divided into three levels, i.e., <ERL, very low toxicity, >ERL and <ERM, middle toxicity, and >ERM, probable toxicity [35].
The environmental quality standard for soils, the quality standard for groundwater and limits of contaminants in foods were also applied to be compared with the Lam values of the trace elements in soil samples, water samples and vegetation samples, respectively, in the study. Unfortunately, there are no specific limits, standards or references of the trace element concentrations for plants. Therefore, the concentrations in vegetation samples had to be compared to the limits of contaminants in foods, the alternative comparing reference, for evaluating the environmental impacts of coal gangue leaching on vegetation.

3. Results

3.1. Chemistry and Mineralogy in Coal Gangue

Proximate and sulfur analyses were performed on the coal gangue sample. Proximate analysis on coal or/and coal gangue samples is long-term, well-established term in coal industry and covers the determination of moisture, volatile matter and ash yield in samples [36]. These data are expressed as percentages of the air-dried coal gangue (on an air dry basis; Table 2), and these include the air-dried moisture, but do not involve the surface moisture of the samples [36,37,38,39].
The coal gangue samples are dominated by SiO2 (70.26%) and Al2O3 (19.23%), followed by Fe2O3 (3.76%) and K2O (3.15%) (Table 2), along with trace percentages of MgO (1.31%), TiO2 (1.10%), CaO (0.50%) and Na2O (0.40%).
The XRD patterns showed that the main mineral phases found in the coal gangue samples were montmorillonite, illite mixed layer, kaolinite and quartz. The dominant minerals of montmorillonite and kaolinite indicated that the coal gangue in the Wulantuga open-cast coal mine area had a high expansibility.
In comparison to the world Clarke values, the concentration of the coal gangue was enriched in Co (the average concentration equaled 53.92 μg/g in study area) and depleted in Se, Cd and Hg. The remains of the selected 12 trace elements were close to the concentrations of the world Clarke values (Table 3).

3.2. Leaching Characteristics of Coal Gangue

3.2.1. Leaching Time

Eight different trend curves for the leached concentration of 12 elements, which were changed by leaching time, could be identified in the four leaching tests (Table 4, Table 5, Table 6 and Table 7). Among them, a sharp drop followed by a steady curve was the major trend, which accounted for more than one third of the concentration time changing curves. This trend curve was observed for elements Co, Ni, Se, Cu, Zn and Pb. Descending curves and curves with a short rise followed by a large decline accounted for 20.83% and 14.58% of the trends, respectively. Elements Cr, As and Cu exhibited descending curves. Short rise, large decline curves were observed for V and As. These three trends, in general, showed higher extractable concentrations of the elements in the initial leaching phase, but decreased sharply or gradually as the leaching time goes on. Steady descending curves (14.58% of all of the trends), i.e., concentrations of the elements decreased slightly during the whole leaching time, were observed for the elements Cd, Sn and Hg. A wave-like curve in decreasing order of significance accounted for 4.17%, including Zn. Double wave-like curves contributed to 2.08%, showing a slight and steady decrease order for elements of Cd and Hg. A curve with a slight and steady rise followed by a decline (2.08% of all of the trends) was observed for Sn. Based on these trends, the elements could be divided into two categories. Elements Co, Ni, Se, Cu, Zn, Pb, Cr, As and V were in the category with a sharp initial decrease in the leaching phase, followed by a steady decline. Elements Cd, Hg and Sn were in the category with characteristics of slight and steady waves, decreasing throughout the leaching phases.
The concentrations of the 12 elements in the resulting leachates reached the maximum at different leaching time periods (Table 8). Approximately 70.83% of the leached concentrations reached the maximum at 0–3 h, especially for elements Co, Ni, Cu and Se. The maximum leach concentration occurred at 12–15 h, accounting for 10.42%. In the other periods of 6–9 h, 15–18 h, 21–24 h, 24–27 h, 27–30 h, 30–33 h, 51–54 h and 60–63 h, the resulting leachates reached the maximum concentration only once (2.08%). All 12 selected trace elements could be mostly leached out within no more than 30 h, except for elements Hg and Cd.

3.2.2. Solution pH

Considering the natural rainfall conditions, three pH values, 6.0, 7.0 and 8.0, were examined in Experiments I, II and III in this study. In general, the trends and mean concentrations were similar in the three experiments for each individual element (Table 4, Table 5, Table 6 and Table 7), indicating that there was no significant impact of pH on the leached concentrations and trends of the elements in the coal gangue of the Wulantuga open-cast coal mine area.
Figure 4 and Figure 5 exhibit the changes of leachability of the 12 selected elements from the coal gangue over 90 h. The interrupted curve in the figures indicated that the element concentration in the resulting leachates was less than the black value. The leachability trends of most of the selected elements differed according to the acidity of the leaching solutions. The results of Experiment II, with a pH of approximately 8.0, differed from those of the other two experiments. For a pH of 6.0, the leachabilities of the elements from the coal gangue displayed a sharp drop in the initial leaching phase (0–18 h) and then a steady wave-like curve (in descending order of significance), whereas for a pH of 7.0, they showed a rise in the initial phase (0–18 h), followed by a sharp decline and, then, a steady decreasing order wave-like curve. Trace elements Co, Ni, Zn and Se showed almost the same trends of leachabilities in experiments with different pH values.
In terms of Lam (μg/g) of the elements from the coal gangue in the study area, a slight reverse dependence with the pH of leaching solutions was observed, which suggested the leachability decreased with increasing pH (Table 6). Most of the selected elements displayed similar behavior for Lrm and Lam under the changing pH values. However, inconsistency was observed between the trends of Lrm and Lam for elements Co, Ni, Cu and Sn. The Lrms values of these four elements remained constant at 0.001%, 0.003%, 0.002% and 0.001%, respectively, regardless of the pH of the leaching solutions (Table 9). As a whole, the pH values had little impact on the Lrm of the 12 elements, but it could influence the Lam.

3.2.3. Sample Amount

The effects of leaching time and pH values on the leaching behavior of the elements had previously been investigated [4,6,34]. However, the amount of samples was one of the impact factors for the leaching behavior of the elements, especially in column leaching tests. Therefore, the effect of sample amount was further discussed in this study. In the column leaching tests, sample amount should be considered and determined before leaching. Experiment III (30-g of sample) and Experiment IV (45-g of sample), under the same pH of solutions, were performed to evaluate the role of the mass of coal gangue samples in terms of leaching behavior of the elements, including leached concentrations, leachability, Lam and Lrm.
All of the selected elements showed much higher leached concentrations with higher sample mass than those with less mass over 90 h, except for As, Cd, Sn and Hg (Table 4, Table 5, Table 6 and Table 7). These four elements were found at almost the same leached concentrations in the two experiments. The leached concentrations reached maximum values in the 0–3-h phase in Experiment IV, with the exception of Sn. For Experiment III, there were four exceptions for the maximum leached concentration, namely As (27–30 h), V (12–25 h), Zn (24–27 h) and Cd (30–33 h).
According to the information displayed above, the sample amount showed little impact on the change trends of the element concentration over time, but a remarkable effect on the analytical concentrations of the elements in the resulting leachates. In terms of the changes in leachability of the elements from coal gangue over the leaching time, most of the elements showed little difference between Experiments III and IV (Figure 4 and Figure 5). However, for Cd and Sn, the characteristics of the leachability trends differed significantly between the two experiments (Figure 5). Cd displayed a slow rise followed by a sharp rise and then a sudden wave curve under the condition of less sample mass. However, it showed a sharp initial drop followed by a steadily decreasing wave curve with higher sample mass. Sn exhibited adverse drastic fluctuations, beginning with a sharp decrease (30 g of sample) and increase (45 g of sample) in the two leaching tests (Figure 5). Furthermore, it also exhibited an obvious inverse leachability trend in the latter phase of leaching (45–90 h) for the element of As (Figure 5), which fluctuated with a general decrease in Experiment III and fluctuated with a general increase in Experiment IV. In this study, the Lam and Lrm of coal gangue showed no significant effect of sample mass in the leaching tests (Table 6). The Lrm of most elements remained invariant, whereas the elements of V, Zn and Hg present a slight decrease with increasing sample mass (Table 9). This indicated that the sample amount perhaps affected the leaching behavior of some environment-sensitive elements.

3.3. Environmental and Ecological Risk Assessment

3.3.1. Environmental Impact

In comparison with the Clarke values, the concentrations of the trace elements As, Co, Se and Pb were considerably higher in the coal gangue of the Wulantuga open-cast coal mine area (Table 3). The EF values for As and Se were 4.86 and 7.41, respectively, indicating a high pollution degree due to their high concentration levels (EF > 2).
The Lam values of the selected trace elements provided information of the maximum potential environmental effect of the elements. The results indicated that all of the selected trace elements from coal gangue in the study area had no potential risk to soils and vegetation, based on comparing the Lam values with the corresponding concentrations of the elements defined by the environmental quality standard for soils and limits of contaminants in foods (Table 9 and Table 10). In contrast, the elements could perhaps have high potential impacts on the groundwater according to the comparison of Lam with the corresponding concentration in the quality standard for groundwater (Table 9 and Table 10). When compared to the quality standard for groundwater, the concentrations of the elements from the water samples were all at an acceptable level. All of the concentrations fell into Grade I (less than the natural background level) for the listing elements in the standard, except for element As, which fell into Grade II (natural background level) (Table 9 and Table 10). According to the standard, water in Grade I and Grade II could be used for all kinds of purposes, including those of drinking water. For the concentrations of soil samples, elements Ni, Pb and Hg were found in Level 1 (natural background level), and As, Cr, Cu, Zn and Cd fell into Level 2 (no pollution to vegetation and the environment) (Table 3 and Table 10). However, in terms of the vegetation samples, almost all of the element concentrations were higher than those defined in the limits of contaminants in foods (Table 3 and Table 10).

3.3.2. Ecological Risk

ERL and ERM values were employed to evaluate the biological toxicity of the selected trace elements. According to Table 3, it could be found that Ni was in the probable biological effects category (>ERMs value) for 50% of the coal gangue samples from the Wulantuga open-cast coal mine area. For As, Cr and Zn, 50% of samples were in the middle range, i.e., occasional adverse biological effects (>ERL and <ERM) predicted. Therefore, the 12 sensitive environmental trace elements from coal gangue in the study produced moderate to high ecological hazard to the environment.

4. Discussion

4.1. Leaching Behavior and Experimental Procedures

The leaching behavior of the elements from the coal gangue is affected by various factors. Leaching time, pH values and sample amount were discussed to evaluate their roles in terms of the leaching behavior of the elements of the resulting leachates from the coal gangue in the Wulantuga open-cast coal mine area. The results of this study show that leaching time and sample mass have relatively obvious effects on the concentrations, leached amounts and leachability of elements. This result is consistent with the conclusions of other research [4,17,19,44,45].
Many previous studies suggested that the leaching behavior of the elements was closely associated with pH values in the leaching solutions [4,19,20,45]. However, it shows little role in the current study. Considering the natural conditions of rainfall, pH varies from 6.60–8.19 in the study area, and the pH values applied to evaluate its effect are 6.0, 7.0 and 8.0. These three values are consistent with the natural conditions, but could not demonstrate the effect of solution acidity or alkalinity. In this study, leaching behavior is considered to include the leached concentrations of the elements, leached amount, leachability, Lam and Lrm. Fraction profiles of the elements could further assess the potential risks posed by the elements from coal gangue [6,46]. In future research, the fraction profiles, water-leachable, ion-changeable, carbonate-bound, organic-bound, silicate-bound and sulfide-bound particles of the selected 12 elements will be investigated.

4.2. Quantitative Analysis of Environmental Impacts

The assessment of the impact of trace elements from coal gangue on vegetation indicates that little potential risk exists to the plants around the open-cast coal mine area based on comparing Lam values of the elements to corresponding concentrations in the limits of contaminants in foods, which could indirectly provide information of the impacts on human health. However, the trace element concentrations of the vegetation samples are higher than those of the limits for all of the selected elements (As, Cr, Ni, Cd, Pb and Hg) listed in the limits of contaminants in foods, except for Sn. This suggests that coal gangue contributed little to the concentrations of trace elements in vegetation in the study area, which are obviously not suitable for food consumption.
In addition to the method of contrasting standards, EF values, Lam, Lrm, ERL and ERM values were also applied to assess the trace element potential environmental and ecological hazards. These methods could be defined as semi-quantitative analyses for the trace element potential environmental and ecological impacts. Furthermore, the spatial extent and levels of pollution exposed by the trace element dispersal from coal gangue in coal mines are critical in determining the best measures and techniques for preventing environmental pollution and reclamation. The trace element transport pathways and the extent of potential environmental pollution should be identified by in situ sampling and analysis with the help of GIS in future research. Based on a large number of studies, a quantitative model of the trace element leaching behavior could be developed to evaluate environmental and ecological potential risks.

5. Conclusions

The changes of concentrations, leached amount, leachability, Lam and Lrm of the selected 12 trace elements from coal gangue in the Wulantuga open-cast coal mine area, Inner Mongolia, China, were investigated in this study. Based on the results of leaching behavior, the potential environmental and ecological hazards were also evaluated through different methods.
Leaching time and sample mass play important roles in determining the trace element concentrations, the leached amounts and leachabilities. pH values do not exhibit an obvious effect on the leaching behavior in this study. The coal gangue is enriched in As, Co, Se and Pb, and the EF values of As and Se indicate higher environmental pollution levels. All of the selected trace elements, namely, As, V, Cr, Co, Ni, Cu, Zn, Se, Cd, Sn, Pb and Hg, show no potential risk to soils and vegetation, but high potential risk to groundwater, based on the analysis of Lam values. Simultaneously, according to the ERL and ERM values in the SQGs, Ni from the coal gangue is inclined to have high biological toxicity, and As, Cr and Zn show moderate ecological risk to the environment. Further research of the environment-sensitive trace element leaching behavior should be investigated through more quantitative methods with the aid of GIS to identify environmental pollution and effectively make decisions regarding prevention and reclamation.

Acknowledgments

This work is supported by the National Basic Research Program of China (973 Program, No. 2014CB238906). We thank Shifeng Dai at China University of Mining & Technology (Beijing) for his suggestions about the leaching tests and assisting in the ICP-MS analysis of the trace elements in coal gangue, the resulting leachates, soil, water and vegetation samples. We thank Xibo Wang at China University of Mining & Technology (Beijing) for his help with the XRF and XRD analysis of the chemical and mineral compositions of coal gangue. Two anonymous reviewers are especially thanked for their valuable comments, which greatly improved the paper quality.

Author Contributions

Liu Yang performed the analysis and designed the evaluation methods. Liu Yang, Jianfei Song and Bo Song helped to conceive of and design the experiments. Jianfei Song, Ruduo Wang and Bo Song performed the experiments. Liu Yang, Xue Bai and Jianfei Song analyzed the data. Xue Bai contributed to the standards and analysis. Jianfei Song and Tianhao Zhou developed the figures and tables. Jianli Jia and Haixia Pu provided the water and vegetation samples. Liu Yang and Xue Bai wrote the paper.

Conflicts of Interest

The authors declare no conflicts of interest.

References

  1. Dai, S.; Ren, D.; Chou, C.; Finkelman, R.; Vladimir, V.; Zhou, Y. Geochemistry of trace elements in Chinese coals: A review of abundances, genetic types, impacts on human health, and industrial utilization. Int. J. Coal Geol. 2012, 94, 3–21. [Google Scholar] [CrossRef]
  2. Hower, J.C.; Robl, T.L.; Anderson, C.; Thomas, G.A.; Sakulpitakphon, T.; Mardon, S.M.; Clark, W.L. Characteristics of coal combustion products (CCP’s) from Kentucky power plants, with emphasis on mercury content. Fuel 2005, 84, 1338–1350. [Google Scholar] [CrossRef]
  3. Park, K.S.; Seo, Y.C.; Lee, S.J.; Lee, J.H. Emission and speciation of mercury from various combustion sources. Powder Technol. 2008, 180, 151–156. [Google Scholar] [CrossRef]
  4. Wang, W.; Qin, Y.; Song, D.; Song, D.; Wang, K. Column leaching of coal and its combustion residues, Shizuishan, China. Int. J. Coal Geol. 2008, 75, 81–87. [Google Scholar] [CrossRef]
  5. Finkelman, R.B.; Orem, W.; Castranova, V.; Tatu, C.A.; Belkin, H.E.; Zheng, B.; Lerch, H.E.; Maharaj, S.V.; Bates, A.L. Health impacts of coal and coal use: Possible solutions. Int. J. Coal Geol. 2002, 50, 425–443. [Google Scholar] [CrossRef]
  6. Zhou, C.; Liu, G.; Wu, D.; Fang, T.; Wang, R.; Fan, X. Mobility behavior and environmental implications of trace elements associated with coal gangue: A case study at the Huainan Coalfield in China. Chemosphere 2014, 95, 193–199. [Google Scholar]
  7. Bhattacharya, A.; Routh, J.; Jacks, G.; Bhattacharya, P.; Morth, M. Environmental assessment of abandoned mine tailings in Adak, Västerbotten district (northern Sweden). Appl. Geochem. 2006, 21, 1760–1780. [Google Scholar] [CrossRef]
  8. Si, H.; Bi, H.; Li, X.; Yang, C. Environmental evaluation for sustainable development of coal mining in Qijiang, Western China. Int. J. Coal Geol. 2010, 81, 163–168. [Google Scholar] [CrossRef]
  9. Querol, X.; Izquierdo, M.; Monfort, E.; Alvarez, E.; Font, O.; Moreno, T.; Alastuey, A.; Zhuang, X.; Lu, W.; Wang, Y. Environmental characterization of burnt coal gangue banks at Yangquan, Shanxi Province, China. Int. J. Coal Geol. 2008, 75, 93–104. [Google Scholar] [CrossRef]
  10. Yue, M.; Zhao, F. Leaching experiments to study the release of trace elements from mineral separates from Chinese coals. Int. J. Coal Geol. 2008, 73, 43–51. [Google Scholar] [CrossRef]
  11. Kang, Y.; Liu, G.; Chou, C.L.; Wong, M.; Zheng, L.; Ding, R. Arsenic in Chinese coals: Distribution, modes of occurrence, and environmental effects. Sci. Total Environ. 2011, 412–413, 1–13. [Google Scholar] [CrossRef] [PubMed]
  12. Swaine, D.J. Why trace elements are important. Fuel Process. Technol. 2000, 65–66, 21–23. [Google Scholar] [CrossRef]
  13. Dai, S.; Ren, D.; Tang, Y.; Yue, M.; Hao, L. Concentration and distribution of elements in Late Permian coals from western Guizhou Province, China. Int. J. Coal Geol. 2005, 61, 119–137. [Google Scholar] [CrossRef]
  14. Chen, J.; Liu, G.; Kang, Y.; Wu, B.; Sun, R.; Zhou, C.; Wu, D. Atmospheric emissions of F, As, Se, Hg, and Sb from coal-fired power and heat generation in China. Chemosphere 2013, 90, 1925–1932. [Google Scholar] [CrossRef] [PubMed]
  15. Praharaj, T.; Powell, M.A.; Hart, B.R.; Tripathy, S. Leachability of elements from sub-bituminous coal fly ash from India. Environ. Int. 2002, 27, 609–615. [Google Scholar] [CrossRef]
  16. Hassett, D.; Pflughoeft-Hassett, D.; Heebink, L. Leaching of CCBs: Observations from over 25 years of research. Fuel 2005, 84, 1378–1383. [Google Scholar] [CrossRef]
  17. Izquierdo, M.; Querol, X. Leaching behaviour of elements from coal combustion fly ash: An overview. Int. J. Coal Geol. 2012, 94, 54–66. [Google Scholar] [CrossRef] [Green Version]
  18. Zhou, C.; Liu, G.; Yan, Z.; Fang, T.; Wang, R. Transformation behavior of mineral composition and trace elements during coal gangue combustion. Fuel 2012, 97, 644–650. [Google Scholar] [CrossRef]
  19. Peng, B.; Wu, D. Leaching characteristics of bromine in coal. J. Fuel Chem. Technol. 2011, 39, 647–651. [Google Scholar] [CrossRef]
  20. Huggins, F.E.; Seidu, L.B.A.; Shah, N.; Backus, J.; Huffman, G.P.; Honaker, R.Q. Mobility of elements in long-term leaching tests on Illinois #6 coal rejects. Int. J. Coal Geol. 2011, 94, 326–336. [Google Scholar]
  21. Du, G.; Zhuang, X.; Querol, X.; Izquierdo, M.; Alastuey, A.; Moreno, T.; Font, O. Ge distribution in the Wulantuga high-germanium coal deposit in the Shengli coalfield, Inner Mongolia, northeastern China. Int. J. Coal Geol. 2009, 78, 16–26. [Google Scholar] [CrossRef]
  22. Dai, S.; Liu, J.; Ward, C.R.; Hower, J.C.; Xie, P.; Jiang, Y.; Hood, M.M.; O’Keefe, J.M.K.; Song, H. Petrological, geochemical, and mineralogical compositions of the low-Ge coals from the Shengli Coalfield, China: A comparative study with Ge-rich coals and a formation model for coal-hosted Ge ore deposit. Ore Geolo. Rev. 2015, 71, 318–349. [Google Scholar] [CrossRef]
  23. Jia, J.; Li, X.; Wu, P.; Liu, Y.; Han, C.; Zhou, L.; Yang, L. Human health risk assessment and safety threshold of harmful trace elements in the soil environment of the Wulantuga open-cast coal mine. Minerals 2015, 5, 837–848. [Google Scholar] [CrossRef]
  24. Dai, S.; Wang, X.; Seredin, V.; Hower, J.C.; Ward, C.R.; O’Keefe, J.M.; Huang, W.; Li, T.; Li, X.; Liu, H.; et al. Petrology, mineralogy, and geochemistry of the Ge-rich coal from the Wulantuga Ge ore deposit, Inner Mongolia, China: New data and genetic implications. Int. J. Coal Geol. 2012, 90–91, 72–99. [Google Scholar] [CrossRef]
  25. Zhuang, X.; Querol, X.; Alastuey, A.; Juan, R.; Plana, F.; Lopez-Soler, A.; Du, G.; Martynov, V.V. Geochemistry and mineralogy of the Cretaceous Wulantuga high germanium coal deposit in Shengli coal field, Inner Mongolia, Northeastern China. Int. J. Coal Geol. 2006, 66, 119–136. [Google Scholar] [CrossRef]
  26. Dai, S.; Seredin, V.V.; Ward, C.R.; Jiang, J.; Hower, J.C.; Song, X.; Jiang, Y.; Wang, X.; Gornostaeva, T.; Li, X.; et al. Composition and modes of occurrence of minerals and elements in coal combustion products derived from high-Ge coals. Int. J. Coal Geol. 2014, 121, 79–97. [Google Scholar] [CrossRef]
  27. Dai, S.; Hower, J.C.; Ward, C.R.; Guo, W.; Song, H.; O'Keefe, J.M.K.; Xie, P.; Hood, M.M.; Yan, X. Elements and phosphorus minerals in the middle Jurassic inertinite-rich coals of the Muli Coalfield on the Tibetan Plateau. Int. J. Coal Geol. 2015, 144–145, 23–47. [Google Scholar] [CrossRef]
  28. Dai, S.; Wang, P.; Ward, C.R.; Tang, Y.; Song, X.; Jiang, J.; Hower, J.C.; Li, T.; Seredin, V.V.; Wagner, N.J.; et al. Elemental and mineralogical anomalies in the coal-hosted Ge ore deposit of Lincang, Yunnan, southwestern China: Key role of N2–CO2-mixed hydrothermal solutions. Int. J. Coal Geol. 2015, 152, 19–46. [Google Scholar] [CrossRef]
  29. Li, X.; Dai, S.; Zhang, W.; Li, T.; Zheng, X.; Chen, W. Determination of As and Se in coal and coal combustion products using closed vessel microwave digestion and collision/reaction cell technology (CCT) of inductively coupled plasma mass spectrometry (ICP-MS). Int. J. Coal Geol. 2014, 124, 1–4. [Google Scholar] [CrossRef]
  30. Dai, S.; Li, T.; Jiang, Y.; Ward, C.R.; Hower, J.C.; Sun, J.; Liu, J.; Song, H.; Wei, P.; Li, Q.; et al. Mineralogical and geochemical compositions of the Pennsylvanian coal in the Hailiushu Mine, Daqingshan Coalfield, Inner Mongolia, China: Implications of sediment-source region and acid hydrothermal solutions. Int. J. Coal Geol. 2015, 137, 92–110. [Google Scholar] [CrossRef]
  31. Liu, K.; Wang, X.; Sun, H.; Chen, L. PH value and acid rain condition in Inner Mongolia area in recent 3 years. Meteorol. J. Inn. Mongolia 2010, 3, 32–33. [Google Scholar]
  32. Duce, R.A.; Hoffmann, G.L.; Zoller, W.H. Atmospheric trace metals at remote northern and southern hemisphere sites: Pollution or natural? Science 1975, 187, 59–61. [Google Scholar] [CrossRef] [PubMed]
  33. Bai, X.; Jia, H. The release of heavy metals in Gangue Leaching Process. Environ. Sci. Tech. 2009, 22, 5–8. [Google Scholar]
  34. Wang, W.; Hao, W.; Bian, Z.; Lei, S.; Wang, X.; Sang, S. Effect of coal mining activities on the environment of Tetraenamongolica in Wuhai, Inner Mongolia, China—A geochemical perspective. Int. J. Coal Geol. 2014, 132, 94–102. [Google Scholar] [CrossRef]
  35. Pekey, H.; Karakas, D.; Ayberk, S.; Tolun, L.; Bakoglu, M. Ecological risk assessment using trace elements from surface sediments of Izmit Bay (Northeastern Marmara Sea) Turkey. Mar. Pollut. Bull. 2004, 48, 946–953. [Google Scholar] [CrossRef] [PubMed]
  36. Thomas, L. Coal Geology, 2nd ed.; John Wiley & Sons Inc.: Hoboken, NJ, USA, 2012; p. 454. [Google Scholar]
  37. ASTM International. Test Method for Moisture in the Analysis Sample of Coal and Coke; ASTM Standard D3173–11; ASTM International: West Conshohocken, PA, USA, 2011. [Google Scholar]
  38. ASTM International. Annual Book of ASTM Standards. In Test Method for Ash in the Analysis Sample of Coal and Coke; ASTM Standard D3174–11; ASTM International: West Conshohocken, PA, USA, 2011. [Google Scholar]
  39. Dai, S.; Graham, I.T.; Ward, C.R. A review of anomalous rare earth elements and yttrium in coal. Int. J. Coal Geol. 2016, 159, 82–95. [Google Scholar] [CrossRef]
  40. Tayor, S.R. Abundance of chemical elements in the continental crust: a new table. Int. J. Geochim. Cosmochim. Acta. 1964, 28, 1273–1285. [Google Scholar]
  41. General Administration of Quality Supervision. Quality Standard for Ground Water; GB/T 14848-1993; General Administration of Quality Supervision: Beijing, China, 1993. (In Chinese) [Google Scholar]
  42. General Administration of Quality Supervision. Environmental Quality Standard for Soils; GB 15618-1995; General Administration of Quality Supervision: Beijing, China, 1995. (In Chinese) [Google Scholar]
  43. Ministry of Health P.R. China. National Food Safety Standard of Maximum Levels of Contaminants in Foods; GB 2762-2012; Ministry of Health P.R. China: Beijing, China, 2012. (In Chinese)
  44. Guo, Y.; Huang, P.; Zhang, W. Leaching of heavy metals from Dexing copper mine tailings pond. Trans. Nonferrous Met. Soc. China 2013, 23, 3068–3075. [Google Scholar] [CrossRef]
  45. Spears, D.A. The determination of trace element distributions in coals using sequential chemical leaching—A new approach to an old method. Fuel 2013, 114, 31–37. [Google Scholar] [CrossRef]
  46. DeLemos, L.J.; Brugge, D.; Cajero, M.; Durant, J.L.; George, C.M.; Henio-Adeky, S.; Nez, T.; Manning, T.; Rock, T.; Seschillie, B.; et al. Development of risk maps to minimize uranium exposures in the Navajo Church rock mining district. Environ. Health 2009, 8, 29. [Google Scholar] [CrossRef] [PubMed]
Figure 1. Study area and sample location in the open-cast germanium coal-mine area, Inner Mongolia, China.
Minerals 06 00050 g001
Figure 2. The distribution of soil sampling points and sections in the mining area [23].
Minerals 06 00050 g002
Figure 3. Installations of the leaching experiments: I, II, III and IV. Experiment I, 30-g samples, pH= 6.0 ± 0.3; Experiment II, 30-g samples, pH = 8.0 ± 0.3; Experiment III, 30-g samples, pH = 7.0 ± 0.3; Experiment III, 45-g samples, pH = 7.0 ± 0.3.
Minerals 06 00050 g003
Figure 4. Leachabilities (%) of the elements As, V, Cr, Co, Ni and Cu from the coal gangue over 90 h in the four experiments.
Minerals 06 00050 g004
Figure 5. Leachabilities (%) of the elements Zn, Se, Cd, Sn, Pb and Hg from the coal gangue over 90 h in the four experiments.
Minerals 06 00050 g005
Table 1. Test setting data for the four column leaching experimental groups.
GroupWeight of Samples (g)pH of SolutionTest Purpose
I306.0 ± 0.3acid solution
II308.0 ± 0.3alkaline solution
III307.0 ± 0.3neutral solution
IV457.0 ± 0.3different weight of samples
Table 2. Contents (wt %) of coal gangue samples in the Wulantuga open-cast coal mine area.
Proximate and Sulfur AnalysisChemical Compositions
AadMadStdSiO2Al2O3Fe2O3K2OMgOTiO2CaONa2OP2O5MnO
90.309.700.0770.2619.233.763.151.311.100.500.400.040.04
Aad, ash yield, air dry basis; Mad, moisture content, air dry basis; Std, total sulfur, dry basis.
Table 3. Concentrations of the 12 elements in coal gangue, soil, water and vegetation in the Wulantuga open-cast coal mine area. SQGs, sediment quality guidelines.
ElementsCoal Gangue (μg/g)Soil (μg/g)Water (μg/L)Vegetation (μg/g)Clarke Value 2ERL-ERM (μg /g)% of Samples amongst Ranges of SQGs
Min–MaxACWorld Coal Gangue 1EFACEFACEFACEF<ERL>ERL and <ERM>ERM
As7.35–28.5317.9410–804.8630.879.088.3041.073.913.781.88.2–7050500
V107.33–107.35107.34100–4000.3999.740.391.930.1318.990.24135
Cr72.48–94.4683.4750–1600.4192.820.491.100.10161.532.8110081–37050500
Co29.64–78.2153.9210–301.0512.550.270.590.212.680.1925
Ni28.38–52.8840.6340–1400.2623.560.171.630.1915.540.367520.9–51.605050
Cu34.58–44.9739.7735–1500.3532.440.315.010.8125.650.815534–27001000
Zn127.41–155.31141.3660–3000.99104.480.7917.552.2330.540.7670150–41050500
Se0.36–1.160.763–307.410.535.613.51625.260.4515.670.05
Cd0.36–0.410.392–120.950.441.170.010.450.141.220.2
Sn3.98–4.014.002–100.984.461.18−0.020.090.350.302
Pb26.40–28.3927.3910–401.0724.001.02−0.080.065.990.8312.5
Hg0.09–0.170.130.2–0.60.790.080.53Nd0.000.030.650.08
Sc44.72–45.4845.10 41.54 2.47 12.63
1 From Zhou et al. [6]; 2 from Taylor. [40]; AC, average concentration; EF, enrichment factor; ERL, effect range low value; ERM, effect range median value.
Table 4. Analytical concentrations of the selected trace elements in resulting leachates from 0–90 h in Experiment I (μg/L).
Element0–9 h9–18 h18–27 h27–36 h36–45 h45–54 h54–63 h63–72 h72–81 h81–90 hTrend Curve
As10.8115.049.757.814.062.982.291.931.330.65 Minerals 06 00050 i001
V33.1835.7924.7419.1614.4412.289.208.245.973.97 Minerals 06 00050 i001
Cr8.936.524.173.943.833.222.422.382.272.23 Minerals 06 00050 i002
Co11.083.241.461.271.260.920.500.340.480.51 Minerals 06 00050 i003
Ni21.648.404.092.482.161.361.340.580.630.58 Minerals 06 00050 i003
Cu15.606.722.521.351.100.570.210.050.000.00 Minerals 06 00050 i003
Zn55.9344.2540.4727.6025.8718.3719.7318.0919.1921.83 Minerals 06 00050 i003
Se28.850.670.440.480.240.300.180.300.020.28 Minerals 06 00050 i003
Cd0.150.070.030.020.030.010.010.010.010.02 Minerals 06 00050 i004
Sn0.370.220.110.090.090.070.020.010.010.01 Minerals 06 00050 i004
Pb3.391.560.610.480.410.190.040.020.010.01 Minerals 06 00050 i005
Hg0.190.160.110.090.070.230.120.080.090.09 Minerals 06 00050 i004
Table 5. Analytical concentrations of the selected trace elements in resulting leachates from 0–90 h in Experiment II (μg/L).
Elements0–9 h9–18 h18–27 h27–36 h36–45 h45–54 h54–63 h63–72 h72–81 h81–90 hTrend Curve
As10.7210.457.786.884.433.492.352.542.091.62 Minerals 06 00050 i002
V28.0731.2021.8818.6715.9214.8111.5811.539.828.49 Minerals 06 00050 i001
Cr6.877.444.464.074.303.792.712.582.482.42 Minerals 06 00050 i001
Co8.093.451.521.261.370.910.550.360.320.30 Minerals 06 00050 i005
Ni19.9610.605.053.823.832.391.301.100.820.59 Minerals 06 00050 i005
Cu13.458.713.792.141.811.260.440.440.130.01 Minerals 06 00050 i005
Zn52.1245.0838.1541.2833.1626.0417.7726.9614.6113.31 Minerals 06 00050 i006
Se23.031.560.950.870.710.230.380.300.230.09 Minerals 06 00050 i005
Cd0.120.050.020.060.060.020.010.010.010.01 Minerals 06 00050 i004
Sn0.300.290.130.110.120.100.010.010.010.0 Minerals 06 00050 i004
Pb2.102.370.960.710.540.290.090.060.030.01 Minerals 06 00050 i001
Hg0.100.150.120.100.070.120.120.120.070.07 Minerals 06 00050 i007
Table 6. Analytical concentrations of the selected trace elements in resulting leachates from 0–90 h in Experiment III (μg/L).
Elements0–9 h9–18 h18–27 h27–36 h36–45 h45–54 h54–63 h63–72 h72–81 h81–90 hTrend Curve
As13.3816.6615.0412.204.713.161.961.821.310.61 Minerals 06 00050 i001
V38.0743.2931.4826.7813.7612.737.806.505.264.05 Minerals 06 00050 i001
Cr10.118.166.494.403.553.472.352.322.322.34 Minerals 06 00050 i002
Co10.183.761.991.161.080.600.420.280.340.47 Minerals 06 00050 i003
Ni22.5911.028.143.082.341.390.820.750.560.67 Minerals 06 00050 i003
Cu17.319.564.402.151.140.740.070.000.000.02 Minerals 06 00050 i002
Zn68.1449.9359.4043.7438.4718.9221.1225.1114.8619.76 Minerals 06 00050 i006
Se25.081.710.570.550.540.500.190.430.170.21 Minerals 06 00050 i003
Cd0.120.050.271.360.040.021.720.080.050.02 Minerals 06 00050 i008
Sn0.390.280.160.100.070.060.000.000.000.00 Minerals 06 00050 i004
Pb4.142.821.670.840.550.380.050.020.030.03 Minerals 06 00050 i002
Hg0.210.090.060.150.130.070.100.090.070.06 Minerals 06 00050 i008
Table 7. Analytical concentrations of the selected trace elements in resulting leachates from 0–90 h in Experiment IV (μg/L).
Elements0–9 h9–18 h18–27 h27–36 h36–45 h45–54 h54–63 h63–72 h72–81 h81–90 hTrend Curve
As12.7911.1311.3611.498.357.516.796.556.004.01 Minerals 06 00050 i002
V59.6143.0242.9336.3835.3131.7523.6621.0318.9714.32 Minerals 06 00050 i002
Cr31.7517.6718.2712.1814.4611.334.954.274.493.54 Minerals 06 00050 i002
Co34.6814.798.695.665.153.631.681.201.220.89 Minerals 06 00050 i005
Ni55.2437.1724.4115.4911.698.174.303.012.652.65 Minerals 06 00050 i005
Cu36.3227.2120.2712.428.495.802.551.791.581.40 Minerals 06 00050 i002
Zn140.9183.3677.0656.7064.4242.6534.5526.8426.5920.49 Minerals 06 00050 i002
Se107.2020.834.561.901.460.941.110.710.680.50 Minerals 06 00050 i005
Cd0.510.150.120.060.070.040.030.020.020.02 Minerals 06 00050 i005
Sn0.290.650.670.490.600.470.100.060.070.10 Minerals 06 00050 i009
Pb17.878.167.734.454.833.020.940.680.790.43 Minerals 06 00050 i005
Hg0.250.100.100.090.050.150.080.050.060.05 Minerals 06 00050 i004
Table 8. The maximum leached concentrations (Clm) of the 12 elements from the coal gangue of the Wulantuga open-cast coal mine area (μg/L).
ElementsExperiment IExperiment IIExperiment IIIExperiment IV
ClmTp (h)ClmTp (h)ClmTp (h)ClmTp (h)
As18.1915–1811.633–617.6427–3013.990–3
V40.076–935.1312–1545.6912–1581.150–3
Cr11.230–310.2112–1513.470–349.100–3
Co17.760–313.760–316.200–351.150–3
Ni27.880–330.570–331.360–367.000–3
Cu19.000–314.810–322.760–343.970–3
Zn63.550–364.400–393.3524–27185.600–3
Se53.500–364.700–349.730–3196.900–3
Cd0.260–30.240–35.8730–330.790–3
Sn0.480–30.4412–150.560–31.0721–24
Pb4.830–33.7212–155.850–329.500–3
Hg0.4151–540.2260–630.270–30.330–3
Tp: time period of leaching.
Table 9. The maximum leached amount (Lam) and leachability (Lrm) of metals from coal gangue in the Wulantuga open-cast coal mine area.
ElementsExperiment IExperiment IIExperiment IIIExperiment IV
Lam (μg/g)Lrm (%)Lam (μg/g)Lrm (%)Lam (μg/g)Lrm (%)Lam (μg/g)Lrm (%)
As0.1680.0090.1360.0080.1740.0100.0850.005
V0.5360.0050.4840.0050.5020.0050.3150.003
Cr0.1370.0020.1170.0010.1340.0020.1070.001
Co0.0600.0010.0430.0010.0460.0010.0590.001
Ni0.1200.0030.1160.0030.1160.0030.1270.003
Cu0.0720.0020.0710.0020.0690.0020.0890.002
Zn1.0150.0070.8600.0061.0960.0080.5190.004
Se0.0790.1050.0600.0790.0610.0810.0960.127
Cd0.0010.0030.0010.0020.0140.0370.0010.002
Sn0.0030.0010.0020.0010.0020.0010.0030.001
Pb0.0170.0010.0160.0010.0220.00140.0380.001
Hg0.0050.0370.0030.0250.0040.0270.0010.007
Table 10. Concentrations of trace elements defined in groundwater, soils and foods.
ElementQuality Standard for Ground Water 1 (μg/L)Environmental Quality Standard for Soils 2 (μg/L)Limits of Contaminants in Foods 3 (μg/g)
Grade IGrade IIGrade IIIGrade IVGrade VLevel OneLevel TwoLevel Three
Natural BackgroundpH < 6.5pH 6.5–7.5pH < 7.5pH > 6.5
As≤5≤10≤50≤50>50≤15≤40≤30≤25≤40≤0.5
V-----------
Cr≤5≤10≤50≤100>100≤90≤150≤200≤250≤300≤0.5
Co≤5≤50≤50≤1000>1000------
Ni≤5≤50≤50≤100>100≤40≤40≤50≤60≤200≤1.0
Cu≤10≤50≤1000≤1500>1500≤35≤50≤100≤100≤400-
Zn≤50≤500≤1000≤5000>5000≤100≤200≤250≤300≤500-
Se≤10≤10≤10≤100>100------
Cd≤0.1≤1≤10≤10>10≤0.20≤0.30≤0.60≤1.0-≤0.2
Sn----------≤250
Pb≤5≤10≤50≤100>100≤35≤250≤300≤350≤500≤0.3
Hg≤0.05≤0.5≤1≤1>1≤0.15≤0.30≤0.50≤1.0≤1.5≤0.01
1 GB/T14848-93 [41]; 2 GB15618-1995 [42]; 3 GB2762-2012 [43]. “-” means data are not available.

