Article

Sequential Extraction Insights into the Mobility of Arsenic (As), Lead (Pb), Chromium (Cr), and Copper (Cu) in Coal Fly Ash

School of Earth and Atmospheric Sciences, Georgia Institute of Technology, 311 Ferst Drive, Atlanta, GA 30332, USA
*
Author to whom correspondence should be addressed.
Minerals 2026, 16(8), 800; https://doi.org/10.3390/min16080800
Submission received: 26 June 2026 / Revised: 25 July 2026 / Accepted: 28 July 2026 / Published: 31 July 2026
(This article belongs to the Section Environmental Mineralogy and Biogeochemistry)

Abstract

Coal combustion generates coal fly ash (CFA) as a solid byproduct, with nearly 16 million tons produced in 2023 alone. CFAs contain harmful trace metals, including arsenic (As), lead (Pb), chromium (Cr), and copper (Cu), whose mobility and environmental impact depend on their chemical speciation. This study examined a set of 16 representative CFAs across the U.S. with trace element speciation and mobility operationally defined by chemical sequential extraction. A principal component analysis (PCA) was performed on CFA bulk properties, and trace element partitioning data were projected onto the PCA space to explore associations. The residual and reducible fractions are the primary hosts for As, Pb, Cr, and Cu, accounting for 8%–95% and 2%–82% of total concentrations, respectively. Subbituminous CFAs were associated with a higher CaO content, whereas bituminous CFAs contained a higher Fe2O3 content. Interestingly, subbituminous CFAs were primarily associated with the more labile fractions (i.e., exchangeable, acid-soluble, reducible, and oxidizable). This suggests that Cu, Cr, and Pb may be more mobile in subbituminous CFAs, which are characterized by higher CaO and lower Fe2O3 contents in this study. A partial least squares discriminant analysis (PLS-DA) revealed that CaO and Fe2O3 content are statistically significant in determining the mobility of Cr.

1. Introduction

The dynamic landscape of primary energy sources in the U.S. began with coal in the mid-1700s. Over time, coal was gradually displaced by natural gas, due to its lower cost and operational flexibility, followed by the expansion of petroleum, nuclear power, and renewable energy sources [1]. Although coal has been a long-established energy source, it only accounted for 16% of U.S. electricity generation in 2023, compared to 43% from natural gas, 21% from renewables, and 19% from nuclear power [2]. Despite the relatively minor share, coal combustion generated more than 66 million tons of byproducts, including nearly 16 million tons of coal fly ash (CFAs) [3]. CFAs are solid particulates with an average size ranging up to 250 µm, which are present in the combustion flue gas and captured by baghouse filters (BHs) and electrostatic precipitators (ESPs). These CFAs may be repurposed in the concrete/cement industry or disposed of in surface impoundments (ash ponds). Currently, repurposing of CFA in cement has been steadily increasing from 59% to 74% from 2022 to 2023, due to lower CO2 emissions in comparison to Portland cement [3,4]. As of 2025, CFAs disposed of in ash ponds may be beneficially reused in the concrete industry if they meet the ASTM-C618 standards [5].
CFAs are composed of amorphous aluminosilicate glass phases along with other minerals such as crystalline aluminosilicates (e.g., mullite), iron oxides (e.g., hematite and magnetite), oxides (e.g., periclase), and quartz [6,7,8]. Based on the contents of major elements, CFAs are classified as class C (50%–70% of SiO2 + Al2O3 + Fe2O3) or class F (50%–70% of SiO2 + Al2O3 + Fe2O3) [5]. In addition to major elements, CFAs also contain harmful trace metals, including arsenic (As), chromium (Cr), copper (Cu), and lead (Pb), with concentrations reaching up to 2120 mg/kg in the case of Pb [9,10]. Although concentration does not provide much insight into trace element distribution and speciation, previous studies using x-ray absorption spectroscopy (XAS) and scanning electron microscopy with energy dispersive x-ray spectroscopy (SEM-EDX) reveal their occurrence as trace metal-bearing iron oxides (i.e., Cr-doped Fe2O3, FeCr2O4), silicates [i.e., Ca3Cr2(SiO4)3], copper oxides, Cu-iron oxides, and calcium arsenate [e.g., Ca3(AsO4)2 or pyroarsenate Ca2As2O7] [11,12,13,14].
Whether CFAs are reused or disposed of, these naturally occurring harmful trace metals may pose serious environmental and ecological risks. Although trace metals are naturally occurring, their toxicity varies with factors such as oxidation state, concentration, and exposure pathways. Various studies have documented widespread trace metal contamination in soils across China, Nigeria, and Austria [15,16,17], highlighting the need for effective monitoring and remediation strategies. These studies also show the role of anthropogenic activities in exacerbating metal contamination globally, which poses a risk for both ecosystems and human health. CFAs are an anthropogenic source of trace metals, and investigating their composition and mobility behavior is essential for assessing potential environmental impacts. Comprehensive knowledge of speciation and mobility can inform risk assessment and guide safe disposal or repurposing strategies of CFAs.
The sequential extraction partitions elements into different fractions of species using chemical reagents. The ion-exchangeable and acid-soluble fractions are the most labile, and they are associated with surface-bound species and carbonates, respectively. Subsequently, the reducible fraction refers to species that are bound to Fe and Mn oxides and are released under reducing conditions, whereas the oxidizable fraction contains species bound to organic matter and sulfides that are mobilized under oxidizing conditions. Species that remain immobile throughout these processes are the residual fraction [18]. Various studies have probed the mobility of these trace metals through sequential extraction [11,19,20], yet further research is needed to evaluate trace element speciation and mobility with regard to different CFA composition, combustion parameters, and coal sources. The CFA samples used in this study were collected based on characteristic CFAs generated across the U.S. from a survey study performed by the Electric Power Research Institute (EPRI) [21]. In collaboration with EPRI, 16 CFAs were selected based on representative coal combustion conditions, coal sources, and coal type in electrical generating units (EGUs). The representative parameters include tangential or opposed furnace type (e.g., burners located on opposite sides), nitrogen oxide (NOx) controls as selective catalytic reduction (SCR) or low NOx burners (used for EGUs less than 300 MWg), and subbituminous or bituminous coal [14].
CFA samples were first characterized for bulk properties: major and minor trace elements, particle size, surface area, mineral phases, and loss on ignition (LOI), which measures unburned carbon and volatile content. This information was obtained using x-ray fluorescence spectrometry (XRF), inductively coupled plasma mass spectroscopy (ICP-MS), x-ray diffraction (XRD), and laser diffraction. Sequential extraction was then used to examine the partitioning of As, Pb, Cr, and Cu in CFAs. A principal component analysis (PCA) was employed to assess the relationships between CFA bulk composition (i.e., major oxides and LOI) and trace metal distribution across operationally defined fractions by supplementary variable projection of these trace element fractions onto PCA. Together, these approaches provide an in-depth evaluation of how CFA composition, combustion parameters, and coal sources govern harmful trace element mobility, particularly under conditions relevant to CFA reuse or disposal.

2. Materials and Methods

2.1. Sample Collection

CFA samples were collected directly from electrostatic precipitators (ESPs) or baghouses (BHs) by EPRI [21]. Samples were chosen based on representative conditions from coal-fired EGUs across the U.S., including typical coal basins, coal types, furnace types, NOx emission controls, and fly ash capture controls. The representative parameters are summarized in Table S1 in the Supplemental Information, which includes coal basins [Powder River Basin (PRB), Northern Appalachia (N. App), and the Illinois Basin (ILB)], coal types (sub-bituminous or bituminous), furnace types (tangential or opposed), and NOx controls [selective catalytic reduction (SCR) or low NOx burners].

2.2. Bulk Characterization

CFA samples were analyzed for bulk properties, including average particle size, bulk density, surface area, volatile content with loss on ignition (LOI), major elemental composition, trace metal concentrations, and mineral phases. The particle size, bulk density, and surface area of CFA samples were analyzed by SGS TEC Services (Lawrenceville, GA, USA) using laser diffraction and the ASTM C188-17 standard test method for density of hydraulic cement. Major elemental composition, trace metal concentrations, and mineral phases were analyzed using a ThermoARL Advant’XP X-ray Fluorescence Spectrometer (XRF, Thermo Fisher Scientific, Watham, MA, USA) and total digestion followed by solution analysis using an Agilent 7700 inductively coupled plasma mass spectrometer (ICP-MS, Agilent Technologies, Santa Clara, CA, USA) by the Peter Hooper GeoAnalytical laboratory at Washington State University [14]. Leachates from sequential extraction were analyzed at the Georgia Institute of Technology using an Agilent 7900 ICP-MS (Agilent Technologies, Santa Clara, CA, USA). ICP-MS solutions were prepared with 2% trace metal grade HNO3 and 20 ppb indium as an internal standard. SPEX CertiPrep multi-element calibration standard 2A was used, and National Institute of Standards & Technology (NIST) Standard Reference Material (SRM) 2690 Coal Fly Ash was used as a reference material for the ICP-MS method development of arsenic. The four elements analyzed in this study were chosen based on reliable ICP-MS determination.

2.3. Sequential Extraction

Sequential extraction was performed based on previously reported methods in duplicates [18,22].
Ion-Exchangeable Fraction
First, 0.5 g of CFA was added to a 50 mL polyethylene tube, followed by 8 mL of MgCl2 (pH 7). The dispersion was allowed to react for 1 h at 140 rpm (ion-exchangeable fraction). After 1 h, the mixture was centrifuged for 10 min at 10,000 rpm. The supernatant was collected, filtered using a 0.22 µm filter, and acidified for ICP-MS analysis. This step was repeated for each fraction, and residues were washed with 4 mL of Milli-Q water before each subsequent step.
Acid-Soluble Fraction
To investigate the carbonate-associated phase (acid-soluble fraction), 16 mL of 1 M NaOAc (pH 5) was added, and the mixture was allowed to react for 6 h at 140 rpm. Next, 20 mL of 0.04 M NH2OH HCl in 25% (v/v) CH3COOH was added and reacted for 6 h (determined in previous experiments [22]) at 96 °C, with agitation every 30 min (reducible fraction).
Oxidizable Fraction
Finally, the oxidizable fraction was targeted using 3 mL of 0.02 M HNO3 and 5 mL of H2O2 (30%) with a pH adjustment to 2 and reacted for 3 h at 85 °C. After the reaction, 5 mL of 3.2 M CH3COONH4 in 20% (v/v) HNO3 was added. The four elements analyzed in this study were chosen based on reliable ICP-MS determination. The total concentrations for trace metals were determined from total digestion of CFAs, and the amount of trace metals leached by each fraction was summed, then subtracted from the concentrations obtained by total digestion to determine the concentrations in the residual fraction.

2.4. Statistical Analysis

Linear correlations between oxide contents of CFAs were explored using pair-wise correlation analysis. These analyses were performed in R-studio version 4.4.1 [23] with a line of best fit and coefficients of determination (R2) and correlation coefficients (R) [24,25,26]. Correlations were deemed as strong or highly correlated when |R| > 0.70 and |R| > 0.90 [27]. A principal component analysis (PCA) was performed using R-studio for bulk CFA properties: major oxides (Fe2O3, Al2O3, SiO2, and CaO) and LOI (unburned carbon and volatiles). Before PCA, major oxides were transformed with “clr” using the compositions package [28]. Lastly, quantitative supplementary variables were projected onto PCA using the vegan package [29], and then qualitative variables were projected (i.e., coal type and coal combustion parameters listed in Table S1) and shown alongside PCA. PCA is a useful tool that allows data reduction as well as visualization of relationships within samples and between sample characteristics (variables). It transforms a dataset of n variables into a new set of variables called principal components (PCs), where each PC is a linear combination (only length and rotation are changed, not overall shape) of the original variables [30]. PCA may be conceptualized as rotating the original coordinate axes and projecting the data onto these new axes. The first PC captures a majority of the variance, and each resulting PC captures the remaining variance and is perpendicular to the previous PCs [31]. Each PC gives new coordinates for the samples, called scores, that represent the location of the samples in the PC space. While the coefficients used in the linear transformation are known as loadings, they also correspond to the cosine of the angles between the original and principal component axes, highlighting the correlation between each variable and a principal component [32]. Since the relationship of the loadings to the PC is defined by the cosine of the angle, they range from −1 to 1, with values closest to ±1 showing the strongest association [32]. Lastly, a biplot showcases both loadings and scores.
Based on patterns highlighted by PCA, partial least squares discriminant analysis (PLS-DA) was conducted on trace metals classified according to their mobility risk [33]. The contribution of oxide phases to sample clustering was evaluated using variable importance in projection (VIP) scores.
Details on supplementary projection are described in Texts S1 and S2.

3. Results and Discussion

3.1. CFA Composition and Particle Size Distribution

CFA properties, including elemental composition for major oxides (Fe2O3, Al2O3, SiO2, and CaO), are shown in Table 1, alongside trace element concentrations for As, Pb, Cu, and Cr. Concentrations for As ranged from 14 to 148 mg/kg, with those for Pb ranging from 24 to 145 mg/kg, those for Cu ranging from 46 mg/kg to 178 mg/kg, and those for Cr ranging from 59 to 216 mg/kg. Trace element concentrations are similar to those from previous work with 1.4 to 446 mg/kg of As, [13,34,35] 1.4 to 2120 mg/kg for Pb, [9,10] 67 to 431 mg/kg of Cu, [11,36] and 106 to 213 mg/kg for Cr [37]. Notably, CFAs may be beneficially reused in the concrete industry if they meet standards from ASTM C618-25a, which classifies reusable CFAs as either class C or class F. Based on this standard specification, there are 8 class C samples (Al2O3 + SiO2 + Fe2O3 ≥ 50%), and 7 class F samples (Al2O3 + SiO2 + Fe2O3 ≥ 70%), and 1 sample (sample 10) did not meet either of the composition requirements [5]. Other properties of CFAs, including average surface area, bulk density, loss on ignition (LOI), and average particle size (8–108 µm), are also presented [14].

3.2. Trace Metal Partitioning by Sequential Extraction

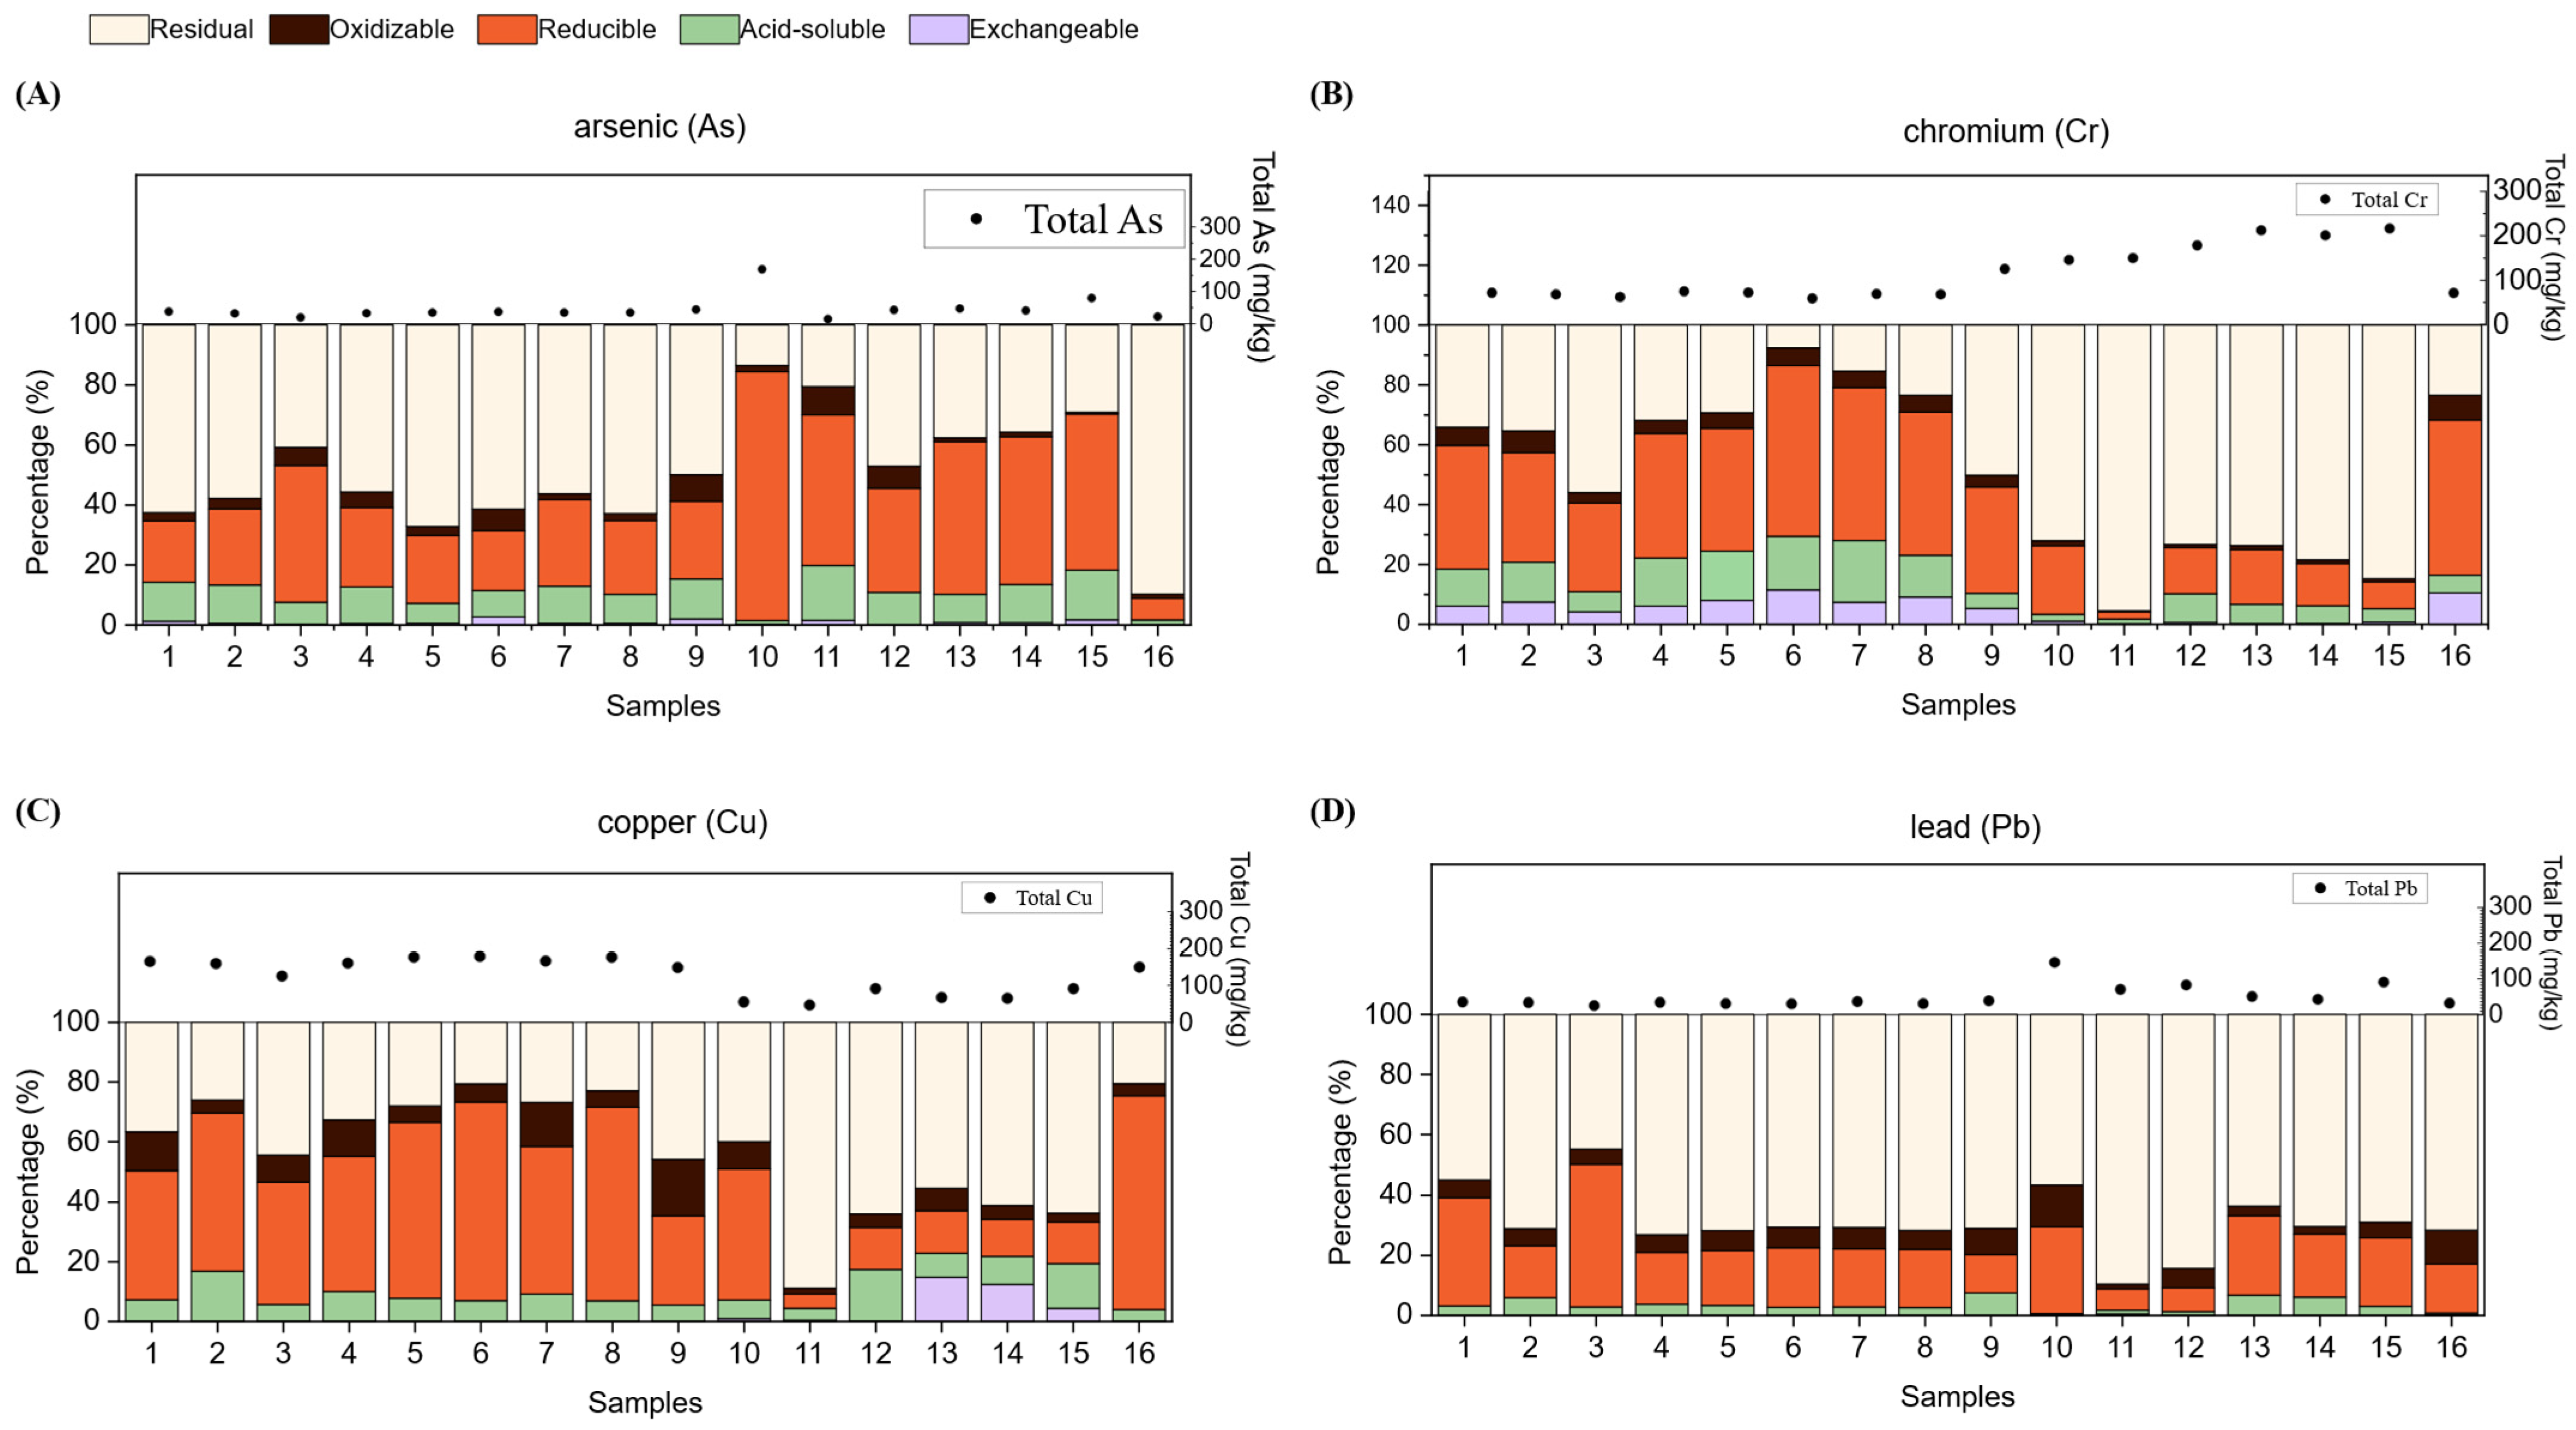
Trace element partitioning in CFAs is shown in Figure 1 (see Tables S2–S5 for more details). Overall, the residual and reducible fractions are the primary hosts for As, Cr, Cu, and Pb, which accounted for 8%–95% and 2%–82% of these trace metals, respectively (Figure 1). The acid-soluble fraction contains 0.5%–20% of trace metals, and the oxidizable fraction hosts 0.4%–19%. Lastly, the ion-exchangeable fraction is relatively modest, containing 0.01%–17% of trace metals, which indicates minor surface adsorbed species compared to the reducible and residual fractions. Overall, the analyzed trace metals were partitioned in CFA samples in the following order: ion-exchangeable < oxidizable < acid-soluble < reducible < residual. To investigate trace element mobility and phase association, sequential extraction was performed to target the exchangeable, acid-soluble, reducible, oxidizable, and residual fractions [18]. Based on previous studies on trace element partitioning in CFAs using Tessier’s sequential extraction method [22], the exchangeable fraction is associated with surface adsorbed species; the acid-soluble fraction at pH 5 is characterized by incomplete dissolution of carbonates as well as other minerals, including anhydrite, periclase, and lime; the reducible fraction at pH 2 indicates incomplete dissolution of Fe oxides; the oxidizable fraction is associated with organic dissolution at pH 2; and the remaining residual fraction is composed of aluminosilicates and unreacted iron oxides.
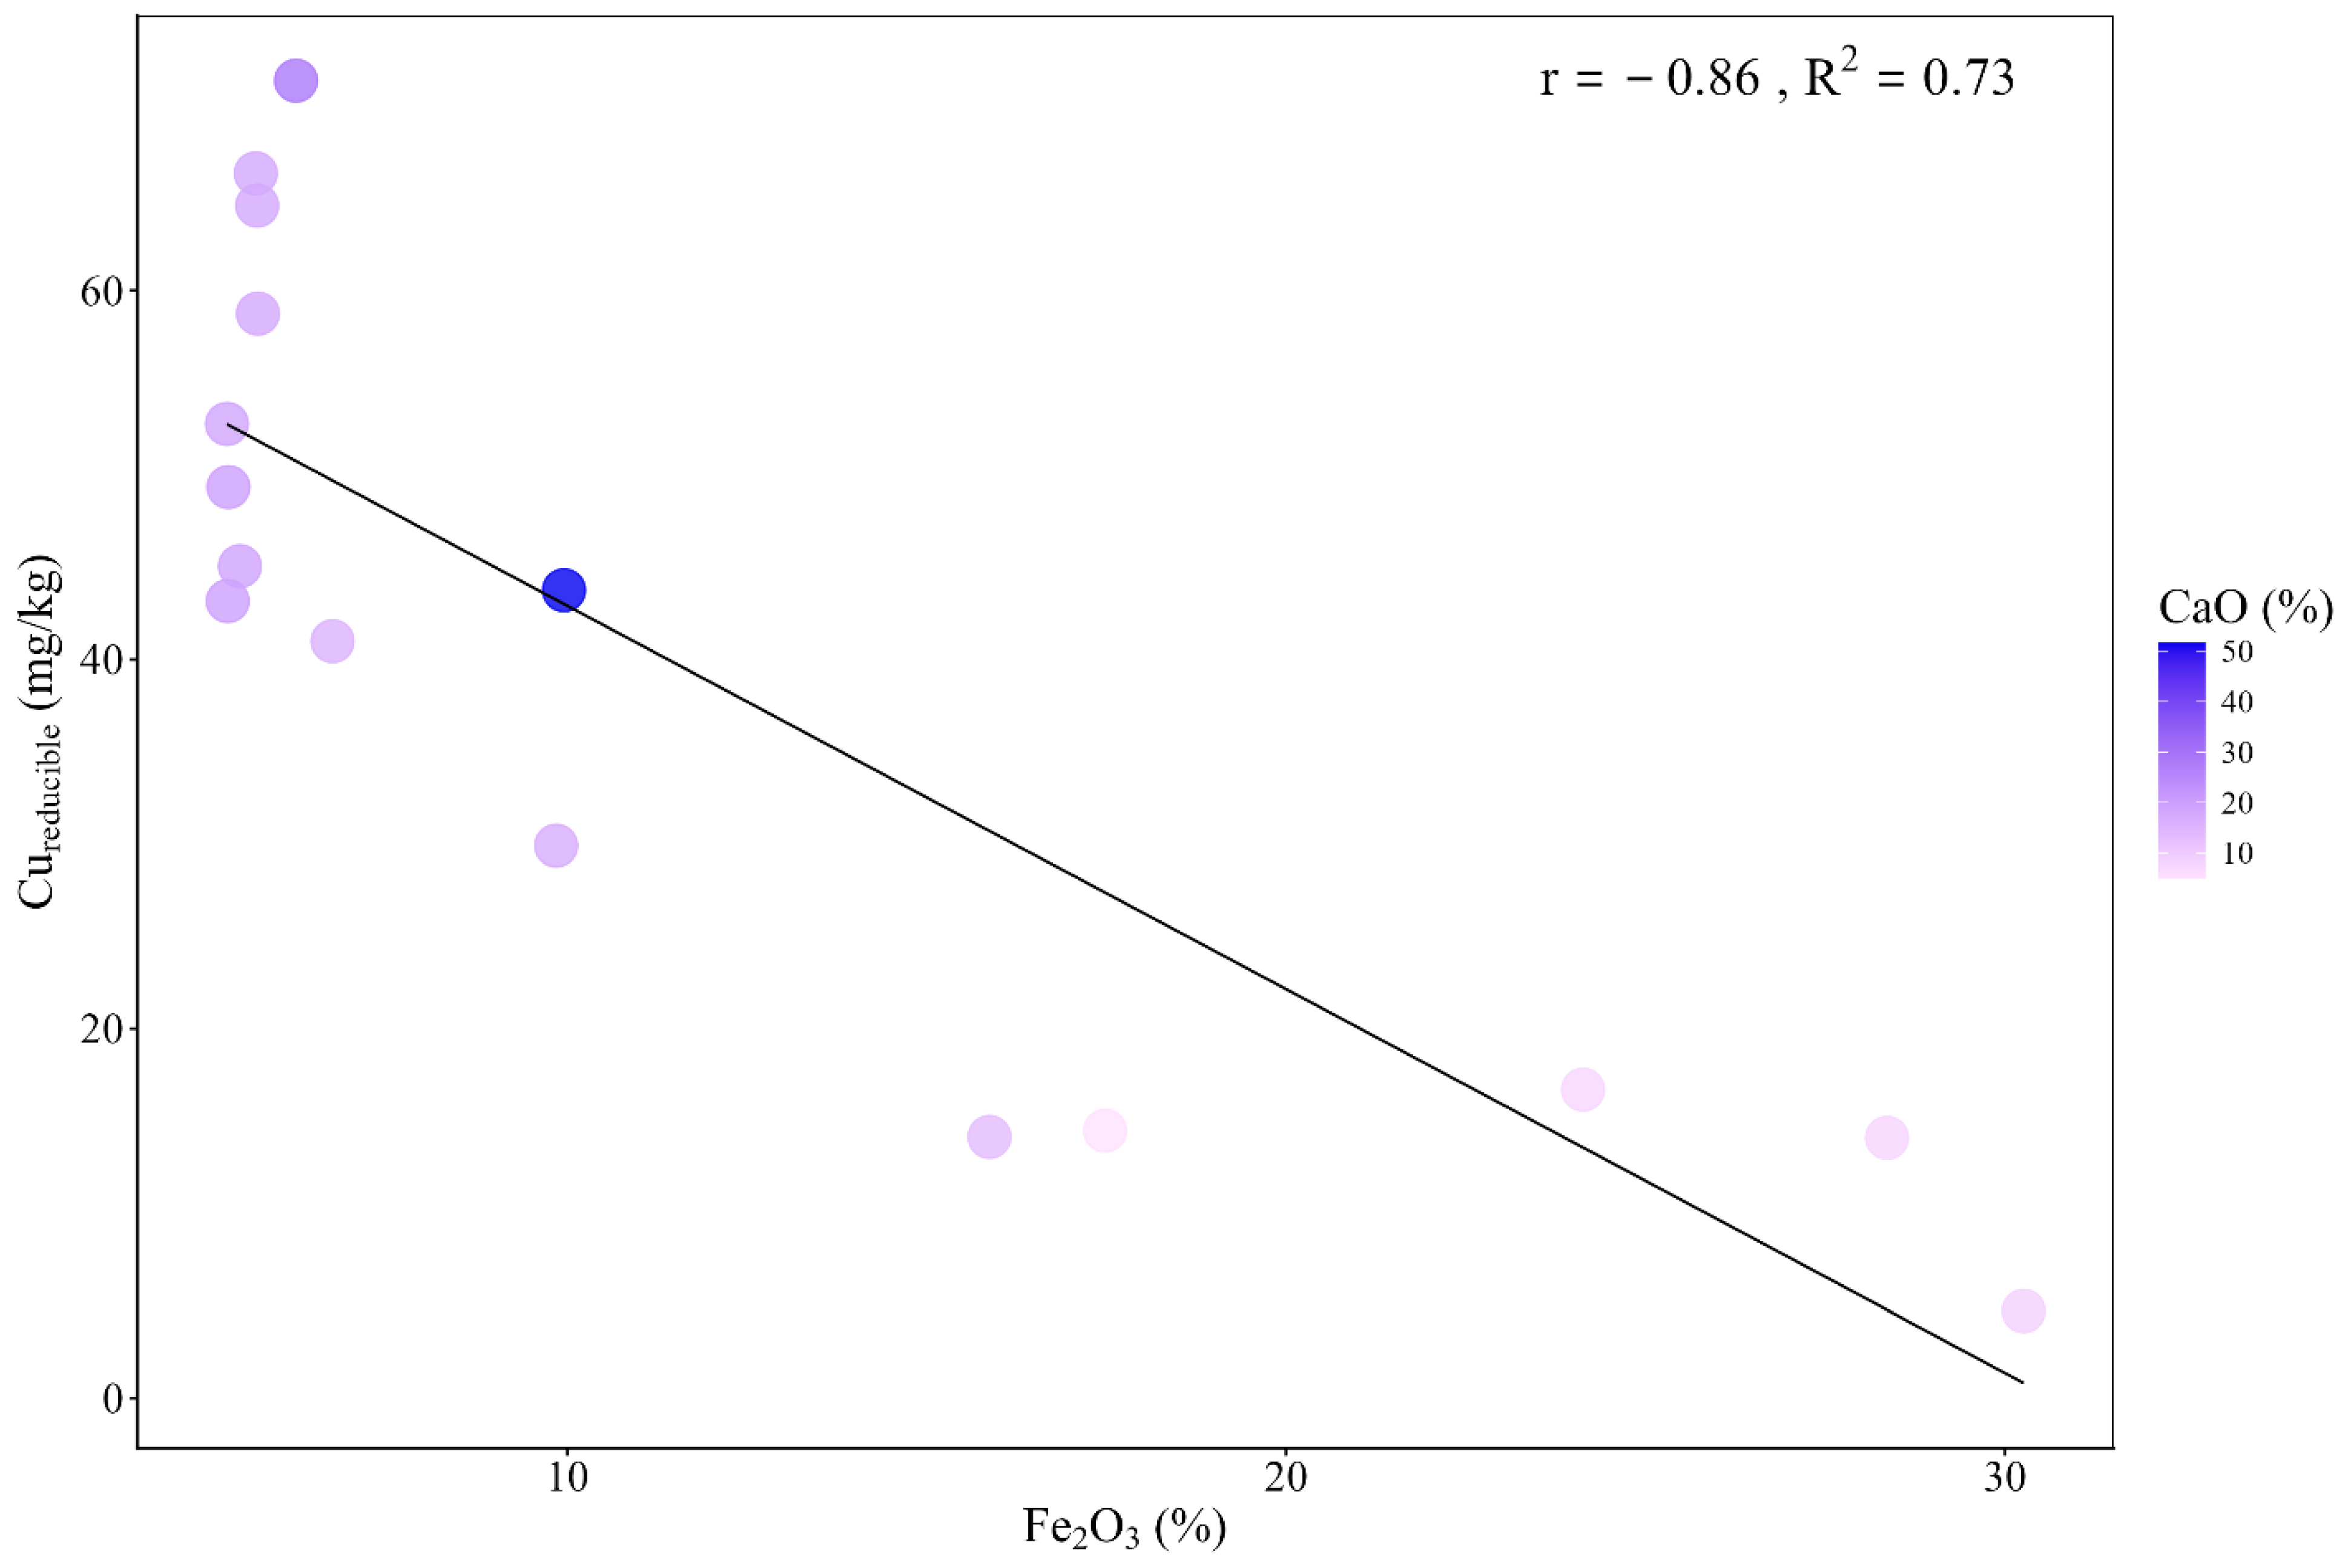
More specifically, Figure 1C indicates that Cu is primarily associated with the reducible fraction, except samples 11, 12, 13, 14, and 1B. As shown in Table 1, these five samples have the highest Fe2O3 content among all samples and contain the lowest CaO content. In Figure 2, samples that have the highest Cu in the reducible fraction (29.9%–71.4%, or 5-71 mg/kg of Cureducible) also have the lowest Fe2O3 content (9.8%–5.26%). These samples are clustered in the top-left corner and have a high CaO content (15%–51.6%). Conversely, samples with the lowest Cureducible (4.7%–14.5%) tend to have a higher Fe2O3 content (15.9%–30.3%) and lower CaO content (4.9%–13.3%). This trend suggests that the CaO content may positively affect Cu speciation in the reducible fraction. A linear relationship between Cureducible and Fe2O3 content is supported by a Pearson’s correlation coefficient (r) of −0.86 and a coefficient of determination (R2) of 0.73, indicating a strongly negative correlation between Fe2O3 content and Cu in the reducible fraction. This finding supports the role of iron oxide phases in controlling partitioning of Cu species in CFAs in this study. Furthermore, CFA samples are naturally clustered by CaO content, suggesting that CFAs with high and low CaO contents are distinct in overall composition due to differences in coal source and combustion temperatures. Similar patterns were also observed for Cr in the reducible fraction (Figure S1) and Pb in the oxidizable fraction (Figure S3). These results are supported by a previous work that reported Cu to be primarily associated with the reducible fraction [38] and other studies that found Ca or Fe2O3 contents influence trace element mobility, especially a higher trace element mobility for class C CFAs (high CaO content) [11].
Pb was the least mobile trace element with the highest residual fraction among all four analyzed trace metals (Figure 1), which is in agreement with previous findings [19]. In coal, As and Pb exist in sulfide-bearing minerals, such as pyrite (both Pb and As), galena (Pb), organics, aluminosilicates (both Pb and As), and carbonates, but their environmental mobility differs [39,40,41,42]. A study from 2005 suggested that As in sulfide phases may stem from diagenetic transformation of As-bearing organics in coal [41,43]. Notably, sample 10 contained elevated concentrations of As, Pb, and Cr, which may be due to the heterogeneity in the feed coal or combustion conditions. This sample also has the highest unburned carbon content (i.e., LOI of 9.72) in this study, suggesting less complete combustion, which may have influenced the distribution and retention of these trace metals. The mobility of As and Pb may differ due to pH-dependent speciation and redox conditions. Redox conditions and pH significantly influence As mobility due to their impact on As oxidation state, speciation, and ultimately sorption behavior. Meanwhile, in most cases, Pb mobility is controlled by pH-dependent processes including precipitation and adsorption, with redox conditions influencing the stability of Pb mineral phases. For example, in aqueous solutions, pH influences ion behavior and mineral sorption, where As(III) is amphoteric and As(V) exists as a neutral ion and an oxyanion, while Pb behaves primarily as a cation and its insolubility increases with increasing pH [42,44].
Liu et al. reported that Cr is mainly present in CFAs as iron oxides (i.e., Cr-doped Fe2O3, FeCr2O4), spinels, or silicates (i.e., Ca3Cr2(SiO4)3) or entrapped within amorphous glass phases, while Cu was found to occur as copper oxides, Cu-iron oxides, and entrapped within glass [11]. While these correlations are specific to CFAs examined in this study, the results highlight the potential for bulk composition (i.e., Fe2O3 and CaO) to influence trace element distribution patterns. Additionally, Ca concentration does not correlate with specific trace metal mineralogy. Instead, trace metal distribution within CFAs varies, depending on whether the metals are embedded within aluminosilicate glass phases, associated with iron oxides or spinel minerals, or present as discrete oxides [11]. The distribution of trace metals across these fractions may be described by their mode of occurrence within the feed coal and their geochemical behavior during extraction. Similar to As, Cr mobility is impacted by redox conditions, which influence its oxidation state, where Cr(VI) is generally more mobile than Cr(III). An important factor for these trace metals is their occurrence in the feed coal. For example, aluminosilicate glass in CFAs primarily results from clays in the feed coal, with their decomposition during combustion relying on the clay structure and fluxing agents (e.g., iron, calcium, magnesium), which destabilize the aluminosilicate structure and lower the melting point [45,46]. Therefore, stable phases with entrapped trace metals are inaccessible to the reagents used during extraction.
The reducible fraction results revealed that Cr, Cu, and As generally had higher mobilities compared to Pb; these elements vary in their mineral coal source. In coal, Pb, Cu, and As are co-hosted in pyrite, while both Cr and Cu are found in iron oxides and silicate minerals, but these trace metals may also be found in clays and organics [47,48]. During combustion, pyrite may transform into iron oxides (e.g., magnetite and hematite) or pyrrhotite, which is then oxidized to magnetite and hematite [49,50]. Both magnetite and hematite are stable minerals and have been shown to resist decomposition by reagents used in this sequential extraction method [11]. Therefore, Pb, Cu, and As may be found within these stable minerals; samples that contained less iron content were shown to exhibit more mobility in the reducible fraction Figure 1. A variety of factors may influence the partitioning and associations between these metals, including their transformation during combustion, but this study indicates that iron content is significant.
By using synchrotron x-ray absorption near-edge structure (XANES), our previous study revealed that As was primarily associated with calcium-bearing phases in these CFA samples [14]. Although XANES provided insight into As speciation, it does not quantify the proportion of As-bearing Ca mineral phases relative to total CaO. This distinction is important because the CaO content influences pH buffering capacity and potential formation of Ca precipitates that may immobilize As [51]. Although synchrotron-based techniques provide percentage distributions, as a complementary technique, bulk chemical analyses such as sequential extraction offer quantitative concentrations. CFAs with low CaO content (i.e., samples 11, 12, 13, 14, and 1B) exhibited the highest As mobility, while samples rich in CaO, or class C CFAs (except sample 10), displayed the lowest As mobility, with As being primarily associated with the residual fraction.

3.3. Risk Assessment

To evaluate the environmental risk of trace metals in solid materials (i.e., CFAs), results from sequential extraction were also used to determine the risk assessment code [11,52,53,54]. The risk assessment code is based solely on the exchangeable and acid-soluble fractions, with risk categories defined as follows: <1% (no risk), 1 ≤ x ≤ 10% (low risk), 10 < x ≤ 30% (medium risk), 30 < x ≤ 50 (high risk), and x > 50% (very high risk) [53]. Since Fe2O3 and CaO content were found to influence element partitioning in the pair-wise plots (Figure 2, Figures S1 and S2), CFAs were assessed using these compositional parameters. For Cr, the risk assessment codes of CFAs with high Fe2O3 content and low CaO (potential class F CFAs) ranged from 2%–10% and are classified as no or low risk. In contrast, potential C class (high CaO and low Fe2O3) CFAs for Cr ranged from 10%–30% as medium risk (see Table S6). These findings are in agreement with Liu et al. stating that class C CFAs have higher trace element mobility [11]. However, potential class F CFAs were found to have higher risks compared to potential class C CFAs for Cu, Pb, and As. Overall, Pb was found to be the least mobile, classified as either safe or low risk, while Cu was the most mobile, classified up to medium risk.

3.4. Relationships Between CFA Composition and Trace Element Partitioning

The characterization of representative CFAs offered insight into bulk properties including oxide content and LOI; meanwhile, sequential extraction results provided information on element partitioning (i.e., Cr, Cu, As, Pb). The relationships between these properties and trace element partitioning were probed with linear analysis using correlation coefficients (r) and coefficients of determination (R2). Linear regression results indicated that Fe2O3 and CaO content are key oxides controlling Cu, Cr, and Pb partitioning, with Fe2O3 governing the reducible fraction and CaO influencing the oxidizable fractions.
Due to the abundance of CFAs, their bulk properties, and partition data, reducing the dimensionality of data is essential for identifying major relationships. Therefore, a principal component analysis (PCA) was applied to compositional properties of pristine CFAs, including Fe2O3, CaO, Al2O3, SiO2, and LOI, to provide a condensed view of their bulk characteristics. Although PCA can accommodate all 320 results from trace element partitioning (5 fractions and 4 trace metals for 16 CFAs) and bulk property measurements, performing PCA on the full dataset could potentially mask the relationships between partitioning and bulk compositions. To address this, trace element partitioning results were projected onto the PCA as supplementary variables.

3.5. Principal Component Analysis (PCA)

Based on this framework, PCA for CFA bulk properties of Fe2O3, CaO, Al2O3, SiO2, and LOI indicated that 91% of the variability in the dataset was captured by the first 2 PCs (54% and 37%, respectively), as presented in Figure S3 and Table S7. Another method for determining the significance of a PC is to evaluate whether its eigenvalue is greater than 1 or not [55]. Both PC1 and PC2 have eigenvalues of >1, indicating that they are both significant (Table S8). Next, loadings for each of the PCS are listed in Table S9. Loading values with an absolute value approaching 0.9 indicate a strong correlation between the PC and the given variable, and absolute values greater than 0.5 are considered significant. On this basis, loadings considered in this study include −0.55, −0.58, and 0.54 for Al2O3, SiO2, and LOI, respectively, in PC1 as well as −0.71 for CaO and 0.68 for Fe2O3 in PC2 (Table S9).
A classic PCA biplot showing both scores and loadings is presented in Figure S4. Characteristic samples are shown in black, and the red vectors (arrows) represent the loadings of each variable (i.e., Fe2O3, CaO, Al2O3, SiO2, and LOI). The angle between two vectors reflects their correlation, where vectors with a small angle relative to one another have a strong positive correlation, and vectors with an angle near 180° indicate a strong negative correlation [cos (180°) = −1]. Based on our previous findings [14] and Figure S4, the angle between SiO2 and Al2O3 (5.7°) suggests a strong positive correlation, which agrees with the presence of aluminosilicates in CFAs. Other variables with strong negative correlations are CaO to Fe2O3 (150°), SiO2 to LOI (159°), and Al2O3 to LOI (164°). For CaO and Fe2O3, this strong negative correlation may be explained by the negligible co-occurrence of Fe and Ca for minerals in CFAs, as each of these is found separately as Ca-rich minerals, including calcite and lime, while iron minerals include magnetite and hematite. Lastly, the strong negative correlation between aluminosilicate content and LOI, or a proxy for unburned carbon content (although LOI includes loss of volatiles as well as unburned carbon), suggests that the unburned carbon content decreases as the aluminosilicate content increases. An increase in unburned carbon indicates incomplete or inefficient combustion. One study reported that coal burned through a circulating fluidized bed (combustion at 850–900 °C) produced CFA with higher unburned carbon content, reduced aluminosilicate mineral formation (including mullite), and lower SiO2 and Al2O3 contents [56].
In Figure S4, each sample is shown as a label corresponding to its PCA scores, and there are two major clusters with samples 1–9 and samples 11, 13, and 14. Samples 1–9 have similar Fe2O3, CaO, Al2O3, SiO2, and LOI values as well as similar coal sources (primarily PRB), coal type (primarily subbituminous), and ESPs used for CFA capture (Table S1). Although sample 3 is clustered near samples 1–9, it is closest to the vectors of SiO2 and Al2O3, indicating that these properties differentiate sample 3 from this major cluster. As shown in Table 1, sample 3 contained the highest SiO2 content (49.12%) and the lowest Al2O3 content (16.88%) compared to samples 1–9. As for samples 11, 13, and 14, these are clustered near the direction of Fe2O3, indicating that they have the highest iron content (Fe2O3 of 30.26%, 24.13%, and 28.36%). Samples 11, 13, and 14 also share similar ranges for SiO2 (40.92%–42.12%) and CaO (7.47%–8.49%). Additionally, sample 2S is the closest to the direction of CaO, implying that it has the highest CaO content, other than sample 10, as evidenced by 28.68% CaO. As for sample 1B, it differs from samples 11, 13, and 14 in terms of its lower Fe2O3 content and high SiO2 content (51.04%). Lastly, sample 10 is grouped the furthest from all the samples, highlighting its differences in terms of LOI (9.72 vs. 0.42–8.86), extremely high CaO content (51.61%), and low Al2O3 (11.24%) and SiO2 content (24.13%).

3.6. Supplemental Quantitative Variables

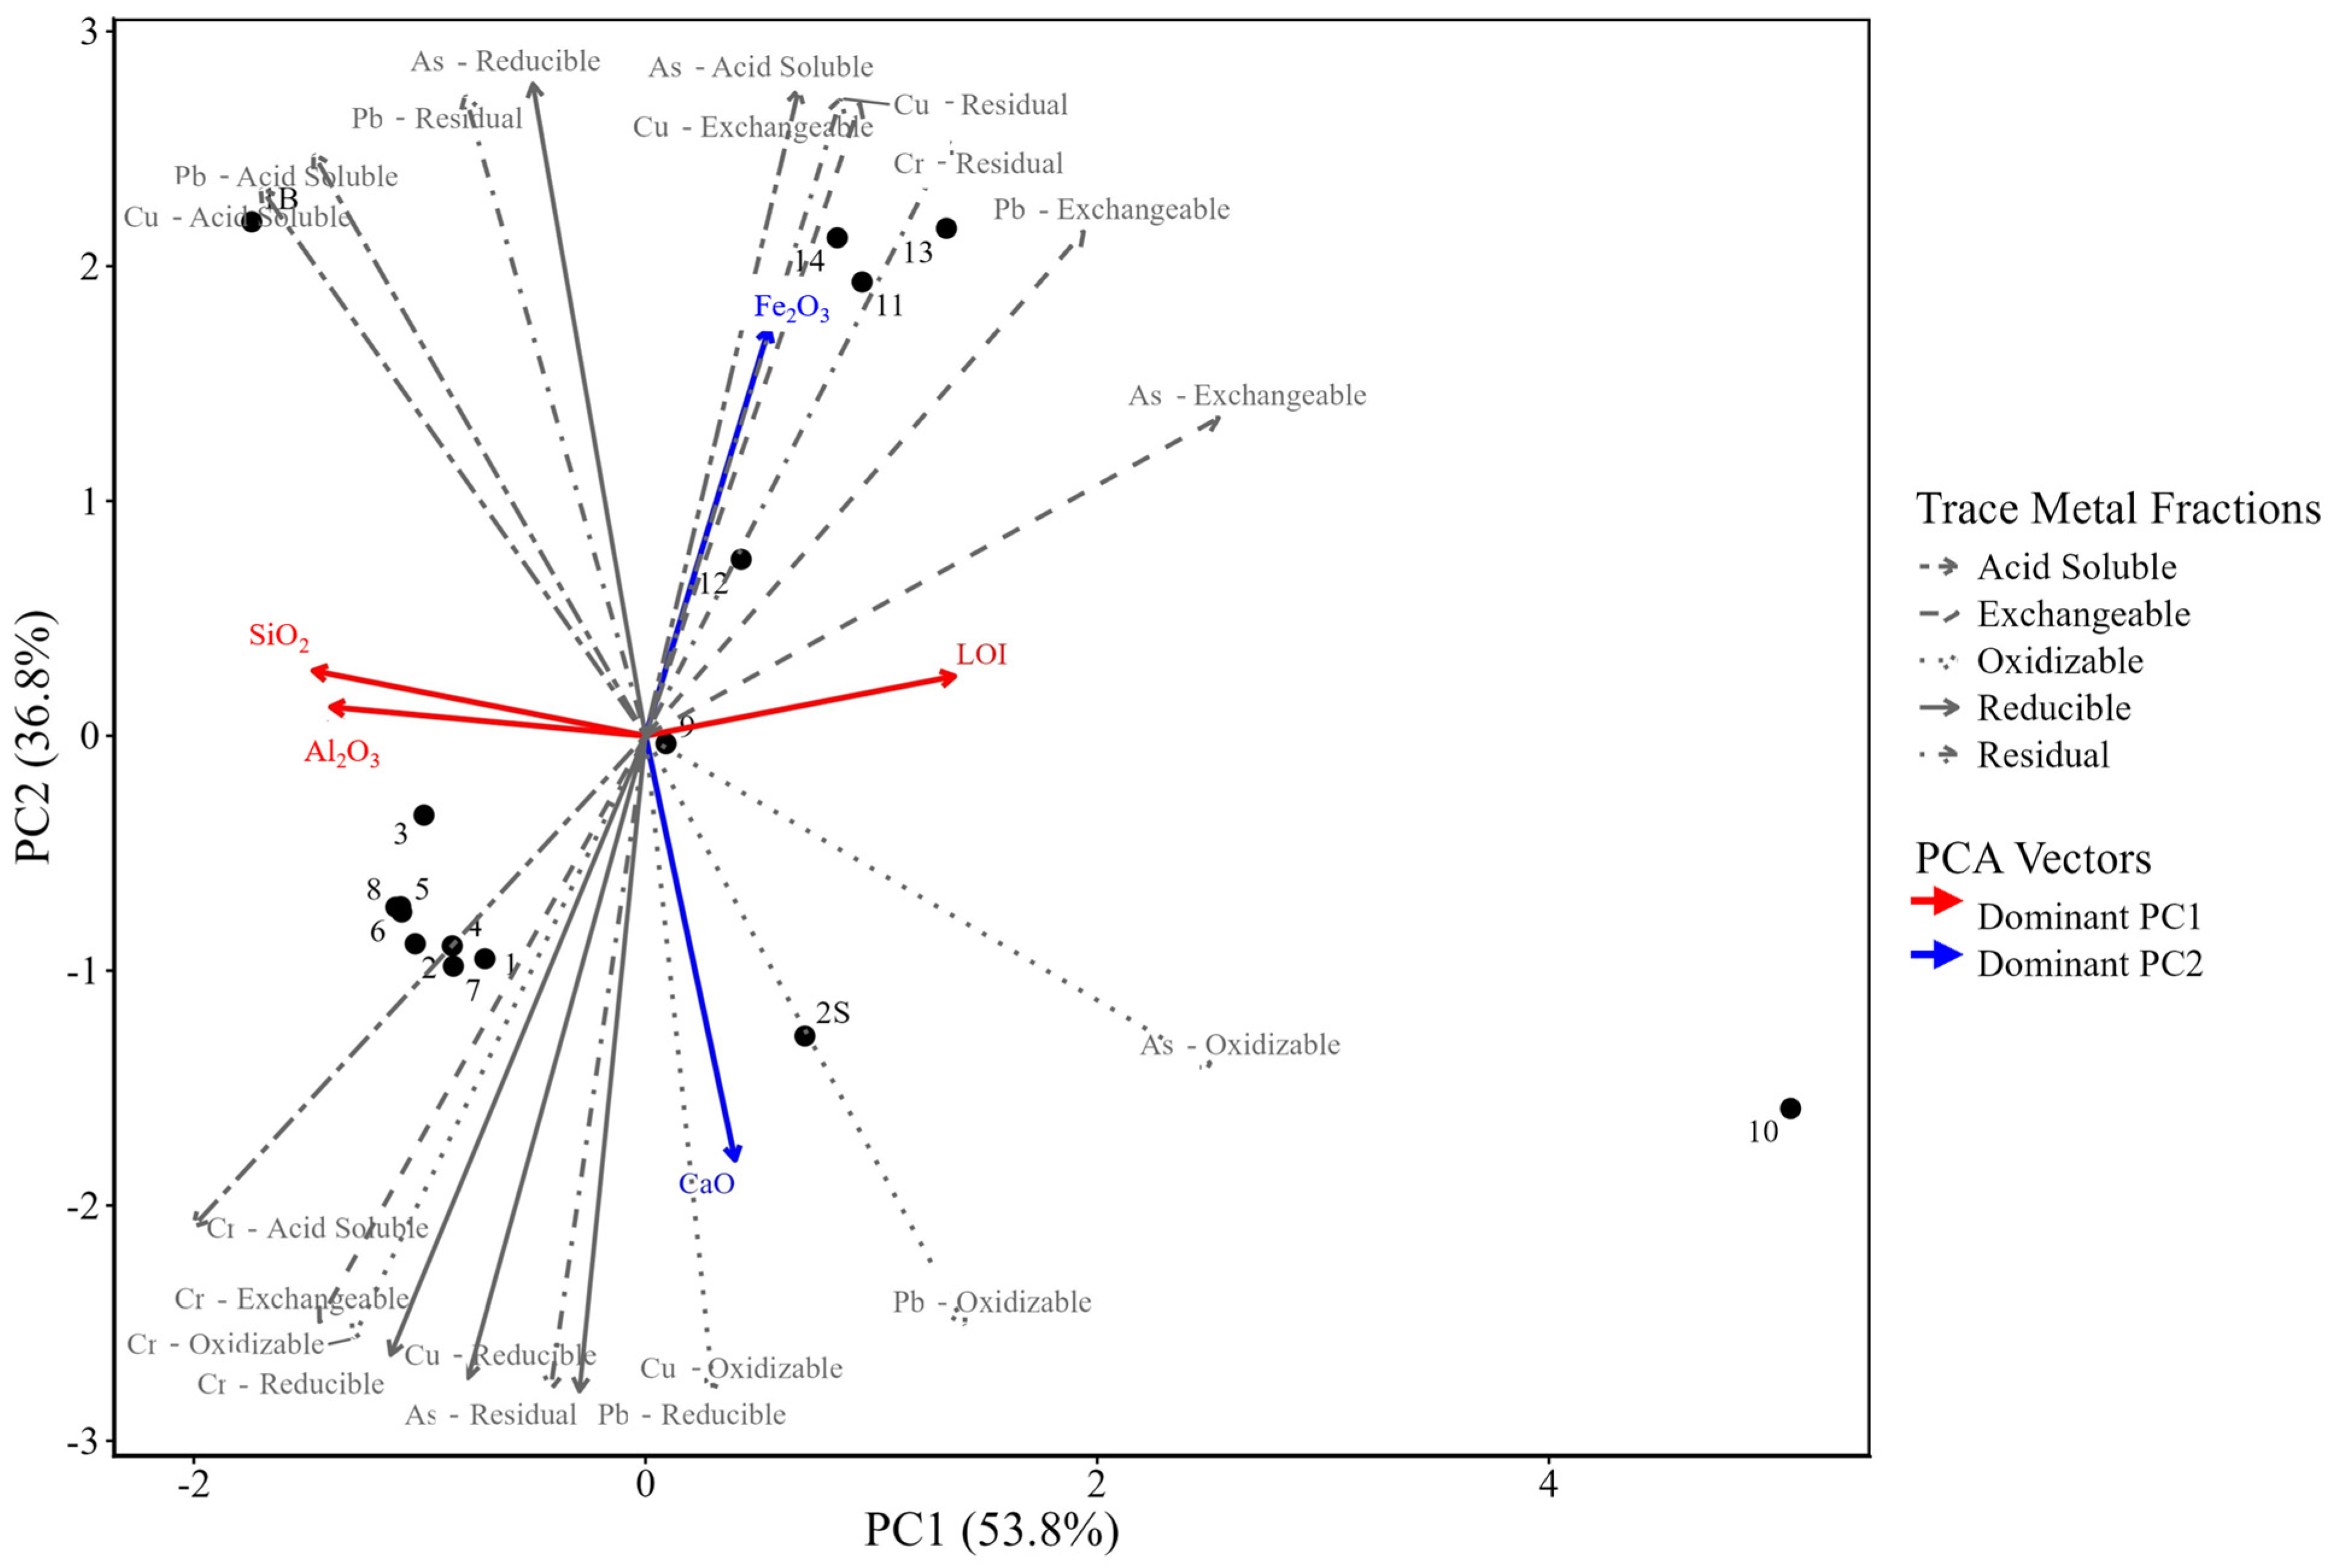
Building on PCA results and further examining the relationship between element fractions and bulk properties, partitioning results for As, Cr, Pb, and Cu were projected onto PCA as supplementary variables. The results for these projections are shown in Figure 3, with trace element partitions as gray vectors, whereas PCA loading vectors are shown in red or blue to indicate their correlations to PC1 or PC2, respectively (see Table 2). Key factors for interpreting the relationship between these supplementary variables (element fractions) and bulk properties are r, r2 (measures the proportion of variance in PCA scores attributed to the fraction), and permutation-based p-values (Pr > r, p < 0.05), at a 95% confidence interval (Table S10) [57]. Permutation-based significance testing from the “envfit” analysis in R identified fractions significantly associated with PC1 and PC2 [26]. Of all 16 element fractions evaluated, 9 showed significant correlations (p < 0.05), and 7 showed strong correlations (r2 > 0.7). These include all Cr fractions except the acid-soluble fraction, the reducible and residual fractions of Cu, and the oxidizable fraction of Pb. All were significantly correlated with PC2, which is strongly associated with CaO/Fe2O3 (Table 2).
These 7 significant fractions are examined in relation to PC1 and PC2, alongside the orientation and magnitude of their vectors, to give insight into specific element fractions in relation to bulk CFA properties. Firstly, the Cr exchangeable fraction showed a strong negative correlation with PC 2 (dimension 2 = −0.88, r2 = 0.76, and a permutation-based p-value of 0.001), refer to Table S10. In the PCA results, PC2 was primarily characterized by a negative correlation to CaO (loading of −0.71) and a positive correlation to Fe2O3 with a loading of 0.68, suggesting that Cr in the exchangeable fraction increases in CFAs with higher CaO content and lower Fe2O3. As for the reducible fraction, both Cr and Cu showed a strong negative correlation with PC2 (i.e., dimension 2 = −0.94 and −0.98), indicating that there is an increase in Cr and Cu in the reducible fractions for CFAs with higher CaO content and lower Fe2O3. These trends are also supported by the pair-wise plots and correlations referenced in the previous section. Next, our results also indicate that the oxidizable fractions of Cr and Pb increase with higher CaO and lower Fe2O3 content. Lastly, an increase in Cr and Cu in the residual fraction is associated, for CFAs, with higher Fe2O3 and lower CaO content, indicating that the mobility of Cr and Cu is inhibited in CFAs with a lower CaO content and higher Fe2O3 content.
Overall, the results suggest that CFAs with high CaO and low Fe2O3 content (potential class C CFAs, except sample 10) exhibit higher trace metal mobility, especially Cr in the exchangeable and reducible fractions, Cu in the reducible fraction, and Pb in the oxidizable fraction. Meanwhile, CFAs with lower CaO and higher Fe2O3 content (potential class F CFAs) show a higher residual fraction of Cr and Cu. This suggests that CFAs with a higher CaO content (potential class C CFAs) have a higher metal mobility, which corroborates with a previous study [11]. It can be inferred that CFAs with higher Fe2O3 (class F) tend to have either more stable crystalline Fe oxide minerals associated with these metals or more encapsulation of these metals within the glass phase.

3.7. Qualitative Supplementary Variables: Coal Type, Coal Basin, and Combustion Parameters

To better visualize potential clustering patterns, qualitative features including coal type, coal basin, and combustion parameters, and categorical variables were projected onto the PCA biplot. For each of these qualitative features, 95% confidence ellipses were drawn around the group centroid to visualize the spread, which provides a qualitative overview of how coal and coal combustion parameters relate to element partitioning and CFA bulk properties.
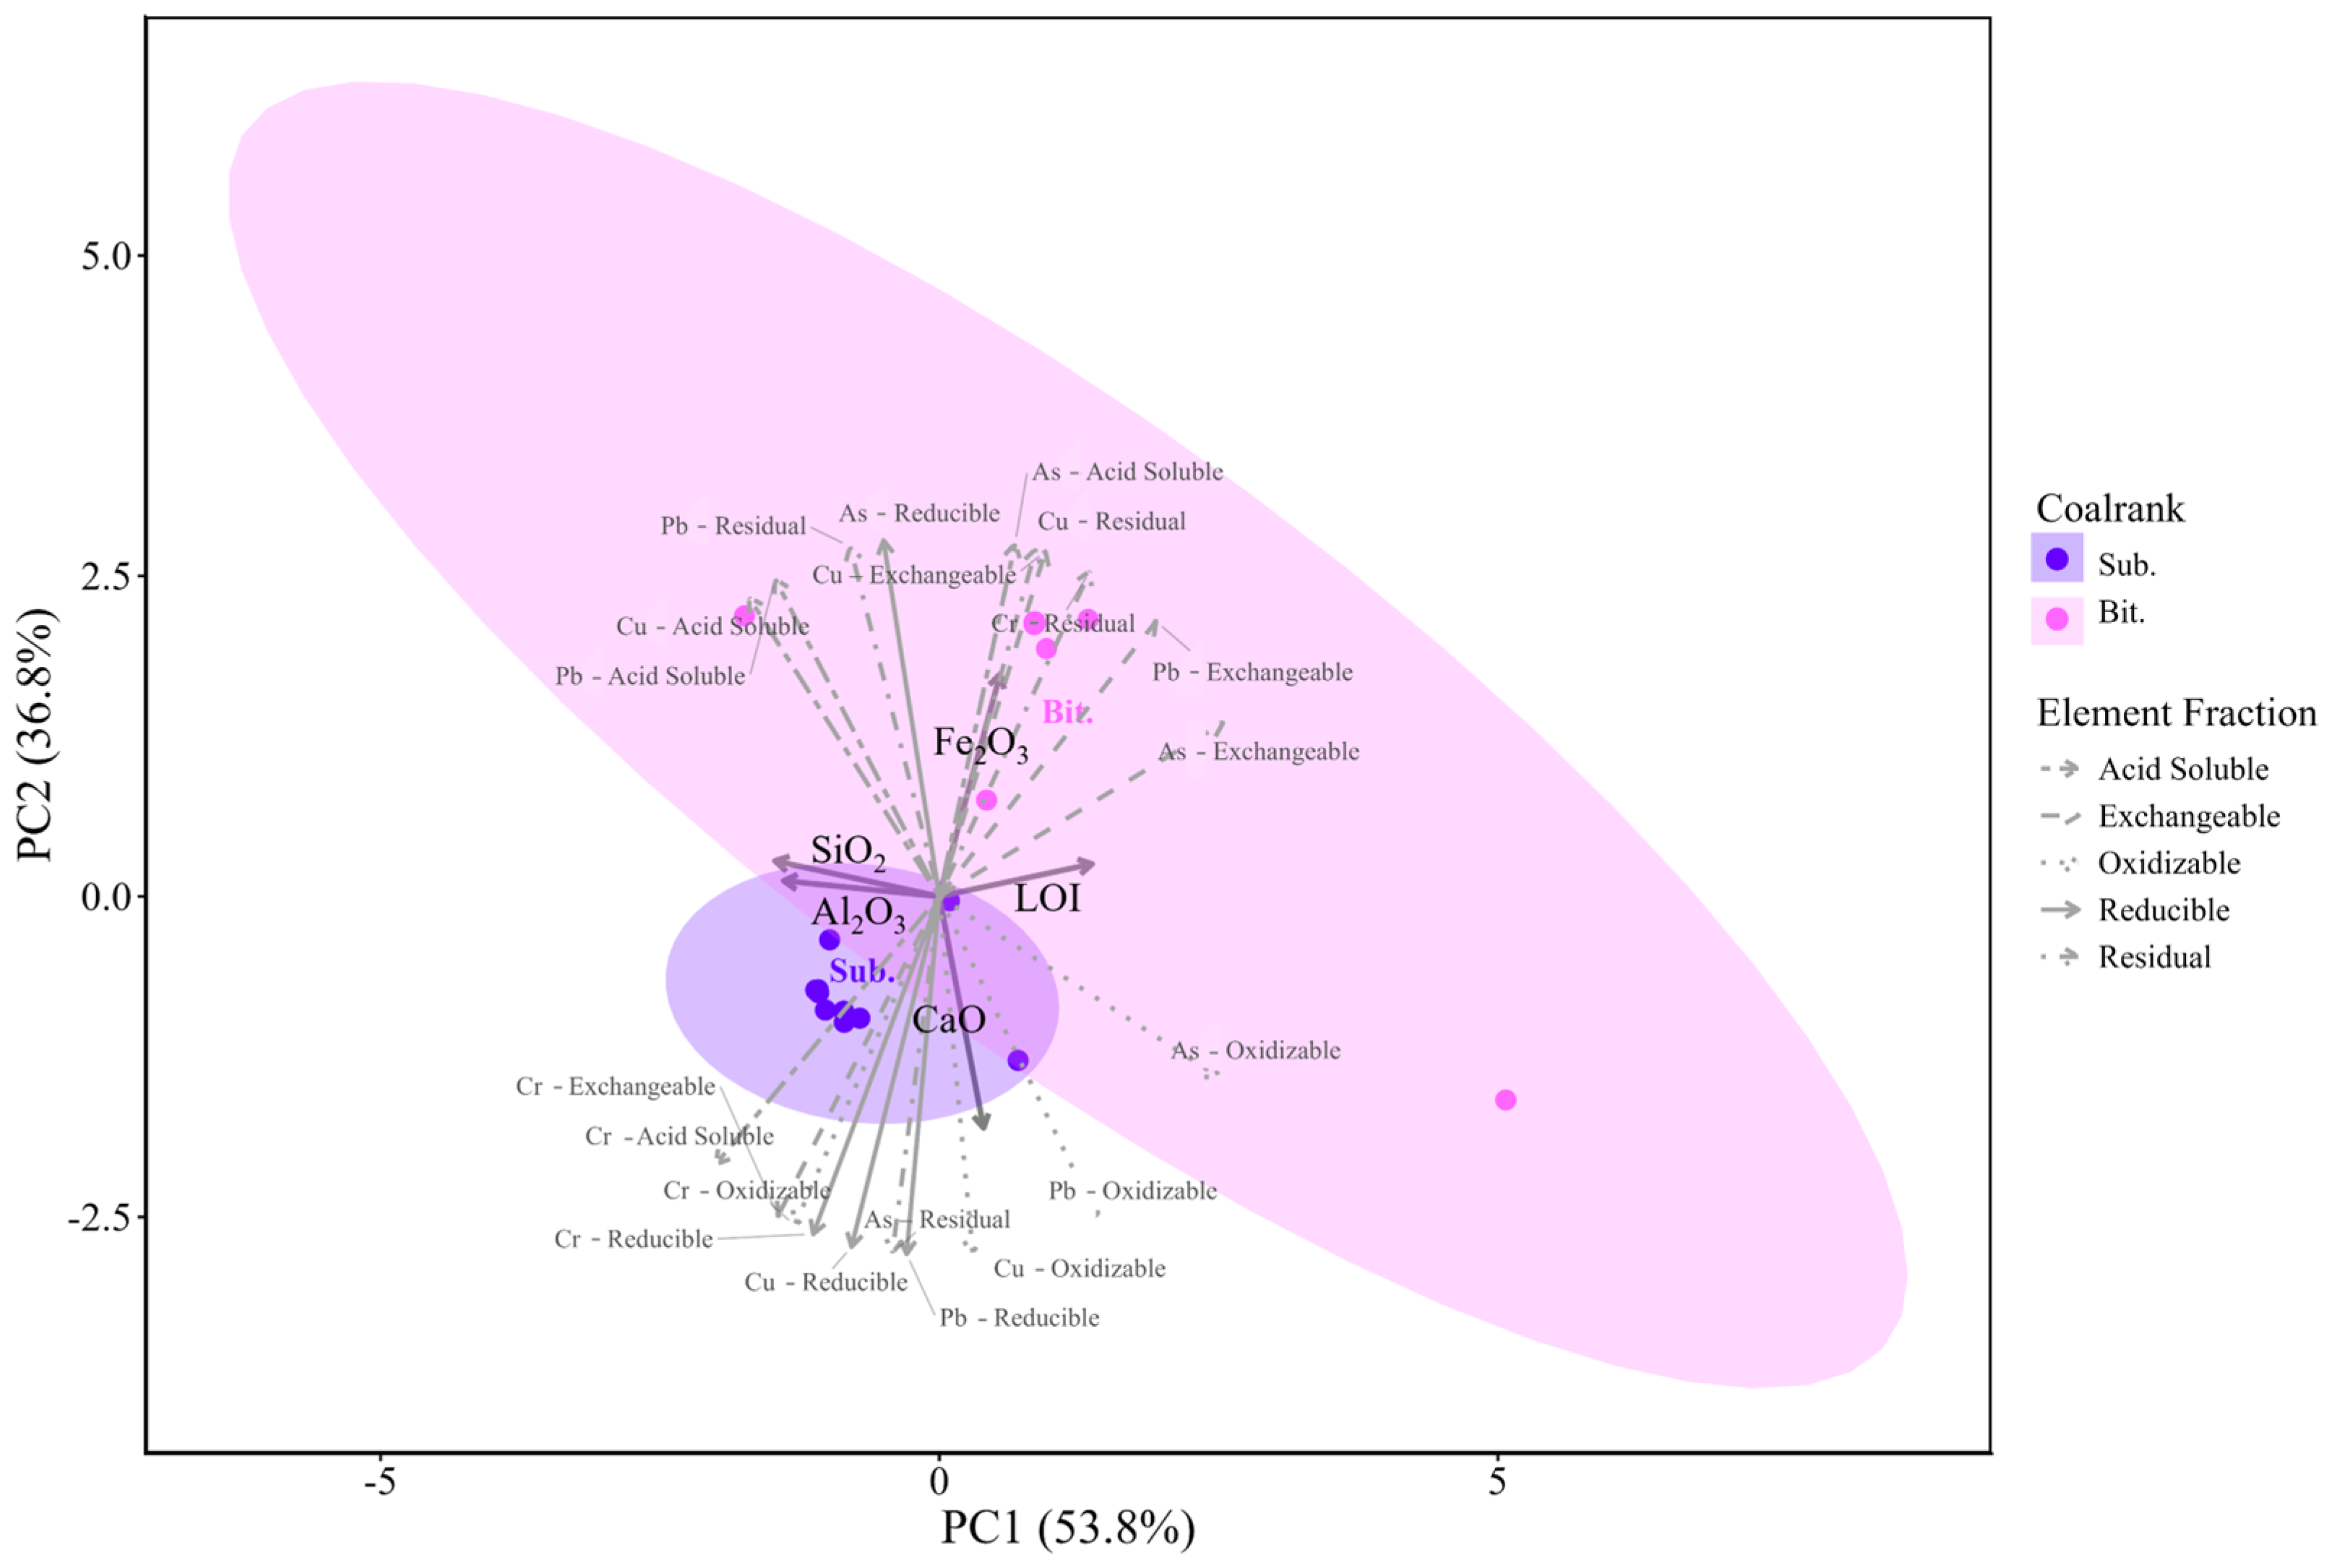
Ellipses for coal type, bituminous (pink) or subbituminous (purple), are shown in Figure 4. CFAs from bituminous coals were Ca-poor/Fe-rich (except sample 10), while CFAs from subbituminous coals were Ca-rich/Fe-poor. The Fe2O3 vector is captured by bituminous CFAs, while the CaO vector is clustered with the subbituminous CFAs. The bituminous CFAs showed a wide diagonal ellipse, indicating more variability for subbituminous CFAs compared to bituminous. Moreover, exchangeable and acid-soluble fractions for As, Cu, and Pb as well as residual fractions for all metals (except As) are associated with bituminous CFAs, suggesting that residual fractions tend to be associated with bituminous CFAs. Subbituminous CFAs show no associations with residual fractions other than As-residual. Additionally, all Cr fractions, except for the residual, were associated with the subbituminous CFAs; interestingly, subbituminous CFAs were primarily associated with the more labile fractions: exchangeable, acid-soluble, reducible, oxidizable. Except for As-residual, this may suggest an enhanced mobility of Cu, Cr, and Pb in subbituminous CFAs examined in this study, which are characterized by higher CaO content.
Ellipses based on coal basins: PRB (orange red), ILB (pink), and N. APP are shown in Figure S5. However, an ellipse was not drawn for N.APP CFAs since 3 or more samples are required; instead, these are shown as gray dots with a green circle. Results for grouping by coal basin were similar to results based on coal type, except grouping was not as distinct. In general, CFAs from ILB grouped where CFAs from bituminous coal were previously clustered (Figure 4), PRB grouped where subbituminous coal was clustered, and N.APP was within the bituminous CFAs. This agrees with coal and coal combustion parameters in Table S1; CFAs from the PRB are from subbituminous coal; likewise, CFAs from the ILB and N.APP are from bituminous coal.
NOx controls, such as SCR or “no SCR,” showed no significant clustering or trends; refer to Figure S6. Lastly, furnace types tangential (Tan) in pink or opposed (Opp) in green are shown in Figure S7. CFAs with an opposed furnace are shown in a diagonal green cluster, while CFAs with a tangential furnace are in a larger pink diagonal cluster encompassing Opp. CFAs. There are no associations regarding NOx controls or furnace types for bulk CFA properties and trace element partitioning.

3.8. Partial Least Squares Discriminant Analysis (PLS-DA)

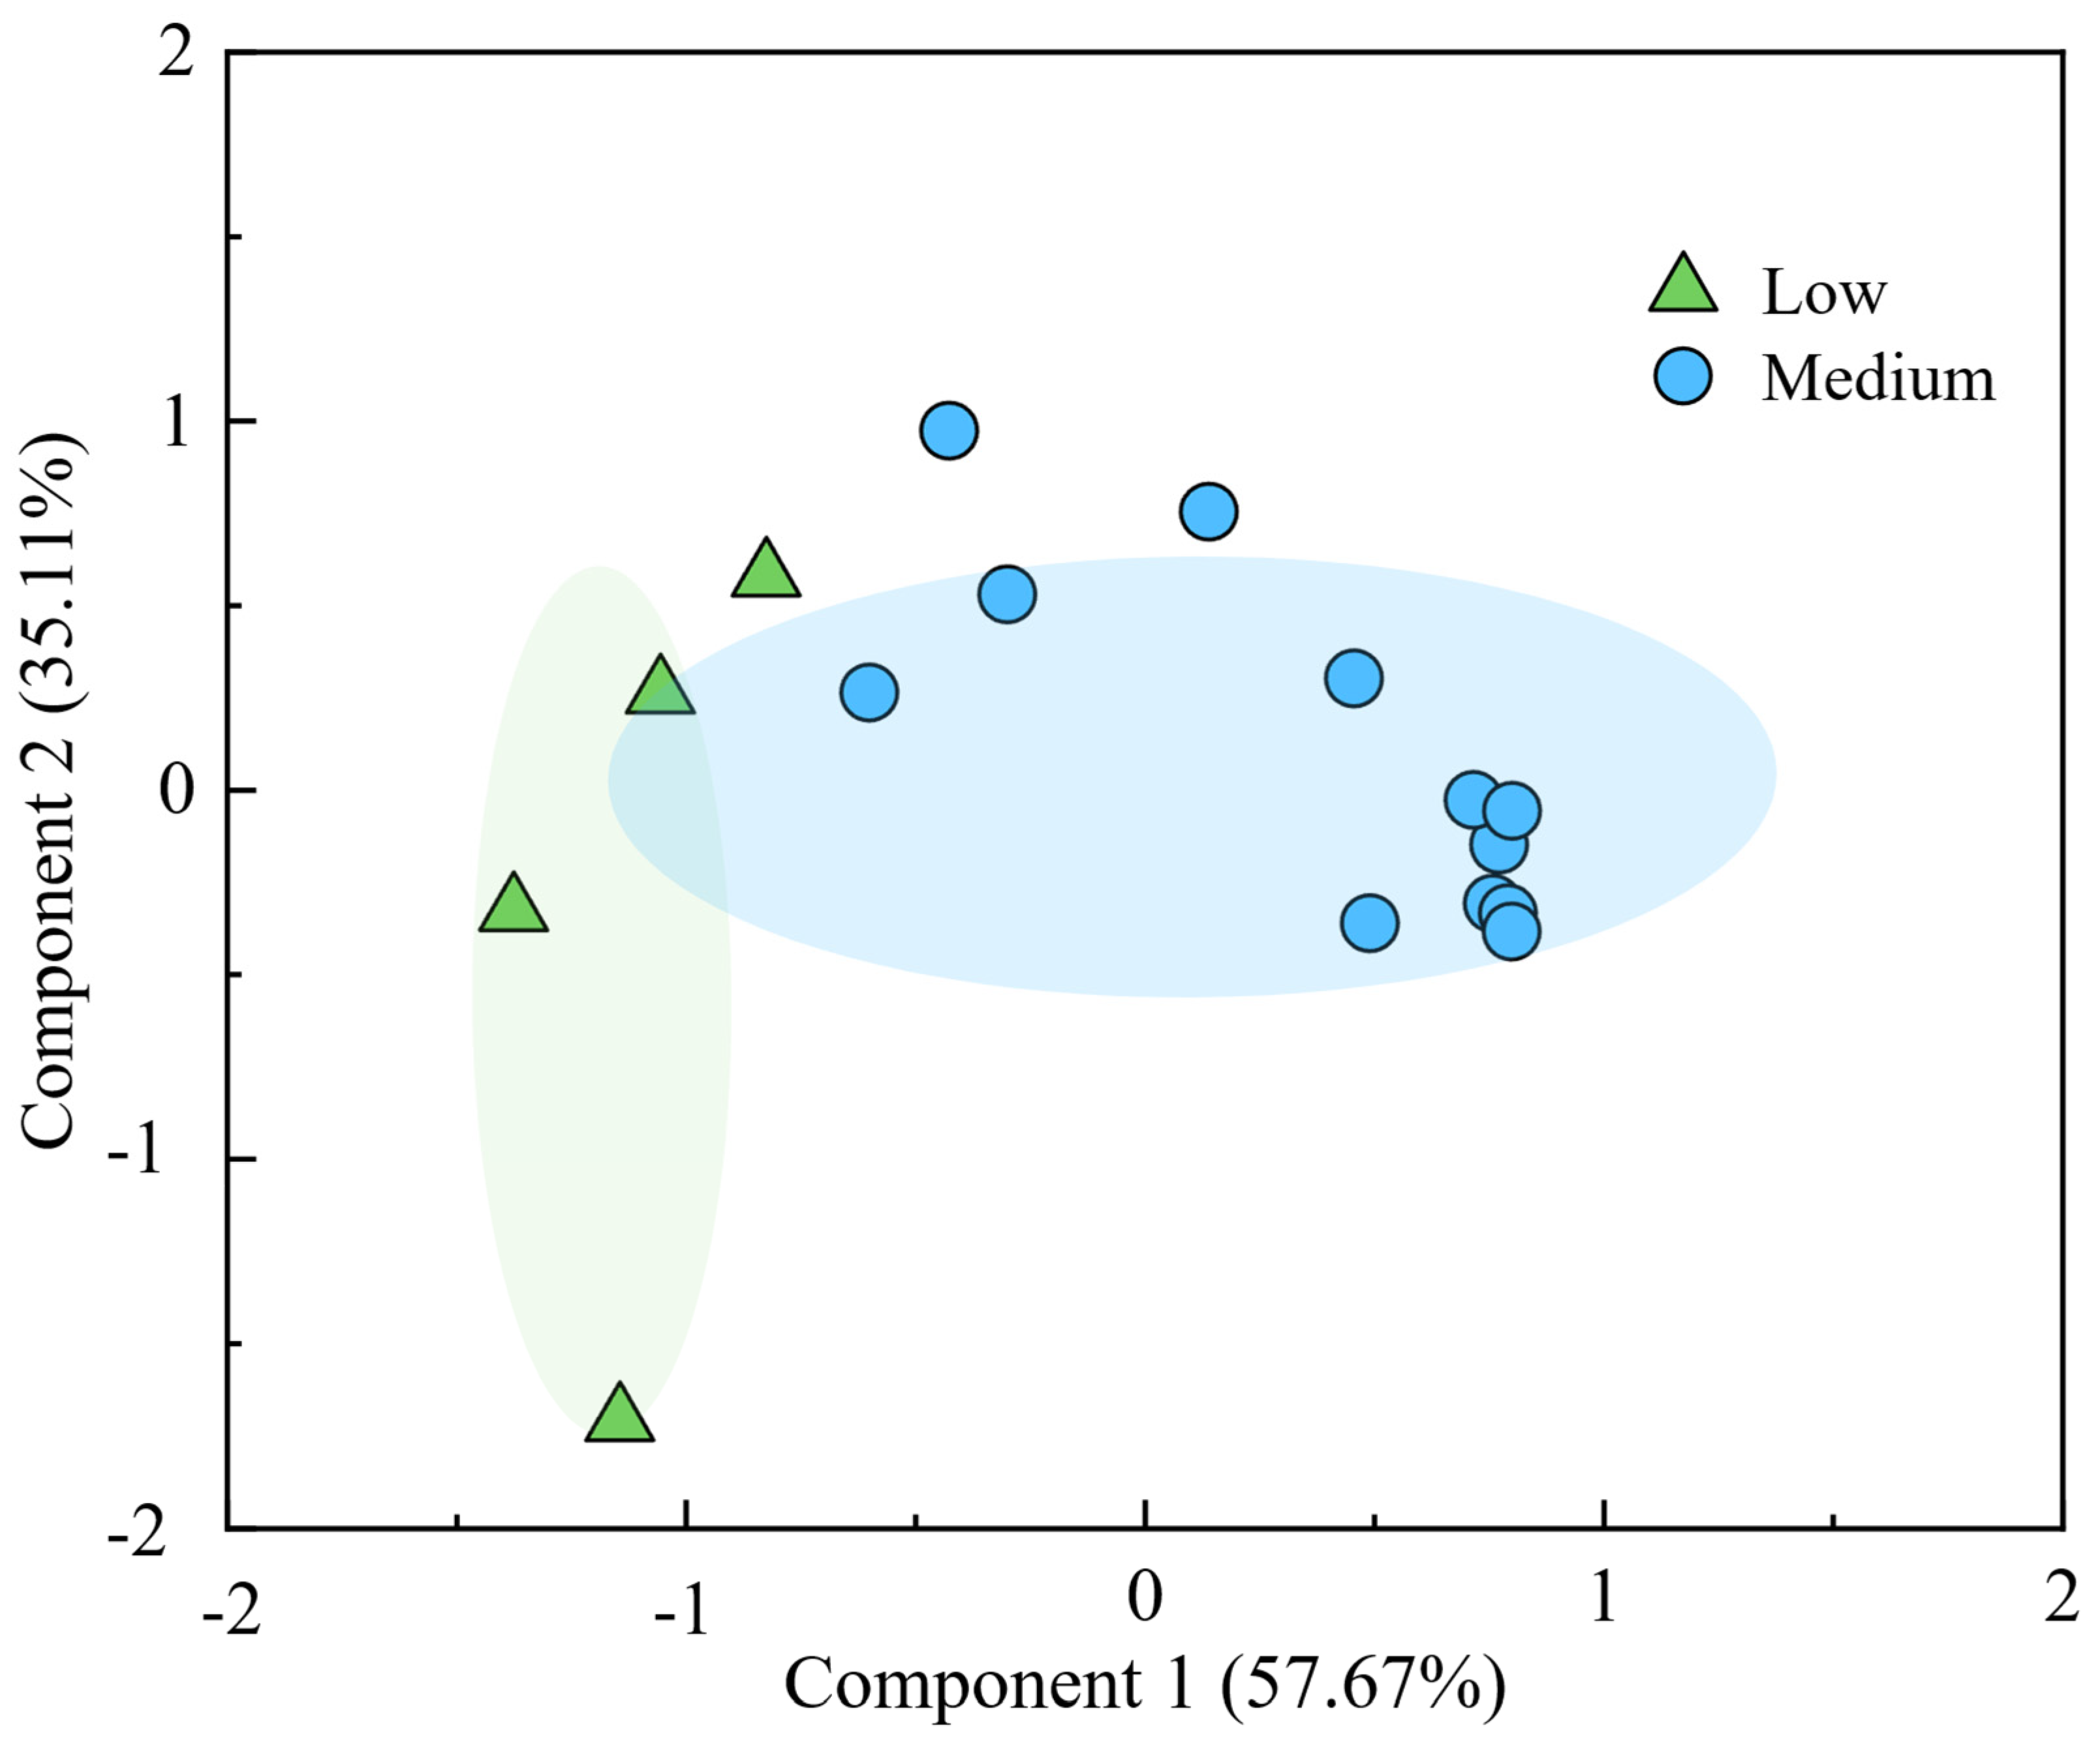
A supplementary variable projection of sequential extraction results onto PCA revealed that samples from bituminous coal are associated with a higher Fe2O3 content, whereas samples from subbituminous CFA are associated with a higher CaO content (Figure 4). Notably, the more mobile fractions (exchangeable, acid-soluble, reducible, and oxidizable) for trace metals were associated with subbituminous samples characterized by higher CaO content and lower Fe2O3 content. Based on this finding, further exploring the role of oxide content (Fe2O3, CaO, Al2O3, SiO2) and volatile content (LOI) on the mobility of trace metals was necessary. PLS-DA was performed on pre-defined classes based on risk assessment criteria: low, medium, and high risk, for As, Cr, and Cu with oxide and LOI information. Pb was excluded from PLS-DA due to its sole classification as low-risk. Figures S8 and S9 show that As and Cu had no significant grouping based on mobility classification. However, the results for Cr in Figure 5 show samples clustered based on mobility risk. The variable importance in projection (VIP) scores for Cr in PLS-DA are presented in Table 3, with scores greater than 1 considered significant. Fe2O3 and CaO exhibit VIP scores >1 for both components 1 and 2, suggesting that these features may strongly influence Cr mobility.

4. Conclusions

Results from sequential extraction revealed that trace metals for these 16 CFAs, including Cr, Cu, Pb, and As were predominantly found in the residual and reducible fractions. Pb exhibited the lowest mobility among all four metals, with 55%–90% remaining in the residual fraction that is typically associated with stable phases such as aluminosilicates and iron oxides. The risk assessment code, based on elemental mobility in the exchangeable and acid-soluble fractions, indicated that Cr ranged from low to medium risk. Fe-rich/Ca-poor CFAs exhibited low risk, whereas Fe-poor/Ca-rich CFAs were classified as medium risk. On the other hand, an opposite trend was observed for Cu, Pb, and As, where iron-rich/calcium-poor CFAs had higher risks. The risk assessment revealed that Pb was the least mobile among the studied metals with no to low risk, and Cu was the most mobile one with a medium risk.
Linear analysis through pair-wise correlations and further analysis with PCA highlight the influence of CaO and Fe2O3 on trace element mobility. The CaO and Fe2O3 contents were found to significantly impact metal mobility, suggesting that Ca-rich/Fe-poor CFAs exhibit higher mobility specifically for Cr in the exchangeable and reducible fractions, and Pb in the oxidizable fraction. In contrast, Fe-rich/Ca-poor CFAs contained more Cr and Cu in the stable residual fraction, suggesting that Fe-rich CFAs may contain more stable crystalline iron oxides or glass encapsulation for these trace metals.
The projection of qualitative variables, including coal type, coal basin, and combustion conditions, onto PCA results and element partitioning showed no significant associations with furnace type and NOx controls. However, coal type (subbituminous vs. bituminous coal) and coal basin (PRB, ILB, or N. APP) were overlaid in similar locations. This indicated that CFAs from the PRB are subbituminous-rank, while CFAs from the N.APP and ILB are from bituminous coal, in agreement with Table S1. Additionally, subbituminous and bituminous CFAs were shown to be associated with a greater CaO and Fe2O3 content, respectively. All Cr fractions, except for the residual, were associated with the subbituminous CFAs. Interestingly, subbituminous CFAs were primarily associated with more labile fractions: exchangeable, acid-soluble, reducible, oxidizable, with the As-residual as the only exception. This implies that Cu, Cr, and Pb may be more mobile in subbituminous CFAs examined in this study, which are characterized by higher CaO content.

Supplementary Materials

The following supporting information can be downloaded at: https://www.mdpi.com/article/10.3390/min16080800/s1. Figure S1. Relationship between total Fe2O3 and Cr in the reducible fraction. The CaO content is shown as a color gradient with black indicating higher CaO content. The Pearson correlation coefficient and R2 are also shown; Figure S2. Relationship between CaO and Pb in the oxidizable fraction. Fe2O3 content is shown as a color gradient with orange indicating higher Fe2O3 content. The Pearson correlation coefficient and R2 are also shown; Figure S3. Scree plot of principal components (PCs), a blue dashed line at a variance of 1 to indicate significant PCs greater than 1; Figure S4: Classic PCA biplot for CFA bulk properties illustrating both scores (axes on the top and right) and loadings (axes on the left and bottom); Figure S5: PCA of coal fly ash composition properties: CaO, Fe2O3, Al2O3, SiO2, and LOI (as black vectors) with sequential extraction fractions projected as vectors onto the PCA (gray vectors), as supplemental variables. CFAs are grouped as either Powder River Basin (PRB) in red, Illinois Basin (ILB) in pink, and Northern Appalachia (N. APP) in green and dark gray dots. An ellipse is not drawn for N.APP since more than 3 samples are required, there are only 2 N.APP CFAs; Figure S6. PCA of coal fly ash composition properties: CaO, Fe2O3, Al2O3, SiO2, and LOI (light gray vectors) with sequential extraction fractions projected as vectors onto the PCA (dark gray), as supplemental variables. CFAs are grouped as either SCR (selective catalytic reduction) in red or “no SCR” in blue; Figure S7: PCA of coal fly ash composition properties: CaO, Fe2O3, Al2O3, SiO2, and LOI (as dark gray vectors) with sequential extraction fractions projected as vectors onto the PCA (light gray), as supplemental variables. CFAs are grouped as either Opp. (opposed) in green or tangential (Tan) in pink; Figure S8. Partial least squares-discriminant analysis (PLS-DA) of As mobility based on exchangeable and acid-soluble fractions from sequential extraction, grouped by low (1%–10% mobility) and medium risk (10%–30% mobility). No significant grouping was observed based on mobility risk; Figure S9. PLS-DA score plot of Cu mobility based on exchangeable and acid-soluble fractions from sequential extraction, grouped by low (1%–10% mobility) and medium risk (10%–30% mobility), with 95% confidence ellipses, indicating no significant grouping based on low and medium risk Cu leaching; Table S1. Fly ash coal sources and combustion conditions; Table S2. Sequential extraction results for arsenic (As) with their associated standard deviation; Table S3. Sequential extraction results for chromium (Cr) with their associated standard deviation; Table S4. Sequential extraction results for copper (Cu) with their associated standard deviation; Table S5. Sequential extraction results for lead (Pb) with their associated standard deviation; Table S6. Results for risk assessment code, based on the exchangeable and acid soluble fractions, where <1% is safe, 1 ≤ x ≤ 10% is low risk, 10 < x ≤ 30% is medium risk, 30 < x ≤ 50 is high risk, and x > 50% is very high risk; Table S7. PCA Summary with proportion of variance, cumulative variance, and standard deviation for each principal component (PC); Table S8. Table of eigenvalues for each PC; Table S9. Loadings for every variable in each PC; Table S10. R2 values and r values for dimensions of metal projections onto PCA, dimension 1 corresponds to PC1 and dimension 2 with PC2.Pr (>r) represents permutation-based p-values, at a 95% confidence interval a value < 0.05 is considered significant (these are bold). Text S1. Principal component analysis (PCA) and supplemental variable projection; Text S2. Partial Least Squares Discriminant Analysis (PLS-DA).

Author Contributions

Conceptualization, E.G. and Y.T.; Methodology, E.G.; Formal analysis, E.G.; Investigation, E.G., A.H., E.T., M.L., Y.W. and H.X.; Resources, Y.T.; Data curation, E.G.; Writing—original draft, E.G. and Y.T.; Writing—review & editing, E.G., A.H., E.T., M.L., Y.W., H.X. and Y.T.; Visualization, E.G.; Supervision, Y.T.; Project administration, Y.T.; Funding acquisition, Y.T. All authors have read and agreed to the published version of the manuscript.

Funding

This work was supported by NSF Grant #237660.

Data Availability Statement

Data is contained within the article or Supplementary Materials.

Acknowledgments

This work was performed in part at the Georgia Tech Institute for Electronics and Nanotechnology, a member of the National Nanotechnology Coordinated Infrastructure (NNCI), which is supported by the National Science Foundation (ECCS-2025462).

Conflicts of Interest

The authors declare no conflict of interest.

References

  1. DEP. Coal Mining in Pennsylvania; Commonwealth of Pennsylvania: Harrisburg, PA, USA, 2025.
  2. U.S. Energy Information Administration (EIA). Electricity Explained: Electricity Generation, Capacity, and Sales in the United States. 2024. Available online: https://www.eia.gov/energyexplained/electricity (accessed on 1 February 2026).
  3. ACAA. 2023 Coal Combustion Product (CCP) Production & Use Survey Report; American Coal Ash Association: Sandy, Utah, 2023. [Google Scholar]
  4. ACAA. 2022 Coal Combustion Product (CCP) Production & Use Survey Report; American Coal Ash Association: Sandy, Utah, 2022. [Google Scholar]
  5. ASTM C618-25a; Standard Specification for Coal Ash and Raw or Calcined Natural Pozzolan for Use in Concrete. ASTM: West Conshohocken, PA, USA, 2025. [CrossRef] [Scilit]
  6. Winburn, R.; Grier, D.; McCarthy, G.; Peterson, R. Rietveld Quantitative X-Ray Diffraction Analysis of NIST Fly Ash Standard Reference Materials. Powder Diffr. 2000, 15, 163–172. [Google Scholar] [CrossRef] [Scilit]
  7. Deonarine, A.; Kolker, A.; Doughten, M. Trace Elements in Coal Ash; U.S. Geological Survey: Reston, VA, USA, 2015.
  8. Hower, J.; Henke, K.; Dai, S.; Ward, C.; French, D.; Liu, S.; Graham, U. Generation and Nature of Coal Fly Ash and Bottom Ash; Woodhead Publishing: Duxford, UK, 2017; pp. 21–65. [Google Scholar]
  9. Reddy, M.S.; Basha, S.; Joshi, H.V.; Jha, B. Evaluation of the emission characteristics of trace metals from coal and fuel oil fired power plants and their fate during combustion. J. Hazard. Mater. 2005, 123, 242–249. [Google Scholar] [CrossRef] [Scilit] [PubMed]
  10. da Silva, E.B.; Li, S.; de Oliveira, L.M.; Gress, J.; Dong, X.; Wilkie, A.C.; Townsend, T.; Ma, L.Q. Metal leachability from coal combustion residuals under different pHs and liquid/solid ratios. J. Hazard. Mater. 2018, 341, 66–74. [Google Scholar] [CrossRef] [Scilit] [PubMed]
  11. Liu, P.; Wang, Q.; Jung, H.; Tang, Y. Speciation, Distribution, and Mobility of Hazardous Trace Elements in Coal Fly Ash: Insights from Cr, Ni, and Cu. Energy Fuels 2020, 34, 14333–14343. [Google Scholar] [CrossRef] [Scilit]
  12. Luo, Y.; Giammar, D.E.; Huhmann, B.L.; Catalano, J.G. Speciation of Selenium, Arsenic, and Zinc in Class C Fly Ash. Energy Fuels 2011, 25, 2980–2987. [Google Scholar] [CrossRef] [Scilit]
  13. Deonarine, A.; Kolker, A.; Foster, A.L.; Doughten, M.W.; Holland, J.T.; Bailoo, J.D. Arsenic Speciation in Bituminous Coal Fly Ash and Transformations in Response to Redox Conditions. Environ. Sci. Technol. 2016, 50, 6099–6106. [Google Scholar] [CrossRef] [Scilit] [PubMed]
  14. Garcia, E.; Liu, P.; Sanchez, J.; Lee, S.; Wang, Q.; Wen, Y.; Shivaprakash, S.; Burns, S.; Tang, Y. A survey study on arsenic speciation in coal fly ash and insights into the role of coal combustion conditions. Appl. Geochem. 2024, 170, 106095. [Google Scholar] [CrossRef] [Scilit]
  15. Bibi, D.; Tőzsér, D.; Sipos, B.; Tóthmérész, B.; Simon, E. Heavy Metal Pollution of Soil in Vienna, Austria. Water Air Soil Pollut. 2023, 234, 232. [Google Scholar] [CrossRef] [Scilit]
  16. Oloruntoba, A.; Omoniyi, A.O.; Shittu, Z.A.; Ajala, R.O.; Kolawole, S.A. Heavy Metal Contamination in Soils, Water, and Food in Nigeria from 2000–2019: A Systematic Review on Methods, Pollution Level and Policy Implications. Water Air Soil Pollut. 2024, 235, 586. [Google Scholar] [CrossRef] [Scilit]
  17. Wu, Y.; Li, X.; Yu, L.; Wang, T.; Wang, J.; Liu, T. Review of soil heavy metal pollution in China: Spatial distribution, primary sources, and remediation alternatives. Resour. Conserv. Recycl. 2022, 181, 106261. [Google Scholar] [CrossRef] [Scilit]
  18. Tessier, A.; Campbell, P.C.G.; Bisson, M. Sequential Extraction Procedure for the Speciation of Particulate Trace Metals. Anal. Chem. 1979, 51, 844–851. [Google Scholar] [CrossRef] [Scilit]
  19. Wadge, A.; Hutton, M. The leachability and chemical speciation of selected trace elements in fly ash from coal combustion and refuse incineration. Environ. Pollut. 1987, 48, 85–99. [Google Scholar] [CrossRef] [Scilit] [PubMed]
  20. Tian, Q.; Guo, B.; Nakama, S.; Sasaki, K. Distributions and Leaching Behaviors of Toxic Elements in Fly Ash. ACS Omega 2018, 3, 13055–13064. [Google Scholar] [CrossRef] [Scilit] [PubMed]
  21. Survey of Coal-Fired Power Plants and Analysis of Selected Fly Ashes: A Task Toward Elucidating Arsenic and Selenium Speciation, Electric Power Research Institute. 2022. Available online: https://www.epri.com/research/products/000000003002025163 (accessed on 1 February 2026).
  22. Liu, P.; Huang, R.; Tang, Y. Comprehensive Understandings of Rare Earth Element (REE) Speciation in Coal Fly Ashes and Implication for REE Extractability. Environ. Sci. Technol. 2019, 53, 5369–5377. [Google Scholar] [CrossRef] [Scilit] [PubMed]
  23. R Core Team. R: A Language and Environment for Statistical Computing; R Foundation for Statistical Computing: Vienna, Austria, 2024; Available online: https://www.R-project.org/ (accessed on 1 November 2025).
  24. RStudio: Integrated Development Environment for R; Posit Software; PBC: Boston, MA, USA, 2024.
  25. Wickham, H. ggplot2: Elegant Graphics for Data Analysis; Springer: New York, NY, USA, 2016. [Google Scholar]
  26. ggrepel: Automatically Position Non-Overlapping Text Labels with ‘ggplot2’. 2024. Available online: https://r-mirror.zim.uni-due.de/web/packages/ggrepel/ggrepel.pdf (accessed on 1 November 2025).
  27. Moore, D.S.; Notz, W.I.; Flinger, M.A. The Basic Practice of Statistics; Freeman and Company: Dallas, TX, USA, 2013. [Google Scholar]
  28. van den Boogaart, K.G. Using the R Package “Compositions”, 2nd ed.; GNU: Boston, MA, USA, 2005. [Google Scholar]
  29. Vegan: Community Ecology Package. R-Project: 2025. Available online: https://CRAN.R-project.org/package=vegan (accessed on 1 February 2026).
  30. Aluja, T.; Morineau, A.; Sanchez, G. Principal Component Analysis for Data Science; Multivariate Analysis: Paris, France, 2018. [Google Scholar]
  31. Understanding Scores and Loadings, R-Project: 2024. Available online: https://cran.r-project.org/web/packages/LearnPCA/vignettes/Vig_04_Scores_Loadings.pdf (accessed on 1 November 2025).
  32. Husson, F.; Le, S.; Pages, J. Principal Component Analysis. In Exploratory Multivariate Analysis by Example Using R, 2nd ed.; Chapman and Hall: London, UK, 2017; p. 27. [Google Scholar]
  33. Rohart, F.; Gautier, B.; Singh, A.; Lê Cao, K.-A. mixOmics: An R package for ‘omics feature selection and multiple data integration. PLoS Comput. Biol. 2017, 13, e1005752. [Google Scholar] [CrossRef] [Scilit] [PubMed]
  34. Catalano, J.G.; Huhmann, B.L.; Luo, Y.; Mitnick, E.H.; Slavney, A.; Giammar, D.E. Metal Release and Speciation Changes during Wet Aging of Coal Fly Ashes. Environ. Sci. Technol. 2012, 46, 11804–11812. [Google Scholar] [CrossRef] [Scilit] [PubMed]
  35. Fu, B.; Hower, J.C.; Dai, S.; Mardon, S.M.; Liu, G. Determination of Chemical Speciation of Arsenic and Selenium in High-As Coal Combustion Ash by X-ray Photoelectron Spectroscopy: Examples from a Kentucky Stoker Ash. ACS Omega 2018, 3, 17637–17645. [Google Scholar] [CrossRef] [Scilit] [PubMed]
  36. Hower, J.C.; Groppo, J.G.; Hopps, S.D.; Morgan, T.D.; Hsu-Kim, H.; Taggart, R.K. Coal Feed-Dependent Variation in Fly Ash Chemistry in a Single Pulverized-Combustion Unit. Minerals 2022, 12, 1071. [Google Scholar] [CrossRef] [Scilit]
  37. Li, Z.; Wang, Q.; Xiao, Z.; Fan, L.; Wang, D.; Li, X.; Du, J.; Cheng, J. Behaviors of Chromium in Coal-Fired Power Plants and Associated Atmospheric Emissions in Guizhou, Southwest China. Atmosphere 2020, 11, 951. [Google Scholar] [CrossRef] [Scilit]
  38. Soco, E.; Kalembkiewicz, J. Investigations of sequential leaching behaviour of Cu and Zn from coal fly ash and their mobility in environmental conditions. J. Hazard. Mater. 2007, 145, 482–487. [Google Scholar] [CrossRef] [Scilit] [PubMed]
  39. Finkelman, R.B.; Palmer, C.A.; Wang, P. Quantification of the modes of occurrence of 42 elements in coal. Int. J. Coal Geol. 2018, 185, 138–160. [Google Scholar] [CrossRef] [Scilit]
  40. Zhou, C.; Liu, G.; Xu, Z.; Sun, H.; Lam, P.K.S. Retention mechanisms of ash compositions on toxic elements (Sb, Se and Pb) during fluidized bed combustion. Fuel 2018, 213, 98–105. [Google Scholar] [CrossRef] [Scilit]
  41. Yudovich, Y.E.; Ketris, M.P. Arsenic in coal: A review. Int. J. Coal Geol. 2005, 61, 141–196. [Google Scholar] [CrossRef] [Scilit]
  42. Smedley, P.L.; Kinniburgh, D.G. A review of the source, behaviour and distribution of arsenic in natural waters. Appl. Geochem. 2002, 17, 517–568. [Google Scholar] [CrossRef] [Scilit]
  43. Kryukova, V.; Kindeeva, V.; Bas’kova, L.; Latyshev, V. Arsenic in Eastern Siberian coals. Chem. Solid Fuels 1985, 1, 129–132. [Google Scholar]
  44. Dzombak, D.A.; Morel, F.M. Surface Complexation Modeling: Hydrous Ferric Oxide; John Wiley & Sons: Hoboken, NJ, USA, 1991. [Google Scholar]
  45. Hurst, H.J.; Novak, F.; Patterson, J.H. Phase Diagram Approach to the Fluxing Effect of Additions of CaCO3 on Australian Coal Ashes. Energy Fuels 1996, 10, 1215–1219. [Google Scholar] [CrossRef] [Scilit]
  46. Li, J.; Du, M.-F.; Zhang, Z.-X.; Guan, R.-Q.; Chen, Y.-S.; Liu, T.-Y. Selection of Fluxing Agent for Coal Ash and Investigation of Fusion Mechanism: A First-Principles Study. Energy Fuels 2009, 23, 704–709. [Google Scholar] [CrossRef] [Scilit]
  47. Diehl, S.F.; Goldhaber, M.B.; Koenig, A.E.; Lowers, H.A.; Ruppert, L.F. Distribution of arsenic, selenium, and other trace elements in high pyrite Appalachian coals: Evidence for multiple episodes of pyrite formation. Int. J. Coal Geol. 2012, 94, 238–249. [Google Scholar] [CrossRef] [Scilit]
  48. Spears, D.A.; Manzanares-Papayanopoulos, L.I.; Booth, C.A. The distribution and origin of trace elements in a UK coal; the importance of pyrite. Fuel 1999, 78, 1671–1677. [Google Scholar] [CrossRef] [Scilit]
  49. Yu, D.; Zhao, L.; Zhang, Z.; Wen, C.; Xu, M.; Yao, H. Iron Transformation and Ash Fusibility during Coal Combustion in Air and O2/CO2 Medium. Energy Fuels 2011, 26, 3150–3155. [Google Scholar] [CrossRef] [Scilit]
  50. Zhang, Y.; Li, Q.; Liu, X.; Xu, B.; Yang, Y.; Jiang, T. A Thermodynamic Analysis on the Roasting of Pyrite. Minerals 2019, 9, 220. [Google Scholar] [CrossRef] [Scilit]
  51. Wang, T.; Wang, J.; Tang, Y.; Shi, H.; Ladwig, K. Leaching Characteristics of Arsenic and Selenium from Coal Fly Ash: Role of Calcium. Energy Fuels 2009, 23, 2959–2966. [Google Scholar] [CrossRef] [Scilit]
  52. Saqib, N.; Bäckström, M. Chemical association and mobility of trace elements in 13 different fuel incineration fly ashes. Fuel 2016, 165, 193–204. [Google Scholar] [CrossRef] [Scilit]
  53. Perin, G.; Craboledda, L.; Lucchese, M.; Cirillo, R.; Dotta, L. Heavy metal speciation in the sediments of Northern Adriatic Sea: A new approach for environmental toxicity determination. Heavy Met. Environ. 1985, 2, 454–456. [Google Scholar]
  54. Huang, S.-J.; Chang, C.-Y.; Mui, D.T.; Chang, F.-C.; Lee, M.-Y.; Wang, C.-F. Sequential extraction for evaluating the leaching behavior of selected elements in municipal solid waste incineration fly ash. J. Hazard. Mater. 2007, 149, 180–188. [Google Scholar] [CrossRef] [Scilit] [PubMed]
  55. Kaiser, F.H. The Application of Computers to Factor Analysis. Educ. Psychol. Meas. 1960, 20, 141–151. [Google Scholar] [CrossRef] [Scilit]
  56. Liu, Y.; Zeng, F.; Sun, B.; Jia, P.; Graham, I.T. Structural Characterizations of Aluminosilicates in Two Types of Fly Ash Samples from Shanxi Province, North China. Minerals 2019, 9, 358. [Google Scholar] [CrossRef] [Scilit]
  57. Zeleny, D. Analysis of Community Ecology Data in R. 2025. Available online: https://www.davidzeleny.net/anadat-r/doku.php/en:start (accessed on 1 November 2025).
Figure 1. Trace metal associations for the exchangeable, acid-soluble, reducible, oxidizable, and residual fractions in CFAs: (A) As, (B) Cr, (C) Cu, and (D) Pb. Total concentrations from total digestion are plotted above the bar graphs as solid black circles.
Minerals 16 00800 g001
Figure 2. Relationship between total Fe2O3 and Cu in the reducible fraction. The CaO content is shown as a color gradient with blue indicating higher CaO content. The Pearson correlation coefficient and R2 are also shown and the line of best fit.
Minerals 16 00800 g002
Figure 3. PCA of coal fly ash composition properties: CaO, Fe2O3, Al2O3, SiO2, and LOI for principal component (PC) 1 and 2. Sequential extraction fractions are projected onto PCA, as supplemental variables.
Minerals 16 00800 g003
Figure 4. PCA of coal fly ash composition properties: CaO, Fe2O3, Al2O3, SiO2, and LOI (vectors are in dark gray) with sequential extraction fractions projected as vectors onto the PCA (light gray), as supplemental variables. CFAs are grouped as either subbituminous (purple) or bituminous coal types (pink).
Minerals 16 00800 g004
Figure 5. PLS-DA score plot of Cr mobility based on exchangeable and acid-soluble fractions from sequential extraction, grouped by low (1%–10% mobility) and medium risk (10%–30% mobility), with 95% confidence ellipses.
Minerals 16 00800 g005
Table 1. CFA properties with sample identification (ID) in the first column.
IDMajor Element (wt%)As (ppm)Pb (ppm)Cu (ppm)Cr (ppm)Surface
Area (cm2/cm3)
Bulk Density (mg/cc)LOIAverage Particle Size (µm)
Fe2O3Al2O3SiO2CaO
15.2720.4938.9519.7237 ± 0.1434.8 ± 0.01164.3 ± 0.0271.4 ± 0.029724.72.61.7513.2
25.2620.0640.9218.6531 ± 0.5432.7 ± 0.01158.9 ± 0.0467.5 ± 0.028917.92.60.9112.7
36.7316.8849.1215.619 ± 0.4624.2 ± 0.01124.9 ± 0.0261.7 ± 0.014271.72.50.8651.4
45.4419.9940.219.1932 ± 0.8233.7 ± 0.01159.9 ± 0.0174.4 ± 0.019735.42.61.0511.5
55.6920.9541.1817.5634 ± 0.3029.8 ± 0.02175.5 ± 0.2771.9 ± 0.039972.82.60.7614.0
65.6621.0740.8217.7336 ± 0.8629.4± 0.02177.8 ± 0.0258.5 ± 0.019780.52.60.7113.5
75.2820.4638.9119.7934 ± 0.3835.5 ± 0.01165.4 ± 0.0568.6 ± 0.0210,0222.60.9510.1
85.6820.941.1717.5234 ± 0.0729.7 ± 0.28175.9 ± 1.5367.5 ± 0.019867.32.60.6613.7
99.8421.8444.4517.0743 ± 0.6538.0 ± 0.01147.8 ± 0.02124.6 ± 0.029233.72.63.4121.2
109.9511.2424.1351.61168 ± 0.63145.4 ± 0.0154.5 ± 0.04145.1 ± 0.0116,4782.59.728.3
1130.2617.4242.128.4914 ± 1.3569.9 ± 0.0146.4 ± 0.03149.2 ± 0.02892.152.41.66107.5
1215.8719.1546.3613.3142 ± 0.4681.8 ± 0.0190.9 ± 0.02177.9 ± 0.017314.32.52.4317.4
1324.1322.8942.97.4746 ± 0.4249.8 ± 0.0166.6 ± 0.02212.1 ± 0.013623.22.68.8641.3
1428.3621.4840.927.4940 ± 1.0741.9 ± 0.0164.4 ± 0.03200.6 ± 0.023514.82.73.9642.6
1B17.4822.5651.044.9479 ± 0.4790.1 ± 0.0190.8 ± 0.03216.2 ± 0.024996.12.40.4230.2
2S6.2217.1437.7828.6821 ± 0.5231.4 ± 0.01148.8 ± 0.0270.8 ± 0.037017.82.73.0723.9
Table 2. Loadings for each variable with corresponding vector colors for Figure 3.
VariablePC1 LoadingsPC2 LoadingsVector Color
Al2O3−0.550.05Red
CaO0.16−0.71Blue
Fe2O30.220.68Blue
LOI0.540.10Red
SiO2−0.58−0.11Red
Table 3. Variable Importance in Projection (VIP) scores for Cr in PLS-DA. VIP scores are shown as a color gradient, with higher values in bright blue and the lowest values in white.
FeatureComponent 1Component 2
Fe2O31.701.61
CaO1.361.31
Al2O30.180.34
SiO20.400.56
LOI0.240.54
Disclaimer/Publisher’s Note: The statements, opinions and data contained in all publications are solely those of the individual author(s) and contributor(s) and not of MDPI and/or the editor(s). MDPI and/or the editor(s) disclaim responsibility for any injury to people or property resulting from any ideas, methods, instructions or products referred to in the content.