Article

Petrophysical Characteristics of Geological Complexes in the Southeastern Part of the Sarysu–Teniz Uplift (Central Kazakhstan) and Their Significance for Ore Mineralization Prospecting


1
Department of Geophysics and Seismology, Satbayev University, 22 Satbayev Str., Almaty 050013, Kazakhstan
2
Institute of Geological Sciences Named After K.I. Satpayev, Satbayev University, Almaty 050010, Kazakhstan
3
Department of «Geology and Exploration of Mineral Deposits», Karaganda Technical University Named After Abylkas Saginov, Karaganda 100027, Kazakhstan
4
Volkovgeology JSC, Almaty 050016, Kazakhstan
*
Authors to whom correspondence should be addressed.
Minerals 2026, 16(7), 706; https://doi.org/10.3390/min16070706
Submission received: 11 June 2026 / Revised: 1 July 2026 / Accepted: 3 July 2026 / Published: 6 July 2026
(This article belongs to the Section Mineral Exploration Methods and Applications)

Abstract

Petrophysical characterization of rocks is essential for the reliable interpretation of gravity and magnetic fields in ore districts where sedimentary, volcanogenic, and intrusive rocks occur in complex structural relationships. This study uses a database comprising 643 bulk-density determinations and 650 magnetic-susceptibility determinations obtained from drill-core and hand-specimen samples from the southeastern part of the Sarysu–Teniz uplift, Central Kazakhstan. In this study, these measurements are presented and interpreted in an aggregated form by the main lithostratigraphic and lithological groups; for each group, the number of determinations, weighted-average values, and diagnostic petrophysical characteristics are reported. The unit-level weighted-average density values range from 2.14 to 2.73 g/cm3, whereas mean magnetic-susceptibility values vary from 0 to 913 × 10−5 SI. Carbonate-dominated units, including limestones, marls, dolomites, and dolomitized limestones, are non-magnetic to practically non-magnetic, mostly at 0–14 × 10−5 SI. The highest values are recorded in andesite-basalts and quartz syenite porphyries, reaching 766–913 × 10−5 SI; granodiorites have an average value of approximately 452 × 10−5 SI. Density values partly overlap between sedimentary and intrusive rocks, especially within the interval range of 2.48–2.66 g/cm3, whereas magnetic susceptibility provides a more reliable criterion for distinguishing carbonate host rocks from magnetite-bearing magmatic assemblages. The combined density–magnetic susceptibility framework indicates that exploration targeting should prioritize bodies with elevated magnetic susceptibility or sharp magnetic gradients, especially where χ > 450 × 10−5 SI, provided that these features coincide with faults, lithological contacts, practically non-magnetic carbonate host rocks, and independent geochemical evidence or known mineral occurrences. Consequently, magnetic anomalies are interpreted as indirect structural–lithological indicators rather than as direct evidence of ore bodies.

1. Introduction

Density and magnetic susceptibility are key petrophysical parameters that link lithological composition, mineral assemblages, secondary alteration, and ore-forming processes with gravity and magnetic fields. Density controls the gravity response of rocks and may reflect compaction, dolomitization, silicification, the composition of intrusive bodies, and the presence of dense ore or vein minerals. Magnetic susceptibility is mainly controlled by the abundance of paramagnetic, ferromagnetic, and ferrimagnetic minerals, especially magnetite-bearing phases; therefore, it is particularly useful for distinguishing practically non-magnetic carbonate–terrigenous successions from more magnetically expressive volcanogenic–intrusive rocks. Modern petrophysical approaches require not only the reporting of average values, but also the statistical treatment of rock-property datasets, construction of density–magnetic susceptibility diagrams, use of Henkel-type plots, and comparison of laboratory data with potential-field and seismic interpretations [1,2,3,4,5,6,7,8,9,10,11].
For Central Kazakhstan, regional petrophysical handbooks, textbook syntheses, and recent studies show that carbonate and terrigenous–carbonate units generally have low magnetic susceptibility, whereas volcanogenic, intrusive, and magnetite-bearing rocks produce more contrasting magnetic fields [12,13,14,15,16,17]. Similar patterns have been reported from the eastern part of the Sarysu–Teniz uplift and the Zhezkazgan ore district, where petrophysical parameters have been used to refine lithological interpretation and evaluate ore-controlling factors. However, for the southeastern part of the Sarysu–Teniz uplift, previous syntheses have rarely integrated density and magnetic susceptibility into a single bivariate interpretation framework or translated petrophysical contrasts into quantitative criteria for gravity–magnetic interpretation and exploration target ranking.
The aim of this study is to summarize and interpret the petrophysical characteristics of the main lithostratigraphic and lithological units in the southeastern part of the Sarysu–Teniz uplift and to evaluate their significance for gravity–magnetic interpretation and ore mineralization prospecting. This study uses a laboratory database of bulk-density and magnetic-susceptibility determinations, presented here in an aggregated form by major lithological group. Particular attention is given to:
  • Characterization of the ranges of unit-level weighted-average density and magnetic susceptibility for sedimentary, volcanogenic, and intrusive rocks;
  • Identification of diagnostic combinations of these parameters that allow practically non-magnetic carbonate host rocks to be distinguished from magnetically expressive volcanogenic and intrusive assemblages;
  • Comparison of the resulting petrophysical classes with the gravity–magnetic field pattern and the structural position of magmatic bodies; and
  • Formulation of quantitative criteria applicable to the exploration of Atasu-type mineralization and related polymetallic systems.
    The novelty of this work lies in moving beyond a descriptive catalog of physical rock properties toward a bivariate density–magnetic susceptibility and exploration-oriented interpretation framework that links laboratory petrophysical data with lithology, structural control, and potential-field geophysical anomalies.

2. Geological Setting

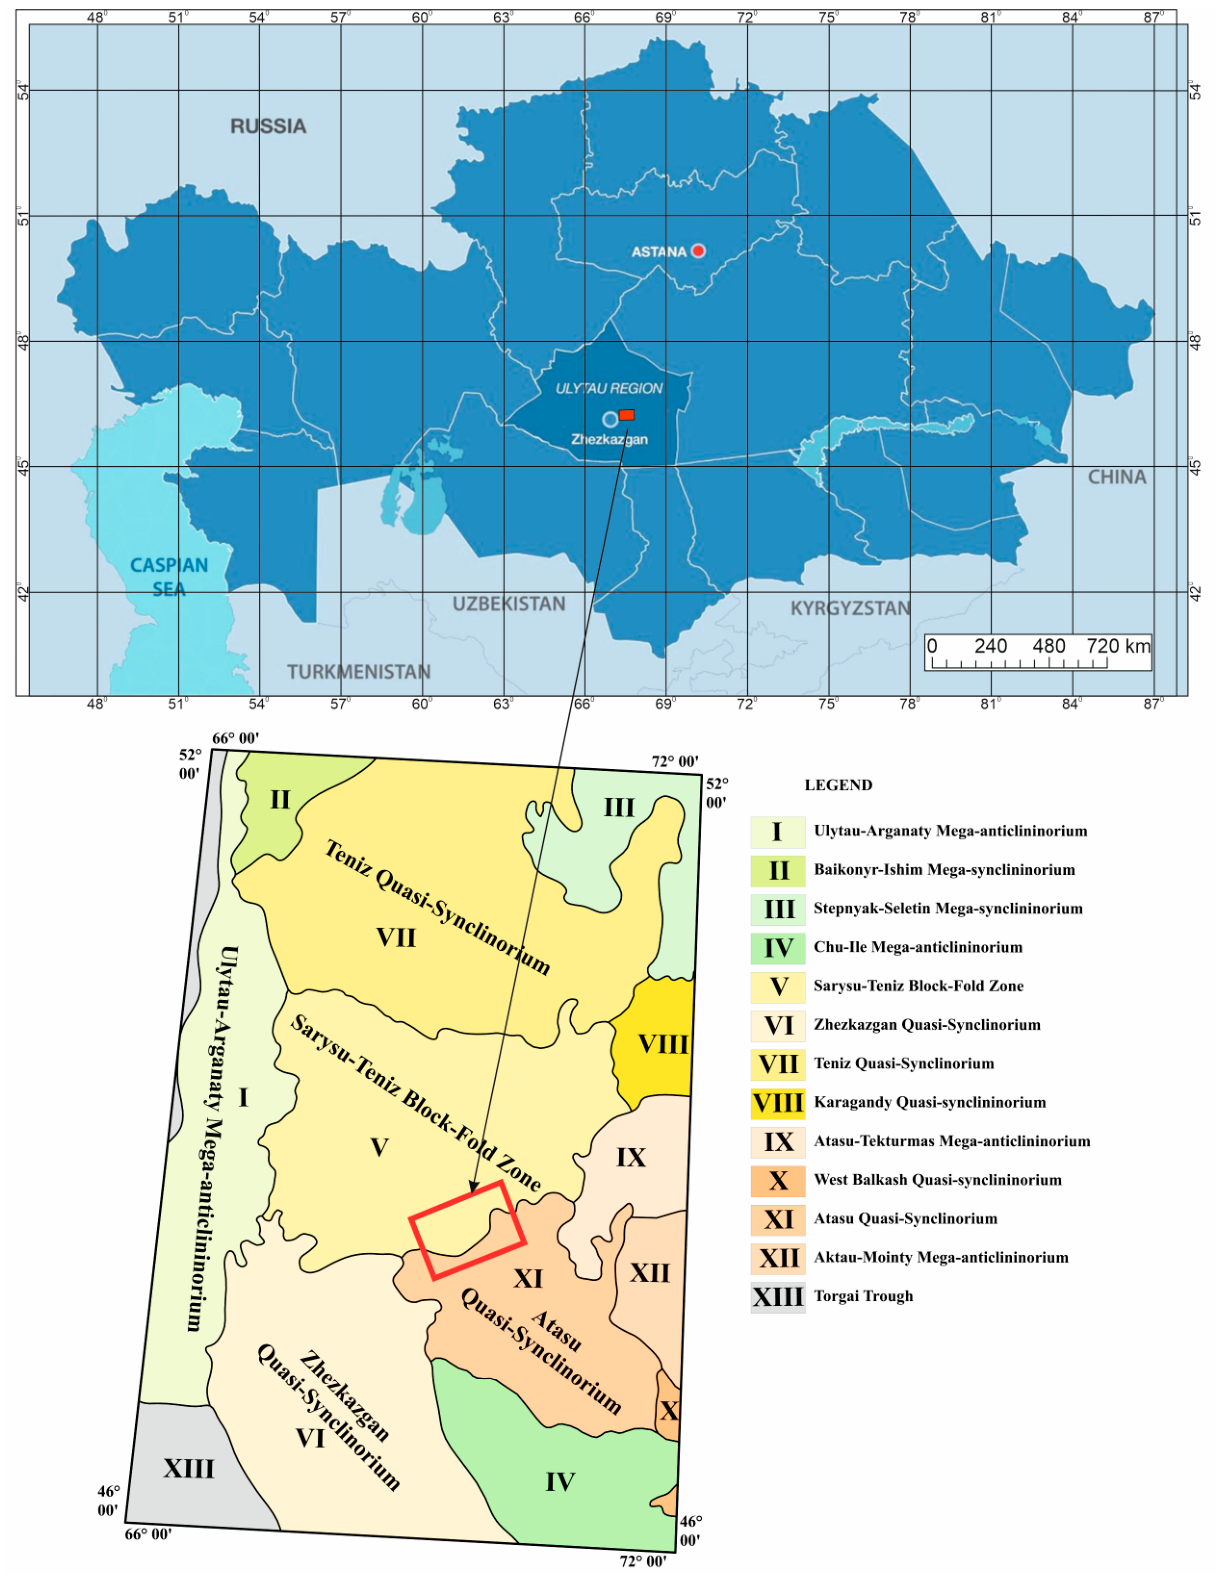
The Sarysu–Teniz uplift is one of the major tectonic elements of Central Kazakhstan and occupies an important position within the Paleozoic fold-and-block structural framework of the region. It is characterized by a complex, multistage geological evolution involving sedimentation, volcanism, intrusive magmatism, and subsequent tectonic reworking [18,19,20,21,22,23]. Owing to the juxtaposition of sedimentary, volcanogenic, and intrusive complexes of different ages, the uplift is important both for regional geological reconstruction in Central Kazakhstan and for assessing its mineral potential. The location of the study area within the Sarysu–Teniz uplift is shown in Figure 1.
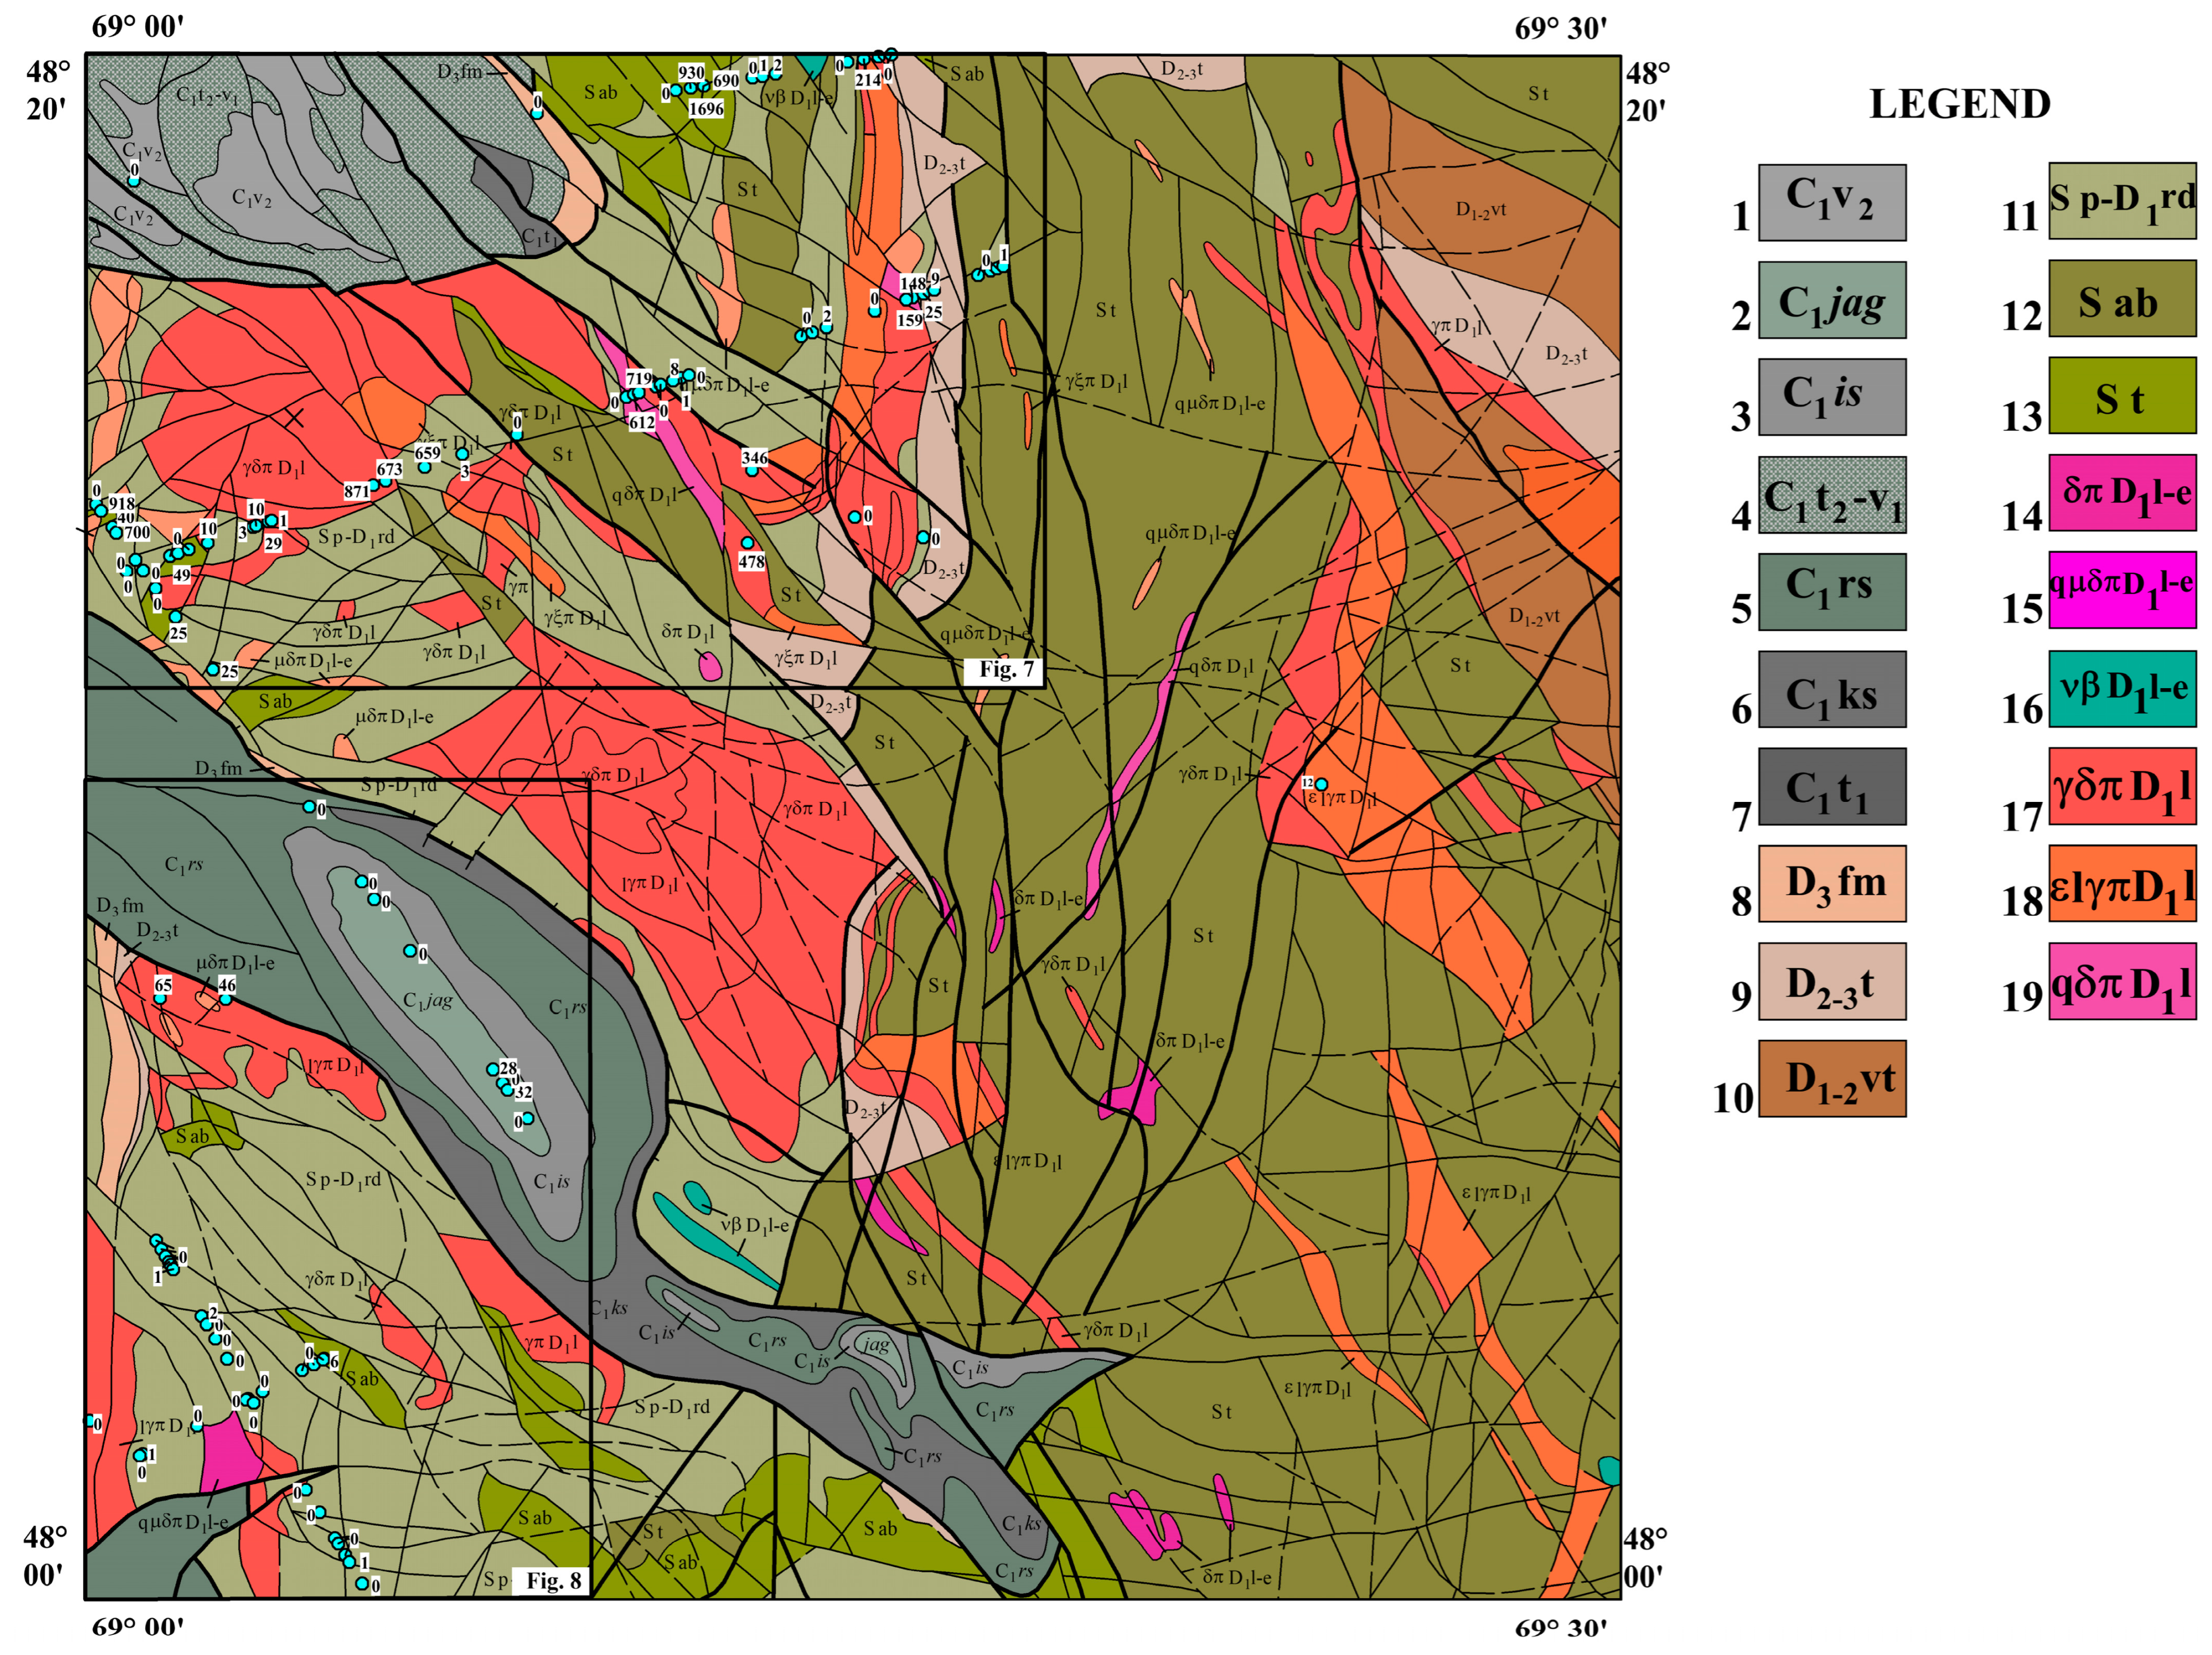
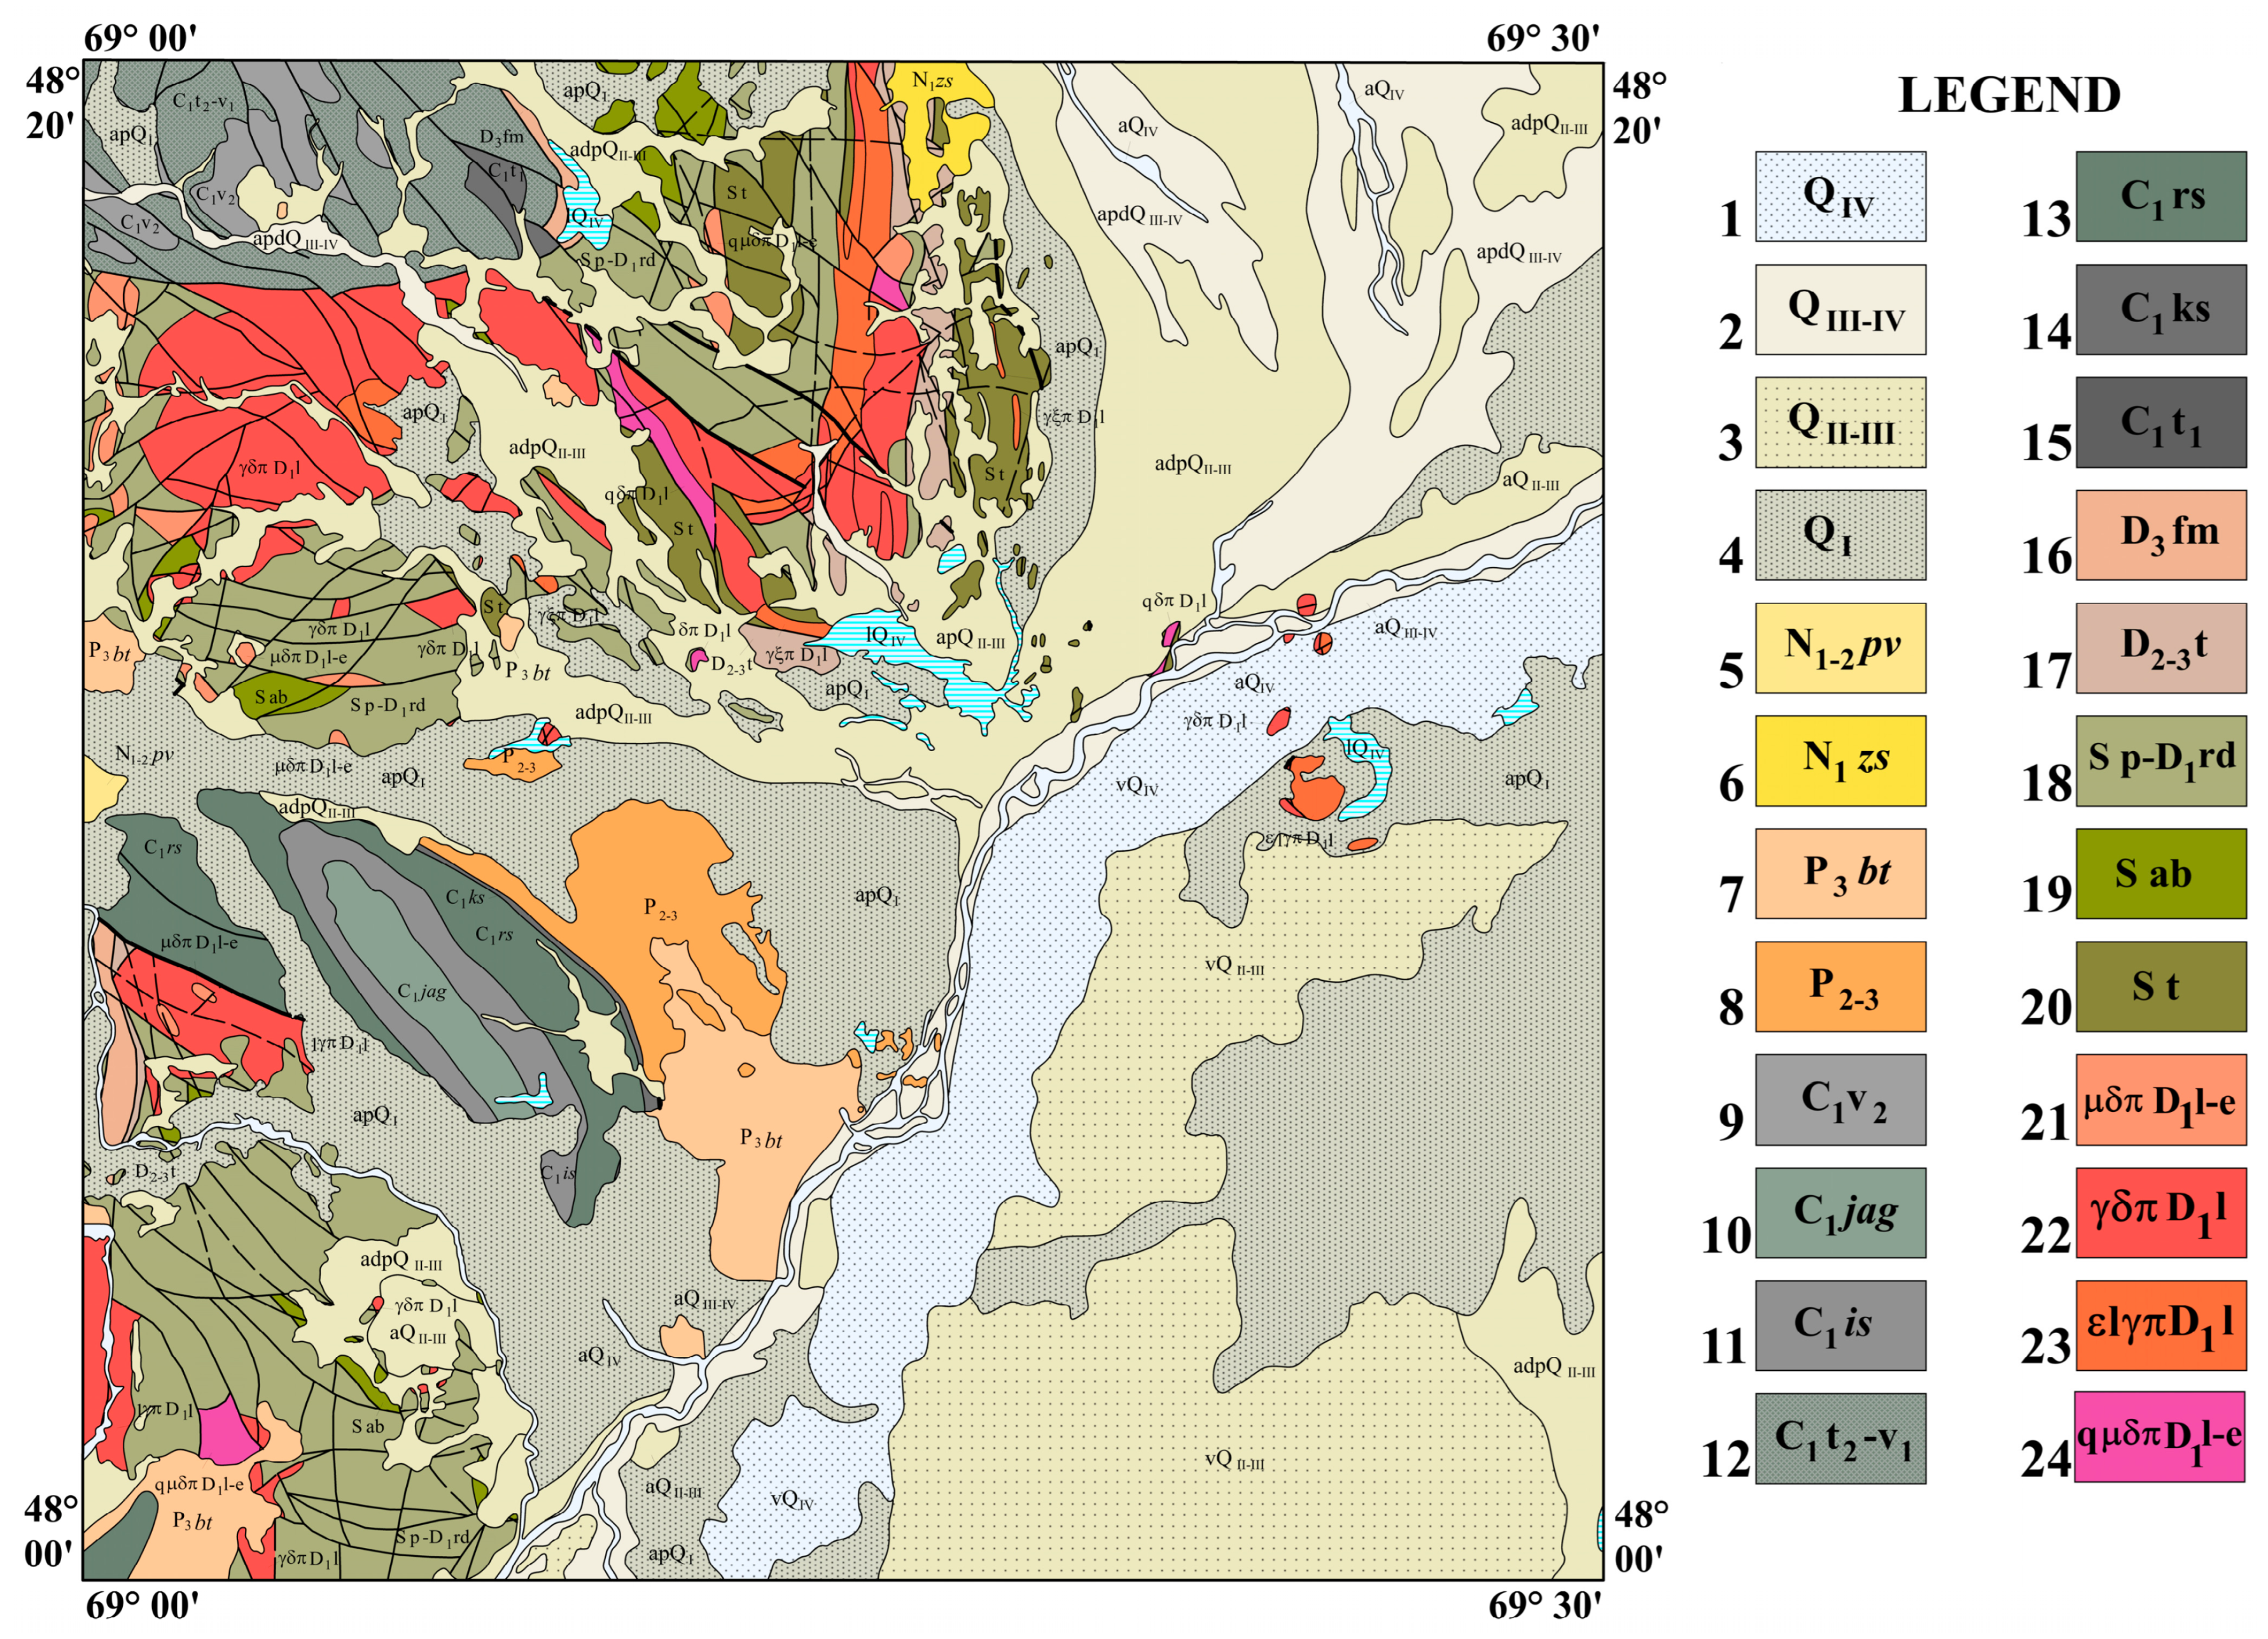
The southeastern part of the Sarysu–Teniz uplift comprises a structurally complex association of Paleozoic sedimentary, volcanogenic–sedimentary, volcanogenic, and intrusive complexes. The stratigraphic succession is composed mainly of Lower Silurian terrigenous and volcanogenic units, Upper Devonian carbonate-bearing formations, Lower Carboniferous carbonate and carbonate–terrigenous deposits, and Devonian hypabyssal intrusive complexes. Devonian–Carboniferous carbonate and mixed carbonate–terrigenous sequences, together with fault-controlled magmatic bodies, are considered prospective for Atasu-type barite–lead–zinc and associated polymetallic mineralization [24,25,26,27]. Recent studies of ore systems in Central Kazakhstan, including the Bestobe, Uspensky, and related districts, as well as new age constraints for intrusive complexes of the Sarysu–Teniz uplift, confirm the continuing significance of this area for mineral exploration [28,29,30,31,32,33,34,35]. In the broader Kazakhstani context, studies of gold-bearing jasperoids, disseminated gold–sulfide mineralization, geological–industrial types of gold deposits, and rare-metal systems show that mineral prospectivity assessment should consider not only lithological composition, but also structural control, mineralogical indicators, metasomatic alteration, and the combined set of ore-controlling factors [36,37,38,39]. The geological structure of the study area and the main lithostratigraphic units are shown in Figure 2.

3. Materials and Methods

3.1. Geological and Lithostratigraphic Framework

The petrophysical dataset represents the main rock associations that crop out at the surface or were intersected by drilling in the southeastern part of the Sarysu–Teniz uplift. The sampled units include Lower Silurian terrigenous and volcanogenic rocks, Upper Devonian carbonate-bearing rocks, Lower Carboniferous carbonate, marly, and mixed terrigenous–carbonate formations, Cenozoic cover deposits, and Devonian intrusive complexes. The lithostratigraphic and lithological grouping used in the maps, tables, and figures is summarized in Table 1. This table is included to explicitly identify the rock types corresponding to each map code and to avoid ambiguity between stratigraphic, lithological, and petrophysical groupings.

3.2. Source Materials, Sample Attribution, and Database Structure

For the quantitative and qualitative interpretation of geophysical survey materials, drill-core and hand-specimen samples were collected from prospecting–mapping and exploration boreholes that intersected the main rock types and ore-bearing intervals in the southeastern part of the Sarysu–Teniz uplift. Two principal petrophysical parameters were determined: bulk density and magnetic susceptibility. All measurements of rock physical properties were carried out in a geophysical laboratory operated by the exploration company responsible for the geological exploration work.
The compiled dataset includes 643 bulk-density determinations and 650 magnetic-susceptibility determinations. Lithological and stratigraphic attribution of the samples was established using drilling logs, field documentation, geological maps, prospecting–mapping materials, and archival interpretation reports [40,41,42,43,44]. Individual sample-level values are not reproduced in the main body of the article; instead, the results are presented in an aggregated form by lithostratigraphic unit and dominant lithological group. For each group, the number of determinations, weighted-average density, and mean or weighted-average magnetic susceptibility are reported.
The geological framework used for interpretation was further constrained by 2D common-depth-point seismic data, ground gravity and magnetic surveys, gamma-ray profiling, electrical prospecting, geological traverses, geological mapping, exploration drilling, borehole geophysics, and laboratory investigations summarized in geological exploration reports [40,41,42,43,44]. These materials were used, first, to verify the attribution of samples to mapped geological units and, second, to compare the identified petrophysical classes with the expected gravity and magnetic responses of the corresponding lithological bodies. This comparison is treated as a first-order consistency check rather than as a full 3D inversion or deterministic forward modeling [45,46,47,48].

3.3. Rock-Density Determination

Bulk density was determined by the hydrostatic weighing method using a Samsonov-type densitometer. The instrument performance was periodically verified by comparing the measured values with reference measurements using calibrated standard weights. The systematic instrumental error of the densitometer was ±0.01 g/cm3. Prior to measurements, rock samples were saturated in distilled water for a range of 15–16 h, and hydrostatic weighing was performed in distilled water with a density of 1.0 g/cm3. The error estimated from repeated measurements did not exceed ±0.01 g/cm3. The measurements were carried out on drill-core specimens with lengths of up to 10 cm. Before measurements, the samples were cleaned; visibly weathered, porous, strongly fractured, or mechanically unstable fragments were excluded from the analysis in order to minimize the effects of near-surface alteration, open fracturing, and mechanical damage on the determined bulk-density values [23,24,28,34,35,36,37,38].
The hydrostatic weighing method was applied to intact drill-core and hand-specimen samples representing the main sedimentary, volcanogenic–sedimentary, volcanogenic, and intrusive units of the study area. The obtained values were grouped according to lithology and stratigraphic affiliation. For subsequent analysis, weighted-average density values were calculated for the selected lithological groups and geological complexes. These aggregated values are used in Table 2, in the distribution diagrams, and in the density–magnetic susceptibility plot.

3.4. Magnetic Susceptibility Measurements

Magnetic susceptibility was measured using a KT-5 kappameter on the flat surface of each pre-cut sample. Three measurements were performed for each sample, and the mean magnetic-susceptibility value was then calculated for that sample. The primary values were recorded in units of 1 × 10⁻³ SI; for consistency in the present article, the results are reported as χ × 10−5 SI. This notation is used consistently throughout the text, tables, figure captions, and diagrams [29,34,35,36,37,38].
The measured magnetic-susceptibility values are interpreted as indicators of the relative abundance and state of paramagnetic, ferromagnetic, and ferrimagnetic minerals, especially magnetite-bearing phases in volcanogenic and intrusive rocks. The interpretation also follows the magnetic classification of rocks proposed by L.D. Bersudsky (1963), according to which rocks are classified as non-magnetic at χ = 0–100 × 10−5 SI, weakly magnetic at χ = 100–700 × 10−5 SI, magnetic at χ = 700–3000 × 10−5 SI, and strongly magnetic at χ > 3000 × 10−5 SI [49].
Natural remanent magnetization was not determined in this study. Therefore, the interpretation of magnetic anomalies is based primarily on induced magnetization and should be treated with caution for volcanogenic and intrusive rocks with elevated magnetic susceptibility, where remanent magnetization may affect both the amplitude and position of magnetic anomalies. This limitation is considered in the Discussion Section when evaluating the exploration significance of magnetic contrasts.

3.5. Calculation of Bouguer Anomalies and Comparison with Petrophysical Data

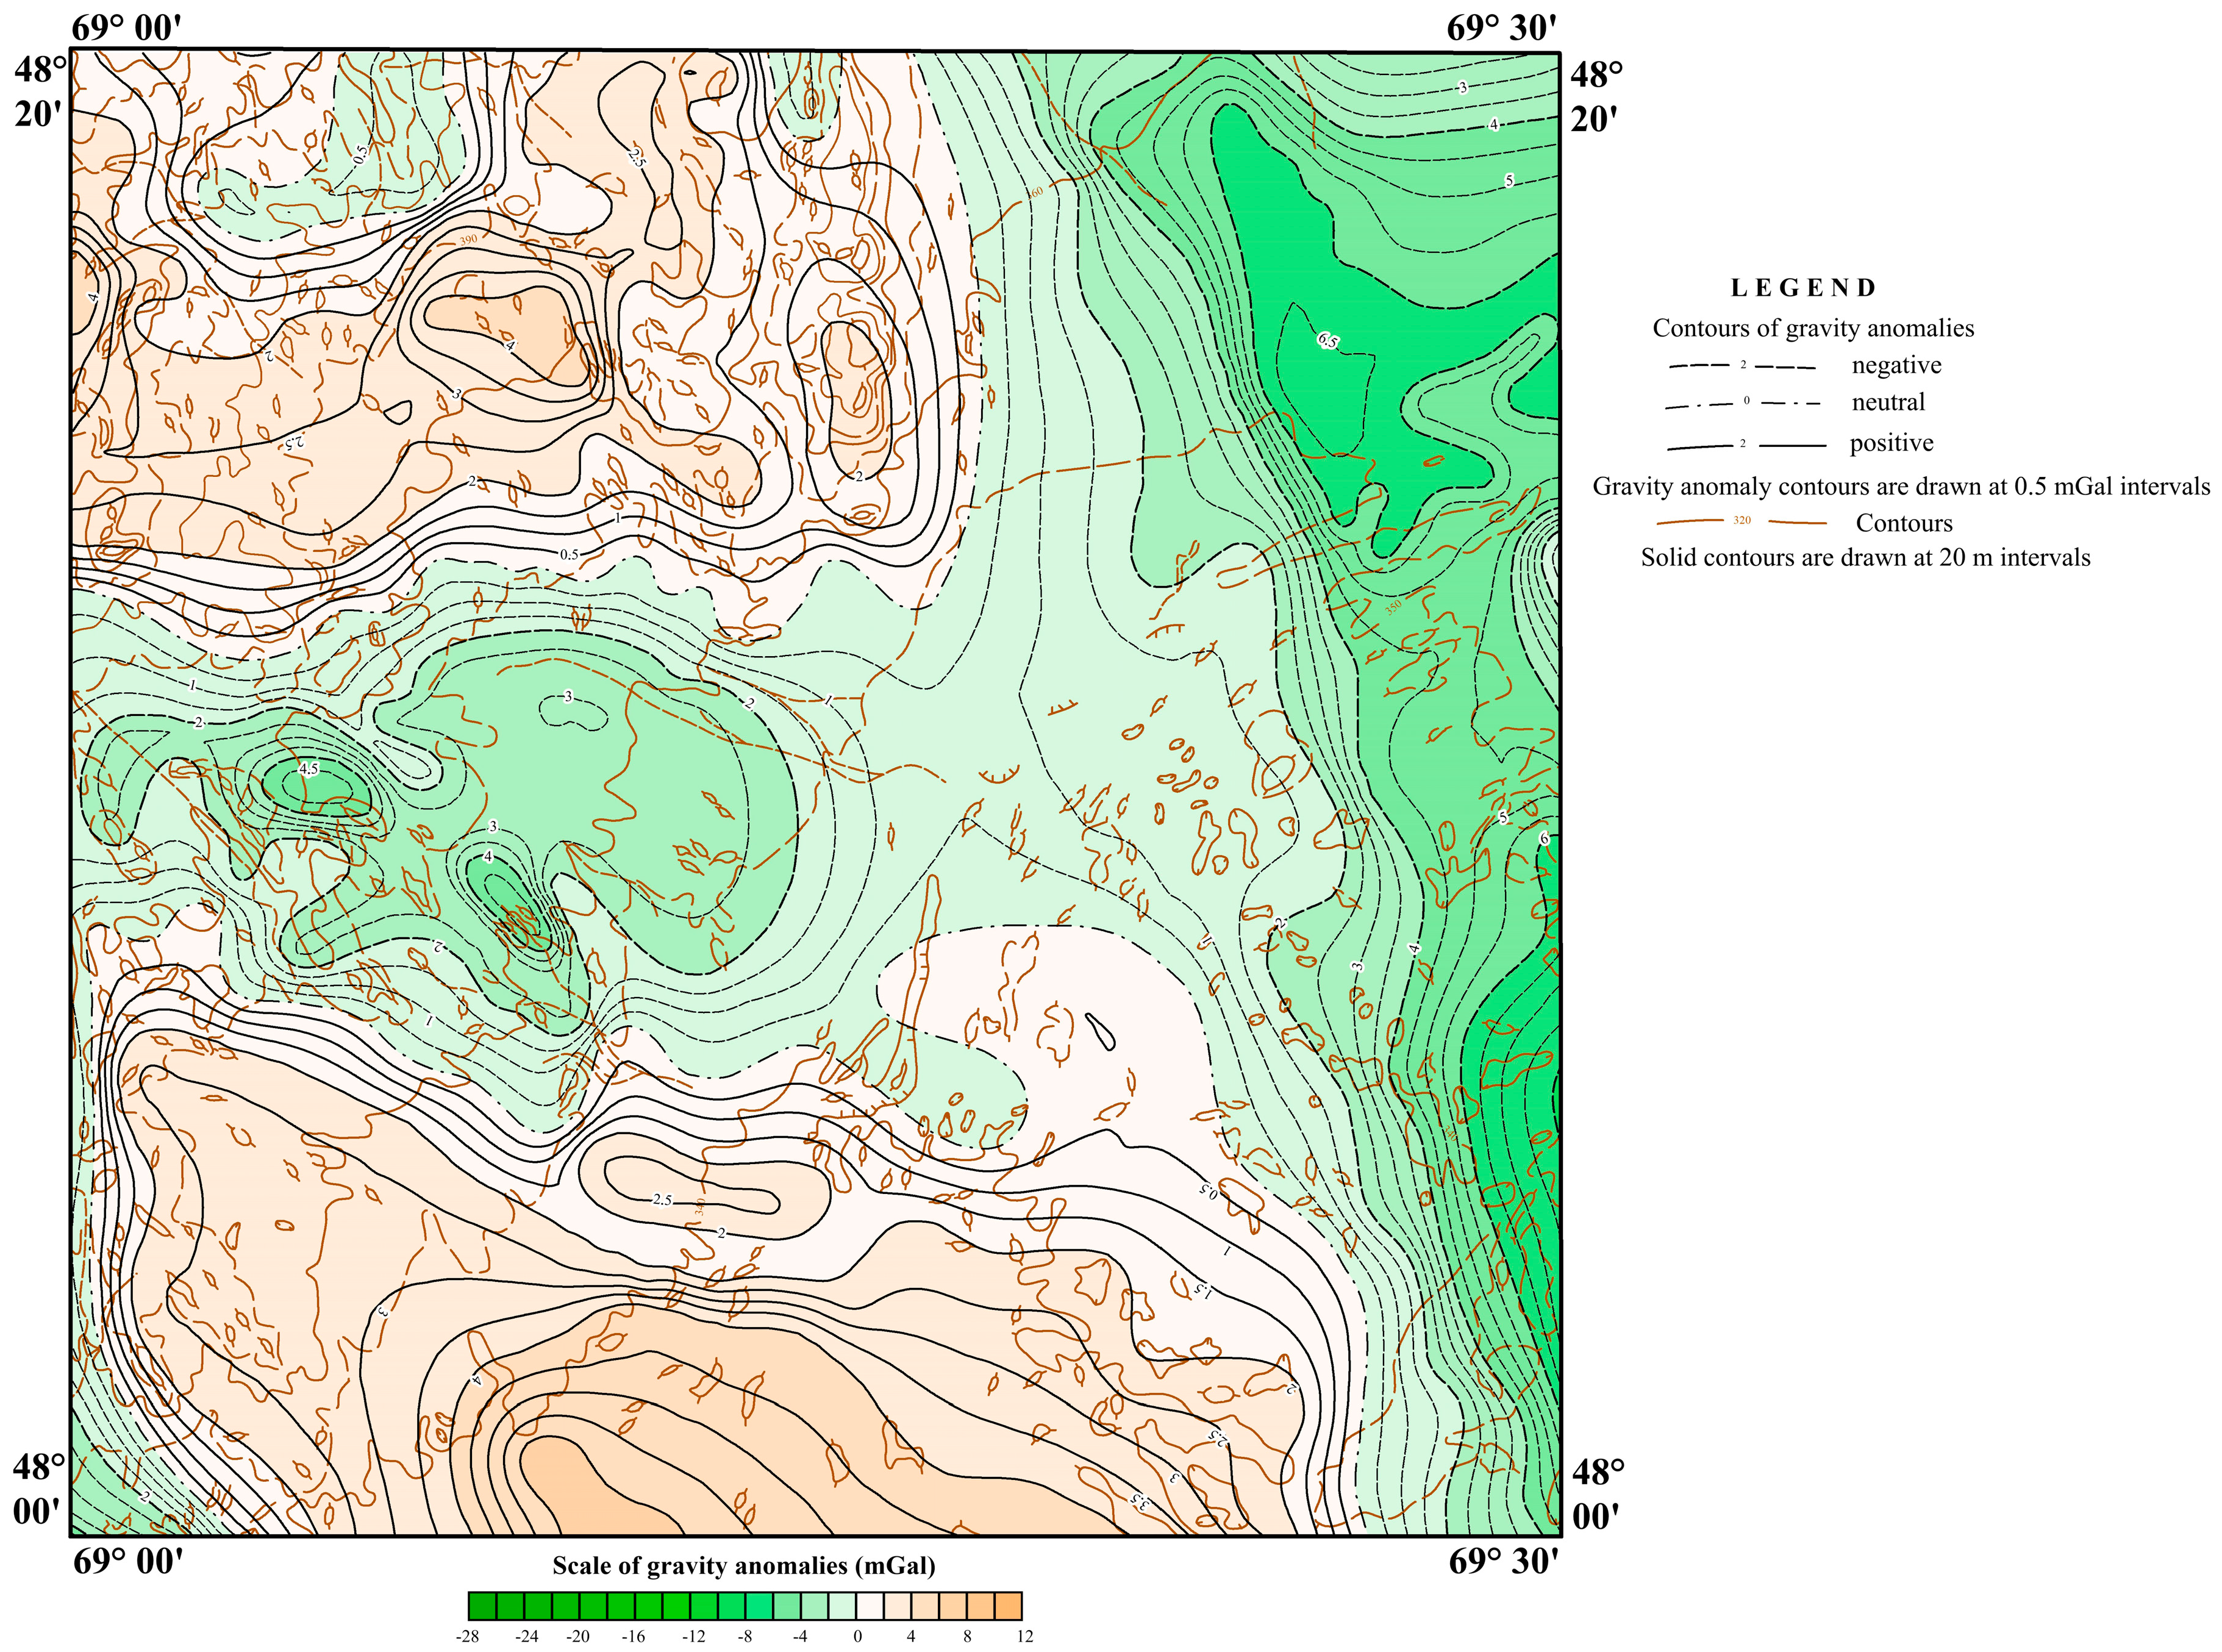
Ground gravity survey data and a Bouguer gravity anomaly map were used to assess the consistency between laboratory density determinations and the observed gravity field. Final Bouguer anomaly values were calculated using two intermediate-layer densities: 2.3 and 2.67 g/cm3. The calculations took into account the observed gravity values, the intermediate-layer density, the elevation of the observation point, and the correction for the normal gravity field of the Earth. After applying the required corrections, Bouguer-reduction materials were produced; in the present study, the Bouguer gravity anomaly map calculated for an intermediate-layer density of 2.67 g/cm3 is used for comparison with the petrophysical data.
The Bouguer gravity anomaly map was used as an independent field-scale basis for evaluating the extent to which laboratory-derived density contrasts between carbonate, volcanogenic, and intrusive rocks are consistent with the gravity field. Because neither forward gravity modeling nor 3D inversion was performed in the present study, the comparison with the Bouguer map is treated as a semi-quantitative consistency check. Particular attention was paid to the fact that dense dolomitized limestones may generate or enhance gravity contrasts while remaining practically non-magnetic, whereas intrusive and volcanogenic rocks are commonly characterized by both elevated density and elevated magnetic susceptibility.

3.6. Data Grouping, Statistical Treatment, and Petrophysical Classification

The petrophysical data were grouped by lithostratigraphic unit, dominant lithology, and broader petrophysical group: sedimentary and cover deposits, volcanogenic and volcanogenic–sedimentary rocks, and intrusive rocks. For each lithological group, the number of determinations, weighted-average bulk density, and mean or weighted-average magnetic susceptibility were evaluated. Because the main text presents aggregated values rather than the complete set of individual sample-level measurements, the interpretation focuses on identifying stable lithological contrasts rather than analyzing isolated deviations of individual samples.
For each lithological unit presented in Table 2, the mean density and mean magnetic susceptibility were calculated from individual laboratory measurements. Subsequently, for the three broader petrophysical groups (sedimentary and cover deposits, volcanogenic and volcanogenic–sedimentary rocks, and intrusive rocks), weighted-average values were calculated using the number of laboratory measurements for each lithological unit as weighting factors according to the following equation:
x - w = i = 1 k n i x - i i = 1 k n i ,
where x - w is the weighted-average value for the broader petrophysical group, x - i is the mean density (or magnetic susceptibility) of the i-th lithological unit, n i is the number of laboratory measurements for that lithological unit, and k is the total number of lithological units included in the corresponding broader petrophysical group. The use of the number of laboratory measurements as weighting factors provides a more representative estimate of the petrophysical characteristics of each broader group because the lithological units are represented by different numbers of samples.
Statistical treatment included a descriptive comparison of lithological units, calculation of weighted-average values, and identification of the ranges of mean values for the main rock groups. The diagrams for the broader groups show the distribution of aggregated petrophysical characteristics by lithological unit and do not replace a full statistical analysis of all individual sample-level measurements. Therefore, the reported intervals should be interpreted as ranges of mean values for the selected units, rather than as the full minimum–maximum range or interquartile range of the original dataset.
For the combined analysis of density and magnetic susceptibility, a Henkel-type plot was used, in which bulk density is compared with magnetic susceptibility on a logarithmic scale. This approach makes it possible to determine which lithological groups are separated mainly by density, which are separated mainly by magnetic susceptibility, and which require the joint interpretation of both parameters. On the plot, zero magnetic-susceptibility values are shown conditionally at the lower boundary of the logarithmic scale for visualization only; they are not treated as real logarithmic measurements [24,25].
Two levels of magnetic classification are distinguished in this study. The first level follows the general petrophysical classification of L.D. Bersudsky (1963) [49], according to which rocks are classified as non-magnetic at χ = 0–100 × 10−5 SI, weakly magnetic at χ = 100–700 × 10−5 SI, magnetic at χ = 700–3000 × 10−5 SI, and strongly magnetic at χ > 3000 × 10−5 SI. The second level is a relative classification within the present dataset, used for exploration interpretation. In this context, values of χ = 0–14 × 10−5 SI characterize the practically non-magnetic carbonate and mixed sedimentary background, whereas χ > 450 × 10−5 SI is used as an empirical threshold for elevated magnetic susceptibility relative to this background. Values of χ ≥ 700 × 10−5 SI correspond to magnetic rocks according to the Bersudsky classification and are characteristic of andesite-basalts, quartz syenites, and quartz syenite porphyries.
The petrophysical classes were compared with the available geological, structural, gravity, and magnetic survey information. This comparison was carried out as a semi-quantitative consistency check between the laboratory-derived physical properties of the rocks and their expected expression in potential-field data. Particular attention was paid to whether areas with elevated magnetic susceptibility coincide with mapped or drill-intersected magmatic bodies, and whether dense but practically non-magnetic carbonate units can explain gravity contrasts without corresponding magnetic highs.
This procedure does not constitute full forward modeling or 3D inversion, because regular digital gravity and magnetic field profiles are not presented in this paper. Nevertheless, it provides a way to evaluate whether the identified petrophysical groups are consistent with the geological map, the structural position of intrusive bodies, and the Bouguer gravity anomaly map. In particular, dense dolomitized limestones may generate or enhance gravity contrasts while remaining practically non-magnetic, whereas volcanogenic and intrusive rocks are commonly characterized by both elevated density and elevated magnetic susceptibility. Therefore, the exploration interpretation in this study is not based on a single parameter, but on the combined analysis of density, magnetic susceptibility, lithology, structural position, and the gravity–magnetic field.

4. Results

4.1. Petrophysical Characteristics of the Main Lithological Units

The compiled petrophysical dataset comprises 25 lithological entries grouped within the main stratigraphic and intrusive units (Table 2). Density values range from 2.14 to 2.73 g/cm3, whereas magnetic susceptibility ranges from 0 to 913 × 10−5 SI.
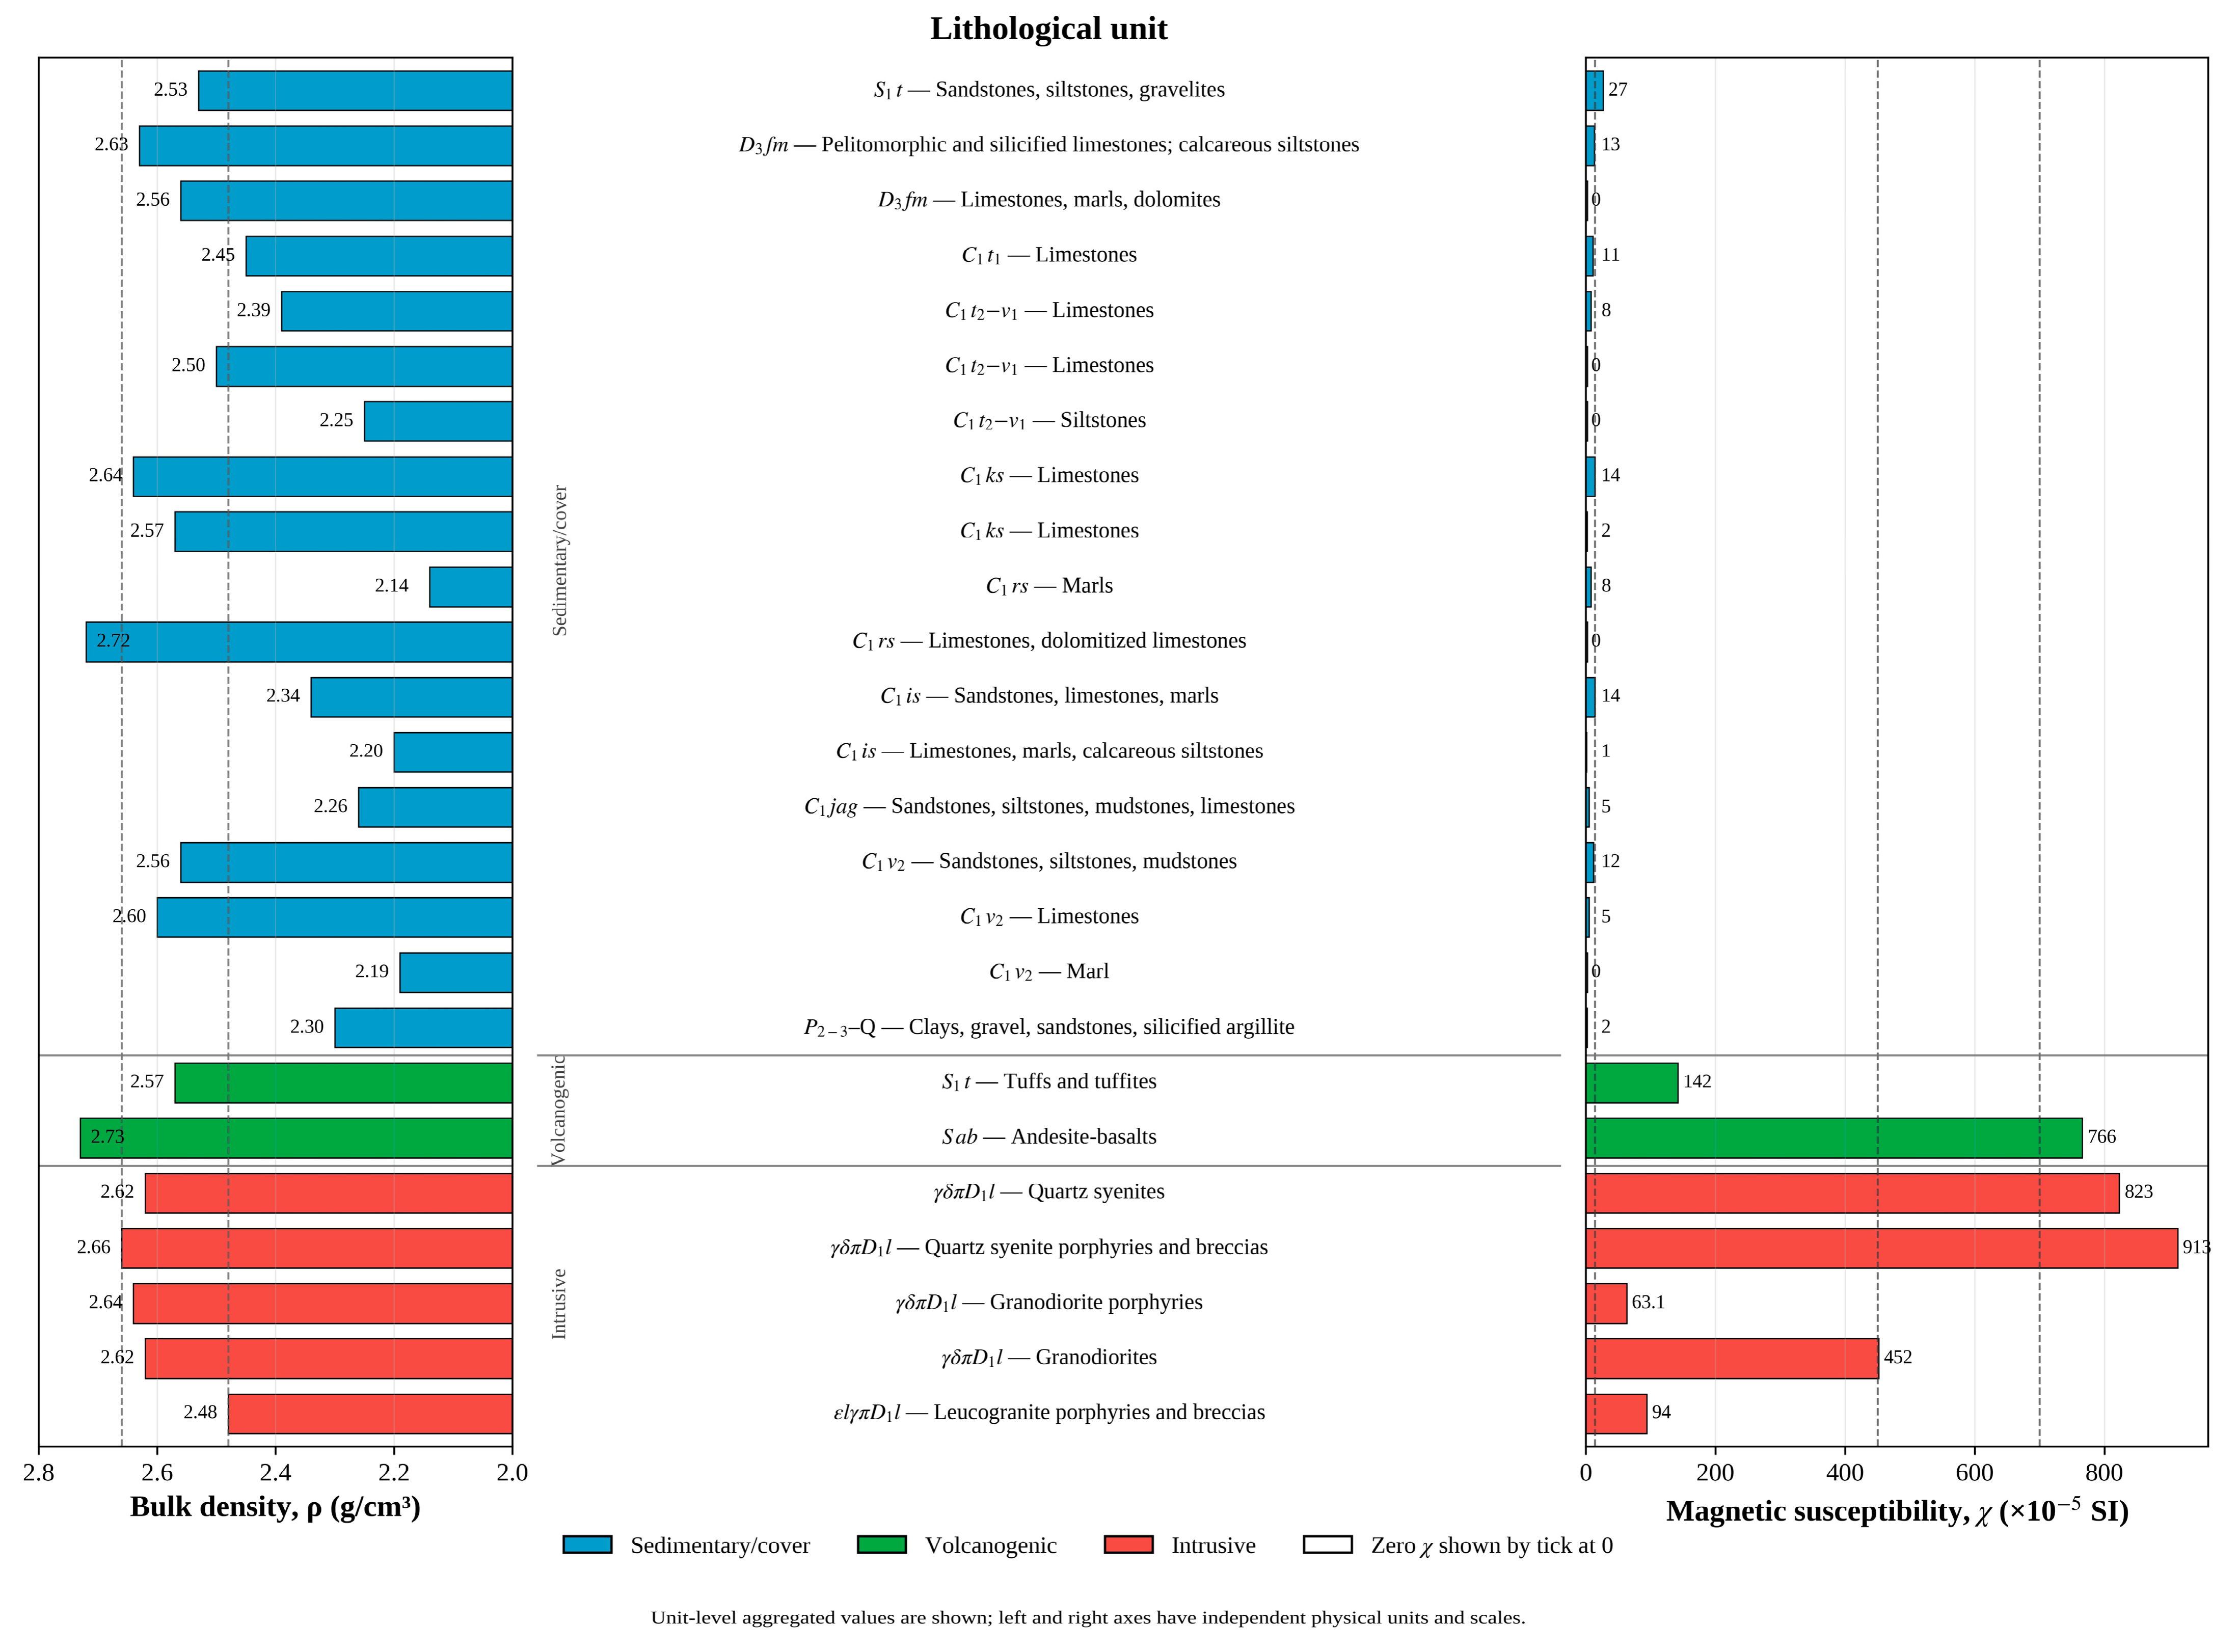
The Lower Silurian terrigenous rocks, represented by sandstones, siltstones, and gravelites, have a weighted-average density of 2.53 g/cm3 and a weighted-average magnetic susceptibility of 27 × 10−5 SI. Tuffs and tuffites assigned to the same broader stratigraphic interval are characterized by a density of 2.57 g/cm3 and a susceptibility of 142 × 10−5 SI. Andesite-basalts have a density of 2.73 g/cm3 and a magnetic susceptibility of 766 × 10−5 SI.
The Upper Devonian and Lower Carboniferous carbonate-dominated units have densities ranging from 2.14 to 2.72 g/cm3, whereas their magnetic susceptibility values mostly fall within the interval range of 0–14 × 10−5 SI. The lowest unit-level density is recorded for marls of the Rusakov Suite, at 2.14 g/cm3, whereas limestones and dolomitized limestones of the same suite reach 2.72 g/cm3 while retaining a susceptibility of 0 × 10−5 SI. Tournaisian–Visean limestones have a density range of 2.39–2.50 g/cm3 and a magnetic susceptibility value range of 0–8 × 10⁻⁵ SI, whereas limestones of the Kassin Suite reach 2.64 g/cm3 and 14 × 10−5 SI.
Intrusive rocks have a density range of 2.48–2.66 g/cm3 and magnetic susceptibility values of 63.13–913 × 10−5 SI. Quartz syenites are characterized by a density of 2.62 g/cm3 and a susceptibility of 823 × 10−5 SI. Quartz syenite porphyries and their breccias have a density of 2.66 g/cm3 and show the highest magnetic susceptibility among the aggregated values, reaching 913 × 10−5 SI. Granodiorites have a density of 2.62 g/cm3 and a susceptibility of 451.88 × 10⁻⁵ SI, whereas granodiorite porphyries and leucogranite porphyries are characterized by lower susceptibility values of 63.13 and 94 × 10−5 SI, respectively.

4.2. Broader Lithological Grouping and Spatial Patterns

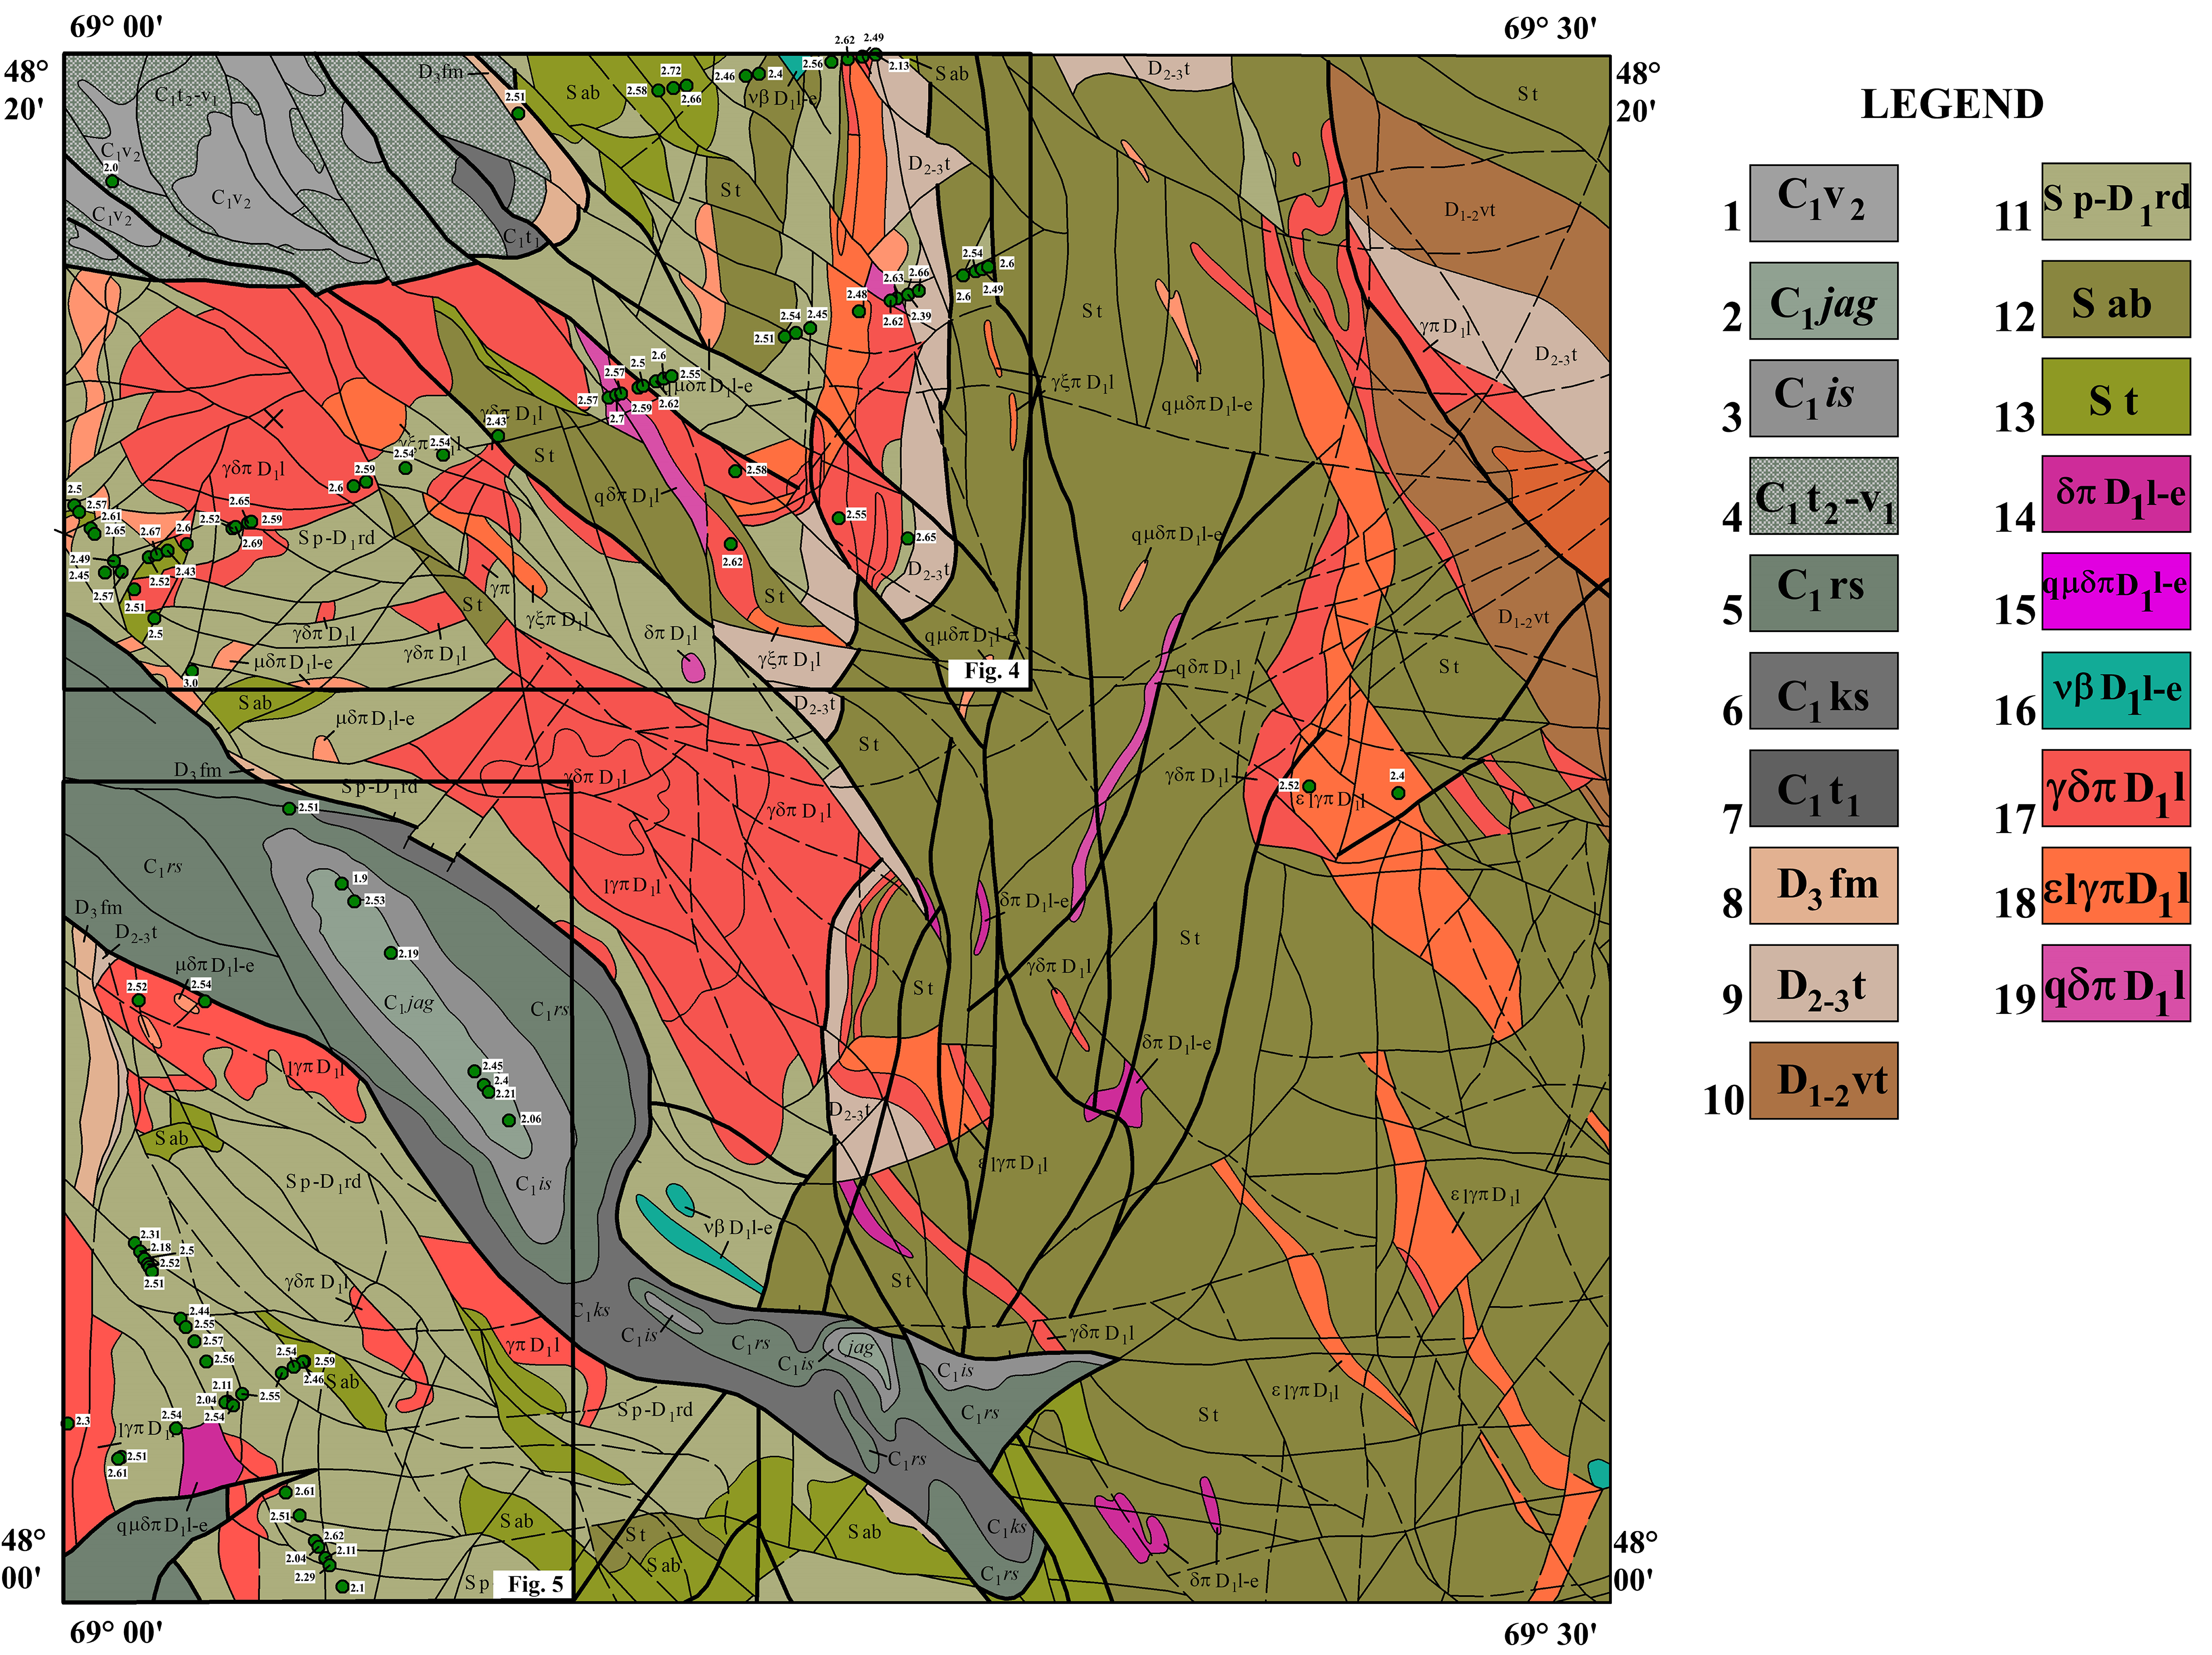
At the level of broader rock groups, sedimentary and cover deposits have a weighted-average density of approximately 2.53 g/cm3 and a weighted-average magnetic susceptibility of 8 × 10⁻⁵ SI. Volcanogenic and volcanogenic–sedimentary rocks have a weighted-average density of approximately 2.70 g/cm3 and a magnetic susceptibility of 666 × 10−5 SI. Intrusive rocks are characterized by a weighted-average density of approximately 2.63 g/cm3 and a magnetic susceptibility of 561 × 10−5 SI. These values were calculated from the lithological-unit averages presented in Table 2 and are shown in Figure 3, Figure 4, Figure 5, Figure 6, Figure 7 and Figure 8.
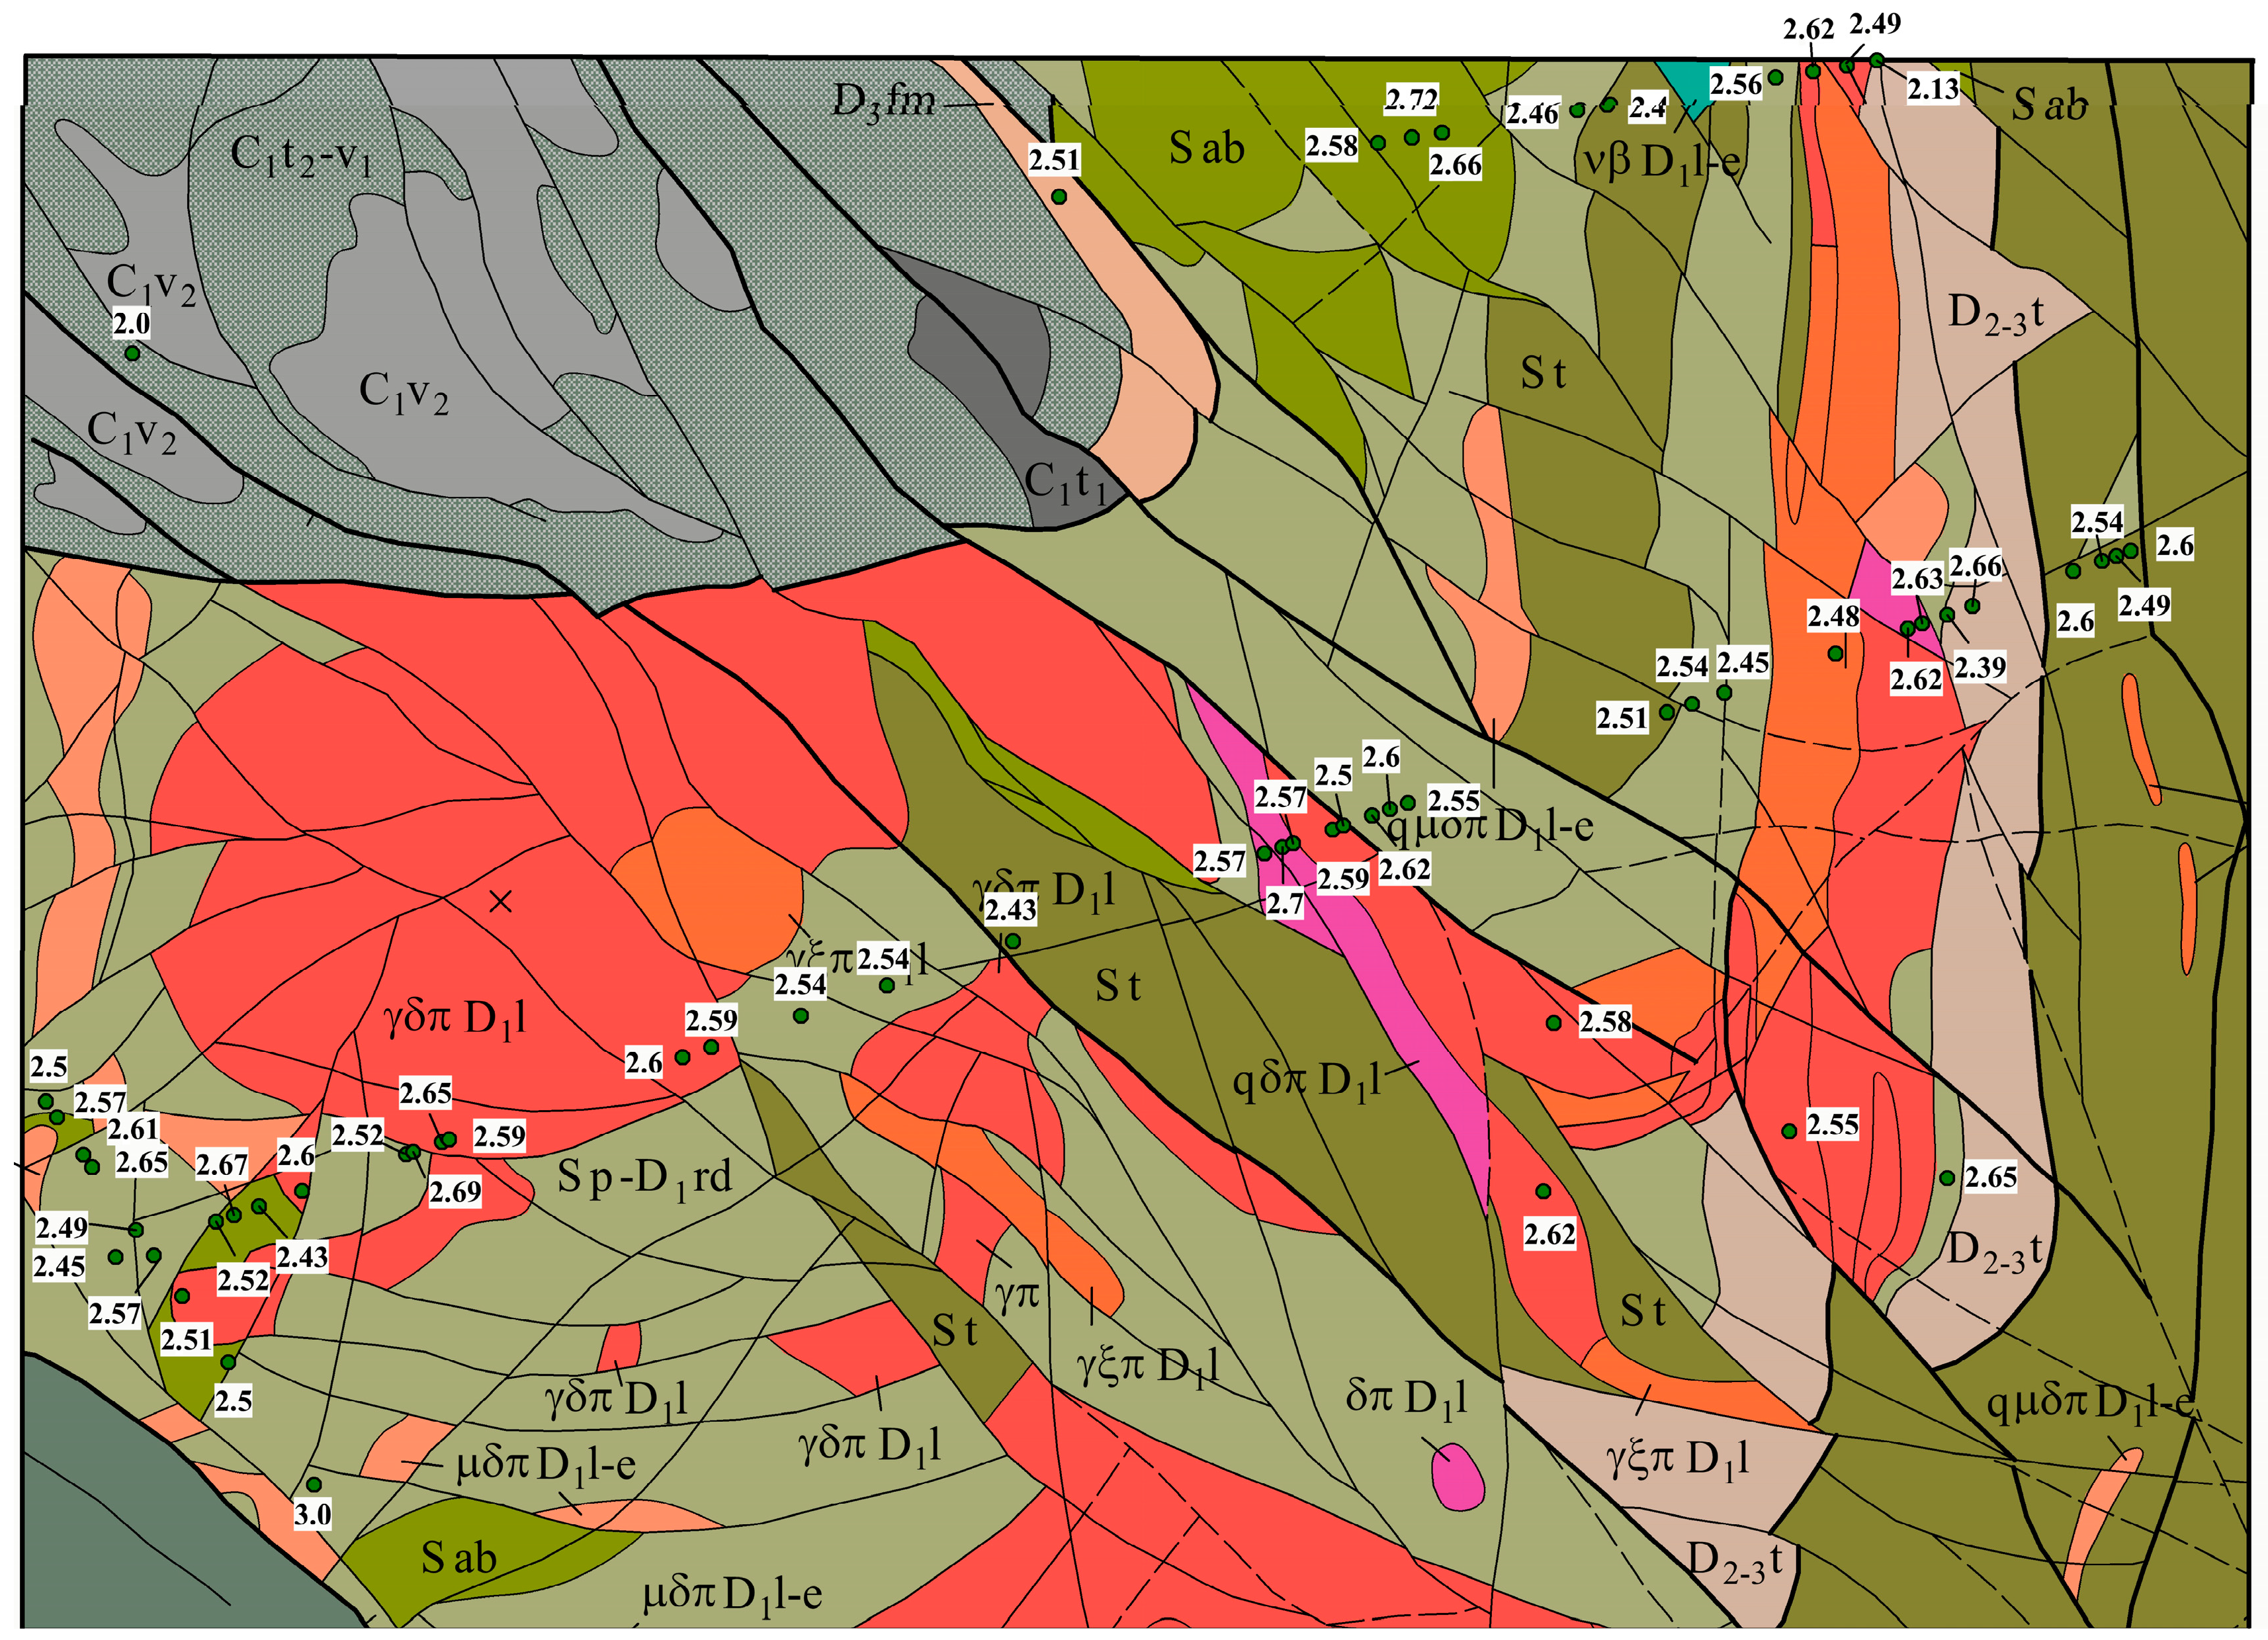
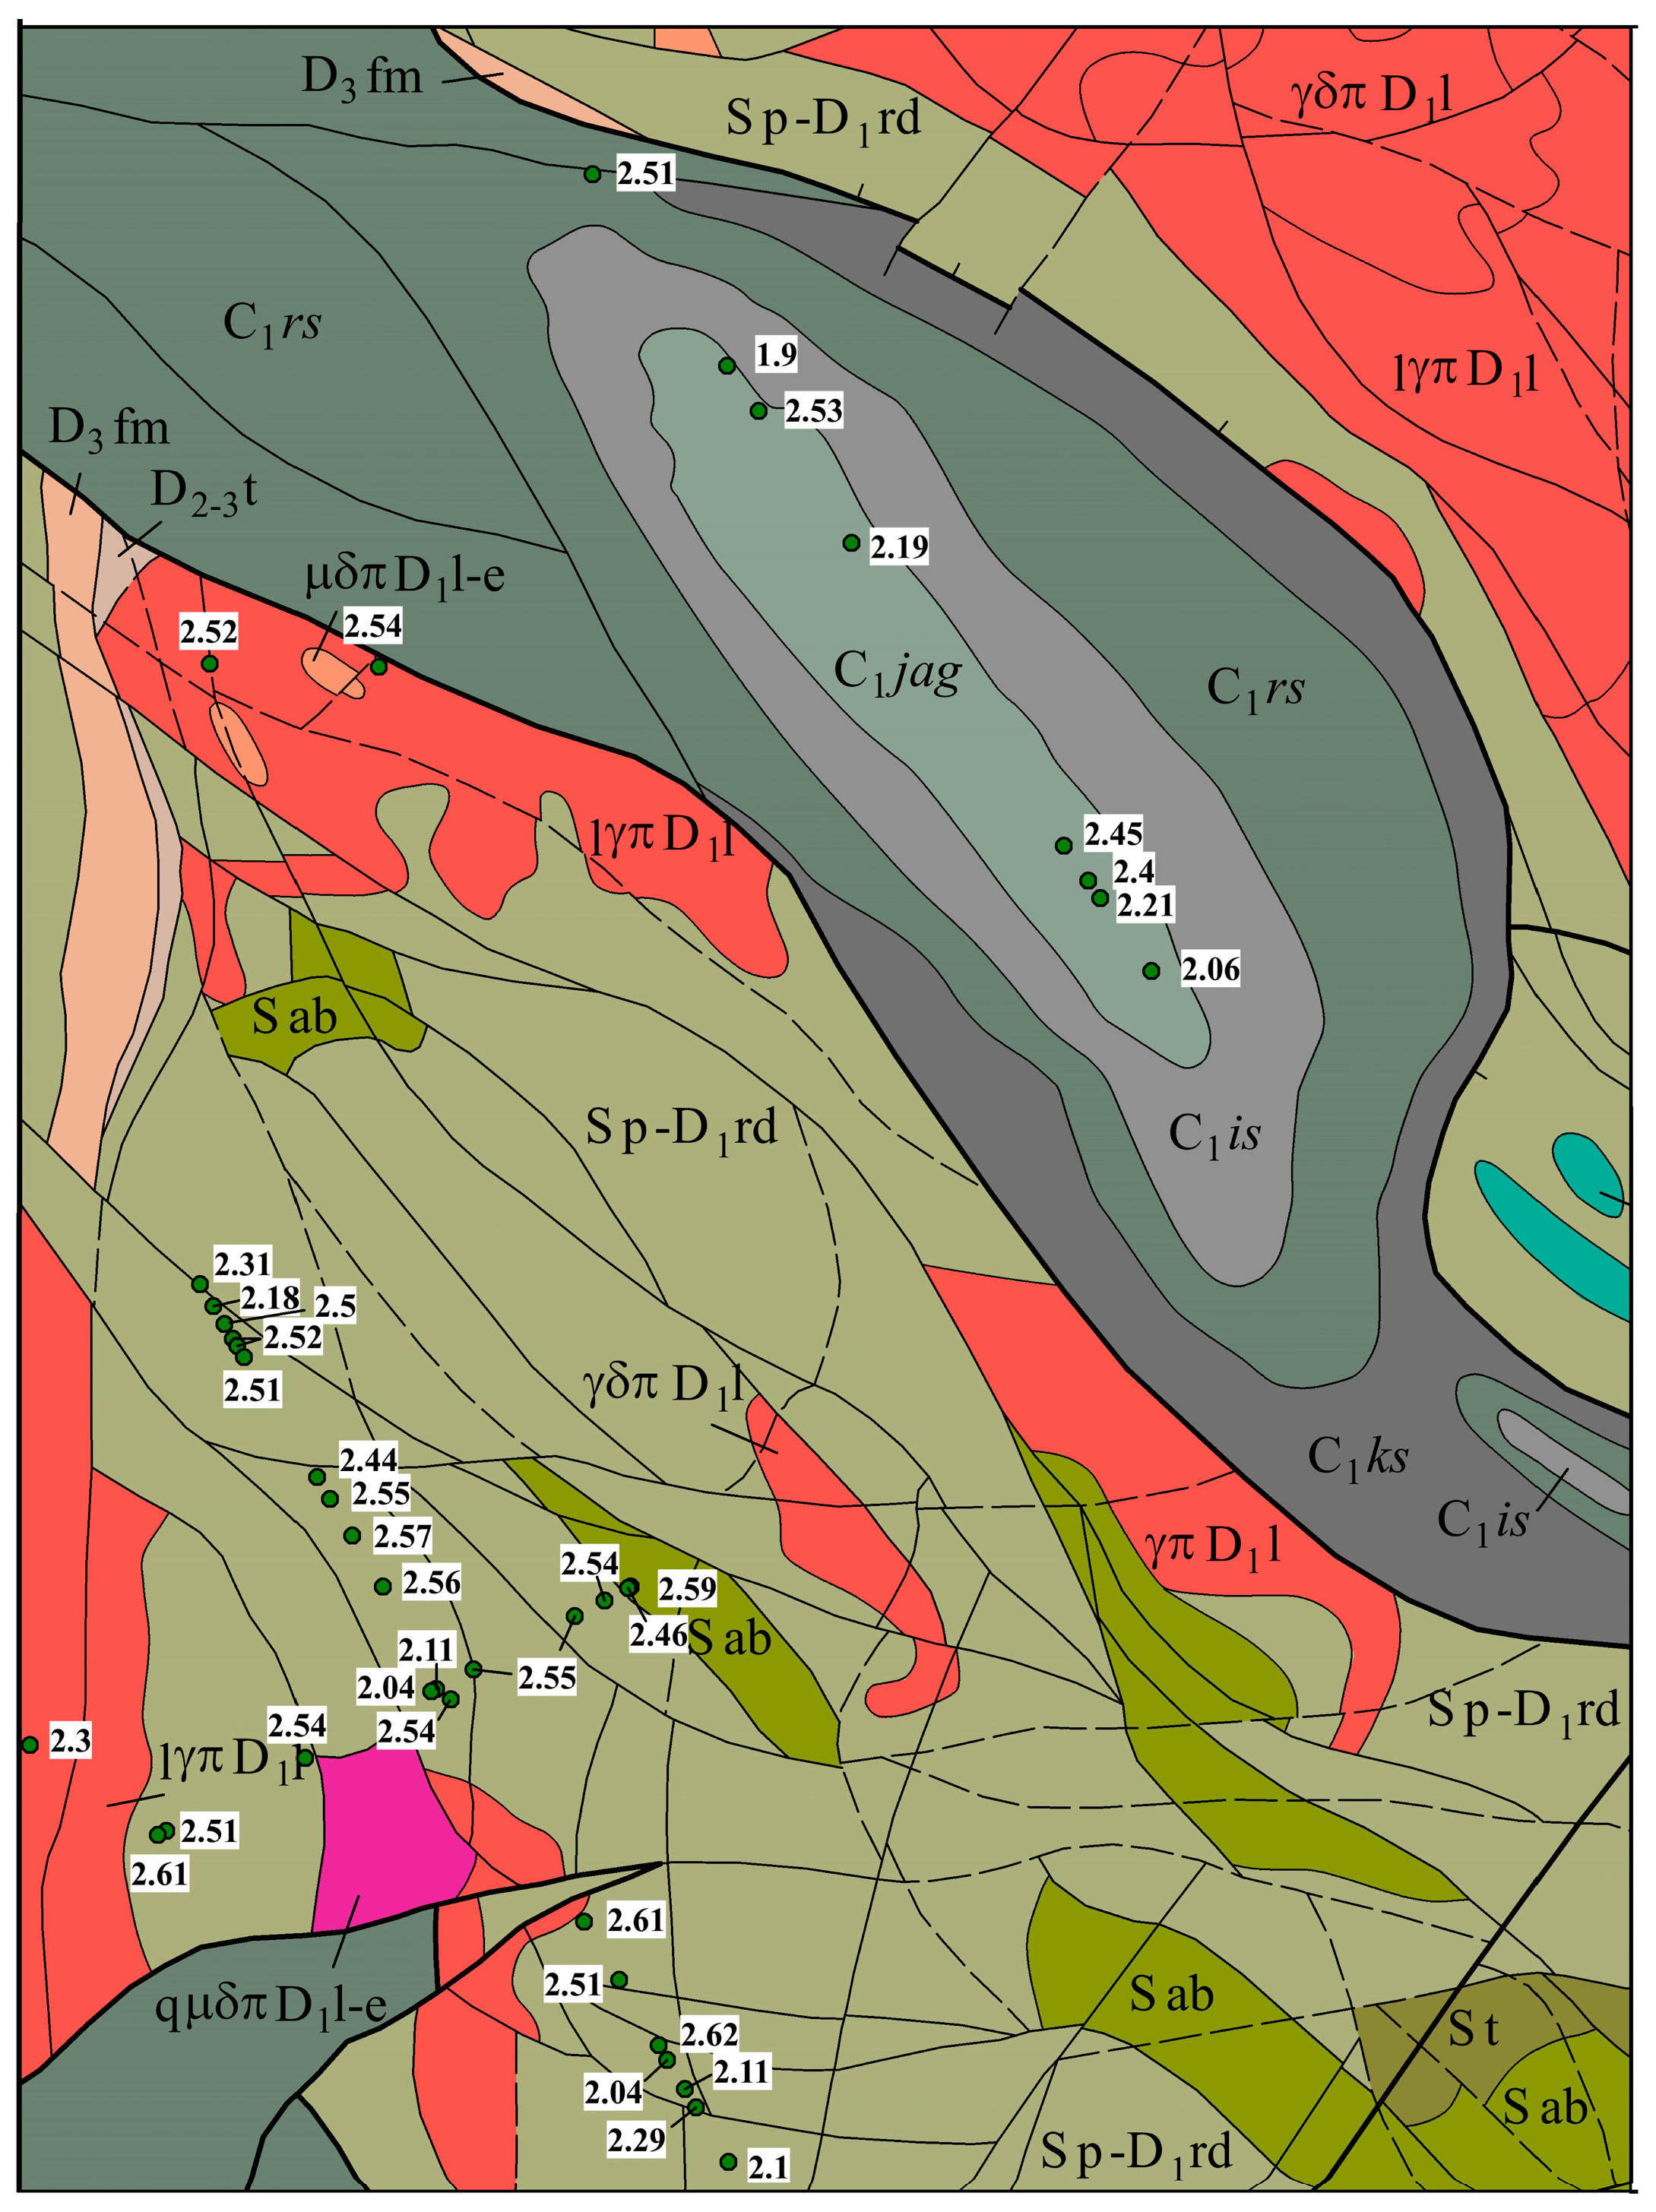
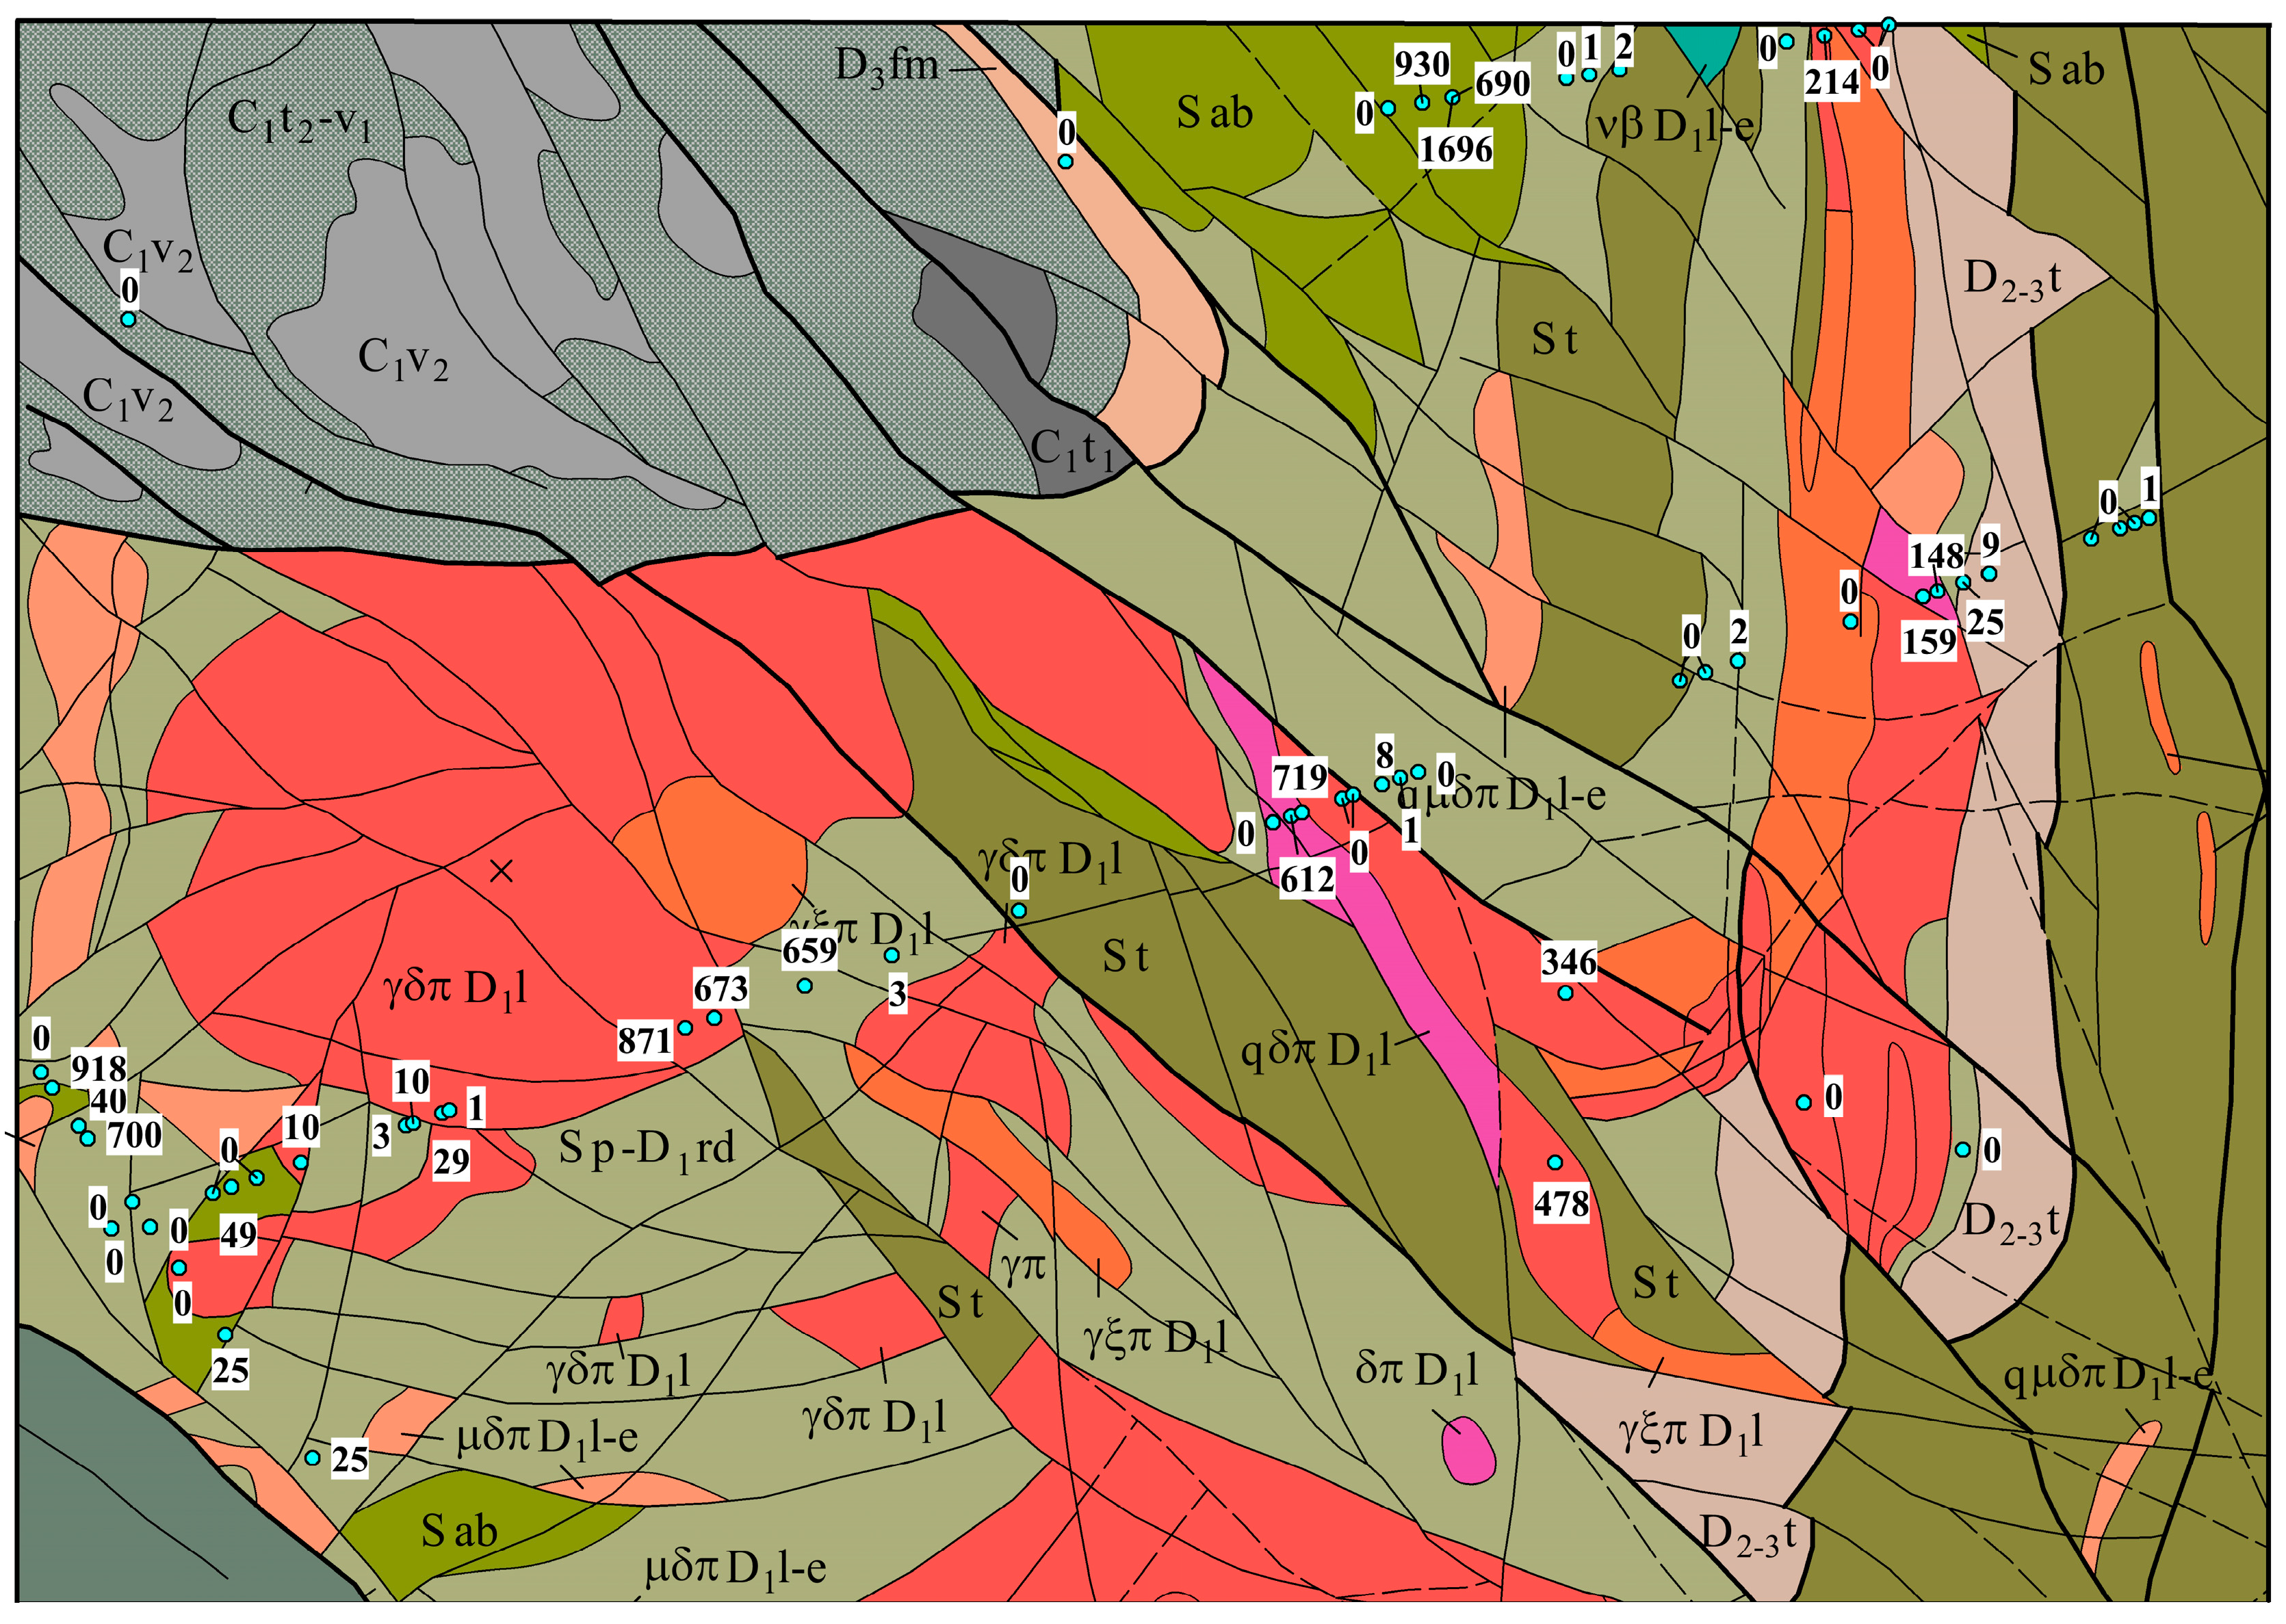
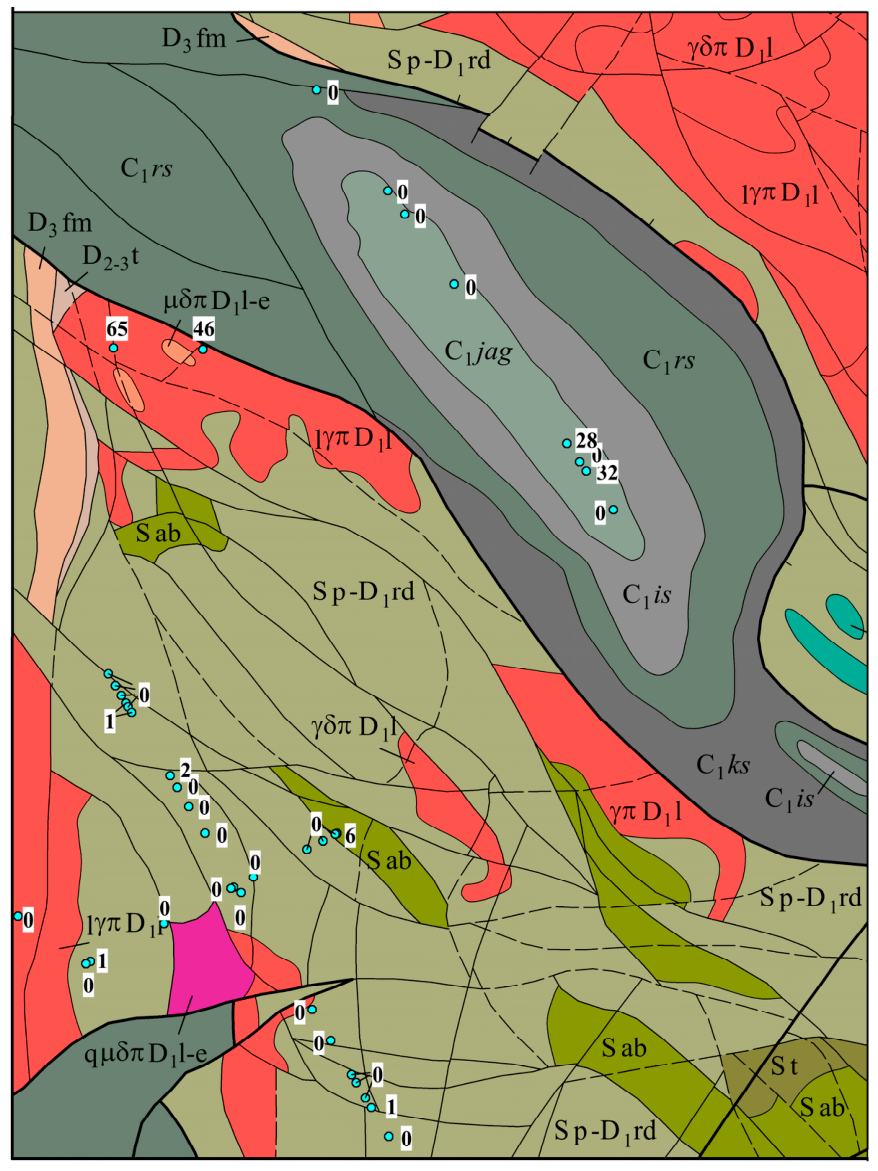
To evaluate the spatial distribution of the measured petrophysical parameters, density values were plotted on the geological base map of the study area. This representation allows the density characteristics to be compared with the main lithostratigraphic units, intrusive bodies, and structural elements shown on the geological map. The spatial pattern of density is presented in Figure 3, Figure 4 and Figure 5. It should be noted that the maps show aggregated values for the selected lithological units rather than the complete set of individual measurements for each sample.
Magnetic susceptibility was analyzed using the same geological base map as density, which allows the two parameters to be compared directly in space. In contrast to density, magnetic susceptibility shows a more pronounced separation between practically non-magnetic carbonate and terrigenous units and the more magnetically expressive volcanogenic and intrusive rocks. The spatial distribution of magnetic susceptibility is shown in Figure 6, Figure 7 and Figure 8.
To provide a clearer comparison of the petrophysical characteristics of individual lithological units, a paired diagram of weighted-average density and magnetic susceptibility values was constructed. This diagram complements the spatial distribution maps and illustrates differences between the units independently of their spatial position. Because the article presents aggregated values, Figure 9 should be interpreted as a comparison of mean characteristics of lithological units rather than as a statistical distribution of all individual samples.
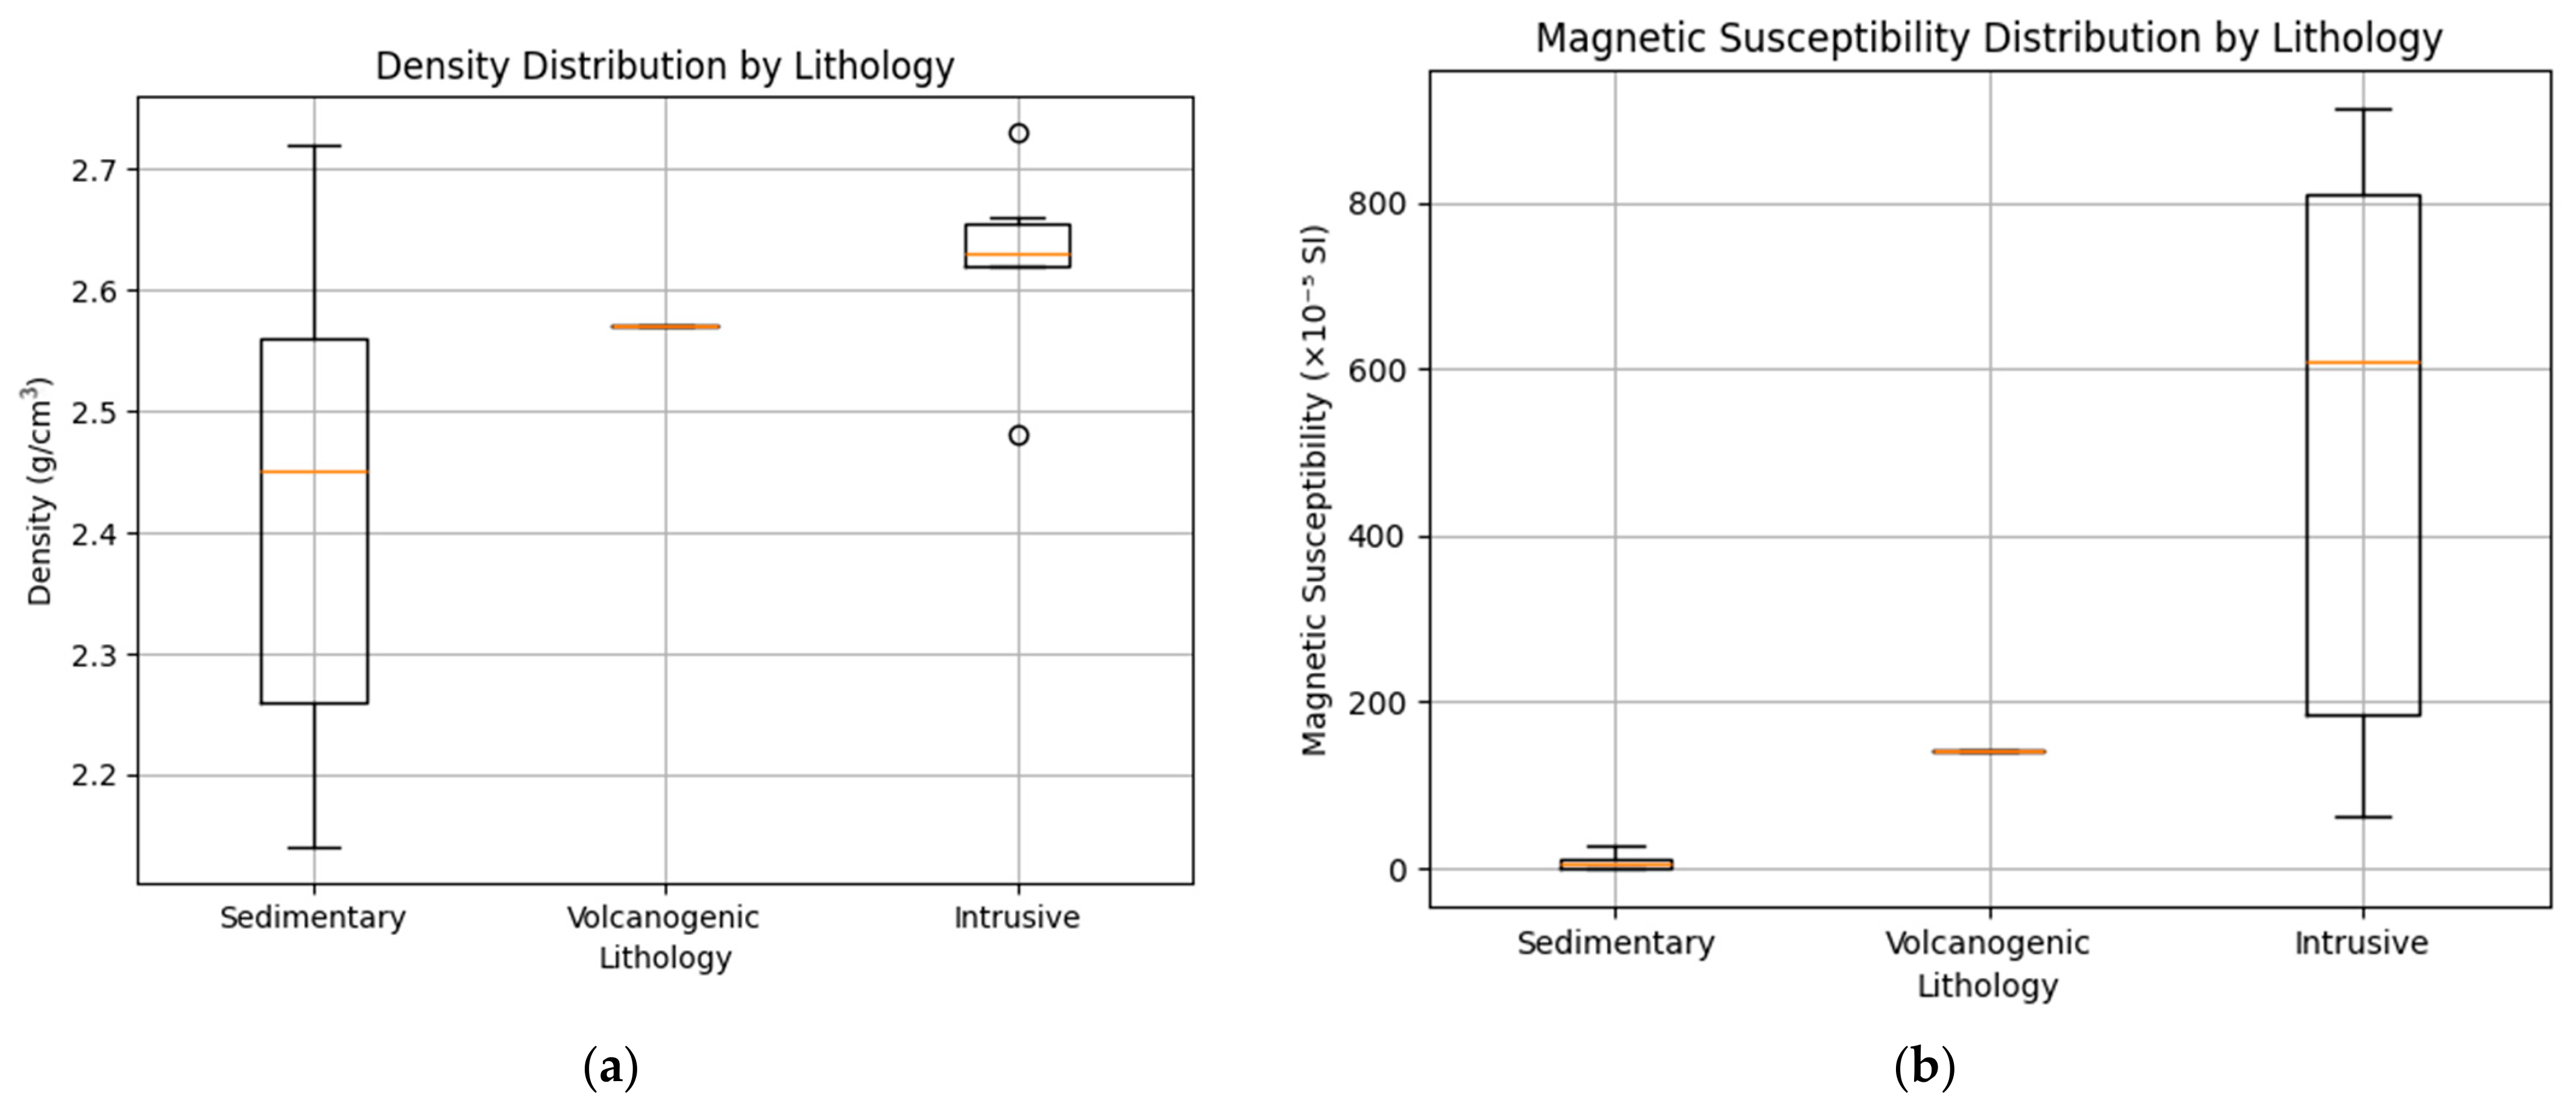
At the next stage, the lithological units were grouped into broader petrophysical categories: sedimentary and cover deposits, volcanogenic and volcanogenic–sedimentary rocks, and intrusive rocks. This grouping makes it possible to evaluate the differences between the main rock types and to determine which of the two parameters–density or magnetic susceptibility–provides better discrimination among the principal groups. A summary comparison of these groups is presented in Figure 10.

4.3. Bivariate Density–Magnetic Susceptibility Framework

At the level of broader rock groups, sedimentary and cover deposits have a weighted-average density of approximately 2.53 g/cm3 and a weighted-average magnetic susceptibility of 8 × 10⁻⁵ SI. Volcanogenic and volcanogenic–sedimentary rocks have a weighted-average density of approximately 2.70 g/cm3 and a magnetic susceptibility of 666 × 10−5 SI. Intrusive rocks are characterized by a weighted-average density of approximately 2.63 g/cm3 and a magnetic susceptibility of 561 × 10−5 SI.
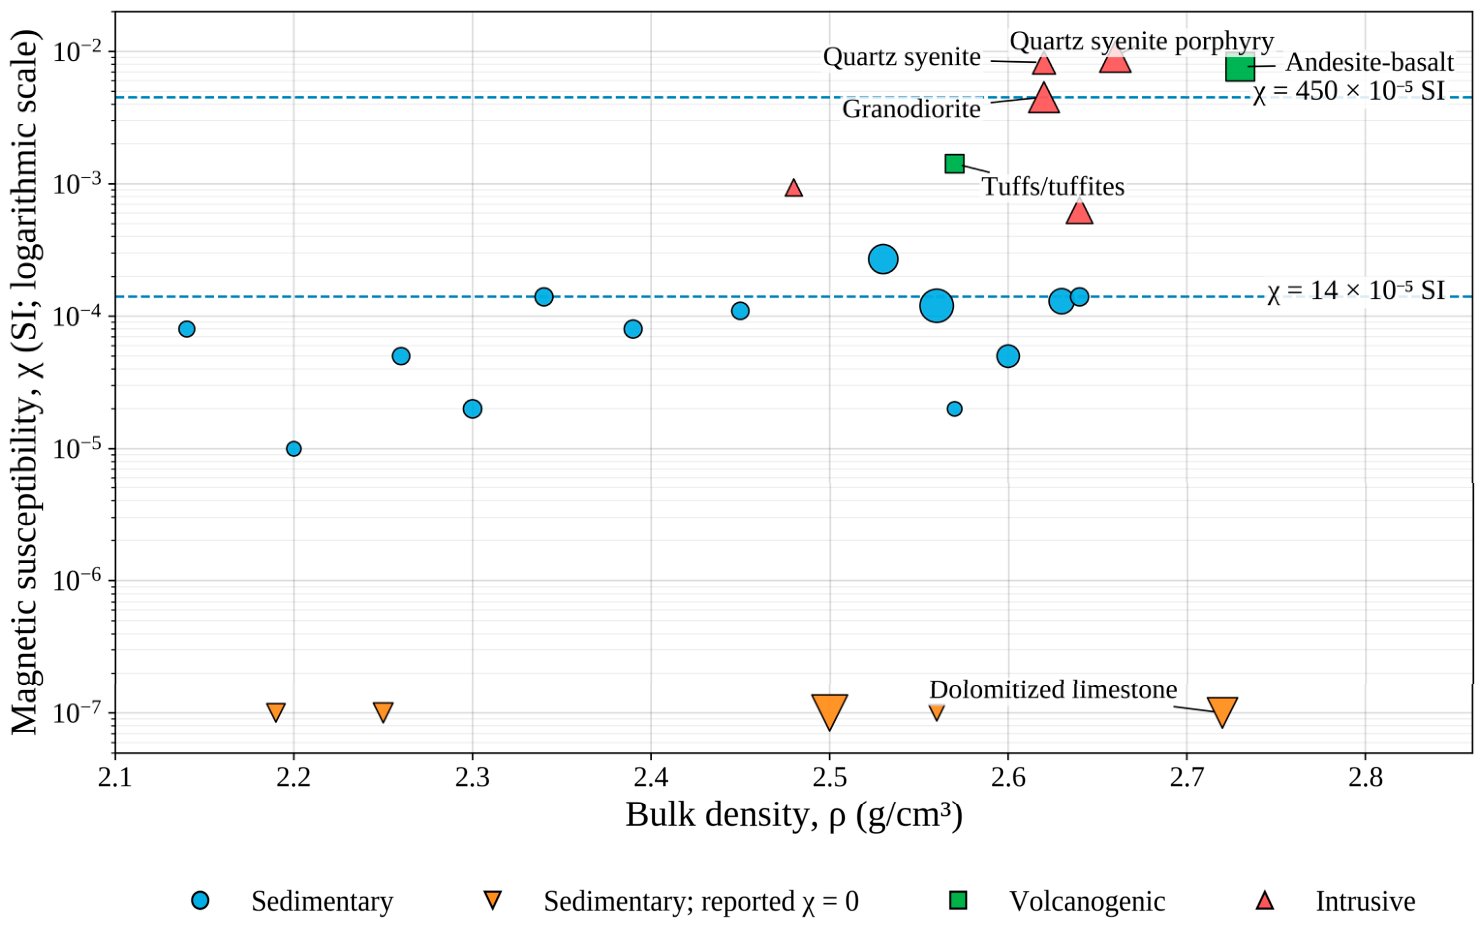
The density–magnetic susceptibility diagram divides the dataset into three practical fields (Figure 11). The first field comprises practically non-magnetic carbonate, mixed sedimentary, terrigenous, and cover rocks, with χ mostly ranging from 0 to 14 × 10−5 SI. The second field includes rocks with intermediate susceptibility, including tuffs, tuffites, leucogranite porphyries, and granodiorite porphyries, with χ values in the range of approximately 63–142 × 10−5 SI. The third field includes high-susceptibility rocks with χ > 450 × 10−5 SI, including granodiorites, andesite-basalts, quartz syenites, and quartz syenite porphyries.
Density values overlap substantially between the groups. Intrusive rocks occupy the interval range of 2.48–2.66 g/cm3, which overlaps with many sedimentary rocks, whereas dolomitized limestones of the Rusakov Suite reach 2.72 g/cm3 at χ = 0 × 10−5 SI. Thus, density alone does not provide an unambiguous classification of the main lithological groups, whereas magnetic susceptibility more clearly separates carbonate-dominated units from the most magnetically expressive magmatic rocks.

5. Discussion

5.1. Lithological Control of Petrophysical Contrasts

The results indicate that the main petrophysical contrasts in the southeastern part of the Sarysu–Teniz uplift are controlled primarily by lithological composition, the degree of carbonatization, dolomitization, and silicification, and the presence of magnetite-bearing mineral phases in volcanogenic and intrusive rocks. The most consistent feature of the dataset is the sharp contrast between practically non-magnetic carbonate and mixed sedimentary units and the volcanogenic–intrusive assemblages characterized by elevated magnetic susceptibility [18,23,24,25,26,31,32,34,35,36,37,38,39].
The Upper Devonian and Lower Carboniferous carbonate-dominated units are characterized mainly by very low magnetic-susceptibility values, commonly in the range of 0–14 × 10−5 SI. At the same time, their density may vary substantially. For example, marls of the Rusakov Suite have a weighted-average density of approximately 2.14 g/cm3, whereas limestones and dolomitized limestones of the same suite reach 2.72 g/cm3 while remaining practically non-magnetic. This indicates that an increase in density in carbonate rocks is not necessarily accompanied by an increase in magnetic susceptibility. The most likely causes of this decoupling are dolomitization, silicification, compaction, and changes in pore space, which affect density but do not produce a significant increase in ferro- or ferrimagnetic mineral content.
In contrast to the carbonate sequences, volcanogenic and intrusive rocks form the most magnetically expressive group. Andesite-basalts have a density of approximately 2.73 g/cm3 and a magnetic susceptibility of about 766 × 10−5 SI. Quartz syenites and quartz syenite porphyries are characterized by magnetic-susceptibility values of a range of approximately 823–913 × 10−5 SI, whereas granodiorites have a value of approximately 452 × 10−5 SI. According to the classification of L.D. Bersudsky, values in the range of 700–3000 × 10−5 SI correspond to magnetic rocks, whereas the interval of 100–700 × 10−5 SI corresponds to weakly magnetic rocks. Therefore, in the present study, the threshold of χ > 450 × 10−5 SI should not be regarded as a universal boundary for “magnetic rocks”, but rather as a local empirical criterion for elevated magnetic susceptibility relative to the sedimentary–carbonate background of the area. Values of χ ≥ 700 × 10−5 SI, established for andesite-basalts, quartz syenites, and quartz syenite porphyries, correspond to magnetic rocks in the Bersudsky classification.
Thus, density and magnetic susceptibility reflect different aspects of lithological heterogeneity. Density is sensitive to composition, compaction, dolomitization, silicification, and the presence of dense minerals, whereas magnetic susceptibility is more directly related to the abundance of magnetite-bearing phases. These parameters should therefore not be interpreted in isolation: their combined use makes it possible to distinguish dense but practically non-magnetic carbonate rocks from dense, magnetically expressive volcanogenic–intrusive rocks [31,33].

5.2. Bivariate Interpretation of Density and Magnetic Susceptibility

The Henkel-type plot confirms that density alone is not an unambiguous lithological criterion for the study area (Figure 11). In the density–magnetic susceptibility diagram, sedimentary, carbonate, and intrusive rocks partly overlap in density, especially within the interval of approximately 2.48–2.66 g/cm3. This means that a positive gravity anomaly or a gravity-gradient zone cannot automatically be interpreted as evidence of an intrusive body or an ore-bearing zone [24,25].
The most illustrative example is provided by the dolomitized limestones of the Rusakov Suite. Their density reaches 2.72 g/cm3, which is comparable to that of andesite-basalts and higher than the density of several intrusive rock types, whereas their magnetic susceptibility remains close to zero. Such rocks may therefore generate or enhance gravity contrasts, but they are not expected to produce corresponding magnetic highs. By contrast, quartz syenites, quartz syenite porphyries, and andesite-basalts are characterized by both elevated density and high magnetic susceptibility, which allows them to be associated with magnetic anomalies or sharp magnetic gradients [32,50].
This bivariate framework is important for the interpretation of potential fields. Gravity anomalies reflect integrated density contrasts and may be caused by both magmatic bodies and dense carbonate or dolomitized sequences. Magnetic anomalies, in contrast, respond more selectively to magnetite-bearing volcanogenic and intrusive rocks. Therefore, the most reliable interpretation is achieved through the combined analysis of density, magnetic susceptibility, lithology, the position of faults and contacts, and drilling and geochemical data.

5.3. Comparison with the Zhezkazgan Ore District

Comparison with the Zhezkazgan ore district shows that the patterns identified in the southeastern part of the Sarysu–Teniz uplift have regional significance for Central Kazakhstan, although they are expressed under different geological and ore-forming conditions. The Zhezkazgan district is one of the best-studied ore districts in Central Kazakhstan, where petrophysical parameters have been used to analyze the density, magnetic, electrical, and seismic properties of rocks, as well as to interpret deeply buried productive horizons and concealed ore-prospective structures [18]. In that study, physical properties were systematized at the level of formations, suites, and lithological heterogeneities, and their variations were related to rock composition, formation conditions, porosity, structural and textural features, changes in mineral composition, brecciation, fracturing, and mineralization processes.
The main similarity between the two districts is that sedimentary and carbonate–terrigenous complexes form a low-magnetic background in both cases. In the Zhezkazgan district, terrigenous sedimentary and carbonate–terrigenous sequences are generally characterized by low magnetic susceptibility: values in the range of approximately 1–60 × 10−5 SI are reported for a large part of the sedimentary succession, whereas Lower Carboniferous rocks have values in the range of about 3–48 × 10−5 SI [18]. In the southeastern part of the Sarysu–Teniz uplift, a similar role is played by the Upper Devonian and Lower Carboniferous carbonate and mixed sedimentary units, which are characterized by values in the range of 0–14 × 10−5 SI. This similarity confirms that low magnetic susceptibility of the carbonate–terrigenous background is a stable regional feature.
A second important similarity concerns the ambiguity of density-based interpretation. In the Zhezkazgan district, the weighted-average density of the succession from the Upper Devonian to the Upper Permian is approximately 2.62 g/cm3, whereas ore-hosting or productive units are distinguished by only a small positive density contrast. For example, the average density is about 2.70 g/cm3 for the Taskuduk Suite, about 2.68 g/cm3 for the Zhezkazgan Suite, and about 2.66 g/cm3 for the Kingir Suite; at the same time, the density of individual dense marls may reach 2.72 g/cm3 [18]. In the present study area, dolomitized limestones of the Rusakov Suite also reach a density of 2.72 g/cm3 while remaining practically non-magnetic. This comparison shows that density highs in Central Kazakhstan may be associated not only with intrusive bodies, but also with dense carbonate, marly, or dolomitized sequences.
The difference between the two districts lies in the type of ore system and the role of magmatic bodies. The Zhezkazgan district is primarily associated with stratiform copper mineralization localized in gray-colored horizons of the Zhezkazgan and Taskuduk suites within a large synclinal structure. Mineralization there is controlled by productive sedimentary horizons, structural nodes, flexures, deep-seated faults, and zones of increased fracturing. In the southeastern part of the Sarysu–Teniz uplift, a different exploration context is considered, one that is more carbonate–magmatic and structurally/contact-controlled and is related to Atasu-type mineralization and associated polymetallic systems. Here, the elevated magnetic susceptibility of volcanogenic and intrusive rocks has more direct significance for mapping magmatic bodies, contacts, and potential pathways for ore-bearing fluids.
At the same time, the general logic of petrophysical interpretation is similar in both districts. In the Zhezkazgan district, a reliable geological interpretation of geophysical anomalies depends on the completeness of information on the physical properties of rocks and their stratigraphic, spatial, and depth distribution. The same principle is applied in the present study: density and magnetic susceptibility are not treated as independent indicators of ore bodies, but as parameters that link lithology, structure, and potential-field geophysical responses.

5.4. Consistency with the Gravity and Magnetic Fields

Comparison with the Bouguer gravity anomaly map provides a first-order field-scale check of the laboratory density determinations. In the study area, the gravity field reflects the combined effect of density contrasts between cover deposits, carbonate sequences, volcanogenic formations, and intrusive bodies. The Bouguer gravity anomaly map, calculated using an intermediate-layer density of 2.67 g/cm3, is shown in Figure 12 [40,41,42,43,44].
A semi-quantitative consistency check was performed by comparing the petrophysical classes with mapped geology, intrusive bodies, faults, and the available ground gravity and magnetic survey information summarized in geological exploration reports [36,37,38,39,40]. This check does not replace formal forward modeling, but it evaluates whether the measured contrasts in physical rock properties are sufficient to explain the expected geophysical expression of the mapped units (Table 3).
The consistency check confirms three practical interpretations. First, samples with elevated magnetic susceptibility are concentrated in mapped intrusive and andesite–basalt domains, i.e., in the units most likely to produce magnetic highs or sharp magnetic gradients. Second, dense carbonate rocks may reach densities comparable to, or higher than, those of intrusive rocks while remaining non-magnetic; this explains why gravity interpretation must take magnetic susceptibility and geological control into account. Third, the most useful exploration signal is the coincidence of elevated magnetic susceptibility or sharp magnetic gradients with faults, intrusive or volcanic contacts, carbonate host rocks, and independent geochemical data or indications of mineralization. Such a multi-criteria interpretation is more robust than using magnetic susceptibility alone as a direct indicator of ore.
Comparison with the Zhezkazgan district confirms this interpretational problem. In Zhezkazgan, density boundaries within the stratigraphic succession are associated with both negative and positive gravity effects. For example, a density deficit at the base of the Famennian–Carboniferous deposits is linked to negative gravity anomalies, whereas increased density in some carbonate–terrigenous and productive sequences may generate local positive gravity effects. In addition, intrusive bodies may produce different gravity expressions depending on their composition and density contrast with the host succession.
For the southeastern part of the Sarysu–Teniz uplift, this means that a positive Bouguer anomaly or a sharp gravity gradient should be regarded as evidence of density heterogeneity, but not as a direct indicator of an intrusion or mineralization. Dense dolomitized limestones may produce a gravity effect without a corresponding magnetic response, whereas andesite-basalts, quartz syenites, quartz syenite porphyries, and granodiorites are expected to be more magnetically expressive bodies. Therefore, the most informative zones are those where gravity gradients coincide with elevated magnetic susceptibility, mapped or inferred faults, contacts between carbonate and magmatic rocks, and geochemical or drilling evidence of mineralization [48,51].
This approach represents a semi-quantitative consistency check rather than full forward modeling. Rigorous modeling would require regular digital grids of gravity and magnetic fields, depth constraints from geological sections, and data on remanent magnetization. Nevertheless, even the comparison of aggregated petrophysical classes with the Bouguer anomaly map and structural framework substantially reduces interpretational ambiguity compared with the use of either the geological map alone or a table of physical properties alone.

5.5. Petrophysical Indicators of Mineralization and the Source–Transport–Trap Model

From the perspective of exploration interpretation, the established petrophysical contrasts should be regarded not as direct indicators of ore bodies, but as indicators of favorable structural–lithological conditions. Elevated to high magnetic susceptibility in the study area primarily indicates the presence of magnetite-bearing volcanogenic and intrusive rocks. Such rocks may mark magmatic bodies, contact zones, possible heat sources, or mechanically competent structural blocks that control deformation and permeability.
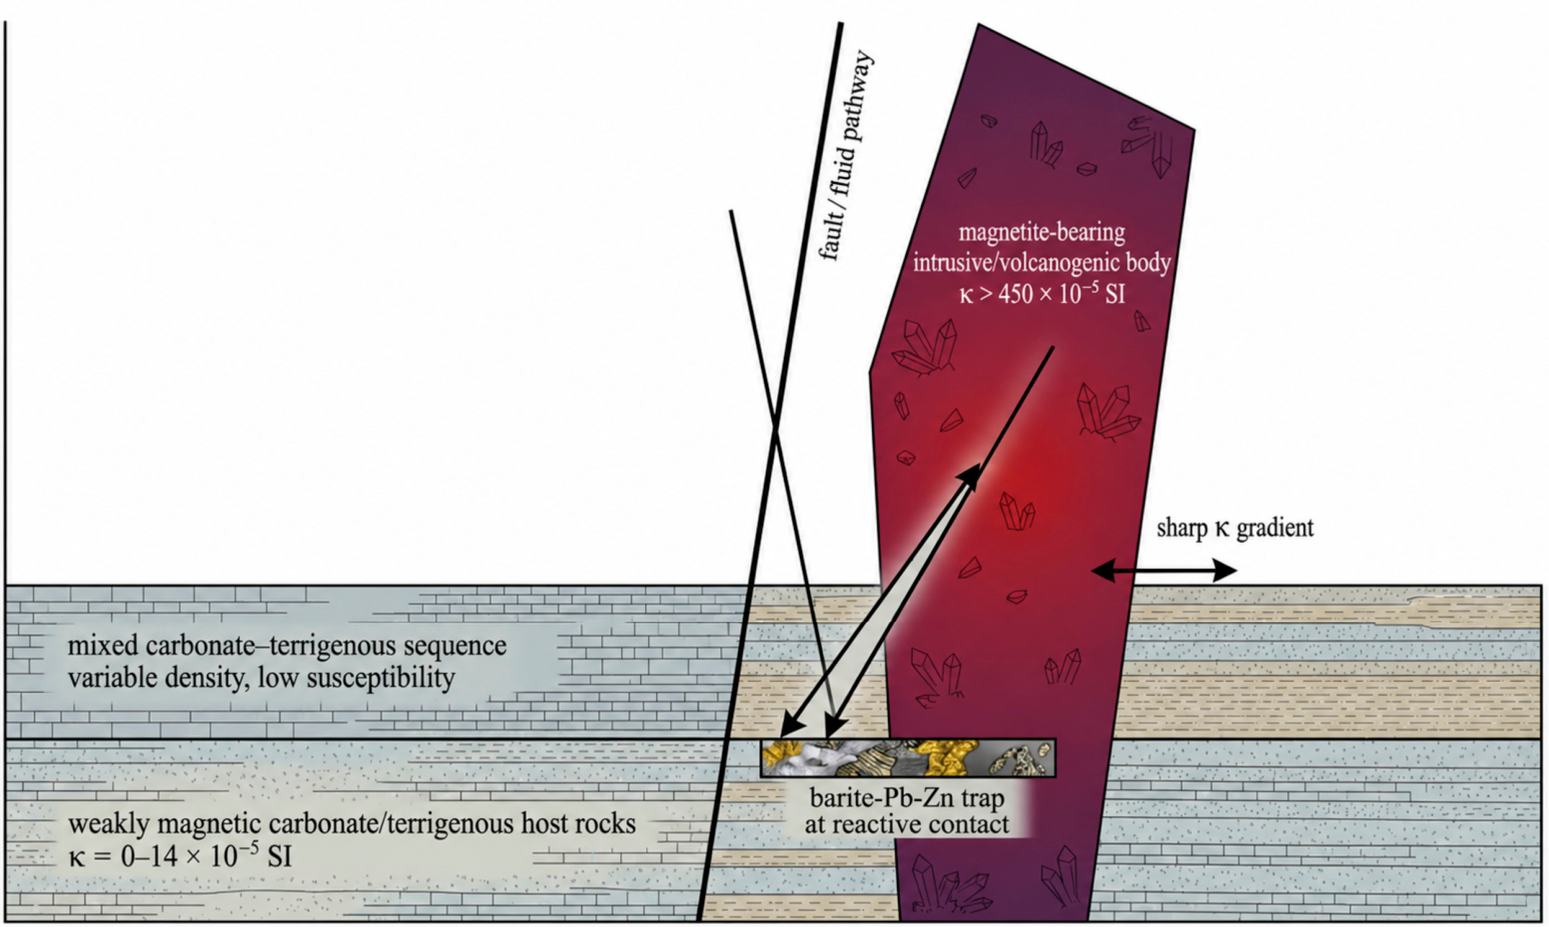
In the proposed source–transport–trap model, volcanogenic–intrusive complexes are considered as potential sources of heat, magmatic influence, and structural preparation of the host environment. Faults and fracture zones act as possible pathways for ore-bearing fluids. Carbonate and carbonate–terrigenous sequences, especially within contact zones and structurally disrupted domains, may serve as chemically reactive and permeable traps. In this framework, the most prospective areas are not simply magnetic highs, but zones where several criteria coincide: elevated magnetic susceptibility relative to the local background, sharp lithological or magnetic gradients, proximity to faults, contacts with practically non-magnetic carbonate units, and independent geochemical or drilling evidence of mineralization [7,8,9,10,19,20,21,22].
Atasu-type barite–lead–zinc and related polymetallic mineralization in Central Kazakhstan is commonly associated with structurally controlled carbonate and volcanogenic–sedimentary settings [7,8,9,10,11,12,13]. The petrophysical data can therefore be translated into a source–transport–trap exploration model (Figure 13). Magnetically expressive volcanic and intrusive rocks mark potential heat sources, magmatic bodies, mechanically competent units, or magnetite-bearing alteration zones. Faults and contacts provide possible pathways for fluid migration. Carbonate and carbonate–terrigenous rocks represent chemically reactive host rocks and create permeability contrasts that may localize replacement or stratiform mineralization [32,50,51].
In this model, a sharp magnetic-susceptibility gradient at a carbonate–volcanogenic or carbonate–intrusive contact is significant only where it coincides with structural corridors, known mineral occurrences, geochemical anomalies, or favorable stratigraphic horizons. The most applicable criterion derived from the dataset is χ > 450 × 10−5 SI for magnetically expressive magmatic rocks, especially where they occur adjacent to practically non-magnetic carbonate units where χ = 0–14 × 10−5 SI. Values in the range of 766–913 × 10−5 SI indicate the highest-susceptibility andesite–basalt or quartz syenite porphyry assemblages in the dataset. However, such high values should be interpreted as indicators of lithology and possible magmatic or alteration-related processes, rather than as evidence of ore mineralization itself [32,51].
Comparison with the Zhezkazgan district confirms the importance of this multi-criteria approach. In Zhezkazgan, mineralization is not controlled by a single physical parameter, but by a combination of factors, including productive horizons, structural nodes, deep-seated faults, porosity, fracturing, changes in rock structure and texture, and variations in mineral composition. This is consistent with the results of the present study: density and magnetic susceptibility help to identify potentially important lithological and structural elements, but the final ranking of exploration targets requires the integrated consideration of geological, geophysical, geochemical, and drilling data.
In practical terms, the most justified exploration criteria for the southeastern part of the Sarysu–Teniz uplift are as follows: (1) a practically non-magnetic carbonate background where χ = 0–14 × 10−5 SI; (2) zones of elevated magnetic susceptibility relative to this background, especially where χ > 450 × 10−5 SI; (3) magnetic rocks according to the Bersudsky classification, where χ ≥ 700 × 10−5 SI, represented primarily by andesite-basalts, quartz syenites, and quartz syenite porphyries; (4) sharp contacts between magnetically expressive volcanogenic–intrusive bodies and practically non-magnetic carbonate rocks; and (5) the coincidence of such contacts with faults, gravity gradients, geochemical anomalies, or known mineral occurrences.

5.6. Limitations of Interpretation and Directions for Further Research

Despite the informative nature of the obtained results, they should be considered in light of several limitations. First, this article presents aggregated values by lithostratigraphic and lithological groups rather than the full set of individual sample-level measurements. Therefore, the reported intervals characterize weighted-average values for the selected units and the main lithological contrasts, but they do not replace a complete statistical analysis of all individual samples with calculation of medians, standard deviations, interquartile ranges, and confidence intervals. Consequently, statistical measures of variability, such as standard deviations and confidence intervals, cannot be reported because only aggregated values are available for the present study, whereas the original individual laboratory measurements were not preserved.
Second, natural remanent magnetization was not determined in the present study. For most practically non-magnetic carbonate and terrigenous units, this limitation is not critical; however, for andesite-basalts and intrusive rocks, remanent magnetization may affect both the amplitude and the position of magnetic anomalies. Consequently, the interpretation of magnetic highs should be based not only on measured magnetic susceptibility, but also on the geological position of the body, anomaly shape, drilling data, and, where possible, future paleomagnetic or detailed magnetic investigations.
Third, the comparison with the Bouguer gravity anomaly map is semi-quantitative. It demonstrates consistency between rock-density contrasts and the gravity field, but it does not replace forward modeling or 3D inversion. Experience from the Zhezkazgan district shows that the reliable interpretation of complex ore districts is substantially improved when petrophysical data are integrated with gravity, magnetic, electrical, and seismic methods. In future work on the southeastern part of the Sarysu–Teniz uplift, it would be useful to expand the database of individual petrophysical measurements; include determinations of remanent magnetization, electrical resistivity, chargeability, and elastic-wave velocities; and perform quantitative modeling of gravity and magnetic profiles across the most prospective zones [48,52,53,54,55,56].
Overall, a comparison with the Zhezkazgan ore district shows that petrophysical characteristics are not merely supplementary reference data, but an essential component of the geological interpretation of potential fields and mineral prospectivity assessment. For the southeastern part of the Sarysu–Teniz uplift, the most important conclusion is that density and magnetic susceptibility should be used jointly: density helps to evaluate gravity contrasts and possible dense carbonate or magmatic bodies, whereas magnetic susceptibility provides a more reliable basis for distinguishing practically non-magnetic carbonate host rocks from magnetically expressive volcanogenic and intrusive assemblages. This integrated framework provides the most justified basis for ranking exploration targets for Atasu-type mineralization and related polymetallic systems.

6. Conclusions

Based on the petrophysical analysis and the comparison of the obtained data with the geological framework and gravity–magnetic field of the study area, the following conclusions can be drawn:
  • The compiled dataset records density values ranging from 2.14 to 2.73 g/cm3 and magnetic susceptibility values ranging from 0 to 913 × 10−5 SI for the main sedimentary, volcanogenic, and intrusive rocks of the southeastern part of the Sarysu–Teniz uplift.
  • Carbonate and mixed sedimentary units are predominantly non-magnetic to practically non-magnetic, with χ mostly within the range of 0–14 × 10−5 SI. The maximum values are recorded in andesite-basalts and quartz syenite porphyries, where χ reaches a range of 766–913 × 10−5 SI. Granodiorites are also characterized by elevated magnetic susceptibility relative to the sedimentary–carbonate background, with an average χ value of approximately 452 × 10−5 SI.
  • Density alone is not an unambiguous lithological discriminator, because sedimentary and intrusive units overlap substantially, especially within the range of 2.48–2.66 g/cm3. Dolomitized limestones may reach densities of up to 2.72 g/cm3 while remaining non-magnetic. Therefore, the combined interpretation of density and magnetic susceptibility is required.
  • The identified petrophysical classes are consistent with the expected gravity–magnetic behavior of the mapped units. Volcanogenic and intrusive rocks with elevated magnetic susceptibility are expected to produce magnetic highs or gradients, whereas dense but practically non-magnetic carbonate rocks may influence the gravity field without producing a strong magnetic response.
  • For exploration targeting, the most reliable criterion is not an isolated magnetic anomaly, but the coincidence of several factors: (i) elevated magnetic susceptibility, especially χ > 450 × 10−5 SI; (ii) faults or sharp lithological contacts; (iii) practically non-magnetic carbonate host rocks where χ = 0–14 × 10−5 SI; and (iv) independent geochemical evidence, drilling data, or known mineral occurrences. This criterion can be used to rank targets for Atasu-type mineralization and related polymetallic systems, provided that magnetic susceptibility is treated as an indirect lithological and alteration-related indicator rather than as a direct indicator of ore.

Author Contributions

Conceptualization, K.T., G.Z. and N.Z.; methodology, K.T. and N.Z.; software, D.M., A.T. and A.Z.; validation, K.T., N.Z. and D.M.; formal analysis, A.T.; investigation, G.Z.; resources, A.T. and A.Z.; data curation, K.T.; writing–original draft preparation, K.T., G.Z., N.Z., D.M., A.T. and A.Z.; writing–review and editing, K.T. and N.Z.; visualization, N.Z. and A.Z.; supervision, K.T.; project administration, G.Z.; funding acquisition, K.T. All authors have read and agreed to the published version of the manuscript.

Funding

This research is funded by the Committee of Science of the Ministry of Science and Higher Education of the Republic of Kazakhstan (Grant No. BR27199165—Scientific substantiation of the expansion and replenishment of mineral resources of priority and critical minerals as the basis for the innovative development of Kazakhstan).

Data Availability Statement

Data are contained within this article.

Conflicts of Interest

The authors declare no conflicts of interest. Aizere Zhumabay is employee of Volkovgeology JSC. The paper reflects the views of the scientists and not the company. The funders had no role in the design of this study; in the collection, analyses, or interpretation of data; in the writing of this manuscript, or in the decision to publish the results.

References

  1. Dentith, M.; Enkin, R.J.; Morris, W.; Adams, C.; Bourne, B. Petrophysics and mineral exploration: A workflow for data analysis and a new interpretation framework. Geophys. Prospect. 2020, 68, 178–199. [Google Scholar] [CrossRef]
  2. Henkel, H. Standard diagrams of magnetic properties and density–A tool for understanding magnetic petrology. J. Appl. Geophys. 1994, 32, 43–53. [Google Scholar] [CrossRef]
  3. Enkin, R.J.; Hamilton, T.S.; Morris, W.A. The Henkel petrophysical plot: Mineralogy and lithology from physical properties. Geochem. Geophys. Geosyst. 2020, 21, e2019GC008818. [Google Scholar] [CrossRef]
  4. Eshaghi, E.; Vayavur, R.; Smith, R.S.; Mancuso, C.; Della Justina, F.; Ayer, J. Density and magnetic susceptibility of major rock types within the Abitibi Greenstone Belt: A compilation with examples of its use in constraining inversion. Explor. Geophys. 2023, 54, 647–669. [Google Scholar] [CrossRef]
  5. Malehmir, A.; Durrheim, R.; Bellefleur, G.; Urosevic, M.; Juhlin, C.; White, D.J.; Milkereit, B.; Campbell, G. Seismic methods in mineral exploration and mine planning: A general overview of past and present case histories and a look into the future. Geophysics 2012, 77, WC173–WC190. [Google Scholar] [CrossRef]
  6. Telford, W.M.; Geldart, L.P.; Sheriff, R.E. Applied Geophysics, 2nd ed.; Cambridge University Press: Cambridge, UK, 1990. [Google Scholar]
  7. Hunt, C.P.; Moskowitz, B.M.; Banerjee, S.K. Magnetic properties of rocks and minerals. In Rock Physics and Phase Relations: A Handbook of Physical Constants; Ahrens, T.J., Ed.; American Geophysical Union: Washington, DC, USA, 1995; Volume 3, pp. 189–204. [Google Scholar] [CrossRef]
  8. Sanger, E.A.; Glen, J.M.G. Density and Magnetic Susceptibility Values for Rocks in the Talkeetna Mountains and Adjacent Region, South-Central Alaska; U.S. Geological Survey Open-File Report 2003-268; U.S. Geological Survey: Reston, VA, USA, 2003. [CrossRef]
  9. Hameed, F.; Khan, M.R.; Tian, J.; Bilal, M.A.; Wang, C.; Wang, Y.; Mughal, M.S.; Niaz, A. Geological significance of bulk density and magnetic susceptibility of the rocks from Northwest Himalayas, Pakistan. Minerals 2025, 15, 781. [Google Scholar] [CrossRef]
  10. Tütünsatar, H.E.; Elitok, Ö.; Yilmaz, M.; Dolmaz, M.N. Mineralogical and petrographical constraints on the magnetic susceptibility of alkaline igneous rocks: A case study from the Gölcük Volcano (Isparta), Turkey. Proc. Natl. Acad. Sci. India Sect. A–Phys. Sci. 2023, 93, 553–563. [Google Scholar] [CrossRef]
  11. Arasada, R.C.; Kumar, S.; Rao, G.S.; Biswas, A.; Sahoo, P.R.; Singh, S. A fuzzy C-means clustering approach for petrophysical characterization of lithounits in the North Singhbhum Mobile Belt, Eastern India. Acta Geophys. 2025, 73, 439–455. [Google Scholar] [CrossRef]
  12. Kurskeev, A.K. Handbook of Physical Properties of Rocks of Kazakhstan; Nauka: Alma-Ata, Kazakhstan, 1977; 245p. [Google Scholar]
  13. Benevolensky, I.P.; Volozh, Y.A.; Lyapichev, G.F.; Patalakha, E.I. Petrophysical characteristics of geological bodies of structural-formational zones. In Petrophysics of Geological Formations, Balkhash Segment; Nauka: Alma-Ata, Kazakhstan, 1988; pp. 34–79. [Google Scholar]
  14. Dortman, N.B. Petrophysics: Handbook. Rocks and Useful Minerals; Nedra: Moscow, Russia, 1992; 391p. [Google Scholar]
  15. Kobranova, V.N. Petrophysics: Textbook for Universities; Nedra: Moscow, Russia, 1986; 392p. [Google Scholar]
  16. Dobrynin, V.M.; Vendelshtein, B.Y.; Kozhevnikov, D.A. Petrophysics (Rock Physics), 2nd ed.; Gubkin Russian State University of Oil and Gas: Moscow, Russia, 2004; 368p. [Google Scholar]
  17. Amralinova, B.B.; Togizov, K.S.; Nukhuly, A.; Zhumabay, N.Z.; Yessengeldina, A.Y. The nature of the Karasor-Lisakov magnetic anomaly and identification of promising areas for magnetite ore deposits in Kazakhstan. News Natl. Acad. Sci. Repub. Kazakhstan Ser. Geol. Tech. Sci. 2025, 5, 31–54. [Google Scholar] [CrossRef]
  18. Ivanov, O.V. Geology of Central Kazakhstan; Nauka KazSSR: Alma-Ata, Kazakhstan, 1969; Volume 3, 229p. [Google Scholar]
  19. Bekzhanov, G.R.; Koshkin, V.Y.; Nikitchenko, I.I.; Skrinnik, L.I.; Azizov, T.M.; Timush, A.V. Geological Structure of Kazakhstan; Academy of Mineral Resources of the Republic of Kazakhstan: Almaty, Kazakhstan, 2000; 396p. [Google Scholar]
  20. Koshkin, V.Y.; Rakishev, B.M.; Uzhkenov, B.S.; Tsirelson, B.S. Tectonic Map of Kazakhstan, Scale 1:1,000,000; Satpayev Institute of Geological Sciences: Astana, Kazakhstan, 2007. [Google Scholar]
  21. Bakhteev, M.K.; Vasyukov, Y.A.; Sorokina, I.M. Famennian volcanism of the western part of Central Kazakhstan. Sov. Geol. 1977, 4, 79–89. [Google Scholar]
  22. Bakhteev, M.K.; Vasyukov, Y.A. Structural-facies zonality and tectonic history of the Atasu ore district (Central Kazakhstan) in the Devonian. Izv. VUZov. Geol. I Razved. 1980, 2, 51–59. [Google Scholar]
  23. Mazarovich, O.A.; Veimarn, A.B.; Velikovskaya, E.M. Devon of the northern flank of the Sarysu-Teniz uplift and southern flank of the Teniz depression. In Questions of Geology of Central Kazakhstan; Moscow State University: Moscow, Russia, 1971; Volume 10, pp. 270–302. [Google Scholar]
  24. Buzmakov, E.I.; Shchibrik, V.I. Stratigraphy and lithology of Famennian and Tournaisian deposits of the Atasu ore district. Sov. Geol. 1976, 2, 63–79. [Google Scholar]
  25. Shchibrik, V.A.; Mityaev, N.M.; Taranushich, F.F. Barite-lead-zinc deposits of the Atasu district. In Volcanogenic-Sedimentary Litho- and Ore Genesis; Nauka: Alma-Ata, Kazakhstan, 1981; pp. 96–106. [Google Scholar]
  26. Mitryaeva, N.M. Mineralogy of Barite-Lead-Zinc Ores of Deposits of the Atasu District; Nauka KazSSR: Alma-Ata, Kazakhstan, 1979; 220p. [Google Scholar]
  27. Puchkov, E.V.; Naidenov, B.M. Formation of stratiform lead-zinc deposits of the Atasuy type. Mod. Geol. 1984, 1, 33–40. [Google Scholar]
  28. Askarova, N.; Portnov, V.; Blyalova, G.; Madisheva, R.; Dyakonov, V. Geology and minerageny of the Bestobe deposit (Central Kazakhstan). Kompleks. Ispolz. Miner. Syra Complex Use Miner. Resour. 2022, 321, 22–30. [Google Scholar] [CrossRef]
  29. Askarova, N.S.; Portnov, V.S.; Rakhimova, G.M.; Maussymbayeva, A.D.; Madisheva, R.K. Mathematical model of the formation of barite-lead mineralization of the Ushkatyn III deposit (Central Kazakhstan). Kompleks. Ispolz. Miner. Syra Complex Use Miner. Resour. 2024, 329, 43–53. [Google Scholar] [CrossRef]
  30. Yessendossova, A.; Mykhailov, V.; Maussymbayeva, A.; Portnov, V.; Mynbaev, M. Features of the geological structure and polymetallic mineralization of the Uspensky (Central Kazakhstan) and Dalnegorsky (Far East) ore districts. Iraqi Geol. J. 2023, 56, 44–60. [Google Scholar] [CrossRef]
  31. Ibyrkhanova, A.I.; Glukhov, A.M.; Portnov, V.S.; Ibyrkhanov, T.S.; Baikenzhina, A.Z. New data of the age of the Sarysu-Teniz Uplift intrusive complexes, Kazakhstan. Iraqi Geol. J. 2025, 58, 278–294. [Google Scholar] [CrossRef]
  32. Zhuravlev, A.N.; Tretyakov, A.A.; Kanygina, N.A.; Degtyarev, K.E. Iron ore series of the Sarysu-Teniz Watershed (Central Kazakhstan): Age justification and formation environment. Dokl. Earth Sci. 2025, 522, 235–241. [Google Scholar] [CrossRef]
  33. Sharapatov, A.; Kabdsikhova, G.A.; Assirbek, N.A.; Saduov, A.B. Density and magnetic characteristics of rocks in the eastern part of the Sarysu-Teniz uplift (Central Kazakhstan). Gorn. Zhurnal Kazakhstana 2024, 4, 15–19. [Google Scholar]
  34. Kamaliden, A.S. Petrographic characteristics of volcanogenic-sedimentary rocks of the Sarysu-Teniz uplift. Young Sci. 2020, 14, 126–130. [Google Scholar]
  35. Issayeva, L.; Istekova, S.; Tolybaeva, D.; Togizov, K.; Saurykov, Z.; Issagaliyeva, A. Petrophysical characteristics of geological formations of the Zhezkazgan Ore District (Kazakhstan) and their relationship with mineralization. Minerals 2025, 15, 1106. [Google Scholar] [CrossRef]
  36. Kuz’mina, O.N.; D’yachkov, B.A.; Vladimirov, A.G.; Kirillov, M.V.; Redin, Y.O. Geology and mineralogy of East Kazakhstan gold-bearing jasperoids: The Baybura Ore Field example. Russ. Geol. Geophys. 2013, 54, 1471–1483. [Google Scholar] [CrossRef]
  37. Kovalev, K.R.; Kuzmina, O.N.; Dyachkov, B.A.; Vladimirov, A.G.; Kalinin, Y.A.; Naumov, E.A.; Kirillov, M.V.; Annikova, I.Y. Disseminated gold-sulfide mineralization at the Zhaima deposit, East Kazakhstan. Geol. Ore Depos. 2016, 58, 134–153. [Google Scholar] [CrossRef]
  38. Mizernaya, M.A.; Miroshnikova, A.P.; Pyatkova, A.P.; Akilbaeva, A.T. The main geological-industrial types of gold deposits in East Kazakhstan. Sci. Bull. Natl. Min. Univ. 2019, 5, 5–10. [Google Scholar] [CrossRef]
  39. Omirserikov, M.S.; Duczmal-Czernikiewicz, A.; Isaeva, L.D.; Asubaeva, S.K.; Togizov, K.S. Forecasting resources of rare metal deposits based on the analysis of ore-controlling factors. News Natl. Acad. Sci. Repub. Kazakhstan Ser. Geol. Tech. Sci. 2017, 3, 35–43. [Google Scholar]
  40. Antonyuk, R.M. Geological Additional Survey at 1:200,000 Scale in the Zhairem-Ushkatyn Mining District, Sheets M-42-XXXIV-XXXV, 2010–2012; Tsentrgeolsyomka JSC: Karaganda, Kazakhstan, 2012. [Google Scholar]
  41. Glevasskiy, E.B.; Glevasskaya, A.M. Geological Map of the USSR at Scale 1:200,000, Sheet L-42-IV, Explanatory Note; TsKGU: Karaganda, Kazakhstan, 1961. [Google Scholar]
  42. Kolesnik, A.P.; Koval, A.P. Geological Structure and Mineral Resources of Sheets M-42-127-V, M-42-138-B, M-42-139-A,V. Report on Geological Survey and Prospecting at 1:50,000 Scale for 1969–1971; TsKGU: Karaganda, Kazakhstan, 1972. [Google Scholar]
  43. Tastanbekov, D. Geological Structure and Mineral Resources of Sheets M-42-127-A and M-42-139-B,G. Report on Geological Survey and Prospecting at 1:50,000 Scale for 1976–1979; Zhairem Geological Exploration Expedition: Zhairem, Kazakhstan, 1979. [Google Scholar]
  44. Turchenyuk, L.I. Geological Structure and Mineral Resources of the Atasu Ore District. Report on Geological Survey and Prospecting at 1:50,000 Scale for 1975–1979; Zhairem Geological Exploration Expedition: Zhairem, Kazakhstan, 1979. [Google Scholar]
  45. Sirazhev, A.; Istekova, S.; Tolybaeva, D.; Togizov, K.; Temirkhanova, R. Methodology and results of detailed 3D seismic exploration in the Zhezkazgan Ore District. Appl. Sci. 2025, 15, 567. [Google Scholar] [CrossRef]
  46. Istekova, S.; Aidarbekov, Z.; Togizov, K.; Tolybayeva, D.; Temirkhanova, R. Lithophysical characteristics of productive strata of cupriferous sandstone within Zhezkazgan ore district in Central Kazakhstan. Min. Miner. Depos. 2024, 18, 9–17. [Google Scholar] [CrossRef]
  47. Ablessenova, Z.; Issayeva, L.; Togizov, K.; Assubayeva, S.; Kurmangazhina, M. Geophysical indicators of rare-metal ore content of Akmai-Katpar ore zone (Central Kazakhstan). Sci. Bull. Natl. Min. Univ. 2023, 5, 34–40. [Google Scholar] [CrossRef]
  48. Cai, J.; Ma, G. Self-structural constraint joint inversion of aeromagnetic and gradient data: Enhanced imaging for gold deposits in Western Henan, China. Minerals 2025, 15, 337. [Google Scholar] [CrossRef]
  49. Bersudsky, L.D. Classification of Rocks by Magnetic Susceptibility; Methodological Materials; Ministry of Geology of the USSR: Moscow, Russia, 1963. [Google Scholar]
  50. Erbek-Kiran, E.; Aydemir, A.; Ateş, A.; Dolmaz, M.N. Geophysical investigation of the Antalya Magnetic Anomaly representing the westernmost link of a buried magmatic arc in the Eastern Mediterranean Sea. Acta Geod. Geophys. 2026, 61, 37–60. [Google Scholar] [CrossRef]
  51. Leng, C.B.; Wang, D.Z.; Yu, H.J.; Tian, F.; Zhang, X.C. Mapping hydrothermal alteration zones with short wavelength infrared (SWIR) spectra and magnetic susceptibility at the Pulang porphyry Cu-Au deposit, Yunnan, SW China. Miner. Depos. 2024, 59, 699–716. [Google Scholar] [CrossRef]
  52. Lowe, M.; Jordan, T.; Ebbing, J.; Koglin, N.; Ruppel, A.; Moorkamp, M.; Laeufer, A.; Green, C.; Liebsch, J.; Ginga, M.; et al. Comparing geophysical inversion and petrophysical measurements for northern Victoria Land, Antarctica. Geophys. J. Int. 2024, 239, 276–291. [Google Scholar] [CrossRef]
  53. Vallée, M.A.; Moussaoui, M.; Khan, K. Case studies of magnetic and electromagnetic techniques covering the last fifteen years. Minerals 2024, 14, 1286. [Google Scholar] [CrossRef]
  54. Kwan, K.; Reford, S. Innovative airborne geophysical strategies to assist the exploration of critical metal systems. Geosystems Geoenvironment 2024, 4, 100344. [Google Scholar] [CrossRef]
  55. Lu, S.; Xu, Y.; Guo, R.; Huang, S.; Zhang, Q.; Zhao, Y.; Liu, Y.; Wang, J.; Zhao, L. Integrating machine learning and petrophysical data for 3D ore body modeling: A case study of the Bayan Obo deposit. Pure Appl. Geophys. 2026, 183, 1107–1126. [Google Scholar] [CrossRef]
  56. Liu, S.; Hu, X.; Fedi, M.; Baniamerian, J.; Abbas, M.A.; Chauhan, M.S. Petrophysical and geophysical constrained inversion of gravity data based on starting and referenced models. J. Geophys. Eng. 2025, 22, 36–47. [Google Scholar] [CrossRef]
Figure 1. Tectonic overview map of Central Kazakhstan showing the position of the Sarysu–Teniz block-fold zone. I—Ulytau-Arganaty Mega-anticlininorium; II—Baikonyr-Ishim Mega-synclininorium; III—Stepnyak-Seletin Mega-synclininorium; IV—Chu-Ile Mega-anticlininorium; V—Sarysu-Teniz Block-Fold Zone; VI—Zhezkazgan Quasi-Synclinorium; VII—Teniz Quasi-Synclinorium; VIII—Karagandy Quasi-Synclinorium; IX—Atasu-Tekturmas Mega-anticlininorium; X—West Balkash Quasi-Synclinorium; XI—Atasu Quasi-Synclinorium; XII—Aktau-Mointy Mega-anticlininorium; XIII—Torgai Trough.
Minerals 16 00706 g001
Figure 2. Geological map of the study area showing the main lithostratigraphic units, intrusive bodies, faults, and structural framework. 1—QIV, modern Holocene alluvial and lacustrine deposits; 2—QIII–IV, Upper–modern Quaternary alluvial and alluvial–proluvial deposits; 3—QII–III, Middle–Upper Quaternary alluvial, alluvial–proluvial, and eolian deposits; 4—QI, Lower Quaternary alluvial–proluvial deposits; 5—N1–2 pv, Pavlodar Suite; 6—N1 zs, Zhamansarysu Suite; 7—P3 bt, Betpakdala Suite; 8—P2–3, Eocene–Oligocene deposits; 9—C1v2, Lower Carboniferous Visean upper substage; 10—C1jag, Yagovkin Suite; 11—C1is, Ishim Suite; 12—C1t2–v1, Upper Tournaisian–Lower Visean interval; 13—C1rs, Rusakov Suite; 14—C1ks, Kassin Suite; 15—C1t1, Lower Tournaisian substage; 16—D3fm, Upper Devonian Famennian carbonate unit; 17—D2–3t, Middle–Upper Devonian terrigenous sequence; 18—S p–D1rd, Silurian Pridoli–Lower Devonian rhyolite–dacite sequence; 19—S ab, Lower Silurian andesite–basalt sequence; 20—S t, Lower Silurian terrigenous sequence; 21—μδπD1l–e, Lochkovian–Emsian monzodiorite-porphyry intrusive rocks; 22—γδπD1l, Lochkovian granodiorite-porphyry intrusive rocks; 23—εlγπD1l, Lochkovian leucogranite-porphyry intrusive rocks; 24—qμδπD1l–e, Lochkovian–Emsian quartz monzodiorite-porphyry intrusive rocks.
Minerals 16 00706 g002
Figure 3. Spatial distribution of unit-level weighted-average bulk density in the study area. 1—C1v2, Visean sedimentary rocks; 2—C1jag, Yagovkin Suite; 3—C1is, Ishim Suite; 4—C1t2–v1, Tournaisian–Visean carbonate interval; 5—C1rs, Rusakov Suite; 6—C1ks, Kassin Suite; 7—C1t1, Lower Tournaisian limestones; 8—D3fm, Famennian carbonate unit; 9—D23t, Middle–Upper Devonian terrigenous sequence; 10—D12vt, Lower–Middle Devonian volcanogenic–terrigenous sequence; 11—Sp–D1rd, Pridoli–Lower Devonian rhyolite–dacite sequence; 12—Sab, Lower Silurian andesite–basalt sequence; 13—St, Lower Silurian terrigenous sequence; 14—δπD1l–e, diorite porphyrites; 15—qμδπD1l–e, quartz monzodiorite porphyrites; 16—νβD1l–e, mafic hypabyssal rocks; 17—γδπD1l, granodiorite porphyries; 18—εlγπD1l, leucogranite porphyries; 19—qδπD1l, quartz diorite porphyrites. Other symbols follow the original geological-map legend.
Minerals 16 00706 g003
Figure 4. Enlarged fragment 1 of the bulk-density distribution map.
Minerals 16 00706 g004
Figure 5. Enlarged fragment 2 of the bulk-density distribution map.
Minerals 16 00706 g005
Figure 6. Spatial distribution of unit-level weighted-average magnetic susceptibility in the study area. 1—C1v2, Visean sedimentary rocks; 2—C1jag, Yagovkin Suite; 3—C1is, Ishim Suite; 4—C1t2–v1, Tournaisian–Visean carbonate interval; 5—C1rs, Rusakov Suite; 6—C1ks, Kassin Suite; 7—C1t1, Lower Tournaisian limestones; 8—D3fm, Famennian carbonate unit; 9—D23t, Middle–Upper Devonian terrigenous sequence; 10—D12vt, Lower–Middle Devonian volcanogenic–terrigenous sequence; 11—Sp–D1rd, Pridoli–Lower Devonian rhyolite–dacite sequence; 12—Sab, Lower Silurian andesite–basalt sequence; 13—St, Lower Silurian terrigenous sequence; 14—δπD1l–e, diorite porphyrites; 15—qμδπD1l–e, quartz monzodiorite porphyrites; 16—νβD1l–e, mafic hypabyssal rocks; 17—γδπD1l, granodiorite porphyries; 18—εlγπD1l, leucogranite porphyries; 19—qδπD1l, quartz diorite porphyrites. Other symbols follow the original geological-map legend.
Minerals 16 00706 g006
Figure 7. Enlarged fragment 1 of the magnetic-susceptibility distribution map.
Minerals 16 00706 g007
Figure 8. Enlarged fragment 2 of the magnetic-susceptibility distribution map.
Minerals 16 00706 g008
Figure 9. Paired density–magnetic susceptibility diagram for the analyzed lithological units of the southeastern Sarysu–Teniz uplift.
Minerals 16 00706 g009
Figure 10. Distribution of petrophysical values by major rock group: (a) density; (b) magnetic susceptibility.
Minerals 16 00706 g010
Figure 11. Henkel-type density–magnetic susceptibility plot for the main lithological units of the southeastern Sarysu–Teniz uplift.
Minerals 16 00706 g011
Figure 12. Bouguer gravity anomaly map of the southeastern Sarysu–Teniz uplift.
Minerals 16 00706 g012
Figure 13. Conceptual source–transport–trap model for petrophysical exploration of Atasu-type and related polymetallic mineralization.
Minerals 16 00706 g013
Table 1. Lithostratigraphic and lithological units represented in the petrophysical dataset and used in the map legends.
CodeAge/UnitDominant LithologyPetrophysical GroupInterpretive Role
S1tLower Silurian terrigenous sequenceSandstones, siltstones, gravelitesSedimentary and cover depositsLow-susceptibility sedimentary background
S1tLower Silurian terrigenous sequenceTuffs and tuffitesVolcanogenic and volcanogenic–sedimentary rocksModerately magnetic volcaniclastic marker
SabLower Silurian andesite–basalt sequenceAndesite-basaltsVolcanogenic and volcanogenic–sedimentary rocksDense magnetic volcanic marker
D3fmUpper Devonian Famennian carbonate-bearing unitPelitomorphic and silicified limestones; calcareous siltstones; limestones, marls, dolomitesSedimentary and cover depositsPractically non-magnetic carbonate background; possible density contrasts related to dolomitization or silicification
C1t1Lower Carboniferous, Tournaisian stageLimestonesSedimentary and cover depositsPractically non-magnetic carbonate background; possible density contrasts related to dolomitization or silicification
C1t2–v1Lower Carboniferous, Tournaisian–Visean intervalLimestonesSedimentary and cover depositsPractically non-magnetic carbonate background; possible density contrasts related to dolomitization or silicification
C1t2–v1Lower Carboniferous, Tournaisian–Visean intervalSiltstonesSedimentary and cover depositsLow-susceptibility sedimentary background
C1ksLower Carboniferous, Kassin SuiteLimestonesSedimentary and cover depositsPractically non-magnetic carbonate background; possible density contrasts related to dolomitization or silicification
C1rsLower Carboniferous, Rusakov SuiteMarls; limestones and dolomitized limestonesSedimentary and cover depositsPractically non-magnetic carbonate background; possible density contrasts related to dolomitization or silicification
C1isLower Carboniferous, Ishim SuiteSandstones, limestones, marls; limestones, marls, calcareous siltstonesSedimentary and cover depositsMixed low-susceptibility sedimentary background
C1jagLower Carboniferous, Yagovkin SuiteSandstones, siltstones, mudstones, limestonesSedimentary and cover depositsMixed low-susceptibility sedimentary background
C1v2Lower Carboniferous, Visean stageSandstones, siltstones, mudstonesSedimentary and cover depositsLow-susceptibility sedimentary background
C1v2Lower Carboniferous, Visean stageLimestones; marlSedimentary and cover depositsPractically non-magnetic carbonate background; possible density contrasts related to dolomitization or silicification
P23–QCenozoic cover complexClays, gravel, sandstones, silicified argilliteSedimentary and cover depositsNear-surface cover with low density and low magnetic susceptibility
γδπD1lLochkovian hypabyssal intrusive complexQuartz syenites; quartz syenite porphyries and their breccias, early phase; granodiorite porphyries; granodioritesIntrusive rocksMagnetic intrusive marker and possible thermal/structural control
εlγπD1lLochkovian leucogranite-porphyry complexLeucogranite porphyries and their breccias, early phaseIntrusive rocksMagnetic intrusive marker and possible thermal/structural control
Table 2. Unit-level weighted-average bulk density and magnetic susceptibility of the analyzed lithological groups in the southeastern Sarysu–Teniz uplift.
Unit CodeLithologyN (Density)Density (g/cm3)N (Magnetic Susceptibility)Magnetic Susceptibility (χ 10−5 SI)
Lower Silurian–Terrigenous sequence
S1tSandstones, siltstones, gravelites512.535127
S1tTuffs and tuffites92.579142
Lower Silurian–Andesite-basalt sequence
SabAndesite-basalts472.7347766
Upper Devonian
D3fmPelitomorphic and silicified limestones; calcareous siltstones282.633213
D3fmLimestones, marls, dolomites42.5640
Lower Carboniferous–Tournaisian-Visean
C1t1Limestones62.45611
C1t2–v1Limestones82.3988
C1t2–v1Limestones922.5920
C1t2–v1Siltstones132.25130
Lower Carboniferous–Kassin Suite
C1ksLimestones82.64814
C1ksLimestones12.5712
Lower Carboniferous–Rusakov Suite
C1rsMarls32.1438
C1rsLimestones, dolomitized limestones572.72570
Lower Carboniferous–Ishim Suite
C1isSandstones, limestones, marls52.34814
C1isLimestones, marls, calcareous siltstones12.211
Lower Carboniferous–Yagovskin Suite
C1jagSandstones, siltstones, mudstones, limestones62.2665
C1v2Sandstone, siltstones, mudstones752.567512
C1v2Limestones212.6215
C1v2Marl92.1990
KZ complex
P2–3-QClays, gravel, sandstones, silicified argillite92.392
Intrusive formations–Lochkovian hypabyssal intrusive complex
γδπD1lQuartz syenites232.6223823
γδπD1lQuartz syenite porphyries and their breccias (early phase)632.6663913
γδπD1lGranodiorite porphyries382.643863.13
γδπD1lGranodiorites602.6260451.88
εlγπD1lLeucogranite porphyries and their breccias (early phase)62.48694
Table 3. Semi-quantitative consistency matrix linking petrophysical classes, lithology, and expected gravity–magnetic responses.
Petrophysical ClassMeasured RangeExpected Magnetic ResponseExpected Gravity ResponseExploration Significance
Carbonate, marly, and mixed sedimentary backgroundDensity: 2.14–2.72 g/cm3; χ = 0–14 × 10−5 SIPractically non-magnetic background; magnetic highs related to induced magnetization are not expectedVariable; dense dolomitized or silicified carbonates may generate local gravity contrastsReactive host rocks and potential trap horizons; prospective only where structural and/or geochemical evidence is present
Terrigenous sedimentary rocksDensity: 2.25–2.56 g/cm3; χ = 0–27 × 10−5 SILow magnetic responseLow to moderate gravity responseBackground units; useful for identifying lithological contacts
Tuffs and tuffitesDensity: 2.57 g/cm3; χ = 142 × 10−5 SIModerate magnetic response or magnetic gradientModerate gravity responseVolcaniclastic marker; may indicate proximity to volcanic or intrusive systems
Andesite-basaltsDensity: 2.73 g/cm3; χ = 766 × 10−5 SIStrong magnetic response expectedLikely positive contribution to the gravity fieldPriority marker where coincident with faults and carbonate contacts
Lochkovian intrusive rocksDensity: 2.48–2.66 g/cm3; χ = 63–913 × 10−5 SIModerate to strong magnetic highs or gradients, especially over quartz syenite and granodiorite bodiesGravity response may be ambiguous because of density overlap with carbonate rocksPotential thermal/source or structural control; not a direct ore indicator without independent supporting evidence
Disclaimer/Publisher’s Note: The statements, opinions and data contained in all publications are solely those of the individual author(s) and contributor(s) and not of MDPI and/or the editor(s). MDPI and/or the editor(s) disclaim responsibility for any injury to people or property resulting from any ideas, methods, instructions or products referred to in the content.