Article

Secondary Uranium Mineral Assemblages in Carboniferous Paleokarst Infill, Um Bogma Formation, the Southern Tethyan Margin: Implications for the Arabian–Nubian Shield in Mineralogical Characterization and Supergene Enrichment

by
Mohamed W. Abd El-Moghny
1,
Mohamed H. Helal
2,*,
Osama Ramzy Elshahat
1,
Mohamed Mohamed Fahim Abaza
3,
Mahmoud Mohamed Mohamed Ali Gabr
3,
Mohamed Fathy
1 and
Haitham M. Ayyad
1,*
1
Geology Department, Faculty of Science for Boys, Al-Azhar University, Nasr City, Cairo 11884, Egypt
2
Center for Scientific Research and Entrepreneurship, Northern Border University, Arar 73213, Saudi Arabia
3
Nuclear Materials Authority, Cairo P.O. Box. 530, Egypt
*
Authors to whom correspondence should be addressed.
Minerals 2026, 16(5), 558; https://doi.org/10.3390/min16050558
Submission received: 9 April 2026 / Revised: 12 May 2026 / Accepted: 19 May 2026 / Published: 21 May 2026
(This article belongs to the Section Mineral Deposits)

Abstract

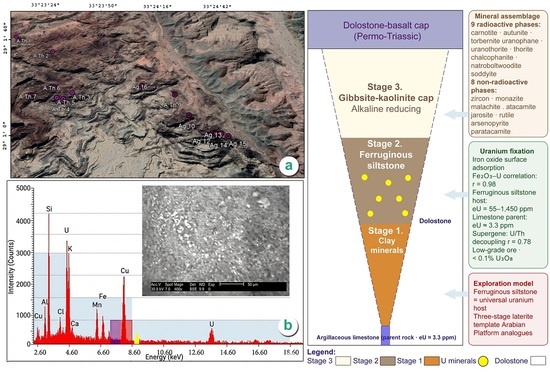
The Lower Carboniferous Um Bogma Formation in southwestern Sinai has sixteen paleokarst structures at Allouga, Abu Thor, and Abu Zarab. Each structure contains high uranium concentrations. These occur in a lateritic infill sequence formed along the southern Tethyan margin. Radiometric reconnaissance in this sector of the Arabian–Nubian Shield has been ongoing for decades. However, the mineralogical character of assemblages in the region was never systematically documented. This study uses multiple techniques to characterize both radioactive and non-radioactive mineral assemblages from paleokarst-fill materials at all sites. Geochemical analysis was used to clarify uranium fixation and ore genesis. Nine radioactive minerals were identified: carnotite, autunite, torbernite, uranophane, uranothorite, thorite, chalcophanite, natroboltwoodite, and soddyite. Eight nonradioactive accessory phases were also found: zircon, monazite, malachite, atacamite, jarosite, rutile, arsenopyrite, and paratacamite. Geochemical data indicate that iron oxide surface adsorption is the dominant mechanism of uranium fixation. A strong positive correlation between uranium and Fe2O3 (r = 0.98), together with negative correlations with carbonate-associated elements (CaO, MgO, Na2O), supports this interpretation. Therefore, uranium is classified as a supergene, low-grade ore. It is concentrated during laterite maturation in paleokarst cavities. Its distribution is governed by ferruginous siltstone lithofacies, not the enclosing carbonate host. These findings offer a reference paragenetic framework for secondary uranium metallogenesis in Carboniferous carbonate terrains of the Arabian–Nubian Shield. They also provide a mineralogical template for exploration in similar paleokarst-hosted systems across the Arabian Platform.

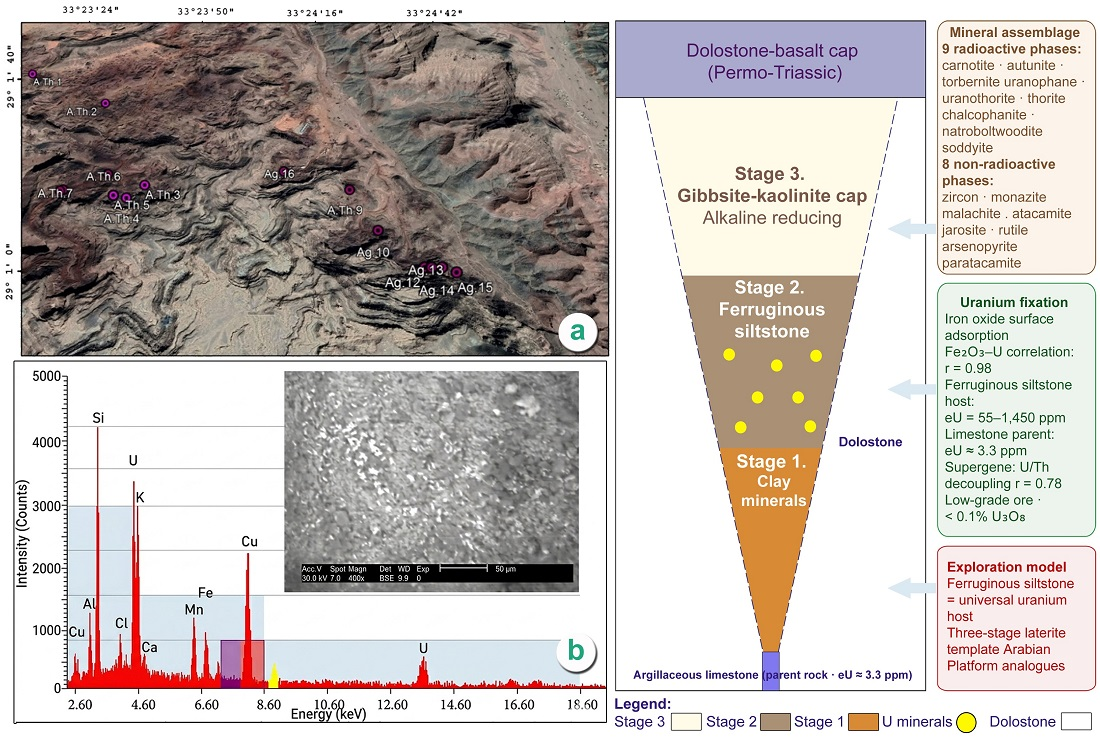
Graphical Abstract

1. Introduction

1.1. Regional Setting and Geological Significance

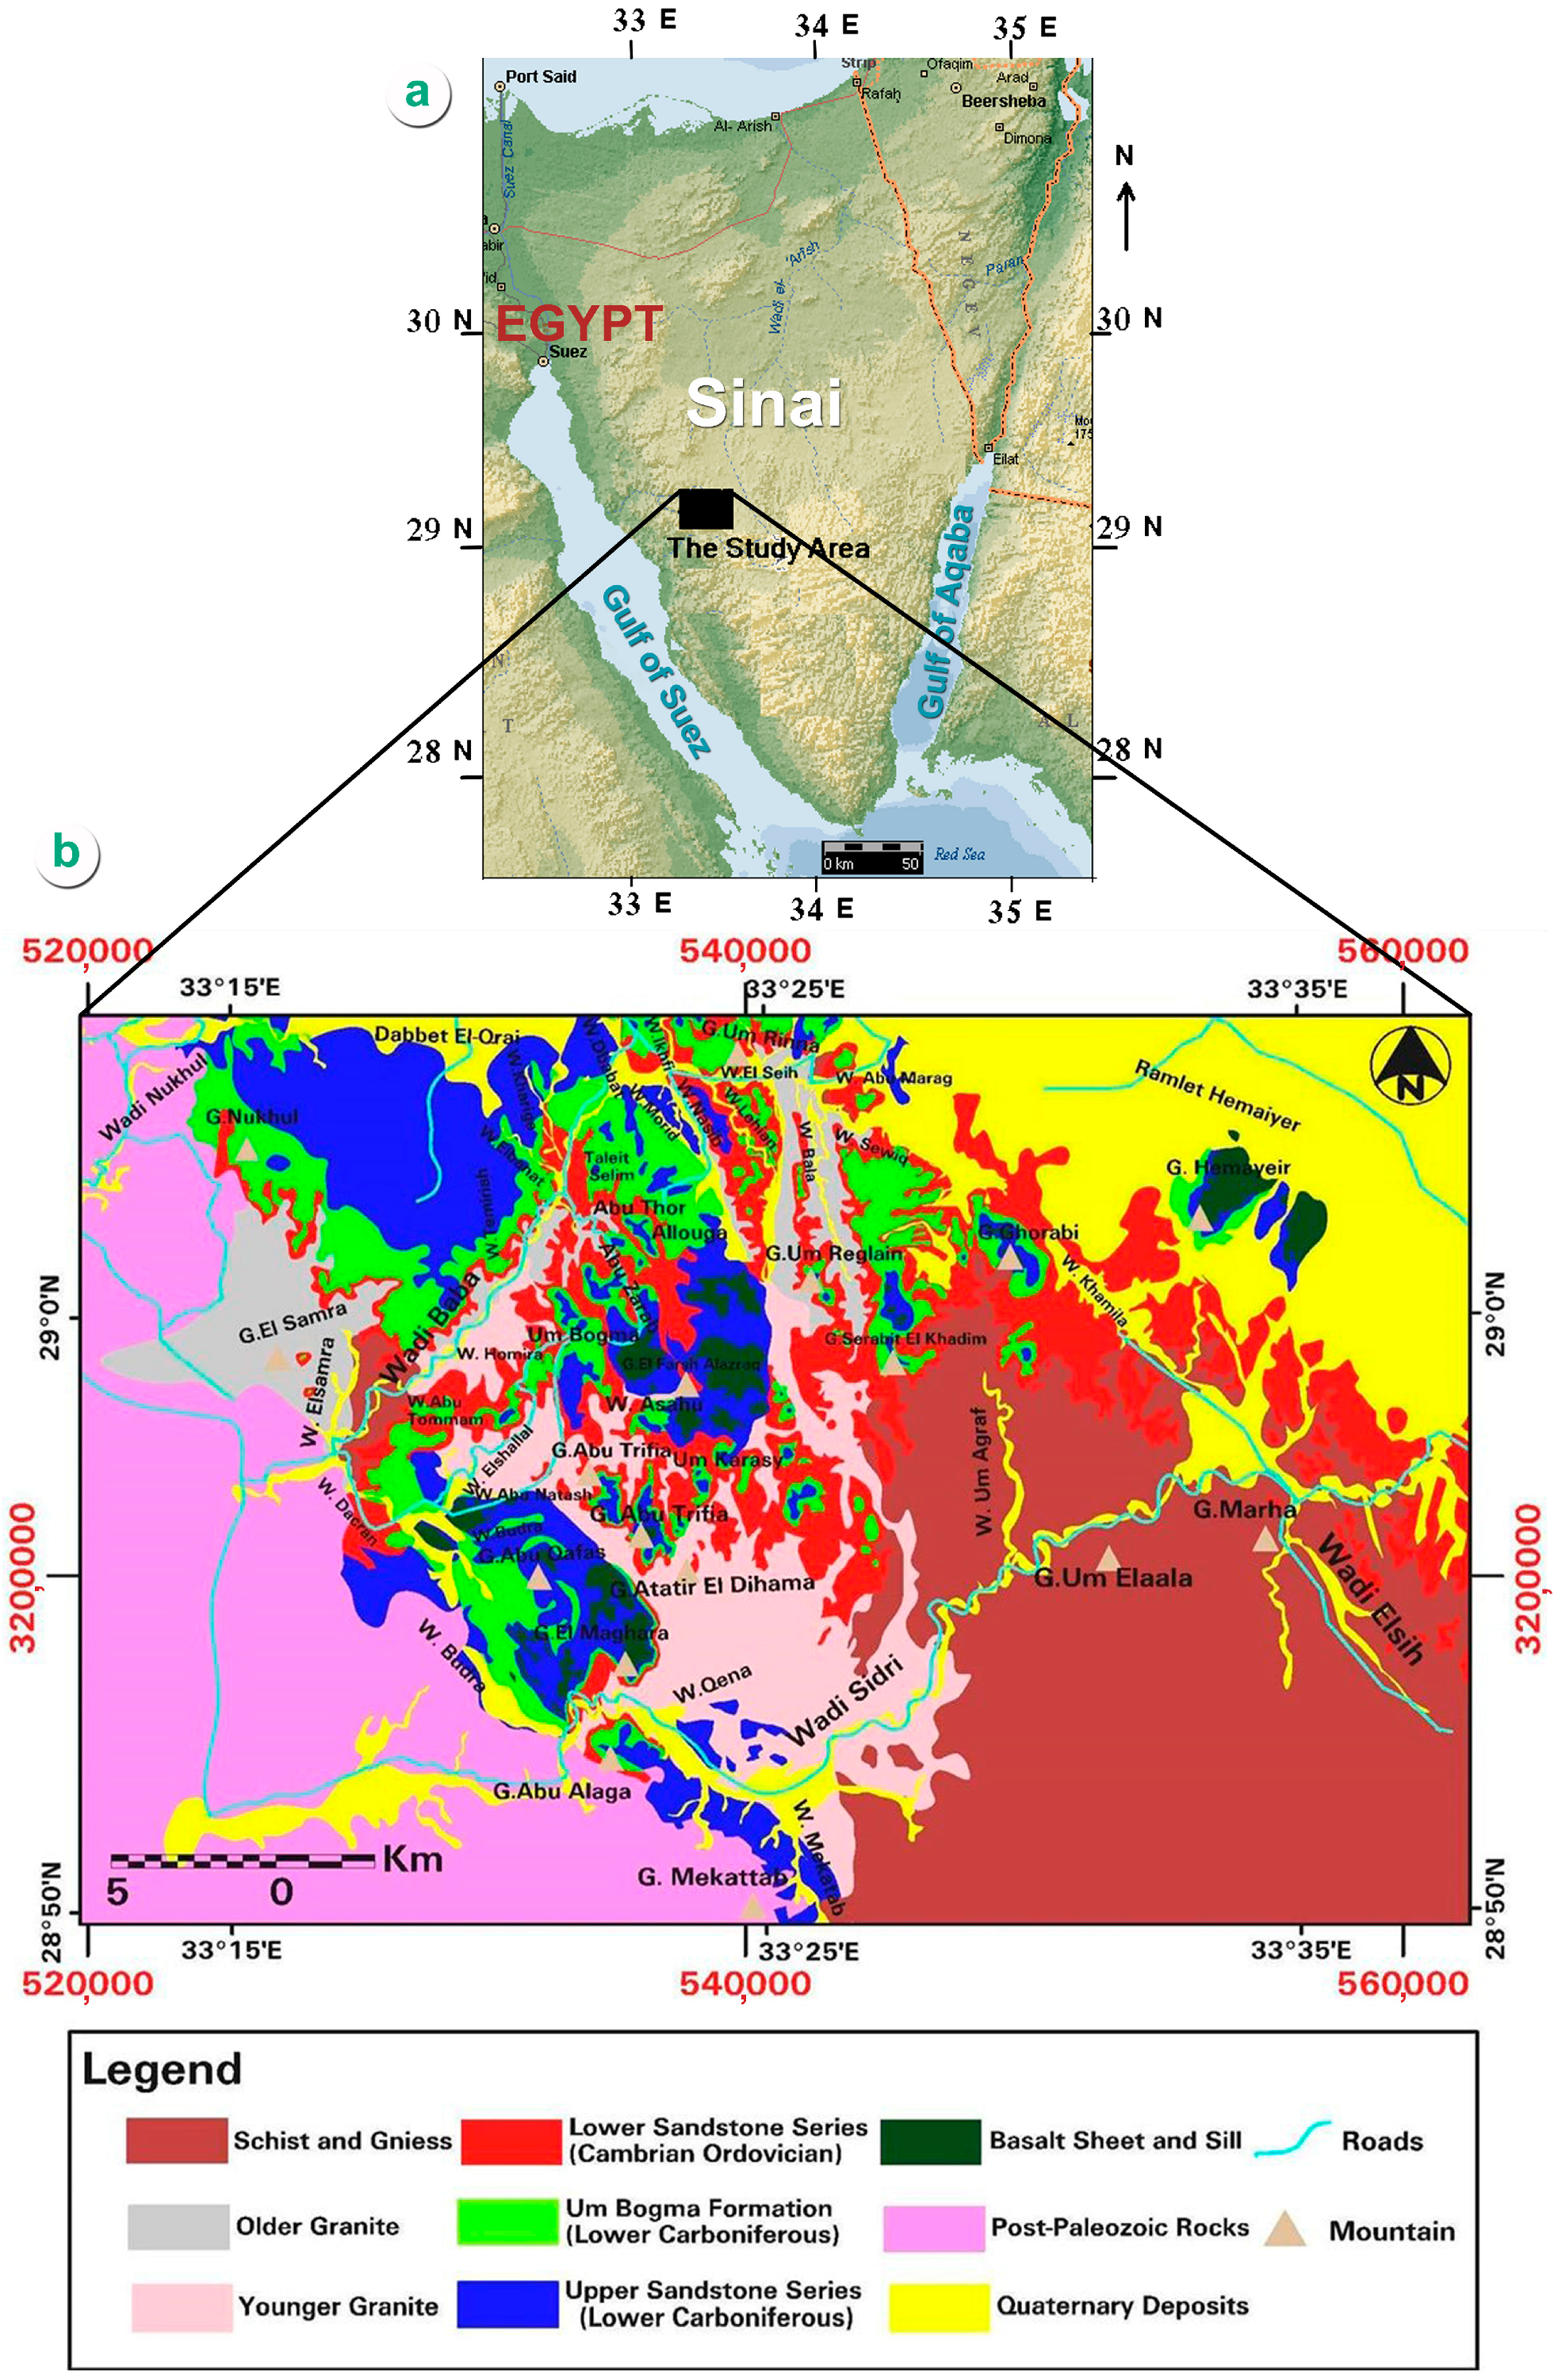
The Um Bogma area lies in the southwestern Sinai Peninsula (33°20′–33°25′ E; 28°57′–29°05′ N), approximately 40 km east of Abu Zenima city, accessible via asphalted roads connecting Abu Zenima and Abu Rudeis. The area, which hosts kaolin, glass sand, turquoise, uranium, thorium, and rare earth elements, ranks among the most mineralogically significant localities in the Middle East, alongside the Ancient Egyptian Sarabit El-Khadim Temple (Figure 1a).
Southwestern Sinai sits at the triple junction of the African, Arabian, and Eurasian plates [1], near the Tethyan Margin, an ancient seaway that separates Gondwana from Eurasia [2]. This tectonic setting shaped the Phanerozoic evolution of the region: rifting, thermal subsidence, and eustatic changes associated with the opening and closure of the Neo-Tethys guided this development [3]. During the Paleozoic, the area lay on the northern Gondwanan passive margin [3], where Hercynian reactivation and marine transgressions produced the Um Bogma Formation’s carbonate–clastic cycles [4]. This tectonic inheritance enabled karstification, lateritization, and supergene uranium enrichment [5,6]. The resulting conditions controlled permeability, fluid pathways, and tropical weathering, all of which are necessary for paleokarst development [7].
The basement consists of gneisses, schists, granodiorite, diorite, and granite, forming an Arabian–Nubian Shield (ANS) fragment that was assembled during the Neoproterozoic East African Orogeny (ca. 900–650 Ma) [8,9]. Peneplanation then reduced the crust to near sea level by the Cambrian, forming the Top Precambrian Nonconformity (TPN). Subsequently, thermal subsidence led to the deposition of a ~2.5 km thick siliciclastic succession, defined at its base by the Base Cambrian Unconformity (BCU) [9,10,11]. In the study area, the Paleozoic succession reaches a thickness of 370 m, rests nonconformably on the basement, and is capped by a Permo-Triassic basaltic sheet (Figure 1b). Tectonic events—including Hercynian uplift, Mesozoic Gondwana breakup, and Oligocene–Miocene Red Sea/Gulf of Suez rifting—subsequently reactivated fracture systems [9,11]. These fracture networks and dissolution conduits later controlled the paleokarst formation and uranium trapping.
The Paleozoic cover consists of seven formations from the base to top: Sarabit El-Khadim, Abu Hamata, Adadia, Um Bogma, El Hashash, Magharet El-Maiah, and Abu Zarab [12,13]. Of these, the Um Bogma Formation is Lower Carboniferous (Middle Visean) in age [14] and forms the main radioactive horizon in Egypt’s Paleozoic record. This formation is exposed at Gabal Allouga, Abu Thor, Wadi El Sahu, and Abu Zarab, reaching a thickness of up to 43 m in Wadi Khaboba. It is subdivided into three members: the lower dolostone, bearing secondary copper and Mn-Fe ore; the middle member, a silty dolomitic limestone deposited under shallow, open-marine conditions [15], which is rich in fossils and radioactive anomalies; and the upper member, a dolostone with gibbsite. The unit is considered a polymineralized rock because it contains uranium, thorium, copper, manganese, iron, and rare earth elements [16,17,18,19].
Figure 1. Location and geological setting of the Um Bogma study area. (a) Location map of the Um Bogma area, southwestern Sinai Peninsula (33°20′–33°25′E; 28°57′–29°05′N), Egypt, showing accessibility from Abu Zenima city via an asphalted road and proximity to the Sarabit El-Khadim Temple site. (b) Geological map of the Um Bogma area compiled from enhanced ASTER imagery (after [20]), illustrating the Paleozoic succession resting nonconformably on Precambrian Arabian–Nubian Shield basement and capped by a Permo-Triassic basaltic sheet.
Minerals 16 00558 g001
Uranium in the formation is unevenly distributed. Paleokarst dissolution structures in the middle carbonate member have the highest concentrations, which differ in shape, size, and composition. These paleokarsts are filled with lateritic material formed under tropical-to-semi-tropical weathering, providing primary sites for uranium precipitation [7,21]. Mineralization always appears in the karst fill, distinguishing Um Bogma-type deposits from stratiform or sandstone-hosted types. Iron oxides act as the main geochemical trap for uranium within these fills, with enrichment factors (GEF) far higher than those of clay minerals [21,22,23]. The main goal of this study is to identify uranium mineral species in these iron-rich horizons and determine their paragenetic sequence.

1.2. Statement of the Problem

Several decades of radiometric exploration and mineralogical studies have been conducted in Um Bogma. However, secondary uranium mineral assemblages in its paleokarst systems have not been systematically characterized across multiple sites with a multi-technique approach. Early investigations found a range of secondary uranium minerals at individual locations: eleven species were described at Allouga [18]; beta-uranophane, clarkeite, and several copper-halide phases appeared at Abu Thor and Allouga [19]; and carnotite and boltwoodite were identified in Allouga, while bassetite and autunite were noted in Abu Thor [24,25]. However, each study was site-specific, analytically incomplete, and lacked a broader paragenetic framework. Critically, no study has characterized the entire mineral inventory at Allouga, Abu Thor, and Abu Zarab using both XRD and SEM–EDX analysis, nor has any work defined the paragenetic order of these minerals within the three-stage laterite evolution that controls uranium distribution in this system.
The most recent geochemical study [21] advanced the understanding of the elemental behavior and uranium fixation at Abu Zarab. However, it is explicitly geochemical, limited to a single locality, and includes no mineralogical characterization. The mineral form of uranium at Abu Zarab—the actual species through which iron oxide adsorption operates—remains unpublished. No geochemical or mineralogical dataset of similar resolution exists at Allouga and Abu Thor, which host the highest documented uranium anomalies in the area [17,26]. The lack of balanced information across sites leaves incomplete paragenetic interpretation of supergene uranium in Um Bogma paleokarsts.
The knowledge gap extends beyond Sinai. Carboniferous carbonate sequences on the broader Arabian Platform—most notably the Tabuk Group of Saudi Arabia and the Khreim Group of Jordan—share broadly analogous depositional settings and tectono-stratigraphic frameworks with the Um Bogma Formation [27,28]. However, none of the relevant regional syntheses addresses the occurrence, geochemistry, or paragenetic sequence of secondary uranium minerals [8,11,27]. The consequence is a regional reference vacuum: researchers and explorers working on Carboniferous carbonate-hosted uranium across the Platform have no published paragenetic model against which to compare their observations. The Um Bogma Formation—with its exceptional mineral diversity, multi-locality exposure, and existing radiometric database—is the natural candidate to fill that gap.

1.3. Objectives

This study addresses the identified deficiencies through four interconnected objectives. The first is to identify and fully characterize all radioactive and nonradioactive heavy minerals in paleokarst infill at Allouga, Abu Thor, and Abu Zarab localities, using an integrated analytical workflow comprising heavy-mineral separation, binocular stereomicroscopy, X-ray diffraction (XRD), and Environmental Scanning Electron Microscopy with energy-dispersive X-ray analysis (SEM–EDX). The second objective is to establish the paragenetic sequence of the identified secondary uranium minerals in direct relation to the three-stage laterite evolution model documented for Um Bogma paleokarsts, thereby resolving the temporal and geochemical relationships between individual mineral species and their host lateritic horizons. Third, this study aims to determine the dominant geochemical mechanism of uranium fixation—with reference to iron oxide surface adsorption and the Geochemical Enrichment Factor (GEF) hierarchy of natural sorbents—and to evaluate the contribution of newly identified sorbent phases, including copper-halide minerals, to the overall uranium budget. Finally, the findings are interpreted within the framework of supergene uranium metallogenesis across the Arabian–Nubian Shield, with the explicit goal of providing a reference model for mineral paragenesis applicable to analogous Carboniferous carbonate sequences on the Arabian Platform.

2. Geological Background

2.1. Stratigraphy of the Paleozoic Succession

The Paleozoic succession of southwestern Sinai rests unconformably on Precambrian basement rocks of the Arabian–Nubian Shield and is capped by Permo-Triassic basaltic extrusion. Seven formations are recognized from the base to the top: Sarabit El-Khadim, Abu Hamata, Adadia, Um Bogma, El Hashash, Magharet El-Maiah, and Abu Zarab [12,13]. The total succession thickness increases systematically from approximately 160 m in the northwest to 370 m in the southeast, broadly reflecting a basin geometry that deepens to the southeast [29].
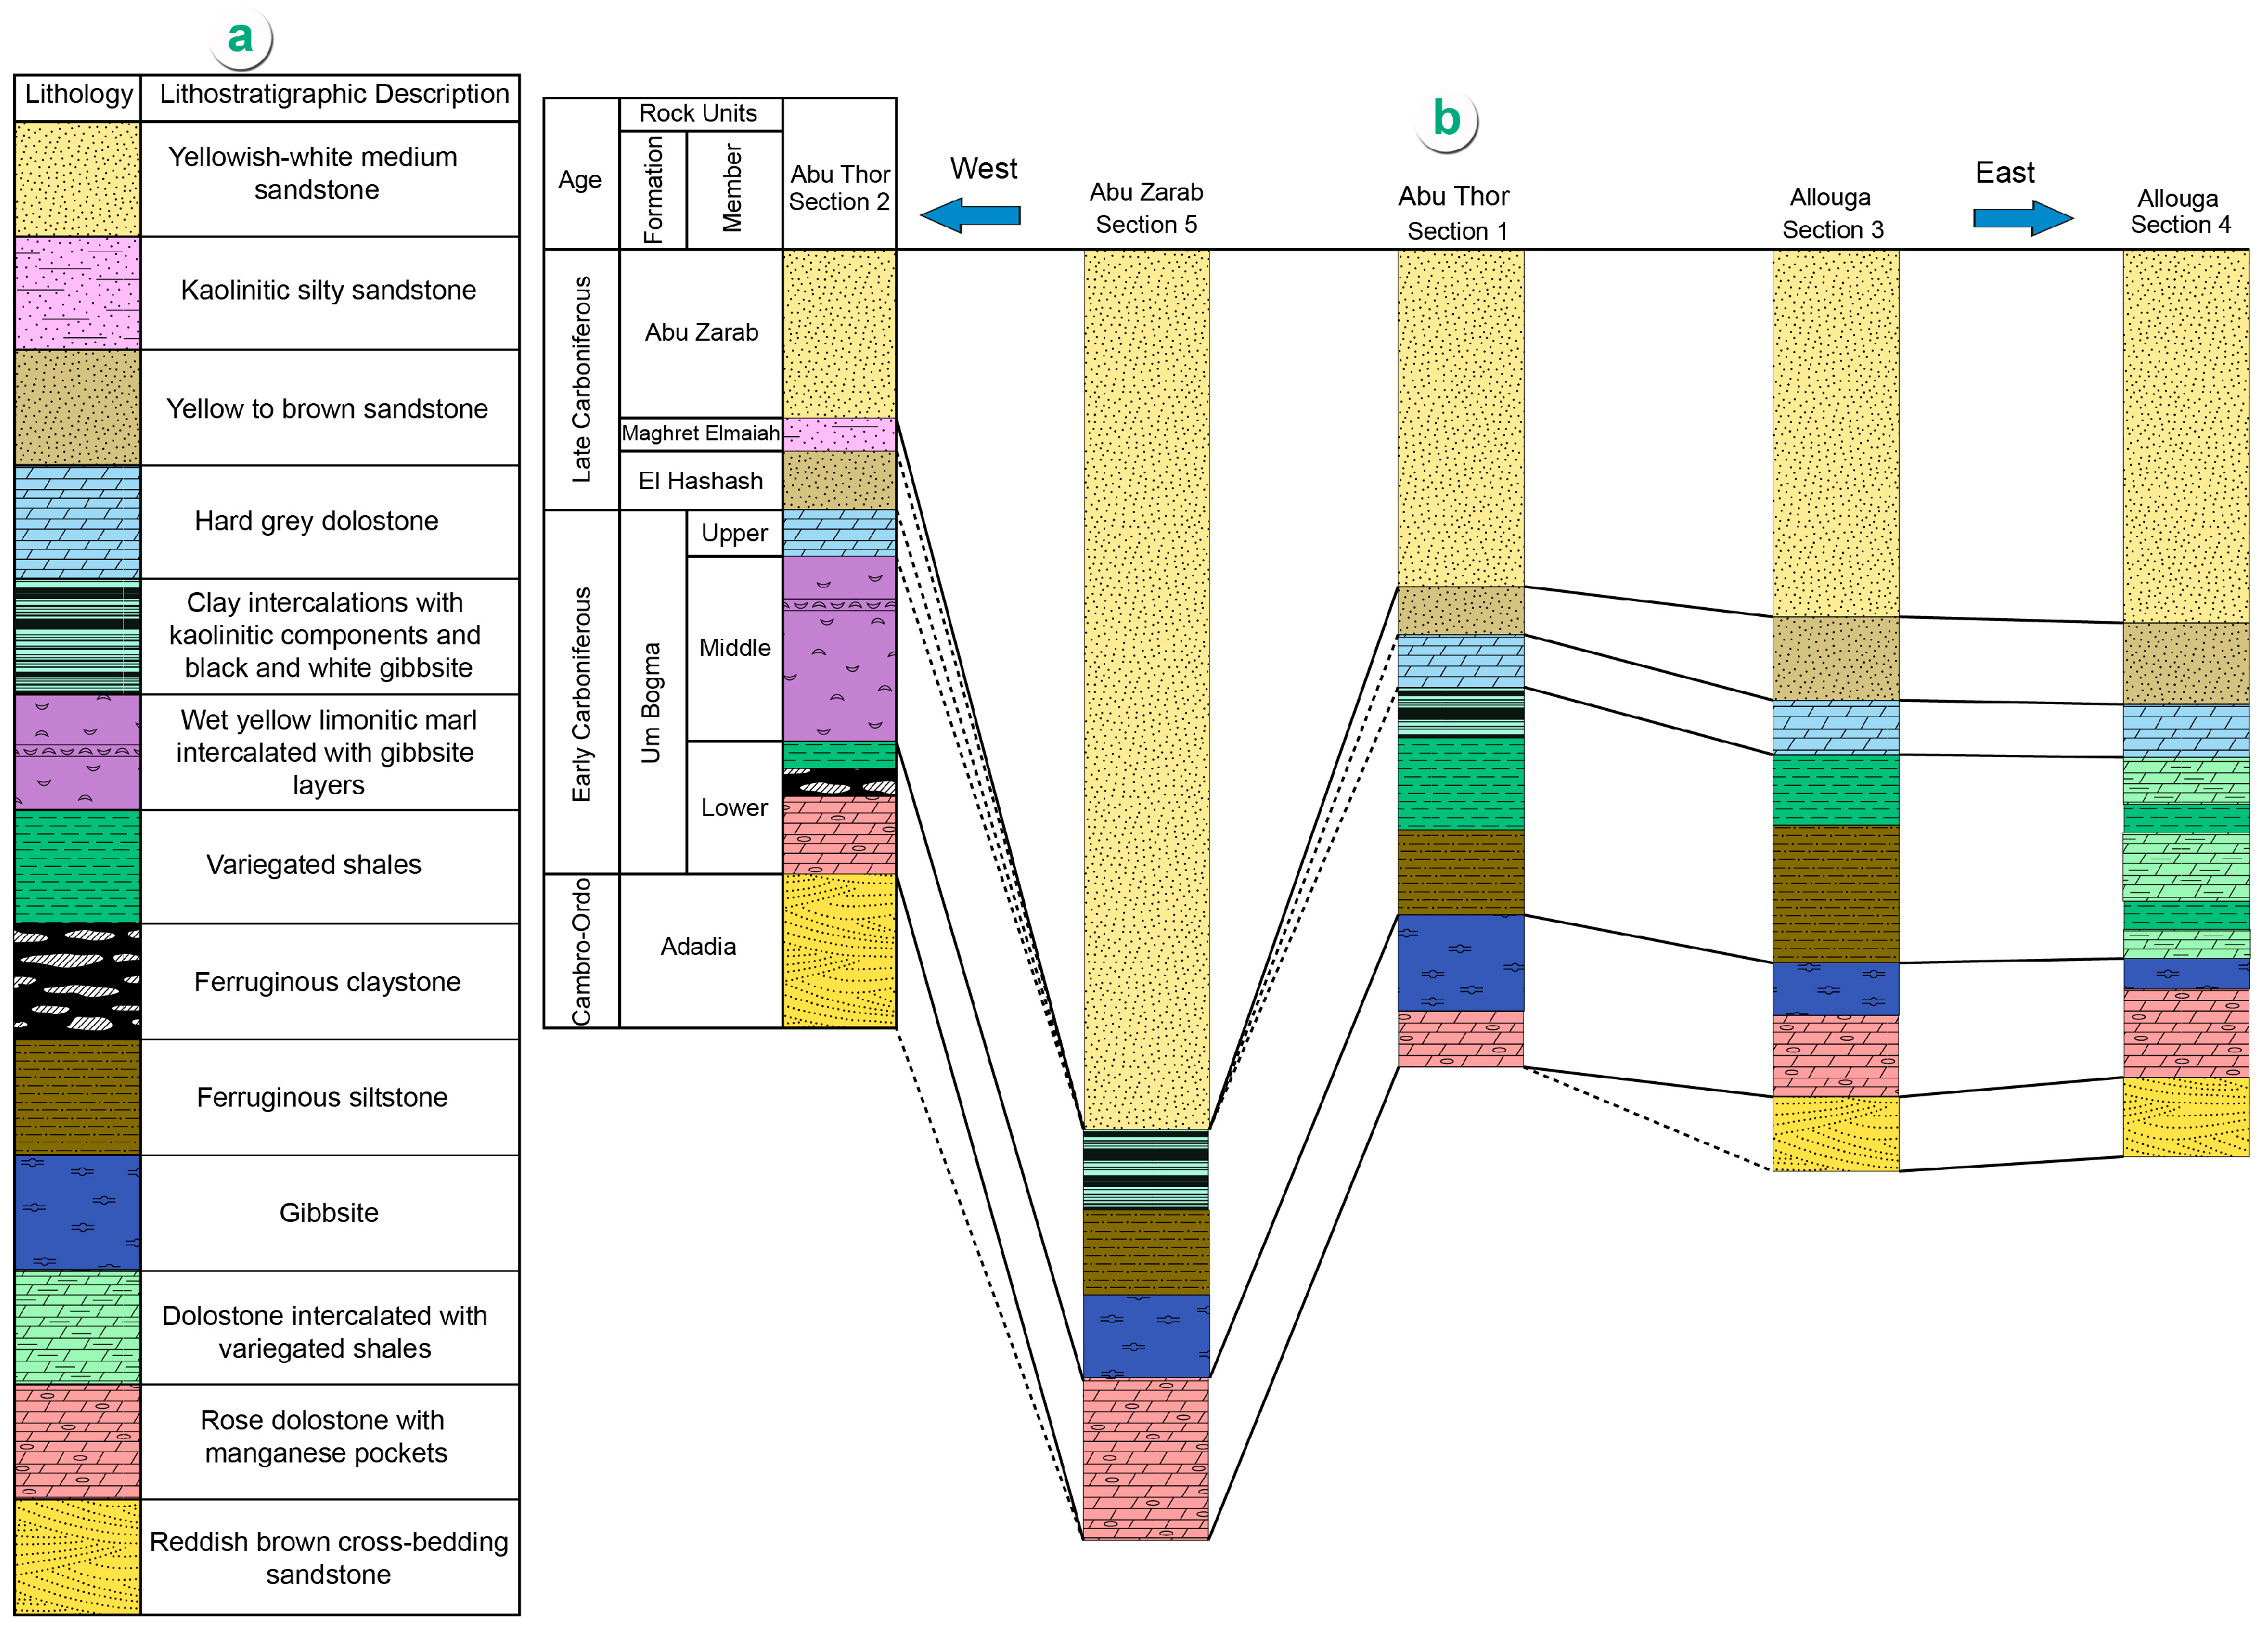
These formations are grouped into three series. The Lower Sandstone Series—comprising the Sarabit El-Khadim, Abu Hamata, and Adadia formations—consists of Cambro-Ordovician siliciclastics. The overlying Middle Carbonate Series is represented solely by the Early Carboniferous Um Bogma Formation, which unconformably succeeds the Adadia Formation. The Upper Sandstone Series, which encompasses Hashash, Magharet El-Maiah, and Abu Zarab formations, is assigned a Late Visean age [15]. Notably, the upper member of the Um Bogma Formation and the overlying El Hashash and Magharet El-Maiah formations are absent in the Abu Zarab section, an attenuation attributed to depositional pinch-out or pre-basalt erosional truncation [25,30]. Five measured lithostratigraphic sections—two at Abu Thor, two at Allouga, and one at Abu Zarab—document this lateral variability. The lithofacies legend and correlation panel are shown in Figure 2a and Figure 2b, respectively.

2.2. Um Bogma Formation: Lithology and Members

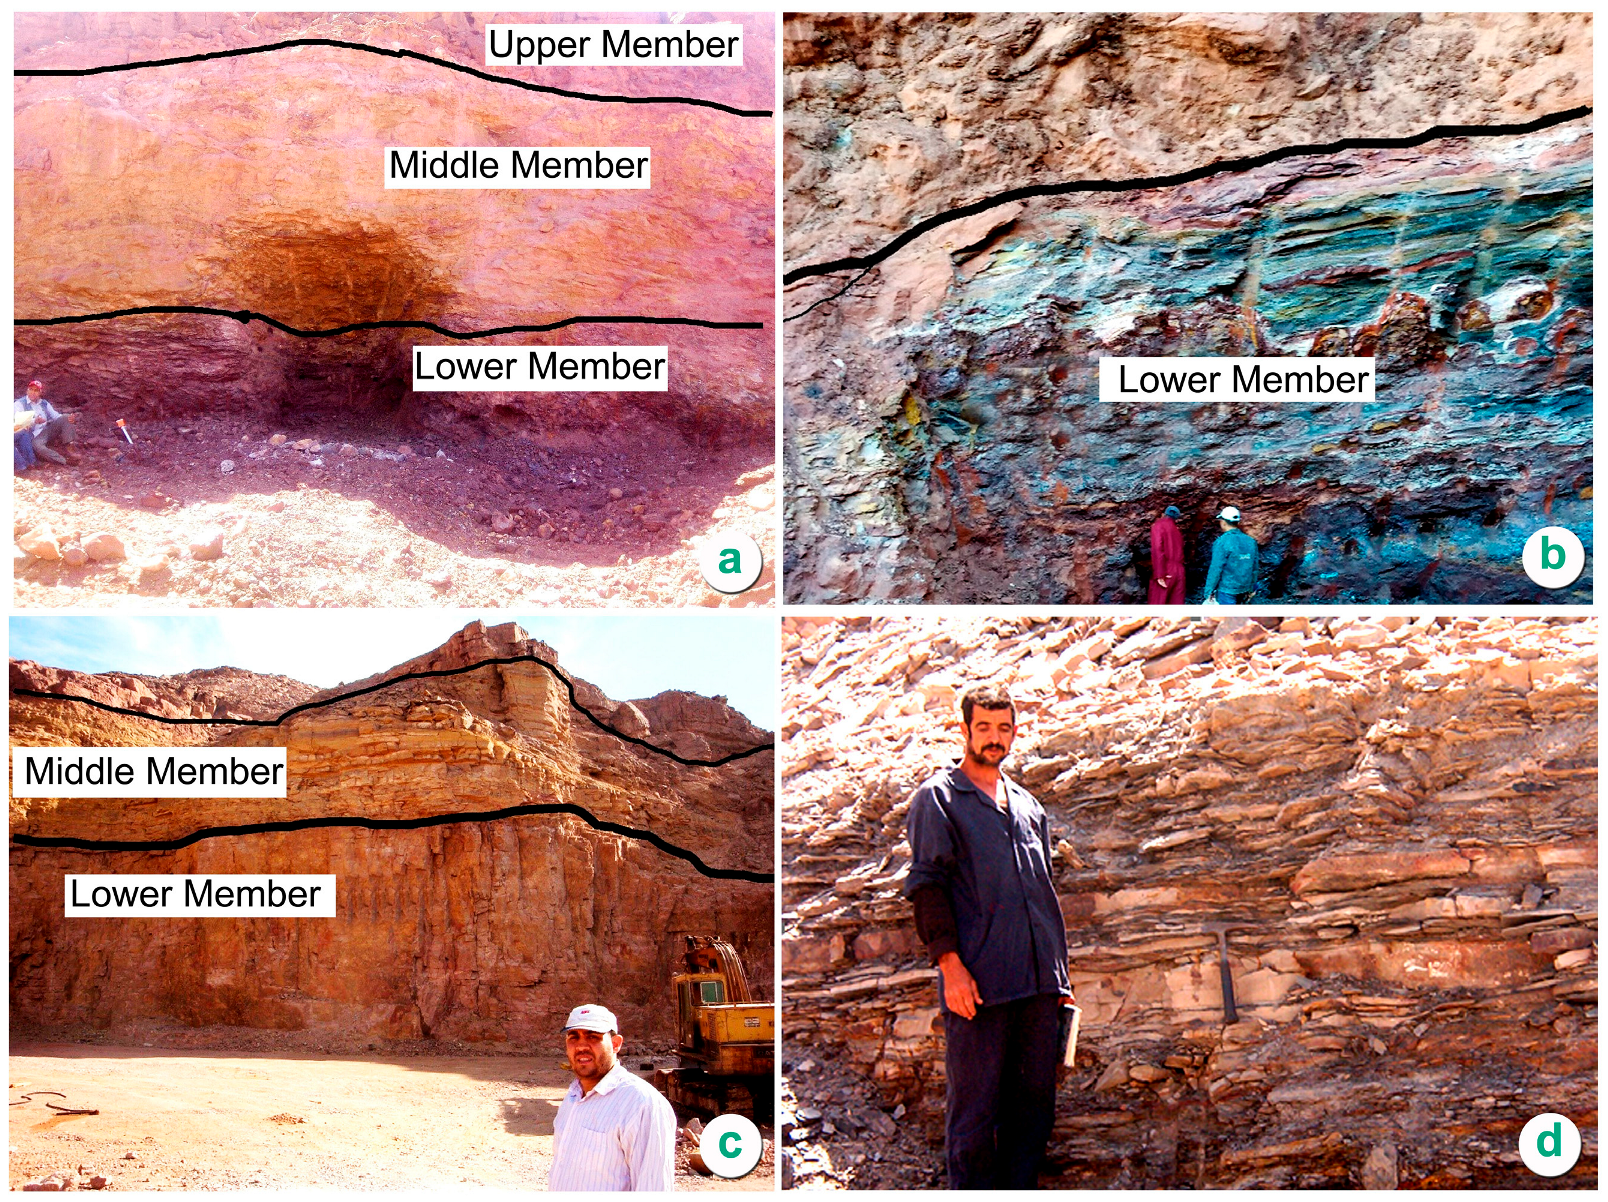
Formally named by [13], the Um Bogma Formation attains a maximum thickness of 43 m at its type locality, Wadi Khaboba, and thins to 3.5 m at Gabal Sarabit El-Khadim. It unconformably overlies the Adadia Formation and conformably underlies the El Hashash Formation. Three members, as defined by [14], are distinguished by contrasting lithologies, depositional environments, and mineralization signatures; Figure 3a illustrates their contact relationships.
Figure 2. Lithostratigraphy of the Um Bogma Formation across the three study localities. (a) Lithofacies legend with symbol descriptions: compact dolostone (grey brick pattern), ferruginous siltstone (orange stipple), clay mineral horizon (yellow dashes), and gibbsite–kaolinite cap (white with diagonal hatching); describing the fill units documented in the measured lithostratigraphic sections at Abu Thor, Allouga, and Abu Zarab. (b) Lithostratigraphic correlation panel of five measured sections—two at Abu Thor, two at Allouga, and one at Abu Zarab—illustrating lateral thickness variability and the progressive attenuation of the upper Um Bogma and overlying formations toward Abu Zarab, attributed to pre-basalt erosional truncation or depositional pinch-out.
Minerals 16 00558 g002
Figure 3. Field characteristics of the three Um Bogma Formation members (Original field photographs). (a) Field exposure showing the three-member subdivision; the brownish-yellow middle member marl serves as a diagnostic marker bed for identifying uranium-bearing paleokarst structures. (b) Lower Um Bogma member displaying intercalated siltstone, shale, and claystone with Fe–Mn ore at the upper contact. (c) Compact, fractured dolostone facies of the lower Um Bogma member. (d) Upper Um Bogma member comprising pinkish-brown compact crystalline dolostone with local black shale facies and gibbsite-bearing horizons indicative of supergene lateritization.
Minerals 16 00558 g003
The lower member (0.5–14 m) consists of compact fractured dolostone intercalated with siltstone, shale, and claystone (Figure 3b,c), with Fe–Mn ore at its upper contact representing a shoal-type facies [31]. Secondary copper mineralization—including malachite, atacamite, and related phases—occurs in association with siltstone and ore horizons (Figure 2, Figure 3, Figure 4, Figure 5, Figure 6, Figure 7, Figure 8, Figure 9, Figure 10, Figure 11, Figure 12, Figure 13, Figure 14, Figure 15, Figure 16, Figure 17, Figure 18 and Figure 19; [29]). The middle member (up to 13 m) is the primary host of radioactive anomalies and is readily distinguished in the field by its characteristic brownish-yellow color (Figure 3a). It comprises intercalated fossiliferous marl, shale, and thin dolostone beds deposited under shallow open-sea shelf conditions [4,32], with pervasive paleokarst structures that entirely govern uranium distribution. The upper member consists of pinkish-brown, compact crystalline dolostone conformably overlying the middle sequence (Figure 3d), with local black shale facies and gibbsite-bearing horizons reflecting supergene lateritization [29].
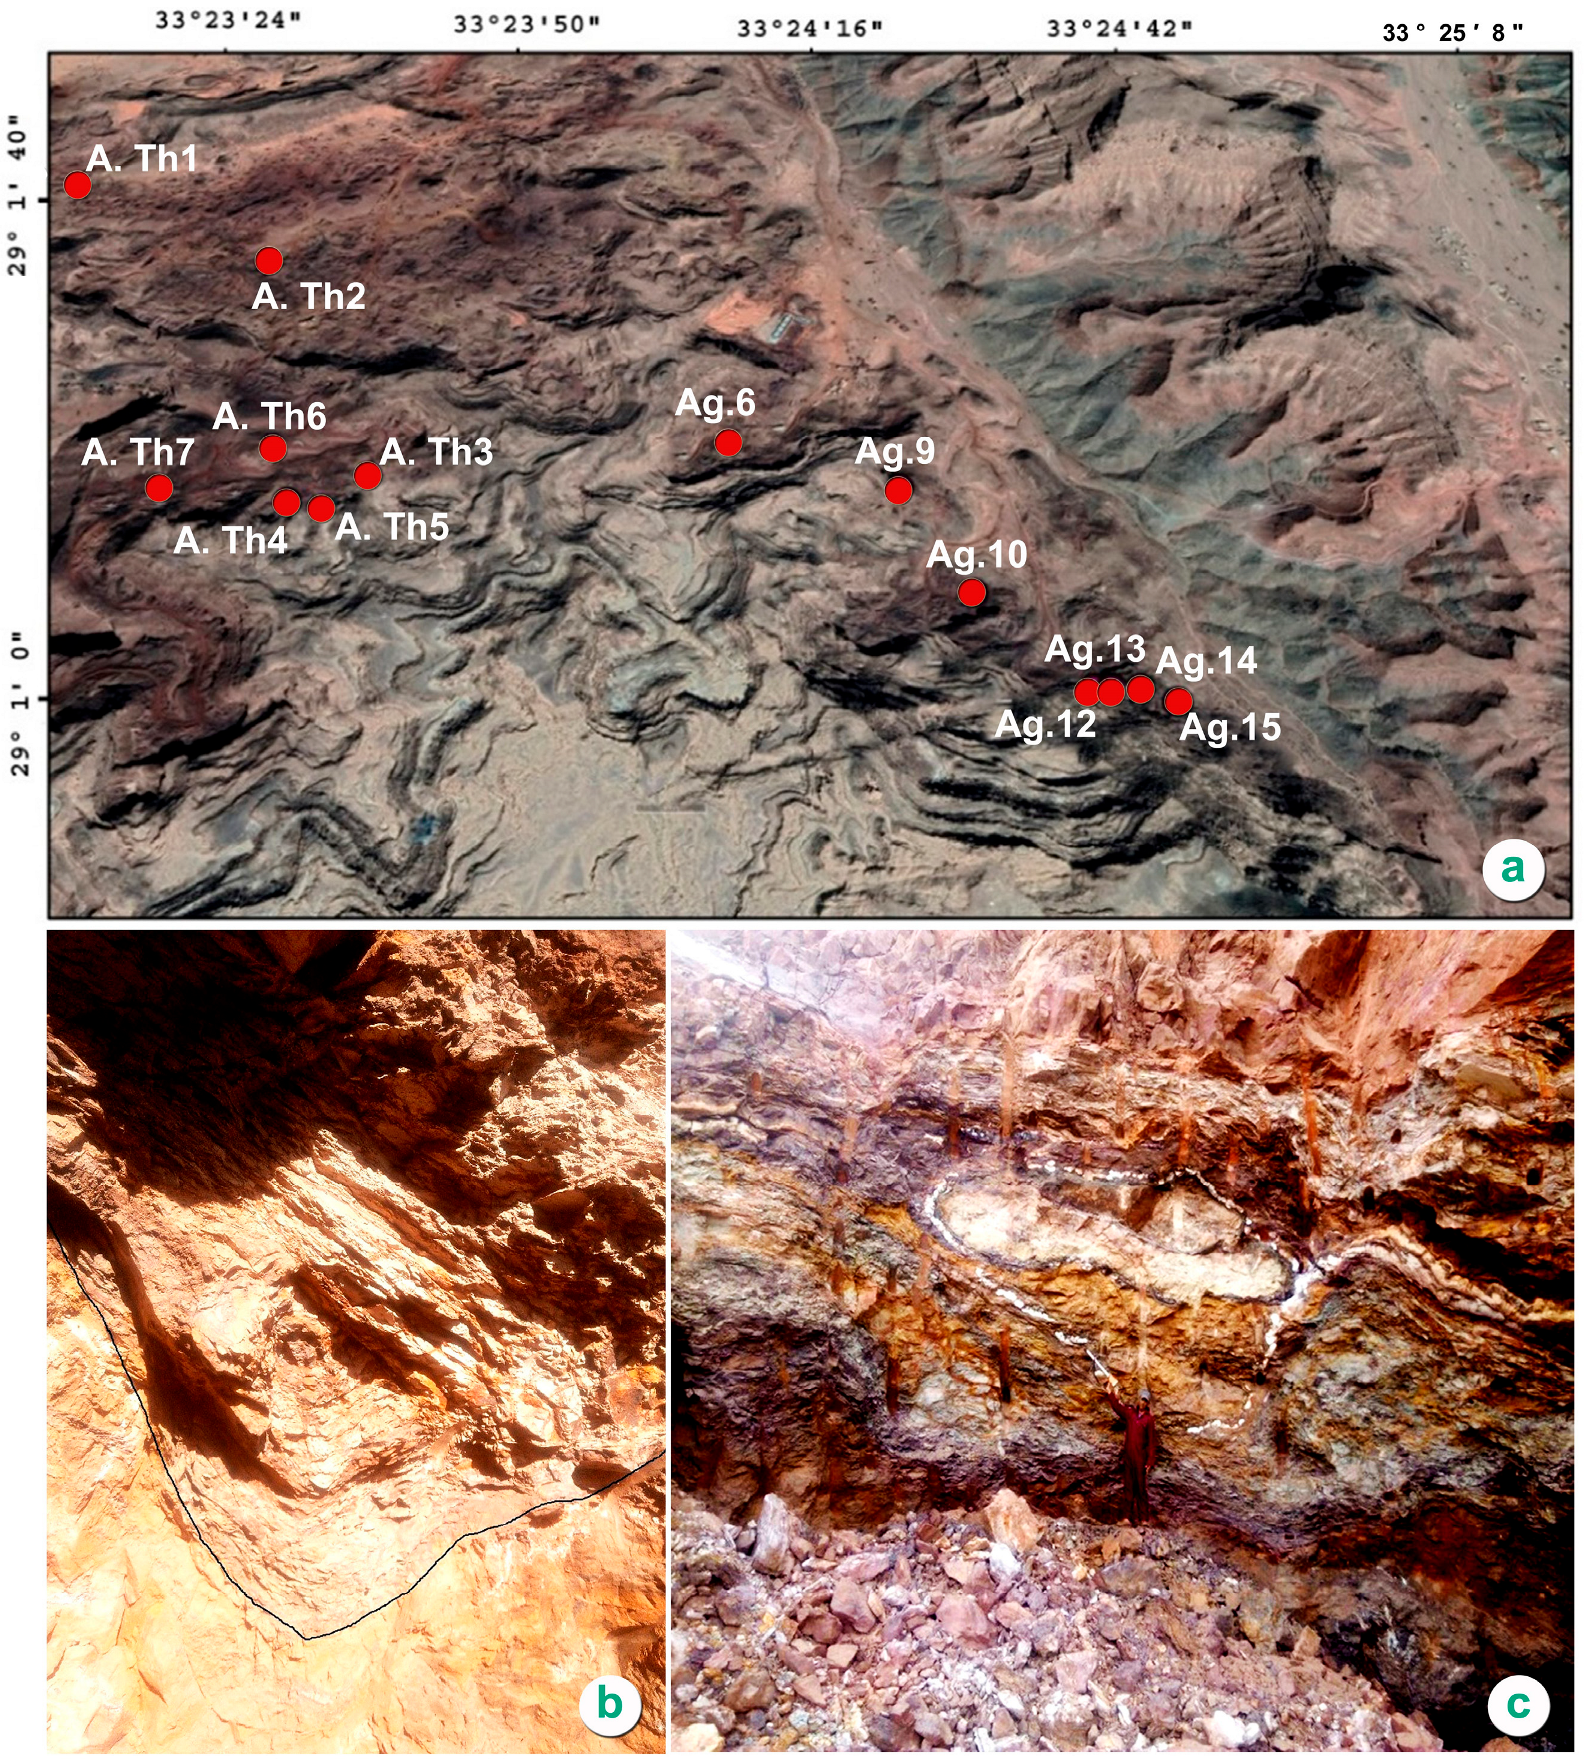
Figure 4. Distribution and morphology of paleokarst dissolution structures within the Um Bogma Formation. (a) Map showing the sixteen documented paleokarst structures: eight at Abu Thor (ATh. 1–8), five at Allouga (Ag. 9–13), and three at Abu Zarab, their clustering governed by NNW-to-NW and N-to-NE structural corridors. (b) V-shaped paleokarst dissolution structure filled with kaolinite and white gibbsite, illustrating one of the dominant morphological forms. (c) Representative paleokarst dissolution structure demonstrating the morphological variability—from U-shaped to pipe-like—characteristic of the sixteen documented features.
Minerals 16 00558 g004
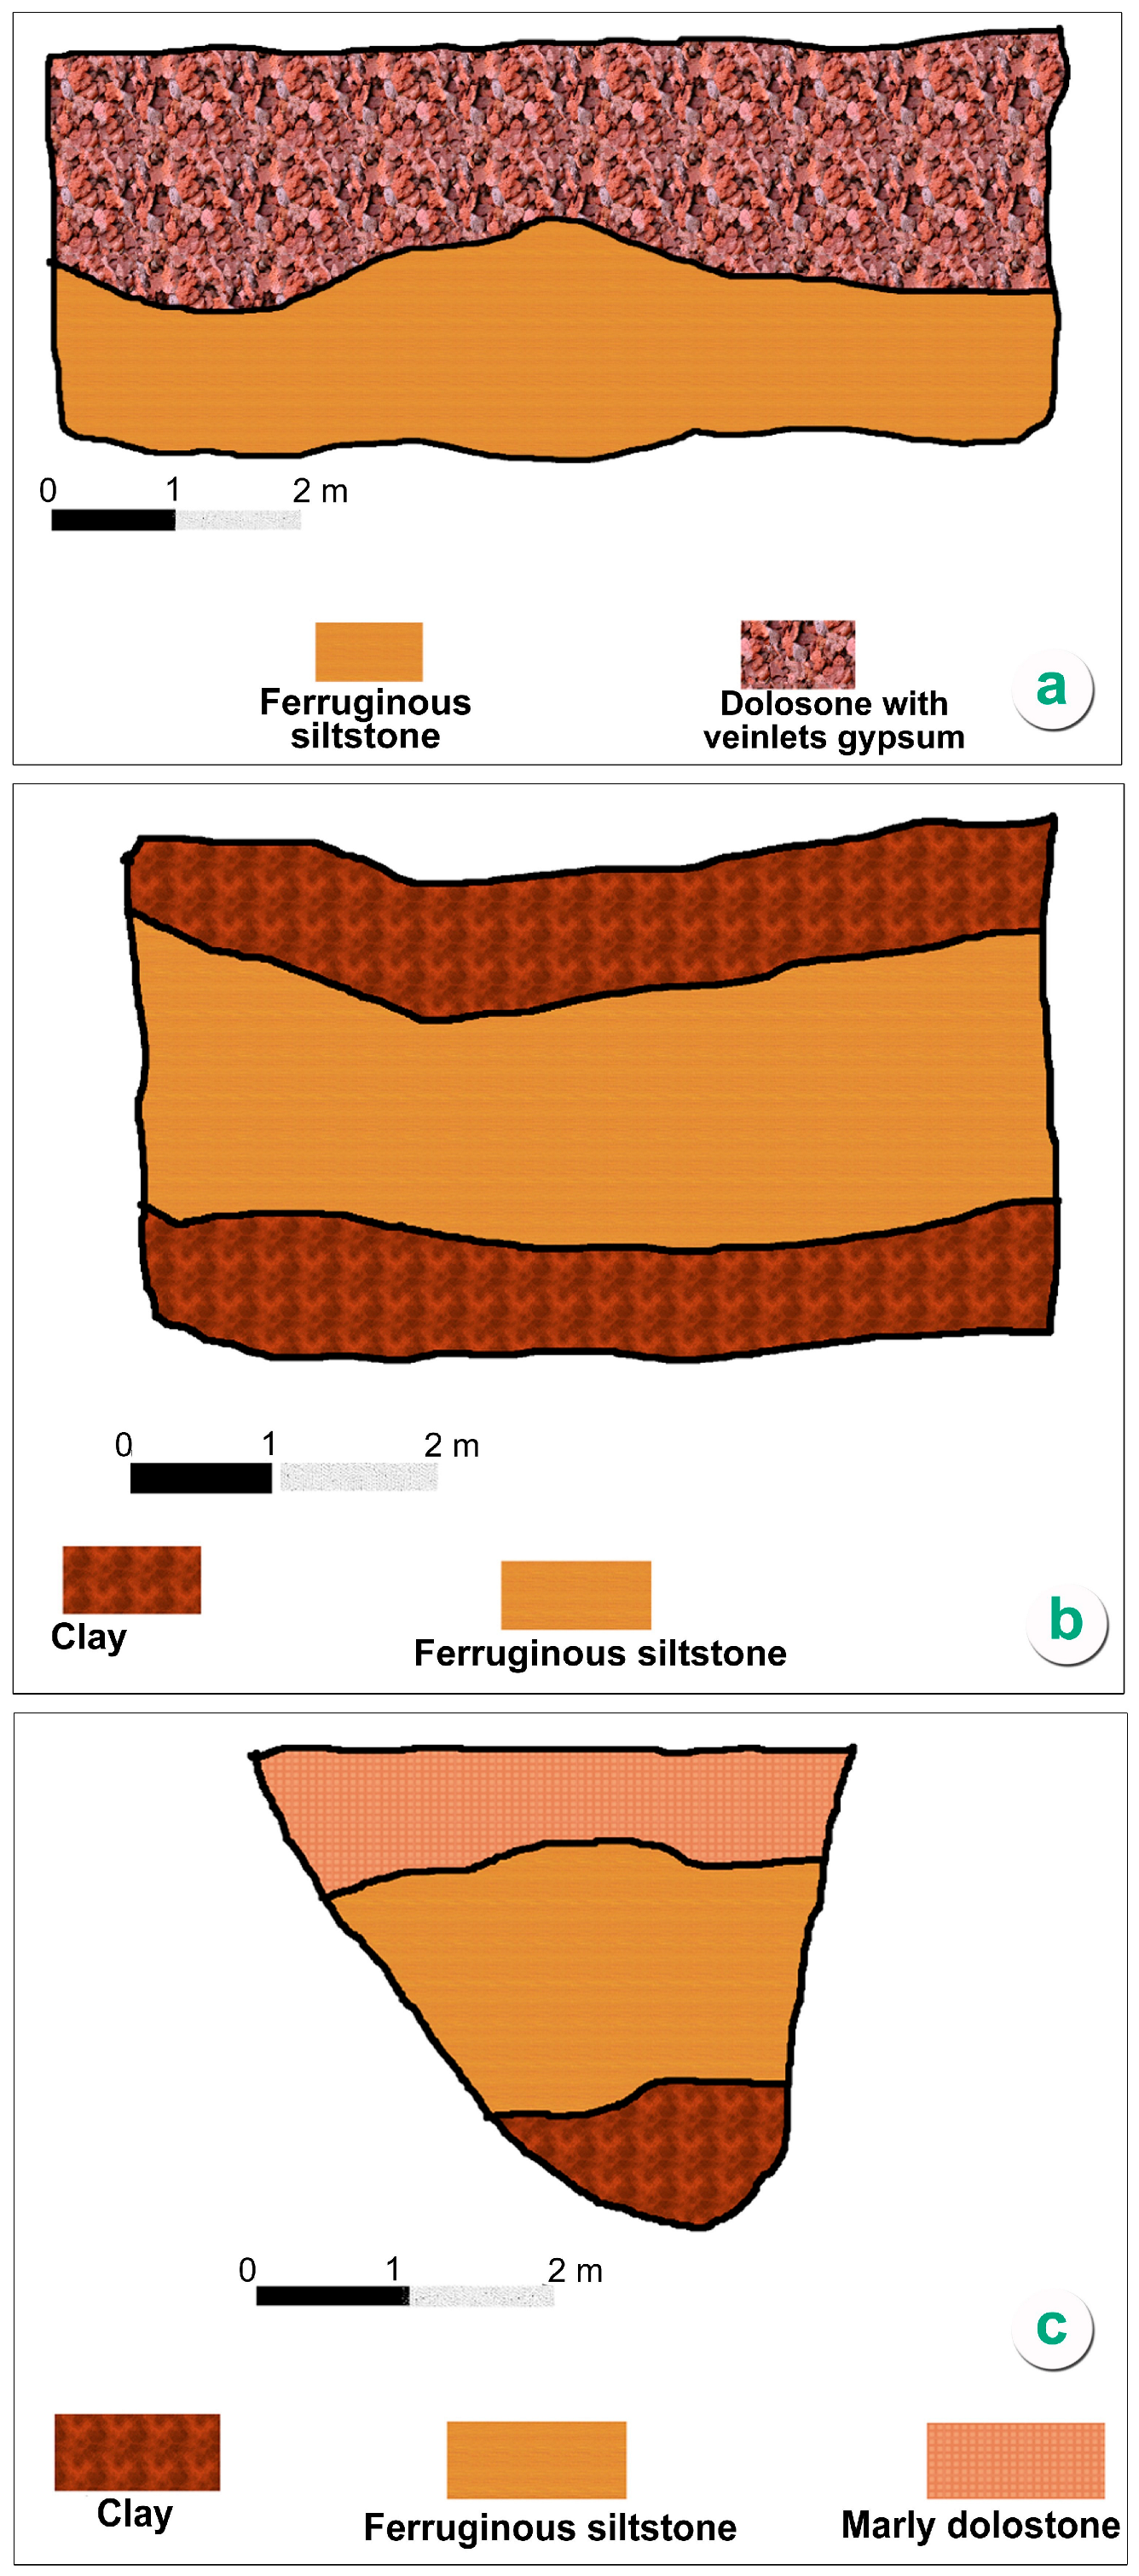
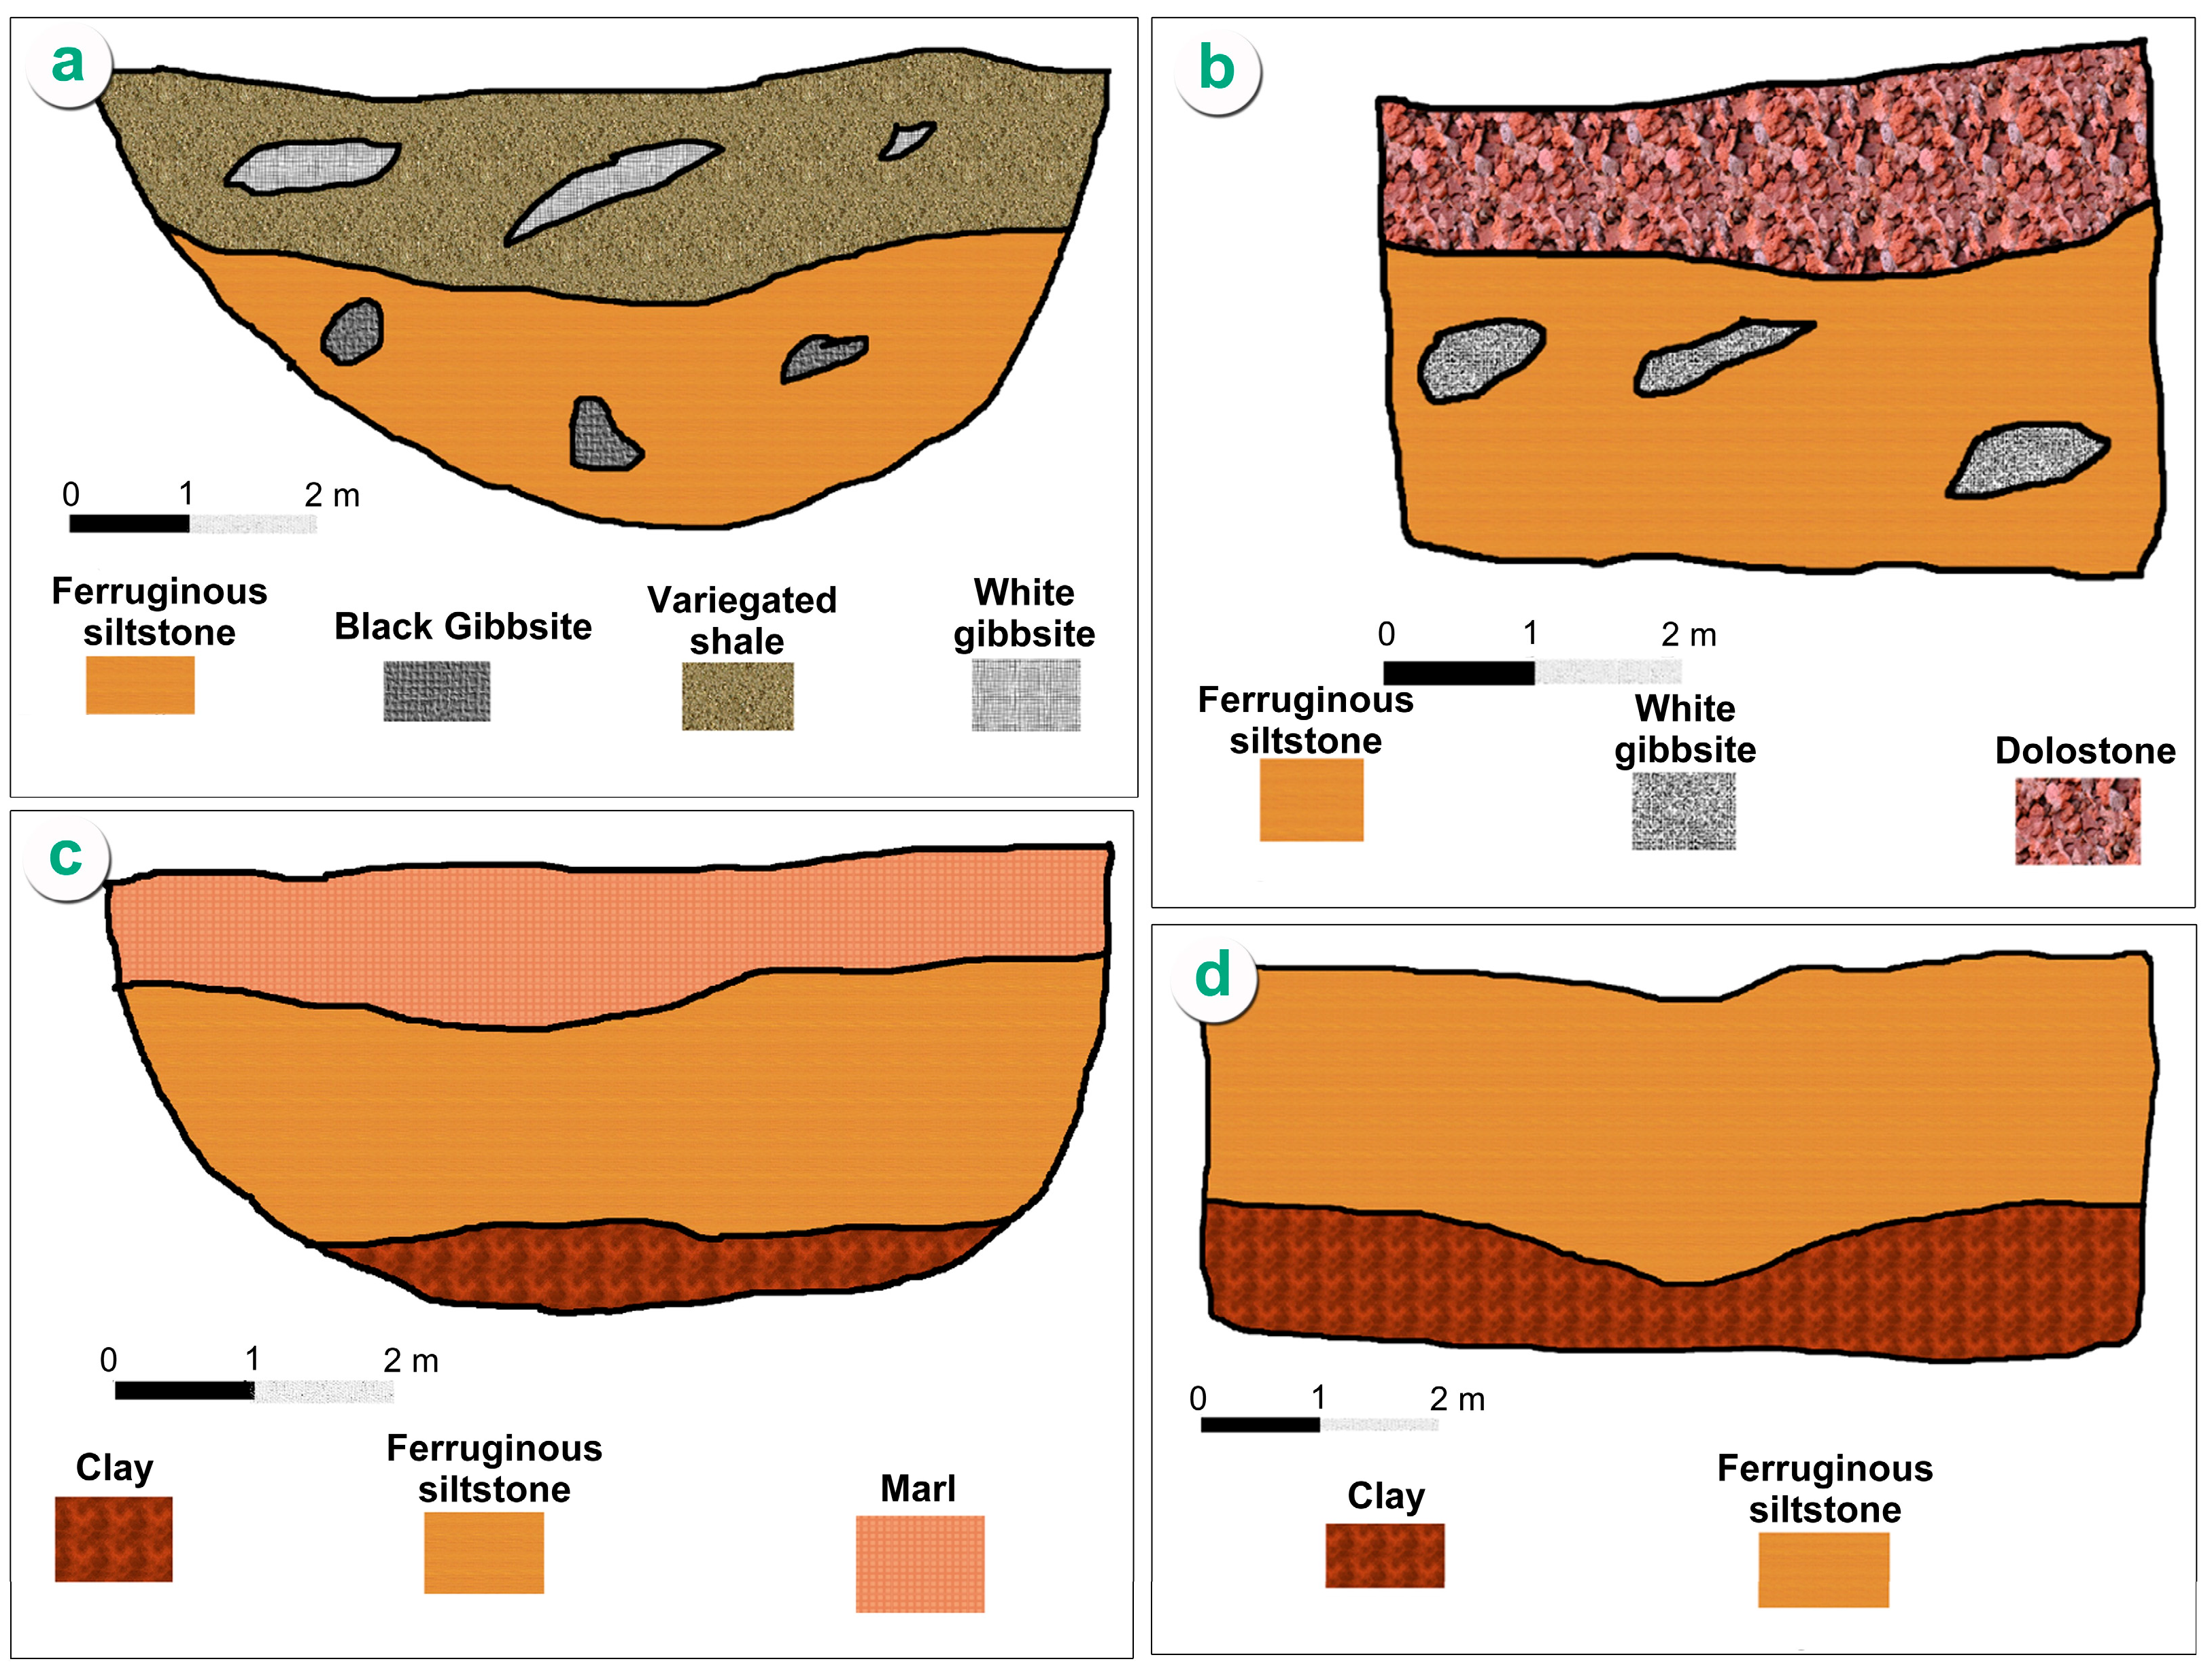
Figure 5. Schematic lithological and morphological profiles of paleokarst structures ATh.1–Ath.4, Abu Thor locality. (a) ATh.1, showing the vertical succession from the argillaceous limestone floor through the clay mineral horizon, ferruginous siltstone, and gibbsite–kaolinite cap. (b) ATh.2. (c) ATh.3. (d) ATh.4. Fill unit symbols follow the legend in Figure 2a.
Minerals 16 00558 g005
Figure 6. Schematic lithological and morphological profiles of paleokarst structures ATh.5–ATh.8, Abu Thor locality. (a) ATh.5. (b) ATh.6. (c) ATh.7. (d) ATh.8. Fill unit symbols follow the legend in Figure 2a.
Minerals 16 00558 g006
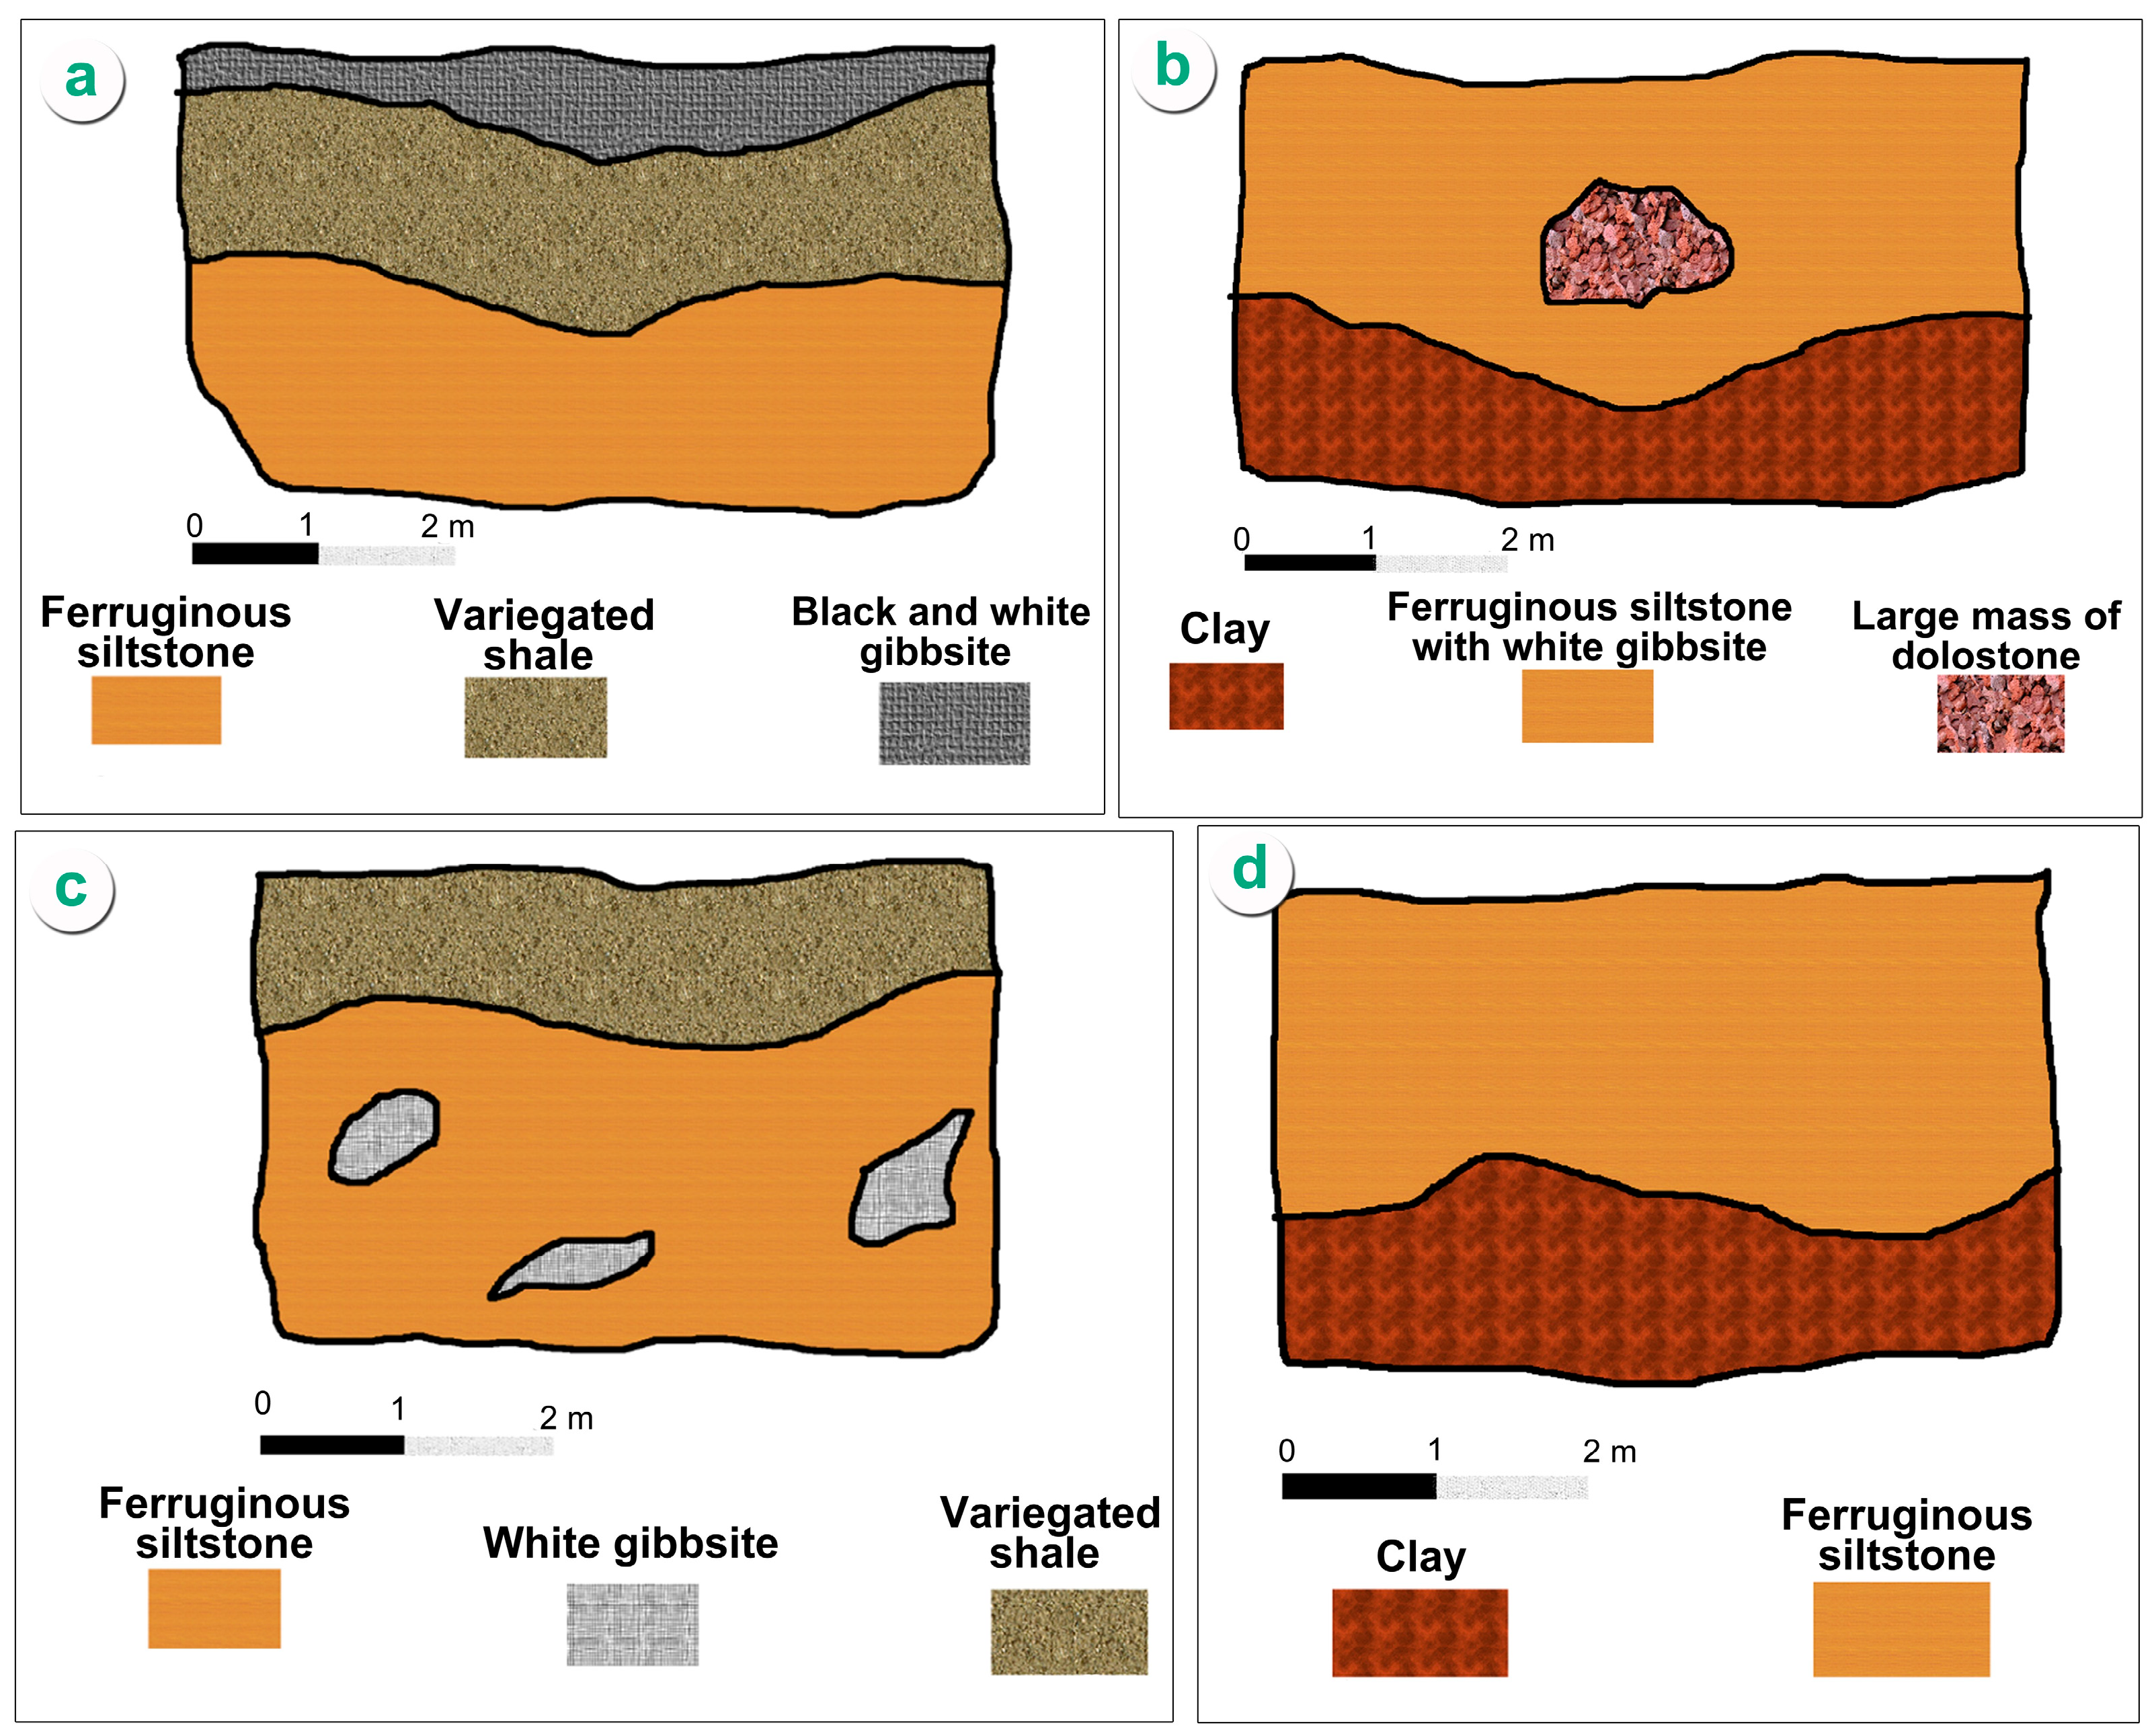
Figure 7. Schematic lithological and morphological profiles of paleokarst structures Ag.9–Ag.11, Allouga locality. (a) Ag.9. (b) Ag.10. (c) Ag.11. Fill unit symbols follow the legend in Figure 2a.
Minerals 16 00558 g007
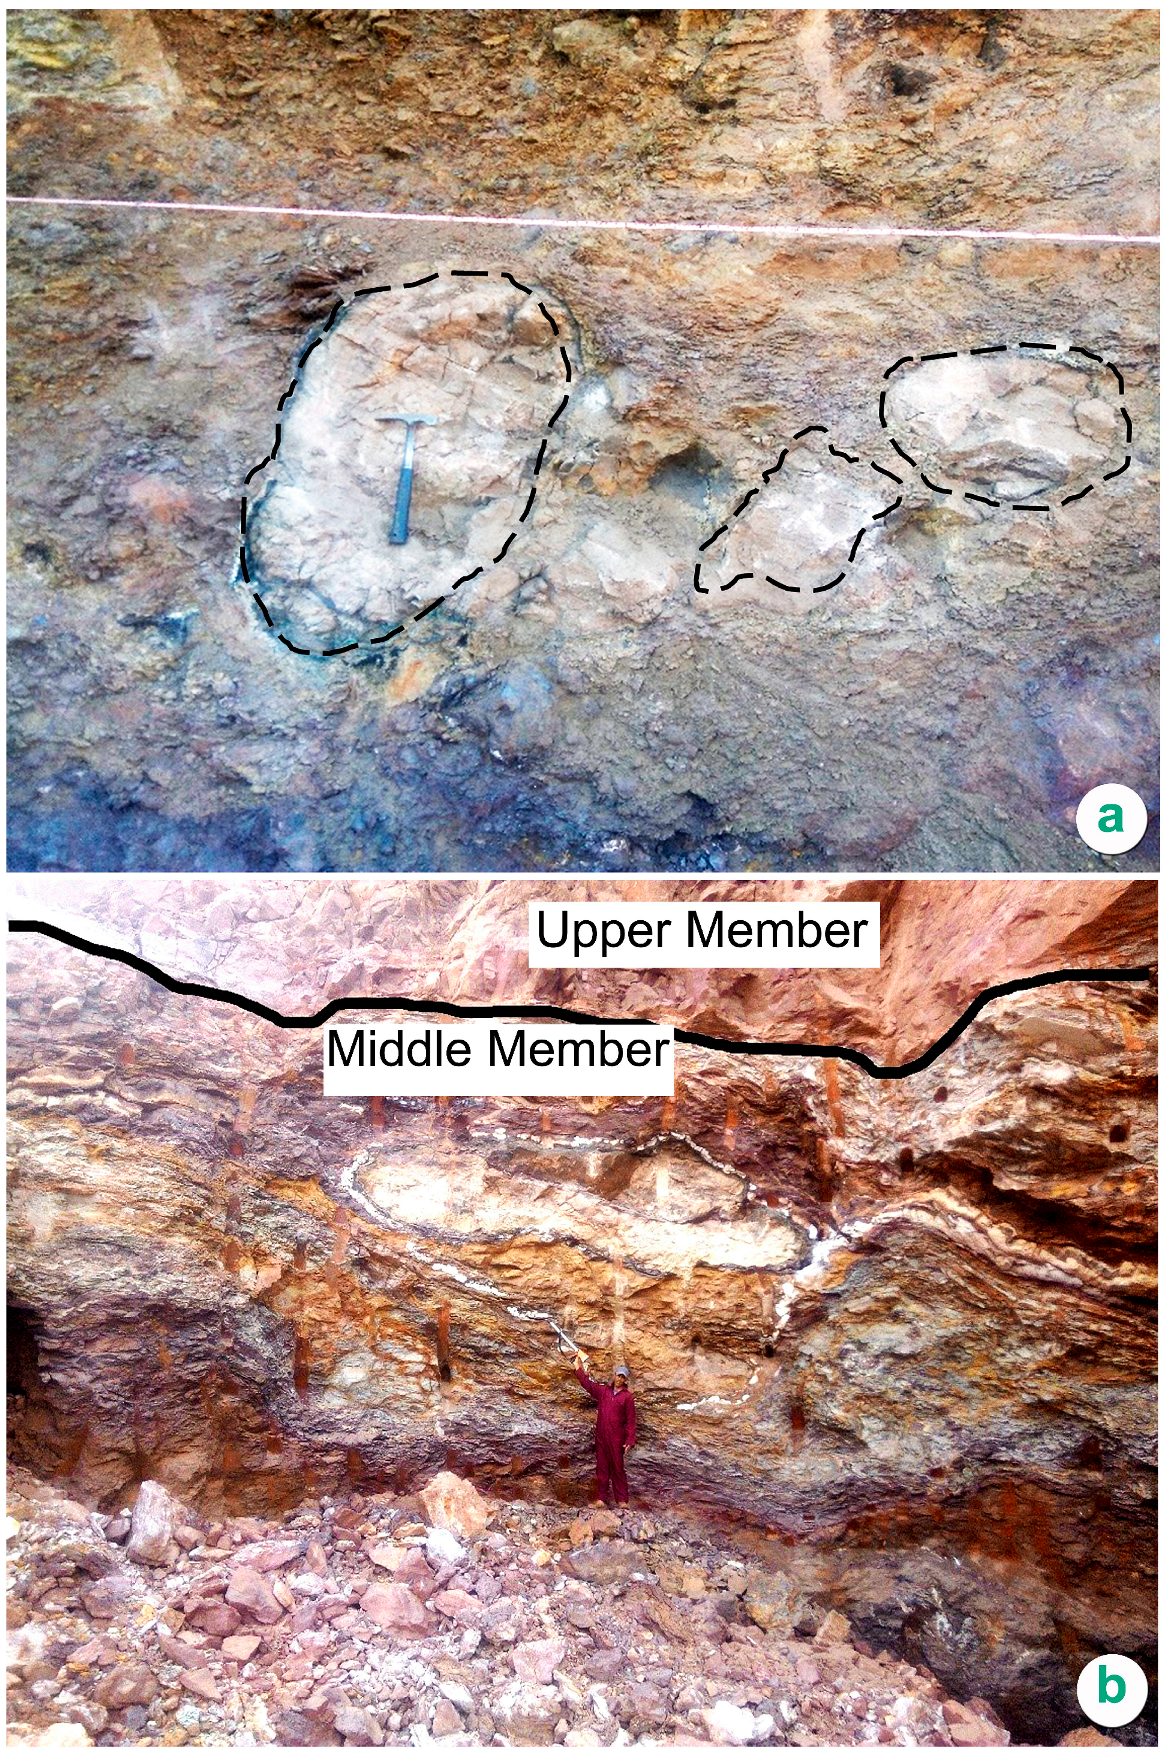
Figure 8. Internal fill architecture of Um Bogma paleokarst structures. (a) Angular dolostone boulders sinking within fine-grained clay fill, recording roof collapse without grain transport and confirming a subsurface dissolution origin for the paleokarst cavities. (b) Lower clay mineral horizon comprising clay, variegated shale, iron oxides, lateritic marl, and gibbsite, representing the alkaline–oxidizing Stage 1 of laterite evolution within the Um Bogma paleokarst fill.
Minerals 16 00558 g008
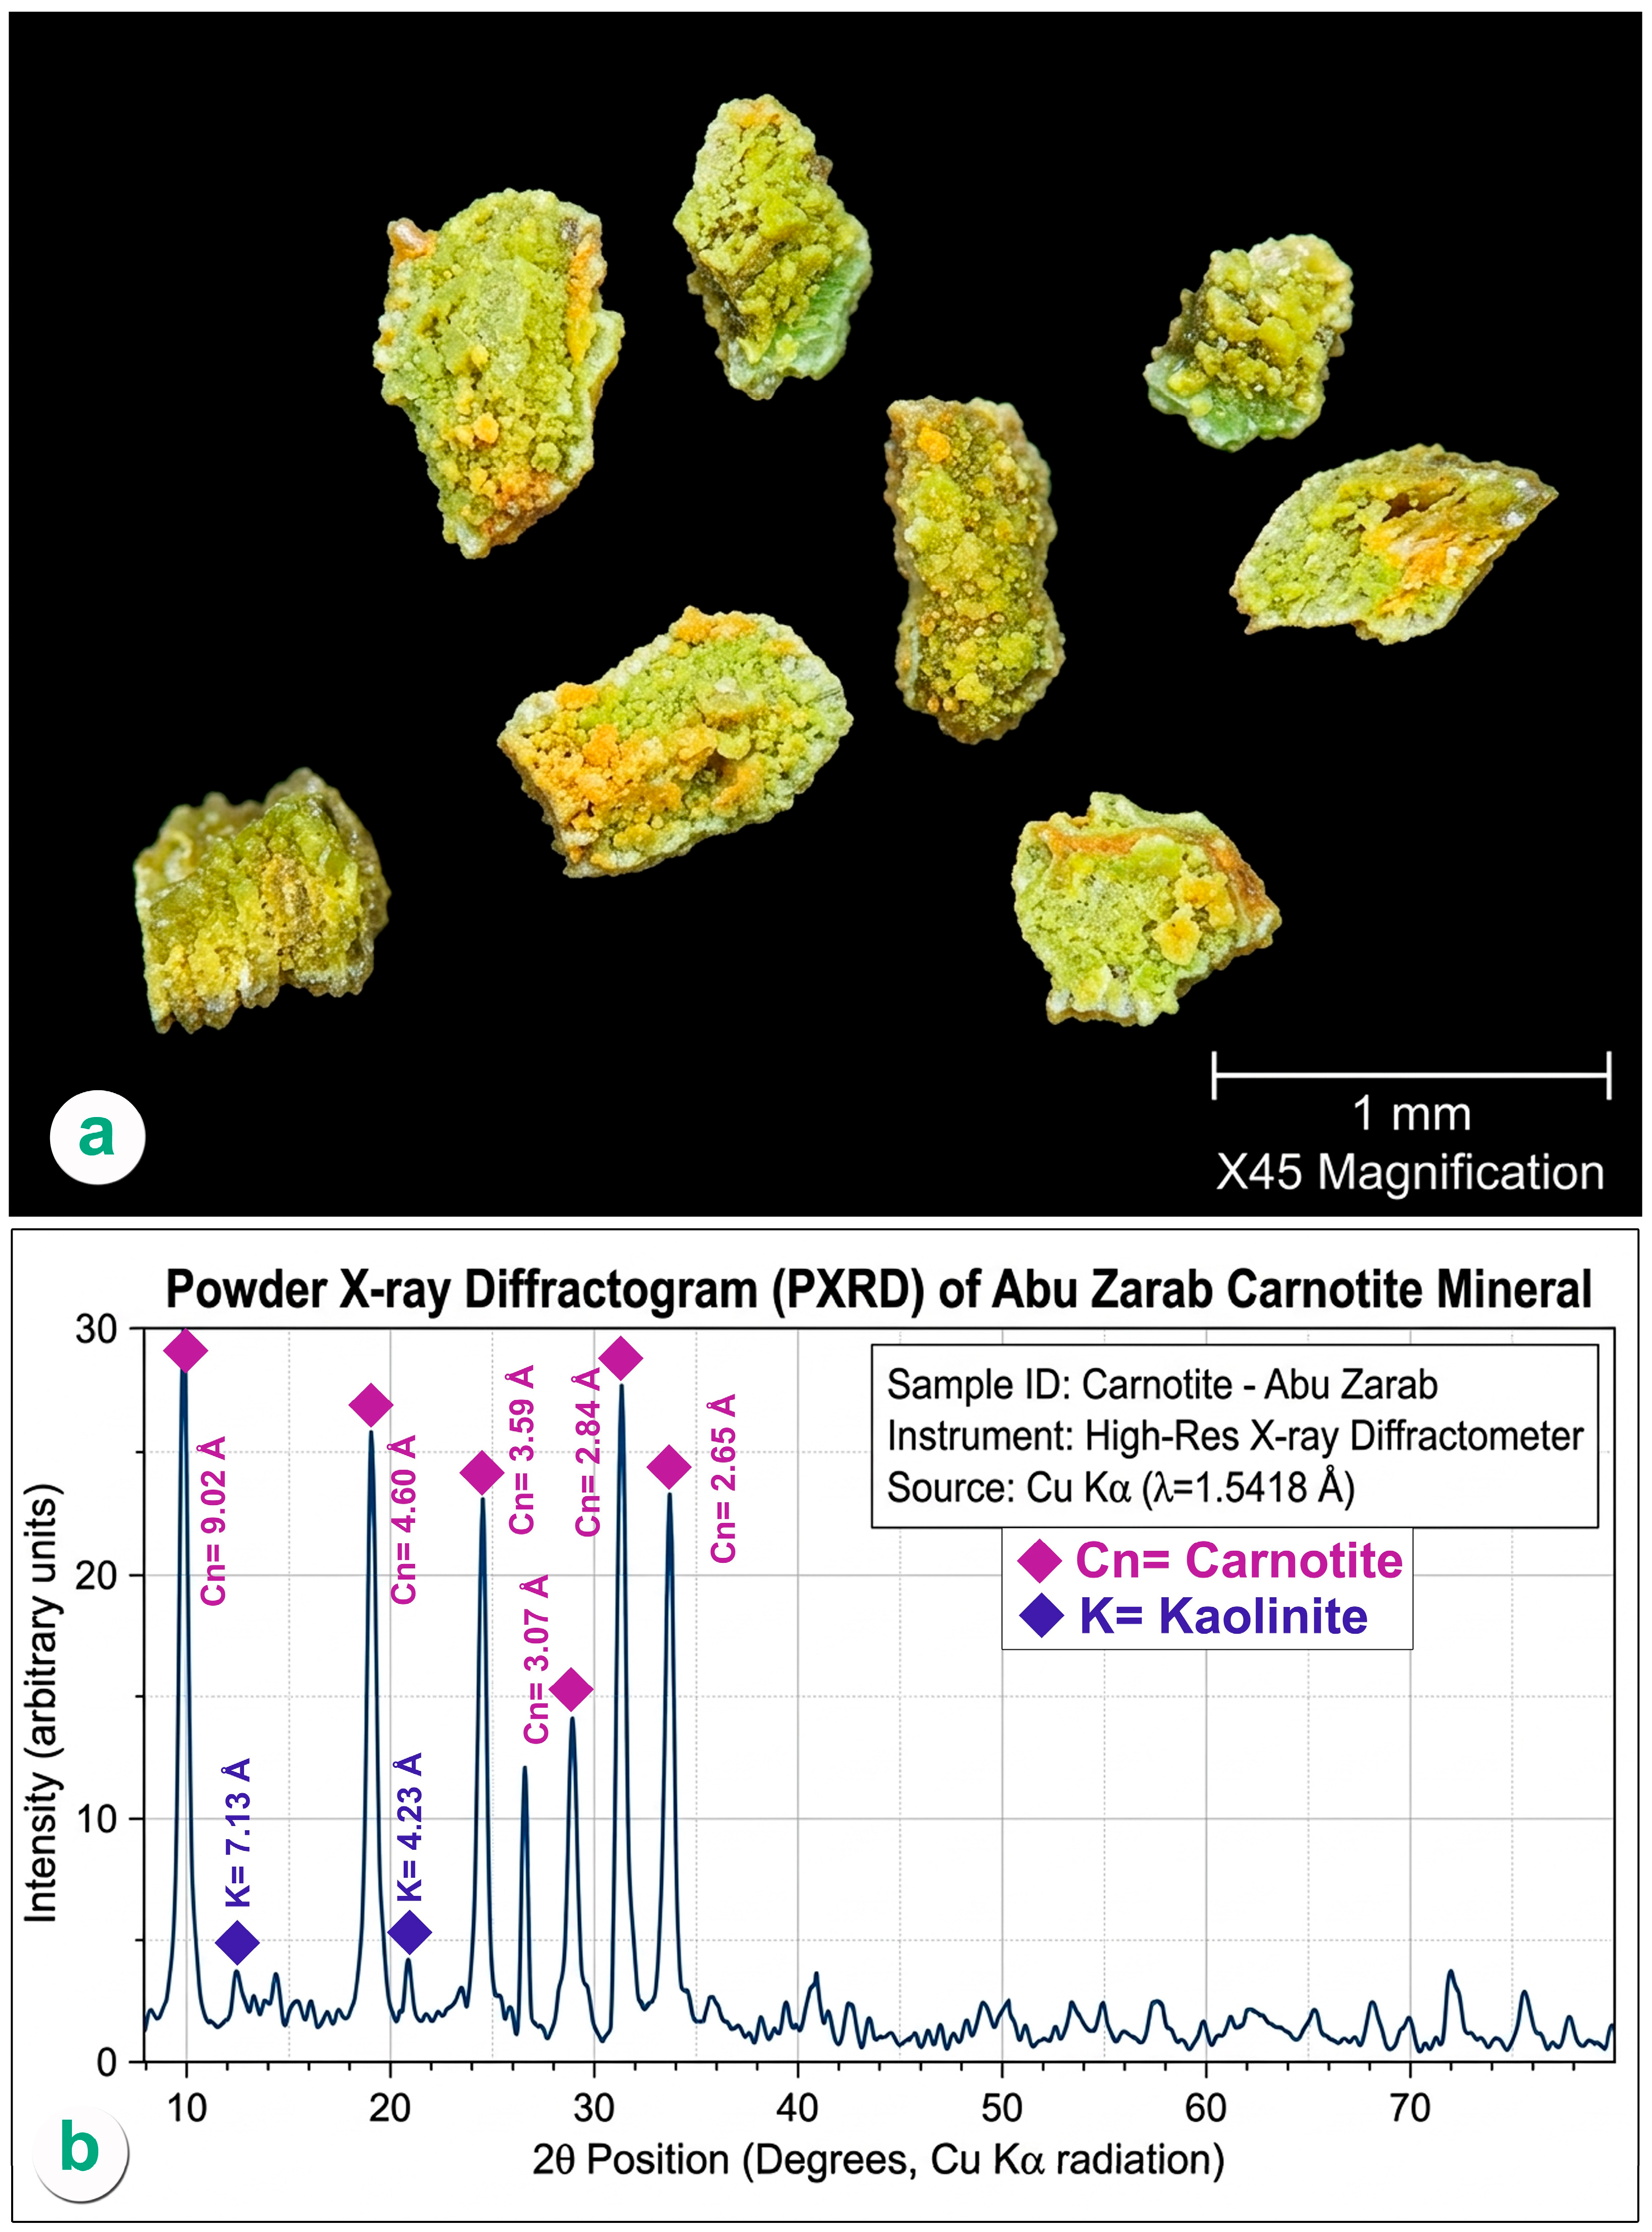
Figure 9. Carnotite [K2(UO2)2V2O8·3H2O] from the Abu Zarab paleokarst, kaolinite–gibbsite facies. (a) Binocular photomicrograph showing yellow to canarian-yellow grains with characteristic light-yellow luster; occurrence in the kaolinite–gibbsite zone directly records the interaction of V-rich alkaline fluids with uranium-bearing lateritic horizons during Stage 3 weathering. (b) XRD diffractogram confirming carnotite identification; diagnostic 2θ peaks labelled at 9.8°, 19.3°, 24.8°, 29.1°, 31.5°, and 33.8°; kaolinite minor reflections at 12.4° and ∼21.0° also annotated (Cu Kα, λ = 1.5406 Å).
Minerals 16 00558 g009
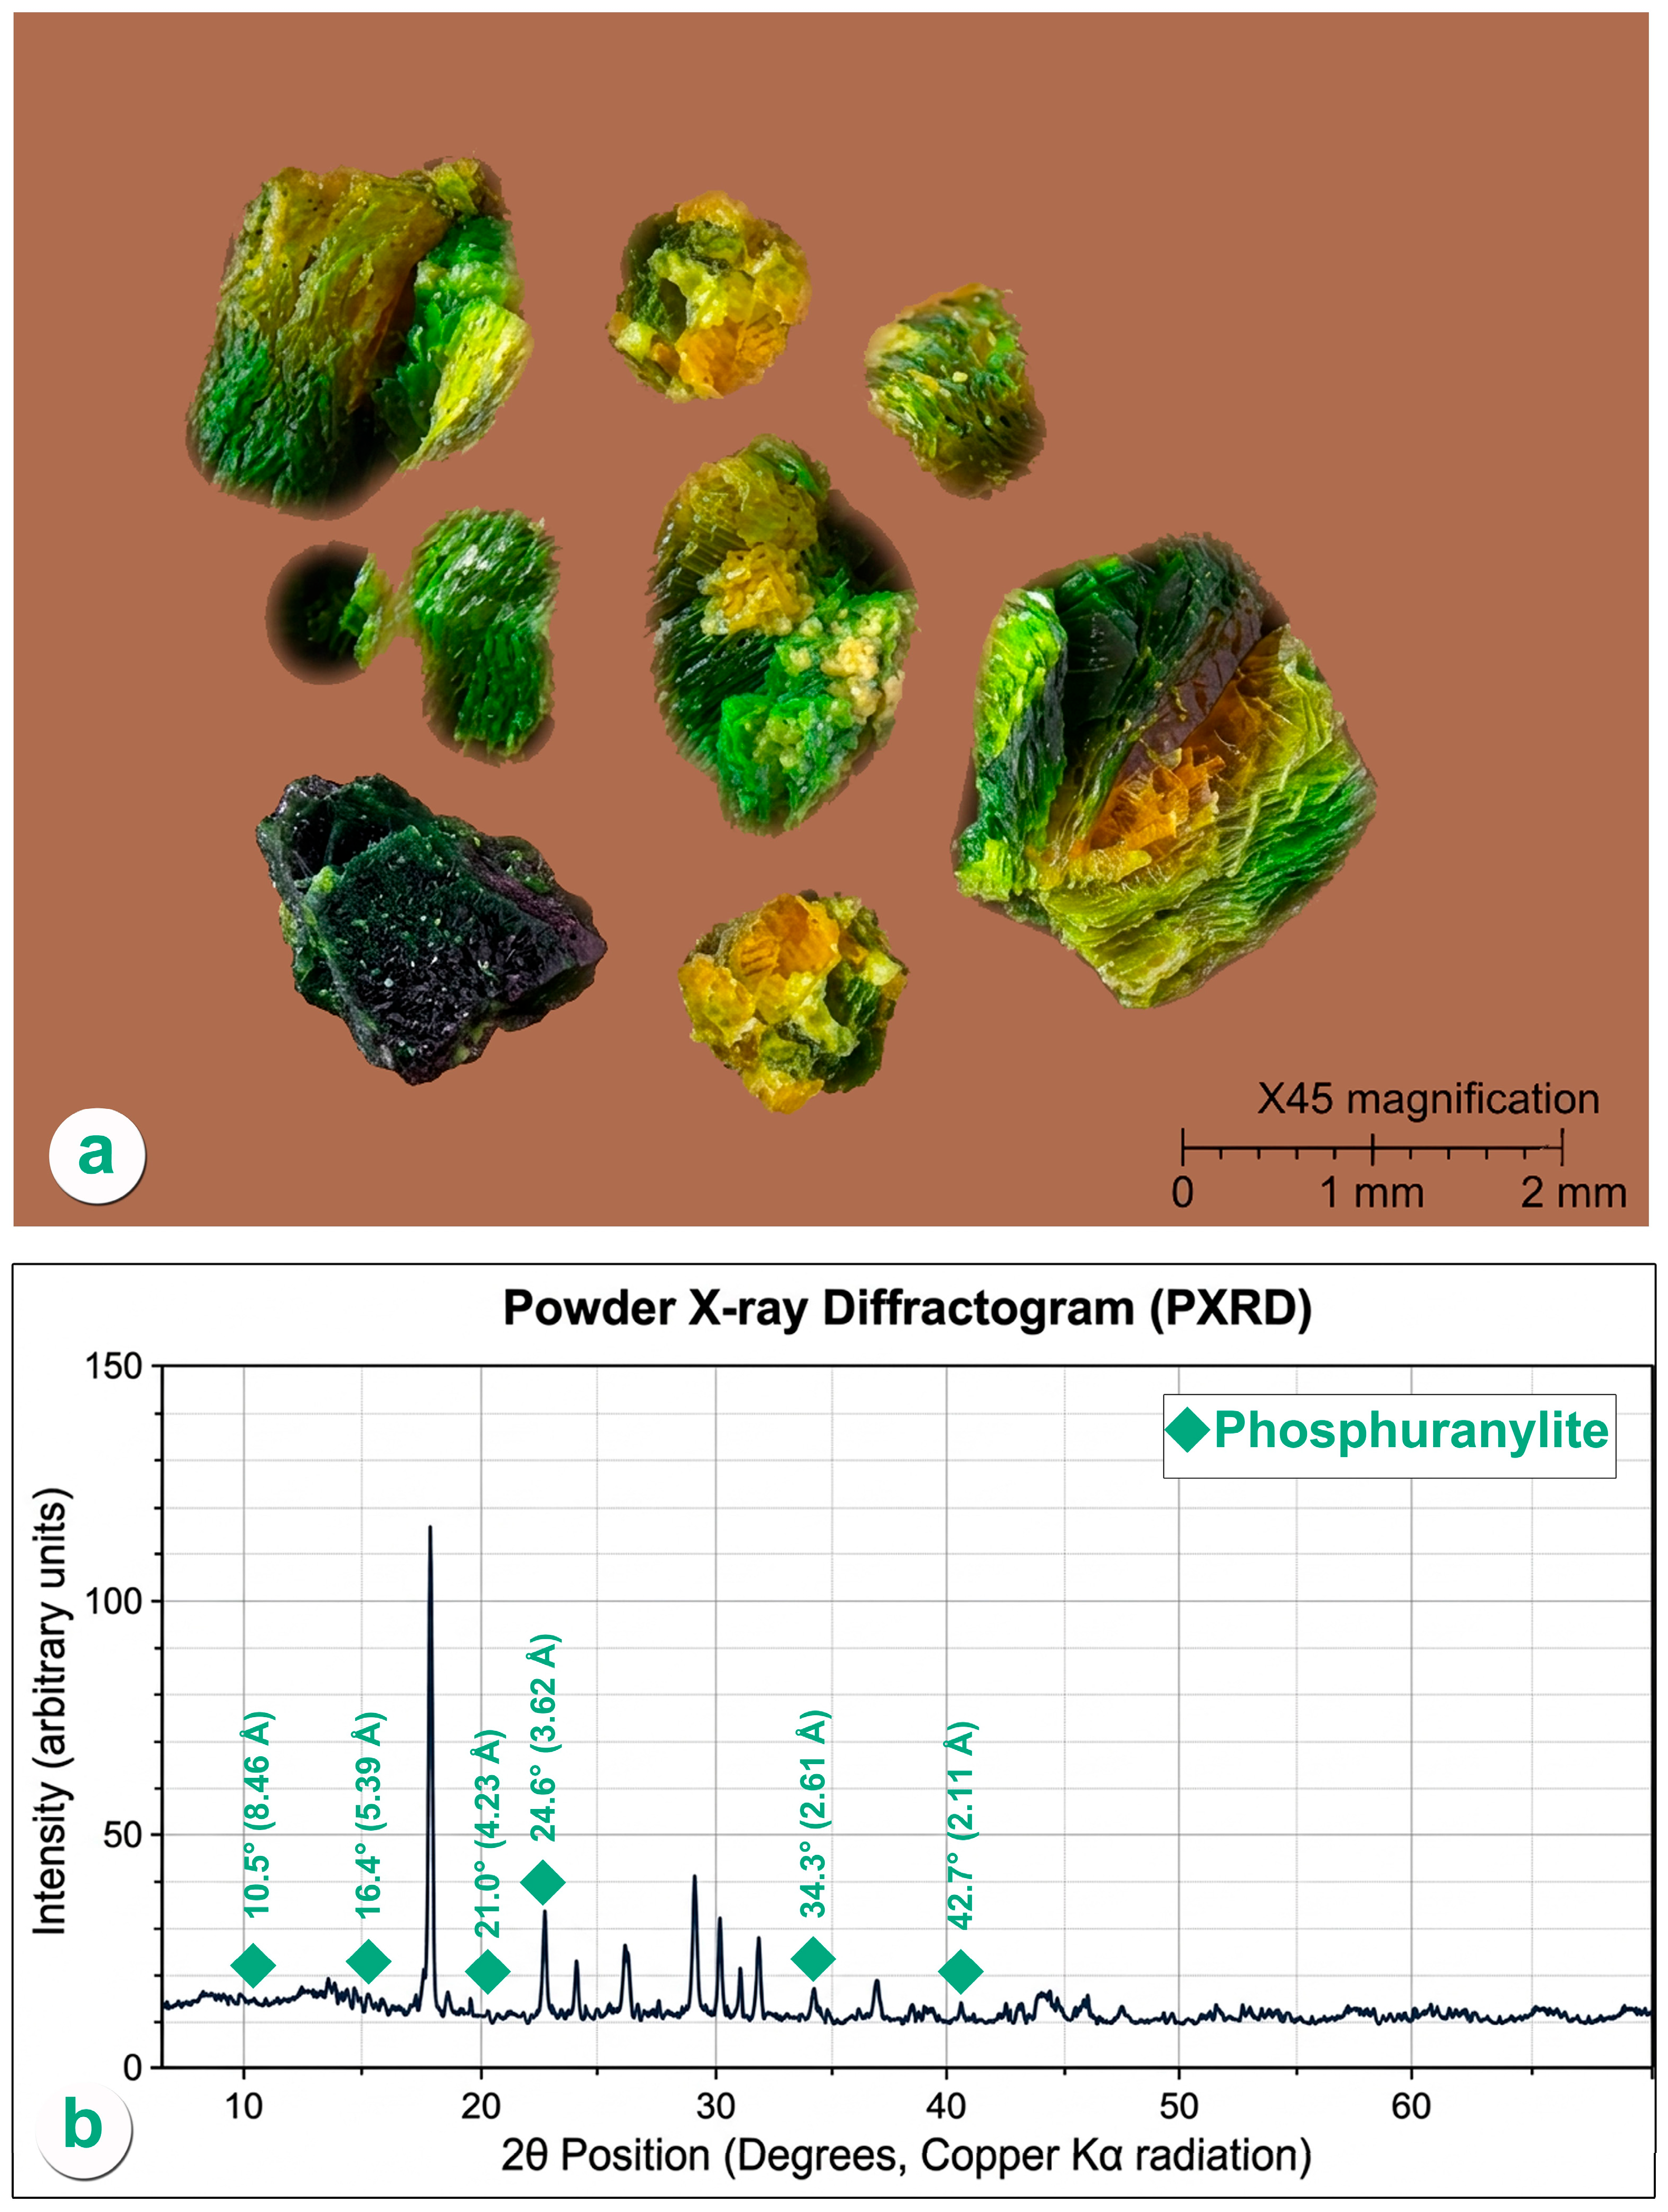
Figure 10. Phosphuranylite [KCa(H3O)3(UO2)7(PO4)4O4·8H2O] from the Abu Zarab paleokarst, clay mineral facies. (a) Binocular photomicrograph showing greenish-yellow crystal aggregates. (b) XRD diffractogram confirming phosphuranylite identification; diagnostic 2θ peaks at 10.5° (d = 8.46 Å, primary), 16.4° (5.39 Å), 21.0° (4.23 Å), 24.6° (3.62 Å), 34.3° (2.61 Å), and 42.7° (2.11 Å); Cu Kα.
Minerals 16 00558 g010
The uranium distribution across the formation is governed by four diagenetic processes: dolomitization, dedolomitization, lateritization, and karstification. The Um Bogma Formation is a polymineralized unit that hosts uranium, Fe–Mn ore, and secondary copper and phosphate deposits within a single stratigraphic interval [4,31].
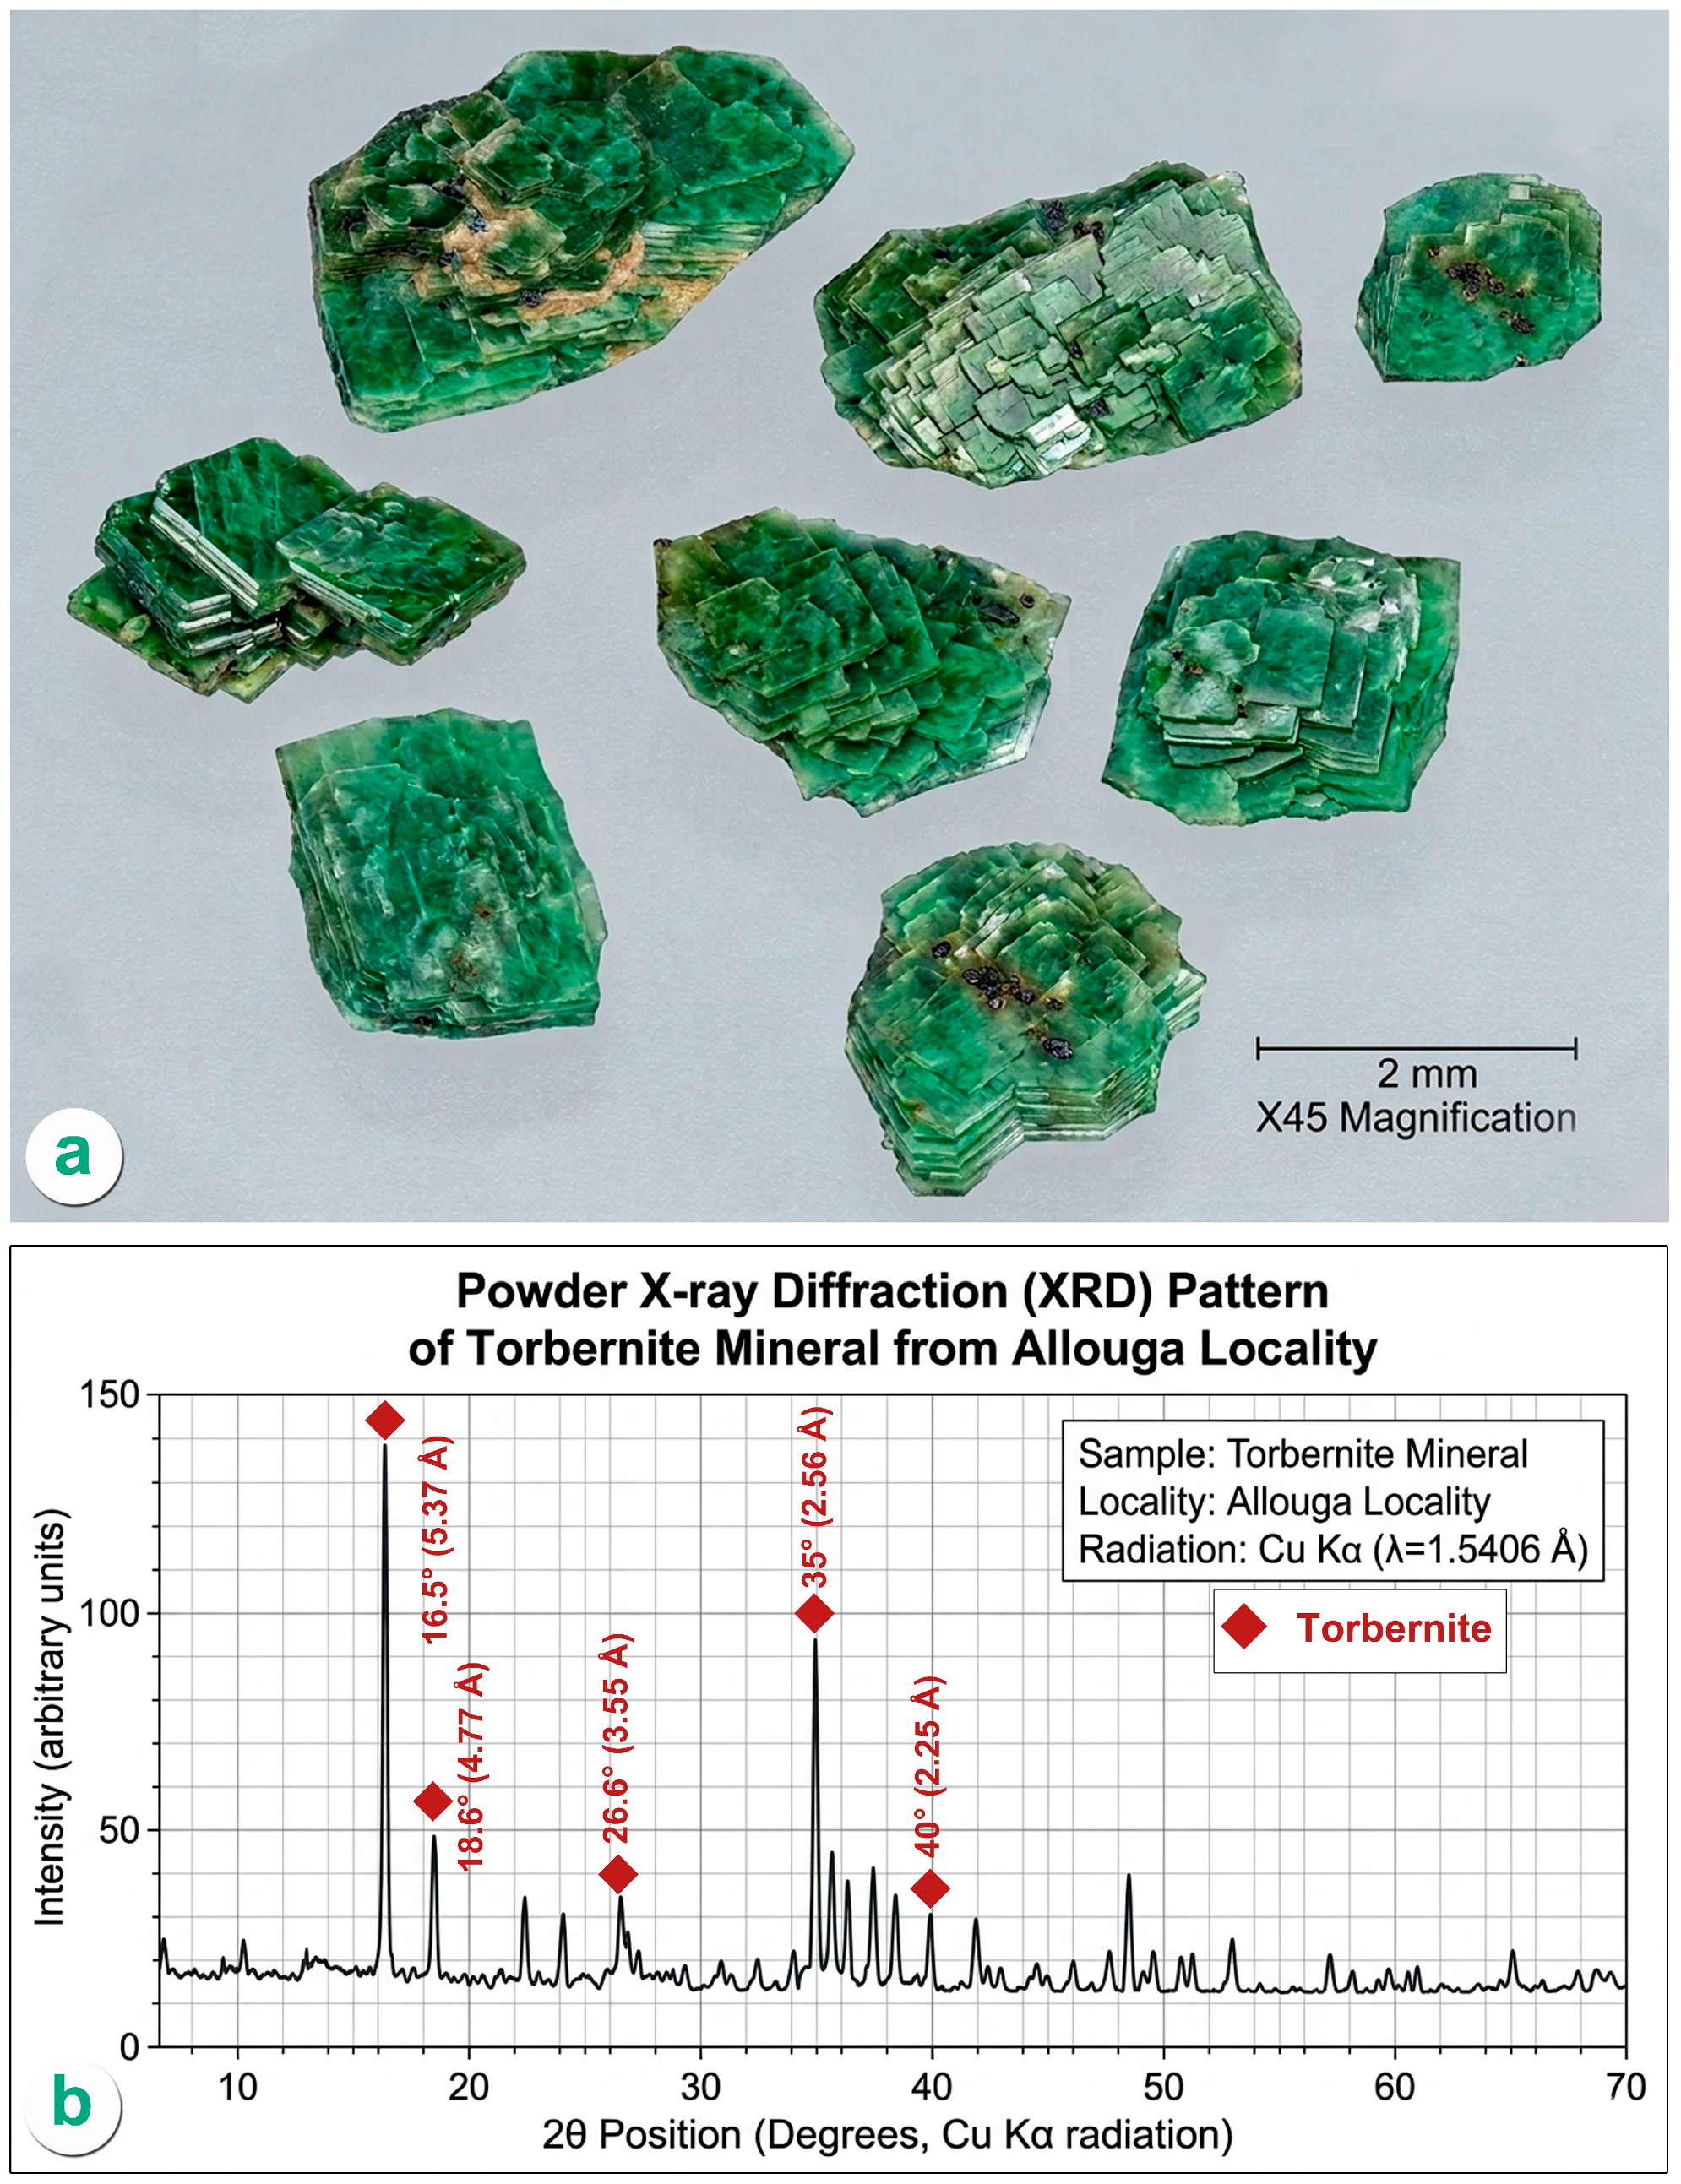
Figure 11. Torbernite [Cu(UO2)2(PO4)2·8–12H2O] from the Allouga paleokarst, copper-enriched ferruginous siltstone. (a) Binocular photomicrograph showing transparent to subtranslucent, two-dimensional platy crystals with apple-green color; occurrence with copper-rich siltstone establishes the coupled mobility of uranium and copper in oxidizing paleokarst fluids. (b) XRD diffractogram confirming torbernite identification; peaks labelled at 8.5°, 16.5° (primary), 18.6°, 22.5°, 24.2°, 26.6°, 35.0°, comb cluster 35.7–40.0°, and 48.5°; Cu Kα radiation.
Minerals 16 00558 g011
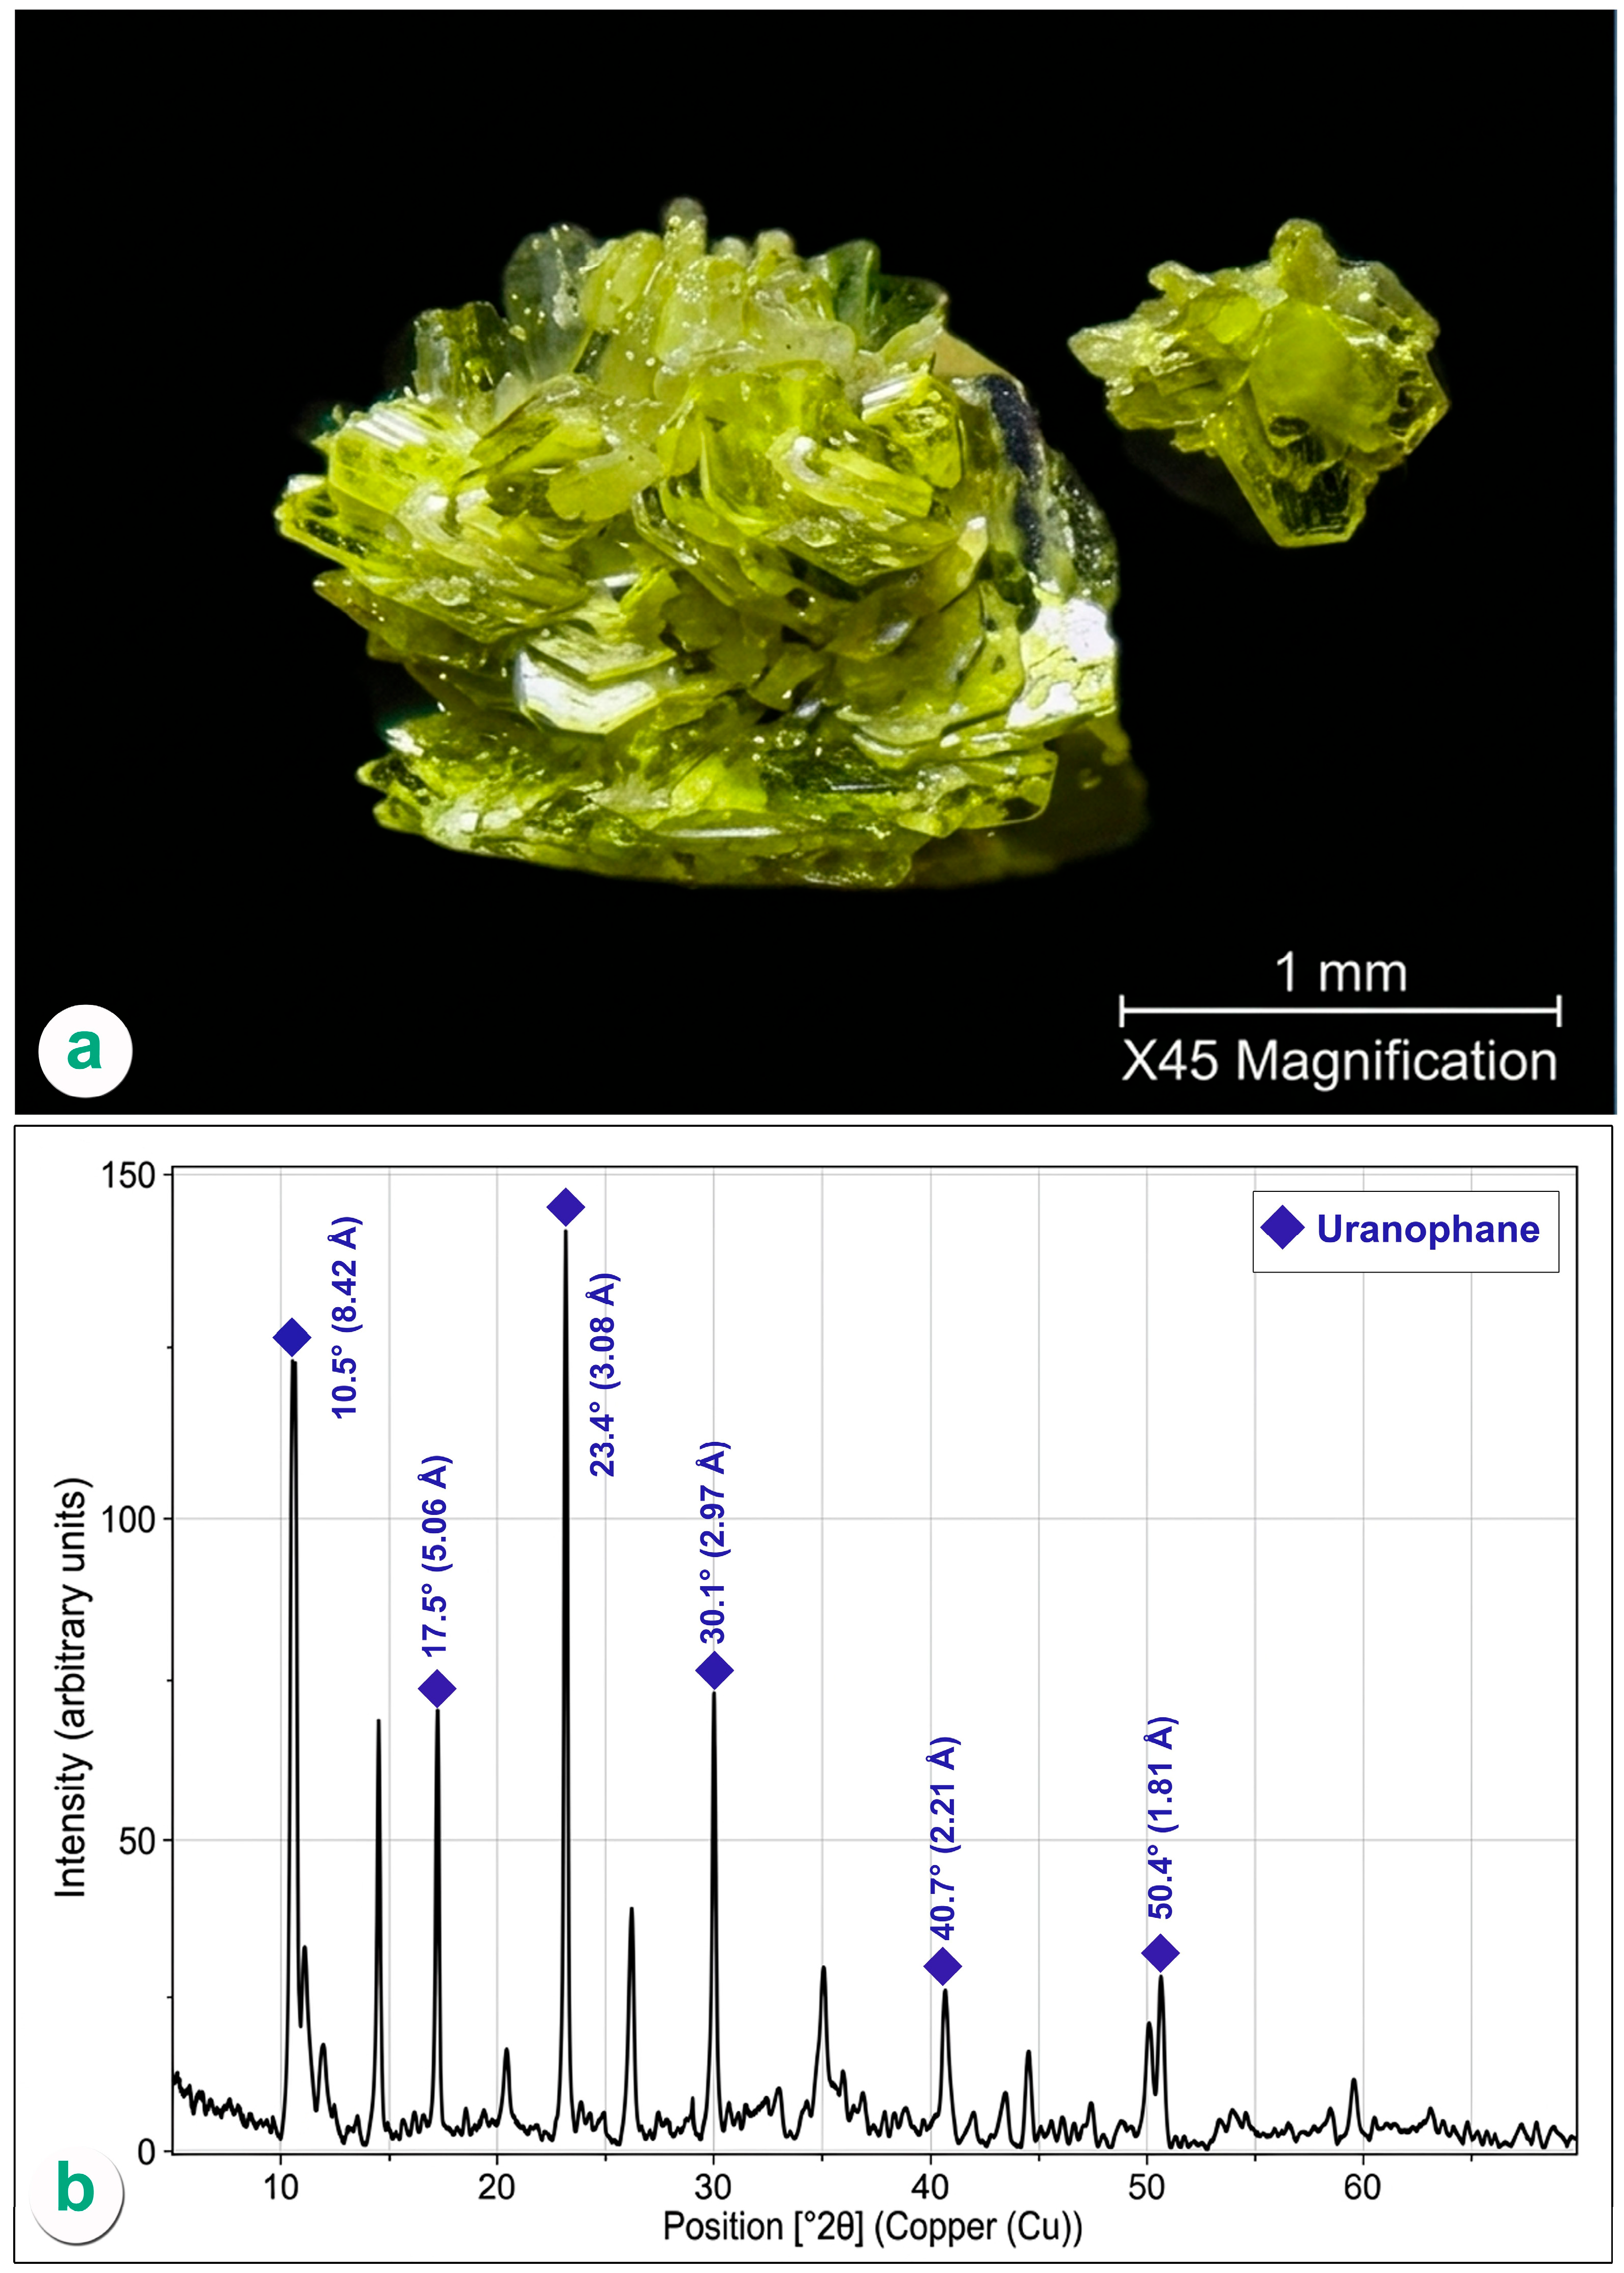
Figure 12. Uranophane [Ca(UO2)2SiO3(OH)2·5H2O] from the Allouga paleokarst, ferruginous siltstone ore body. (a) Binocular photomicrograph showing fibrous radiating aggregates with yellowish-orange to light-yellow color and a yellowish-white streak; its restriction to the ferruginous siltstone horizon is consistent with uranium fixation during the iron-oxide-dominated Stage 2 of laterite evolution. (b) XRD diffractogram confirming uranophane identification; peaks labelled at 10.5° (8.42 Å), 14.6° (6.06 Å), 17.5° (5.06 Å), 23.4° (3.80 Å, primary), 30.1° (2.97 Å), 35.1° (2.55 Å), 40.7° (2.21 Å), 50.4° (1.81 Å); Cu Kα.
Minerals 16 00558 g012
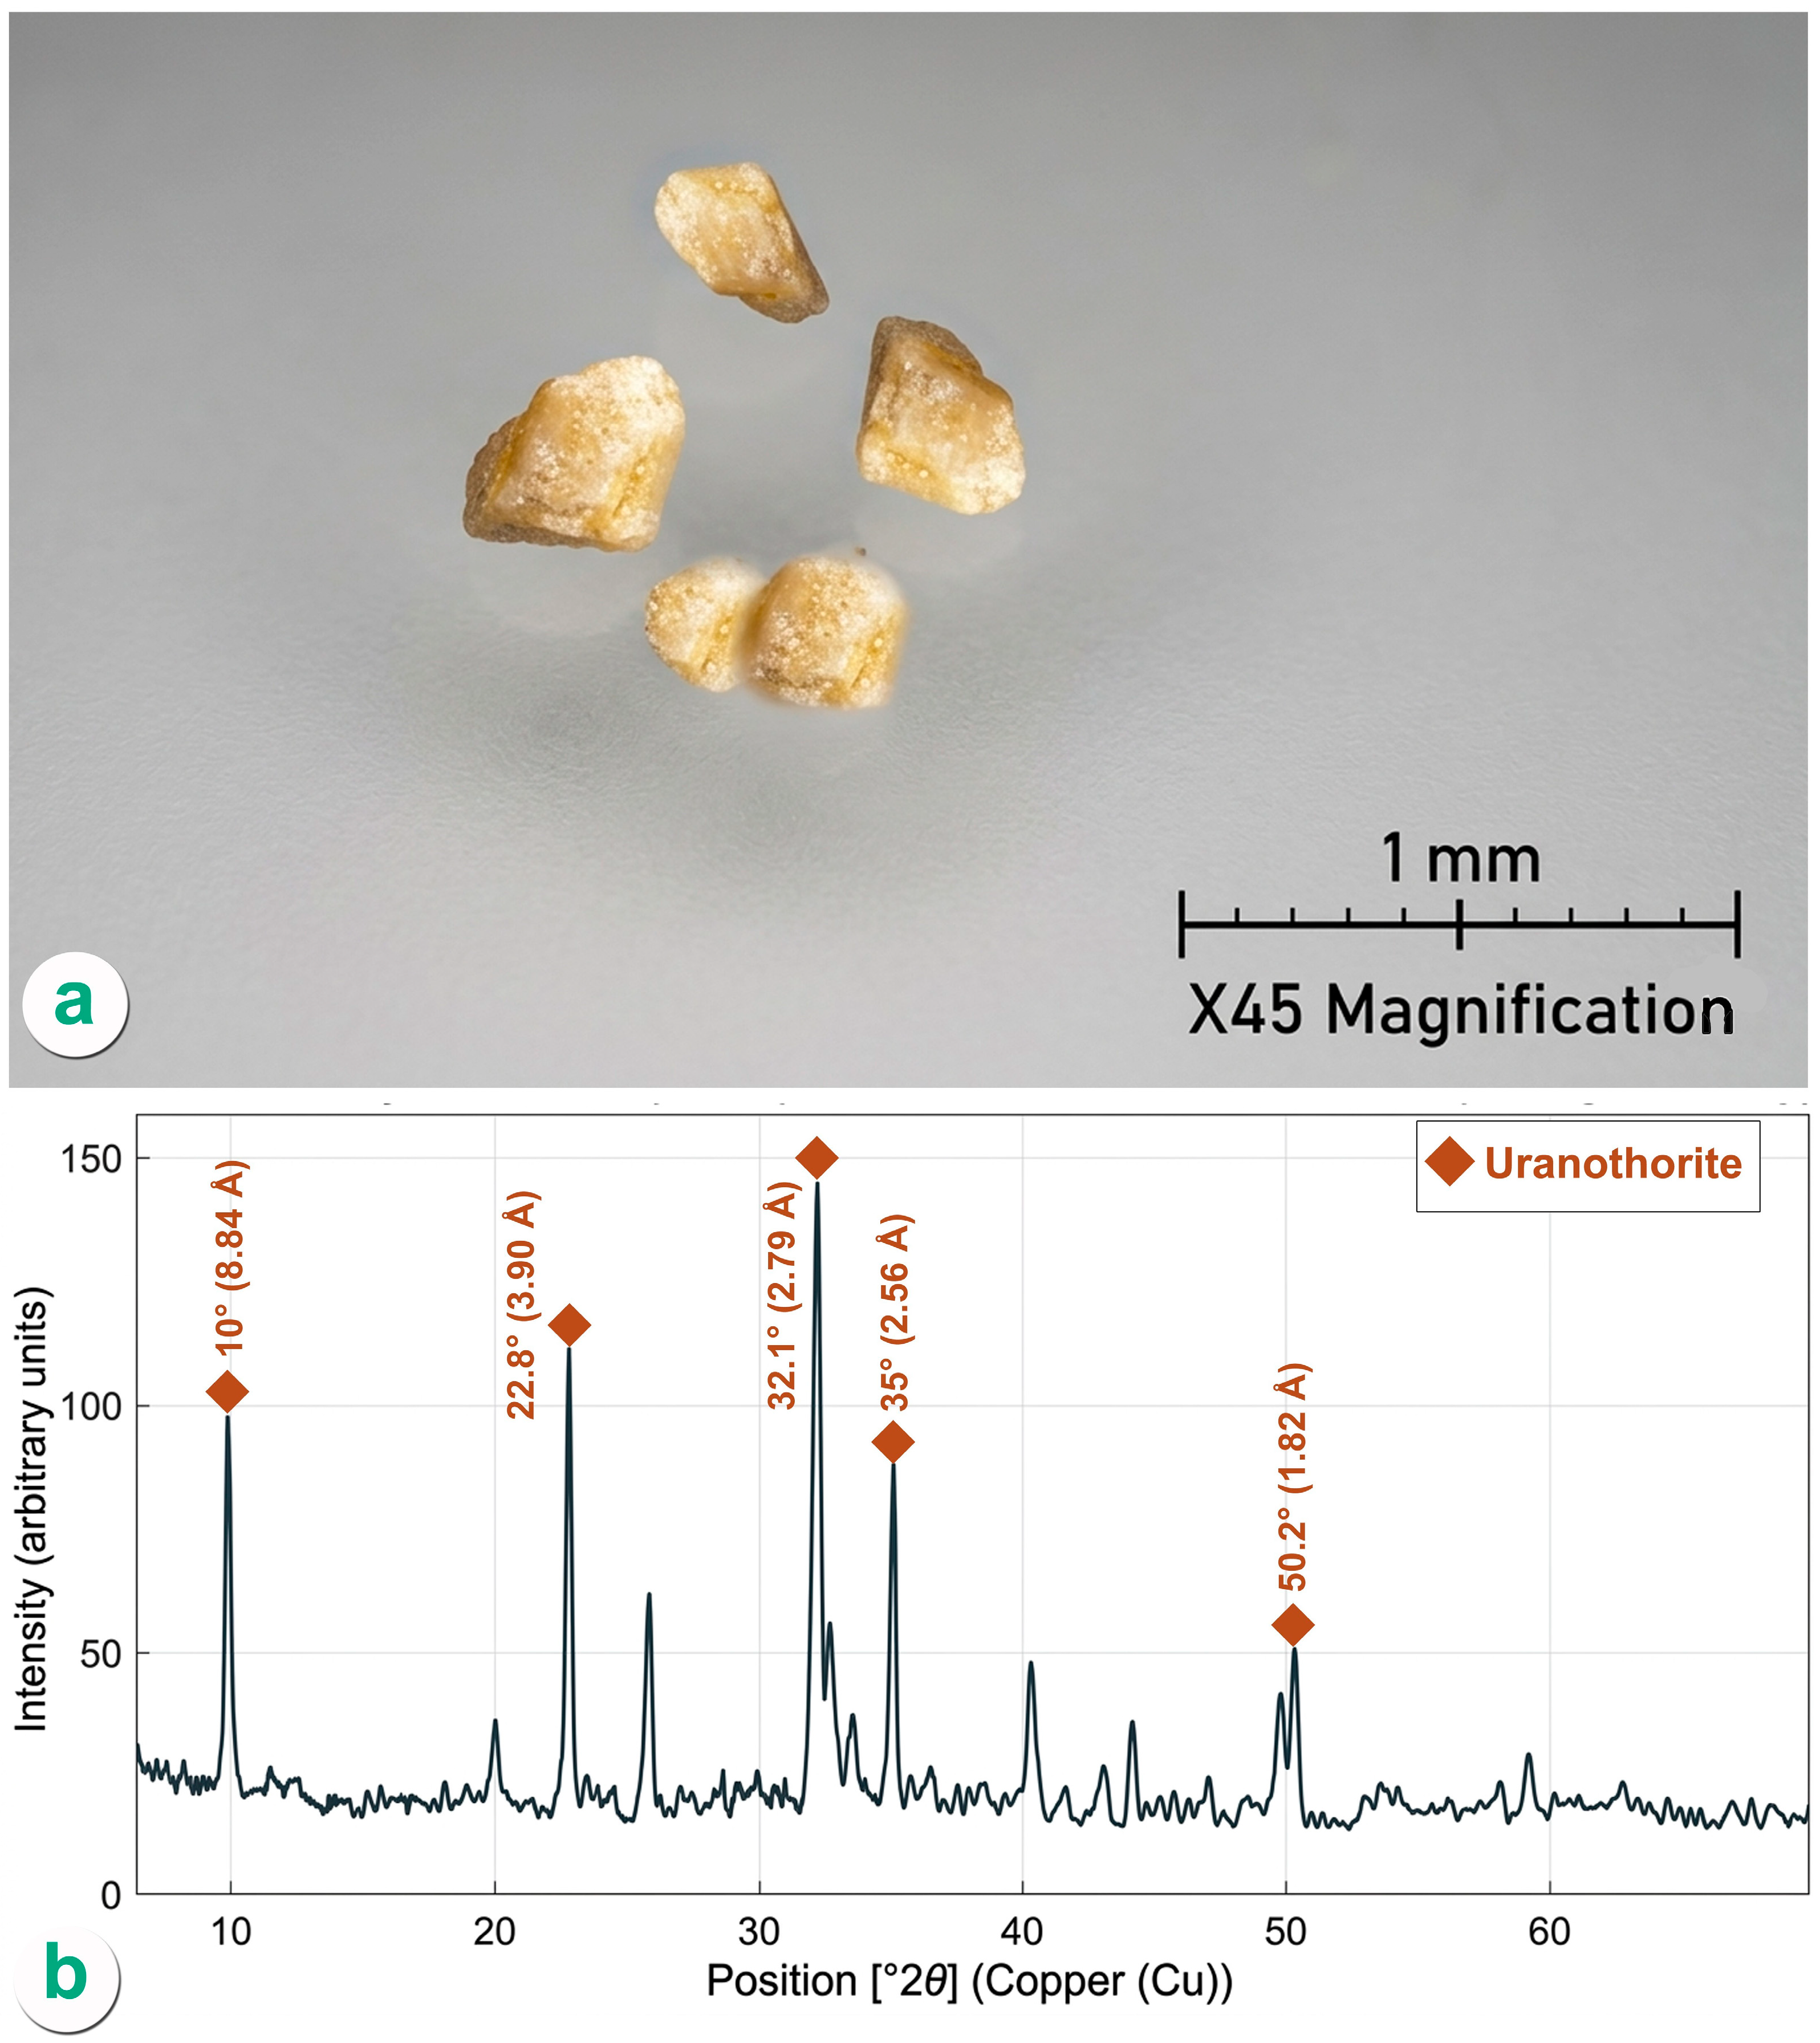
Figure 13. Uranothorite [(Th,U)SiO4] from the Allouga paleokarst, ferruginous siltstone facies. (a) Binocular photomicrograph showing minute dark-brown to pale-brownish anhedral crystals, occurring as both metamict and non-metamict varieties; the mineral may represent a primary crystallization product or a detrital input contributing a non-supergene U–Th component to the fill. (b) XRD diffractogram confirming uranothorite identification; peaks labelled at 10.0° (8.84 Å), 22.8° (3.90 Å), 25.8° (3.45 Å), 32.1° (2.79 Å, primary), 35.0° (2.56 Å), 40.3° (2.24 Å), 50.2° (1.82 Å); Cu Kα.
Minerals 16 00558 g013

2.3. Paleokarst Occurrences: Distribution and Internal Lithofacies

Sixteen paleokarst structures have been documented within the Um Bogma Formation across three localities: eight at Abu Thor (ATh. 1–ATh. 8) (Figure 5a–d and Figure 6a–d), five at Allouga (Ag. 9–Ag. 13) (Figure 7a–c), and three at Abu Zarab (Figure 4a). Developed exclusively within the carbonate members, these dissolution features serve as the primary structural and geochemical traps for uranium mineralization [7,21]. Their clustering is governed by the intersection of dissolution-susceptible lithologies with NNW-to-NW and N-to-NE structural corridors.
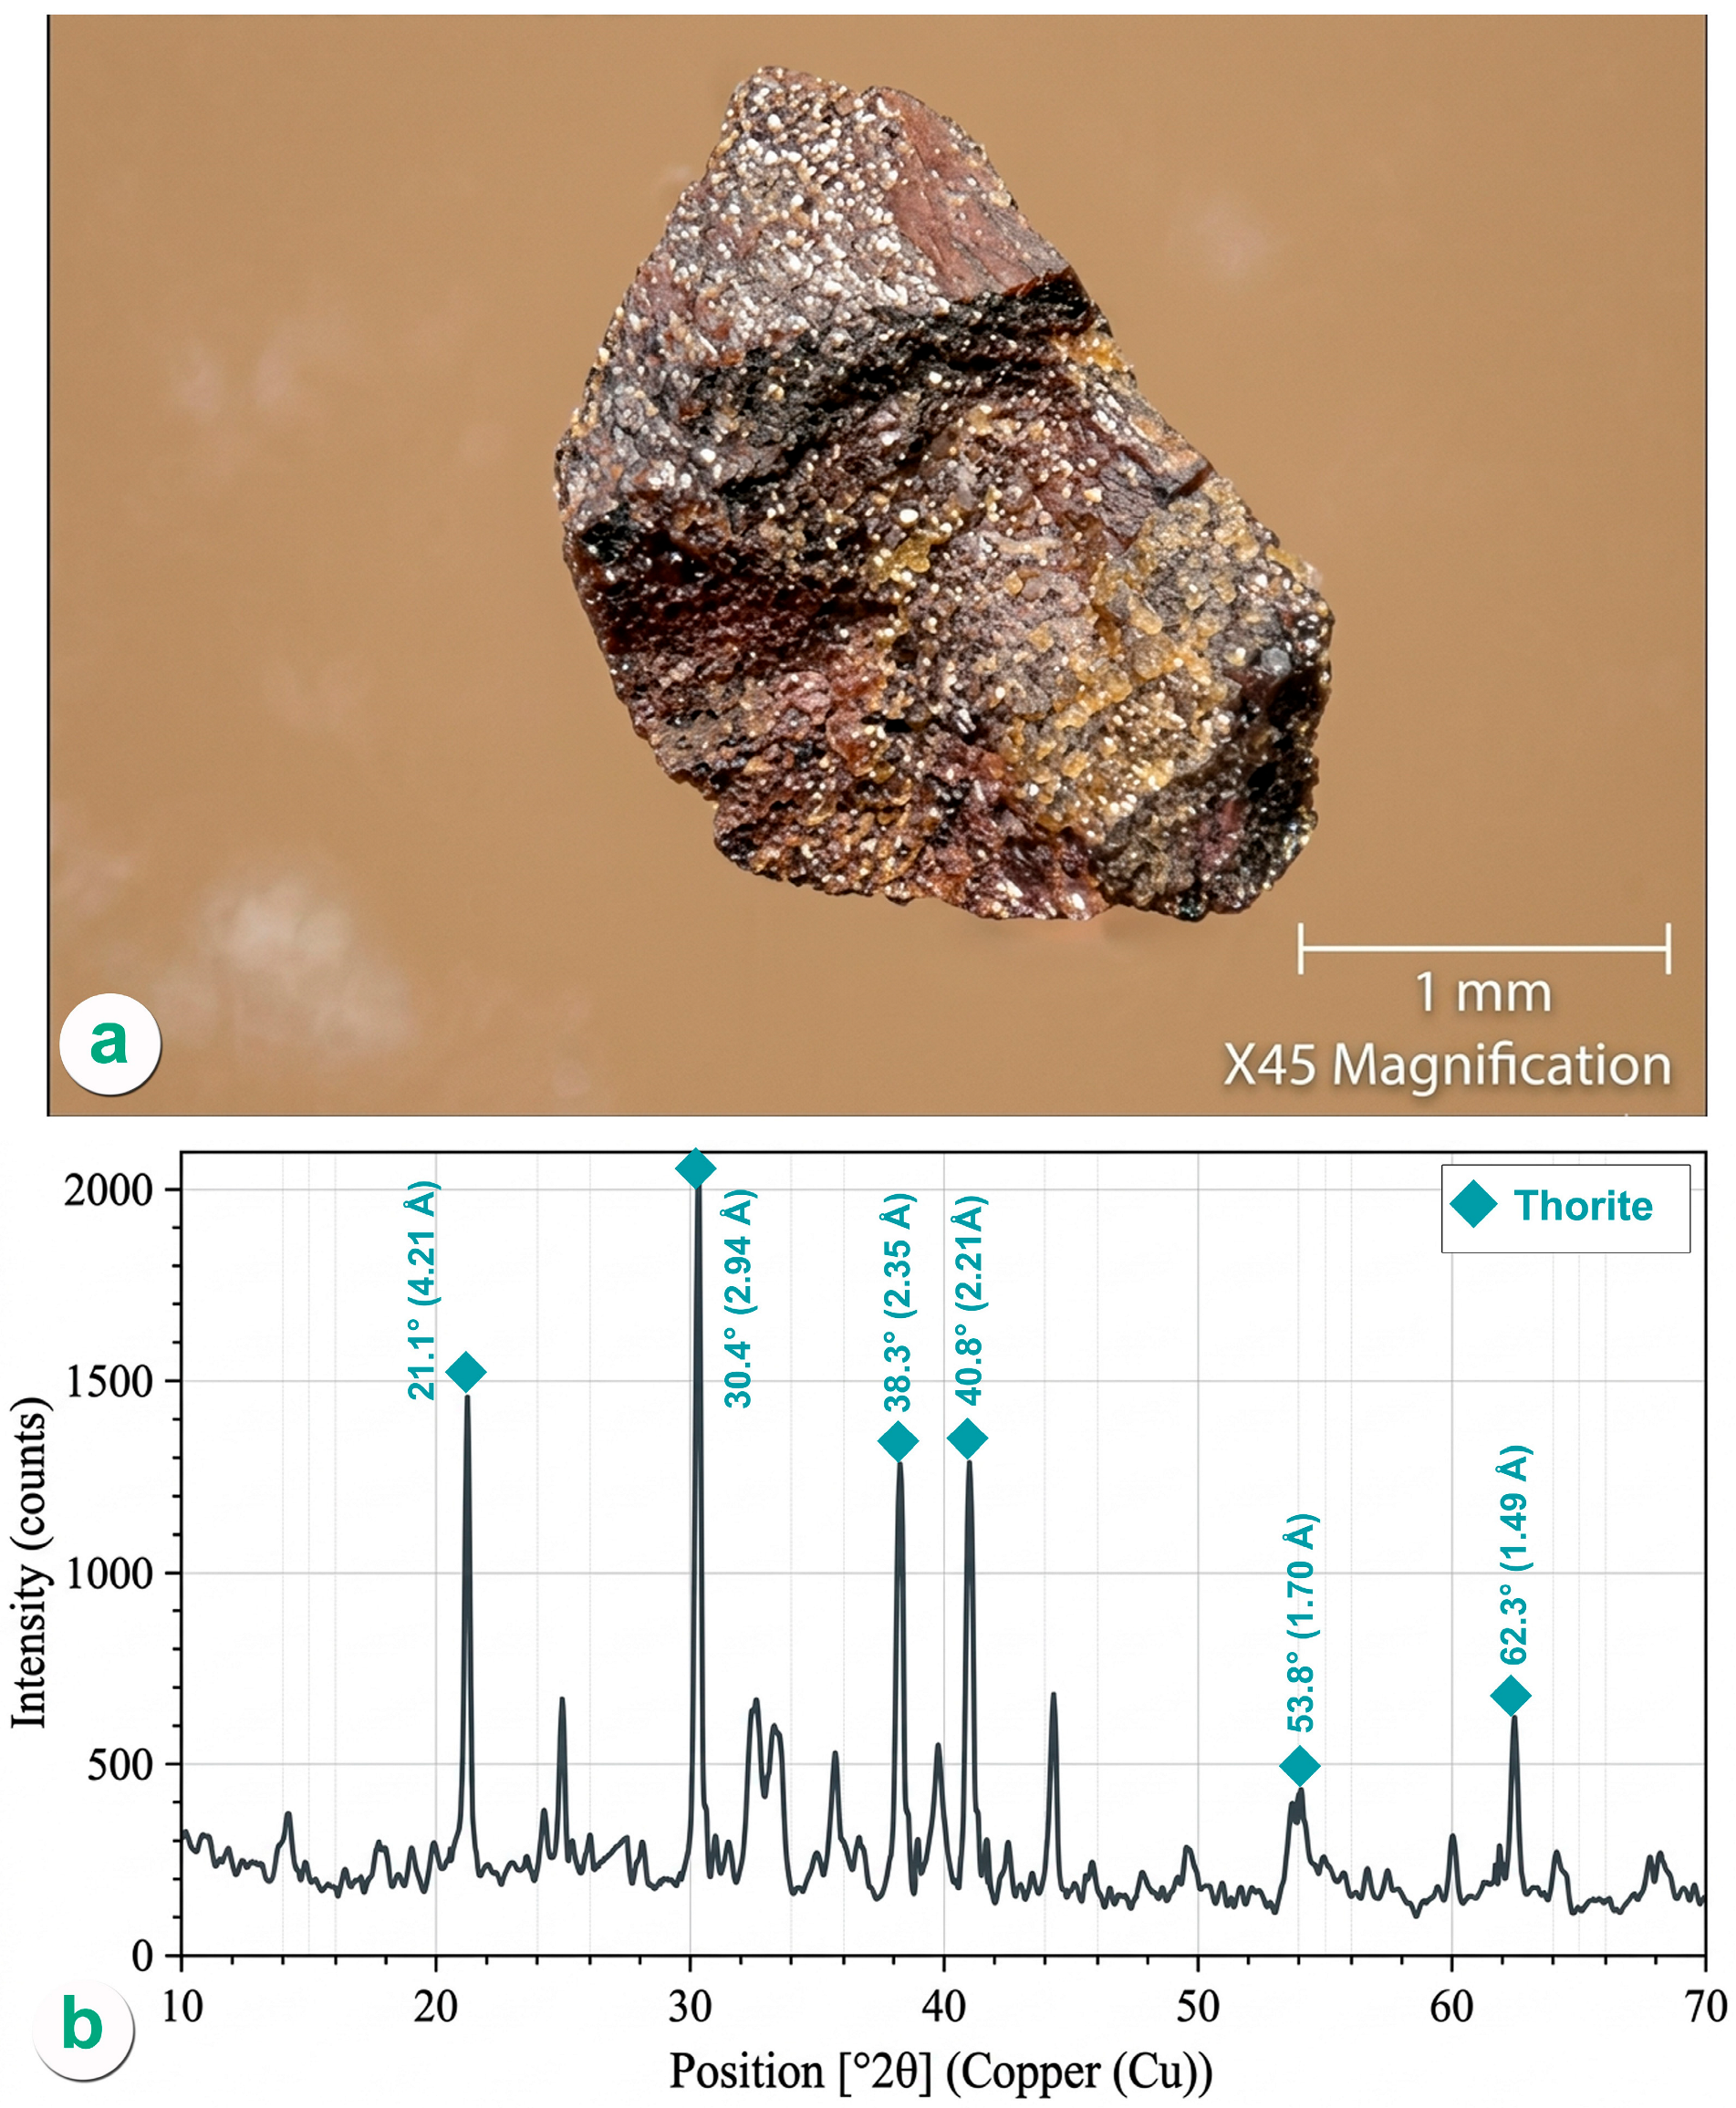
Figure 14. Thorite [ThSiO4] from the Allouga paleokarst, ferruginous claystone zone. (a) Binocular photomicrograph showing transparent to subtranslucent brownish-yellow to brownish-orange anhedral to subhedral crystals, occasionally developing slender tetragonal prismatic habits; crystals occur along fractures within the claystone. (b) XRD diffractogram confirming thorite identification; peaks labelled at 21.1° (4.21 Å), 24.9° (3.57 Å), 30.4° (2.94 Å, primary), 38.3° (2.35 Å), 40.8° (2.21 Å), 44.2° (2.05 Å), 53.8° (1.70 Å), 62.3° (1.49 Å); Cu Kα.
Minerals 16 00558 g014
Morphologically, the structures range from V-shaped and U-shaped to pipe-like and irregular, with widths of 3–15 m and depths of up to 13 m (Figure 4b,c). The individual profiles for all sixteen features are documented in Figure 5a–d, Figure 6a–d and Figure 7a–c.
Despite this morphological diversity, each structure displays a consistent succession of internal lithofacies that records the evolving paleohydrologic conditions controlling uranium fixation.
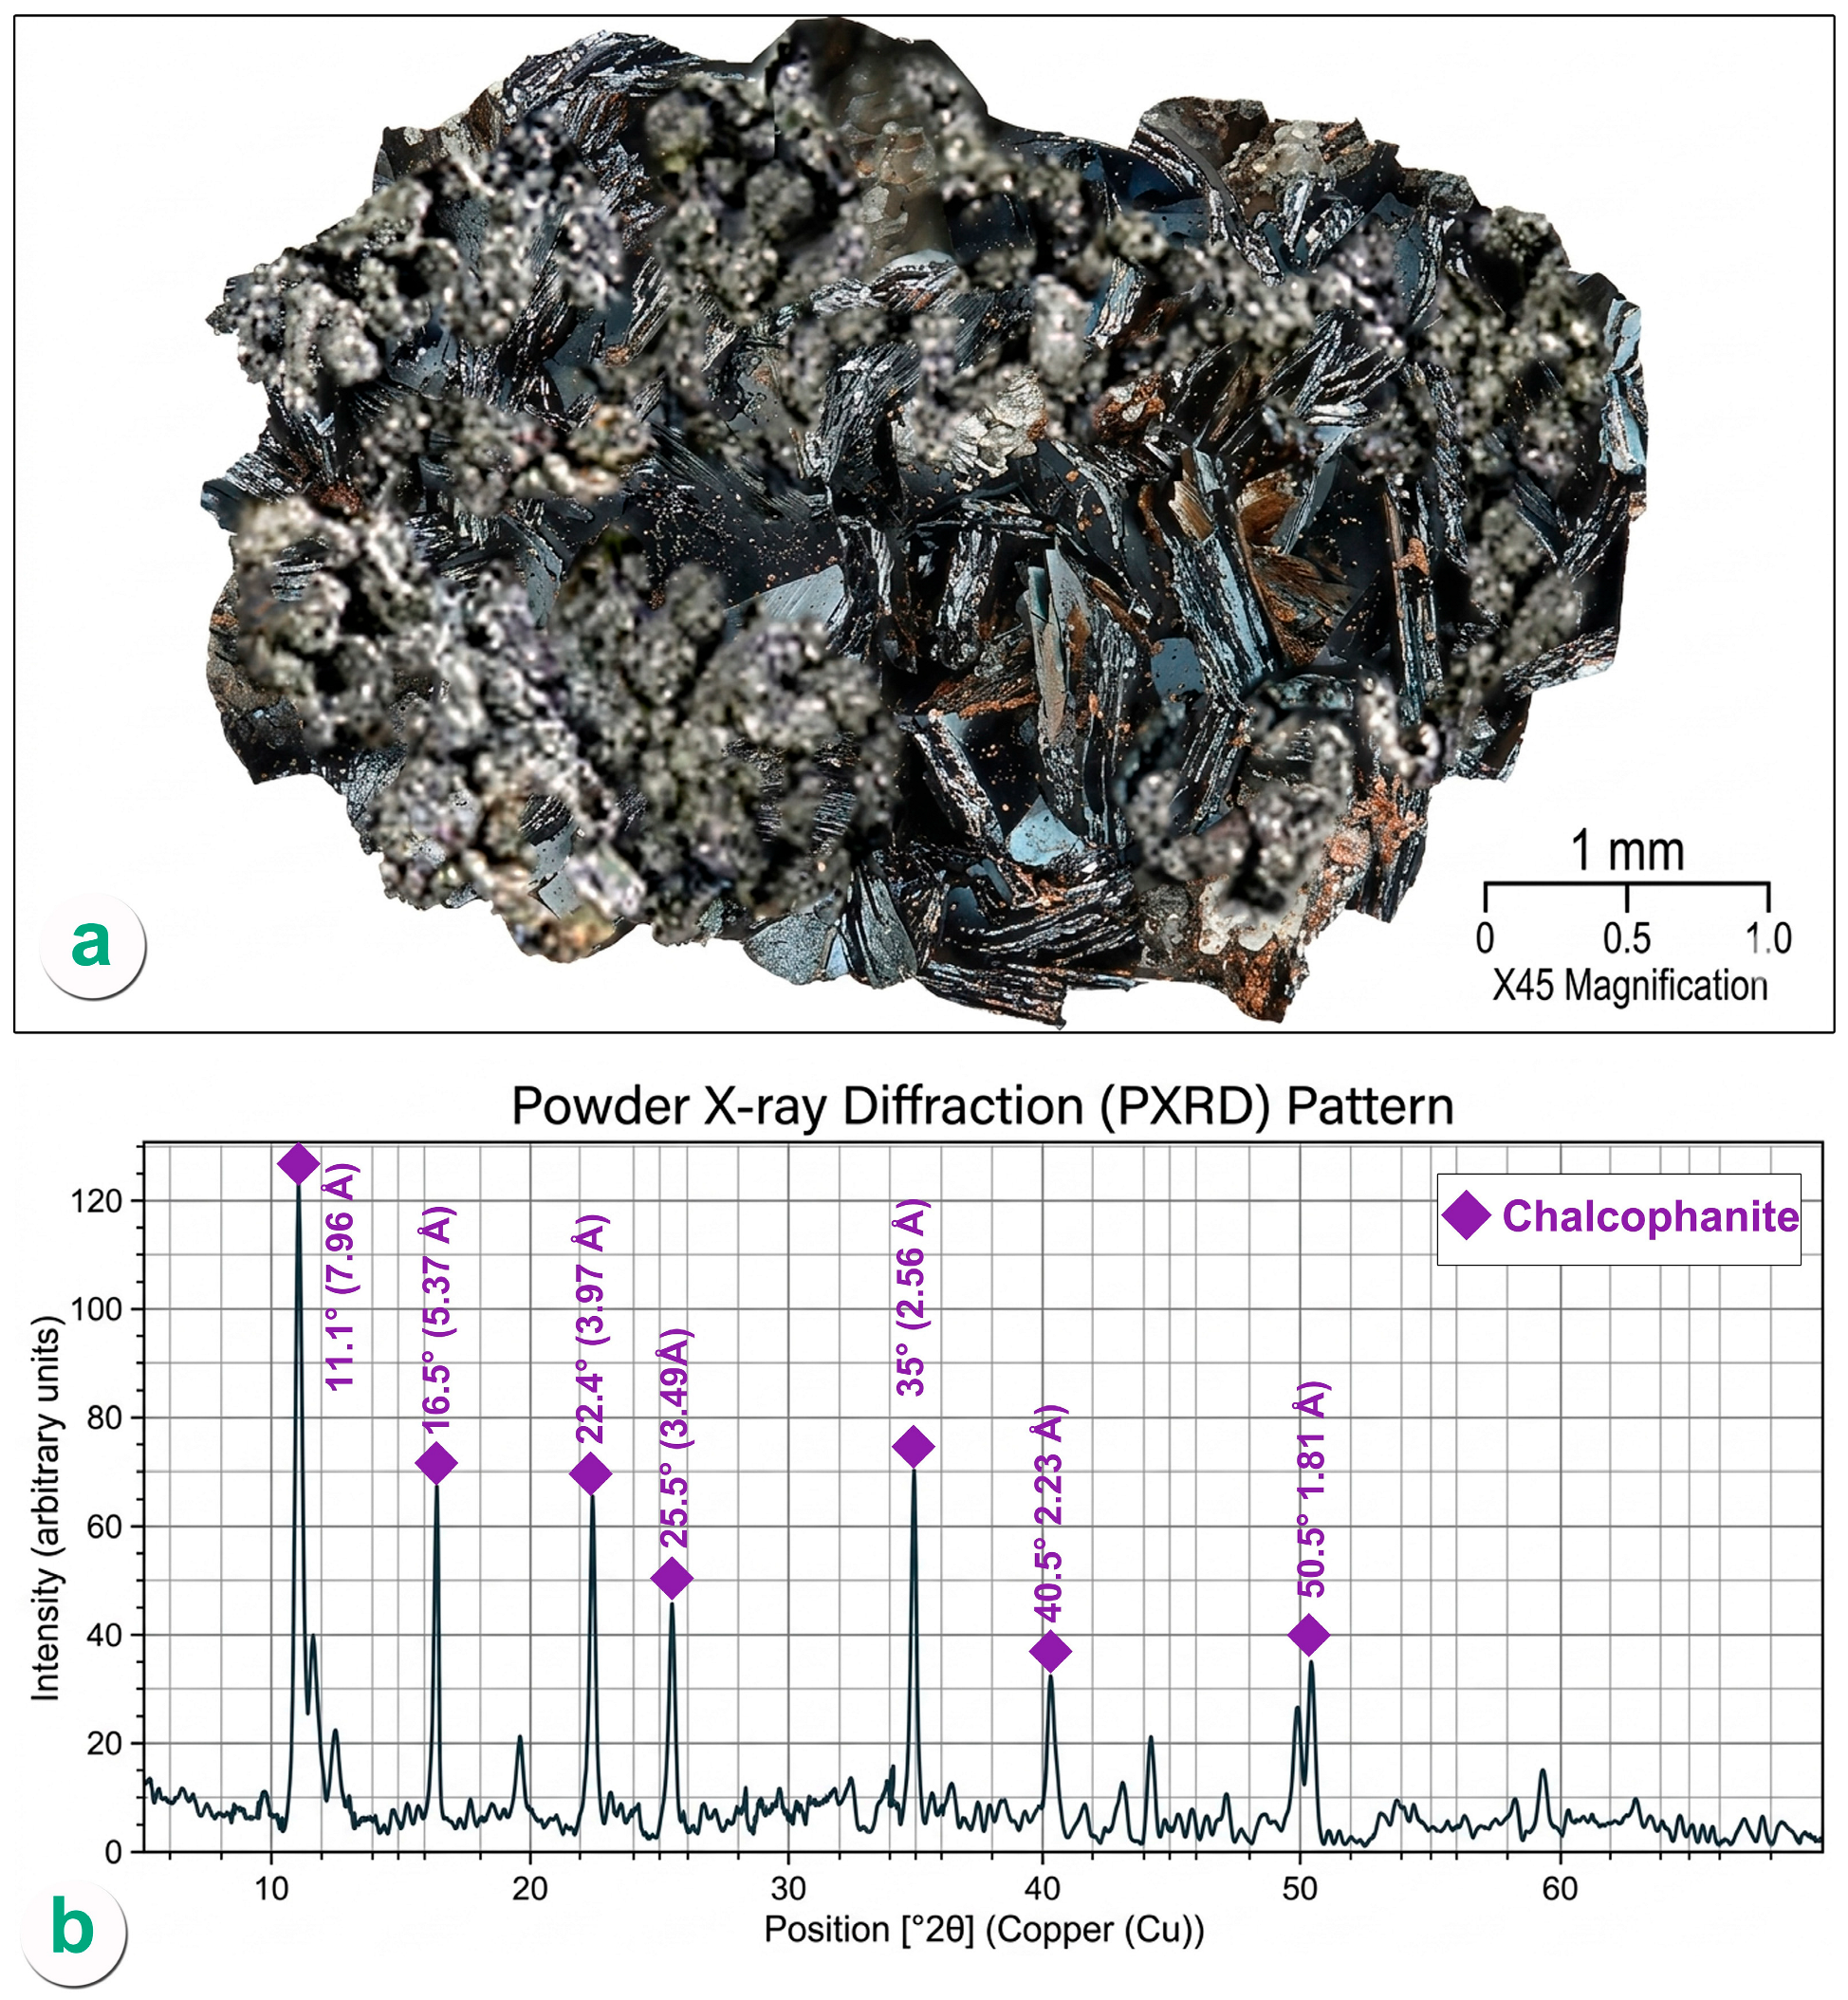
Figure 15. Chalcophanite [(Zn,Fe2+,Mn2+)Mn3+4O7·3H2O] from the Allouga paleokarst, clay zone. (a) Binocular photomicrograph showing flexible foliated aggregates with bluish-black to black platy foliations and a brown streak; its occurrence records the geochemical interaction between zinc and manganese within the paleokarst oxidation zone, consistent with base-metal inputs sourced from the adjacent Precambrian syenogranite basement. (b) XRD diffractogram confirming chalcophanite identification. Chalcophanite peaks labelled at 11.1° (7.96 Å, primary), 16.5° (5.37 Å), 22.4° (3.97 Å), 25.5° (3.49 Å), 35.0° (2.56 Å), 40.5° (2.23 Å), 50.5° (1.81 Å), 60.0° (1.54 Å); Cu Kα.
Minerals 16 00558 g015
The fill sequence comprises four intervals described from bottom to top. The cavity floor is formed by fresh argillaceous limestone, representing the undisturbed middle-member parent rock. Angular dolostone boulders sinking within fine-grained clay fill record roof collapse without grain transport (Figure 8a), confirming a subsurface dissolution origin [7]. Above this, a clay mineral horizon—comprising clay, variegated shale, iron oxides, lateritic marl, and gibbsite (Figure 8b)—formed under initial alkaline–oxidizing weathering conditions. A ferruginous siltstone horizon follows, representing the acidic–oxidizing stage of laterite evolution and serving as the principal geochemical trap for uranium [21]. The final alkaline–reducing stage is marked by the uppermost interval of clay, gibbsite, and kaolinite [7,21]. Uranium anomalies are confined exclusively to the paleokarst fill—and specifically to the ferruginous siltstone horizon—and are entirely absent from the enclosing host carbonate [33,34], firmly establishing the supergene, post-karstification origin of the mineralization.
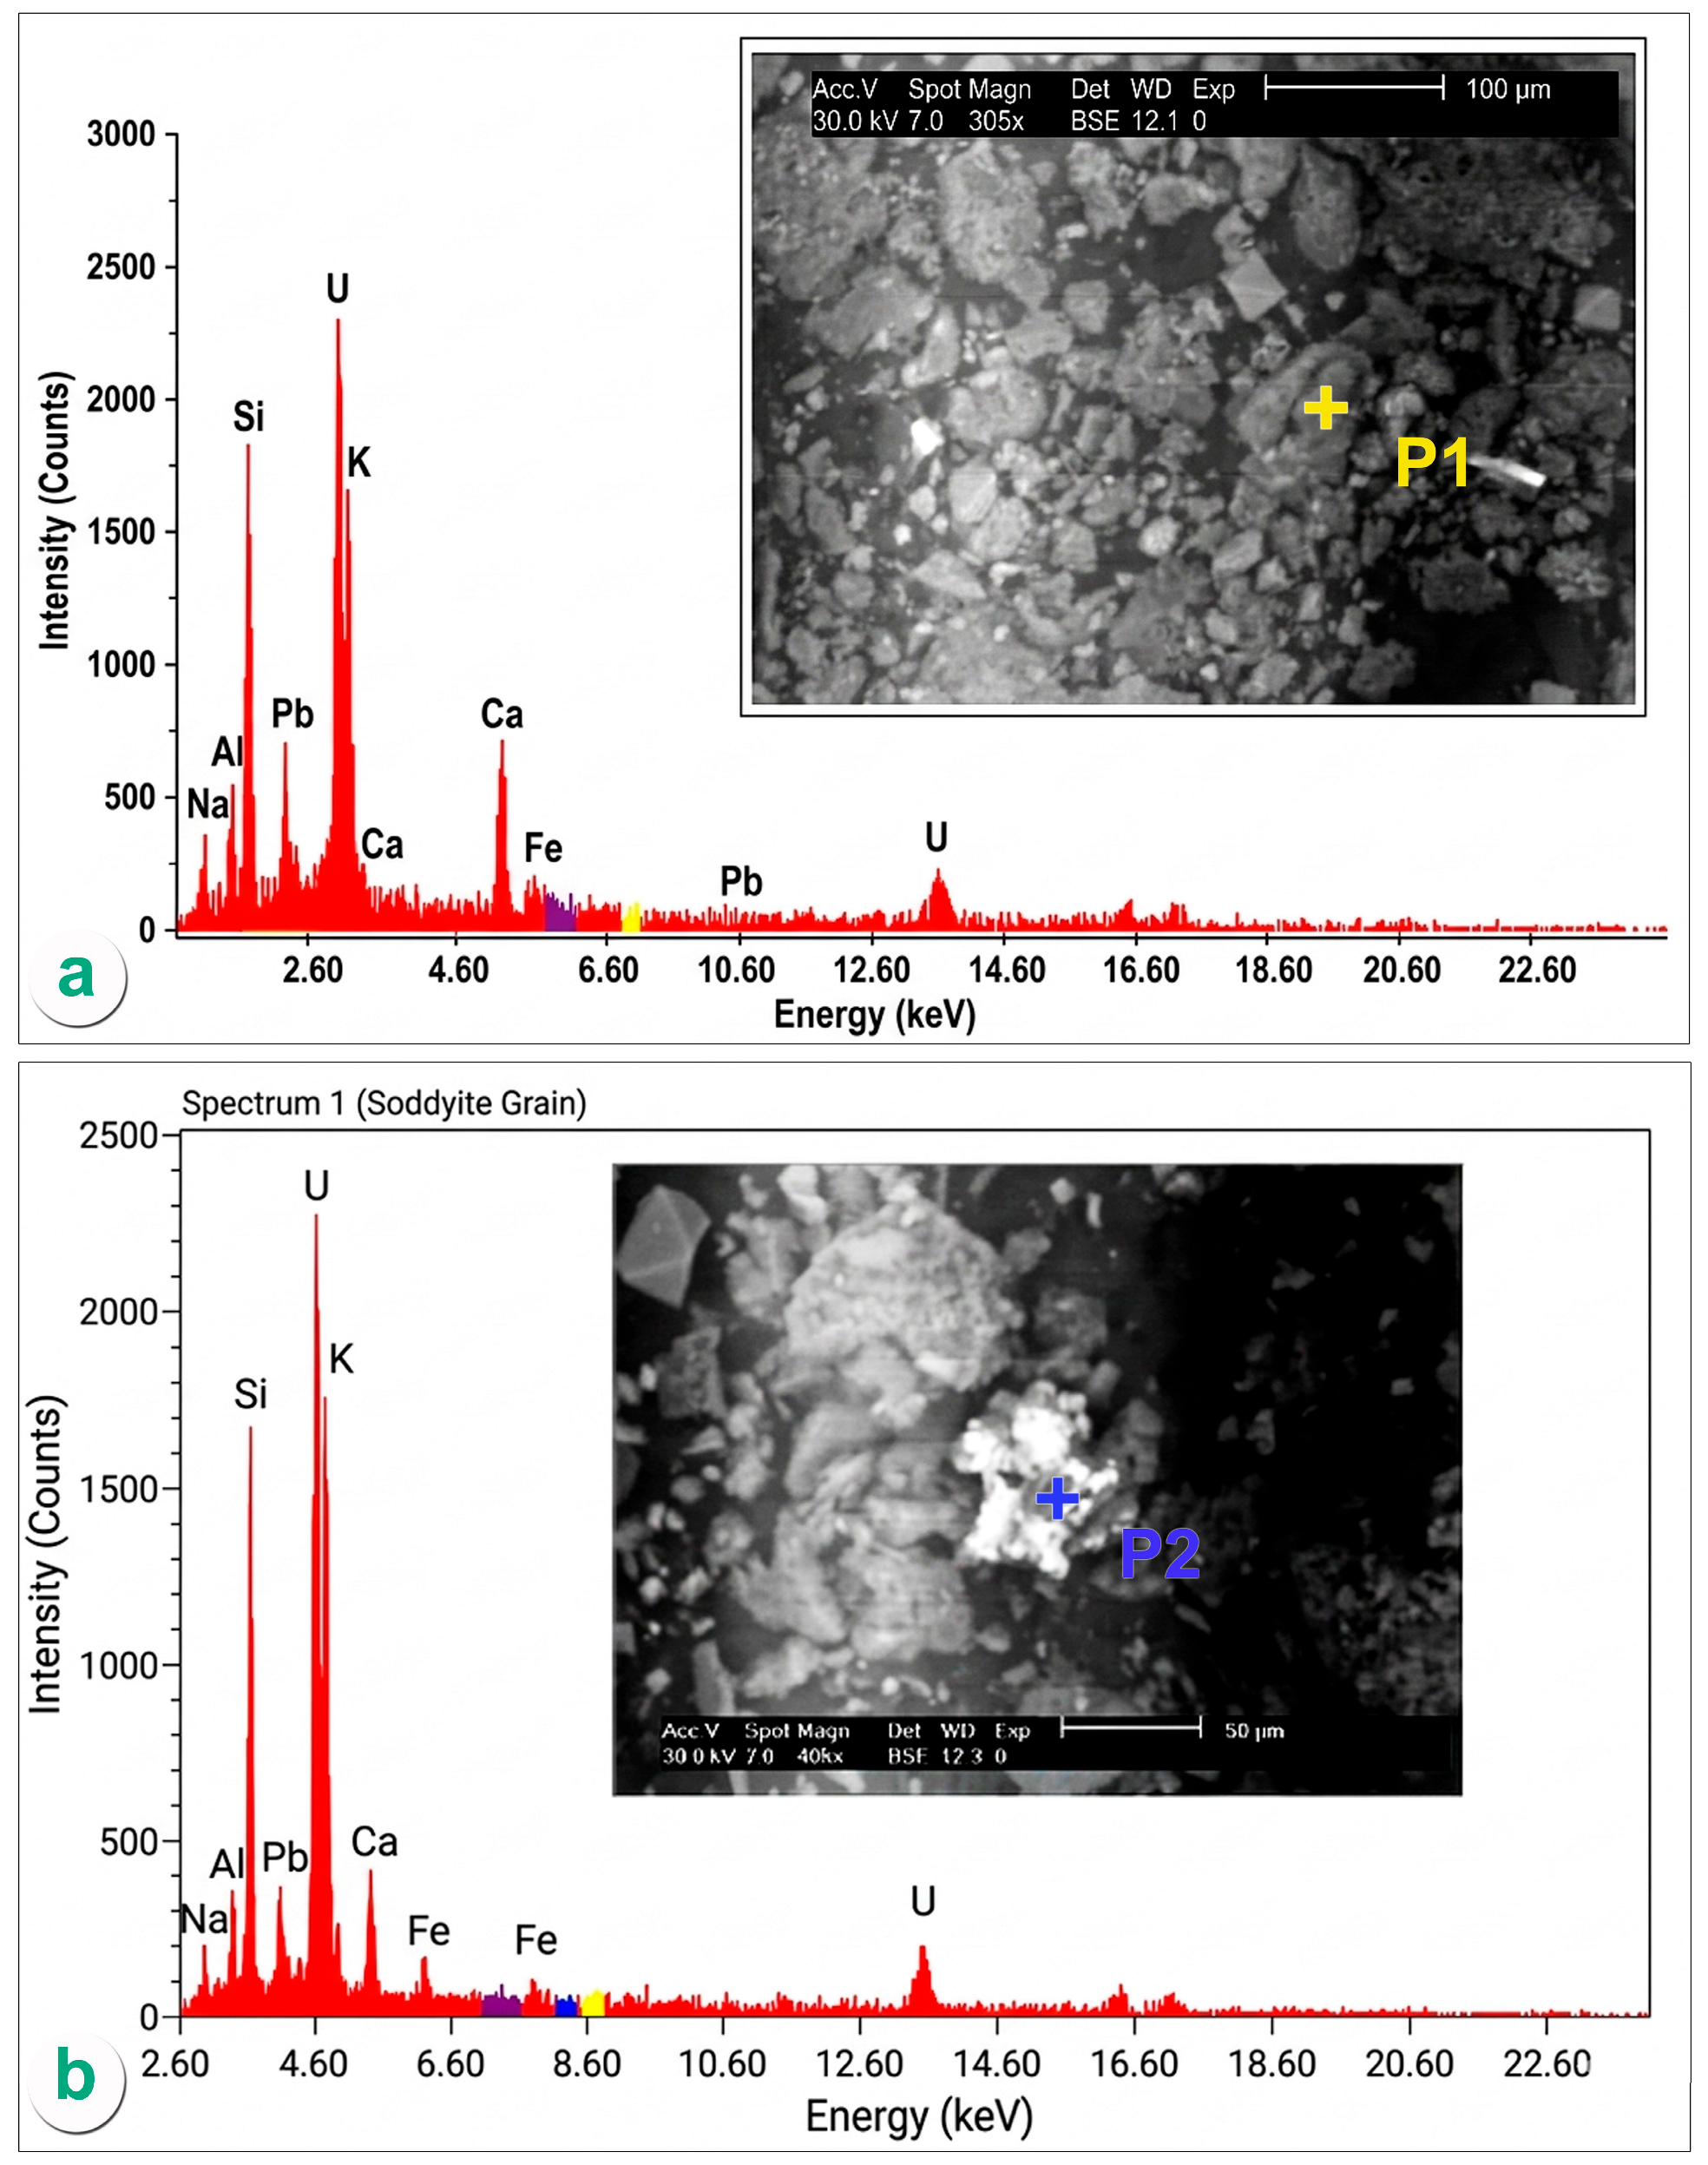
Figure 16. SEM–EDX characterization of high-uranium silicate phases from the Abu Zarab paleokarst, ferruginous siltstone facies. (a) BSE image and EDX spectrum of natroboltwoodite [(H3O)(Na,K)(UO2)SiO4·H2O], yielding an elemental sequence of U > Si > Fe > Al > Pb > Na > K with U = 60.23 wt% (18.26 at%). (b) BSE image and EDX spectrum of soddyite [(UO2)2SiO4·2H2O], yielding an elemental sequence of U > Si > Al > Na > Fe > K > Pb with U = 69.45 wt% (22.79 at%)—the highest uranium content recorded in the entire mineral assemblage. Note: The yellow and blue crosshairs (+P1, +P2) in both BSE images indicate the exact point from which the spot EDX spectrum was collected.
Minerals 16 00558 g016
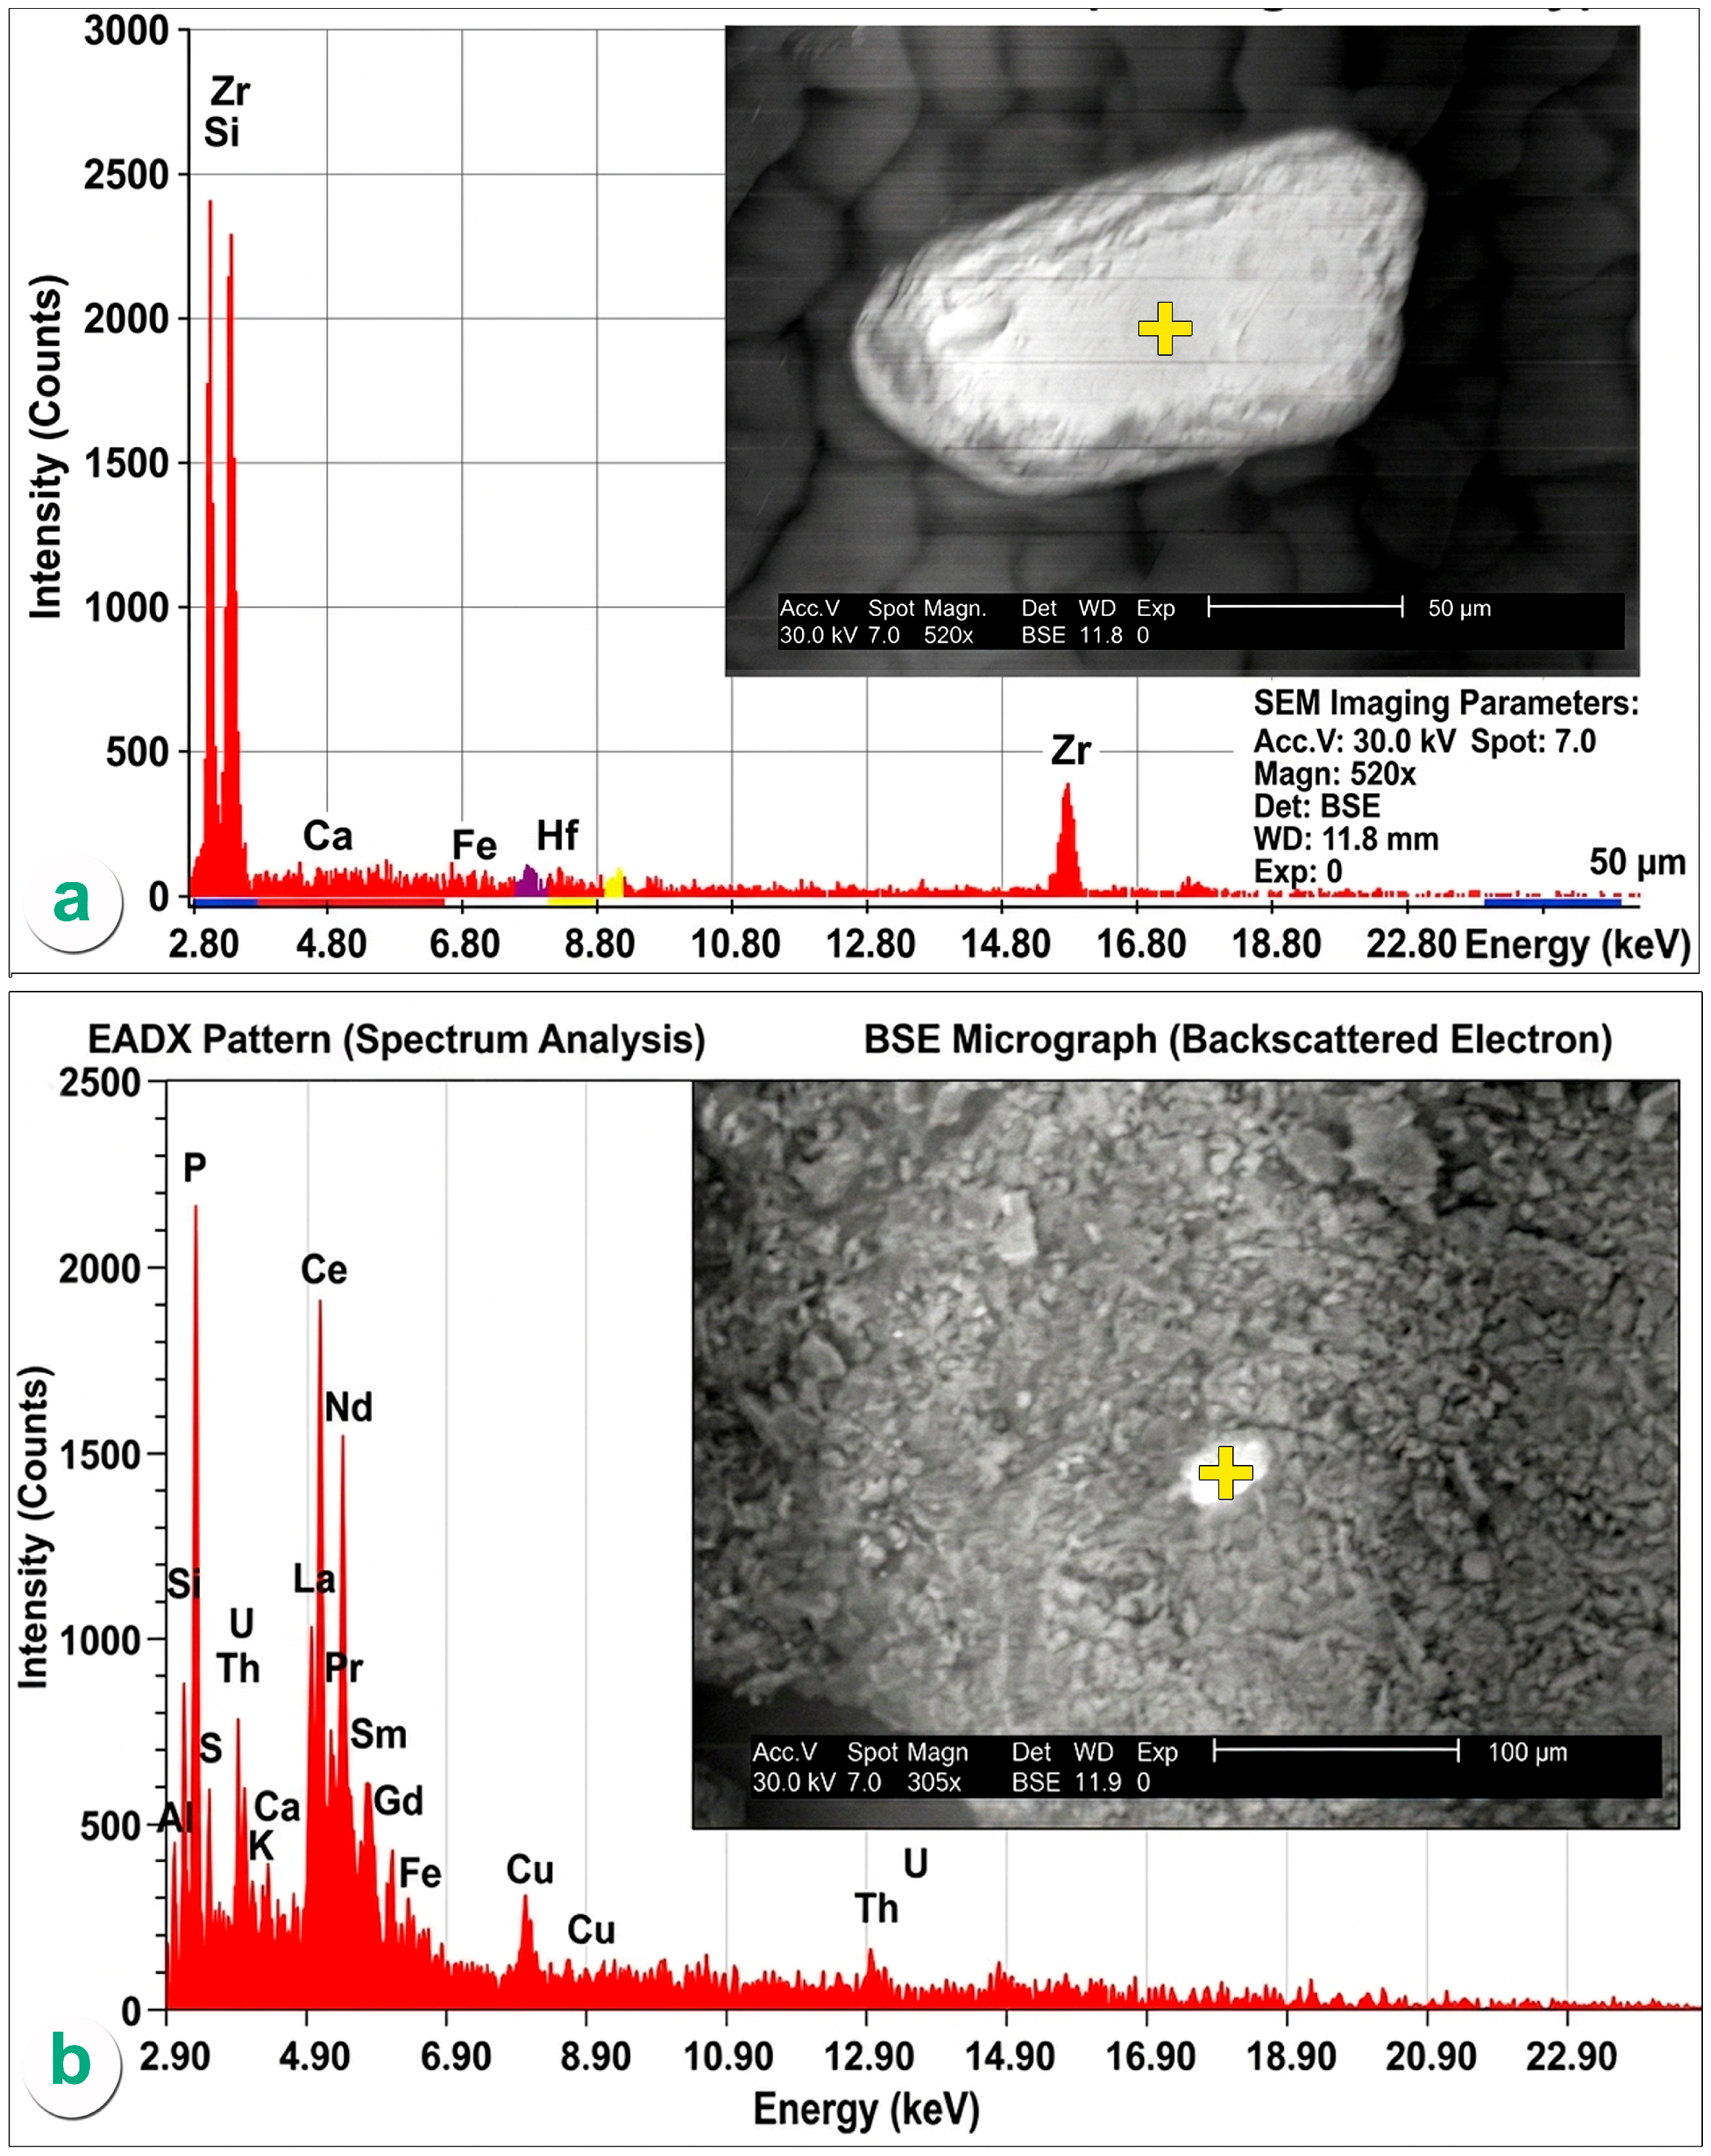
Figure 17. SEM–EDX characterization of detrital accessory phases from the Allouga paleokarst. (a) BSE image and EDX spectrum of zircon [ZrSiO4] from the ferruginous siltstone facies, showing smooth pitted surfaces consistent with moderate transport; confirming a Zr-dominant composition with Hf as a minor substituent. (b) BSE image and EDX spectrum of monazite [(Ce,La,Nd,Th)PO4] from the clay mineral facies, confirming a P–Ce–La–Nd–Th-dominated composition with minor U (2.49 wt%) and identifying monazite as the primary LREE carrier in the paleokarst fill. Note: The yellow crosshair (+) in both BSE images indicates the exact point from which the spot EDX spectrum was collected.
Minerals 16 00558 g017
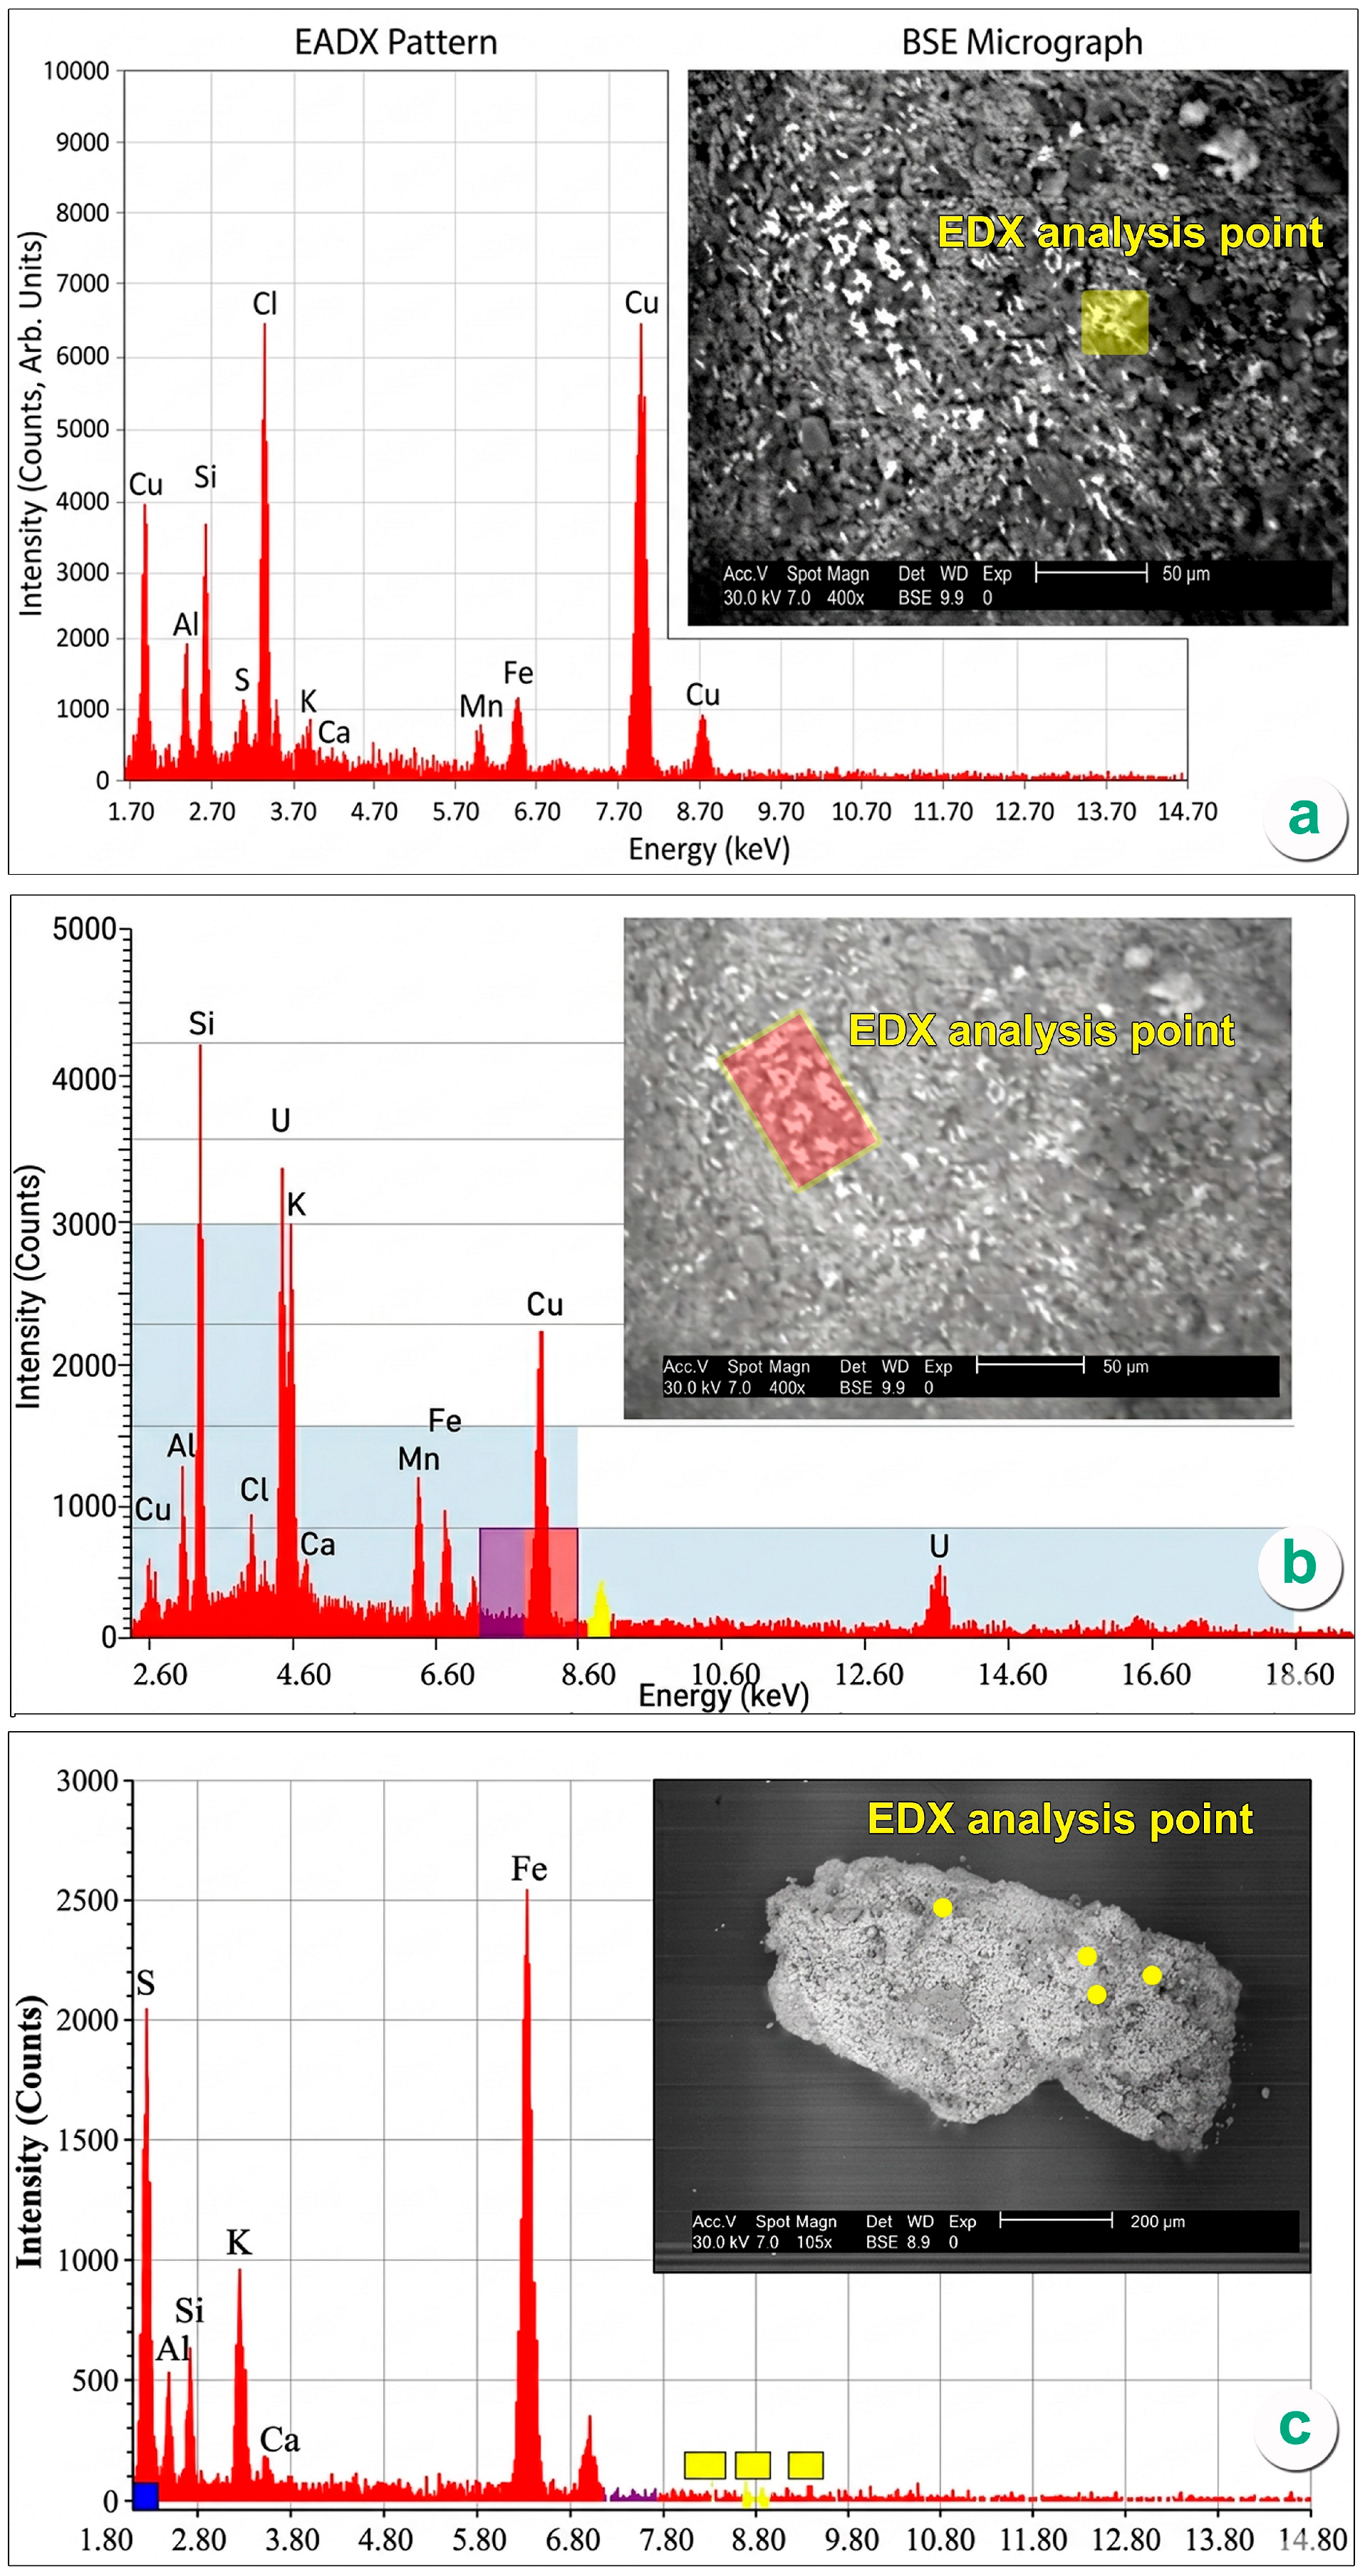
Figure 18. SEM–EDX characterization of copper-halide and sulfate phases from the Abu Zarab paleokarst. (a) BSE image and EDX spectrum of atacamite [Cu2Cl(OH)3], Grain 1, clay mineral facies, yielding a standard Cu > Cl > Si > Al composition consistent with the accepted mineral formula. (b) BSE image and EDX spectrum of atacamite, Grain 2, revealing anomalous uranium enrichment at the crystal surface (U = 45.36 wt%; 12.08 at%)—a previously unreported uranium–atacamite surface association that extends the known uranium sorbent inventory beyond iron oxides. (c) BSE image and EDX spectrum of jarosite [KFe3(SO4)2(OH)6] from the ferruginous siltstone facies, confirming an Fe > S > K composition and providing a mineralogical proxy for the acidic–oxidizing Stage 2 paleoenvironment. Note: The yellow markers on the BSE images (box in ‘a’, shaded area in ‘b’, and points in ‘c’) indicate the specific locations where the EDX spot and area spectral analyses were collected.
Minerals 16 00558 g018
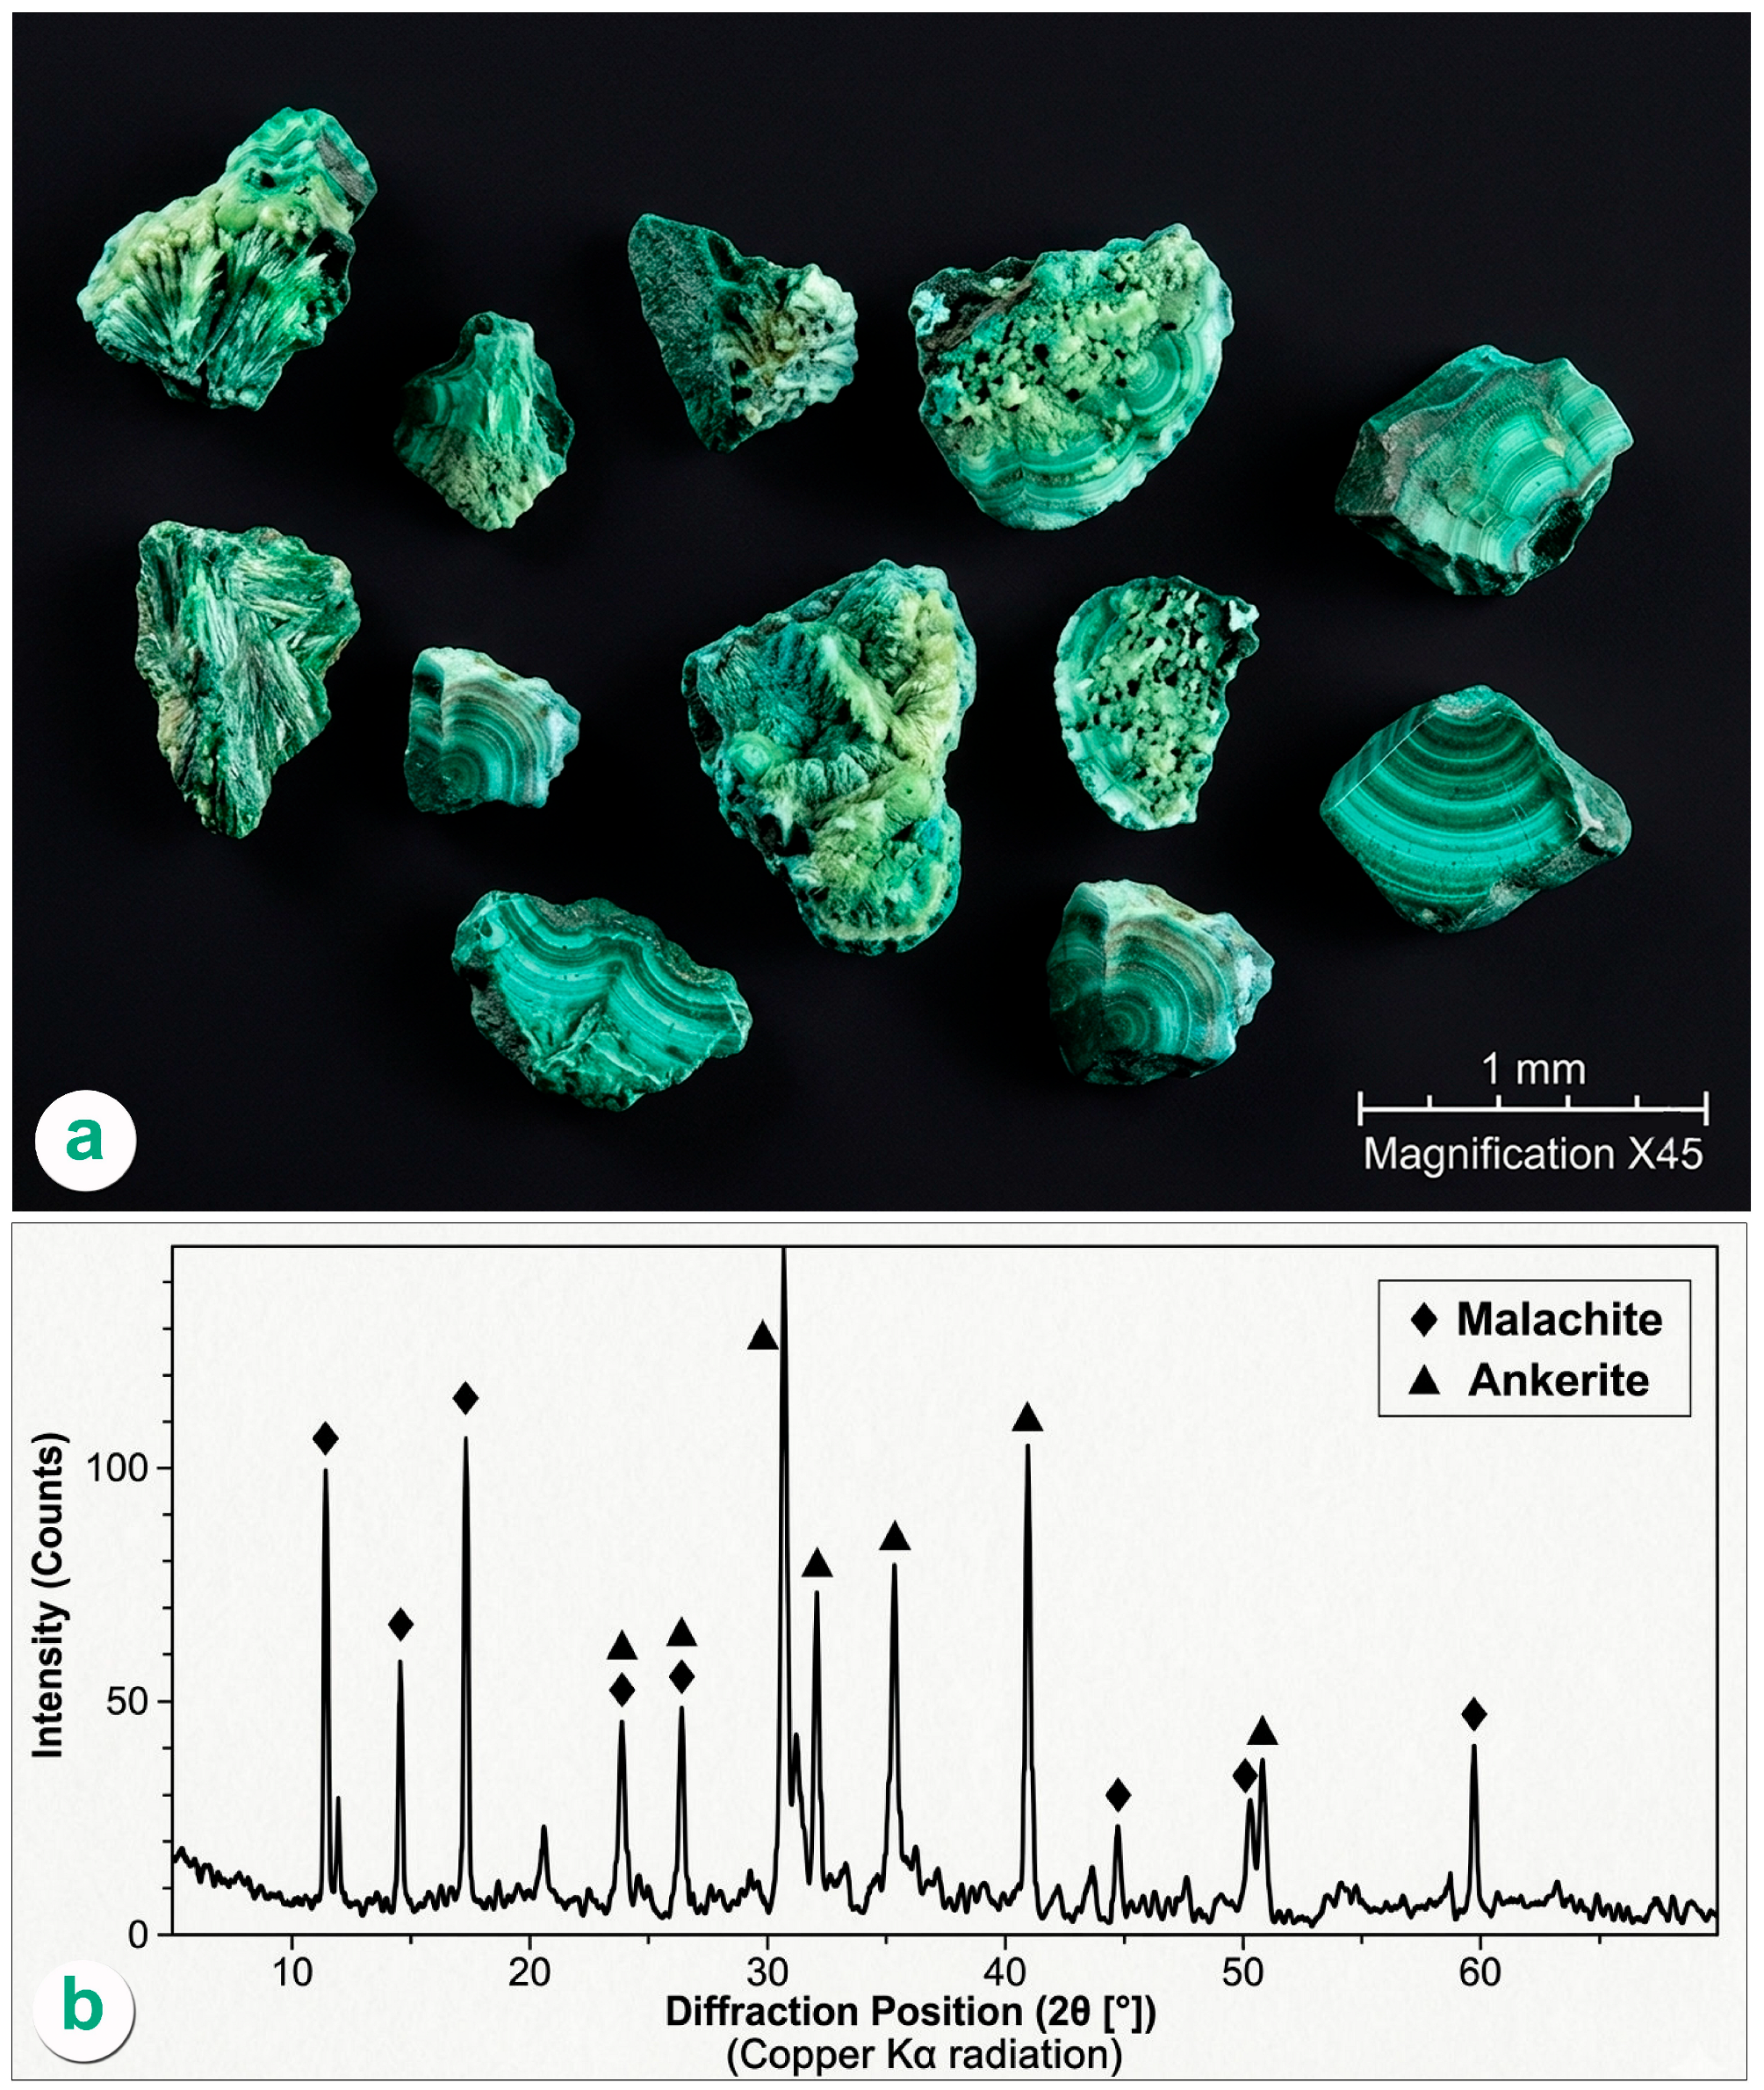
Figure 19. Late-stage copper carbonate and associated carbonate phases from the Abu Zarab paleokarst. (a) Binocular photomicrograph of malachite [Cu2(CO3)(OH)2] showing subhedral prismatic grains with dark-green to blackish-green color and a light-green streak; the mineral occurs in the clay–gibbsite–kaolinite facies. (b) Combined XRD diffractogram resolving malachite [Cu2(CO3)(OH)2] and ankerite [Ca(Fe,Mg,Mn)(CO3)2] from the uppermost laterite horizon of the Abu Zarab paleokarst, recording the final alkaline–reducing Stage 3 of supergene oxidation.
Minerals 16 00558 g019
The interpretation of these dissolution structures as true paleokarst is supported by multiple diagnostic field criteria. (i) Angular, matrix-supported dolostone blocks in a fine-grained clay-rich matrix represent roof-collapse breccias that accumulated without fluvial transport, a feature ubiquitous in subsurface karst cavities. (ii) Geopetal structures, where fine laminated internal sediment partially fills voids and is overlain by sparry calcite or later ferruginous silt, record a multi-phase filling history consistent with vadose–phreatic transitions. (iii) Undulating, sharp-walled dissolution contacts, commonly lined with a thin Mn-Fe crust, truncate the bedding of the host dolostone and indicate corrosive fluid flow prior to infill. (iv) Per descensum karst geometries, including vertical pipes and irregular dissolution pockets that widen downward, argue for meteoric water percolation from an exposed land surface.


3. Materials and Methods

3.1. Sample Collection

Sampling targeted sixteen paleokarst structures across two principal localities—Abu Thor (ATh. 1–ATh. 8; Figure 5a–d and Figure 6a–d) and Allouga (Ag. 9–Ag. 16; Figure 7a–c) with a single paleokarst at Abu Zarab dissected by three NMA-excavated trenches. The UTM coordinates of all sample structures are presented in Table 1. Approximately 3 kg of bulk samples were collected from the paleokarst-filling materials at each locality.
Sampling followed a vertical profiling strategy in which each lithofacies horizon was treated as a discrete unit—progressing upward from the fresh argillaceous limestone parent rock through the clay mineral horizon and ferruginous siltstone to the near-surface clay–gibbsite–kaolinite intercalation. This facies-resolved approach was designed to capture the full mineralogical range of the laterite evolution sequence and enable interpretation of mineral-specific paragenetic relationships within their host horizon. The sampled paleokarsts vary in geometry: V-, U-, irregular-, pipe-like-, and lenticular with widths of 3–15 m and depths of 0.5–13 m.
3.2. Heavy-Mineral Separation

All samples for mineralogical investigation were processed through a sequential separation protocol at the National Material Analysis (NMA) laboratories. Each bulk sample was disaggregated using a jaw crusher and dry-sieved to retain the 60–30 mesh fraction. The heavy and light mineral fractions separated using bromoform (CHBr3) at a specific gravity of 2.85 g/cm3, after which the heavy fraction was washed with acetone, dried, and hand-picked under a binocular stereomicroscope (Euromex, Duiven, The Netherlands). At this stage, individual grains were identified using observable physical properties—color, luster, streak, crystal form, transparency, and estimated density. Magnetic fractionation using a Frantz isodynamic separator (Prior, London, UK) was applied to further purify specific fractions prior to instrumental analysis where necessary.

3.3. X-Ray Diffraction (XRD) Analysis

Powder X-ray diffraction (XRD) analysis was performed at the NMA laboratories on purified mineral concentrates and served as the primary identification technique for minerals available in sufficient quantity. This method was applied to twelve species: carnotite, autunite, torbernite, uranophane, uranothorite, thorite, and chalcophanite within the radioactive assemblage; and malachite, ankerite, rutile, arsenopyrite, and paratacamite within the non-radioactive accessory assemblage. The diffraction patterns were matched against reference databases, and representative diffractograms are presented in Section 4 alongside the corresponding mineral descriptions.
The XRD-based mineral identifications are documented. Essential data for reproducibility and credibility—including d-spacing values, relative peak intensities, and PDF reference numbers—are provided in the Supplementary Data file (Tables S1–S4) submitted with this revised manuscript. Instrument operating parameters (tube voltage: 40 kV; current: 30 mA; radiation: CuKα, λ = 1.5406 Å; scan range: 3–70° 2θ; step size: 0.02°; counting time: 1 s/step) and the preparation protocol for separated mineral fractions (randomly oriented powder mounts on glass slides) are also reported therein.

3.4. Scanning Electron Microscopy with Energy-Dispersive X-Ray Analysis (SEM–EDX)

Minerals present in quantities insufficient for reliable XRD identification were analyzed at the NMA laboratories using a Philips XL30 Environmental Scanning Electron Microscope (ESEM) equipped with an EDAX microanalysis unit. Backscattered electron (BSE) imaging distinguished phases of contrasting mean atomic number within polished grain mounts, while quantitative standardless EDX analysis yielded elemental compositions as weight percent (wt%) and atomic percent (at%), together with K-ratios and ZAF matrix correction factors—Z (atomic number), A (absorption), and F (fluorescence)—tabulated in the respective mineral data tables. SEM–EDX was the definitive technique for five mineral species whose low abundance or fine grain size precluded XRD analysis: natroboltwoodite and soddyite from the ferruginous siltstone facies at Abu Zarab, atacamite from the clay mineral facies at Abu Zarab, and zircon and monazite from the Allouga paleokarst profiles. The BSE images and EDAX for each are presented in Section 4.

4. Results: Mineralogical Characterization of the Samples

4.1. Radioactive Mineral Assemblies

4.1.1. Carnotite [K2(UO2)2V2O8·3(H2O)]

Carnotite was identified in the Abu Zarab paleokarst, occurring in association with shale and ferruginous siltstone and within the kaolinite–gibbsite facies of the upper laterite horizon. Carnotite is a secondary uranium vanadate typical of sedimentary rocks formed under arid climatic conditions [35,36]; it occurs as grains ranging in color from yellow to canarian yellow with a characteristic light-yellow luster (Figure 9a). Its XRD diffractogram is presented in Figure 9b. The measured diagnostic 2θ reflections (CuKα) are: 9.8° (d = 9.02 Å), 19.3° (4.60 Å), 24.8° (3.59 Å), 29.1° (3.07 Å), 31.5° (2.84 Å; strongest), and 33.8° (2.65 Å); kaolinite matrix reflections co-occur at 12.4° and 21.0°. Full peak data are tabulated in Supplementary Tables S1–S3. Carnotite occurrence in the kaolinite–gibbsite zone is geochemically significant. Vanadium is enriched during Stage 3 of the laterite evolution sequence at several paleokarsts in the area, and its presence directly records the interaction of V-rich alkaline fluids with uranium-bearing lateritic horizons during the final stage of weathering—a process that effectively fingerprints the terminal geochemical environment of the paleokarst system.

4.1.2. Phosphuranylite [KCa(H3O)3(UO2)7(PO4)4O4·8H2O]

Phosphuranylite occurs as greenish-yellow crystal aggregates within the clay mineral facies of the Abu Zarab paleokarst (Figure 10a). The mineral was identified by X-ray diffraction (Figure 10b); all diagnostic reflections match the reference pattern for phosphuranylite, a hydrated potassium–calcium uranyl phosphate. Phosphuranylite typically forms as a secondary phase during the oxidative alteration of uraninite in the presence of phosphate-rich solutions, and its occurrence here records the activity of mildly alkaline, oxidizing fluids that circulated through the clay-rich karst fill. Its dual occurrence—in paleokarst clay facies and within a clastic formation—points to multiple, spatially distinct pathways of secondary uranium phosphate precipitation operating simultaneously within the Um Bogma succession.
Detailed re-examination of the Figure 10b diffractogram reveals that the observed peak positions (principal reflections at 17.8°, 22.6°, 26.0°, 29.1°, 30.2°, and 31.8° 2θ) are more consistent with phosphuranylite [KCa(H3O)3(UO2)7(PO4)4O4·8H2O] than with autunite. Phosphuranylite commonly co-occurs with autunite in oxidized uranium deposits and is readily confused with it by visual inspection alone. The reported identification as autunite should be verified against the original diffractogram, ICDD reference patterns, and, where material is available, by SEM–EDX confirmation. Full measured peak positions and calculated d-spacings are tabulated in Supplementary Tables S1–S3.

4.1.3. Torbernite [Cu(UO2)2(PO4)2·8–12(H2O)]

Torbernite was identified in the upper oxidation zone of the Allouga paleokarst’s copper-enriched ferruginous siltstone. It crystallizes in the tetragonal system, with a green to apple-green color, occurring as transparent to subtranslucent, two-dimensional, platy crystals (Figure 11a); XRD confirmation is provided in Figure 11b. Measured 2θ reflections (CuKα): 8.5° (d = 10.39 Å; minor), 16.5° (5.37 Å; strongest, 100%), 18.6° (4.77 Å), 22.5° (3.95 Å), 24.2° (3.67 Å), 26.6° (3.35 Å), 35.0° (2.56 Å); a diagnostic ‘comb’ cluster of closely spaced peaks occurs between 35.7° and 40.0° (d = 2.51–2.25 Å); additional reflection at 48.5° (1.88 Å); full data in Tables S1–S3. The co-occurrence of torbernite with copper-rich siltstone carries direct metallogenic relevance: it establishes the co-mobility of uranium and copper in oxidizing fluids within the paleokarst system, suggesting that the same oxidizing front responsible for copper enrichment also mobilized and locally precipitated uranium as a phosphate phase. This coupling between uranium and copper is not merely coincidental—it reflects a shared geochemical pathway governed by the same Eh–pH conditions.

4.1.4. Uranophane [Ca(UO2)2SiO3(OH)2·5(H2O)]

Uranophane occurs within the Allouga paleokarst’s ferruginous siltstone ore body. The mineral presents as fibrous radiating aggregates with a yellowish orange to light yellow color and a yellowish white streak. The grain surfaces are flat and lack cleavage, and the grains are translucent to subtranslucent (Figure 12a). The XRD analysis confirmed the identification of the species (Figure 12b). Measured 2θ reflections (CuKα): 10.5° (d = 8.42 Å), 14.6° (6.06 Å), 17.5° (5.06 Å), 23.4° (3.80 Å; strongest, 100%), 30.1° (2.97 Å), 35.1° (2.55 Å), 40.7° (2.22 Å), 50.4° (1.81 Å); full data in Tables S1–S3. As a calcium uranyl silicate, uranophane represents a silica-rich pathway of uranium secondary mineralization—distinct from the phosphate phases described above—and its restriction to the ferruginous siltstone horizon is consistent with uranium fixation during the iron-oxide-dominated Stage 2 of laterite evolution.

4.1.5. Uranothorite [(Th,U)SiO4]

Uranothorite was encountered at the Allouga paleokarst, where it occurs as minute anhedral crystals—both metamict and non-metamict varieties—associated with the ferruginous siltstone facies (Figure 13a). The color ranges from dark brown to pale brownish, and the XRD results are shown in Figure 13b. Measured 2θ reflections (CuKα): 10.0° (d = 8.84 Å), 22.8° (3.90 Å), 25.8° (3.45 Å), 32.1° (2.79 Å; strongest, 100%), 35.0° (2.56 Å), 40.3° (2.24 Å), 50.2° (1.82 Å); full data in Tables S1–S3. As a uranium-rich variety of thorite, this mineral occupies a distinct and somewhat ambiguous position within paragenesis.
Unlike the clearly supergene phases, uranothorite may represent either a primary crystallization product or a detrital input transported into the paleokarst fill—thereby contributing a non-supergene component to the total U–Th budget alongside the secondary phases. This distinction is important for the interpretation of the U/Th ratio systematics at Allouga.

4.1.6. Thorite [ThSiO4]

Thorite is the most common thorium mineral found in the study area. It occurs in the Allouga paleokarst’s ferruginous claystone zone, along fractures developed within the claystone. The crystals range from brownish yellow to brownish orange with a light brown streak and are transparent to subtranslucent (Figure 14a), generally presenting as anhedral to subhedral forms and occasionally developing slender tetragonal prismatic habits. XRD examination confirms its identification (Figure 14b). Measured 2θ reflections (CuKα): 21.1° (d = 4.21 Å), 24.9° (3.57 Å), 30.4° (2.94 Å; strongest, 100%), 38.3° (2.35 Å), 40.8° (2.21 Å), 44.2° (2.05 Å), 53.8° (1.70 Å), 62.3° (1.49 Å); full data in Tables S1–S3.

4.1.7. Chalcophanite [(Zn,Fe2+,Mn2+)Mn3+4O7·3H2O]

Chalcophanite was identified in the clay zone of the Allouga paleokarst, where zinc enrichment is pronounced. A radioactive mineral that commonly occurs in weathered zones above zinc- and manganese-bearing base-metal deposits [37], it presents as flexible foliated aggregates with bluish black to black platy foliations and a brown streak (Figure 15a). Phase identification was confirmed by XRD (Figure 15b). Measured 2θ reflections (CuKα): 11.1° (d = 7.96 Å; strongest (100) basal reflection), 16.5° (5.37 Å), 22.4° (3.97 Å), 25.5° (3.49 Å), 35.0° (2.56 Å), 40.5° (2.23 Å), 50.5° (1.81 Å), 60.0° (1.54 Å); full data in Tables S1–S3. Its occurrence directly records the geochemical interaction between zinc and manganese within the paleokarst oxidation zone and is consistent with the influx of base-metal-bearing solutions sourced from the adjacent Precambrian syenogranite basement—a reminder that the paleokarst system was not geochemically isolated but actively received externally derived inputs throughout laterite development.

4.1.8. Natroboltwoodite [(H3O)(Na,K)(UO2)SiO4·(H2O)]

Natroboltwoodite—also known as sodium boltwoodite—was identified in the Abu Zarab paleokarst’s ferruginous siltstone facies. The mineral occurs within the outer altered silicate zone surrounding hydrated uranyl oxides that incrust primary uraninite, a mineral association consistent with its documented paragenetic context alongside uraninite, becquerelite, and soddyite [38]. The grains are yellow and white with a density of approximately 4.1 g/cm3. SEM–EDX analysis (Figure 16a; Table 2) yields a qualitative elemental composition in descending order of U > Si > Fe > Al > Pb > Na > K, with uranium contributing 60.23 wt% (18.26 at%), confirming the phase’s dominant uranyl silicate character. Full quantitative standardless EDX data—including wt%, at%, K-ratios, and Z, A, F matrix correction factors—are tabulated in Table 2.

4.1.9. Soddyite [(UO2)2SiO4·2(H2O)]

Soddyite was identified alongside natroboltwoodite in the Abu Zarab paleokarst’s ferruginous siltstone facies. It occurs as angular, yellow to yellowish-green grains with a pyramid-shaped habit, parallel cleavage lines on crystal surfaces, and a yellow streak; grains are transparent to translucent. SEM–EDX analysis (Figure 16b; Table 3) revealed a qualitative elemental composition of U > Si > Al > Na > Fe > K > Pb, with uranium accounting for 69.45 wt% (22.79 at%)—the highest uranium content recorded for any mineral in the assemblage. Table 3 presents full quantitative standardless EDX data. Together with natroboltwoodite, soddyite represents the most uranium-rich end of the secondary silicate mineral spectrum, and its co-occurrence with primary uraninite alteration products confirms a multi-step, late-stage supergene reworking history at Abu Zarab.

4.2. Non-Radioactive Accessory Mineral Assemblies

4.2.1. Zircon [ZrSiO4]

In this study, zircon is the most widely distributed heavy mineral, recorded in the ferruginous siltstone facies across all three localities. SEM–EDX confirms Zr-dominant composition (79.13 wt%) with Hf (2.72 wt%). The elevated Al signal (16.68 wt%) in Table 4 reflects partial beam overlap with an adjacent aluminosilicate phase arising from sub-micron grain size; it does not represent lattice-bound Al in zircon. The Zr-dominant and Hf-bearing composition confirm zircon identification. Detrital in origin, the grains are typically small, with smooth, gentle edges and pitted surfaces consistent with moderate transport (Figure 17a). Color varies from colorless to reddish brown, gray, and green. The grains are slightly radioactive owing to trace amounts of uranium substituting for zirconium in the crystal lattice.
Quantitative EDX analysis (Table 4) confirmed the Zr-dominant composition with Hf as a characteristic minor substituent. Zircon serves a dual role in this system: as a provenance indicator for the detrital sediment fraction transported into the paleokarst fill and as a potential vector for heavy rare earth element (HREE) enrichment in the laterite through coupled xenotime dissolution [39,40].

4.2.2. Monazite [(Ce,La,Nd,Th)PO4]

Monazite is uncommon in the clay mineral facies of the Allouga paleokarst. Its grains are small, elongated, and prismatic with yellowish to pale brown colors; the mineral is notably brittle, producing uneven fractures, with a specific gravity of approximately 5.04 g/cm3 (Figure 17b). EDX analysis (Table 5) revealed a composition dominated by P, Ce, La, Nd, and Th, with minor U at 2.49 wt%, confirming its role as the primary light rare-earth element (LREE) carrier within the paleokarst fill. The presence of both monazite and zircon establishes a detrital supply of LREE and HREE to the karst system through externally sourced heavy-mineral input, independent of the carbonate parent rock [40].

4.2.3. Atacamite [Cu2Cl(OH)3]

Atacamite occurs in the clay mineral facies of the Abu Zarab paleokarst—the Stage 1 laterite horizon in which copper is most strongly enriched. It is a copper halide mineral and occurs as well-formed green to yellowish-green crystals with an apple-green streak and a density of 3.78 g/cm3. Two grains from Abu Zarab were selected for SEM–EDX examination. The first grain (Figure 18a; Table 6) yields a composition of Cu > Cl > Si > Al, consistent with the standard formula for atacamite. However, the second grain tells a different story. SEM–EDX analysis (Figure 18b; Table 7) revealed that uranium accounted for 45.36 wt% (12.08 at%) at the crystal surface, with copper reduced to 18.11 wt%—a pattern not previously reported in the Um Bogma Formation. In this geological context, this observation extends the known uranium sorbent inventory beyond iron oxides and carries a significant implication: copper halide mineral surfaces may act as additional, albeit subordinate, geochemical traps for uranium during the early alkaline–oxidizing stage of laterite evolution.

4.2.4. Jarosite [KFe3(SO4)2(OH)6]

Jarosite was identified in the Abu Zarab paleokarst’s ferruginous siltstone facies, corresponding to Stage 2 of the laterite evolution sequence. It occurs as well-formed, fine-sized hexagonal crystals that are brown to light yellow in color and fibrous in texture, with a yellow streak and a density of 3.6 g/cm3; crystal surfaces are flat and lack cleavage, with uneven fracture patterns. EDX analysis (Figure 18c; Table 8) confirms a composition dominated by Fe > S > K. Notably, jarosite is a well-established pH indicator mineral, and its formation under acidic–oxidizing conditions—in direct contrast to the alkaline Stage 1 environment that produced atacamite—marks the Stage 1-to-Stage 2 paleoenvironmental transition within the paleokarst fill. Thus, it provides a clear mineralogical proxy for the shift in fluid chemistry that governs uranium redistribution across laterite stages.

4.2.5. Malachite [Cu2(CO3)(OH)2] and Ankerite [Ca(Fe,Mg,Mn)(CO3)2]

Malachite and ankerite co-occur within the clay–gibbsite–kaolinite facies of the Abu Zarab paleokarst, both in association with azurite. Malachite occurs as subhedral grains with a prismatic form, dark green to blackish green color, flat surfaces lacking cleavage, a light green streak, and a density of 3.8 g/cm3 (Figure 19a). In contrast, ankerite forms white anhedral to subhedral crystals within the clay–gibbsite matrix. XRD confirmed both phases, and their diffractograms co-resolved in a single pattern (Figure 19b). In the co-resolved diffractogram, principal malachite reflections occur at 17.44 Å (2θ = 5.1°; strongest, 100%), 9.90 Å (8.9°), 3.70 Å (24.1°), 2.86 Å (31.3°), and 2.52 Å (35.7°); ankerite reflections are identified at 2.89 Å (30.9°; strongest), 3.72 Å (24.0°), and 1.80 Å (50.8°) (ICDD 10-0399 and 33-0282, respectively); full data are in Supplementary Tables S1–S3. Their co-occurrence in the uppermost laterite horizon reflects the final stage of supergene oxidation, in which the carbonate and copper-oxide phases stabilize under near-surface alkaline–reducing conditions.

4.2.6. Rutile [TiO2] and Arsenopyrite (FeAsS)

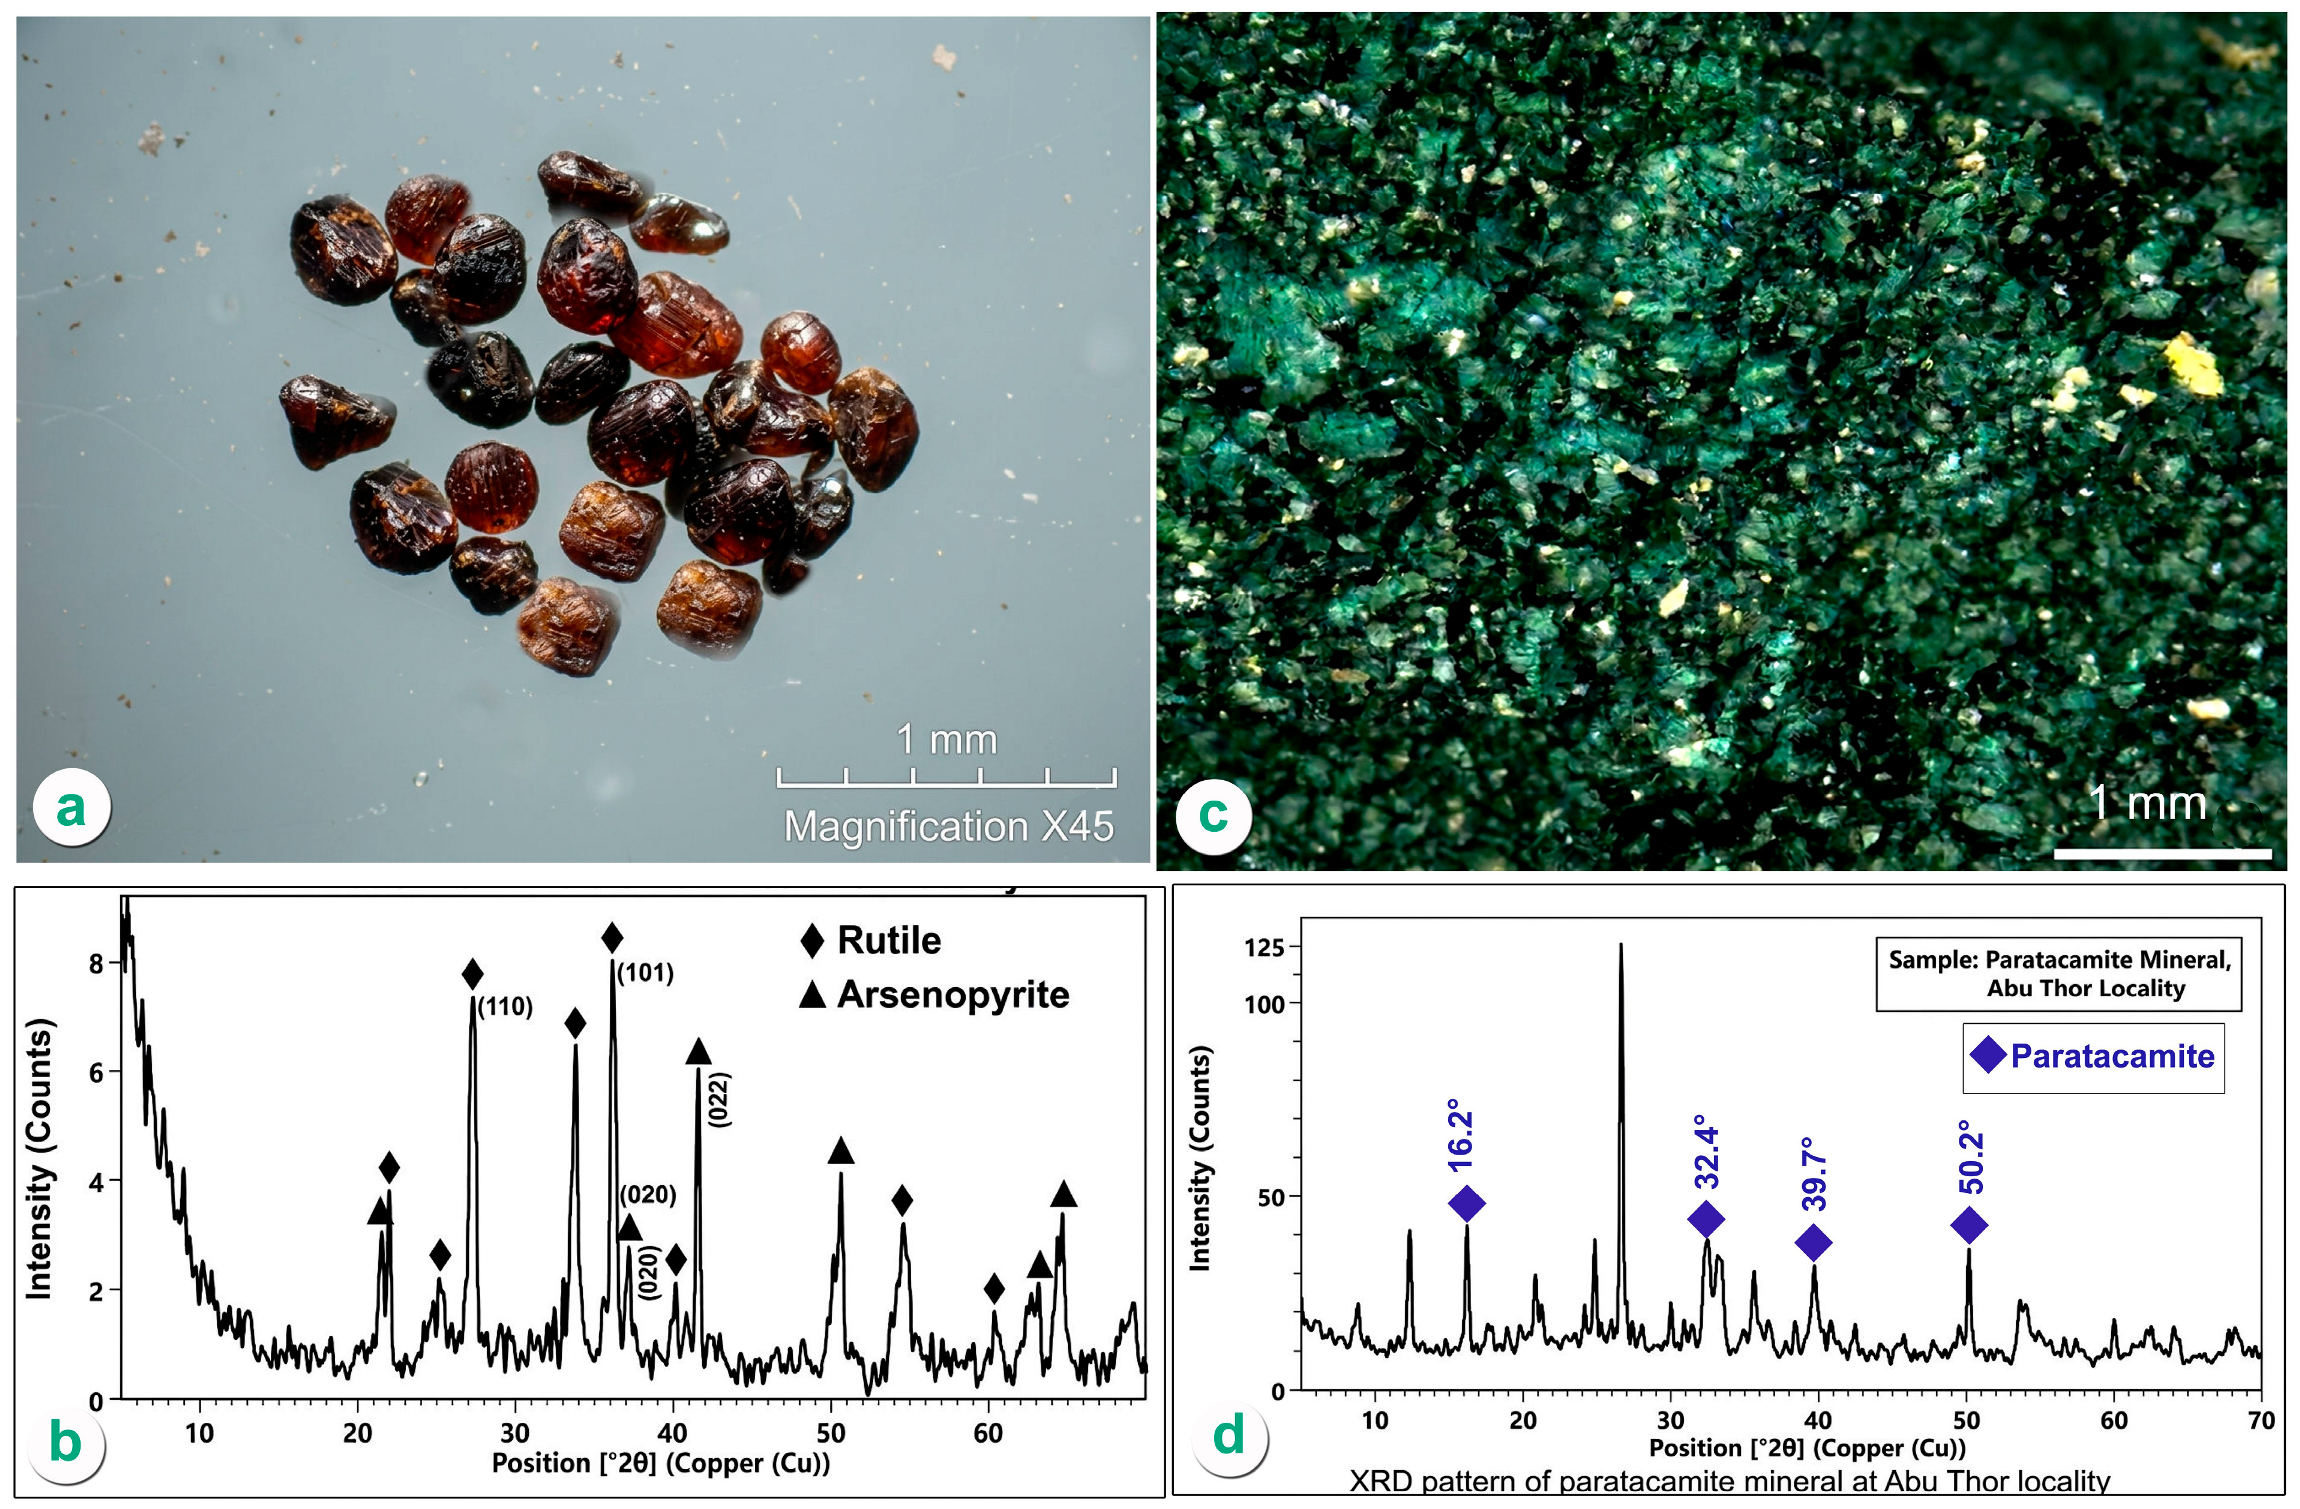
Rutile and arsenopyrite co-occur in the Abu Thor paleokarst’s ferruginous siltstone facies, forming a distinctive mineral pair absent from the other two localities. Rutile occurs as elongated and subrounded grains ranging in color from deep blood red to brownish red with an adamantine luster (Figure 20a), whereas arsenopyrite presents as euhedral crystals with a tin white to light steel gray color, a black streak, and a notable magnetic response when heated. Both phases were confirmed by XRD in a combined diffractogram (Figure 20b). Principal rutile reflections in the combined pattern occur at 3.25 Å (2θ = 27.4°; strongest, 100%), 1.69 Å (53.6°), 2.49 Å (36.2°), 2.19 Å (41.2°), and 1.62 Å (56.1°) (ICDD 21-1276); arsenopyrite reflections are identified at 2.87 Å (31.2°; strongest), 3.46 Å (25.8°), 2.56 Å (35.1°), 1.80 Å (50.8°), and 2.41 Å (37.4°) (ICDD 42-1320); full data are in Supplementary Tables S1–S3. Their co-occurrence at Abu Thor and their complete absence at Allouga and Abu Zarab likely reflect provenance signature, possibly from As- and Ti-bearing basement lithologies exposed in the Abu Thor drainage catchment, rather than a formation-wide mineralization process.
Figure 20. Detrital and late-stage alteration minerals from the Abu Thor paleokarst, ferruginous siltstone and gibbsite–kaolinite facies. (a) Binocular photomicrograph of rutile [TiO2] showing elongated to subrounded grains with deep blood-red to brownish-red color and adamantine luster, reflecting a locality-specific detrital provenance signature absent from Allouga and Abu Zarab. (b) Combined XRD diffractogram confirming the co-occurrence of rutile [TiO2] and arsenopyrite [FeAsS]—a distinctive mineral pair unique to Abu Thor within the studied assemblage. (c) Binocular photomicrograph of paratacamite [Cu2(OH)3Cl] from the gibbsite–kaolinite facies, showing well-developed rhombohedral crystals with greenish-black to dark-green color and a light-green streak, associated with malachite, azurite, and atacamite. (d) XRD diffractogram con-firming paratacamite identification, representing a late-stage, low-temperature Cu-halide alteration product of atacamite within the Abu Thor paleokarst.
Minerals 16 00558 g020

4.2.7. Paratacamite [Cu2(OH)3Cl]

Paratacamite was identified in the gibbsite–kaolinite facies of the Abu Thor paleokarst, where it is associated with malachite, azurite, and atacamite. Its crystals are well-developed rhombohedral forms with a greenish-black to dark-green color and a light-green streak (Figure 20c); Figure 20d confirms XRD identification. Measured 2θ reflections (CuKα): 16.1° (d = 5.49 Å; strongest, 100%), 32.6° (2.75 Å), 39.9° (2.26 Å), 49.5° (1.84 Å), and 57.7° (1.59 Å) (ICDD 25-1427); full data are in Supplementary Tables S1–S3. Paratacamite forms through the alteration of atacamite under cold, chlorine-rich percolating-water conditions and represents a late-stage, lower-temperature Cu-halide phase. Its restriction to Abu Thor—where the Cu-halide assemblage is most diverse—reinforces the locality-specific character of the copper mineralization pathways and underscores each paleokarst system’s geochemical individuality within the broader Um Bogma framework.

5. Discussion

5.1. Lithofacies as the Primary Control of Uranium Distribution

Across all 16 paleokarst profiles examined at Abu Thor, Allouga, and Abu Zarab, one pattern emerges with remarkable consistency: ferruginous siltstone is the universal uranium host. This lithofacies invariably records the highest equivalent uranium (eU) values at every locality—a reproducibility that cannot be attributed to sampling bias and instead points directly to a lithofacies-governed geochemical mechanism. The explanation lies in the surface chemistry. Iron oxides—particularly amorphous Fe(OH)3—carry exceptionally high specific surface areas, providing a maximum density of reactive hydroxyl sites for the adsorption of dissolved uranyl ions (UO22+) from percolating meteoric fluids [41]. The Fe2O3 content of the ferruginous siltstone is, by definition, the highest of any lithofacies in the paleokarst fill, and it is precisely this characteristic that makes it the dominant uranium trap.
The clay mineral horizon, which underlies or flanks the ferruginous siltstone in most paleokarst profiles, retains moderate uranium concentrations. Kaolinite has a geochemical enrichment factor (GEF) of approximately 2, and montmorillonite a GEF of 6—both figures are orders of magnitude below the GEF of amorphous iron hydroxides, which ranges from 1.1 × 10⁶ to 2.7 × 10⁶ [41,42,43]. Thus, clay minerals act as secondary, subordinate sorbents rather than primary uranium traps. Note that this distinction is not merely academic: it directly determines where drill intersections should be targeted in exploration, as detailed in Section 5.5.
Paradoxically, the uppermost gibbsite–kaolinite zone—despite its surface proximity and presumed exposure to uranium-bearing fluids—consistently records the lowest eU values of any horizon within the paleokarst fill. The reason for this is the geochemical conditions of Stage 3 laterite evolution. The return to alkaline–reducing conditions at this stage promotes the solubility of uranyl carbonate and uranyl hydroxide complexes, destabilizing previously adsorbed uranium and driving its downward remobilization into the underlying iron-rich horizons [41]. Thus, the gibbsite–kaolinite zone functions not as a terminal sink but as a transient zone of uranium mobility—a conclusion with direct implications for the interpretation of radiometric profiles in weathered carbonate sequences.

Statistical Validation of Lithofacies-Controlled Uranium Distribution

A quantitative statistical analysis was performed to test whether the observed enrichment of uranium in the ferruginous siltstone is significant. Equivalent uranium (eU) measurements from each lithofacies horizon of the 16 profiled paleokarsts were compiled and summarized using descriptive statistics (Table 9). Because the eU data are not normally distributed, a Kruskal–Wallis non-parametric test was applied to compare median eU concentrations across lithofacies. Dunn’s post hoc test with Bonferroni correction was used to isolate which pairs of lithofacies differ. The results demonstrate that the ferruginous siltstone possesses a significantly higher median eU than all other fill lithofacies (p < 0.001), confirming its role as the primary uranium host.
Post hoc pairwise comparisons (Dunn test with Bonferroni correction):
  • Ferruginous siltstone vs. Argillaceous limestone: p < 0.001
  • Ferruginous siltstone vs. Clay mineral horizon: p < 0.001
  • Ferruginous siltstone vs. Gibbsite–kaolinite: p < 0.001
  • Clay mineral horizon vs. Argillaceous limestone: p = 0.003
  • Clay mineral horizon vs. Gibbsite–kaolinite: p = 0.012
The Kruskal–Wallis test confirms that eU concentrations differ significantly across lithofacies. Pairwise comparisons show that the ferruginous siltstone (Stage 2) has eU values that are orders of magnitude higher than those of the other three horizons, with all Bonferroni-corrected p-values below 0.001. This demonstrates that the ferruginous siltstone is the only lithofacies that serves as a statistically significant, high-grade uranium host, and that uranium distribution in the paleokarst system is fundamentally governed by lithofacies rather than by proximity to dissolution features or random variability.

5.2. Three-Stage Laterite Evolution and Uranium Enrichment Timing

The geochemical evolution of the Um Bogma paleokarst fill is most coherently interpreted through a three-stage laterite model, supported by independent evidence from radiometric profiles, major oxide variation curves, trace element systematics, and rare-earth element (REE) patterns. Stage 1, characterized by alkaline–oxidizing conditions, records intense leaching of the soluble cations Ca, Mg, Si, and Na from the parent argillaceous limestone, leaving behind a residue progressively enriched in Al and Fe. This stage also coincides with the maximum REE adsorption onto clay and iron oxide surfaces and with the peak enrichment of Cu and Zn—the latter sourced, as discussed in Section 5.4, from lateral input of Precambrian basement-derived fluids [44]. The mineralogical record of Stage 1 is captured by atacamite and chalcophanite, which are both confined to this early horizon.
It must be noted that the assignment of individual minerals to specific laterite stages is based on their stratigraphic position within the profiled fill sequences, not on direct petrographic evidence such as cross-cutting relationships, replacement textures, or phase equilibria constraints. While the stratigraphic assignments are internally consistent with the geochemical model, future thin-section petrography and in situ isotopic analysis would be required to confirm the temporal relationships proposed here.
Stage 2 represents the laterite system’s geochemical climax. Under acidic oxidizing conditions, Fe2O3 reaches its maximum concentration, and the ferruginous siltstone lithofacies forms as the dominant product of this environment. Uranium enrichment is maximized precisely at this stage, coinciding with the iron oxide accumulation peak—a temporal correspondence that constitutes the strongest evidence for surface adsorption as the operative uranium fixation mechanism. Published major oxide variation curves (Figure 3 and Figure 4 in [21]), trace element profiles (Figure 5a–c in [21]), and uranium concentration curves (Figure 8 in [21]) all converge on this conclusion for the Abu Zarab locality, and the present multi-locality dataset confirms its reproducibility across Abu Thor and Allouga as well. The jarosite mineral assemblage, with its well-established formation under acidic–oxidizing conditions [45] provides an independent mineralogical proxy for Stage 2 conditions.
Stage 3 marks a return to alkaline–reducing conditions, under which gibbsite and kaolinite crystallize as stable aluminosilicate phases, Fe2O3 concentrations decline, and uranium is partially remobilized downward from the surface zone [46]. Carnotite, natroboltwoodite, soddyite, malachite, paratacamite, and ankerite all stabilize during this final stage. Their co-precipitation reflects a chemically heterogeneous fluid regime in which vanadium, sodium, potassium, copper, and carbonate become available as ligands for secondary mineral formation. Taken together, the three-stage model yields a confirmed and internally consistent conclusion: uranium in the Um Bogma paleokarst fill is a supergene, low-grade ore concentrated post-laterite formation. This is not a model assumption—it is an empirically validated conclusion supported by convergent lines of radiometric, geochemical, and mineralogical evidence assembled across all 16 profiled paleokarsts. The optimum formation conditions for the key secondary minerals in the Um Bogma system are compiled in Table 10.

5.3. Iron Oxide Surface Adsorption: Mechanism and Evidence

The most probable mechanism of uranium fixation in the Um Bogma paleokarst system is iron oxide surface adsorption—an interpretation consistent with theoretical geochemical arguments and bulk geochemical data, though direct microscale confirmation at the mineral surface was not obtained in this study. The theoretical basis lies in the ionic potential of Fe3+: at values ≥3+, cations form insoluble hydroxides under oxidizing conditions rather than remaining in solution, generating the amorphous Fe(OH)3 phase that carries the highest known GEF for uranium adsorption [51,52]. Under the mildly acidic to near-neutral pH conditions of Stage 2 laterite evolution, dissolved UO22+ is electrostatically attracted to the negatively charged surfaces of these iron hydroxide precipitates—a process well characterized in experimental adsorption studies [41,53,54].
The empirical validation is supportive but indirect. The Pearson correlation coefficient between U and Fe2O3 across the Abu Zarab paleokarst geochemical dataset is r = 0.98—a near-perfect positive correlation that was previously reported by [21] and now confirmed across the full 16-paleokarst multi-locality dataset of the present study. No other major oxide or trace element approaches this level of co-variation with uranium, strongly implicating Fe2O3 as the primary geochemical control. It is important to acknowledge, however, that correlation does not demonstrate causation; direct microscale evidence—such as TEM imaging or micro-XANES spectroscopy of uranyl bonding at iron oxide surfaces—was not obtained in this study. By comparison, the correlation coefficients of clay minerals with uranium are orders of magnitude weaker, consistent with their substantially lower GEF values [41].
One finding from this mineralogical investigation warrants particular attention. SEM–EDX analysis of atacamite grains from the Abu Zarab paleokarst (Figure 18b; Table 7) revealed uranium at a concentration of 45.36 wt% (12.08 at%) at crystal surfaces—a discovery with no precedent in the Um Bogma Formation literature. This observation extends the known uranium sorbent inventory beyond iron oxides and identifies copper halide mineral surfaces as an additional geochemical trap for uranium during the early alkaline–oxidizing stage of laterite evolution. The implication is clear: the uranium fixation system in this formation is more mineralogically diverse than previously recognized, and uranium may be locally concentrated on the atacamite surfaces independently of the iron oxide framework.
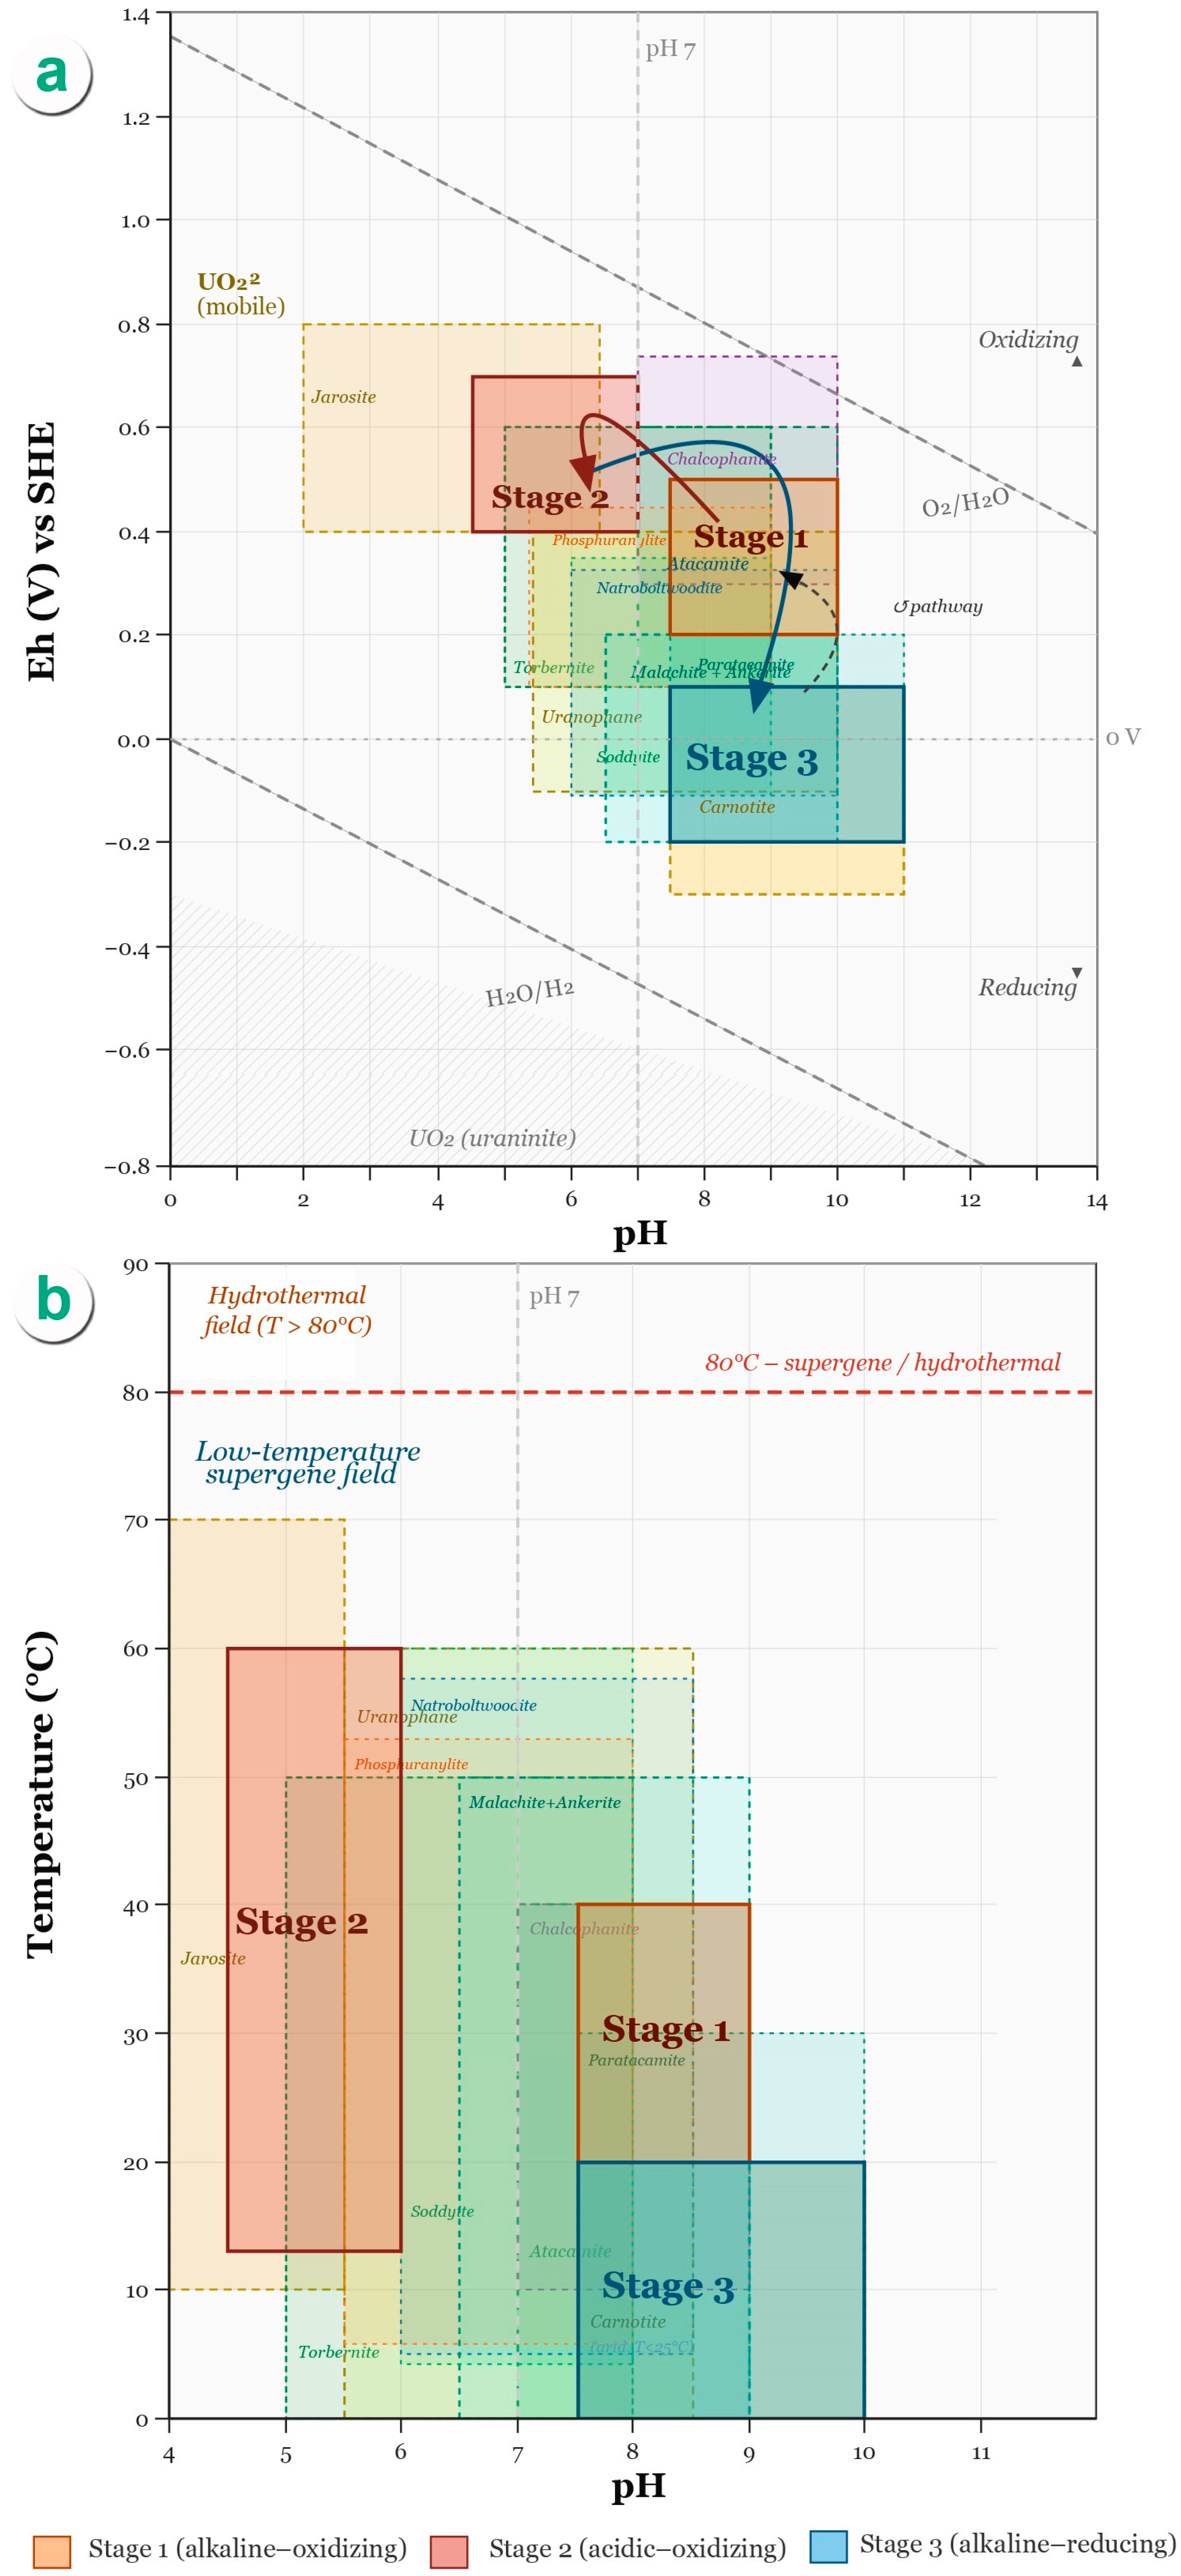
The geochemical evolution of the paleokarst fluid system can be visualized quantitatively in Eh–pH space, where each laterite stage occupies a distinct, internally consistent geochemical domain (Figure 21a). Stage 1, the alkaline–oxidizing phase, plots in the upper-right field of the diagram (pH 7.5–9.0; Eh +0.20 to +0.45 V), entirely within the aqueous UO22+ stability field. This position confirms that uranium remains mobile in solution during the initial laterite phase, which explains why atacamite and chalcophanite—despite direct contact with uranium-bearing fluids—adsorb comparatively little uranium at Stage 1. The Stage 1-to-Stage 2 transition follows a vector toward lower pH and higher Eh (Figure 21a, arrow 1–2), entering the co-stability domain of iron hydroxides and secondary uranium phases. Stage 2, the acidic–oxidizing climax (pH 4.5–6.5; Eh +0.30 to +0.62 V), is where the uranium fixation cascade operates: dissolved UO22+ is electrostatically adsorbed onto negatively charged iron hydroxide surfaces [55,56], and secondary uranium silicates (uranophane, soddyite, natroboltwoodite) and phosphates (torbernite, phosphuranylite) nucleate within the iron oxide matrix.
The jarosite stability field overlaps Stage 2 precisely, providing an independent mineralogical proxy for acidic–oxidizing conditions consistent with the EDX data of Table 8. Stage 3, the alkaline–reducing closing phase (pH 7.5–9.5; Eh −0.15 to +0.10 V), is defined by the co-stability of carnotite, malachite, ankerite, and paratacamite (Figure 21a, arrow 2–3). The return to low Eh values at Stage 3 partially destabilizes previously adsorbed uranium, driving the downward remobilization documented by the consistently reduced eU values of the gibbsite–kaolinite zone across all 16 profiled paleokarsts (Table 9). Taken together, the three-stage pathway traces a clockwise loop in Eh–pH space—a paragenetic vector consistent with supergene mineral evolution sequences reported for residual clay deposits, metalliferous duricrusts, and lateritic ore systems in Ore Geology Reviews [57,58] and with the comparable Arabian Desert orecretes described by [5,59,60].
The temperature axis of the mineralization system is addressed in Figure 21b. All secondary uranium phases in the Um Bogma assemblage fall below 80 °C; the terminal Stage 3 phase, carnotite, precipitates at ambient temperatures below 25 °C, consistent with the arid to hyperarid post-Miocene climatic conditions reconstructed for southwestern Sinai during Stages 5 and 6 of the landscape evolution framework [61,62]. No mineral in the assemblage requires elevated temperatures for stability, confirming that the entire Um Bogma secondary uranium assemblage formed under low-temperature supergene conditions and that no hydrothermal overprint contributed to the observed mineral inventory.
Figure 21. Geochemical stability framework for secondary uranium mineralization in the Um Bogma Formation paleokarst, southwestern Sinai. (a) Eh–pH stability diagram at 25 °C (vs SHE) showing approximate stability fields of radioactive and non-radioactive mineral phases identified in this study. Water stability limits (dashed lines): upper, O2/H2O (Eh = 1.228 − 0.0591·pH); lower, H2O/H2 (Eh = −0.0591·pH). The three laterite evolution stages are superimposed: Stage 1 (orange; alkaline–oxidizing; pH 7.5–9.0; Eh +0.20 to +0.45 V), Stage 2 (red; acidic–oxidizing; pH 4.5–6.5; Eh +0.30 to +0.62 V), and Stage 3 (blue; alkaline–reducing; pH 7.5–9.5; Eh −0.15 to +0.10 V). The clockwise evolutionary pathway (arrows) constitutes the first formal Eh–pH paragenetic vector for Carboniferous carbonate-hosted uranium in the Arabian–Nubian Shield. Mineral stability fields compiled from [38,41,47,48,49,50]. (b) Temperature–pH projection confirming that all identified secondary uranium phases form below 80 °C, consistent with a low-temperature supergene origin. The 80 °C boundary (red dashed line) separates the supergene field from hydrothermal conditions. Carnotite occupies the lowest-temperature domain (<25 °C), consistent with arid post-Miocene surface conditions in southwestern Sinai [61,62]. Temperature constraints from [38,49,50].
Minerals 16 00558 g021

5.4. Uranium-Mobilizing Elements’ Provenance, Tectonic Setting, and Source

Geochemical classification diagrams and tectonic discrimination plots applied to the full Paleozoic rock succession of the study area consistently indicate a passive continental margin tectonic setting for most clastic formations. This affinity is entirely consistent with the established regional paleogeographic framework: during Cambro-Ordovician to Carboniferous time, southwestern Sinai formed part of the northern Gondwanan passive margin facing the Tethyan seaway, a setting characterized by low-energy siliciclastic deposition, gradual thermal subsidence, and minimal active magmatic input [63]. TiO2–Ni provenance plots indicate a mature sediment provenance for the Abu Hamata and Magharet El-Maiah Formations, consistent with recycled orogenic sources rather than proximal juvenile arc material—a result that aligns with the ANS basement inheritance described in the regional setting.
The enrichment of Cu and Zn in the paleokarst fill clay mineral horizons presents a more locally specific picture. These elements cannot be sourced solely from the enclosing carbonate or the overlying siliciclastic cover; their concentrations exceed the primary detrital input or carbonate dissolution could plausibly deliver. The most parsimonious explanation—and the one best supported by the spatial distribution of enrichment—is lateral transfer from adjacent Precambrian syenogranite bodies, which are well-documented hosts of base-metal mineralization in the Arabian–Nubian Shield [63]. We interpret this as evidence of active basement-to-cover element transfer during lateritization, a process that effectively coupled the metallogeny of the underlying crystalline basement to the geochemical evolution of the Paleozoic cover.
The heavy rare-earth element enrichment observed in the ferruginous siltstone horizon is interpretively distinct from the Cu–Zn signal. Rather than reflecting a primary depositional or hydrothermal input, HREE enrichment in this context most plausibly consistent with the dissolution of detrital zircon and xenotime grains during acidic Stage 2 weathering—a diagenetic REE fractionation mechanism recognized in lateritic systems [40,64]—though direct evidence (e.g., REE mass-balance calculations, xenotime dissolution textures under SEM, or comparative HREE budgets between parent rock and fill) was not obtained and would be required to confirm this interpretation. The negative Eu anomaly documented in the REE patterns further supports a mixed origin model in which externally sourced detrital material, rather than enclosing carbonate alone, contributes to the paleokarst infill geochemistry.

5.5. Tethyan Arabian Platform Analogs and Implications for Exploration

The Um Bogma Formation does not exist in geological isolation. Carboniferous carbonate sequences across the broader Arabian Plateau share a common tectono-stratigraphic inheritance as integral components of the northern Gondwanan margin of the Tethys. The metallogenic framework established in this study may serve as a hypothesis-generating reference for these correlative sequences, though direct applicability would require supporting regional geochemical, stratigraphic, or isotopic correlation data that lie beyond the scope of this investigation. The Tabuk Formation of Saudi Arabia—a Cambro-Ordovician to Carboniferous clastic–carbonate succession deposited along the same Tethyan margin—hosts paleokarst development in its dolomitic intervals and uranium anomalies in ferruginous horizons that are directly analogous to those documented here. Similarly, the Khreim and Rum Groups of Jordan, where Cambro-Ordovician sandstones are overlain by Carboniferous carbonates, record uranium enrichment in Fe-rich horizons at carbonate–clastic contacts—precisely the same stratigraphic position and geochemical context as the Um Bogma ferruginous siltstone facies.
Iron-rich lateritic infill within Carboniferous carbonate paleokarst structures, developed under tropical-to-subtropical weathering regimes driven by Tethyan climatic conditions and tectonically punctuated by platform emergence episodes during Hercynian uplift and eustatic lowstands, is the common metallogenic thread running through all these sequences. Note that this shared inheritance is not coincidental: it reflects the synchronous exposure of carbonate platforms across the northern Arabian margin during the same Hercynian tectonic cycle, generating broadly equivalent weathering and karst-forming conditions across a region extending from Egypt through Jordan to Saudi Arabia.
From this synthesis, a practical and hypothesis-driven exploration model emerges. Ferruginous siltstone facies within paleokarst dissolution features in Carboniferous carbonate sequences constitute the primary drill targets; clay mineral horizons represent secondary targets with moderate uranium potential; and gibbsite–kaolinite zones are low-priority targets owing to uranium remobilization under Stage 3 conditions despite their surface prominence. This three-tier target hierarchy, derived empirically from 16 profiled paleokarsts across three localities, is placed within a Tethyan-scale exploration framework that extends its applicability well beyond the Um Bogma Formation—representing, to our knowledge, the first formally published mineral paragenetic reference for supergene uranium in Carboniferous carbonate paleokarst systems of the Arabian–Nubian Shield. Its broader regional applicability should be treated as a testable hypothesis pending independent geochemical, stratigraphic, and isotopic validation in analogous sequences across the Arabian Platform.

5.6. Comparison with Uranium Mineralization in Adjacent Arabian–Nubian Shield Regions

The mineral paragenesis documented at Um Bogma shares several key phases with uranium occurrences in neighboring countries yet exhibits distinctive characteristics that reflect local palaeohydrological conditions. A comparative summary of secondary uranium, copper, and manganese mineral assemblages from Egypt, Jordan, and Saudi Arabia is presented in Table 11. Uranophane, carnotite, and torbernite are widespread across the region, indicating that similar uranyl-silicate and uranyl-vanadate/-phosphate complexation processes operate wherever oxidizing fluids interact with uranium-bearing host rocks. The copper-halide phases (atacamite, paratacamite) that are particularly abundant at Abu Thor, however, are rare or absent in the sandstone-hosted deposits of Jordan and Saudi Arabia. This enrichment is attributed to the proximity of Cu-rich syenogranite basement in the Um Bogma area and to the exceptionally efficient trapping of Cu-chloride complexes in the alkaline Stage-1 paleokarst environment.
The Um Bogma assemblage also differs from the typical ‘orecrete’-type surficial uranium accumulations described from the Arabian Desert [5,60]. Where orecretes commonly form at or near the present-day land surface as duricrusts cemented by uranyl vanadate, the Um Bogma paragenesis is sealed beneath a Permo-Triassic basalt cap and is intimately tied to a multi-stage laterite weathering profile developed within a buried paleokarst system. Consequently, the mineralogy records a polyphase history of uranium fixation, remobilization, and re-precipitation that extends well beyond the range of conditions observed in simple calcrete-hosted deposits. This comparison underscores the need to treat the Um Bogma Formation as a reference for Paleozoic carbonate-hosted uranium paleokarst systems on the Arabian–Nubian Shield, while acknowledging that younger supergene overprinting may have contributed to the final mineral inventory.

5.7. Morphostratigraphic Framework, Sequence Stratigraphy, and Landscape Evolution from Late Paleozoic to Quaternary

The uranium mineralization documented in this study cannot be fully interpreted without anchoring it within a morphostratigraphic and sequence stratigraphic framework spanning the Late Carboniferous to the Quaternary. The Um Bogma Formation and its enclosed paleokarst system represent a single snapshot within a much longer landscape evolution history; only by examining this broader temporal context can the preservation, Cenozoic re-exposure, and supergene reworking of the mineral assemblage be properly understood. Table 12 presents the framework in tabular form, using the column structure most accessible to an international audience and directly comparable with GeoArabia-published Arabian Platform sequence stratigraphic schemes [27,28,69] and Geomorphology-published morphostratigraphic records of supergene ore deposits [60,70]. The discussion below links each stage to the mineralogical record documented in Section 4 and Section 5.1, Section 5.2, Section 5.3, Section 5.4, Section 5.5 and Section 5.6.
Stage 1—Hercynian Emergence and Karstification (Late Carboniferous–Early Permian, ca. 310–290 Ma). Compressional reactivation of the Arabian–Nubian Shield drove regional emergence and subaerial exposure of the Um Bogma carbonate platform. Meteoric water infiltration through NNW–NW and N–NE fracture corridors dissolved the dolostones, creating the 16 paleokarst cavities documented in this study. Simultaneously, tropical–subtropical weathering initiated Stage 1 laterite formation, depositing the clay mineral horizon and the atacamite–chalcophanite assemblage (Figure 21a, Stage 1 domain). This stage is bounded below by the Hercynian unconformity—a first-order sequence boundary that is independently recognizable across the Arabian craton [11,27,28,69]—and defines the fundamental uranium trap of the Um Bogma system. The detrital zircon (Neoproterozoic ANS provenance) and monazite grains identified in this study record the initial heavy-mineral input to the paleokarst fill, supplying both LREE and HREE to the evolving laterite profile from the outset of Stage 1.
Stage 2—Permo-Triassic Basalt Sealing (ca. 265–245 Ma). Emplacement of the Permo-Triassic basalt sheet across southwestern Sinai [9,11] sealed the uranium-bearing laterite beneath an impermeable igneous cap, halting further supergene reworking and preserving Stage 2 iron oxide mineralogy and uranium fixation intact through the subsequent 250 Ma of geological history. From a sequence stratigraphic perspective, this cap constitutes a regional unconformity that defines the upper temporal bound of the mineralizing interval [2]. The basalt cap is the primary geological reason why the Um Bogma uranium deposit has survived 300 million years of erosion while analogous surface laterites on the Arabian margin have been stripped. Stage 2 conditions (acidic–oxidizing; Eh +0.30 to +0.62 V; pH 4.5–6.5; Figure 21a) matured to completion during this interval, producing the uranophane, torbernite, soddyite, natroboltwoodite, and phosphuranylite assemblage documented in Section 4.1.3, Section 4.1.4, Section 4.1.5, Section 4.1.6, Section 4.1.7, Section 4.1.8 and Section 4.1.9.
Stage 3—Mesozoic Burial and Thermal Quiescence (Triassic–Cretaceous). Transgression of Tethyan marine sediments buried the basalt-capped Paleozoic succession beneath a Mesozoic carbonate and clastic cover, corresponding to the Transgressive Systems Tract in regional Arabian Platform compilations [2,3,27]. Geothermal gradients associated with burial remained below the stability thresholds of the entire supergene mineral assemblage (<80 °C; Figure 21b). No new uranium mineral phases are attributed to this stage; it represents a period of chemical stability and geochemical isolation that effectively locked in the Stage 2 mineral inventory.
Stage 4—Paleogene Uplift and Partial Unroofing (Eocene–Oligocene, ca. 55–30 Ma). Epirogeny associated with incipient Arabian Plate–African Plate divergence stripped the Mesozoic cover from the highest structural culminations of the Sinai Peninsula [10]. Where the basalt cap was locally breached, the Um Bogma Formation was re-exposed to oxidizing surface conditions. Limited fluid throughput in the absence of major fracture reactivation, however, produced no new diagnostic uranium mineral phases at this stage. Comparable Paleogene landscape responses—selective unroofing at structural highs followed by geochemical stasis in sealed sub-surface horizons—are documented in morphostratigraphic records of supergene ore systems in Geomorphology [60,71].
Stage 5—Oligocene–Miocene Rifting and Morphotectonic Partitioning (ca. 30–5 Ma). The opening of the Red Sea and Gulf of Suez rift systems [10,72] was the pivotal geomorphic event controlling the present spatial distribution of the Um Bogma uranium occurrences. Rifting reactivated the NNW–NW and N–NE structural corridors identified in this study as governing paleokarst clustering, produced differential block uplift across southwestern Sinai, and controlled stream incision into the Paleozoic succession. The selective exhumation of the Um Bogma Formation at precisely three localities—Abu Thor, Allouga, and Abu Zarab—is therefore in part a Miocene morphotectonic artifact: these localities correspond to structurally elevated blocks preferentially incised by Miocene–Pliocene drainage networks. The variable preservation of the upper Um Bogma member at Abu Zarab (Section 2.1) likely reflects greater Miocene erosional truncation at that block relative to Abu Thor and Allouga. Critically, fracture corridors reactivated during this stage provided new fluid pathways through the paleokarst fill, facilitating minor uranium remobilization and the first precipitation of Stage 3 mineral phases (carnotite, paratacamite) documented in the uppermost laterite horizon.
Stage 6—Pliocene–Quaternary Hyperaridity and Terminal Mineral Stabilization (<5 Ma). Progressive aridification of the Sinai Peninsula during the late Neogene and Quaternary established the hyperarid desert conditions that persist today [5,69,70]. Desert pavement development and episodic wadi incision under this climate regime produced the near-surface alkaline–reducing geochemical conditions of Stage 3 (Figure 21a), under which carnotite precipitated from V-bearing alkaline fluids at temperatures below 25 °C (Figure 21b) and malachite, paratacamite, and ankerite stabilized in the uppermost gibbsite–kaolinite zone. Carnotite formation under arid to semi-arid conditions at ambient temperatures is characteristic of Quaternary-age supergene uranium deposits across the Arabian Desert and North Africa [5,6,73]. The Um Bogma Stage 6 assemblage thus represents the terminal, climatically driven endpoint of a 300-million-year metallogenic history that spans from Hercynian karstification to Quaternary arid-climate mineralization.
Integrating Figure 21 (Eh–pH and T–pH stability framework) with Table 12 (morphostratigraphic and sequence stratigraphic framework) provides a four-dimensional context for uranium metallogenesis in this sector of the Arabian–Nubian Shield: space (three paleokarst localities across 15 km2 of exposed Um Bogma Formation), time (Late Paleozoic to Quaternary, six morphostratigraphic stages spanning ca. 310 Ma), fluid chemistry (the Eh–pH clockwise paragenetic loop spanning three geochemical domains), and geomorphology (six-stage landscape evolution from Hercynian platform emergence to Quaternary desert pavement formation). To the authors’ knowledge, this is the first formally published morphostratigraphic framework for a Carboniferous carbonate-hosted uranium paleokarst system on the Arabian–Nubian Shield. The framework is deliberately structured to be directly comparable with Arabian Platform sequence stratigraphic schemes [11,27,28] and with morphostratigraphic records of supergene ore deposits [5,60], enabling future regional correlation across the Carboniferous carbonate sequences of the Arabian Platform.

6. Conclusions

Radiometric profiling of 16 paleokarst structures across Abu Thor, Allouga, and Abu Zarab confirms that ferruginous siltstone is the universal uranium host within the Um Bogma Formation. Equivalent uranium (eU) values in this lithofacies range from 55 to 650 ppm at Abu Thor, 100 to 1450 ppm at Allouga, and 111 to 498 ppm at Abu Zarab—contrasting sharply with those of the near-background argillaceous limestone parent rock (eU average 3.3 ppm at Abu Zarab). All other paleokarst lithofacies record consistently lower values. The reproducibility of this pattern across three localities and sixteen structures establishes that uranium distribution is governed by lithofacies, not dissolution proximity. Therefore, lithostratigraphic mapping of the ferruginous siltstone interval is the most direct exploration targeting approach within this deposit type. A descriptive statistics table (mean, median, range, SD) for eU by lithofacies, along with statistical significance tests (Kruskal–Wallis or ANOVA) comparing the ferruginous siltstone against other horizons, is recommended as an addition to the revised manuscript to substantiate this pattern quantitatively.
Nine radioactive and eight non-radioactive mineral phases were identified across 16 paleokarst profiles at Abu Thor, Allouga, and Abu Zarab using XRD and SEM–EDX, constituting the first comprehensive multi-locality mineral inventory for the Um Bogma Formation. The assemblage defines a three-stage paragenetic sequence tied to laterite evolution: atacamite and chalcophanite in the alkaline–oxidizing Stage 1; the primary uranium-bearing phases (uranophane, torbernite, natroboltwoodite, soddyite) in the iron-oxide-dominated Stage 2; and carnotite, malachite, paratacamite, and ankerite in the final alkaline–reducing Stage 3. A strong U–Fe2O3 correlation (r = 0.98), consistent across all localities, supports iron oxide surface adsorption as the principal uranium fixation mechanism, though microscale confirmation awaits future work. Novel findings include the first reported uranium enrichment (45.36 wt%) at atacamite crystal surfaces in this formation, extending the known sorbent inventory beyond iron oxides. REE systematics indicate an open-system paleokarst with mixed carbonate-derived (LREE) and detrital (HREE) provenance. The facies-based exploration model—prioritizing ferruginous siltstone within paleokarst structures—provides a testable reference framework for Carboniferous carbonate uranium systems across the Arabian–Nubian Shield, pending regional isotopic and stratigraphic validation.

Supplementary Materials

The following supporting information can be downloaded at: https://www.mdpi.com/article/10.3390/min16050558/s1. Table S1:. Measured XRD 2θ peak positions, calculated d-spacings, and relative intensities for radioactive and non-radioactive mineral phases in Um Bogma Formation paleokarst fill, southwestern Sinai, Egypt. Table S2: Kaolinite (K) XRD marker positions identified in the carnotite diffractogram (Figure 9b), Um Bogma Formation paleokarst fill. Table S3: SEM–EDX quantitative compositional data for mineral phases identified by scanning electron microscopy, Um Bogma Formation paleokarst fill. Table S4: Descriptive statistics for equivalent uranium (eU, ppm) by lithofacies across all 16 sampled paleokarst structures, Um Bogma Formation, southwestern Sinai.

Author Contributions

Conceptualization, H.M.A. and M.W.A.E.-M.; methodology, H.M.A. and M.W.A.E.-M.; formal analysis, H.M.A. and M.W.A.E.-M.; investigation, H.M.A., M.W.A.E.-M., O.R.E., M.M.F.A., M.M.M.A.G. and M.F.; resources, H.M.A. and M.H.H.; data curation, H.M.A., M.W.A.E.-M., O.R.E., M.M.F.A., M.M.M.A.G. and M.F.; writing—original draft preparation, H.M.A. and M.W.A.E.-M.; writing—review and editing, H.M.A., M.W.A.E.-M. and M.H.H.; visualization, H.M.A. and M.W.A.E.-M.; supervision, H.M.A.; project administration, H.M.A.; validation, H.M.A.; funding acquisition, M.H.H. All authors have read and agreed to the published version of the manuscript.

Funding

This research was funded by Northern Border University, Saudi Arabia project number (NBU-CRP-2026-540).

Data Availability Statement

The datasets generated and analyzed during this study are not publicly available due to institutional restrictions but may be obtained from the corresponding author upon reasonable request.

Acknowledgments

The authors extend their appreciation to Northern Border University, Saudi Arabia, for supporting this work through project number (NBU-CRP-2026-540).

Conflicts of Interest

The authors declare no conflicts of interest.

References

  1. Hamada, M.; Gaber, H.; Saleh, M.; Badreldin, H.; ElKhouly, S.H.; El-Sharkawy, A.; Abudeif, A.M.; Mohamed, E.A.; Ramadan, H.S. Seismotectonic Map of the Sinai Triple Junction. J. Afr. Earth Sci. 2025, 221, 105464. [Google Scholar] [CrossRef]
  2. Tassy, A.; Crouzy, E.; Gorini, C.; Rubino, J.-L.; Bouroullec, J.-L.; Sapin, F. Egyptian Tethyan Margin in the Mesozoic: Evolution of a Mixed Carbonate-Siliciclastic Shelf Edge (from Western Desert to Sinai). Mar. Pet. Geol. 2015, 68, 565–581. [Google Scholar] [CrossRef]
  3. Zoleikhaei, Y.; Mulder, J.A.; Cawood, P.A. Early Paleozoic Extensional Tectonics along Gondwana’s Northern Margin: Insights from Iran. Gondwana Res. 2024, 128, 106–126. [Google Scholar] [CrossRef]
  4. Kora, M.; El Shahat, A.; Abu Shabana, M. Lithostratigraphy of the Manganese-Bearing Um Bogma Formation, West-Central Sinai, Egypt. J. Afr. Earth Sci. 1994, 18, 151–162. [Google Scholar] [CrossRef]
  5. Dill, H.G. A Comparative Study of Uranium–Thorium Accumulation at the Western Edge of the Arabian Peninsula and Mineral Deposits Worldwide. Arab. J. Geosci. 2011, 4, 123–146. [Google Scholar] [CrossRef]
  6. Dill, H.G.; Weber, B.; Botz, R. Metalliferous Duricrusts (“orecretes”)—Markers of Weathering: A Mineralogical and Climatic-Geomorphological Approach to Supergene Pb-Zn-Cu-Sb-P Mineralization on Different Parent Materials. Neues Jahrb. Für Mineral. Abh. 2013, 190, 123–195. [Google Scholar] [CrossRef]
  7. El Sharkawi, M.A.; El Aref, M.M.; Motelib, A.A. Manganese Deposits in a Carboniferous Paleokarst Profile, Um Bogma Region, West-Central Sinai, Egypt. Miner. Depos. 1990, 25, 34–43. [Google Scholar] [CrossRef]
  8. Stern, R.J.; Johnson, P. Continental Lithosphere of the Arabian Plate: A Geologic, Petrologic, and Geophysical Synthesis. Earth-Sci. Rev. 2010, 101, 29–67. [Google Scholar] [CrossRef]
  9. Mansour, S.; Hasebe, N.; Abdelrahman, K.; Fnais, M.S.; Tamura, A. Reconstructing the Tectonic History of the Arabian–Nubian Shield in Sinai: Low-Temperature Thermochronology Implications on Wadi Agar Area. Minerals 2023, 13, 574. [Google Scholar] [CrossRef]
  10. Afifi, A.S.; Moustafa, A.R.; Helmy, H.M. Rift Domains and Structural Framework of the Northwestern Red Sea Basin, Egypt. Int. J. Earth Sci. 2023, 112, 2049–2064. [Google Scholar] [CrossRef]
  11. Al Hseinat, M.; AlZidaneen, M.; Jaradat, R.; Al-Rawabdeh, A.; Hübscher, C. Tectono-Stratigraphic Framework and Evolution of the Northwestern Arabian Plate, Central Jordan. Tectonophysics 2023, 863, 229993. [Google Scholar] [CrossRef]
  12. Soliman, S.M.; Abu El-Fetouh, M. Lithostratigraphy of the Carboniferous Nubian-Type Sandstone in West-Central Sinai, Egypt. In VI Arab Science Congress, 2–9 November 1969, Damascus, Syria; Cairo University Press: Cairo, Egypt, 1969. [Google Scholar]
  13. Weissbrod, T. The Paleozoic of Israel and Adjacent Countries; Institute for Petroleum Research and Geophysics: Lod, Israel, 1969. [Google Scholar]
  14. Kora, M. The Paleozoic Outcrops of Um-Bogma Area, Sinai, Egypt. Master’s Thesis, Mansoura University, Mansoura, Egypt, 1984. [Google Scholar]
  15. El-Shahat, A.; Kora, M. Petrology of the Early Paleozoic Rocks of Um Bogma Area, Sinai. Mansoura Sci. Bull. 1986, 13, 151–184. [Google Scholar]
  16. El Kassas, I.A. Geologic and Radiometric Prospection of Radioactive Raw Materials in West Central Sinai; Internal Report; Department of Geological Raw Materials (AEE): Cairo, Egypt, 1967. [Google Scholar]
  17. El Aassy, I.; Botros, N.H.; Abdel Razik, A.; El Shamy, A.S.; Ibrahim, S.K.; Sherif, H.Y.; Attia, K.E.; Moufei, A.A. Report on Proving of Some Radioactive Occurrences in West Central Sinai; Internal Report; NMA: Cairo, Egypt, 1986. [Google Scholar]
  18. Dabbour, G.A.; Mahdy, M.A. Mineralogical Studies on the Carboniferous Uraniferous Sediments of West Central Sinai, Egypt. In Proceedings of the Fourth Conference of Nuclear Sciences and Applications, Cairo, Egypt, 6–10 March 1988; VI Nuclear reactors. Nuclear fuel cycle; Nuclear Materials Authority (NMA): Cairo, Egypt, 1988; p. 1. [Google Scholar]
  19. Abd Elghany, M.S.; Mahdy, M.A.; Abd El-Monem, A.M.; El-Hazek, A.T. Pilot Plant Studies on the Treatment of El Atshan Uranium Ores, Eastern Desert, Egypt. In Proceedings of the Second Arab Conference on the Peaceful Uses of Atomic Energy, Cairo, Egypt, 5–9 November 1994; Part II: A and B; Arab Atomic Energy Commission: Cairo, Egypt, 1995; p. 229. [Google Scholar]
  20. Omar, A.E. Geo-Environmental and Radioactivity Assessment of East Abu Zenima Area, Southwestern Sinai, Egypt, Using Remote Sensing and GIS. Ph.D. Thesis, Suez Canal University, Ismailia, Egypt, 2016. [Google Scholar]
  21. Mohamed Ali Gabr, M.M.; Awad, M.H.; Elshahat, O.R.; Abdel-Halim, K.A.; Fahim Abaza, M.M. Geochemistry of Paleokarst-Hosted Uranium Anomalies at Abu Zarab Area, Southwestern Sinai, Egypt. J. Afr. Earth Sci. 2021, 181, 104259. [Google Scholar] [CrossRef]
  22. Mansour, M. Sedimentology and Radioactivity of Um Bogma Formation, West Central Sinai, Egypt. Master’s Thesis, Suez Canal University, Ismailia, Egypt, 1994. [Google Scholar]
  23. Sehsah, H.; Kirkland, C.L.; Johnson, T.E.; Abdel-Fattah, Z.A. Evolution of the Neoproterozoic Kareim Basin, North Arabian—Nubian Shield. Sci. Rep. 2025, 15, 17534. [Google Scholar] [CrossRef]
  24. Abdel Monem, A.A.; El Aassy, I.E.; Hegab, O.A.; El-Fayoumy, I.F.; El-Agami, N.L. Gibbsite, Uranium and Copper Mineralization, Um Bogma Area, Southwestern Sinai, Egypt. Sedimentol. Egypt 1997, 5, 117–132. [Google Scholar]
  25. El Agami, N.L. Geology and Radioactivity Studies on the Paleozoic Rock Units in the Sinai Peninsula, Egypt. Master’s Thesis, Mansoura University, Mansoura, Egypt, 1996. [Google Scholar]
  26. Bishr, A. Primary Uranium Mineralization in Paleochannels of the Um Bogma Formation at Allouga, Southwestern Sinai, Egypt. In Proceedings of the Eleventh Arab Conference on the Peaceful Uses of Atomic Energy, Khartoum, Sudan, 23–27 December 2012; Arab Atomic Energy Agency: Khartoum, Sudan, 2012; p. 12. [Google Scholar]
  27. Laboun, A.A. The Paleozoic Geology of Saudi Arabia: History, Tectono-Stratigraphy, Glaciations, and Natural Resources. In The Structural Geology Contribution to the Africa-Eurasia Geology: Basement and Reservoir Structure, Ore Mineralisation and Tectonic Modelling; Rossetti, F., Blanc, A.C., Riguzzi, F., Leroux, E., Pavlopoulos, K., Bellier, O., Kapsimalis, V., Eds.; Springer International Publishing: Cham, Switzerland, 2019; pp. 99–103. [Google Scholar]
  28. Al-Awwad, S.F.; Collins, L.B. Carbonate-Platform Scale Correlation of Stacked High-Frequency Sequences in the Arab-D Reservoir, Saudi Arabia. Sediment. Geol. 2013, 294, 205–218. [Google Scholar] [CrossRef]
  29. Alshami, A.S.A. U-Minerals and REE Distribution, Paragenesis and Provenance, Um Bogma Formation Southwestern Sinai, Egypt. Nucl. Sci. Sci. J. 2018, 7, 31–55. [Google Scholar] [CrossRef]
  30. Abdel-Halim, K.A. Geological and Geochemical Studies on Abu Thora Formation, Southwest Sinai, Egypt. Master’s Thesis, Menoufia University, Shebin El-Kom, Egypt, 2011. [Google Scholar]
  31. El Shahat, A.; Kora, M. Composition of the Early Carboniferous Dolostones of Um Bogma Formation. Bull. Fac. Sci. Mansoura Univ. 1988, 15, 33–58. [Google Scholar]
  32. Kora, M.; Jux, U. On the Early Carboniferous Macrofauna from the Um Bogma Formation, Sinai. Neues Jahrb. Für Geol. Und Paläontologie-Monatshefte 1986, 1986, 85–98. [Google Scholar] [CrossRef]
  33. Gabr, M.M. Structural Control of Uranium and Associated Elements in the Area around Wadi Sad Banat, Southwestern Sinai, Egypt. Sedimentol. Egypt 2013, 21, 207–220. [Google Scholar]
  34. Sallam, O.R.; Abdrabboh, A.M.; Abbas, A.E.A.; Ali, H.H.; Alshami, A.S. The Alloga Quarry, Southwestern Sinai, Egypt: Geological Studies, Radioactivity and Mineralogical Investigations. Egypt. J. Basic Appl. Sci. 2020, 7, 159–179. [Google Scholar] [CrossRef]
  35. Redfern, S.A.T. Manual of Mineralogy (After James D. Dana), 21st Edn, by C. Klein and C. S. Hurlbut Jr, Wiley, New York, 1993. No. of Pages: 681. Price: £22.95 (Soft Covers). Geol. J. 1995, 30, 84–85. [Google Scholar] [CrossRef]
  36. Dahlkamp, F.J. Uranium Ore Deposits; Springer Science & Business Media: Heidelberg, Germany, 2013. [Google Scholar]
  37. Grice, J.D.; Gartrell, B.; Gault, R.A.; Van Velthuizen, J. Ernienickelite, NiMn3O7·3H2O, a New Mineral Species from the Siberia Complex, Western Australia; Comments on the Crystallography of the Chalcophanite Group. Can. Mineral. 1994, 32, 333–337. [Google Scholar]
  38. Stohl, F.V.; Smith, D.K. The Crystal Chemistry of the Uranyl Silicate Minerals. Am. Mineral. 1981, 66, 610–625. [Google Scholar]
  39. El-Aassy, I.E.; Ahmed, F.Y.; AlShami, A.S.; Shata, A.E.; Gabr, M.M.; Rizq, A.A. Geochemical Differentiation in Karst Laterites, Sinai, Egypt. In Proceedings of the 7th International Conference on Geochemistry, 6–7 September 2006, Alexandria, Egypt; Faculty of Science, Alexandria University: Alexandria, Egypt, 2006; pp. 75–81. [Google Scholar]
  40. McLennan, S.M. Rare Earth Elements in Sedimentary Rocks; Influence of Provenance and Sedimentary Processes. Rev. Mineral. Geochem. 1989, 21, 169–200. [Google Scholar]
  41. Langmuir, D. Uranium Solution-Mineral Equilibria at Low Temperatures with Applications to Sedimentary Ore Deposits. Geochim. Cosmochim. Acta 1978, 42, 547–569. [Google Scholar] [CrossRef]
  42. Bowden, J.W.; Posner, A.M.; Quirk, J.P. Adsorption and Charging Phenomena in Variable Charge Soils. In Soils with Variable Charge; Thong, B.K.G., Soc, N.Z., Sci, S., Publ, S., Eds.; New Zealand Society of Soil Science: Lower Hutt, New Zealand, 1980; pp. 147–166. [Google Scholar]
  43. Furlong, D.N.; Yates, D.E.; Healy, T.W. Fundamental Properties of the Oxide/Aqueous Solution Interface. In Trassati, Electrodes of Conductive Metallic Oxides, Part B; Elsevier: Amsterdam, The Netherlands, 1981; pp. 367–432. [Google Scholar]
  44. Erhart, H. La Genèse Des Sols En Tantque Phénomène Géologique; Esquissed’une Théorie Géologique Géochimique, Biostasie et Rhexistasie, 2nd ed.; Masson: Paris, France, 1967; p. 177. [Google Scholar]
  45. Mitchell, R.L.; Sheldon, N.D. The 1100 Ma Sturgeon Falls Paleosol Revisited: Implications for Mesoproterozoic Weathering Environments and Atmospheric CO2 Levels. Precambrian Res. 2010, 183, 738–748. [Google Scholar] [CrossRef]
  46. Knut, T. Sedimentary Geochemistry; Springer: Berlin, Heidelberg, 2010. [Google Scholar] [CrossRef]
  47. Rose, A.W.; Wright, R.J. Geochemical Exploration Models for Sedimentary Uranium Deposits. In Geochemical Exploration for Uranium; Carpenter, R.H., Ed.; Elsevier: Amsterdam, The Netherlands, 1980; pp. 153–179. [Google Scholar]
  48. Buriti, M.S.; Poulain, M.; Cézac, P.; Casás, L. K-Jarosite Precipitation Kinetics at Low-Moderate Temperatures: Factors Affecting Mechanism, Formation Rates, Solid Morphology and Crystallinity. Hydrometallurgy 2025, 235, 106474. [Google Scholar] [CrossRef]
  49. Finch, R.; Ewing, R. Uraninite Alteration in an Oxidizing Environment and Its Relevance to the Disposal of Spent Nuclear Fuel; Swedish Nuclear Fuel and Waste Management Co.: Stockholm, Sweden, 1990. [Google Scholar]
  50. Ranalli, A.; Yager, D. Use of Mineral/Solution Equilibrium Calculations to Assess the Potential for Carnotite Precipitation from Groundwater in the Texas Panhandle, USA. Appl. Geochem. 2016, 73, 118–131. [Google Scholar] [CrossRef]
  51. Gheith, A.M.; El Sankary, M.M.; Anan, T.; Ibrahim, A.S. Occurrence of Carnotite in the Phosphatic Horizon of the Sudr Chalk, Wadi El-Quseiyib, East Central Sinai, Egypt: Paleoenvironmental and Radioactivity Implications. J. Environ. Sci. Mansoura Univ. 2018, 47, 23–25. [Google Scholar] [CrossRef]
  52. Knox, R.W.O.; Soliman, M.F.; Essa, M.A. Heavy Mineral Stratigraphy of Palaeozoic and Mesozoic Sandstones of Southwestern Sinai, Egypt: A Reassessment. GeoArabia 2011, 16, 31–64. [Google Scholar] [CrossRef]
  53. Barton, P.B. Fixation of Uranium in the Oxidized Base Metal Ores of the Goodsprings District, Clark County, Nevada. Econ. Geol. 1956, 51, 178–191. [Google Scholar] [CrossRef]
  54. Van der Weijden, C.H.; Arthur, R.C.; Langmuir, D. Sorption of Uranyl by Hematite: Theoretical and Geochemical Implications. Geol. Soc. Am. Annu. Meet. 1976, 10, 1152. [Google Scholar]
  55. Zhmodik, S.M.; Mironov, A.G.; Nemirovskaya, N.A. Uranium Distribution in Iron Hydroxides from Weathered Mantle as Shown by F-Radiography. Dokl. Akad. Nauk. USSR 1980, 250, 219–222. [Google Scholar]
  56. Michel, D. Les Oxy-Hydroxydes de Fer: Leur Rôle Dans La Distribution de l’uranium Dans Le Milieu Supergène. Ph.D. Thesis, University of Lorraine, Nancy, France, 1983. [Google Scholar]
  57. Wazne, M.; Korfiatis, G.P.; Meng, X. Carbonate Effects on Hexavalent Uranium Adsorption by Iron Oxyhydroxide. Environ. Sci. Technol. 2003, 37, 3619–3624. [Google Scholar] [CrossRef] [PubMed]
  58. Duff, M.C.; Coughlin, J.U.; Hunter, D.B. Uranium Co-Precipitation with Iron Oxide Minerals. Geochim. Cosmochim. Acta 2002, 66, 3533–3547. [Google Scholar] [CrossRef]
  59. Newitt, D.J.; Pedersen, P.K. Observational Data-Based Sequence Stratigraphy of a Clastic Wedge within an Active Foreland Basin, Spirit River Formation, West-Central Alberta, Canada. Mar. Pet. Geol. 2022, 140, 105681. [Google Scholar] [CrossRef]
  60. Dill, H.G.; Gerdes, A.; Weber, B. Age and Mineralogy of Supergene Uranium Minerals—Tools to Unravel Geomorphological and Palaeohydrological Processes in Granitic Terrains (Bohemian Massif, SE Germany). Geomorphology 2010, 117, 44–65. [Google Scholar] [CrossRef]
  61. Sallam, O.R.; Alshami, A.S.; Mohamed, S.A.; El-Akeed, I.A. The Occurrence of Silver-Gold Mineralization Associated with Uranium Bearing Minerals and Base Metal Sulphide, El Sheikh Soliman Area, South Sinai, Egypt. Egy. J. Pure Appl. Sci. 2014, 52, 47–54. [Google Scholar]
  62. Balashov, Y.; Girin, Y. On the Reserve of Mobile Rare Earth Elements in Sedimentary Rocks. Geochem. Int. 1969, 6, 649–659. [Google Scholar]
  63. Abd El-Naby, H.H. Genesis of Secondary Uranium Minerals Associated with Jasperoid Veins, El Erediya Area, Eastern Desert, Egypt. Miner. Depos. 2008, 43, 933–944. [Google Scholar] [CrossRef]
  64. El Tohamy, A.M. Study of Rare Metal Mineralization of Granitoids at South Um Ara-Wadi Murrah Area, Southeastern Desert, Egypt: Implications for a Characterization of Mineral Paragenesis. J. Umm Al-Qura Univ. Appl. Sci. 2025, 7, 115–137. [Google Scholar] [CrossRef]
  65. Krempl, I.; Novotný, K.; Wertich, V.; Škoda, R.; Kanický, V.; Leichmann, J. Distinguishing Secondary Uranium Mineralizations in Uranium Ore Using LIBS Imaging. Spectrochim. Acta Part B At. Spectrosc. 2023, 206, 106734. [Google Scholar] [CrossRef]
  66. Matzko, J.J.; Flanigan, V.; Mawad, M.; Kollak, Z.; Naqvi, M.I.; Helaby, A. Radioactive Anomaly and Mineralogy of the Lower Part of the Tabuk Formation, Al Qassim Area, Kingdom of Saudi Arabia; U.S. Geological Survey: Reston, VA, USA, 1978.
  67. Dawood, Y.H.; Abd El-Naby, H.H. Genesis of Uranyl Mineralization in the Arabian Nubian Shield: A Review. J. Asian Earth Sci. 2022, 225, 105047. [Google Scholar] [CrossRef]
  68. Heikal, M.T.S.; Shereif, A.S.; Csámer, Á.; Deshesh, F. Radiation Assessment and Geochemical Characteristics of 238U, 226Ra, 232Th, and 40K of Selected Specialized Granitic Occurrences, Saudi Arabia, Arabian Shield. Toxics 2025, 13, 612. [Google Scholar] [CrossRef]
  69. Sharland, P.R.; Casey, D.M.; Davies, R.B.; Simmons, M.D.; Sutcliffe, O.E. Arabian Plate Sequence Stratigraphy—Revisions to SP2. GeoArabia 2004, 9, 199–214. [Google Scholar] [CrossRef]
  70. El Sayed Ahmed Shata, A. The Geochemical Constraints on the Supergene REE-Fluorocarbonate and Uranyl Mineralization in the Karst Bauxites: Insights from Um Bogma Area, Sinai, Egypt. Carbonates Evaporites 2025, 40, 125. [Google Scholar] [CrossRef]
  71. Angerer, T.; Hagemann, S.G.; Walde, D.H.G. Diagenetic and Supergene Ore Forming Processes in the Iron Formation of the Neoproterozoic Jacadigo Group, Corumbá, Brazil. J. S. Am. Earth Sci. 2021, 105, 102902. [Google Scholar] [CrossRef]
  72. Boni, M.; Bouabdellah, M.; Boukirou, W.; Putzolu, F.; Mondillo, N. Vanadium Ore Resources of the African Continent: State of the Art. Ore Geol. Rev. 2023, 157, 105423. [Google Scholar] [CrossRef]
  73. Sharland, P.; Archer, R.; Casey, D.; Davies, R.; Hall, S.H.; Heward, A.; Horbury, A.; Simmons, M. Arabian Plate Sequence Stratigraphy. In GeoArabia; Arabian Plate Sequence Stratigraphy: Manama, Bahrain, 2001; Volume 2. [Google Scholar]
Table 1. UTM coordinates and morphological characteristics of the sixteen paleokarst structures sampled at Allouga, Abu Thor, and Abu Zarab, Um Bogma Formation, southwestern Sinai.
NameEast (X)North (Y)
ATh.1537,8103,211,136
ATh.2538,2583,210,895
ATh.3538,5543,210,322
ATh.4538,4883,210,238
ATh.5538,4283,210,292
ATh.6538,3713,210,397
ATh.7538,1803,210,286
ATh.8538,1933,210,292
Ag.9539,4773,210,294
Ag.10539,5803,210,072
Ag.11539,7403,209,875
Ag.12539,7683,209,874
Ag.13539,7663,209,875
Ag.14539,8103,209,876
Ag.15539,8623,209,851
Ag.16539,1833,210,408
Table 2. Quantitative standardless SEM–EDX data for natroboltwoodite [(H3O)(Na,K)(UO2)SiO4·(H2O)] from the ferruginous siltstone facies of the Abu Zarab paleokarst, including elemental weight percent (wt%), atomic percent (at%), K-ratios, and ZAF matrix correction factors.
Elementwt %At %K-RatioZAF
Na K3.119.770.00531.12940.14941.0013
Al K5.1713.830.01441.1250.2461.0035
Si K15.4339.650.0541.15830.3021.0004
K K2.1740.01691.16880.66431.0021
Ca K0.681.220.00441.19190.54211.0021
Fe K9.1811.860.07321.06370.74891.0011
Pb L4.021.40.03660.87750.99231.0461
U L60.2318.260.50960.8341.01451
Table 3. Quantitative standardless SEM–EDX data for soddyite [(UO2)2SiO4·2(H2O)] from the ferruginous siltstone facies of the Abu Zarab paleokarst, including elemental weight percent (wt%), atomic percent (at%), K-ratios, and ZAF matrix correction factors.
Elementwt %At %K-RatioZAF
Na K2.929.90.00491.1420.14791.0013
Al K4.7213.670.01291.13740.23911.0034
Si K15.743.660.0541.1710.29391.0003
Pb M1.790.680.01220.91860.74381.0001
K K2.214.420.01761.18940.6671.0009
Ca K0.711.390.00451.21230.51991.0005
Fe K2.53.50.01941.07770.72091.0005
U L69.4522.790.60140.85321.01491
Table 4. Quantitative SEM–EDX compositional data for detrital zircon [ZrSiO4] from the ferruginous siltstone facies across the Allouga, Abu Thor, and Abu Zarab paleokarst profiles, confirming Zr-dominant composition with Hf as a characteristic minor substituent.
Elementwt %At %K-RatioZAF
Al K16.6839.380.10781.14210.55011.0291
Si K0.711.180.0041.14440.48951.0005
Fe K0.760.900.00681.03980.86291.0036
Hf L2.721.010.02450.87411.03071
Zr K79.1357.530.75660.95660.99961
Table 5. Quantitative SEM–EDX compositional data for monazite [(Ce,La,Nd,Th)PO4] from the clay mineral facies of the Allouga paleokarst, documenting the light rare-earth element (LREE) and minor uranium (2.49 wt%) inventory.
Elementwt %At %K-RatioZAF
Al K2.556.750.00581.12870.19921.0042
Si K5.5214.050.01611.16220.24891.0058
P K14.7133.930.05061.12420.30481.0038
S K2.435.420.00951.15370.3371.0051
K K0.280.520.0021.15610.60361.0216
Ca K1.32.310.00971.18010.61461.0301
La L14.417.410.11890.91850.8941.0045
Ce L25.0312.760.21210.92720.91081.0035
Pr L3.071.560.02690.93840.93211.0021
Nd L8.534.230.07580.93280.94971.0025
Sm L1.460.690.01270.92520.93471.0021
Gd L2.811.280.2270.9130.88491.0023
Fe K1.311.680.01051.06290.74941.0027
Cu K2.883.240.0251.04260.83001.0035
Th L11.23.450.09280.82281.00761
U L2.490.750.02050.81281.01171
Table 6. Quantitative SEM–EDX data for the first atacamite [Cu2Cl(OH)3] grain from the Abu Zarab paleokarst clay mineral facies, yielding a composition consistent with the standard atacamite formula (Cu > Cl > Si > Al).
Elementwt %At %K-RatioZAF
Al K7.6612.240.01881.04680.23371.0057
Si K13.9121.350.04351.07820.2891.0047
S K3.224.320.01471.0710.42121.0109
Cl K17.721.530.09221.02570.50691.0019
K K1.611.770.01011.03860.5981.0083
Ca K0.370.40.00271.06220.67471.0127
Mn K2.311.810.0220.95470.92591.0796
Fe K4.813.720.04970.97470.94821.1166
Cu K48.4132.850. 44550.94880.96991
Table 7. Quantitative SEM–EDX data for the second atacamite grain from the Abu Zarab paleokarst clay mineral facies, revealing anomalous uranium enrichment at the crystal surface (U = 45.36 wt%; 12.08 at%), with copper reduced to 18.11 wt%.
Elementwt %At %K-RatioZAF
Al K5.1912.180.01321.10290.23031.0040
Si K17.0538.50.05551.13560.28651.0009
Cl K2.153.840.01151.07940.49321.0023
K K2.323.770.01761.12990.66791.0041
Ca K0.71.10.00471.15320.57641.0048
Mn K5.286.090.04041.01570.7431.0142
Fe K3.854.370.03221.0380.78961.0204
Cu L18.1118.070.16261.01860.87211.0104
U L45.3612.080.36690.79641.01561
Table 8. Quantitative standardless SEM–EDX compositional data for jarosite [KFe3(SO4)2(OH)6] from the ferruginous siltstone facies of the Abu Zarab paleokarst (Stage 2 laterite), confirming a composition dominated by Fe > S > K and supporting its role as a mineralogical proxy for the acidic–oxidizing paleoenvironmental transition from Stage 1 to Stage 2.
Elementwt %At %K-RatioZAF
Al K7.8311.810.02381.02740.2941.0075
Si K8.6712.560.03271.05820.35341.0091
S K21.2526.980.11721.05120.52071.0078
K K9.9910.40.06931.01730.67041.0163
Ca K0.560.570.00411.04050.68421.0235
Fe K51.7137.690.46970.95580.95041
Table 9. Descriptive statistics of equivalent uranium (eU) concentrations (ppm) by lithofacies, derived from radiometric profiles of 16 paleokarst structures.
Lithofacies (Laterite Stage)nMin (ppm)Max (ppm)Mean (ppm)Median (ppm)SD (ppm)Range (ppm)
Argillaceous limestone (parent rock)162.13.93.13.20.52.1–3.9
Clay mineral horizon (Stage 1)168.231.519.318.97.18.2–31.5
Ferruginous siltstone (Stage 2)1655.01450.0464.8394.5370.855.0–1450.0
Gibbsite–kaolinite (Stage 3)164.121.311.010.45.14.1–21.3
Kruskal–Wallis H-test (all four lithofacies groups): H (df = 3) ≈ 38.4, p < 0.001.
Table 10. Optimum formation conditions for selected secondary minerals in the Um Bogma paleokarst system (compiled from published experimental and thermodynamic data).
MineralpH RangeEh (V)T Range (°C)Dominant Aqueous SpeciesKey References
Atacamite7.5–9.0>0.25–40CuCl+, Cl[47]
Jarosite2.0–5.0>0.510–70Fe3+, SO42−[48]
Uranophane6.0–8.50.1–0.4<60UO22+, SiO2(aq)[49]
Carnotite7.5–9.5<0.1<50UO2(CO3)34−, HVO42−[41,50]
Soddyite6.0–8.00.1–0.4<25 (arid)UO22+, SiO2(aq)[38]
Table 11. Comparative secondary uranium and associated mineral assemblages from selected localities in Egypt, Jordan, and Saudi Arabia.
Locality (Country)Host RockKey Uranium MineralsAssociated Cu/Mn MineralsReference
Um Bogma, Sinai (Egypt)Carboniferous dolostone paleokarstUranophane, carnotite, torbernite, soddyite, natroboltwooditeAtacamite, paratacamite, jarosite, chalcophaniteThis study
Central Eastern Desert (Egypt)Granitoid/metamorphicUranophane, autunite, β-uranophaneMalachite, chrysocolla[65,66]
Khreim Group, southern JordanCambro-Ordovician sandstoneCarnotite, tyuyamuniteCu-carbonates, Mn-oxides[5,57]
Tabuk Formation, Saudi ArabiaCarboniferous sandstone/carbonateUranophane, carnotite[58,67,68]
Table 12. Morphostratigraphic framework correlating geomorphic and tectonic events, sequence stratigraphic surfaces, dominant weathering regimes, and mineralogical responses from the Late Carboniferous to the Quaternary in southwestern Sinai, Egypt. Sequence stratigraphic nomenclature follows Arabian Platform conventions [27,28]. SB = sequence boundary; TST = transgressive systems tract.
StageTime PeriodGeomorphic/Tectonic EventSeq. Strat. ContextClimate/WeatheringMineralogical Response
1Late Carb.–Early Perm. (~310–290 Ma)Hercynian uplift; karstification; laterite initiation1st-order SB; Hercynian unconformity [27,28]Tropical–subtropical; intense chemical weatheringPaleokarst cavities; clay mineral horizon; atacamite; chalcophanite; primary U trapping in ferruginous siltstone
2Permo-Triassic (~265–245 Ma)Basalt emplacement; geochemical sealing of laterite profileRegional unconformity; basalt cap [9,11]Arid–semi-arid; sealed from meteoric inputStage 2 maturation: uranophane; torbernite; soddyite; natroboltwoodite; jarosite; maximum U fixation
3Mesozoic (Triassic–Cretaceous)Burial under Tethyan marine cover; thermal quiescenceTST; platform subsidence [2,3]Subtropical–tropical (offshore); no surface weatheringChemical stability; no new U mineral phases
4Paleogene (Eocene–Oligocene, ~55–30 Ma)Epirogeny; partial unroofing of basalt cap at structural highsErosional SB; onset of Arabian Plate divergence [10]Subtropical; renewed oxidation at exposed highsLocal oxidation; no new diagnostic U mineral phases
5Oligocene–Miocene (~30–5 Ma)Red Sea/Gulf of Suez rifting; NNW–NW & N–NE fracture reactivation; differential block upliftRifting unconformity; morphotectonic partitioning of 3 localities [1,10]Progressive aridification; semi-aridRe-exposure; fracture-controlled fluid pathways; minor U remobilization; onset Stage 3
6Pliocene–Quaternary (<5 Ma)Desert pavements; wadi incision; hyperarid climatePresent-day geomorphic surface [5,60]Hyperarid; alkaline–reducing near-surfaceStage 3 terminal: carnotite; malachite; paratacamite; ankerite; U remobilized from gibbsite–kaolinite zone
Note: All stage boundaries are defined by independently recognizable tectono-stratigraphic surfaces or geomorphic discontinuities. Geochronological calibration of Stages 1 and 2 against U–Pb zircon dating and (U–Th)/He thermochronology would refine the timing of paleokarst formation and basalt sealing.
Disclaimer/Publisher’s Note: The statements, opinions and data contained in all publications are solely those of the individual author(s) and contributor(s) and not of MDPI and/or the editor(s). MDPI and/or the editor(s) disclaim responsibility for any injury to people or property resulting from any ideas, methods, instructions or products referred to in the content.