Article

Source and Evolution of Ore-Forming Fluids in the Dulanggou Gold Deposit, Danba, Sichuan, China: Constraints from Fluid Inclusions and C–H–O Isotopes


1
College of Earth and Planetary Sciences, Chengdu University of Technology, Chengdu 610059, China
2
China Railway Eryuan Engineering Group Co., Ltd., Chengdu 610031, China
3
The 7th Geological Brigade of Sichuan, Leshan 614000, China
*
Authors to whom correspondence should be addressed.
Minerals 2026, 16(5), 523; https://doi.org/10.3390/min16050523
Submission received: 31 March 2026 / Revised: 10 May 2026 / Accepted: 12 May 2026 / Published: 14 May 2026

Abstract

The Danba–Dadu River gold belt on the western Yangtze Craton margin is a major gold province in China. The Dulanggou gold deposit is a large quartz-vein-type deposit recently discovered in this belt. Ore bodies are fault-controlled veins hosted in high-grade metamorphic rocks of the Devonian Weiguan Formation. Mineralization includes three stages: early (quartz–minor sulfide), main (quartz–abundant sulfide–native gold–Te–Bi minerals), and late (quartz–minor sulfide–calcite). Fluid inclusion studies show the following. Early-stage inclusions are mainly CO2–H2O-type (homogenization temperature 307–388 °C, salinity 0.4–7.1 wt.% NaCl eqv.) with minor NaCl–H2O-type. Main-stage inclusions are dominated by CO2–H2O and NaCl–H2O types, with minor pure CO2 inclusions (homogenization temperature 207–307 °C, salinity 0.2–11.2 wt.% NaCl eqv.). Late-stage inclusions are mainly NaCl–H2O-type (168–223 °C, 4.6–10.1 wt.% NaCl eqv.). Laser Raman analysis detects CH4 in the fluid. The ore-forming fluid is a reducing, medium–low temperature, low-salinity H2O–CO2–NaCl–CH4 system. Thermodynamic calculations of CO2–H2O inclusions yield total densities of 0.94–1.03 g/cm3 and total homogenization pressures of 170–276 MPa for the early stage, and slightly lower densities (0.94–1.01 g/cm3) with pressures of 170–246 MPa for the main stage, indicating a progressive pressure decrease during fluid evolution. Hydrogen and oxygen isotopes (early stage: δD −96.4‰ to −78.9‰, δ18OH2O 6.1‰ to 6.5‰; main stage: δD −104.3‰ to −75.1‰, δ18OH2O 5.3‰ to 7.1‰) indicate that the ore-forming fluid was mainly derived from primary magmatic water. Immiscible CO2–H2O and NaCl–H2O inclusion assemblages in the main stage suggest that fluid immiscibility was the key mechanism for gold precipitation. The Dulanggou deposit resembles classic orogenic gold deposits in host rocks, ore-controlling structures, mineral assemblages, and low-salinity CO2-rich fluids. However, its H–O isotopes and thermodynamic data point to a magmatic water source, distinct from the metamorphic water source of typical orogenic gold deposits. This highlights the diversity of fluid sources in orogenic gold systems along the western Yangtze Craton margin.

1. Introduction

The Danba–Daduhe gold metallogenic belt, located along the western margin of the Yangtze Craton, is an important gold-producing region in southwestern China. The Dulanggou gold deposit in Danba, Sichuan Province, is a typical quartz-vein-type gold deposit newly identified in this belt in recent years. It contains proven gold resources of 48 t with an average grade of 6.71 g/t, and is therefore classified as a large high-grade gold deposit. Previous studies on this deposit have mainly focused on its geological characteristics, sources of ore-forming materials, mineralization age, and prospecting indicators [1,2,3,4,5,6], providing a solid basis for further investigation. However, key issues concerning the sources and evolution of ore-forming fluids and the mineralization mechanism remain controversial. In particular, the relative contributions of metamorphic fluids, anatectic magma, and mantle-derived fluids have not yet been systematically constrained.
The root cause of this controversy lies in the existence of two end-member models for the fluid sources of global orogenic gold deposits: the crustal metamorphic fluid model [7,8] and the subduction zone-mantle-derived fluid model [9]. The former emphasizes that the ore-forming fluids originate from metamorphic devolatilization during crustal thickening, whereas the latter argues that the fluids are mainly derived from subducting slab dehydration or from mantle source regions metasomatized by slab-derived fluids. Therefore, systematic fluid source tracing is a key approach to resolving this type of controversy.
Fluid inclusions are the most direct and best-preserved samples of ore-forming fluids trapped during mineral growth, and they provide important information on the physicochemical properties, sources, and evolution of hydrothermal fluids [10,11,12,13,14,15]. In addition, the C–H–O stable isotope system is an effective tool for tracing the sources and evolution of ore-forming fluids and for constraining mineralization processes [16].
Therefore, based on detailed field geological investigations, this study carried out fluid inclusion petrography, microthermometric analyses, and C–H–O isotope measurements on ores from different mineralization stages of the Dulanggou gold deposit. The main objectives are to systematically constrain the characteristics, evolution, and sources of the ore-forming fluids, and to further discuss the mechanism of gold precipitation in the context of the regional geological setting.

2. Geological Setting

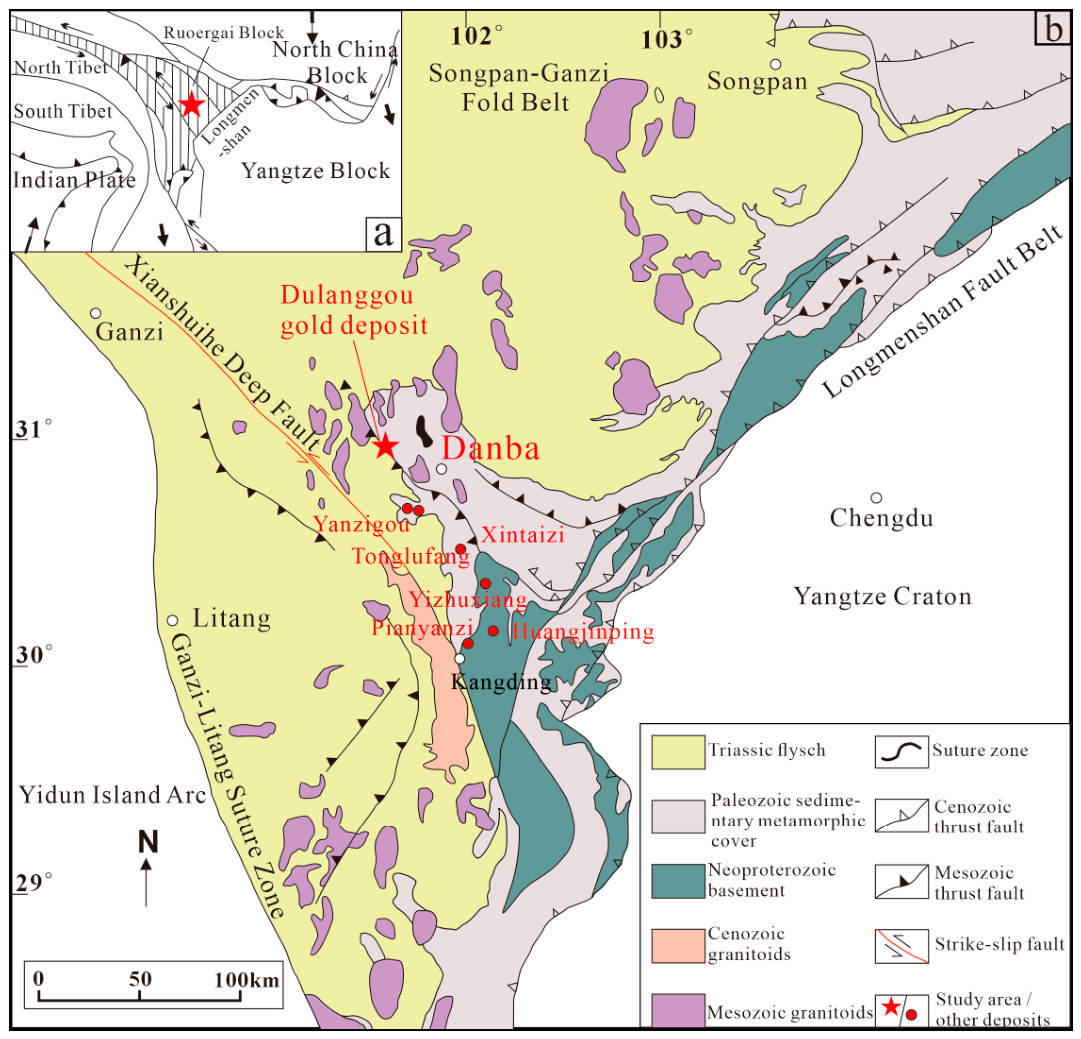
The Dulanggou gold deposit in Danba is tectonically located at the junction of the Yangtze, North China, and Indian plates (Figure 1a) [1,4,17]. It lies on the northwestern side of the Y-shaped tectonic framework formed by the NW-trending Xianshuihe fault zone, the NE-trending Longmenshan fault zone, and the Sichuan–Yunnan tectonic belt along the southern segment of the western margin of the Yangtze Craton (Figure 1b) [1,4,17]. The northern branch of this Y-shaped structure corresponds to the Jintang arcuate structure within the Songpan–Ganzi fold belt.
The regional strata consist of a lower Neoproterozoic crystalline basement overlain by Paleozoic–Cenozoic sedimentary cover sequences. Lithologies of the cover are diverse and include Silurian, Devonian, and Permian marble, quartzite, quartz schist, schist, and gneiss, as well as Triassic sandstone, carbonate rocks, and flysch. Cambrian strata are completely absent in this area, and the Neoproterozoic crystalline basement is in unconformable contact with the overlying strata. Regional tectonic activity was intense and produced a variety of geological structures, including faults, domes, and folds, forming three principal fault sets trending NW–SE, NE–SW, and nearly N–S. Igneous rocks of different ages are exposed in the region. The Jinning–Chengjiang stage is represented mainly by plagiogranite, which commonly occurs as batholiths and is concentrated in the core of the Gezong dome. Regional metamorphism is strong and metamorphic rocks are widespread, with metamorphic grades mainly ranging from greenschist facies to amphibolite facies. In terms of metamorphic origin, rocks in the area mainly experienced regional metamorphism and dynamic metamorphism, whereas thermal contact metamorphism is relatively weak. The products of regional metamorphism are dominated by medium- to high-grade amphibolite-facies rocks that generally underwent recrystallization. The region is rich in mineral resources, including Au, Ag, Cu, Pb–Zn, and Mo deposits.

3. Deposit Setting

3.1. Orebody Characteristics

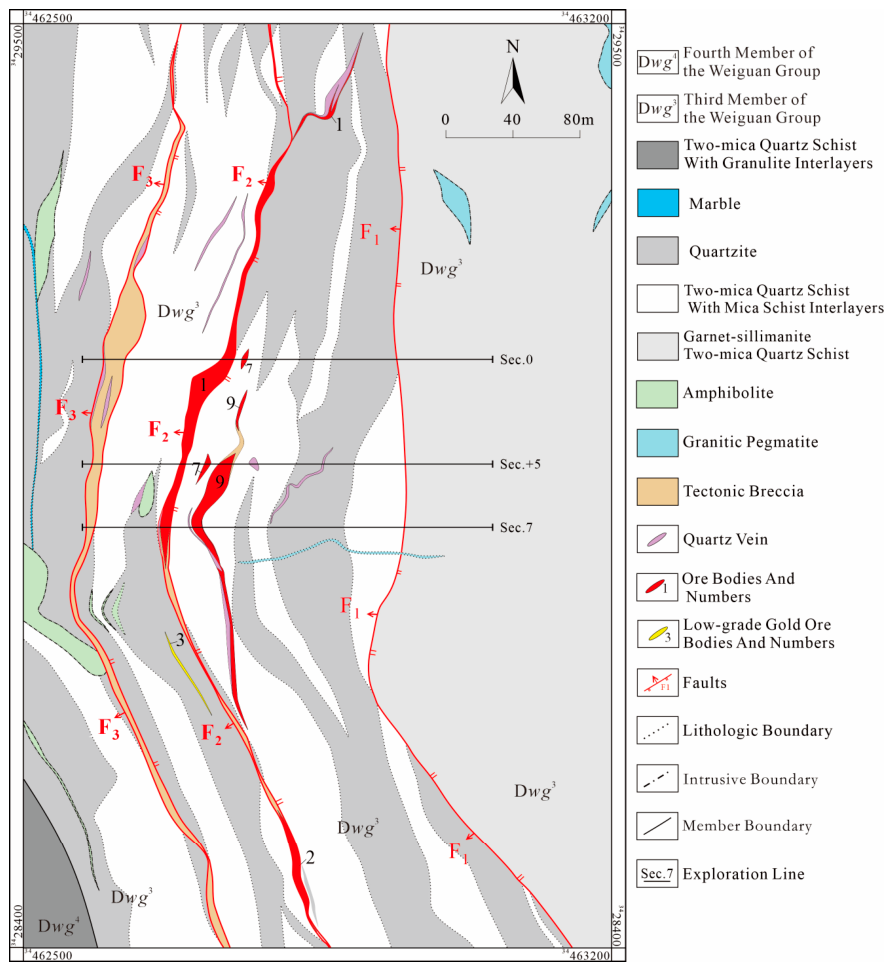
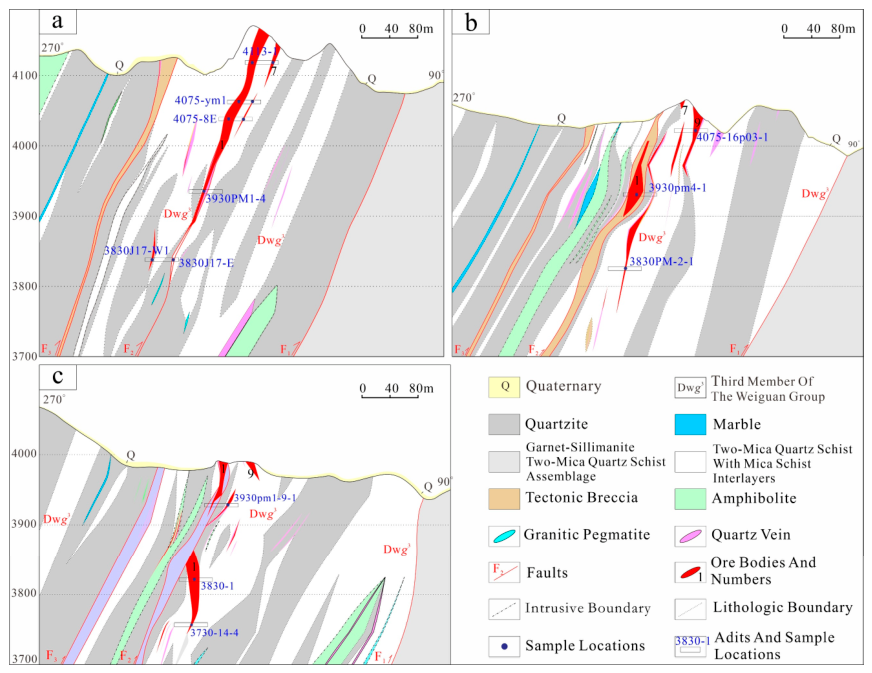
The Dulanggou gold deposit is exposed in the third (Dwg3) and fourth (Dwg4) members of the Devonian Weiguan Group (Figure 2). The third member (Dwg3) is the main exposed stratum in the study area and also the principal ore-hosting horizon in the mining district (Figure 2 and Figure 3). It is composed mainly of garnet–sillimanite two-mica quartz schist intercalated with quartzite, with dolomitic marble locally developed at the top. A total of 29 economic orebodies have been delineated in the mining district, all of which are quartz-vein-type orebodies (Figure 3a and Figure 4a). Four major orebodies are present. The orebodies are strictly controlled by structures. The ore-controlling faults are three secondary faults derived from the Huodi fault, namely F1, F2, and F3 (Figure 2). Fault F1 strikes 325–360°, generally dips west to northwest, and has dip angles of 65–82°. Fault F2 strikes 336–30°, generally dips 221–275°, with dip angles of about 45–90°. Fault F3 is approximately parallel to F2, dipping 232–264° with dip angles of 50–90°. Among them, F2 is the principal ore-controlling fault. The orebodies mostly occur as veins, lenses, and en echelon bodies. They overall dip westward, with dip directions mostly between 230° and 310°, and are steeply dipping, generally at 70–90°.

3.2. Ore Characteristics and Wall–Rock Alteration

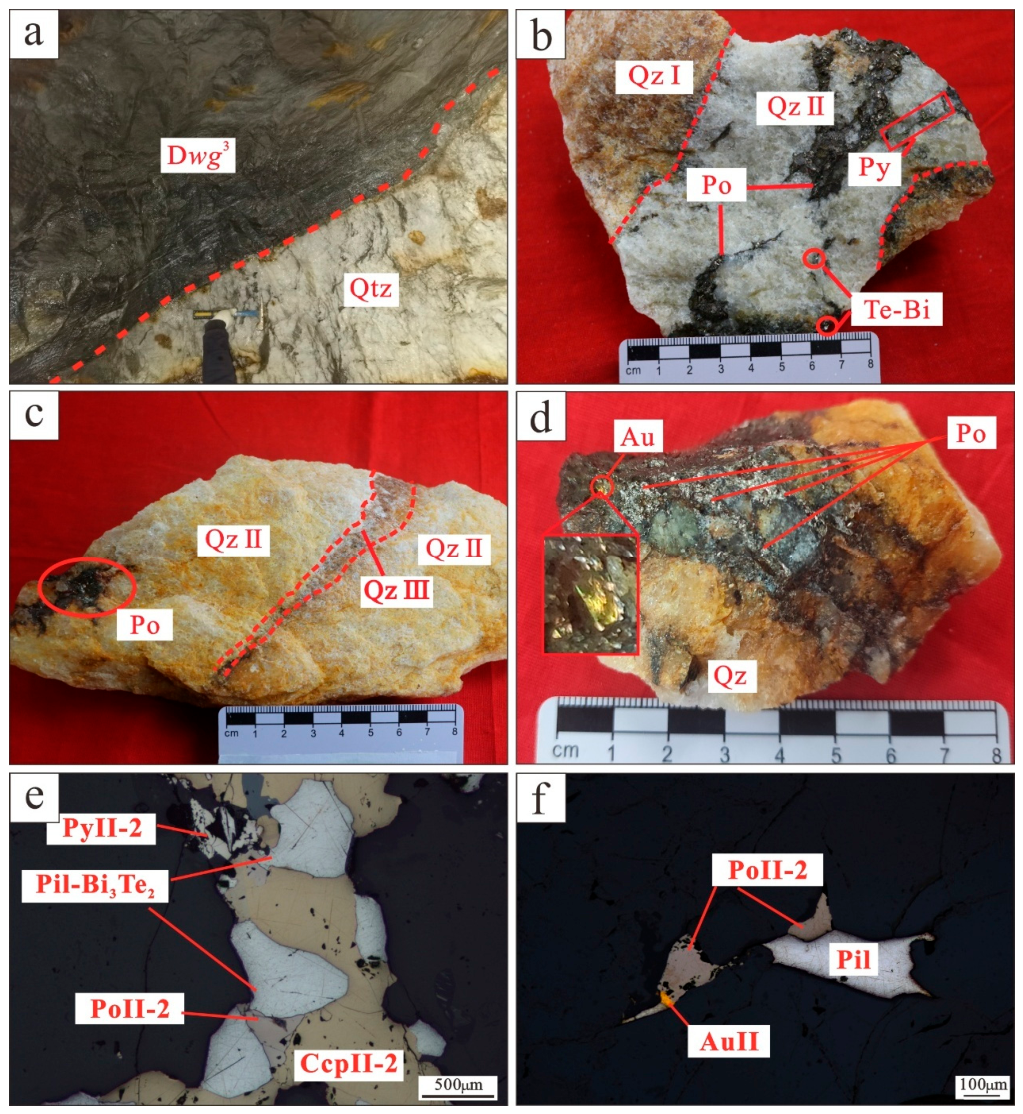
The non-metallic minerals in the ore are dominated by quartz. According to their paragenetic sequence, they are divided into early-stage hydrothermal quartz veins (QtzI) (Figure 4b), main-stage quartz veins (QtzII) (Figure 4b,c), and late-stage hydrothermal quartz veins (QtzIII) (Figure 4c). The metallic minerals in the ore mainly consist of three types: sulfides, gold minerals, and tellurium–bismuth minerals. The sulfides primarily include pyrrhotite, pyrite, and chalcopyrite (Figure 4b–e). Native element minerals are typically represented by native gold (Figure 4d,f) and native bismuth. Tellurium–bismuth minerals are diverse, mainly comprising a series of such minerals, including tetradymite.
In the Dulanggou gold mining district, wall–rock alteration is intense, but alteration zoning is indistinct. The wall rocks mainly develop silicification, biotitization, and hornblendization, overprinted by sericitization, with minor carbonatization and chloritization at the late stage.

3.3. Division of Hydrothermal Mineralization Stages

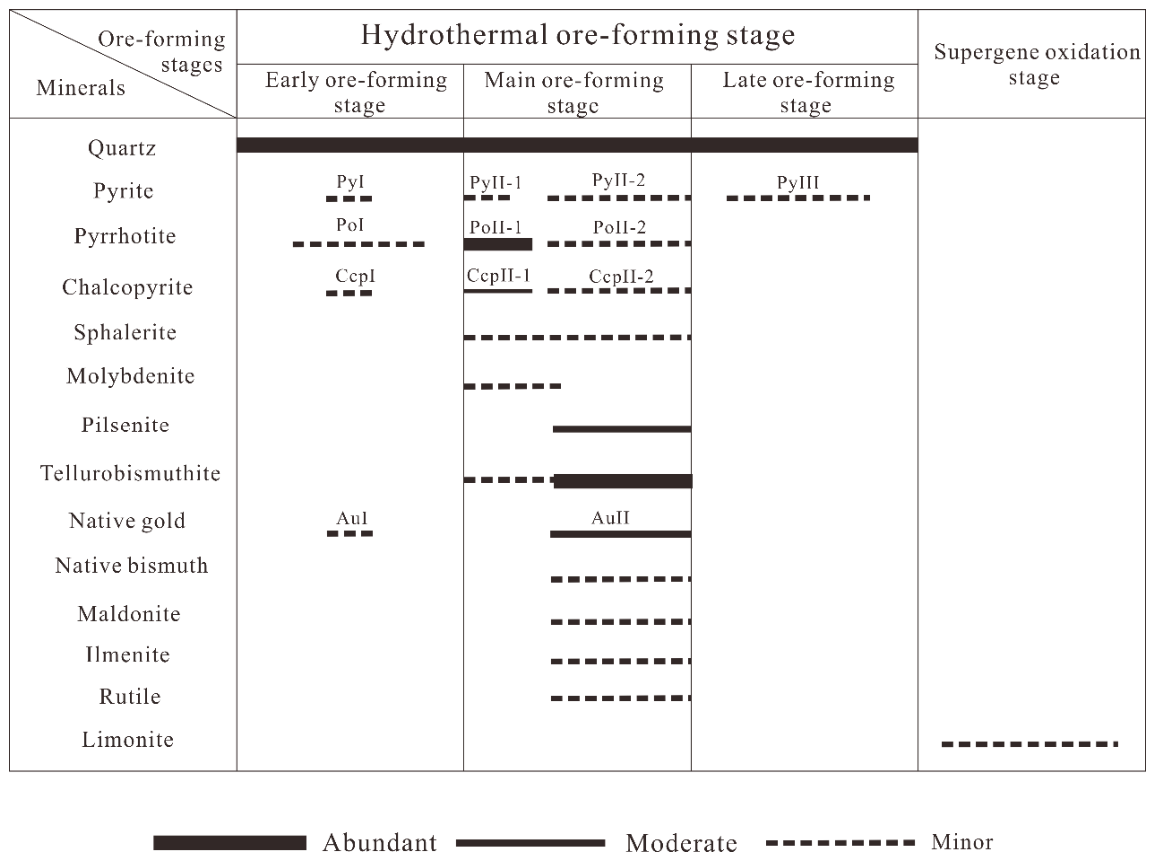
Based on the field occurrence of quartz veins, hand specimen textural and structural characteristics, and detailed microscopic mineralogical studies, the mineralization stages of the Danba Dulanggou gold deposit are divided into the hydrothermal mineralization stage and the supergene oxidation stage. According to the paragenetic relationships among minerals, the hydrothermal mineralization stage is further subdivided into three substages: the early-stage quartz–minor sulfide substage (I), the main-stage quartz–abundant sulfide–native gold–tellurium–bismuth mineral substage (II), and the late-stage quartz–minor sulfide–calcite substage (III).
Early hydrothermal ore stage (quartz + minor sulfides): this stage is characterized mainly by quartz together with minor pyrite, pyrrhotite, and trace chalcopyrite, whereas Te–Bi minerals are absent. Pyrite grains are generally coarse, mostly larger than 100 μm, and relatively euhedral. Early-stage pyrite can be observed to have been replaced by main-stage pyrrhotite, forming replacement-corrosion textures.
Main hydrothermal ore stage: this stage is characterized by abundant sulfides together with visible native gold and abundant Te–Bi minerals. Te–Bi minerals are diverse and include mainly pilsenite and joséite. The sulfides are represented mainly by pyrrhotite, chalcopyrite, and pyrite. The main stage can be further divided into early and late substages (Figure 5).
Late hydrothermal ore stage: this stage consists mainly of quartz with minor pyrite and calcite.
The supergene stage is manifested mainly by oxidation of pyrrhotite, pyrite, and other Fe-bearing minerals to limonite.

4. Sampling and Analytical Methods

Samples were systematically collected from different elevations and exploration lines in this study. Systematic sampling was carried out at different elevations along the No. 1, No. 7, and No. 9 main orebodies of the Dulanggou gold deposit, mainly along exploration line 0 (3830, 3930, 4075, 4113, and 4115 m), exploration line +5 (3830, 3930, and 4075 m), and exploration line 7 (3730, 3830, and 3930 m) (Figure 3). More than 300 quartz inclusion wafers were prepared for this work in order to conduct systematic research on ore-forming fluids. These samples were used for detailed inclusion petrography, followed by fluid inclusion microthermometry (heating–freezing stage) and laser Raman spectroscopy. In addition, single-mineral quartz separates were handpicked from representative ores for Carbon–Hydrogen–Oxygen isotope analysis.
Preliminary fluid inclusion petrography and microthermometric measurements were completed at Chengdu University of Technology using a Nikon 100POL polarizing microscope (Nikon Corporation, Tokyo, Japan) and a Linkam THM SG600 heating–freezing stage (Linkam Scientific, Redhill, UK). The microscope was equipped with objective lenses of 2×, 5×, 10×, 20×, 50×, and 100×. The heating–freezing stage uses a platinum resistance thermometer as the temperature sensor, with a working range of −196 to 600 °C, a display precision of 0.1 °C, and a temperature stability better than ±0.1 °C. During homogenization and freezing measurements, the heating/cooling rate was generally controlled between 0.2 and 5.0 °C/min; when approaching phase-transition points, the rate was reduced to 0.2 °C/min. To avoid mechanical deformation of inclusions during freezing, the experiments followed the sequence of measuring homogenization temperature (Th) first and ice-melting temperature (Tm-ice) afterward.
Laser Raman analyses of fluid inclusions were carried out at the Institute of Geochemistry, Chinese Academy of Sciences. A LabRAM HR Evolution micro-confocal laser Raman spectrometer (Horiba, Glasgow, UK) was used, with an excitation wavelength of 532 nm and a spectral resolution of ±0.65 cm−1.
H–O isotope analyses were completed at Beijing Zhongke Kuangyan Testing Technology Co., Ltd. Quartz samples for analysis were crushed and sieved to a 40–60 mesh fraction, and high-purity single-mineral grains (>99.9%) were handpicked under a binocular stereomicroscope. For hydrogen isotope analysis of fluid inclusions, 10–20 mg of single-mineral quartz of 40–60 mesh grain size was weighed into tin sample cups and dried at 90 °C for 12 h in a constant-temperature oven to completely remove surface-adsorbed water. After drying, the tin-wrapped samples were introduced through an autosampler into a high-temperature pyrolysis furnace (Flash EA, Thermo Fisher Scientific, Waltham, MA, USA). At 1420 °C, water released from the inclusions reacted with glassy carbon filling material in the reactor to generate H2 and CO. These gases were carried by high-purity helium (99.999%; 5N), separated by gas chromatography, and introduced into an isotope ratio mass spectrometer (253 Plus, Thermo Fisher Scientific, Waltham, MA, USA) for determination of the δD value of H2. International polyethylene standard IAEA-CH-7 (δD_V-SMOW = −100.3‰) was used for quality control, and analytical precision was better than ±0.1‰. Detailed analytical procedures follow Gong et al. [18].
For oxygen isotope analysis of quartz, single-mineral quartz samples were ground to 200 mesh. About 6 mg of pure quartz or an equivalent amount of silicate mineral containing the same oxygen content was dried at 105 °C for 12 h. Oxygen was extracted using the conventional bromine pentafluoride (BrF5) method [19]: samples were reacted with BrF5 under vacuum at 580 °C to generate O2, which was collected in 5 Å molecular sieve sample tubes and measured relative to the V-SMOW standard. Isotopic measurements were conducted on a 253 Plus gas isotope ratio mass spectrometer, and data reduction followed the procedures of Clayton et al. [20]. The δ18O_H2O value of fluid inclusions in quartz was calculated according to the classical isotope fractionation equation, using the δ18O_quartz value of quartz and the corresponding homogenization temperature data (Equation (1)) [20,21].
1000lnαquartz-water = 3.38 × 10⁶/T2 − 3.40
In the calculation, T is the homogenization temperature of quartz-hosted fluid inclusions.
The carbon isotopic composition of CO2 in mineral fluid inclusions is an important tool for constraining the sources and evolution of ore-forming fluids. In this study, the δ13C and δ18O values of CO2 entrapped in fluid inclusions hosted by single quartz separates were determined. All analyses were carried out by Beijing Zhongke Kuangyan Testing Technology Co., Ltd. using a MAT 253 stable isotope ratio mass spectrometer.
For carbon isotope analysis of fluid inclusions, approximately 0.1 g of single-mineral quartz separates with a grain size of 40–60 mesh were selected and dried in a constant-temperature oven at 105 °C for more than 4 h to remove volatile components adsorbed on the grain surfaces. The dried samples were then loaded into the reaction tube of an online continuous-flow extraction system. Prior to analysis, the elemental analyzer (Flash EA) and extraction lines were thoroughly purged with high-purity helium (He, 99.999%) to minimize the background CO2 signal of the system. The samples were then decrepitated online at 550 °C for 5 min to ensure complete release of CO2 from the fluid inclusions. The liberated gases were passed through a water trap filled with magnesium perchlorate [Mg(ClO4)2] to remove moisture, after which CO2 was collected in a trapping tube packed with a Ni catalyst, whereas CH4 and other gas components were flushed out of the system. When the temperature of the Flash EA reactor reached 960 °C and the baseline CO2 signal had stabilized at below 10 mV, the collected CO2 was introduced into the mass spectrometer for isotopic measurement. The analyses were calibrated against the national reference material GBW04417 (δ13CV-PDB = −6.06‰) to ensure analytical accuracy and inter-laboratory comparability.

5. Result

5.1. Petrographic Characteristics of Fluid Inclusions

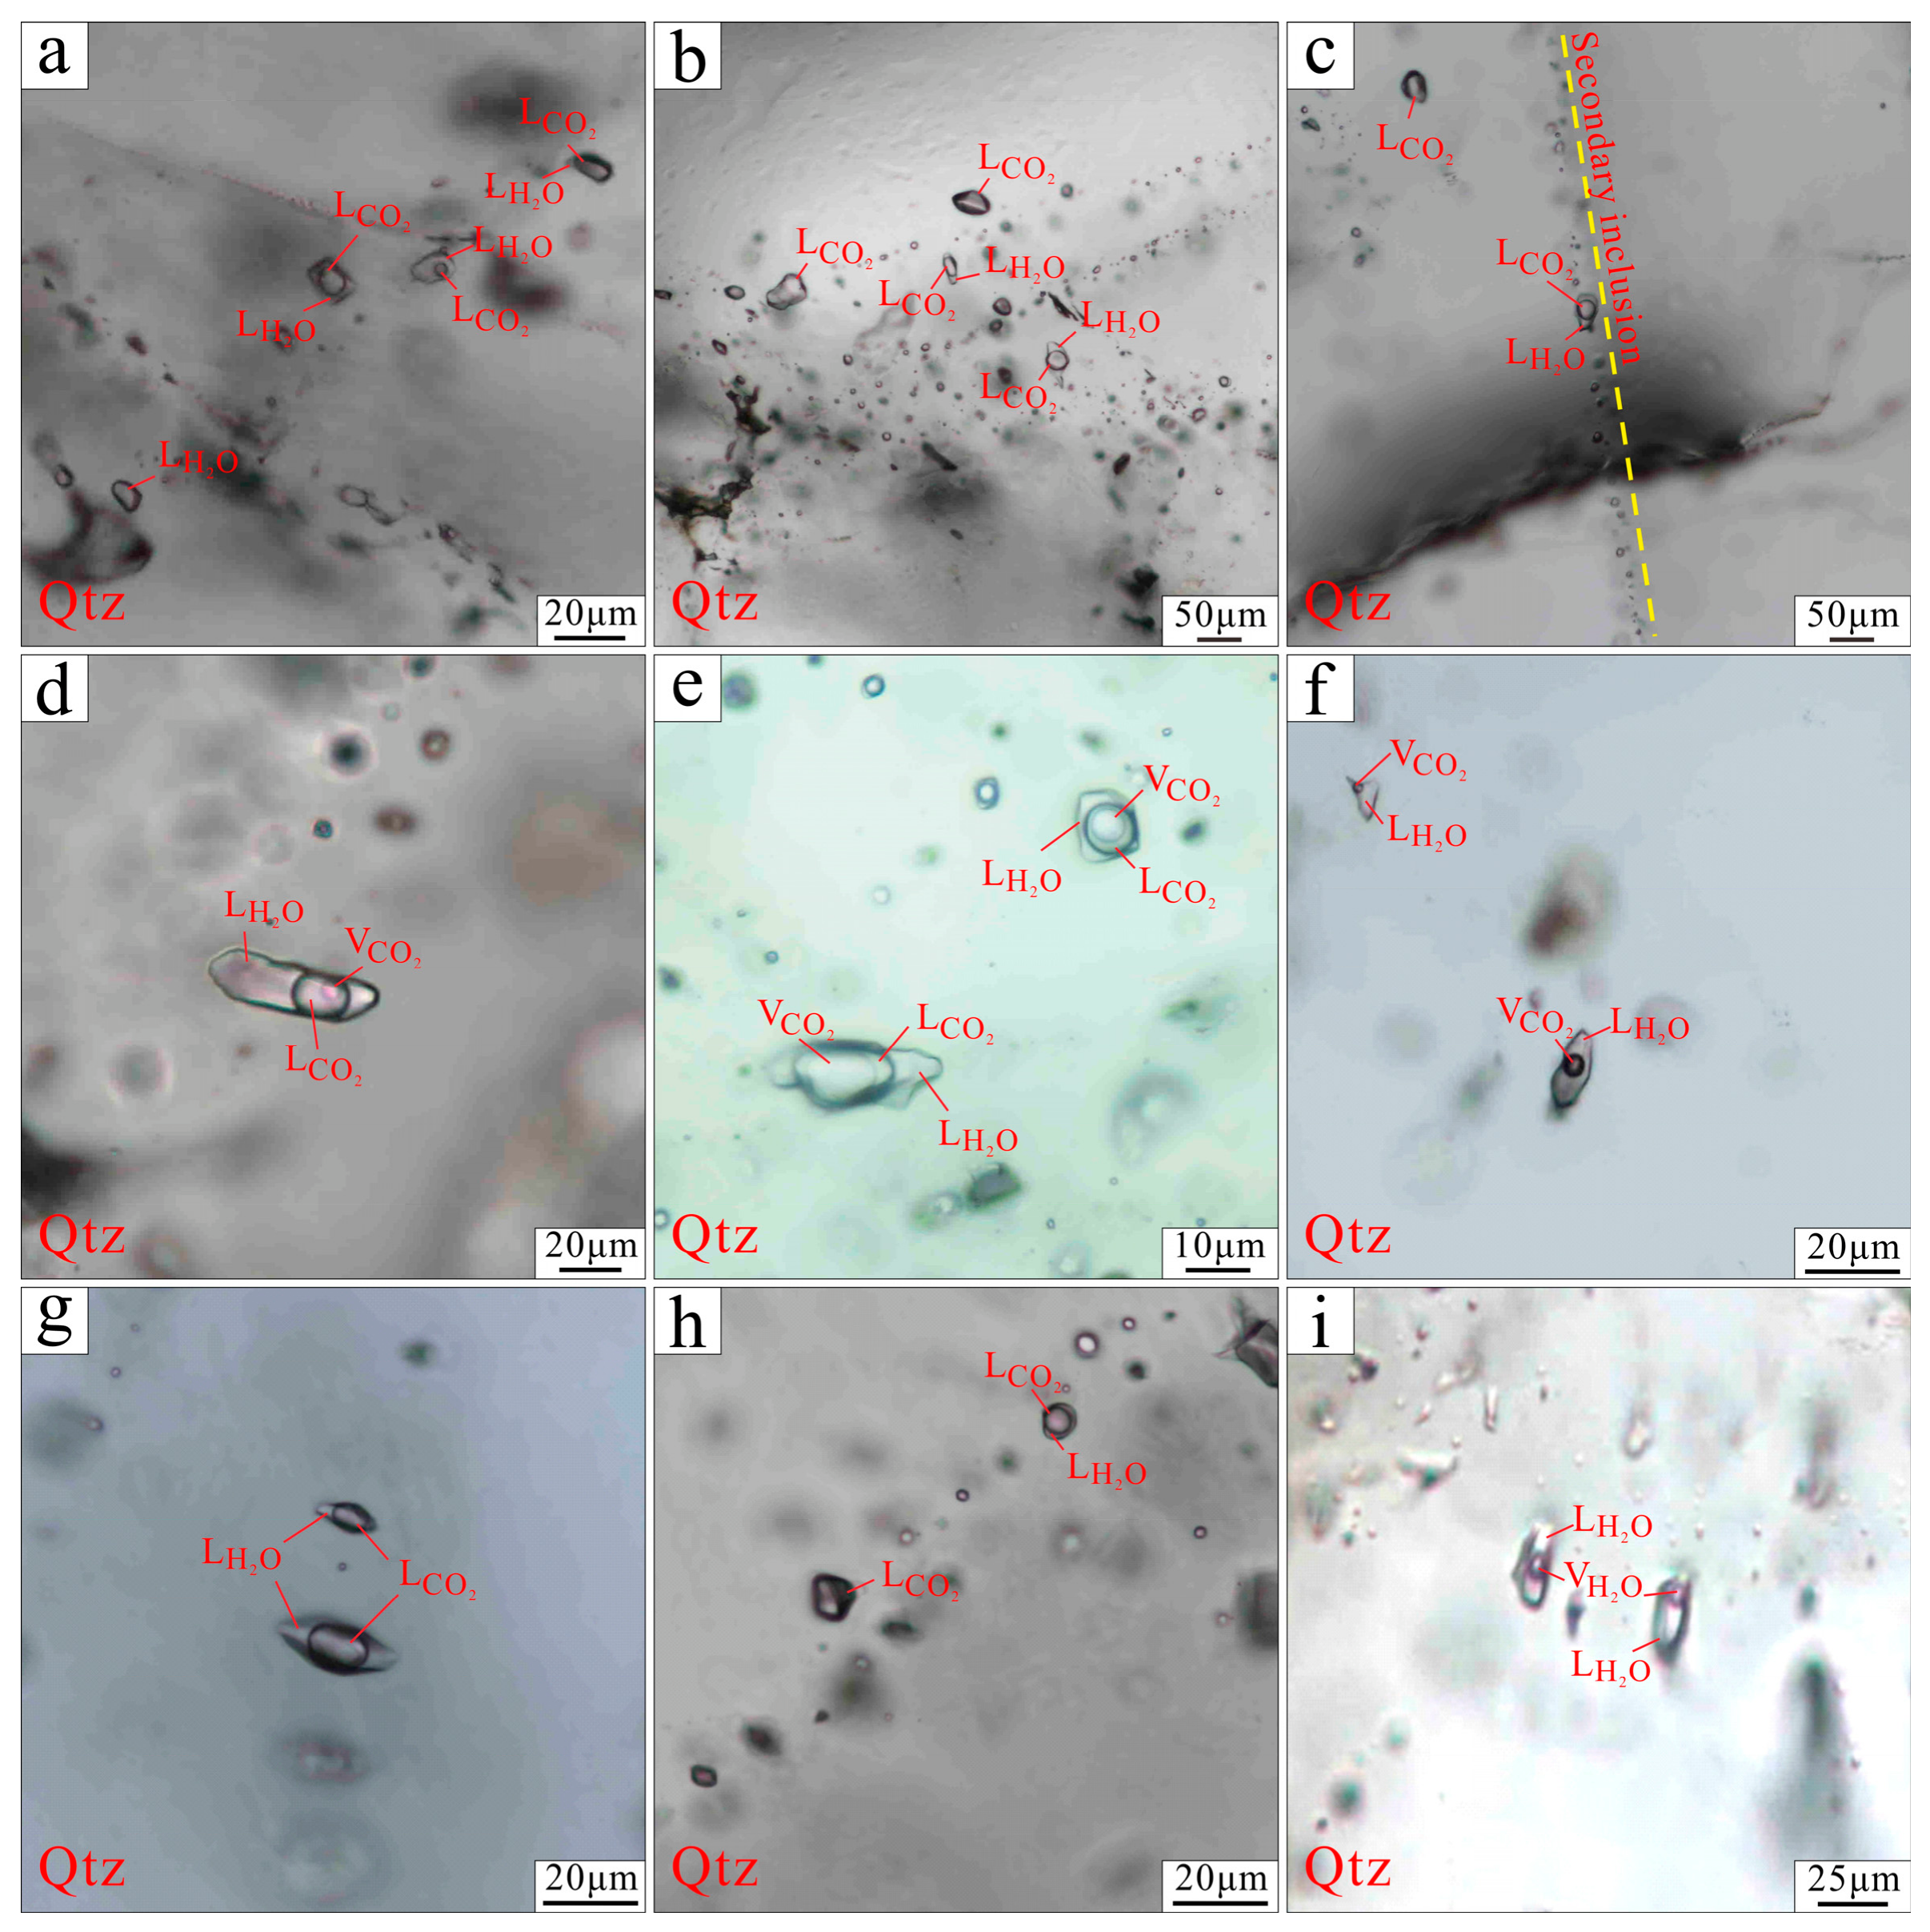
This thesis presents a systematic fluid inclusion microthermometric study of quartz from the three mineralization stages of the Dulanggou gold deposit: the early-stage quartz–minor sulfide substage (I), the main-stage quartz–abundant sulfide–native gold–tellurium–bismuth mineral substage (II), and the late-stage quartz–calcite substage (III). According to the criteria for distinguishing primary and secondary inclusions proposed by Van den Kerkhof and Hein [22], most inclusions occur as isolated or densely clustered forms (Figure 6a,b,d,e,i), indicating that they are primary inclusions. Inclusions distributed along healed fractures are secondary (Figure 6c). Following the room-temperature phase classification scheme of Roedder [10], the observed primary inclusions are divided into the following two assemblage types:
CO2–H2O inclusions (Type C): This type is the most dominant and widely distributed fluid inclusion type in the Dulanggou gold deposit, accounting for the vast majority in all stages. The inclusions are mainly elliptical, negative crystalline, or irregular in shape, with long-axis lengths ranging from 5 to 25 μm, and the volume fraction of the CO2 phase varies between 30% and 70%. Based on the phase state of CO2, Type C inclusions are further divided into three subtypes: (1) C-1 three-phase inclusions: LH2O + LCO2 + VCO2, showing a typical “double-eyelid” appearance (Figure 6d,e); (2) C-2 two-phase inclusions: LH2O + VCO2, in which the volumetric proportion of the CO2 phase is 10%–35% (Figure 6f); when cooled to around −10 °C, liquid CO2 appears around the gaseous CO2; and (3) C-3 two-phase inclusions: LH2O + LCO2, in which the CO2 phase proportion is relatively high, mostly 40%–70% (Figure 6g); during cooling (around −10 °C), gaseous CO2 appears within the liquid CO2.
CO2 inclusions (PC-type): these are nearly pure CO2 inclusions (Figure 6b,c,h), mainly elliptical, and secondarily negative-crystal or irregular in shape, with sizes not exceeding 15 μm. At room temperature, they commonly occur as pure liquid CO2 and develop a gaseous CO2 phase during cooling (−10 °C or lower). PC-type inclusions may occur alone or coexist with C-type inclusions within the same field of view (Figure 6h).
NaCl–H2O inclusions (W-type): these are saline aqueous inclusions, mostly elongate or elliptical in shape, with long axes ranging from 3 to 12 μm and gas-phase H2O proportions generally not exceeding 25%. W-type inclusions may occur alone (Figure 6i) or coexist with C-type inclusions in the same field of view (Figure 7c).
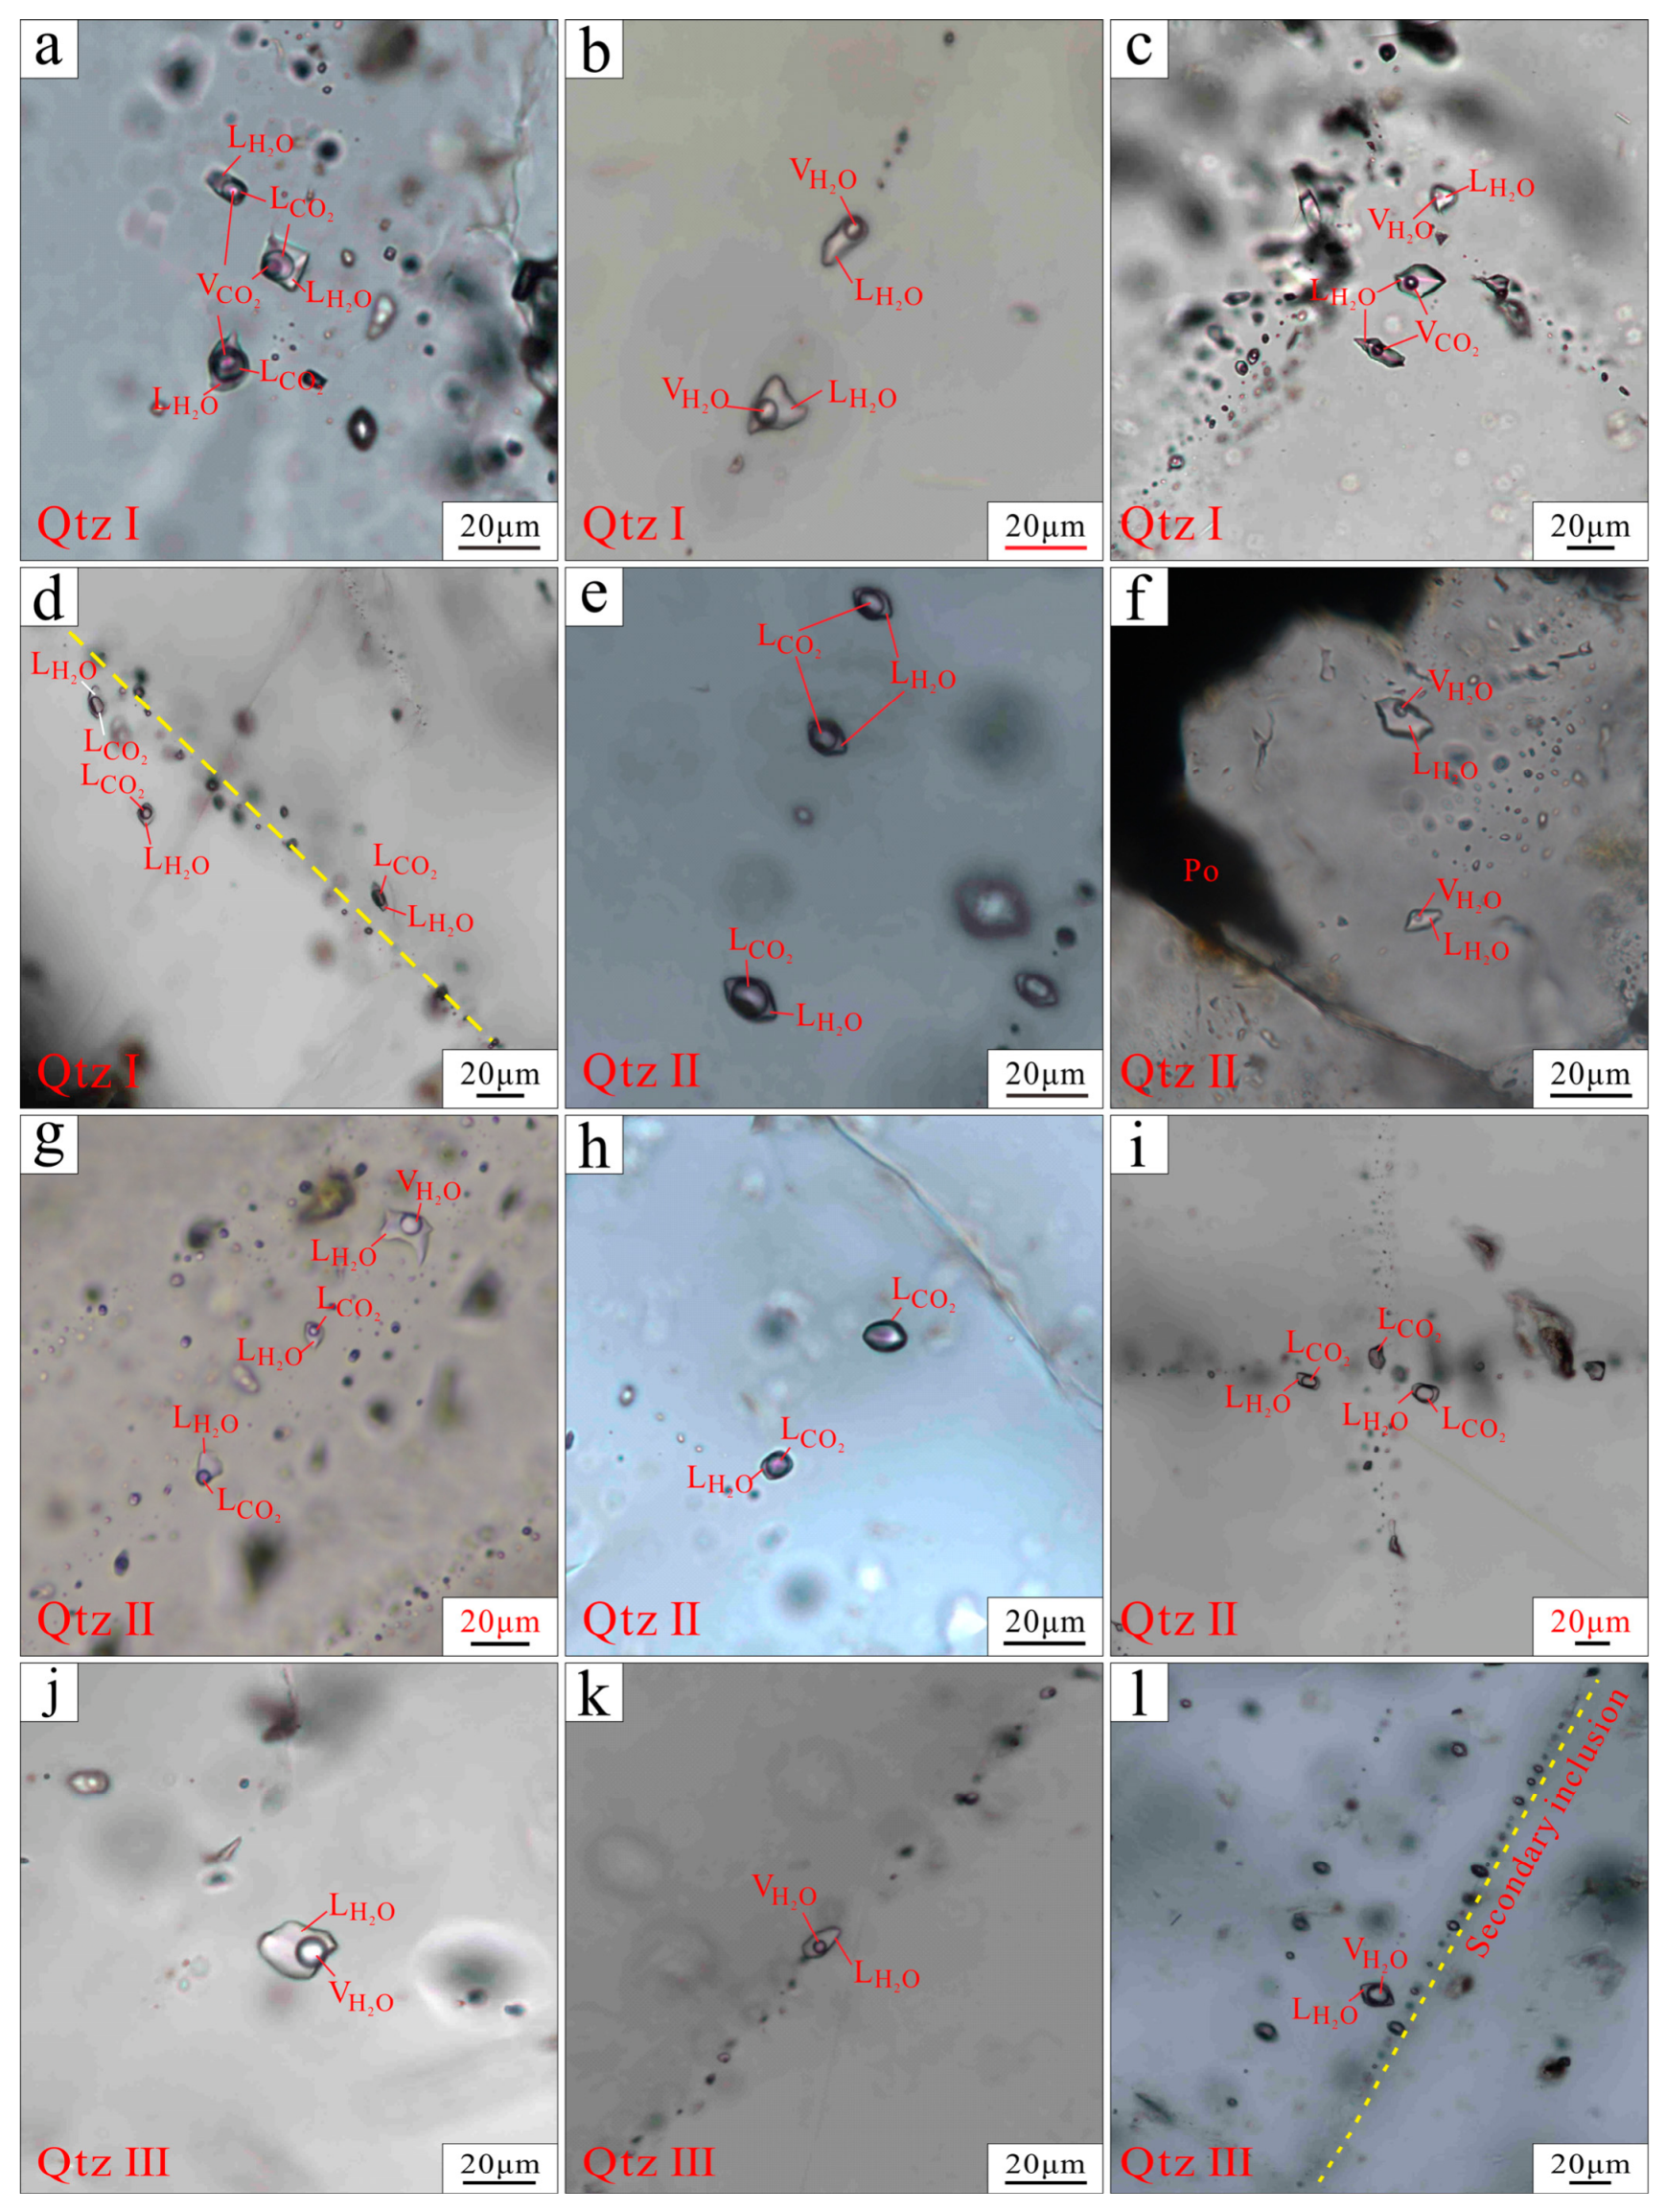
In quartz grains of the early ore stage, the dominant inclusion type is C-type (CO2–H2O), followed by W-type (NaCl–H2O). Most CO2-bearing inclusions occur as tightly associated small clusters or isolated inclusions and are negative-crystal or elliptical in shape, with sizes of 10–25 μm (Figure 7a). A small number of saline aqueous inclusions are typically elliptical, occur in clusters, and are 10–20 μm in size (Figure 7b). In the same microscopic field of view, C-type (CO2–H2O) inclusions coexist with W-type (NaCl–H2O) inclusions (Figure 7c). According to the definition of fluid inclusion assemblages (FIA) proposed by Goldstein and Reynolds [23], these two types are interpreted as contemporaneously trapped products formed during fluid immiscibility in the evolution of the same ore-forming fluid, thus constituting a typical immiscible fluid inclusion assemblage (Figure 7c).
In quartz grains of the main ore stage, C-type (CO2–H2O), PC-type (CO2), and W-type (NaCl–H2O) inclusions are all present. C-type and W-type inclusions are the principal types. They are commonly negative-crystal to elliptical in shape, 10–20 μm in size, and occur as tightly associated small clusters within the same field of view (Figure 7e–g). PC-type inclusions are elliptical to subrounded, 5–10 μm in size, and occur either isolated or in clusters, commonly together with C-type inclusions in the same field of view (Figure 7h). The coexistence of these three inclusion types within a single field of view indicates that they were trapped contemporaneously from the same fluid and together define an immiscible fluid inclusion assemblage [23].
In the late ore stage, W-type inclusions dominate, and C-type and PC-type inclusions are absent. Most W-type inclusions are elliptical and 8–15 μm in size. They occur either linearly along healed fractures in quartz grains or as small clusters within grains (Figure 7j–l). The observed inclusions show highly uniform vapor/liquid ratios. According to the criteria for recognizing fluid inclusion assemblages proposed by Goldstein and Reynolds [23], this feature indicates that these inclusions were trapped simultaneously from the same pulse of ore-forming fluid.

5.2. Characteristics of Homogenization Temperatures and Salinities of Fluid Inclusions

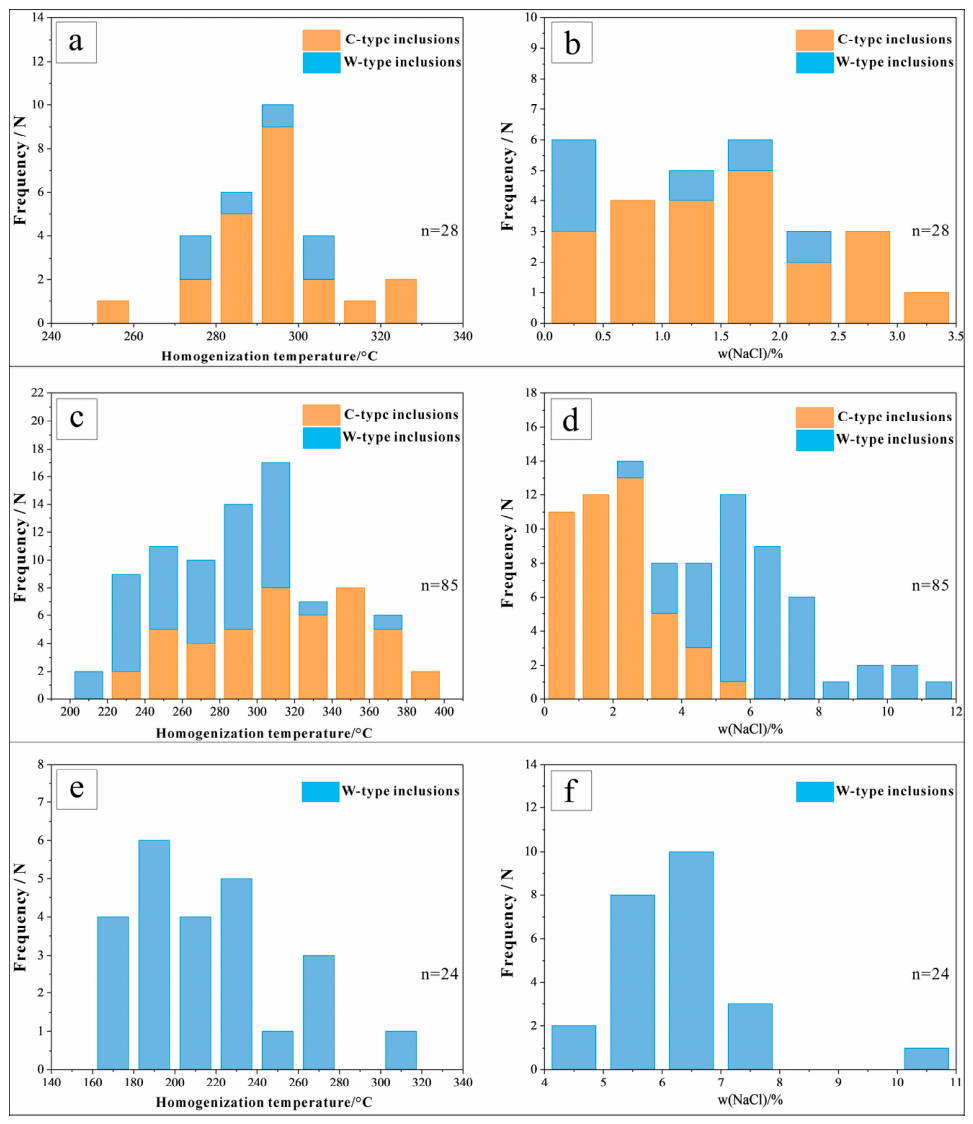
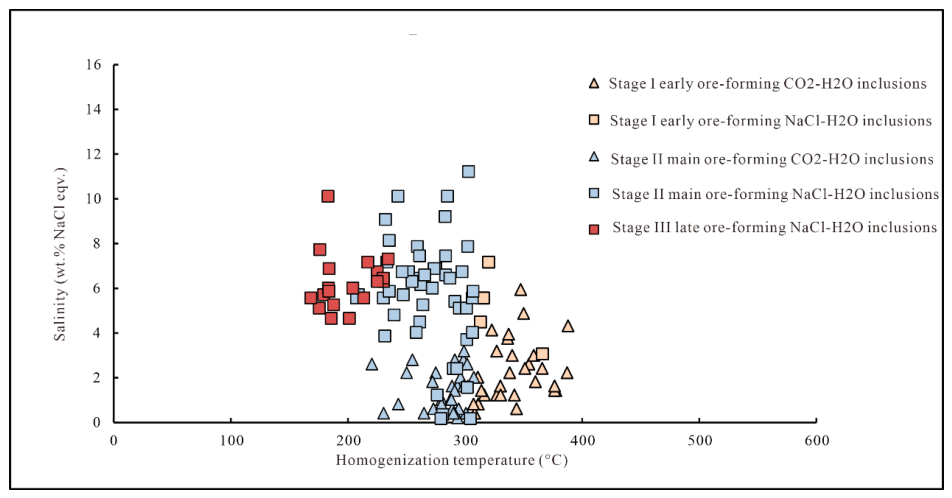
Based on petrographic observations, representative fluid inclusions in quartz from the early, main, and late ore stages of the Dulanggou gold deposit were selected for microthermometric analysis. The analytical results are listed in Table 1. The distributions of homogenization temperatures and salinities for inclusions from each stage are shown in the histograms (Figure 8) and scatter plot (Figure 9).
Studies of fluid inclusions from different mineralization stages of the Dulanggou gold deposit, combined with salinity calculations using the corresponding empirical equations, show the following characteristics of homogenization temperature and salinity in the ore-forming fluids:
(1) Early ore stage (Stage I)
Both C-type (CO2–H2O) and W-type (NaCl–H2O) inclusions occur in this stage. The partial homogenization temperatures of C-type inclusions range from 11.8 to 27.3 °C, whereas complete homogenization temperatures range from 307 to 388 °C, with a mean of 341 °C (Figure 8a). The initial melting temperatures of solid CO2 are −58.9 to −56.8 °C, and clathrate melting temperatures range from 6.9 to 9.8 °C, with a mean of 8.9 °C. Salinity of this inclusion type must be calculated from clathrate dissociation temperatures using the following empirical equation (Equation (2)) [7]:
WNaCl = 15.52022 − 1.02342 × T − 0.05286 × T2
where WNaCl is the mass fraction of NaCl in the aqueous solution, and T is the clathrate melting temperature in CO2–H2O inclusions. This equation is applicable only when −9.6 °C ≤ T ≤ 10 °C. Calculated salinities of the Stage I C-type inclusions range from 0.4 to 5.9 wt.% NaCl eqv. (Figure 8b).
The coexisting W-type inclusions have homogenization temperatures mainly ranging from 313 to 366 °C, with a mean of 326 °C (Figure 8a). Their salinities were calculated from ice-melting temperatures using the following equation (Equation (3)):
S = 0.00 + 1.78 T m 0.0442 T m 2 + 0.000557 T m 3 for   NaCl   solutions   with   salinities   of   0 23.3   wt . %
where S is salinity (wt.% NaCl eqv.), and Tm is the ice-melting temperature (°C).
This equation is applicable to NaCl solutions with salinities of 0–23.3 wt.%. The measured ice-melting temperatures of W-type inclusions in this stage are −4.5 to −3.2 °C, corresponding to calculated salinities of 3.1–7.2 wt.% NaCl eqv. (Figure 8b). The overall mean homogenization temperature of early-stage inclusions (C-type + W-type) is 341 °C.
(2) Main ore stage (Stage II)
This stage also contains C-type (CO2–H2O) and W-type (NaCl–H2O) inclusions. The partial homogenization temperatures of C-type inclusions are 13.1–26.7 °C, and complete homogenization temperatures range from 220 to 307 °C, with a mean of 279 °C (Figure 8c). Initial melting temperatures of solid CO2 are −58.6 to −56.7 °C, and clathrate melting temperatures range from 8.4 to 9.9 °C. Using Equation (1), calculated salinities range from 0.2 to 3.2 wt.% NaCl eqv., with a peak value of 1.5 wt.% NaCl eqv. (Figure 8d).
The coexisting liquid-rich W-type inclusions have homogenization temperatures of 207–306 °C, with a mean of 269 °C (Figure 8c). Their salinities were calculated using Equation (2) based on ice-melting temperatures. Measured ice-melting temperatures range from −7.6 to −0.1 °C, corresponding to salinities of 0.2–11.2 wt.% NaCl eqv. (Figure 8d). The overall mean homogenization temperature of inclusions from the main stage is 274 °C.
(3) Late ore stage (Stage III)
This stage is dominated by W-type inclusions (NaCl–H2O), whose homogenization temperatures range from 168 to 223 °C, with a mean of 199 °C (Figure 8e). Measured ice-melting temperatures range from −6.7 to −2.8 °C, and calculated fluid salinities based on Equation (2) range from 4.6 to 10.1 wt.% NaCl eqv. (Figure 8f).

5.3. Inclusion Density and Pressure

In the Dulanggou gold deposit, the dominant fluid inclusion type developed in different mineralization stages is the CO2–H2O type, and some CO2–H2O inclusions coexist with NaCl–H2O inclusions. The specific steps for calculating the homogenization pressure of the CO2–H2O inclusions are as follows:
(1) Calculate the CO2 phase density at partial homogenization of the CO2–H2O inclusions [24,25]:
Density of liquid CO2 (Equation (4)):
d C O 2 ( l i q u i d ) = 0.4683 + 0.001442 × ( 31.35 t c ) + 0.1318 × ( 31.35 t c ) 1 3
Density of vapor CO2 (Equation (5)):
d C O 2 ( v a p o r ) = 0.4683 + 0.001442 × ( 31.35 t c ) 0.1318 × ( 31.35 t c ) 1 3
where dCO2(liquid) is the density (g/cm3) of liquid CO2 when vapor CO2 gradually homogenizes into liquid CO2 upon partial homogenization of the CO2–H2O inclusions; dCO2(vapor) is the density (g/cm3) of vapor CO2 when liquid CO2 gradually homogenizes into vapor CO2 upon partial homogenization; and tc is the partial homogenization temperature (°C) of the CO2 phase upon partial homogenization of the CO2–H2O inclusions.
(2) Calculate the density of liquid water upon partial homogenization of the CO2–H2O inclusions [25,26] (Equations (6) and (7)):
m = ( 1000 × w ) / [ 58.4428 × ( 100 w ) ]
d a q = 0.999839 × ( 1000 + 58.4428 × m ) ÷ [ 1000 + 0.999839 × ( 12.43 × m + 3.07 × m 1.5 0.02 × m 2 ) ] + 5.2777 × 10 5 × t c 1.0113 × 10 5 × t c 2 + 9.3537 × 10 8 × t c 3
where m is the molality of NaCl in the liquid water upon partial homogenization (mol/kg H2O); w is the salinity of the liquid water (wt.% NaCl equiv); and daq is the density of the liquid water upon partial homogenization (g/cm3).
(3) Calculate the mole fraction in the liquid water upon partial homogenization of the CO2–H2O inclusions [27] (Equations (8)–(10)):
S C O 2 ( a q ) = 7.2754 0.056634 × t c + 7.877 × 1 0 4 × t c 2 2.037 × 1 0 5 × t c 3
w C O 2 ( a q ) = S C O 2 ( a q ) ÷ ( S C O 2 ( a q ) + 100 ) × 100
X C O 2 ( a q ) = 18.0152 × W C O 2 ( a q ) ÷ [ 18.0152 × W C O 2 ( a q ) + 44.0098 × ( 100 W C O 2 ( a q ) ) ]
where S C O 2 ( a q ) is the solubility of CO2 in the liquid water upon partial homogenization (g); w C O 2 ( a q ) is the mass fraction of CO2 in the liquid water upon partial homogenization (g/100 g); and X C O 2 ( a q ) is the mole fraction of CO2 in the liquid water upon partial homogenization.
(4) Calculate the mole fraction of CO2 (XCO2) and the mole fraction of NaCl (XNaCl) in the CO2–H2O inclusions, as well as the molar volume of the inclusions (V) [28] (Equation (11)–(19)):
X C O 2 = m C O 2 m C O 2 + m N a C l + m H 2 O
X N a C l = m N a C l m C O 2 + m N a C l + m H 2 O
V = 1 m C O 2 + m N a C l + m H 2 O
m C O 2 = m C O 2 ( C O 2 ) + m C O 2 ( a q )
m C O 2 ( C O 2 ) = d C O 2 × F C O 2 ÷ 44.0098
m C O 2 ( a q ) = d a q × ( 1 F C O 2 ) ÷ 44.0098 × ( 1 w ) ÷ 18.0152 × K × X C O 2 ( a q ) × 44.0098 ÷ [ 1 + ( 1 w ) ÷ 18.0152 × K × X C O 2 ( a q ) × 44.0098 ]
m H 2 O = d a q × ( 1 F C O 2 ) ÷ 18.0152 × ( 1 w ) ÷ [ 1 + ( 1 w ) ÷ 18.0152 × K × X C O 2 ( a q ) × 44.0098 ]
m N a C l = d a q × ( 1 F C O 2 ) ÷ 58.4428 × w ÷ [ 1 + ( 1 w ) ÷ 18.0152 × K × X C O 2 ( a q ) × 44.0098 ]
K = 1.0 ( 11.0 ÷ 3.0 ) × w
where mCO2, mNaCl, and mH2O are the numbers of moles of CO2, NaCl, and H2O, respectively; m C O 2 ( C O 2 ) and m C O 2 ( a q ) are the numbers of moles of CO2 dissolved per-unit volume in the CO2 phase and in the aqueous phase upon partial homogenization, respectively; FCO2 is the filling degree of the CO2 phase upon partial homogenization; and K is the correction coefficient (0 ≤ K ≤ 10 ≤ K ≤ 1).
(5) Calculate the homogenization pressure of the CO2–H2O inclusions upon complete homogenization [26] (Equations (20) and (21)):
T = T h + 273.15
P = 83.143 × T V b a [ T 0.5 × V × ( V + b ) ]
where Th is the complete homogenization temperature (°C); P is the homogenization pressure upon complete homogenization of the CO2–H2O inclusions (bar); a and b are calculation parameters.
Fluid inclusion thermodynamic calculations show that the thermodynamic parameters of CO2–H2O-type fluid inclusions in the Dulanggou gold deposit exhibit regular changes with respect to mineralization stages. A total of 30 liquid-rich CO2–H2O inclusions were measured in stage I, and 37 in stage II (Table 2). For stage I, the total density (d) of liquid-rich CO2–H2O inclusions ranges from 0.94 to 1.03 g/cm3, the molar volume (V) ranges from 19.14 to 28.14 cm3·mol−1, the CO2 mole fraction (X(CO2)) ranges from 0.04 to 0.26, the CO2 filling degree (FCO2) ranges from 5% to 50%, and the complete homogenization pressure (P) ranges from 171.6 to 275.7 MPa. For stage II, the total density is slightly lower than that of stage I, ranging from 0.94 to 1.01 g/cm3; the molar volume is similar to that of stage I, ranging from 19.16 to 28.14 cm3·mol−1; the CO2 mole fraction and CO2 filling degree are consistent with those of stage I (0.04–0.26 and 5%–50%, respectively); whereas the complete homogenization pressure is generally lower than that of stage I, ranging from 169.7 to 245.9 MPa. The inclusions in both stages exhibit typical thermodynamic characteristics of the CO2–H2O binary fluid system, and the differences in parameter distribution reflect changes in the physicochemical conditions of the ore-forming fluid during different evolution stages.
The density calculation of NaCl–H2O inclusions in different mineralization stages of the Dulanggou gold deposit is based on previous empirical formulas [27,29,30] (Equation (22)):
ρ = A + B t + C t 2   ( Salinity  S = 0 3030  wt . % )
where ρ is the density of the saline solution (g/cm3), and t is the homogenization temperature (°C). The applicable conditions of the above formula are:
Homogenization temperature ≤ 500 °C, where A (Equation (23)), B (Equation (24)), and C (Equation (25)) are all functions of salinity:
A = 0.993531 + 8.72147 × 1 0 3 × S 2.43975 × 1 0 5 × S 2
B = 7.11652 × 1 0 5 5.2208 × 1 0 5 × S + 1.26656 × 1 0 6 × S 2
C = 3.4997 × 1 0 6 + 2.12124 × 1 0 7 × S 4.52318 × 1 0 9 × S 2
Calculated results show that the densities of NaCl–H2O inclusions in the stage I mineralization of the Dulanggou gold deposit range from 0.60 to 0.75 g/cm3, with an average of 0.71 g/cm3; and those in the stage II mineralization range from 0.69 to 0.96 g/cm3, with an average of 0.84 g/cm3. The homogenization pressure of these NaCl–H2O inclusions can be roughly estimated using the previous empirical formula [31].
The formula for the homogenization pressure of the NaCl–H2O fluid inclusion system [31] is as follows (Equations (26)–(28)):
P 1 = P 0 × T 1 / T 0
P 0 = 219 + 2620 × S
T 0 = 374 + 920 × S
where P1 is the homogenization pressure, P0 is the initial pressure, T1 is the ore-forming temperature (the homogenization temperature of immiscible inclusions is approximately equal to this temperature), T0 is the initial temperature, and S is the salinity.
Calculation results show that for the stage I mineralization of the Dulanggou gold deposit, the homogenization pressures of NaCl–H2O inclusions range from 230 to 296 MPa, with an average of 273 MPa; for the stage II mineralization, the homogenization pressures range from 166 to 326 MPa, with an average of 215 MPa.

5.4. Laser Raman Spectroscopic Characteristics of Fluid Inclusions

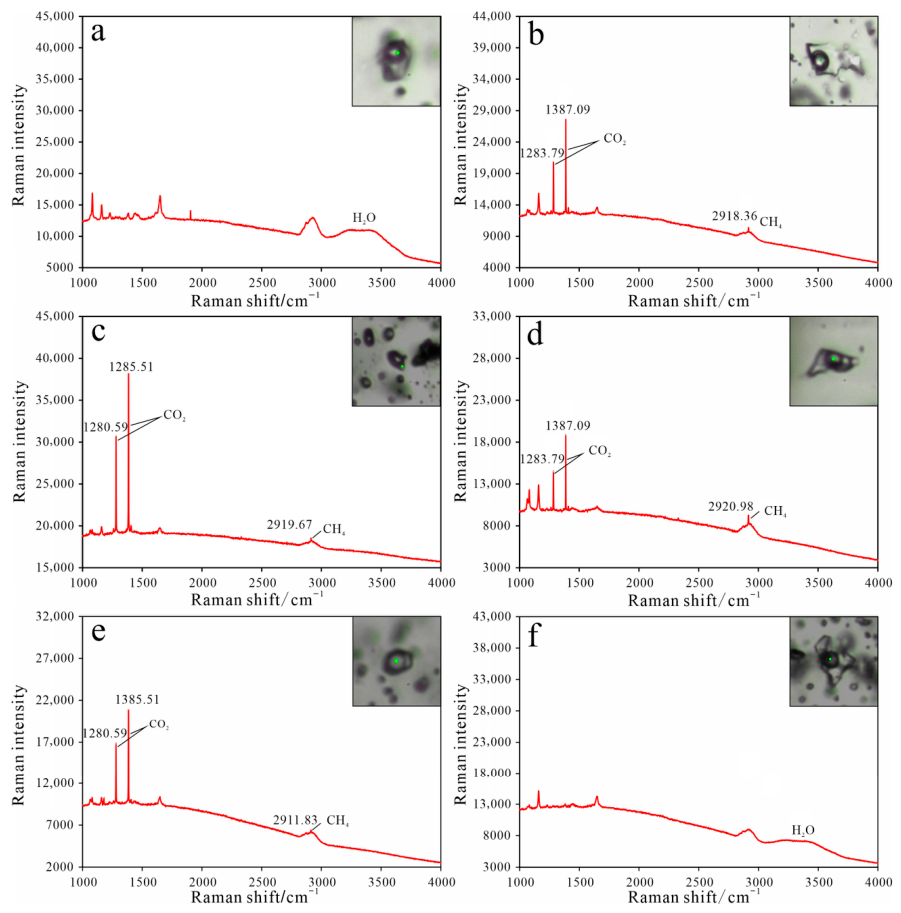
Laser Raman spectroscopy was performed on typical fluid inclusions from different mineralization stages in the Dulanggou gold deposit. The results show the following. In the early mineralization stage, the gas phase of W-type inclusions is mainly H2O (Figure 10a). Correspondingly, the C-type CO2–H2O inclusions from the same stage exhibit distinct CO2 Raman peaks at 1285 cm−1 and 1387 cm−1 (Figure 10b). In the main mineralization stage, C-type CO2–H2O inclusions show clear CO2 peaks at 1285 cm−1 and 1387 cm−1, as well as a clear CH4 peak near 2900 cm−1 (Figure 10c–e). In the late mineralization stage, the gas phase of the liquid-rich aqueous inclusions is dominated by H2O, with no CO2 or CH4 peaks observed (Figure 10f). These results indicate that the ore-forming fluids in the early and main mineralization stages of the Dulanggou gold deposit are CO2-dominated and contain CH4 as a reducing gas component. In contrast, the fluids in the late mineralization stage are H2O-dominated. In summary, the ore-forming fluid of the Dulanggou gold deposit is a reduced CO2–H2O–NaCl–CH4 system.

5.5. H–O Isotopes

Hydrogen and oxygen isotopic compositions were determined for quartz from the early and main ore stages of the Dulanggou gold deposit. The results show that, for fluids in quartz from the early ore stage, δDV-SMOW values range from −96.4‰ to −78.9‰, with a mean of −85.2‰, and δ18OV-SMOW values range from 11.6‰ to 13.6‰, with a mean of 12.4‰. Based on homogenization temperature data from fluid inclusions and using the quartz–water oxygen isotope fractionation equation of Clayton et al. [20], the calculated δ18OH2O-V-SMOW values of fluids in equilibrium with early-stage quartz range from 6.1‰ to 6.5‰, with a mean of 6.3‰. For quartz from the main ore stage, δDV-SMOW values range from −104.3‰ to −75.1‰, with a mean of −88.4‰, and δ18OV-SMOW values range from 12.4‰ to 14.2‰, with a mean of 13.4‰. The calculated δ18O_H2O-V-SMOW values of fluids in equilibrium with main-stage quartz, based on the quartz–water isotope fractionation equation, range from 5.3‰ to 7.1‰, with a mean of 6.3‰ (Table 3).

5.6. C–O Isotopes

Carbon and oxygen isotope analyses were carried out on quartz-hosted fluid inclusions from the early mineralization stage and the main mineralization stage of the Dulanggou Te–Bi-rich gold deposit. The analytical results (Table 4) show that quartz from the early mineralization stage yields δ13CV-PDB values ranging from −7.7‰ to −5.9‰, with an average of −6.9‰, and δ18OV-SOMW values ranging from 13.4‰ to 13.6‰, with an average of 13.5‰. The calculated δ18OH2O-V-SMOW values of the fluid in equilibrium with early-stage quartz range from 6.1‰ to 6.5‰, with an average of 6.3‰. Quartz from the main mineralization stage yields δ13CV-PDB values ranging from −8.7‰ to −5.8‰, with an average of −7.3‰, and δ18OV-SOMW values ranging from 13.5‰ to 14.3‰, with an average of 13.9‰. The calculated δ18OH2O-V-SMOW values of the fluid in equilibrium with main-stage quartz range from 6.4‰ to 7.2‰, with an average of 6.8‰.

6. Discussion

6.1. Characteristics and Evolution of Ore-Forming Fluids

Detailed petrographic analysis of the three stages shows the following. In the early stage, fluid inclusions are mainly CO2–H2O type, with total homogenization temperatures ranging from 307 to 388 °C. NaCl–H2O type inclusions are subordinate, with homogenization temperatures mainly from 313 to 366 °C. The combined homogenization temperature range is 307–388 °C, and salinities range from 0.4 to 7.1 wt.% NaCl eqv. The early-stage ore fluid is characterized by medium–high temperature, low salinity, and CO2–H2O richness.
In the main stage, the inclusions are predominantly CO2–H2O and NaCl–H2O types, with minor pure CO2 inclusions. The CO2–H2O inclusions have total homogenization temperatures of 220–307 °C, and NaCl–H2O inclusions have temperatures of 313–366 °C. Salinities range from 0.2 to 11.2 wt.% NaCl eqv. The CO2-rich feature of the early and main stages is similar to that of most orogenic gold deposits [39,40]. However, laser Raman analysis shows the presence of CH4 in the fluid, and the relative CO2 content is slightly lower than that in typical orogenic gold deposits, indicating a certain uniqueness of the fluid system.
In the late stage, inclusions are mainly NaCl–H2O type, with homogenization temperatures of 168–234 °C (average 199 °C) and salinities of 4.6–10.1 wt.% NaCl eqv. Overall, from the early to the late stage, the ore-forming fluid shows a gradual decrease in temperature and an increase in salinity, indicating that fluid evolution is related to immiscibility.
Laser Raman spectroscopy of fluid inclusions reveals that in the early and main stages, the fluid is dominated by CO2, with the presence of CH4 as a reducing gas component. In the late stage, the fluid is dominated by H2O, also with CH4. In summary, the ore-forming fluid of the Dulanggou gold deposit is a reducing, medium–high temperature, low salinity H2O–CO2–NaCl–CH4 system.
The CO2–H2O and NaCl–H2O inclusions in the early and main stages have broadly similar homogenization temperatures, indicating fluid immiscibility [41]. This is consistent with the petrographic observation that these three types of inclusions occur together in the same field of view, forming an immiscible inclusion assemblage. Previous studies have shown that fluid immiscibility can cause phase separation of a formerly homogeneous fluid into two or more heterogeneous fluids, destroying the original equilibrium of the system and promoting the precipitation and enrichment of useful components. For example, coexisting quartz formed during the main stage of gold precipitation often contains immiscible fluid inclusions [14,42,43]. Physicochemical experiments have also confirmed that fluid immiscibility favors gold precipitation [44].

6.2. Sources of the Ore-Forming Fluids

Fluid inclusions provide critical evidence for deposit classification and for constraining the sources and evolution of ore-forming fluids [39]. Low-salinity, CO2-rich inclusions are widely regarded as a characteristic feature of orogenic gold deposits [40,45].
In general, CO2 in ore-forming fluids may be generated through two main mechanisms: (1) dissolution or decarbonation of carbonate rocks. Direct dissolution of carbonate rocks does not cause carbon isotope fractionation [46,47], whereas decarbonation can increase the δ13C value of the fluid by approximately 3–5‰ [48]; and (2) oxidation or hydrolysis of organic matter. At temperatures of 350–600 °C, organic carbon may be converted through the reaction 2C + 2H2O → CO2 + CH4, and this process may increase the δ13C value of the fluid by 3–12‰ [46].
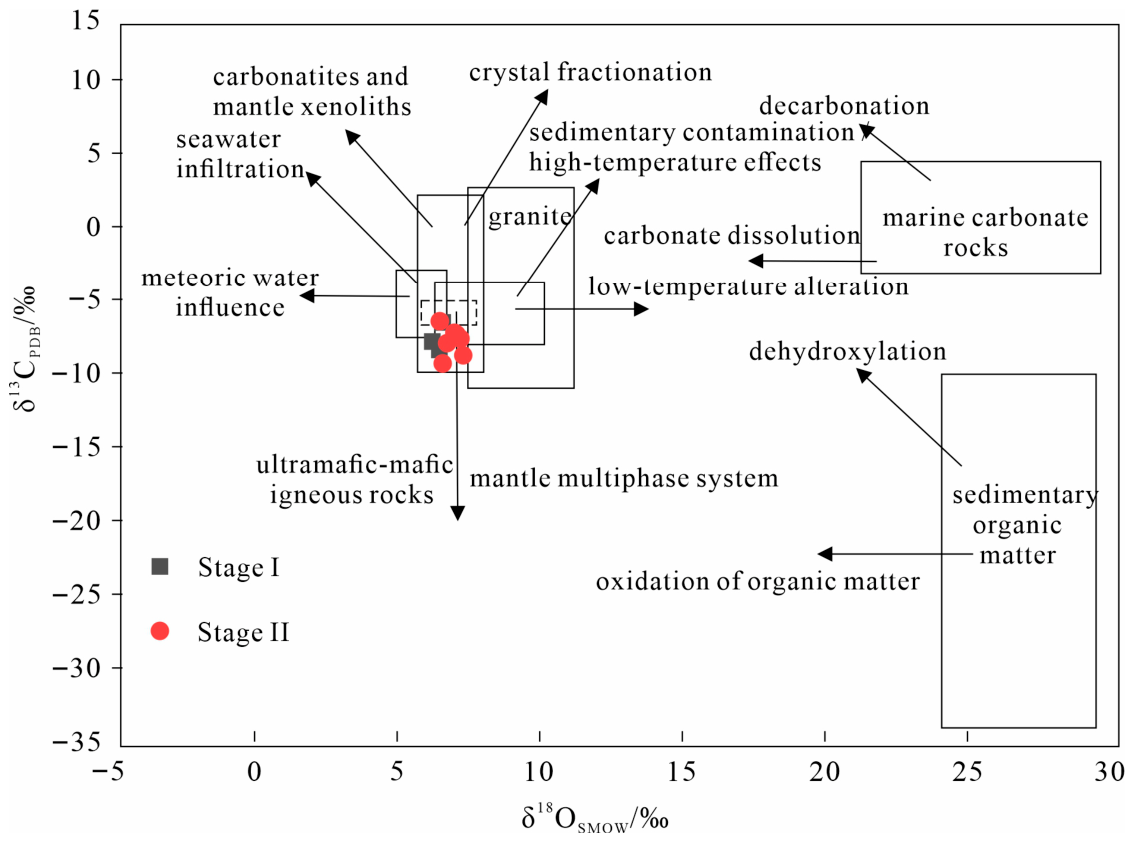
δ13CV-PDB values of the ore-forming fluids in the Dulanggou Te–Bi-rich gold deposit range from −8.77‰ to −5.85‰, showing a relatively wide variation. Therefore, the carbon in the ore-forming fluids was not derived entirely from the direct dissolution or decarbonation of marine carbonate rocks in the Devonian host strata (δ13C ≈ 0‰; [46,49]), nor can it be attributed solely to an organic matter source, because sedimentary organic carbon generally has δ13C values of −30‰ to −20‰ [50,51]. When the carbon and oxygen isotopic compositions of the ore-forming fluids are plotted on the C–O isotope diagram (Figure 11), all data points fall within the fields of igneous carbonatites and mantle xenoliths, and closely match the typical carbon isotopic composition of igneous carbonatites (−8‰ to −5‰; [52]). This feature indicates that the principal carbon source was most likely closely related to mantle-derived carbonatitic magma. Therefore, we suggest that the dominant carbon source of the deposit was mantle-derived magmatic carbon, although minor contamination from marine limestone or organic sedimentary materials cannot be excluded.
H–O isotope studies are one of the most effective methods commonly used to trace the sources of ore-forming fluids in hydrothermal deposits [54,55,56].
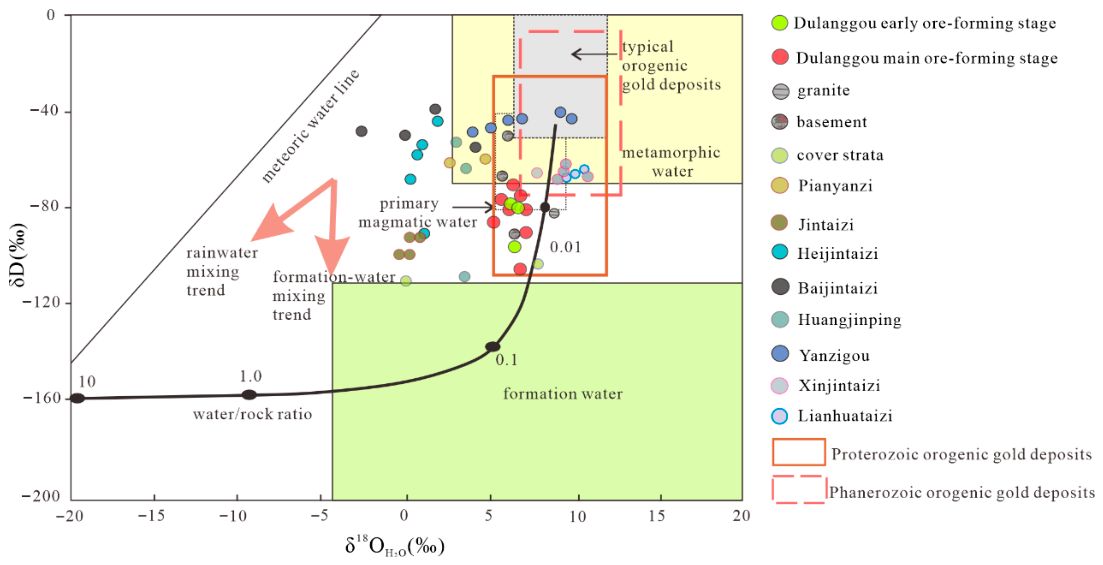
A comparison of hydrogen and oxygen isotopic compositions between the Dulanggou gold deposit and typical gold deposits in the Danba–Dadu River metallogenic belt is presented. On the H–O isotopic composition diagram (Figure 12), data points of the Dulanggou gold deposit mainly plot below the field of Phanerozoic typical orogenic gold deposits (i.e., metamorphic water) and fall within the primary magmatic water field. This indicates that the ore-forming fluids were primarily derived from primary magmatic water. This feature differs from that of typical orogenic gold deposits, where metamorphic water is the dominant fluid source [57]. Some deposits differ from the Dulanggou gold deposit, such as Lianhuataizi, Xinjintaizi, and Yanzigou. Their data points plot within the fields of Phanerozoic and Archean orogenic gold deposits (Figure 12). This indicates that their ore-forming fluids are characterized by both metamorphic water and primary magmatic water.
In summary, the ore-forming fluid of the Dulanggou gold deposit is predominantly derived from primary magmatic water. The ore-forming system was relatively closed, and the carbon in the fluid originated from mantle-derived magmatic carbon. Compared with typical orogenic gold deposits in the region, which are dominated by metamorphic water, the fluid source of the Dulanggou deposit is distinctive.

6.3. Discussion of the Ore-Forming Mechanism

Previous studies have shown that fluid immiscibility is one of the most effective mechanisms for gold precipitation. In the Dulanggou gold deposit, the phase types and distribution assemblages of fluid inclusions in quartz veins from the early and main mineralization stages indicate that gold mineralization occurred during fluid immiscibility [58,59]. Microthermometric data show that the ore-forming fluid belongs to the H2O–CO2–NaCl–CH4 system [60]. Petrographic analysis further reveals that in the main-stage quartz veins, CO2-bearing inclusions (C) and aqueous-rich inclusions (W) abundantly coexist. Because isochores can constrain the minimum trapping pressure relative to the measured homogenization temperature [12,61], the homogenization temperatures of inclusions in main-stage quartz veins yield an estimated ore-forming pressure range of 166–326 MPa [61,62].
The main-stage quartz veins contain abundant immiscible inclusion assemblages of CO2-bearing (C) and aqueous-rich (W) inclusions (Figure 7). These two types have similar homogenization temperatures but significantly different salinities (Figure 8 and Figure 9), indicating that fluid immiscibility occurred during the main mineralization stage. This immiscibility was likely a key factor for gold precipitation [10,14,63,64,65,66].
The temperature of the early-stage fluid (307–388 °C, average 341 °C) is higher than that of the main stage and also exceeds the eutectic point of the Au–Bi–Te ternary melt system (235–266 °C) [4,67]. This suggests that during the main stage, the initially Au-rich Te–Bi melt underwent fluid–melt phase separation as the temperature dropped below its melting point, accompanied by fluid immiscibility as revealed by fluid inclusions. This process formed Te–Bi-rich metal melt droplets. Native gold adsorbed in the melt was then precipitated sequentially according to the melting points of the tellurium–bismuth minerals [4].
The Dulanggou gold deposit resembles classic orogenic gold deposits in terms of host rocks, ore-controlling structures, ore mineral assemblages, and low-salinity CO2-rich ore-forming fluids. However, its C–H–O isotopic characteristics indicate that the fluid is dominated by mantle-derived magmatic components. This is different from typical orogenic gold deposits, where metamorphic water is the main fluid source.

7. Conclusions

(1) The mineralization of the Dulanggou gold deposit process can be divided into three stages: the early mineralization stage (quartz + minor sulfides), the main mineralization stage (quartz + abundant sulfides + native gold + telluride–bismuthide minerals), and the late mineralization stage (quartz + minor sulfides + calcite).
(2) In the early stage, fluid inclusions are dominated by the CO2–H2O type, with subordinate NaCl–H2O type. They show medium–high temperature and low salinity. In the main stage, the inclusions are mainly CO2–H2O and NaCl–H2O types, with minor pure CO2 inclusions. They exhibit wide ranges of homogenization temperature and salinity. In the late stage, inclusions are mainly the NaCl–H2O type, with low homogenization temperatures. Raman spectroscopy indicates that, in addition to CO2, CH4 is present in the vapor phase of inclusions from all three stages. Therefore, the ore-forming fluid of the Te-Bi-rich Dulanggou gold deposit is a reducing, medium–low temperature, low-salinity H2O–CO2–NaCl–CH4 system.
(3) Thermodynamic calculations of CO2–H2O inclusions show that from the early stage to the main stage, the total density, molar volume, CO2 mole fraction, and CO2 filling degree have similar ranges. However, the total homogenization pressure is generally lower in the main stage than in the early stage. This reflects a progressive decrease in pressure during fluid evolution.
(4) The C–O and H–O isotopic compositions of fluid inclusions in quartz are consistent with each other. They indicate that the ore-forming fluid is genetically related to magmatic fluid and contains mantle-derived components modified by carbonate metasomatism. H–O isotopic data plot in the field of primary magmatic water. This suggests that the ore-forming fluid was mainly derived from primary magmatic water in a relatively closed deep environment. This feature is distinctly different from that of typical orogenic gold deposits, where metamorphic water is the dominant fluid source.
(5) The coexistence of CO2–H2O and NaCl–H2O inclusions in the early and main stages indicates fluid immiscibility. The decrease in temperature and pressure led to phase separation of the fluid. This destabilized gold–sulfur complexes and promoted gold precipitation. In the main stage, abundant tellurium–bismuth minerals are developed. The ore-forming temperature is higher than the eutectic point of the Au–Bi–Te melt system. A melt phase may have participated in the extraction and enrichment of gold [4]. The synergistic effect of fluid immiscibility and melt separation is the key control on efficient gold precipitation in the Dulanggou gold deposit. This study improves the understanding of gold mineralization mechanisms on the western margin of the Yangtze Craton. It reveals the diversity of fluid sources in orogenic gold systems. It also provides a basis for regional metallogenic regularity and exploration targeting.

Author Contributions

Conceptualization, Y.Z. (Yan Zhang) and B.C.; Data Curation, Y.Z. (Yan Zhang), Y.X., H.X., H.Z. (Haijun Zhang) and Y.G.; Formal Analysis, Y.Z. (Yan Zhang), H.X., M.Q. and Y.Y.; Funding Acquisition, X.L., C.C. and Q.W.; Project Administration, X.L. and Q.W.; Validation, Y.Z. (Yan Zhang), Y.X. and K.Y.; Visualization, Y.Z. (Yan Zhang), B.C. and C.L.; Investigation, H.Z. (Hesen Zhao), W.C. and Y.Z. (Yaru Zhang); Writing—Original Draft, Y.Z. (Yan Zhang), B.C. and Y.X.; Writing—Review and Editing, X.L., C.C., H.Z. (Hesen Zhao) and W.C. All authors have read and agreed to the published version of the manuscript.

Funding

This research was funded by the Sichuan Provincial Science and Technology Program “Jiebang Guashuai” Project (Grant No. 2025YFNZH0006) and the Major Science and Technology Project of the Xinjiang Uygur Autonomous Region, China (Grant No. 2025A03005).

Data Availability Statement

The authors confirm that the data supporting the findings of this study are available within the article.

Acknowledgments

We are grateful to the Institute of Geochemistry, Chinese Academy of Sciences, for providing tools for laser Raman spectroscopy analyses, and to Beijing Zhongkuangyan Testing Technology Co., Ltd., for providing tools for C-H-O isotope analyses. We deeply appreciate Fan Tao and Yang Kaijun for their invaluable assistance during field investigations and sampling. We also thank the anonymous reviewers for their insightful comments, which significantly improved the quality of this manuscript.

Conflicts of Interest

Bing Chen is employee of China Railway Eryuan Engineering Group Co., Ltd. Kaijun Yang is employee of The Seventh Geological Brigade of Sichuan Province. The authors declare that they have no known competing financial interests or personal relationships that could have appeared to influence the work reported in this paper.

References

  1. Zhao, H.S.; Wang, Q.F.; Groves, D.I.; Deng, J. A rare Phanerozoic amphibolite-hosted gold deposit at Danba, Yangtze Craton, China: Significance to fluid and metal sources for orogenic gold systems. Miner. Depos. 2019, 54, 133–152. [Google Scholar] [CrossRef]
  2. Wang, Q.F.; Deng, J.; Zhao, H.S.; Yang, L.; Ma, Q.Y.; Li, H.J. Review on Orogenic Gold Deposits. Earth Sci. 2019, 44, 2155–2186, (In Chinese with English abstract). [Google Scholar] [CrossRef]
  3. Ma, T.Q.; Zhang, Y.; Chen, C.H.; Li, Y.; Chen, X.; Yang, Y.L.; Liu, S.Y.; Gu, Y.; Lai, X. The occurrence states of gold and tellurium-bismuth minerals and enrichment mechanism of gold in Dulangou gold deposit of Danba, Sichuan Province. Acta Petrol. Mineral. 2023, 42, 541–554, (In Chinese with English abstract). [Google Scholar]
  4. Ma, T.Q. Mineralogical Characteristics and Indicative Significance of Typical Telluride-Type Gold Deposits in the Dadu River Basin. Master’s Thesis, Chengdu University of Technology, Chengdu, China, 2024. (In Chinese with English abstract). [Google Scholar]
  5. Fan, T.; Wang, C.L.; Yang, B.; Li, J.Q.; Wang, Y.; Yang, K.J.; Zhang, C. Genesis of the Dulanggou gold deposit in Danba County of Sichuan Province: Based on isotopic evidence. Geol. Explor. 2023, 59, 481–496, (In Chinese with English abstract). [Google Scholar]
  6. Fan, T.; Lai, X.; Cheng, W.B.; Lang, X.H.; Chen, C.H.; Zhang, H.J.; Xiang, Y.Y.; Zhang, Y.; Cai, J.M.; Ma, T.Q.; et al. Genetic Mineralogy and Prospecting Mineralogy of the Dulanggou Gold Deposit in Danba, Sichuan Province. Northwest. Geol. 2025, 58, 209–224, (In Chinese with English abstract). [Google Scholar] [CrossRef]
  7. Phillips, G.N.; Powell, R. Formation of gold deposits: A metamorphic devolatilization model. J. Metamorph. Geol. 2010, 28, 689–718. [Google Scholar] [CrossRef]
  8. Tomkins, A.G. Windows of metamorphic sulfur liberation in the crust: Implications for gold deposit genesis. Geochim. Cosmochim. Acta 2010, 74, 3246–3259. [Google Scholar] [CrossRef]
  9. Goldfarb, R.J.; Groves, D.I. Orogenic gold: Common or evolving fluid and metal sources through time. Lithos 2015, 233, 2–26. [Google Scholar] [CrossRef]
  10. Roedder, E. Fluid Inclusions; Reviews in Mineralogy; Mineralogical Society of America: Chantilly, VA, USA, 1984; Volume 12. [Google Scholar] [CrossRef]
  11. Groupner, T.; Kempe, U.; Dombon, E.; Pätzold, O.; Leeder, O.; Spooner, E.T.C. Fluid regime and ore formation in the tungsten (-yttrium) deposits of Kyzyltau (Mongolian Altai): Evidence for fluid variability in tungsten-tin ore systems. Chem. Geol. 1999, 154, 21–58. [Google Scholar] [CrossRef]
  12. Wilkinson, J.J. Fluid inclusions in hydrothermal ore deposits. Lithos 2001, 55, 229–272. [Google Scholar] [CrossRef]
  13. Paradis, S.; Chi, G.X.; Lavoi, D. Fluid inclusion and isotope evidence for the origin of the Upton Ba-Zn-Pb deposit, Quebec Appalachians, Canada. Econ. Geol. 2004, 99, 801–817. [Google Scholar] [CrossRef]
  14. Lu, H.Z.; Fan, H.R.; Ni, P.; Ou, G.X.; Shen, K.; Zhang, W.H. Fluid Inclusions; Science Press: Beijing, China, 2004; (In Chinese with English abstract). [Google Scholar]
  15. Chi, G.X.; Lai, J.Q. Role of fluid inclusions in study of mineral deposits. Miner. Depos. 2009, 28, 850–855, (In Chinese with English abstract). [Google Scholar]
  16. Zhang, L.G. Application of Stable Isotopes in the Geological Sciences; Shaanxi Science and Technology Press: Xi’an, China, 1985; (In Chinese with English abstract). [Google Scholar]
  17. Xu, Z.Q.; Hou, L.W.; Wang, Z.X.; Fu, X.F.; Huang, M.H. Orogenic Processes of the Songpan–Ganzi Orogenic Belt, China; Geological Publishing House: Beijing, China, 1992; (In Chinese with English abstract). [Google Scholar]
  18. Gong, B.; Zheng, Y.F.; Chen, R.X. An online method combining a thermal conversion elemental analyzer with isotope ratio mass spectrometry for the determination of hydrogen isotope composition and water concentration in geological samples. Rapid Commun. Mass. Spectrom. 2007, 21, 1386–1392. [Google Scholar] [CrossRef]
  19. Clayton, R.N.; Mayeda, T.K. The use of bromine pentafluoride in the extraction of oxygen from oxides and silicates for isotopic analysis. Geochim. Cosmochim. Acta 1963, 27, 43–52. [Google Scholar] [CrossRef]
  20. Clayton, R.N.; O’Neil, J.R.; Mayeda, T.K. Oxygen isotope exchange between quartz and water. J. Geophys. Res. Atmos. 1972, 77, 3057–3067. [Google Scholar] [CrossRef]
  21. Graham, C.M.; Harmon, R.S.; Sheppard, S.M.F. Experimental hydrogen isotope studies: Hydrogen isotope exchange between amphibole and water. Am. Mineral. 1984, 69, 128–138. [Google Scholar]
  22. Van den Kerkhof, A.M.; Hein, U.F. Fluid inclusion petrography. Lithos 2001, 55, 27–47. [Google Scholar] [CrossRef]
  23. Goldstein, R.H.; Reynolds, T.J. Fluid Inclusion Microthermometry. In Systematics of Fluid Inclusions in Diagenetic Minerals; SEPM Society for Sedimentary Geology: Claremore, OK, USA, 1994. [Google Scholar] [CrossRef]
  24. Touret, J.; Bottinga, Y. Équations d’état pour le CO2; application aux inclusions carboniques. Bull. Minéral. 1979, 102, 577–583. [Google Scholar] [CrossRef]
  25. Li, B.H.; Gu, X.X.; Fu, S.H.; Xu, S.H.; Chen, C.H.; Dong, S.Y. The evidence from fluid inclusions for the immiscibility of the ore-forming fluids in the Shuiyindong gold deposit, Guizhou Province. Earth Sci. Front. 2010, 17, 286–294, (In Chinese with English abstract). [Google Scholar]
  26. Liu, B.; Zhu, S.L.; Shen, K. Calculation Software and Examples for Thermodynamic Parameters of Fluid Inclusions; Geological Publishing House: Beijing, China, 2000; (In Chinese with English abstract). [Google Scholar]
  27. Liu, B.; Shen, K. Thermodynamics of Fluid Inclusions; Geological Publishing House: Beijing, China, 1999; (In Chinese with English abstract). [Google Scholar]
  28. Song, Y.C.; Hu, W.X.; Ni, P.; Duan, Z.H.; Zhang, X.F. An improved method to determine the molar volume and composition of CO2-bearing saline fluid inclusions. Sci. China Ser. D Earth Sci. 2007, 37, 363–369, (In Chinese with English abstract). [Google Scholar]
  29. Bodnar, R.J. A method of calculating fluid inclusion volumes based on vapor bubble diameters and P-V-T-X properties of inclusion fluids. Econ. Geol. 1983, 78, 535–542. [Google Scholar] [CrossRef]
  30. Hass, J.L., Jr. The effect of salinity on the maximum thermal gradient of a hydrothermal system at hydrostatic pressure. Econ. Geol. 1971, 66, 940–946. [Google Scholar] [CrossRef]
  31. Shao, J.L. Gold Prospecting Mineralogy; China University of Geosciences Press: Wuhan, China, 1988; (In Chinese with English abstract). [Google Scholar]
  32. Luo, H.S.; Mao, Y.Y.; Lu, Y. The Kangding Sellaite Gold Deposit; Sichuan Science and Technology Press: Chengdu, China, 1987; (In Chinese with English abstract). [Google Scholar]
  33. Ge, S.L.; Cheng, X. Geological and Geochemical Characteristics of Jintaizi Au Deposit, Sichuan Province. Geol. Prospect. Rev. 1996, 11, 87–94, (In Chinese with English abstract). [Google Scholar]
  34. Chen, Z.L.; Liu, Y.P.; Wei, S.Q. Structural Study of Ore Fields in the Major Gold Districts on Both Banks of the Dadu River, Kangding; Geological Publishing House: Beijing, China, 1997; (In Chinese with English abstract). [Google Scholar]
  35. Teng, Y.G.; Ni, S.J.; Zhang, C.J.; Tang, J.W.; Wu, X.Y.; Xu, Q.D. Isotopic Geochemical Tracing for Sources of Ore-Forming Fluids in Tianwan Ore Belt. J. Changchun Univ. Sci. Technol. 2000, 145–149, (In Chinese with English abstract). [Google Scholar]
  36. Li, X.F.; Mao, J.W.; Wang, D.H.; Luo, F.X. Helium and Argon Isotope Systematics in Fluid Inclusion of the Gold Deposits along the Daduhe River, Sichuan Province, Southwestern China. Acta Geol. Sin. 2004, 203–210, (In Chinese with English abstract). [Google Scholar]
  37. Hou, L.; Deng, J.; Ding, J.; Wang, X.W.; Peng, H.J. Ore-Forming Fluids Features of the Yanzigou Orogenic Gold Deposit, Danba County, Sichuan Province, China. Acta Geol. Sin. 2012, 86, 1957–1971, (In Chinese with English abstract). [Google Scholar]
  38. Li, H.B.; Dong, G.C.; Xie, Z.L.; Wang, S.; Fan, Y.T. Geology and genesis of gold deposits in the Daduhe belt: A case study of the Lianhua gold deposit on the western margin of the Yangtze Craton, China. Ore Geol. Rev. 2025, 178, 106500. [Google Scholar] [CrossRef]
  39. Groves, D.I.; Goldfarb, R.J.; Gebre-Mariam, M.; Hagemann, S.G.; Robert, F. Orogenic gold deposits: A proposed classification in the context of their crustal distribution and relationship to other gold deposit types. Ore Geol. Rev. 1988, 13, 7–27. [Google Scholar] [CrossRef]
  40. Chen, Y.J.; Ni, P.; Fan, H.R.; Pirajno, F.; Lai, Y.; Su, C.W.; Zhang, H. Diagnostic Fluid In-clusions of Different Types Hydrothermal Gold Deposits. Acta Petrol. Sin. 2007, 23, 2085–2108, (In Chinese with English abstract). [Google Scholar]
  41. Hai, L.F.; Liu, A.L.; Tao, R.; Bai, J.H.; Song, Y. Source of Fluid and Genesis of Jinchangzi Gold Deposit in Weiningbeishan, Ningxia: Evidence from Fluid Inclusions and C-H-OIsotopes. J. Earth Sci. 2021, 46, 4274–4290. [Google Scholar] [CrossRef]
  42. Craw, D.; Teagle, D.A.H.; Belocky, R. Fluid Immisci-bility in Late-Alpine Gold-Bearing Veins, Eastern and Northwestern European Alps. Miner. Depos. 1993, 28, 28–36. [Google Scholar] [CrossRef]
  43. Hu, F.F.; Fan, H.R.; Shen, K.; Di, M.G.; Jin, C.W.; Chen, X.S. Nature and Evolution of Ore-Forming Fluids in the Rushan Lode Gold Deposit, Jiaodong Peninsula of Eastern China. Acta Petrol. Sin. 2005, 21, 1329–1338, (In Chinese with English abstract). [Google Scholar]
  44. Bowers, T.S. The Deposition of Gold and Other Metals:Pressure—Induced Fluid Immiscibility and Associated Stable Isotope Signatures. Geochim. Cosmochim. Acta 1991, 55, 2417–2434. [Google Scholar] [CrossRef]
  45. Ridley, J.R.; Diamond, L.W. Fluid Chemistry of Orogenic Lode Gold Deposits and Implications for Genetic Models. Rev. Econ. Geol. 2000, 13, 141–162. [Google Scholar] [CrossRef]
  46. Ohmoto, H.; Rye, R.O. Carbon and sulfur isotopes. In Geochemistry of Hydrothermal Ore Deposits; Barnes, H.L., Ed.; Wiley: New York, NY, USA, 1979; pp. 509–567. [Google Scholar]
  47. Golding, S.D.; McNaughton, N.J.; Barley, M.E.; Groves, D.I.; Ho, S.E.; Rock, N.M.S.; Turner, J.V. Archean carbon and oxygen reservoirs: Their significance for fluid sources and circulation paths for Archean mesothermal gold deposits of the Norseman-Wiluna Belt, Western Australia. Econ. Geol. Monogr. 1989, 6, 376–388. [Google Scholar] [CrossRef]
  48. Burrows, D.R.; Spooner, E.T.C. Generation of a magmatic H2O-CO2 fluid enriched in Au, Mo, and W within an Archean sodic granodiorite stock, Mink Lake, northwestern Ontario. Econ. Geol. 1987, 82, 1931–1957. [Google Scholar] [CrossRef]
  49. Prokoph, A.; Shields, G.A.; Veizer, J. Compilation and time-series analysis of a marine carbonate δ18O, δ13C, 87Sr/86Sr and δ34S database through Earth history. Earth-Sci. Rev. 2008, 87, 113–133. [Google Scholar] [CrossRef]
  50. Ohmoto, H. Systematics of sulfur and carbon isotopes in hydrothermal ore deposits. Econ. Geol. 1972, 67, 551–578. [Google Scholar] [CrossRef]
  51. Schoell, M.; Wellmer, F.W. Anomalous 13C depletion in early Precambrian graphites from Superior Province, Canada. Nature 1981, 290, 696–699. [Google Scholar] [CrossRef]
  52. Taylor, H.P., Jr.; Frechen, J.; Degens, E.T. Oxygen and carbon isotope studies of carbonatites from the Laacher See District, West Germany and the Alnö District, Sweden. Geochim. Cosmochim. Acta 1967, 31, 407–430. [Google Scholar] [CrossRef]
  53. Liu, J.M.; Liu, J.J. Basin fluid genetic model of sediment-hosted microdisseminated gold deposits in the gold-triangle area between Guizhou, Guangxi and Yunnan. Acta Mineral. Sin. 1997, 17, 448–456, (In Chinese with English abstract). [Google Scholar]
  54. Jean-Baptiste, P.; Fouquet, Y. Abundance and isotopic composition of helium in hydrothermal sulfides from the East Pacific Rise at 13 °N. Geochim. Cosmochim. Acta 1996, 60, 87–93. [Google Scholar] [CrossRef]
  55. Mao, J.; Wang, Y.; Ding, T.; Chen, Y.C.; Wei, J.X.; Yin, J.Z. Dashuigou tellurium deposit in Sichuan Province, China: S, C, O, and H isotope data and their implications on hydrothermal mineralization. Resour. Geol. 2002, 52, 15–23. [Google Scholar] [CrossRef]
  56. Pirajno, F. Hydrothermal Processes and Mineral Systems; Springer: Dordrecht, The Netherlands, 2009; pp. 1–1250. [Google Scholar] [CrossRef]
  57. Goldfarb, R.J.; Groves, D.I.; Gardoll, S. Orogenic gold and geologic time: A global synthesis. Ore Geol. Rev. 2001, 18, 1–75. [Google Scholar] [CrossRef]
  58. Lawrence, D.M.; Treloar, P.J.; Rankin, A.H.; Boyce, A.; Harbidge, P. A fluid inclusion and stable isotope study at the Loulo Mining District, Mali, West Africa: Implications for multifluid sources in the generation of orogenic gold deposits. Econ. Geol. 2013, 108, 229–257. [Google Scholar] [CrossRef]
  59. Lambert-Smith, J.S.; Lawrence, D.M.; Vargas, C.A.; Boyce, A.J. The Gounkoto Au deposit, West Africa: Constraints on ore genesis and volatile sources from petrological, fluid inclusion and stable isotope data. Ore Geol. Rev. 2016, 78, 606–622. [Google Scholar] [CrossRef]
  60. Groves, D.I.; Santosh, M.; Deng, J.; Wang, Q.F. A holistic model for the origin of orogenic gold deposits and its implications for exploration. Miner. Depos. 2020, 55, 275–292. [Google Scholar] [CrossRef]
  61. Roedder, E.; Bodnar, R.J. Geologic pressure determinations from fluid inclusion studies. Annu. Rev. Earth Planet. Sci. 1980, 8, 263–301. [Google Scholar] [CrossRef]
  62. Robert, F.; Kelly, W.C. Ore-forming fluids in Archaean gold-bearing quartz veins at the Sigma Mine, Abitibi greenstone belt, Quebec, Canada. Econ. Geol. 1987, 82, 1464–1482. [Google Scholar] [CrossRef]
  63. Ramboz, C.; Michel, P.; Alain, W. Fluid immiscibility in natural processes: Use and misuse of fluid inclusion data: II. Interpretation of fluid inclusion data in terms of immiscibility. Chem. Geol. 1982, 37, 29–48. [Google Scholar] [CrossRef]
  64. Shepherd, T.J.; Rankin, A.H.; Alderton, D.H.M. A Practical Guide to Fluid Inclusion Studies. Glasgow and London (Blackie), 1985. xi + 239 pp. Price £26. Mineral. Mag. 1985, 50, 352–353. [Google Scholar] [CrossRef]
  65. Fan, H.R.; Guo, J.H.; Chen, F.; Jin, C.W.; Shen, K.; Satir, M. Fluid evolution and exhumation history of ultrahigh-pressure rocks at Lanshantou, Sulu terrane, Eastern China. J. Geochem. Explor. 2003, 78, 51–54. [Google Scholar] [CrossRef]
  66. Ni, P.; Chi, Z.; Pan, J. Metallogenic fluid and prospecting mediation of porphyry and epithermal deposits: A case study of several typical deposits in South China. Earth. Sci. Front. 2020, 27, 60–78, (In Chinese with English abstract). [Google Scholar] [CrossRef]
  67. Ciobanu, C.L.; Birch, W.D.; Cook, N.J.; Pring, A.; Grundler, P.V. Petrogenetic significance of Au-Bi-Te-S associations: The example of Maldon, Central Victorian gold province, Australia. Lithos 2010, 116, 1–17. [Google Scholar] [CrossRef]
Figure 1. Tectonic location of the study area. (a) Tectonic location map; (b) schematic diagram of the Y-shaped structure (modified after [1,4,17]).
Minerals 16 00523 g001
Figure 2. Simplified geological map of the Dulanggou gold deposit (modified after internal data of the 403 Geological Team).
Minerals 16 00523 g002
Figure 3. Cross-sections of exploration lines in the Dulanggou gold deposit, Danba. (a) Cross-section of exploration line 0; (b) cross-section of exploration line +5; (c) cross-section of exploration line 7. Sections (ac) are all cropped to show only the parts related to the ore bodies. The ore bodies are mainly hosted in two-mica quartz schist and tectonic breccia of the third member of the Weiguan Formation (Dwg3) of Devonian age.
Minerals 16 00523 g003
Figure 4. Ore characteristics and mineral assemblages of the Dulanggou gold deposit. (a) Contact between quartz vein and wall rocks of the third member of the Weiguan Group (Dwg3), showing silicification and biotitization; (b) crosscutting relationship between early-stage quartz (Qtz I) and main-stage quartz (Qtz II), with pyrrhotite, Te–Bi minerals, pyrite, and other minerals occurring in the main-stage quartz vein (Qtz II); (c) crosscutting relationship between main-stage quartz vein (Qtz II) and late-stage quartz vein (Qtz III); (d) massive native-gold ore, showing native gold distributed as clots in quartz veins; (e) pilsenite (Pil), chalcopyrite, and Po II-2 showing a shared-boundary texture under plane-polarized light; (f) native gold (Au II), pilsenite (Pil), and pyrrhotite (Po II-2) distributed in quartz veins.
Minerals 16 00523 g004
Figure 5. Mineralization stages and mineral paragenetic sequence of the Dulanggou gold deposit.
Minerals 16 00523 g005
Figure 6. Types of fluid inclusions in the Dulanggou gold deposit (a) clustered primary two-phase CO2-rich aqueous inclusions (C-3 type) coexisting with a small number of primary pure liquid aqueous inclusions (W type); (b) clusters of primary two-phase CO2-rich aqueous inclusions (C-3 type) coexisting with a small number of primary pure liquid CO2 inclusions (PC type); (c) coexisting primary two-phase CO2-rich aqueous inclusions (C-3 type) and pure liquid CO2 inclusions (PC type), with secondary inclusions arranged in an oriented pattern; (d,e) primary three-phase H2O-rich CO2 inclusions (C-1 type) showing a distinct “double-eyelid” structure; (f) isolated primary vapor–liquid two-phase H2O-rich CO2 inclusions (C-2 type); (g) clustered primary two-phase CO2-rich aqueous inclusions (C-3 type); (h) pure liquid CO2 inclusions (PC-type FIA) coexisting with two-phase CO2-rich aqueous inclusions (C-3 type); (i) clustered primary liquid-rich two-phase aqueous inclusions (W type). LH2O, liquid H2O; LCO2, liquid CO2; VH2O, vapor H2O; VCO2, vapor CO2; Qtz, quartz.
Minerals 16 00523 g006
Figure 7. Microscopic morphology and distribution characteristics of fluid inclusions in the three mineralization stages (a) clustered primary three-phase CO2-rich aqueous inclusions from the early ore stage; (b) clustered primary liquid-rich two-phase aqueous inclusions from the early ore stage; (c) coexisting clustered primary vapor–liquid two-phase H2O-rich CO2 inclusions and liquid-rich two-phase aqueous inclusions; (d) isolated primary two-phase CO2-rich aqueous inclusions with secondary inclusions showing oriented distribution; (e) slightly clustered primary two-phase CO2-rich aqueous inclusions from the main ore stage; (f) clustered primary liquid-rich two-phase aqueous inclusions from the main ore stage; (g) coexisting primary vapor–liquid two-phase H2O-rich CO2 inclusions and liquid-rich two-phase aqueous inclusions from the main ore stage; (h) coexisting pure liquid CO2 inclusions and two-phase CO2-rich aqueous inclusions; (i) clustered coexistence of primary two-phase CO2-rich aqueous inclusions and pure liquid CO2 inclusions from the main ore stage; (j,k) isolated liquid-rich two-phase aqueous inclusions from the late ore stage; (l) isolated primary vapor-rich two-phase aqueous inclusions from the late ore stage, with secondary inclusions arranged in an oriented pattern. LH2O, liquid H2O; LCO2, liquid CO2; VH2O, vapor H2O; VCO2, vapor CO2; Qtz, quartz; Qtz I, early-stage quartz; Qtz II, main-stage quartz; Qtz III, late-stage quartz; Po, pyrrhotite.
Minerals 16 00523 g007
Figure 8. Histograms of homogenization temperature and salinity of fluid inclusions in different mineralization stages: (a,b) early ore stage; (c,d) main ore stage; (e,f) late ore stage.
Minerals 16 00523 g008
Figure 9. Homogenization temperature–salinity plot of fluid inclusions from the Dulanggou gold deposit.
Minerals 16 00523 g009
Figure 10. Raman spectra of fluid inclusions and corresponding photomicrographs. (a) The gas phase of W-type inclusions in the early mineralization stage is dominated by H2O; (b) C-type CO2–H2O inclusions in the early mineralization stage show distinct CO2 peaks; (ce) C-type CO2–H2O inclusions in the main mineralization stage exhibit distinct CO2 and CH4 peaks; (f) main mineralization stage.
Minerals 16 00523 g010
Figure 11. Distribution of C–O isotopic compositions of the Te-Bi-rich Dulanggou gold deposit, Danba (modified after [53]).
Minerals 16 00523 g011
Figure 12. H–O isotopic compositions of the Dulanggou gold deposit and representative gold deposits in the Danba–Daduhe metallogenic belt.
Minerals 16 00523 g012
Table 1. Microthermometric data of fluid inclusions from the three mineralization stages.
StageTypeHost MineralnTm, h (°C)Tm, Ice (°C)Salinity
(wt.% NaCl eq.)
Pressure
(MPa)
ICQtz36307~388−7.6~−1.40.4~5.9171~276
IWQtz10313~366-3.1~7.1230~296
IICQtz55220~307−7.6~−0.10.2~3.1170~246
IIWQtz66207~306−6.7~−2.80.2~11.2166~326
IIIWQtz24168~234−7.6~−1.44.6~10.1144 ~218
Table 2. Thermodynamic calculation results of CO2–H2O inclusions in the Dulanggou gold deposit.
Mineralization Staged/(g/cm3)V/(cm3·mol−1)X (CO2)FCO2/%P (MPa)
I (n = 30)0.94~1.0319.14~28.140.04~0.260.05~0.50171~276
II (n = 37)0.94~1.0119.16~28.140.04~0.260.05~0.50170~246
Note: d is the density of the fluid upon inclusion homogenization (g·cm−3); V is the molar volume of the inclusion (cm3·mol−1); X(CO2) is the mole fraction of CO2; FCO2 is the calculated filling degree of CO2 (%); Th is the complete homogenization temperature of the inclusion; P is the complete homogenization pressure of the inclusion (MPa).
Table 3. H–O isotopic compositions of gangue minerals, Dulanggou gold deposit (‰, SMOW).
DepositSampleHost MineralStageth/°Cδ18OV-SMOW/‰δ18OH2O/‰δDV-SMOW/‰Reference
Dulanggou4150-1-007QtzEarly339.413.46.19−78.9This study
4150-1-00813.76.53−80.4
3830-16-1413.66.43−96.4
3830pm-2QtzMain269.614.06.91−75.1This study
4075pm16-4269.613.96.83−104.3
3830j-1-2269.612.85.75−76.7
3930pml-8269.612.45.32−85.1
3830-1-7269.614.27.13−80.5
4150-1-13269.613.56.45−70.6
3730PM14-2269.614.06.95−91.3
4113-1269.613.66.55−79.9
PianyanziP-4Qtz//12.02.66−61.2[32]
W-15 //13.94.80−59.6
Xiaoshandun/Grt///8.32−82.94[33]
BasementH1Qtz//11.06.37−89.434[34]
H2//11.65.91−49.887
H3//12.15.32−67.079
CoverDf-1Qtz//7.90.04−110[35]
Df-2//15.87.94−103
Jintaizi/Qtz//9.50.26−99[33]
///9.5−0.32−99
///9.40.84−92
///9.40.25−92
HeijintaiziHJ-1Qtz//11.11.14−90.4[36]
HJ-8//11.01.04−53.78
HJ-9//10.30.34−68.06
HJ-10//10.70.74−57.76
HJ-16//11.91.94−44.07
BaijintaiziBJ-1Qtz//7.9−2.61−47.79[36]
BJ-2//10.60.09−49.73
BJ-3//12.31.79−39.13
BJ-4//14.74.19−54.78
HuangjinpingHJP-3Qtz//12.03.04−52.61[36]
HJP-14//12.53.54−108.23
HJP-20//12.63.64−63.59
YanzigouB10QtzIII//5.07−46.78[37]
B13III//3.95−48.44
B14I//9.28−40.32
B15I//9.95−43.02
B41II//6.97−42.86
B46II//6.12−43.55
Xinjintaizi/QtzII//8.89−66.5[38]
/II//8.49−68.3
/II//7.29−63.5
/II//10.89−67.7
/V//9.16−85.5
Lianhuataizi/QtzII//9.81−66.8[38]
/II//10.61−64.8
/II//9.01−68.3
Equation for calculating δ18OH2O: 1000lnαquartz-water = 3.38 × 10⁶/(273.15 + th)2 − 3.40 [20]. (Base diagram after Clayton et al. [20]; data for other deposits from Luo et al. [32], Ge and Chen [33], Chen et al. [34], Teng et al. [35], Li et al. [36], Hou et al. [37], and Li HB et al. [38]).
Table 4. Summary of C-H-O isotopic compositions of the Dulanggou gold deposit, Danba, Sichuan Province.
SampleHost MineralStageth/°Cδ18OV-SMOW/‰δ18OH2O/‰δDV-SMOW/‰
4150-1-007QtzEarly339.413.46.19−78.9
4150-1-00813.76.53−80.4
3830-16-1413.66.43−96.4
3830-1-7QtzMain269.614.06.91−75.1
3830-1-6269.613.96.83−104.3
4150-1-13269.612.85.75−76.7
3730PM14-2269.612.45.32−85.1
4113-1269.614.27.13−80.5
4113-2269.613.56.45−70.6
Disclaimer/Publisher’s Note: The statements, opinions and data contained in all publications are solely those of the individual author(s) and contributor(s) and not of MDPI and/or the editor(s). MDPI and/or the editor(s) disclaim responsibility for any injury to people or property resulting from any ideas, methods, instructions or products referred to in the content.