Article

Impact of Mining Methods and Mine Types on Heavy Metal (Loid) Contamination in Mine Soils: A Multi-Index Assessment

1
Provincial-Ministerial Collaborative Innovation Center for Green Development of Mineral Resources and Ecological Restoration in Xinjiang, Urumqi 830046, China
2
Coal Mining and Designing Department, Tiandi Science and Technology Co., Ltd., Beijing 100013, China
3
CCTEG Coal Mining Research Institute, Beijing 100013, China
4
Department of Applied Ecology, Saint Petersburg State University, 199178 Saint Petersburg, Russia
*
Authors to whom correspondence should be addressed.
Minerals 2025, 15(9), 986; https://doi.org/10.3390/min15090986
Submission received: 3 August 2025 / Revised: 5 September 2025 / Accepted: 14 September 2025 / Published: 16 September 2025

Abstract

Mining activities caused heavy metal enrichment in mine soils. Sixty-six soil samplings of 26 mines in the central Tianshan Mountains of China were conducted to reveal heavy metal pollution for the single-factor (Pi), Nemerow comprehensive pollution (PN), geo-accumulation (Igeo), potential ecological risk (Ei), and health risks. The results indicate that mines in Bayingolin and Aksu exhibit the most severe pollution (PN = 26.64 and 25.28), characterized by Cd (Pi = 115.18) and As (Pi = 67.20), forming a Cd-As compound pattern. While Ili mines show Ni-Cu co-exceedance, and Turpan mines have lower overall pollution but localized Cd enrichment. Additionally, Cd is identified as the most severe by Igeo, with moderate or higher pollution levels observed in 61.00% of samplings. The Ei assessment revealed that Cd posed the greatest threat, with 100%, 53.80%, and 30.70% of samplings indicating slight, high, and extremely high ecological risk levels, respectively. Health risk assessment indicated that non-carcinogenic risks were dominated by Cr (affecting 19.20% of samplings), while carcinogenic risks were primarily from As (7.70%) and Cd (11.50% of samplings), with Cr exhibiting the highest carcinogenic risk. Furthermore, comparative analysis showed that underground mines led to higher pollution levels (Igeo) for Cd, Cu, Mn, Pb, and Zn compared to open-pit mines, and metal mines incurred greater heavy metal(loid) contamination than non-metal mines. These findings could provide data for mine soil pollution remediation in the central Tianshan Mountains.

Graphical Abstract

1. Introduction

Soil, as a fundamental natural resource underpinning agricultural production, ecosystem stability, and human livelihood, is of paramount importance [1]. Studying soil pollution is therefore critical for ensuring food security, maintaining ecological balance, and safeguarding public health, making it a research area of global significance. This threat is predominantly driven by persistent and toxic contaminants, notably heavy metals and metalloids (collectively termed heavy metal(loid)s), which originate from both natural sources, such as geological weathering, and anthropogenic activities [2].
Among anthropogenic sources, mining operations are a major contributor to global soil contamination. During open-pit mining, ore processing, and tailings storage, heavy metal(loid)s are released and transported through surface runoff, atmospheric dust dispersion, and biogeochemical cycles, leading to their accumulation in surrounding soils. This contamination triggers severe ecological degradation, including vegetation destruction, water and soil erosion, loss of biodiversity, and long-term ecosystem damage [3,4]. Concurrently, it poses a direct threat to human health as heavy metal(loid)s enter the human body through inhalation of dust, ingestion of contaminated food and water, and dermal contact, potentially causing carcinogenic effects, neurotoxicity, and functional failure of vital organs [5,6].
Global assessments indicate that over 60% of mining areas exhibit excessive concentrations of hazardous elements like Cd and As [7,8]. The problem is particularly acute in China, a country with extensive mining activities, where soil contamination around mines has become a pressing environmental issue [9,10]. In arid and semi-arid regions such as the Tianshan Mountains, the situation is exacerbated by high evaporation rates and limited leaching, resulting in the accumulation of pollutants in topsoil and creating persistent ecological hazards [11]. The Tianshan Mountains in China form a pivotal metallogenic belt in Central Asia, rich in metallic resources such as copper, nickel, zinc, and gold, along with non-metallic minerals, making this region a key strategic mineral reserve [12]. While large-scale mining has spurred economic growth, it has also caused the aforementioned regional ecological degradation and health risks [13].
Since the 1980s, mining-derived heavy metal pollution has intensified. Current research on contaminated mine soils shows substantial advances in characterizing pollution patterns, developing remediation techniques, and assessing ecological risks. Field studies and experiments have elucidated the distribution and contamination levels of heavy metal(loid)s in mine soils, which are defined as surface soils within operational mining leases disturbed by excavation and waste disposal activities, and are evaluated as construction land for risk assessment purposes. For example, Lin Jin et al. studied farmland soils surrounding Tongguan County, China, revealing that the average content of heavy metal(loid)s in local soils exceeded the background values, with distinct accumulation patterns observed across different elements [14]. Zhong et al. selected 420 soil samples from 58 typical metal mines in Eastern China as research subjects and analyzed the total and available concentrations of heavy metal(loid)s in soils. Significant Cd and As pollution has been identified in South China and Northeast regions, with their total concentrations and ecological risks being particularly elevated due to metal mining and smelting activities [15]. Although current research on heavy metal pollution in mine soils has achieved notable pollution characteristics, remediation technologies, and ecological risk assessment, certain deficiencies remain. For instance, while numerous studies have revealed the distribution patterns and pollution levels of heavy metal(loid)s in mine soils [16,17], there is a lack of the effect of different mineral types and mining methods on soil heavy metal pollution distribution characteristics at large scales. The distribution of mine types and mining methods exhibits regional characteristics, with heavy metal pollutants dispersing across different regions through atmospheric and water flows [18]. The above-mentioned study, confined to a single area, cannot comprehensively reflect regional heterogeneity, whereas multi-regional investigations integrating diverse mine types and mining methods are critical for deciphering pollution sources, migration pathways, and dispersion scopes at the landscape scale.
Significant achievements have been made in the study of heavy metal(loid)s in mine soils in Xinjiang, China. Spatial distribution patterns of soil heavy metal(loid)s in open-pit coal mines were analyzed by GIS [19]. Similarly, the spatial characteristics of four heavy metal(loid)s were investigated to examine concentrations at various distances and elevations in the Wucaiwan open-pit mines of Eastern Junggar Coalfield of Xinjiang [20]. Monitoring of heavy metal contamination in soils of open-pit mines in Xinjiang predominantly focuses on single-scale mining areas [21]; However, large-scale mines, abandoned sites, and remote locations remain inadequately surveyed. This limitation prevents a comprehensive understanding of the overall soil heavy metal pollution in the mines of Xinjiang, potentially overlooking contaminated areas. Therefore, the above research has concentrated on coal open-pit mines, with relatively little investigation on non-coal mines and underground mining operations.
The aims of study are (1) to analyze the concentration characteristics and spatial distribution patterns of heavy metal (As, Cd, Cr, Cu, Ni, Pb, Mn, and Zn) in mine soils of the Central Tianshan Mountains (CTM) of China; (2) to evaluate the pollution and risk levels of soil heavy metal(loid)s; (3) to reveal potential threats to human health and ecosystems; and (4) to compare the impacts of different mining methods (open-pit mines and underground mines) and types (metal mines and non-metal mines) on heavy metal concentrations in mine soils. These research findings are expected to provide data supporting precise soil pollution remediation in the mining areas of the CTM.

2. Materials and Methods

2.1. Materials

2.1.1. Overview of the Study Area

The study area is located in the CTM in Xinjiang, China (Figure 1a), with sampling points distributed across four regions: Ili Kazakh Autonomous Prefecture (Ili), Bayingolin Mongol Autonomous Prefecture (Bazhou), Aksu Prefecture (Aksu), and Turpan City (Turpan). The Ili River Valley features a humid continental mid-temperate climate with abundant but spatially and temporally uneven precipitation. Aksu has an annual average temperature of 7–8 °C, with extreme temperatures ranging from 40.7 °C to −27.6 °C, characterized by concentrated summer precipitation but insufficient total rainfall. Turpan experiences an arid desert climate, with extremely high temperatures, high day-night temperature variations, and low precipitation due to its basin topography. The Bazhou has an annual average temperature of 10.5–11.7 °C, with extremely high temperatures reaching 40.4 °C.
The distribution of mines in Aksu, Bazhou, Turpan, and Ili exhibits resource diversity and regional differences. Turpan City contains 3 mines, primarily using open-pit mining methods (sand mines and granite mines), with only copper mines employing underground mining. Bazhou has 7 mines, with mineral types including andalusite, iron ore, potassium salt, asbestos, zinc-iron, and salt mines. Mining methods are predominantly open-pit (6 sites), with only zinc-iron mines using underground mining; Bazhou iron mines utilize hybrid mining systems. Ili has a complex mining pattern of multiple mineral resources (14 sites), featuring copper, construction materials, gypsum, iron, gold, and other minerals. Mining methods are diverse: open-pit mining dominates (8 sites), while underground mining accounts for 3 sites and combined mining for 2 sites. There are 2 mines in Aksu: Dishui Copper Mine, which employs a combination of open-pit and underground mining, and Yinfeng Salt Mine, which uses underground mining. Therefore, open-pit mining prevails as the main development mode, where metal mines (copper, iron, and gold) coexist with non-metal mines (construction materials, salt, gypsum, etc.).

2.1.2. Soil Sampling and Processing

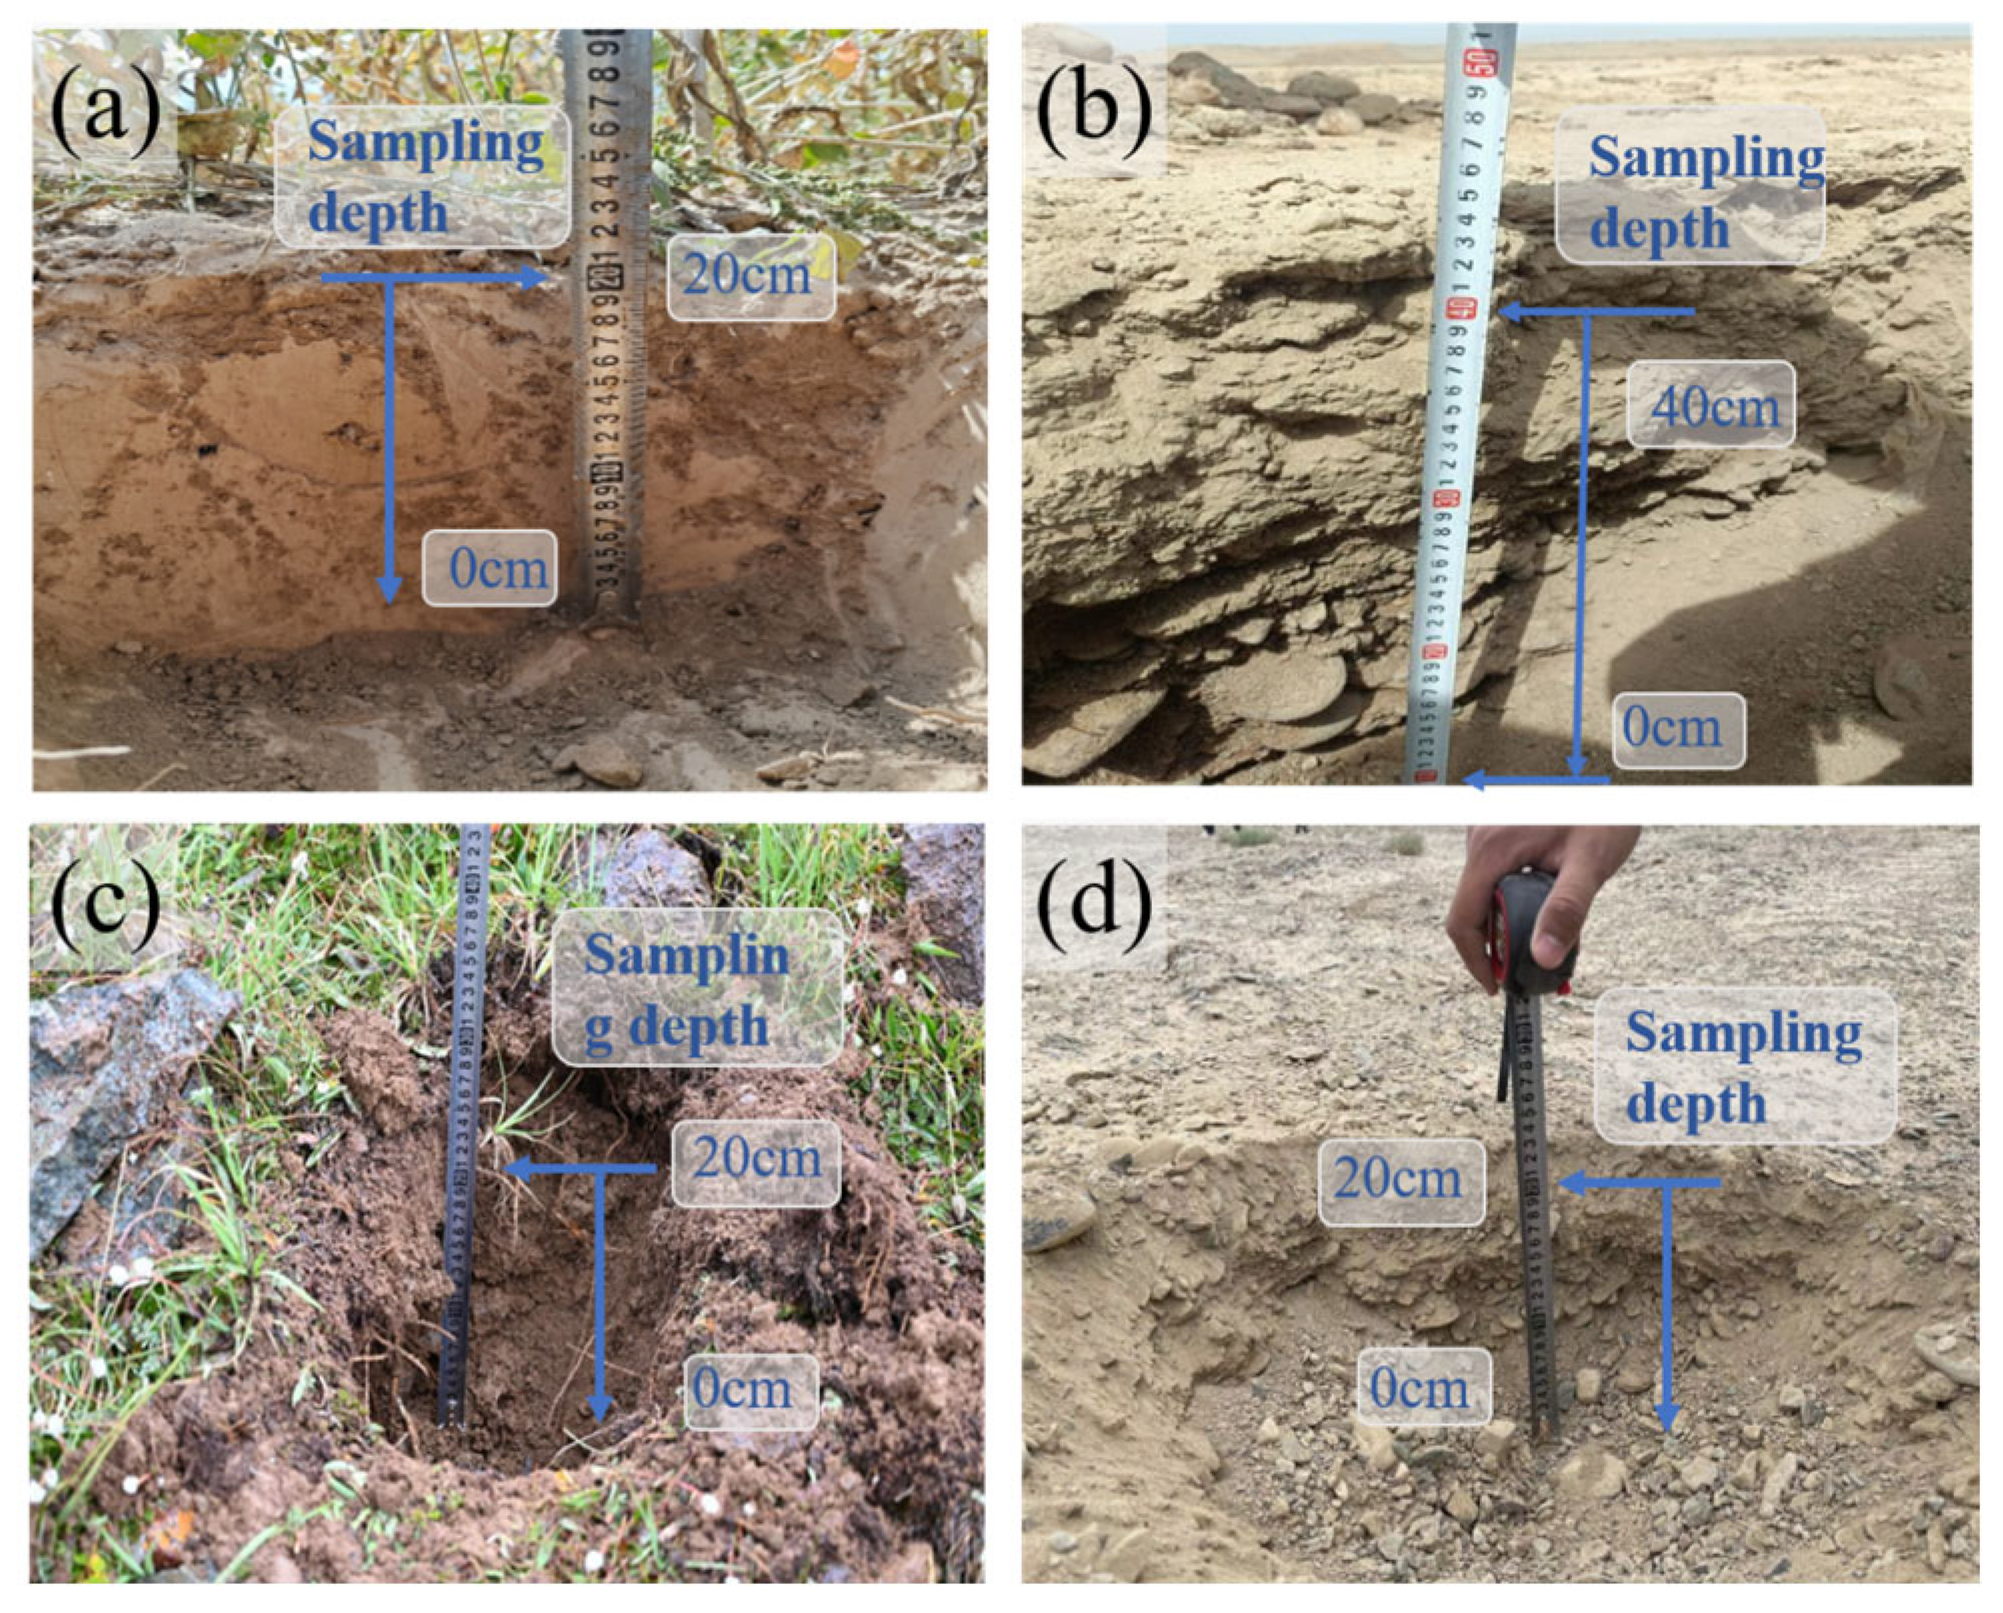
Sixty-six mine soil samples were collected from 26 mines (Table S1), with the sampling distributions and heavy metal concentrations in mine soils shown in Figure 1b. All soil samples were collected within the boundaries of the mining leases to directly evaluate the impact of mining operations on local soil quality. The sampling depth was 0–20 cm [22], and the soil sampling process and soil profiles from different regions are shown in Figure 2. The collected soil samples were sieved to remove branches and gravel, homogenized, air-dried at room temperature, crushed, and sieved again [23,24]. The soil samples were then digested with a typical concentrated acid mixture, and the digested soil solutions were analyzed using inductively coupled plasma atomic emission spectroscopy (ICP-MS, NexION 1000G, PerkinElmer, Waltham, MA 02451, USA). For quality assurance and control, certified reference material (GBW07405/GSS-5), procedural blanks, and sample duplicates were included in each analytical batch, yielding spike recovery rates of 92%–105% for all elements, relative standard deviations below 5% in replicates, and method detection limits ranging from 0.01 μg/L (Cd) to 0.8 μg/L (Cr) [25,26].

2.2. Methods

2.2.1. Single Factor Pollution Index

The Single Factor Pollution Index (Pi) is a dimensionless indicator used to evaluate soil and crop pollution levels or soil environmental quality grades. This index can effectively reflect the pollution degree of various elements [27], as follows in Equation (1):
P i = C i / B i
where P i is the environmental pollution index of the i-th element in soil, with the evaluation criteria shown in Table S3; C i is the measured environmental content of the i-th element in soil, with detection results presented in Table 1; and B i is the soil background values of the i-th pollutant element in Xinjiang, as shown in Table S2 [28].

2.2.2. Nemerow Comprehensive Pollution Index

The Nemerow comprehensive pollution index simultaneously considers both the maximum and average values of single-factor pollution indices, providing a more specific reflection of environmental quality while highlighting the effects of heavily polluting substances [29,30]. The comprehensive pollution index is calculated as follows in Equation (2):
P N = ( P m a x 2 + P a v e 2 ) / 2
where P N represents the Nemerow comprehensive pollution index; P m a x and P a v e denote the maximum and average values of the Pi for a specific heavy metal element, respectively. The evaluation criteria are presented in Table S3.

2.2.3. Geo-Accumulation Index

In 1969, German scientist Müller proposed I g e o , which accounts for background values and quantifies soil heavy metal pollution levels. This index has been widely applied in sediments and soil trace elements [31,32]. I g e o has analyzed heavy metal contamination levels in mine soils, as follows in Equation (3):
I g e o = log 2 [ C i / N × B i ]
where I g e o is the geo-accumulation index, with classification standards detailed in Table S3; N is the fluctuation coefficient, typically set at 1.5 to account for differences caused by regional geology [33,34].

2.2.4. Potential Ecological Risk Index

The potential ecological risk index (Ei) integrates ecological risk potential factors for eight heavy metal(loid)s while considering their different toxicological properties [35,36]. Ri quantifies potential ecological risk levels, as follows in Equations (4)–(6):
R i = i = 1 n E i
E i = T i × f i
f i = C i / B i
where E i represents the Ri for each heavy metal, with classification standards shown in Table S3; T i is the metal toxicity coefficient, where the assigned values are 2, 1, 5, 5, 1, 10, 30, and 5 for Cr, Mn, Ni, Cu, Zn, As, Cd, and Pb, respectively [37].

2.2.5. Health Risk Index

Evaluating both carcinogenic risks (CR) and non-carcinogenic risks (NCR) based on soil pollutant exposure levels and toxicity effects provides a rapid assessment of health risks associated with soil pollutants [38,39]. Adult males were focused on as the subjects for health risk assessment in the study area [40,41].
  • Non-carcinogenic risk
Cr, Mn, Cu, Zn, As, Cd, Pb, and Ni are associated with non-carcinogenic risks to humans (Mn lacks an RfD). The hazard quotient ( H Q ) and hazard index are employed to assess NCR, as follows in Equations (7) and (8). The HQ is defined as the ratio of the chronic daily intake (actual exposure dose) to the toxicity threshold (dose RfD), with data sourced from Long et al. 2024 [42].
H Q = A D D t o t a l / R f D
A D D i n g = C × I R i n g × E F × E D × 10 6 / B W × A T
A D D i n h = C × I R i n h × E F × E D / B W × A T × P E F
A D D d e r = C × S A × A F × A B S × E F × E D × 10 6 / B W × A T
A D D t o t a l = A D D i n g + A D D i n h + A D D d e r
where R f D is the chronic reference dose of chemicals, based on USEPA 2011 and detailed in Table S5; A D D t o t a l refers to the average daily intake of heavy metal(loid)s by the human body, which is the sum of intakes through three main pathways that include oral ingestion ( A D D i n g ), respiratory inhalation ( A D D i n h ), and dermal contact ( A D D d e r ), each calculated via Equations (8)–(10), respectively, and integrated into Equation (11).
I R i n g is the average daily soil intake via oral ingestion; E F , E D , and A T are the exposure frequency, exposure duration, and average time of contact with contaminated soil, respectively; B W refers to the body weight of the exposed individual.
I R i n h is the average daily intake of soil dust via inhalation; P E F is the particulate emission factor; S A , A F , and A B S are the dermal exposure area, skin adherence factor, and dermal absorption coefficient, respectively. All parameter values were derived from the Chinese national standard HJ25.3-2019 [42].and are detailed in Table S6. For each element under different exposure pathways, an H Q greater than 1 indicates potential non-carcinogenic effects.
2.
Carcinogenic risk
C R is estimated by calculating the increased probability of an individual developing cancer over a lifetime due to exposure to potential carcinogens [43]. The slope factor directly converts the average daily intake of toxins over a lifetime into an incremental C R   for individuals [44]. In this study, Pb, Cu, Cr, As, Cd, and Ni exhibit dual risks of NCR and C R (except for others), as follows in Equations (12) and (13):
C R = A D D × S F
T C R = C R = C R o r a l + C R d e r m a l + C R i n h
where C R represents the unitless probability of an individual developing cancer over a lifetime, and S F is the carcinogenic slope factor, also derived from USEPA 2011 [42].and detailed in Table S5. The T C R between 1 × 10⁻⁶ and 1 × 10⁻⁴ is considered to be within an acceptable range [45], while a T C R > 1 × 10⁻⁴ indicates a significant risk to human health.

3. Results

3.1. Assessment of Single-Factor Pollution Index

Pi reveals (Table S4) that heavy metal contamination exhibits significant multi-element accumulation characteristics and spatial differentiation patterns in the mining area of CTM. Pi shows that the proportion of pollution samplings for each element follows: Cd > Ni > Pb > Zn > As > Cu > Cr, with Ni and Pb being pollutants with a more widespread spatial distribution. Although Cd has the highest proportion of sites, its pollution intensity varies regionally.
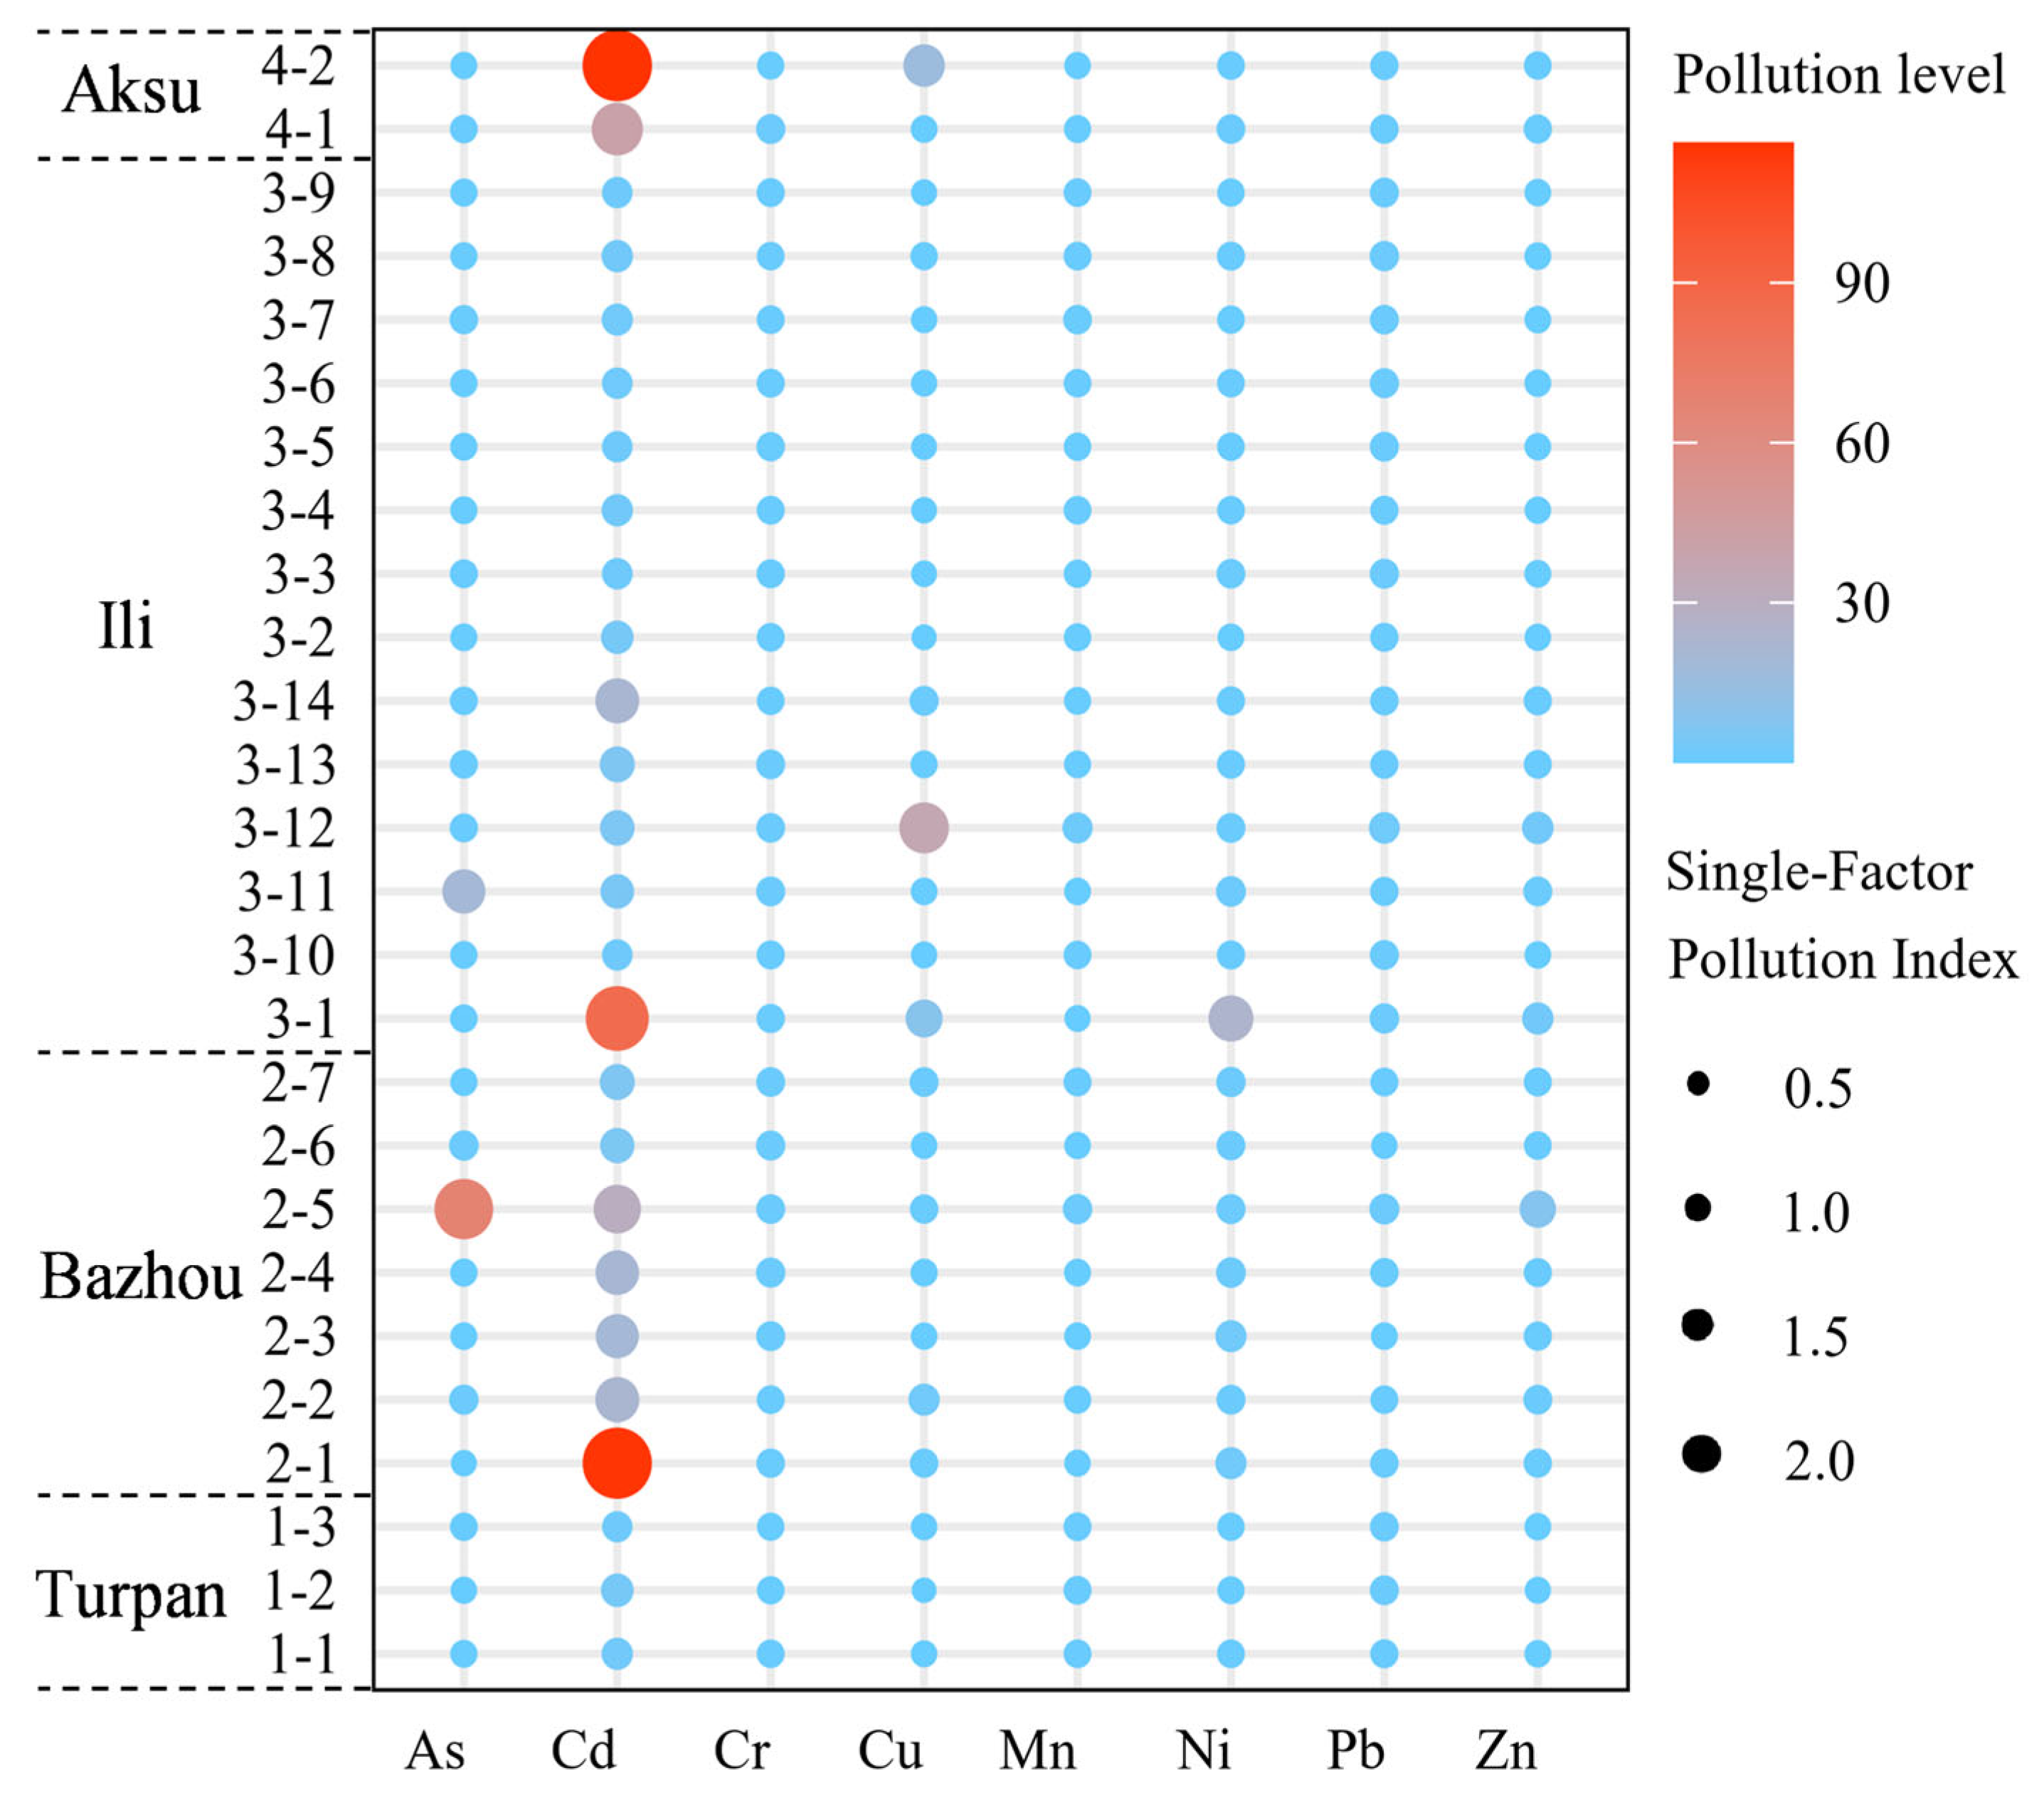
The average ranking of Pi indices is Cd > Cu > Ni > As > Zn > Pb > Cr, with the mean value of Cd far exceeding others, consistent with findings from other studies [46]. Aksu and Bazhou represent the core pollution areas, with a maximum value as high as 116.18 in waste dumps (Aksu site 4-2), indicating that mining and smelting waste dumps serve as the main pollution sources. Based on Pi and the spatial distribution of mining areas (Figure 3), soil heavy metal pollution exhibits significant regional differentiation and element-specific accumulation characteristics. Pi shows that elements such as As, Cd, Cu, and Ni demonstrate significant differences in pollution levels across different mining areas, with Cd and Cu identified as the dominant pollutants in the region.
Heavy metal content in the CTM (Table 1) shows that Cd, As, Cu, and Ni are the primary pollutants, with average concentrations of 2.44, 43.37, 74.13, and 49.64 mg·kg−1, respectively. The above-mentioned pollution levels are 20.33, 3.87, 2.78, and 1.87 times higher than background concentrations. The pollution severity is Cd > As > Cu > Ni. While the average Pb concentration (19.47 mg·kg−1) slightly exceeds the background value, 42.31% of the samplings surpass the standard, indicating a risk of enrichment in certain areas.
From a spatial distribution perspective, Cd is most widespread, with all samplings exceeding background values, followed by Ni (46.15%) and Cu (23.08%). According to the “Soil Environmental Quality Risk Control Standard for Soil Contamination of Development Land” (GB 36600-2018) Standard I (Table 1) [47], average As concentration exceeds the standard by 2.17 times, with high-value sites (752.64 mg·kg−1) from Bazhou (2-5) reaching 37.63 times, and 7.69% of samples exceeding Standard I. The average Cd concentration is exceeded by 4.07 times, with samples from Yili 3-11 (10.24 mg·kg−1) and Bazhou 2-5 (13.82 mg·kg−1) reaching 17.07 and 23.03 times, respectively, indicating significant anthropogenic interference near mining areas.

3.2. Assessment of Nemerow Comprehensive Pollution Index

The PN for each region is presented in Table S4, which further highlights the variation in pollution levels: (1) 100% of the sampling sites have PN > 1, indicating pollution in all areas, with 34.62% experiencing light pollution, 11.54% moderate pollution, and 46.15% severe pollution; (2) Cd and Ni significantly contribute to PN. The Aksu 4-2 sample (83.02) and Bazhou 2-1 sample (82.15) are the most severe pollution samples, both reaching heavy pollution levels, with Cd being the predominant heavy metal contributor in both cases.
In terms of spatial distribution (Figure 4), (1) Turpan (PN = 1.46~2.68) and Ili (PN = 1.53~61.33) are characterized by light to moderate pollution, whereas Bazhou (PN = 3.92~82.15) and the Aksu region (PN = 4.78~83.02) show heavier pollution levels. (2) The PN values for the Turpan, Bazhou, Ili, and Aksu are 2.02, 26.24, 9.82, and 56.12, respectively. Except for Turpan, which is at a moderate pollution level, the other regions have all reached heavy pollution levels.

3.3. Assessment of Geo-Accumulation Index

The Igeo is ranked as follows in the mine soils of the CTM: Cd > Ni > Pb > Cr > As > Zn > Mn > Cu. The distribution of the above indices across the mining areas is illustrated in Figure 4. Samples 2-1, 2-2, 2-3, 2-4, 2-6, 2-7, 3-14, and 4-1 show Cd pollution. Sampling 3-1 shows composite pollution with Ni, Cu, and Cd, reaching levels from moderate to severe pollution. The Igeo for As in samples 2-5 and 3-11 are significantly higher than the regional background, while sample 4-2 shows concurrent enrichment of Cu and Cd.
Figure 5a shows that Cd has the most severe level, with an average Igeo of 2.33. Severe pollution accounts for 11.54% of Cd, while 61.54% of the samplings show Cd pollution reaching moderate or higher levels. The average Igeo for Ni is −0.61, with an extreme value of 3.99 observed in sampling 3-1, while 19.23% of sites range from no pollution to moderate pollution levels, and others are non-polluted. The average for As is −1.07, with high pollution accounting for 7.69%, and the remainder ranges from no pollution to moderate pollution. The average Igeo for Cu is −1.56, with 11.54% of sites experiencing pollution above moderate levels. Pollution levels for Cr, Pb, Mn, and Zn do not exceed moderate thresholds at any site.

3.4. Assessment of Ecological Risk

The distribution characteristics of Ei are as follows in mine soils (Figure 5b): (1) Cd > As > Cu > Ni > Pb > Cr > Zn > Mn; (2) the mean Ei of Cd is 610.77, indicating extremely high ecological risk. All samplings show at least slight Cd pollution, with 53.80% reaching high levels and 30.70% showing extremely high ecological risk. Regarding the distribution of Ei, all samplings for Cr, Mn, Pb, and Zn show slight ecological risk, while one sampling point (3.85%) each for Ni, As, and Cu shows considerable ecological risk. (3) The ecological risk was demonstrated to have extreme heterogeneity, with the Ri of Cd reaching extremely high-risk levels (Ei ≥ 3200) at samplings 2-1 (3455.40), 4-2 (3485.40), and 3-1 (2560.20), being 100 to 1000 times higher than others.
For the Ri, (1) Ri ranges from 0.59 to 610.77 for the eight heavy metal(loid)s, with soil samplings categorized as slight, moderate, considerable, high, and extremely high ecological risk accounting for 46.15%, 11.54%, 7.69%, 15.38%, and 19.23% of total samplings, respectively. The mean Ri is 680.99, indicating that heavy metal(loid)s lead to high ecological risk. (2) Regarding contributions to Ri, the eight heavy metal(loid)s rank as Cd > As > Cu > Ni > Pb > Cr > Zn > Mn. Notably, Cd contributes 89.70% to the total Ri, while the others collectively contribute only 10.30%. Therefore, Ri is predominantly attributable to Cd from heavy metal(loid)s in the mine soils of the study area.

3.5. Assessment of Health Risk Index

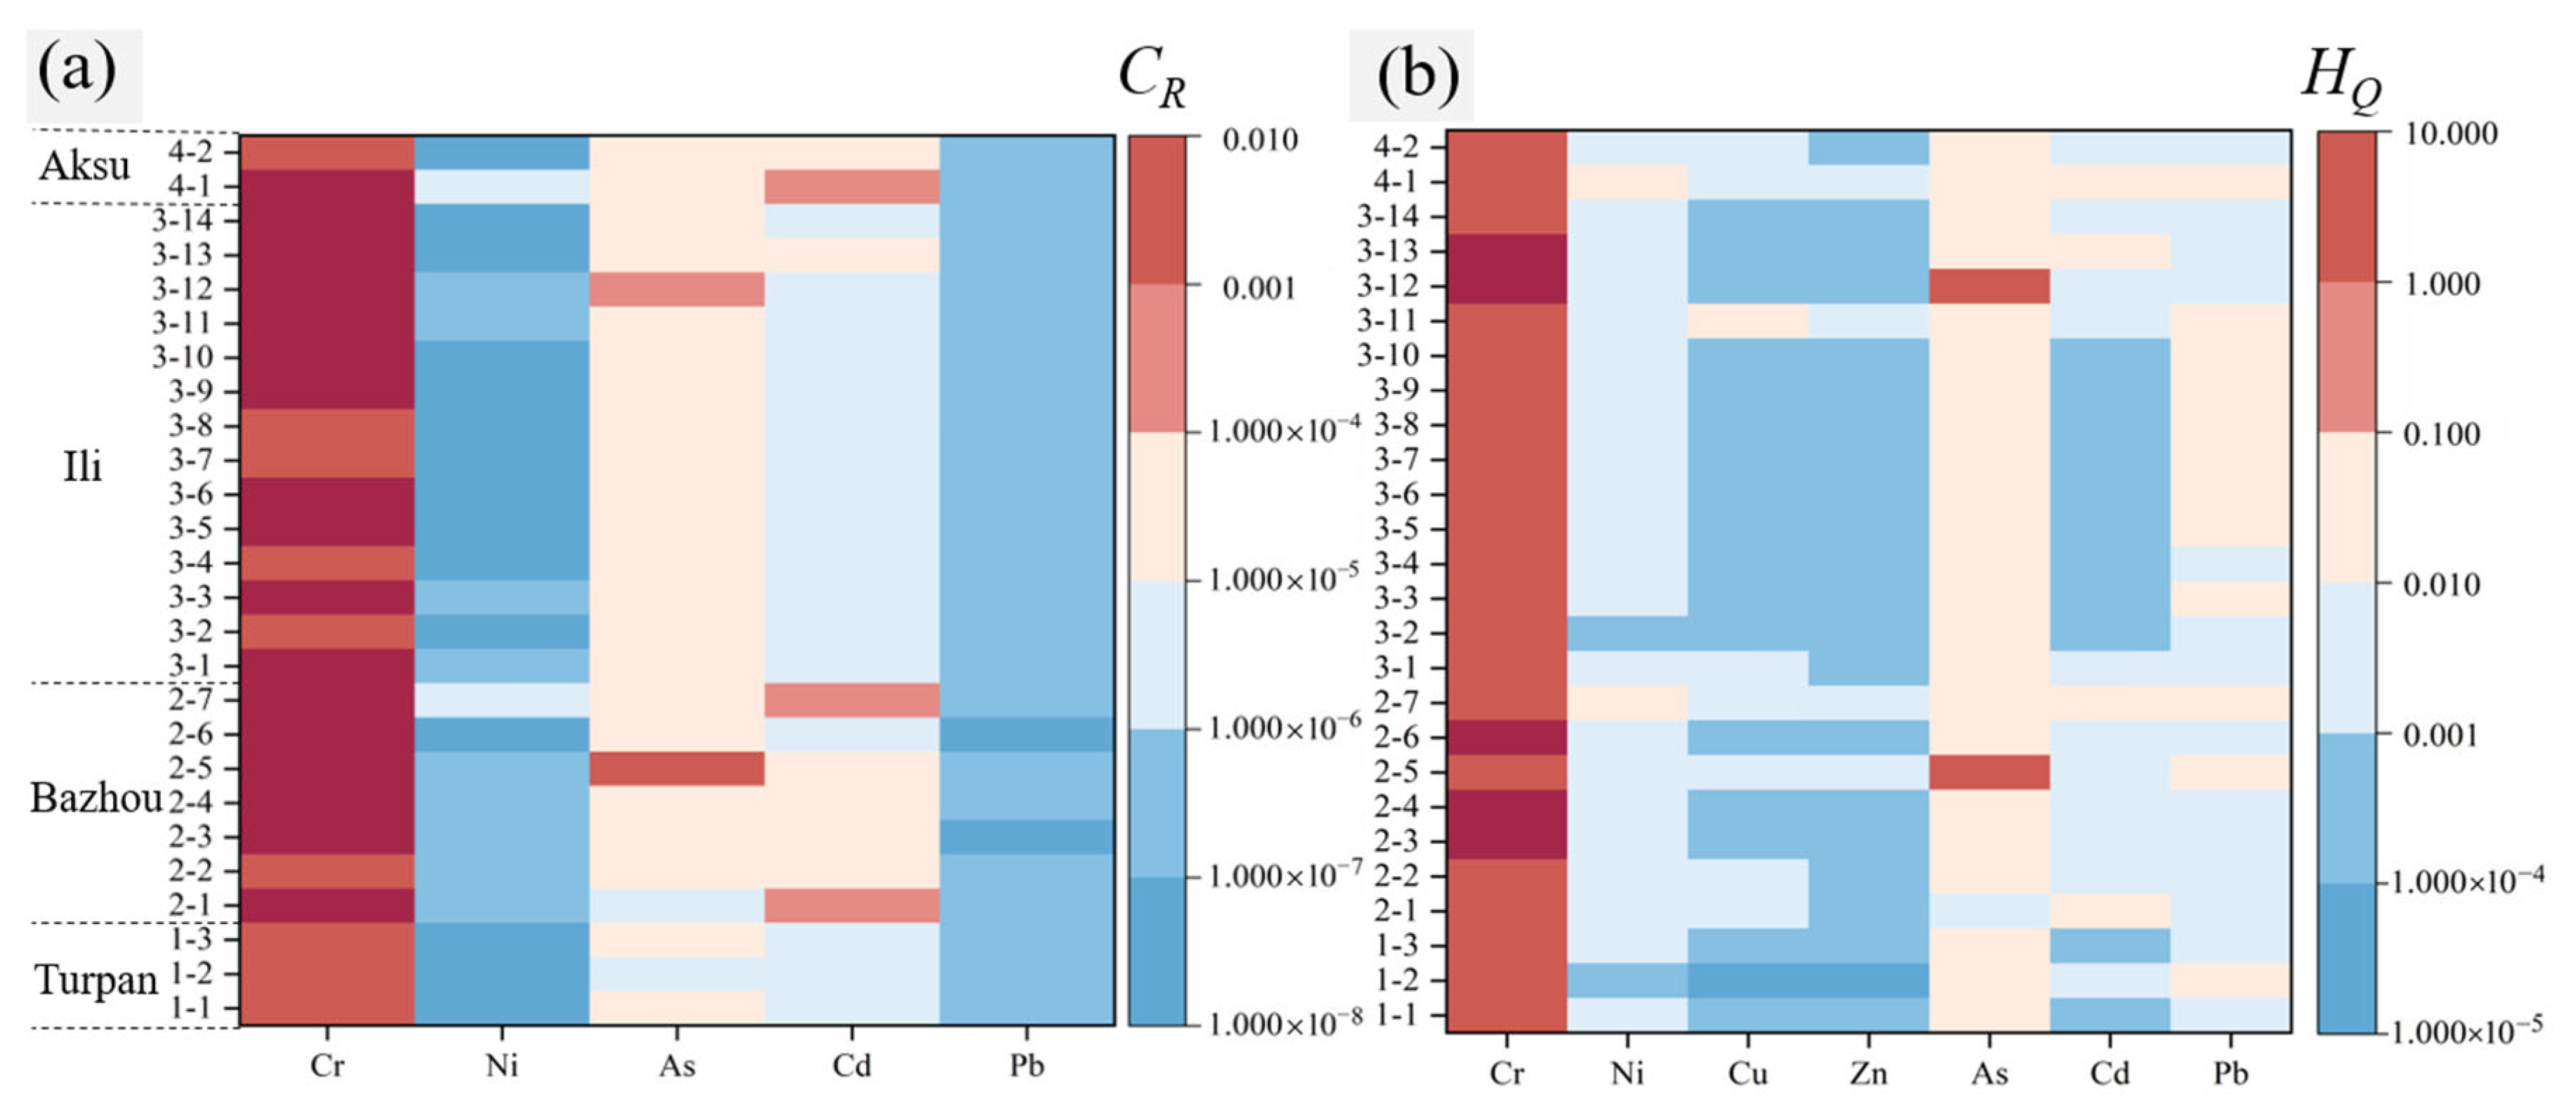
Soil concentrations of Pb, Cr, and As are elevated, resulting in higher human exposure probability to heavy metal(loid)s. Additionally, combined with their lower RfD, they contribute to the majority of NCR (Figure 6b). NCR indices for different heavy metal(loid)s are ranked as follows: (1) Cr > As > Pb > Cd > Ni > Cu > Zn. Among these, Cr and As present the highest NCR, with Cr contributing 34.61% to the NCR in mining areas of the CTM. (2) Relatively severe soil pollution is identified in mining areas 3-12 and 2-5 through regional analysis, with HQ exceeding 1 being observed for two heavy metal(loid)s. The residents in or near these mining areas may be at risk of NCR effects. (3) Cr posed NCR risks at 19.23% of the sampling sites, while As presented NCR risks at 7.69% of all sampling sites.
CR is associated with Pb, Cr, As, Cd, and Ni (Figure 6a). CR ranks as follows: (1) Cr > As > Cd > Ni > Pb. Cd, Cr, and As demonstrate high CR, with Cr presenting the highest risk, consistent with findings from numerous other studies [48]. (2) All sampling sites show CR from Cr, while 11.54% and 7.69% of the sites exhibited CR from Cd and As, respectively. (3) Furthermore, TCR for Cd in samples 2-1, 2-7, 4-1, and 4-2, as well as for As in samples 2-5 and 3-12, remain below the risk threshold, indicating no significant CR. (4) Similarly, CR for Pb and Ni across all study areas was consistently low, demonstrating negligible health concerns. Thus, CR assessment highlights Cr, As, and Cd as priority contaminants, with Cr exhibiting the highest risk, while Pb and Ni pose negligible threats, underscoring the need for targeted mitigation strategies in high-risk zones.

4. Discussion

4.1. Soil Heavy Metal Pollution of Different Mining Methods

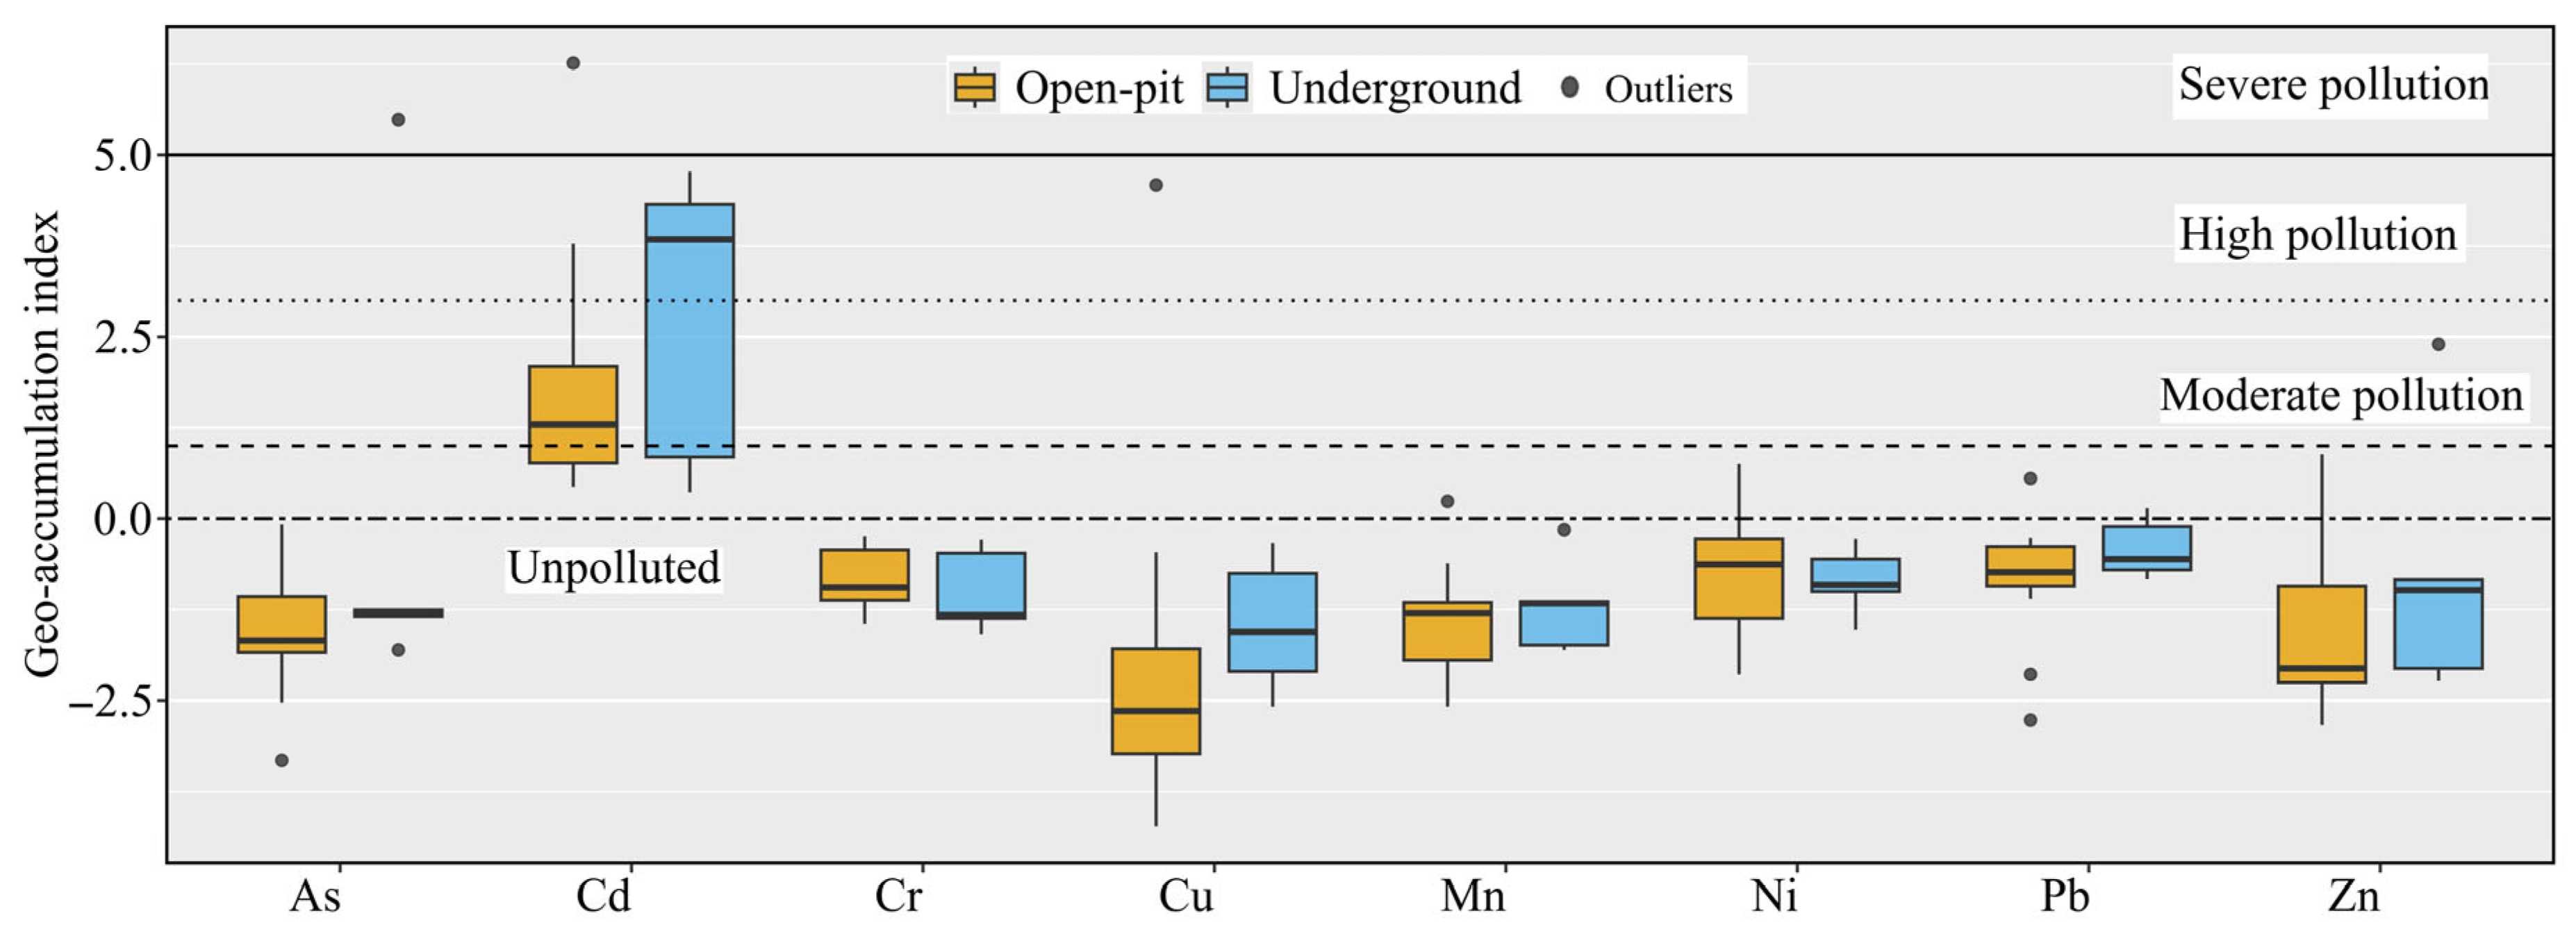
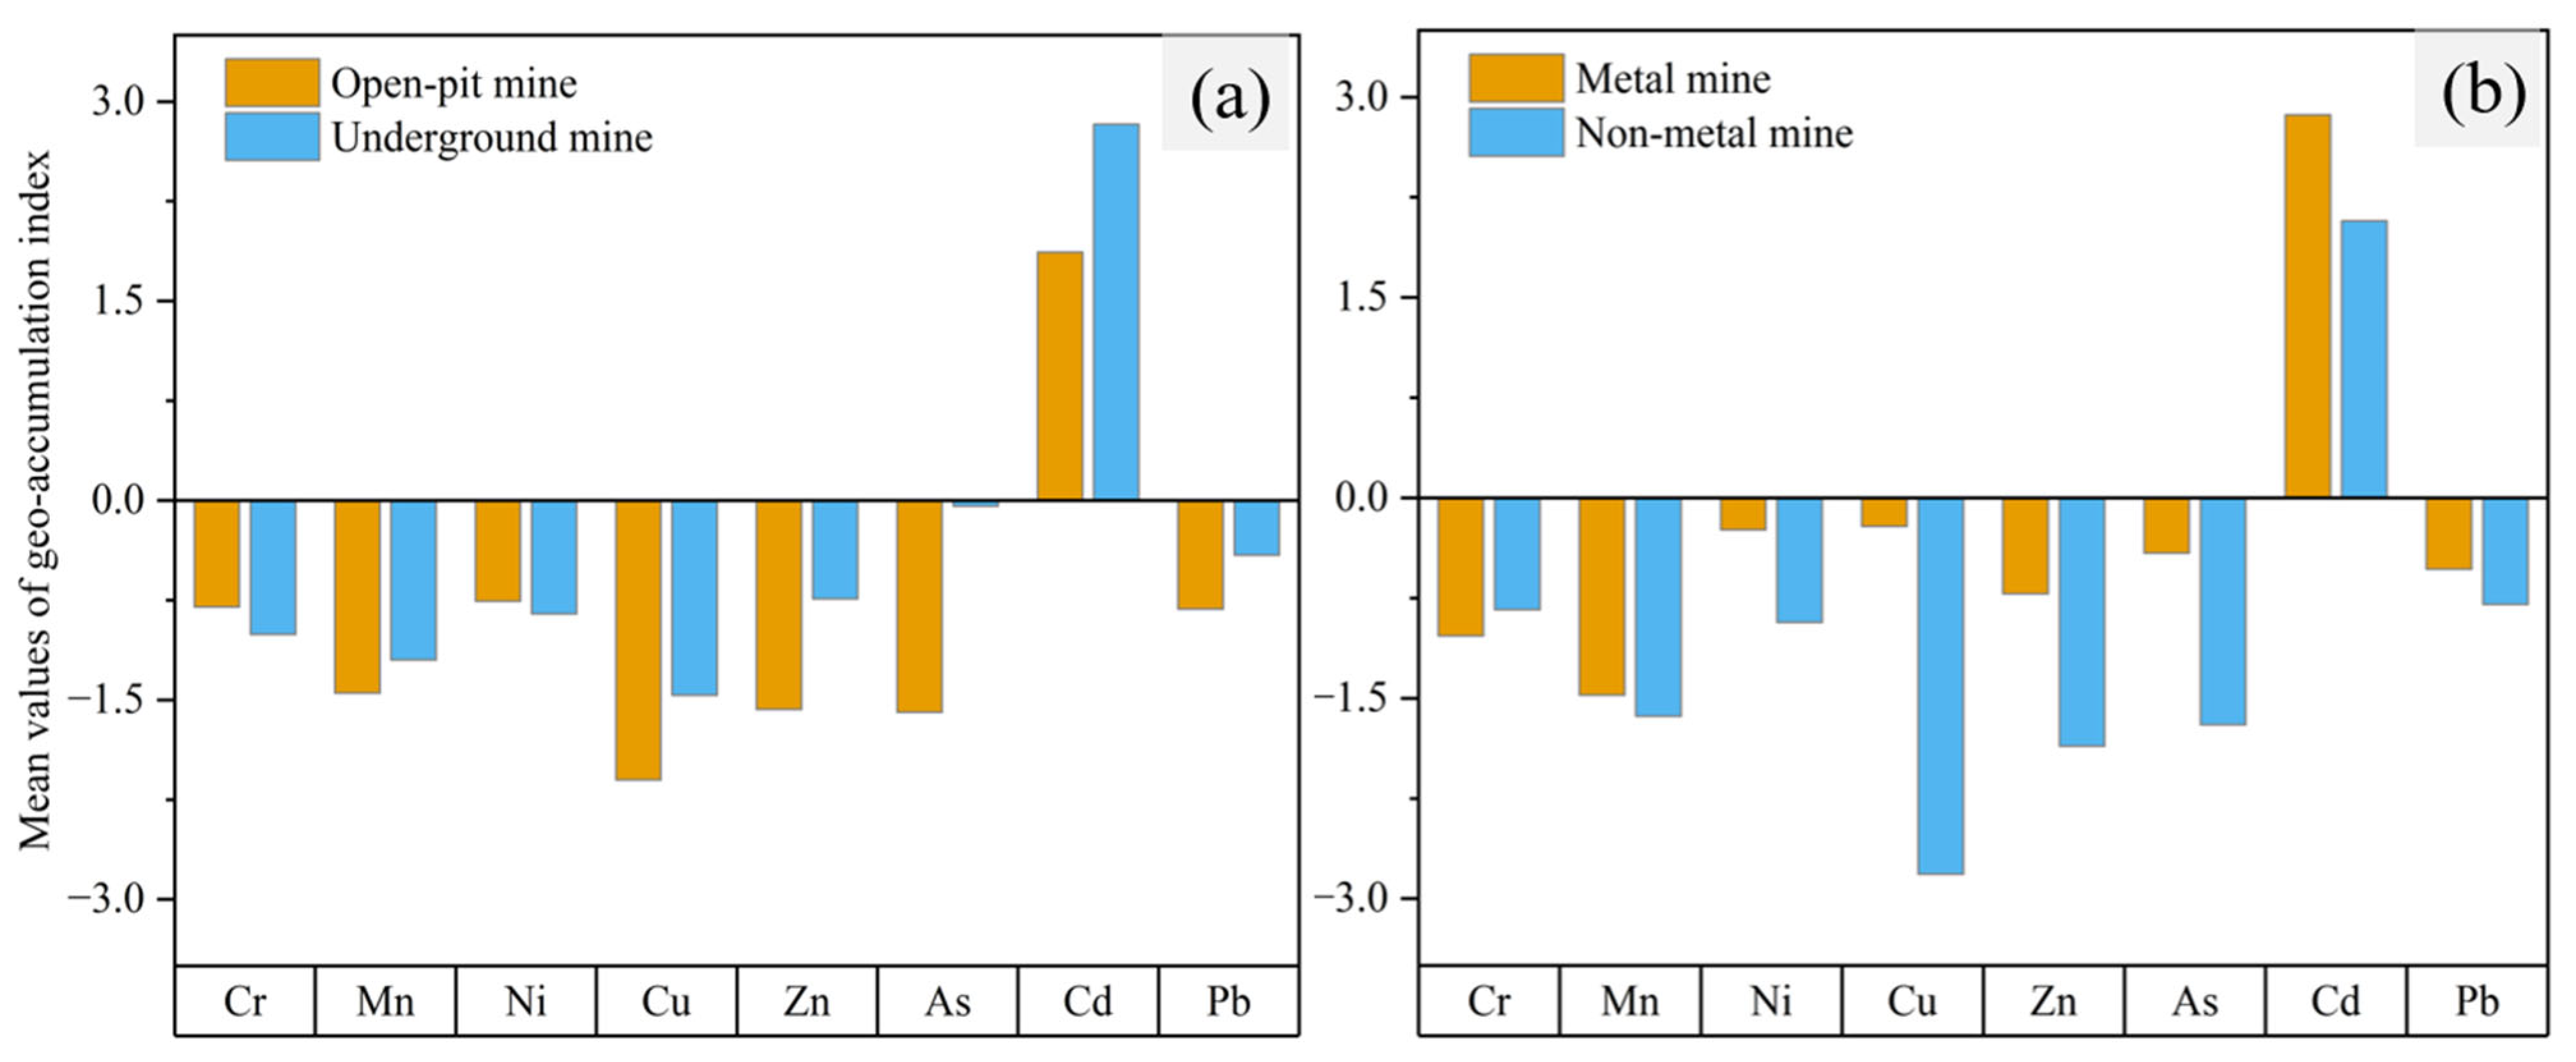
The Igeo values of soil heavy metal(loid)s according to different mining methods in the study area are shown in Figure 7 and Figure 8a. The Igeo values of Cd, Cu, Mn, Pb, and Zn in underground mines are higher than those in open-pit mines. Among these elements, Cd and Cu show the most significant differences between open-pit mine and underground mine soils, while the other three heavy metal(loid)s (Mn, Pb, and Zn) exhibit less significant variations.
The median Igeo of Cd in underground mines is higher than in open-pit mines (Figure 7), with a larger interquartile range and multiple high outliers, which indicates that underground mines lead to higher Cd pollution levels and are influenced by mining methods. For Cu, the median value in open-pit mines is lower than in underground mines, while the interquartile range of open-pit mines is wider, demonstrating distinct pollution characteristics between the two methods. For elements such as Cr, Mn, and Ni, although the median values are similar across both mining methods, the differences in interquartile ranges reflect varying impacts on Igeo. In addition, the mean Igeo values of Mn, Cu, Zn, As, Cd, and Pb in underground mines are higher than those in open-pit mines (Figure 8a). Notably, Cd exhibits the highest, confirming that Cd remains the primary pollutant, which aligns with the findings presented in Section 3.3 and Section 3.4.
In summary, significant differentiation exists between open-pit mines and underground mines regarding element enrichment, pollution levels, and spatial distribution. The pollution risk associated with Cd is prominent, and the impact of mining methods on Cd pollution demonstrates the greatest variation.

4.2. Soils Heavy Metal Pollution of Different Mine Types

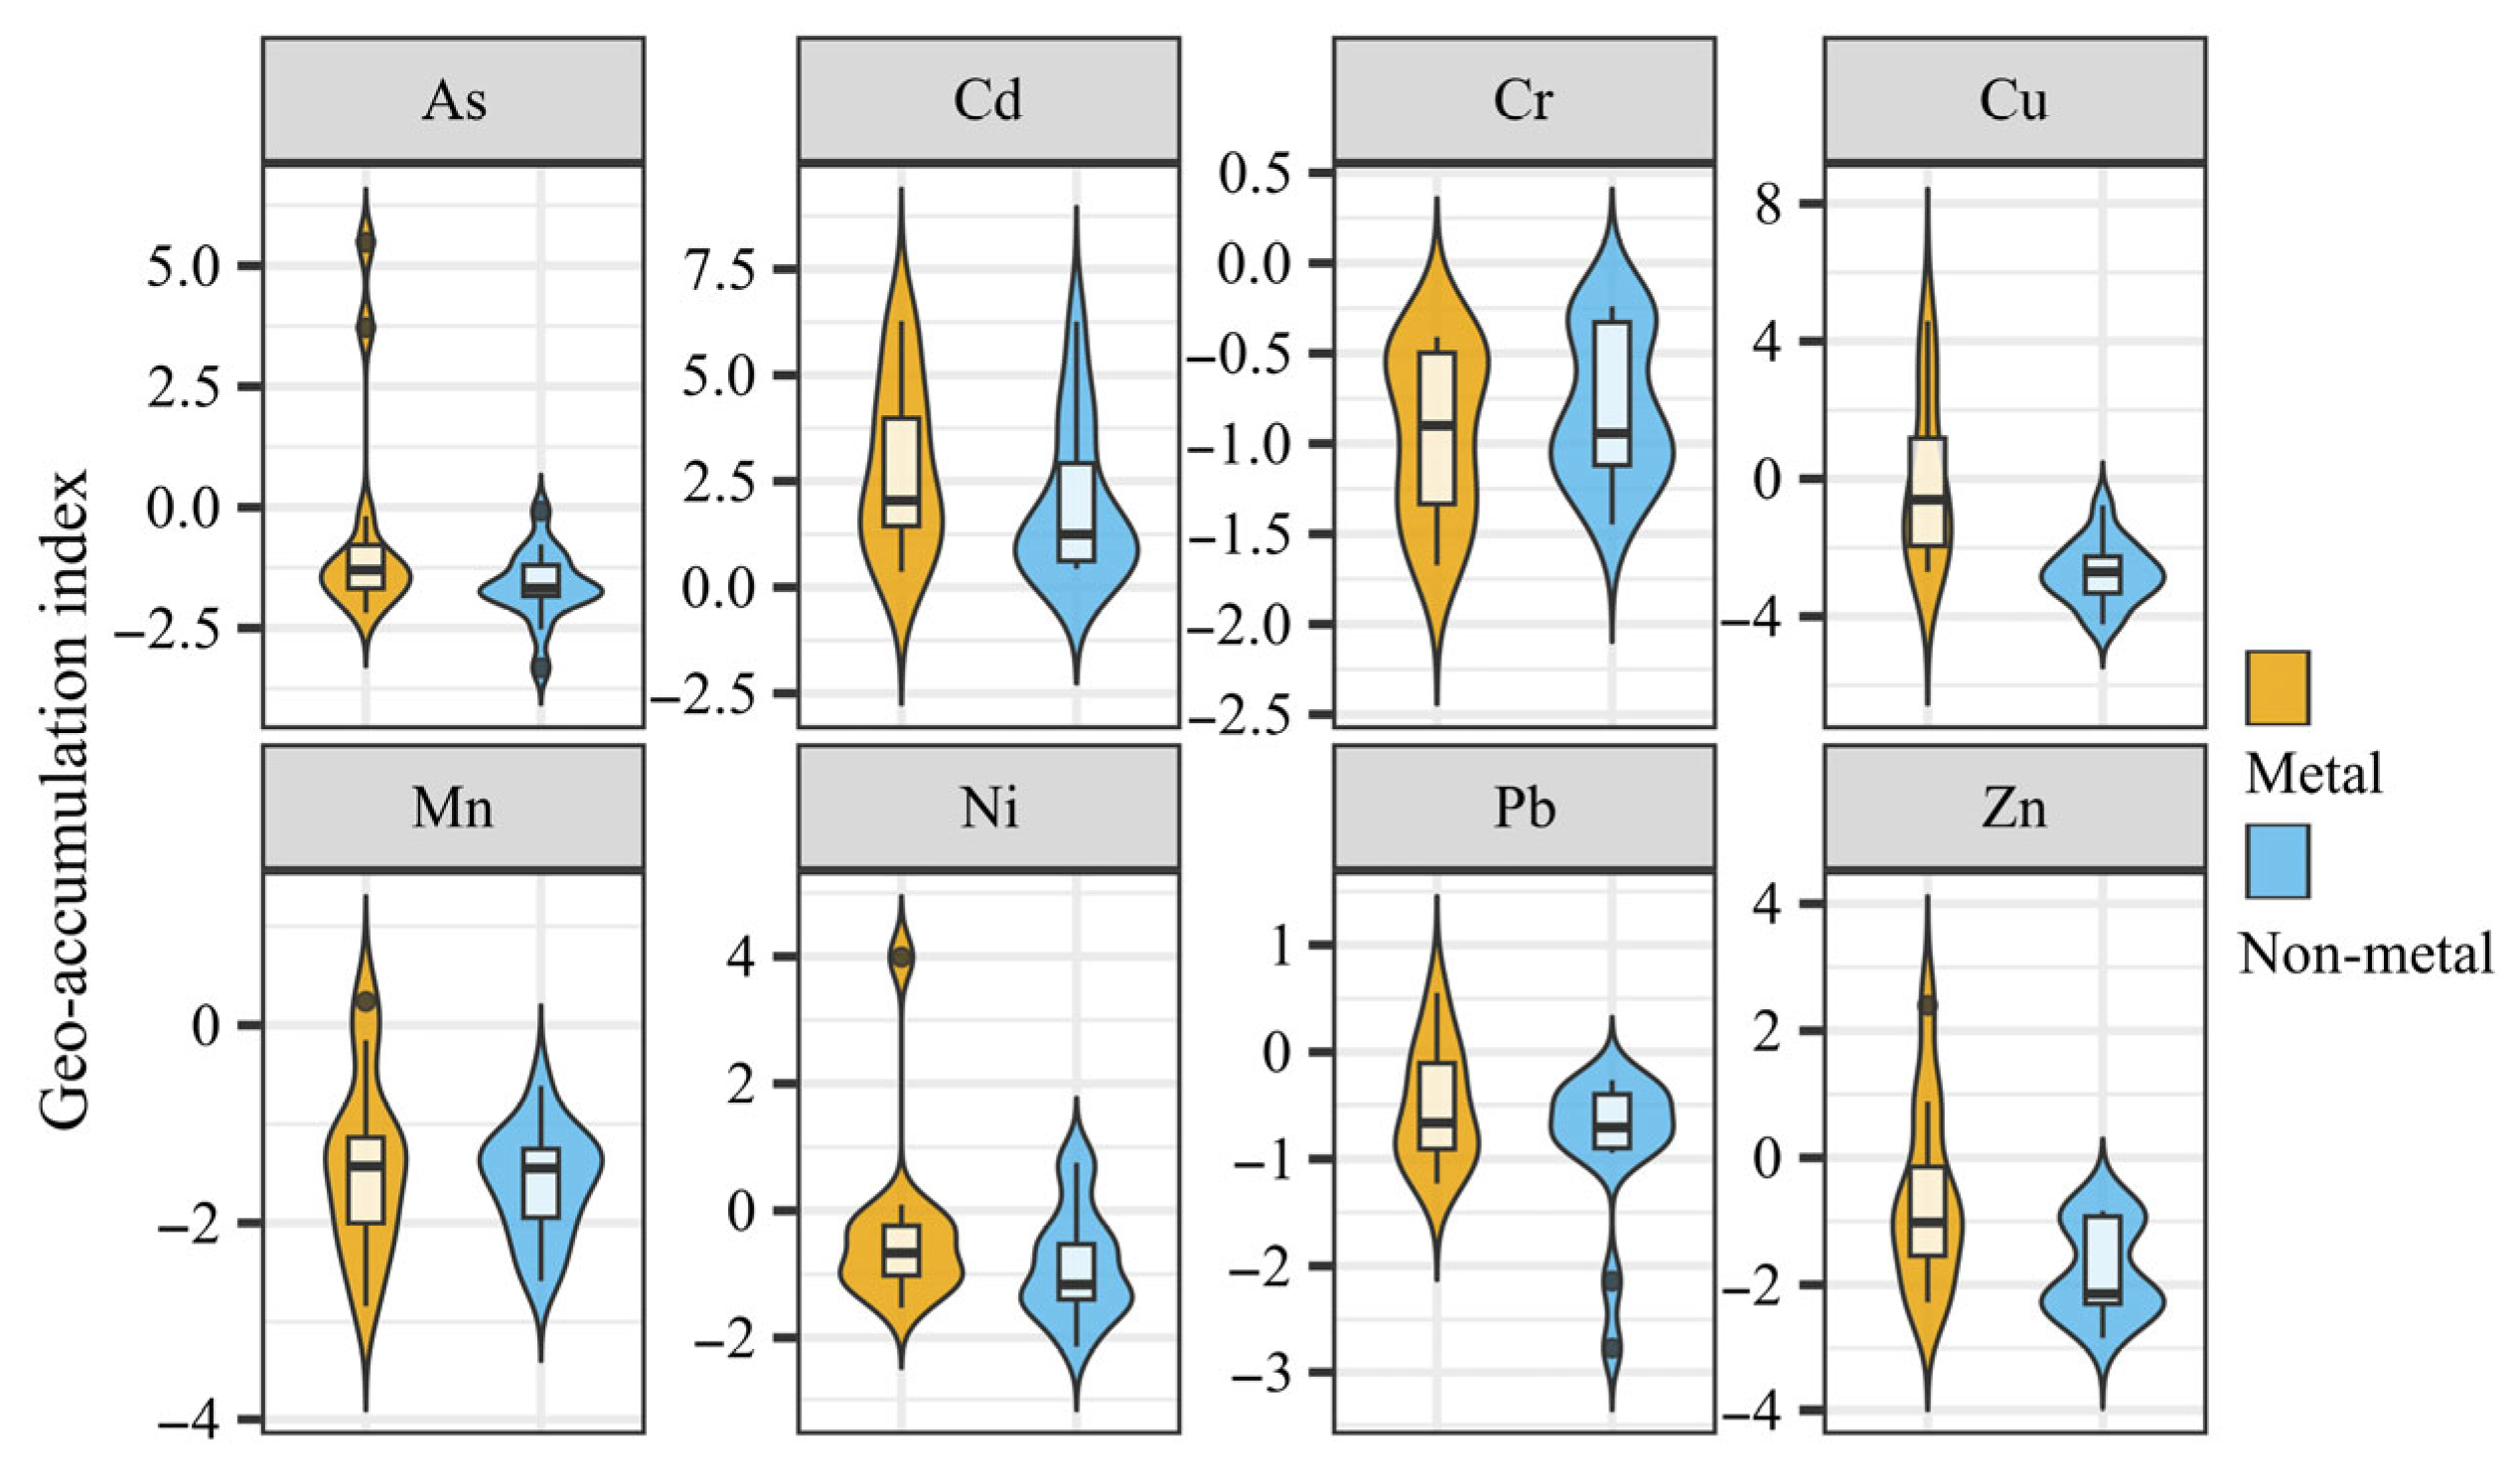
The distribution characteristics of Igeo in metal and non-metal mines are shown in Figure 8b and Figure 9. Metal mines have higher Igeo for Cd and Cu, reflecting potentially more severe pollution risks, while non-metal mines demonstrate relatively lower and more concentrated Igeo for others. In addition, the mean Igeo of Ni, Mn, Cu, Zn, As, Cd, and Pb in metal mines are all higher than those in non-metal mines (Figure 8b), with the differences in Cd and Cu being the most pronounced.
Metal mines show significant enrichment of Cd and Cu (Figure 9), with Igeo medians higher than those in non-metal mines. The level of Cd extends toward higher values with an elevated median, demonstrating more severe Cd pollution in metal mines. In contrast, non-metal mines show a single-peak, negatively skewed distribution, showing no significant difference from background values. In addition, although the median Cr and Mn in metal mines have not reached pollution thresholds, their distribution ranges are significantly wider than those in non-metal mines, reflecting greater spatial heterogeneity.
In summary, metal mines demonstrate higher pollution levels than non-metal mines, indicating that heavy metal contamination in metal mines has stronger spatial heterogeneity and greater ecological risk uncertainty.
In addition, a comparison with the Guyang iron mine (Inner Mongolia) [49], located in a similar arid-semiarid zone, further underscores the dominant role of ore geology over climate. Pollution there is milder and dominated by Cu (from processing) and Cr/Ni (from natural parent material). In contrast, the severe Cd and As contamination and higher health risks in our study area are directly tied to the mining of metallic sulfide deposits, highlighting the critical impact of anthropogenic activity on metal release and risk.

4.3. Soil Heavy Metal Pollution of Different Regions

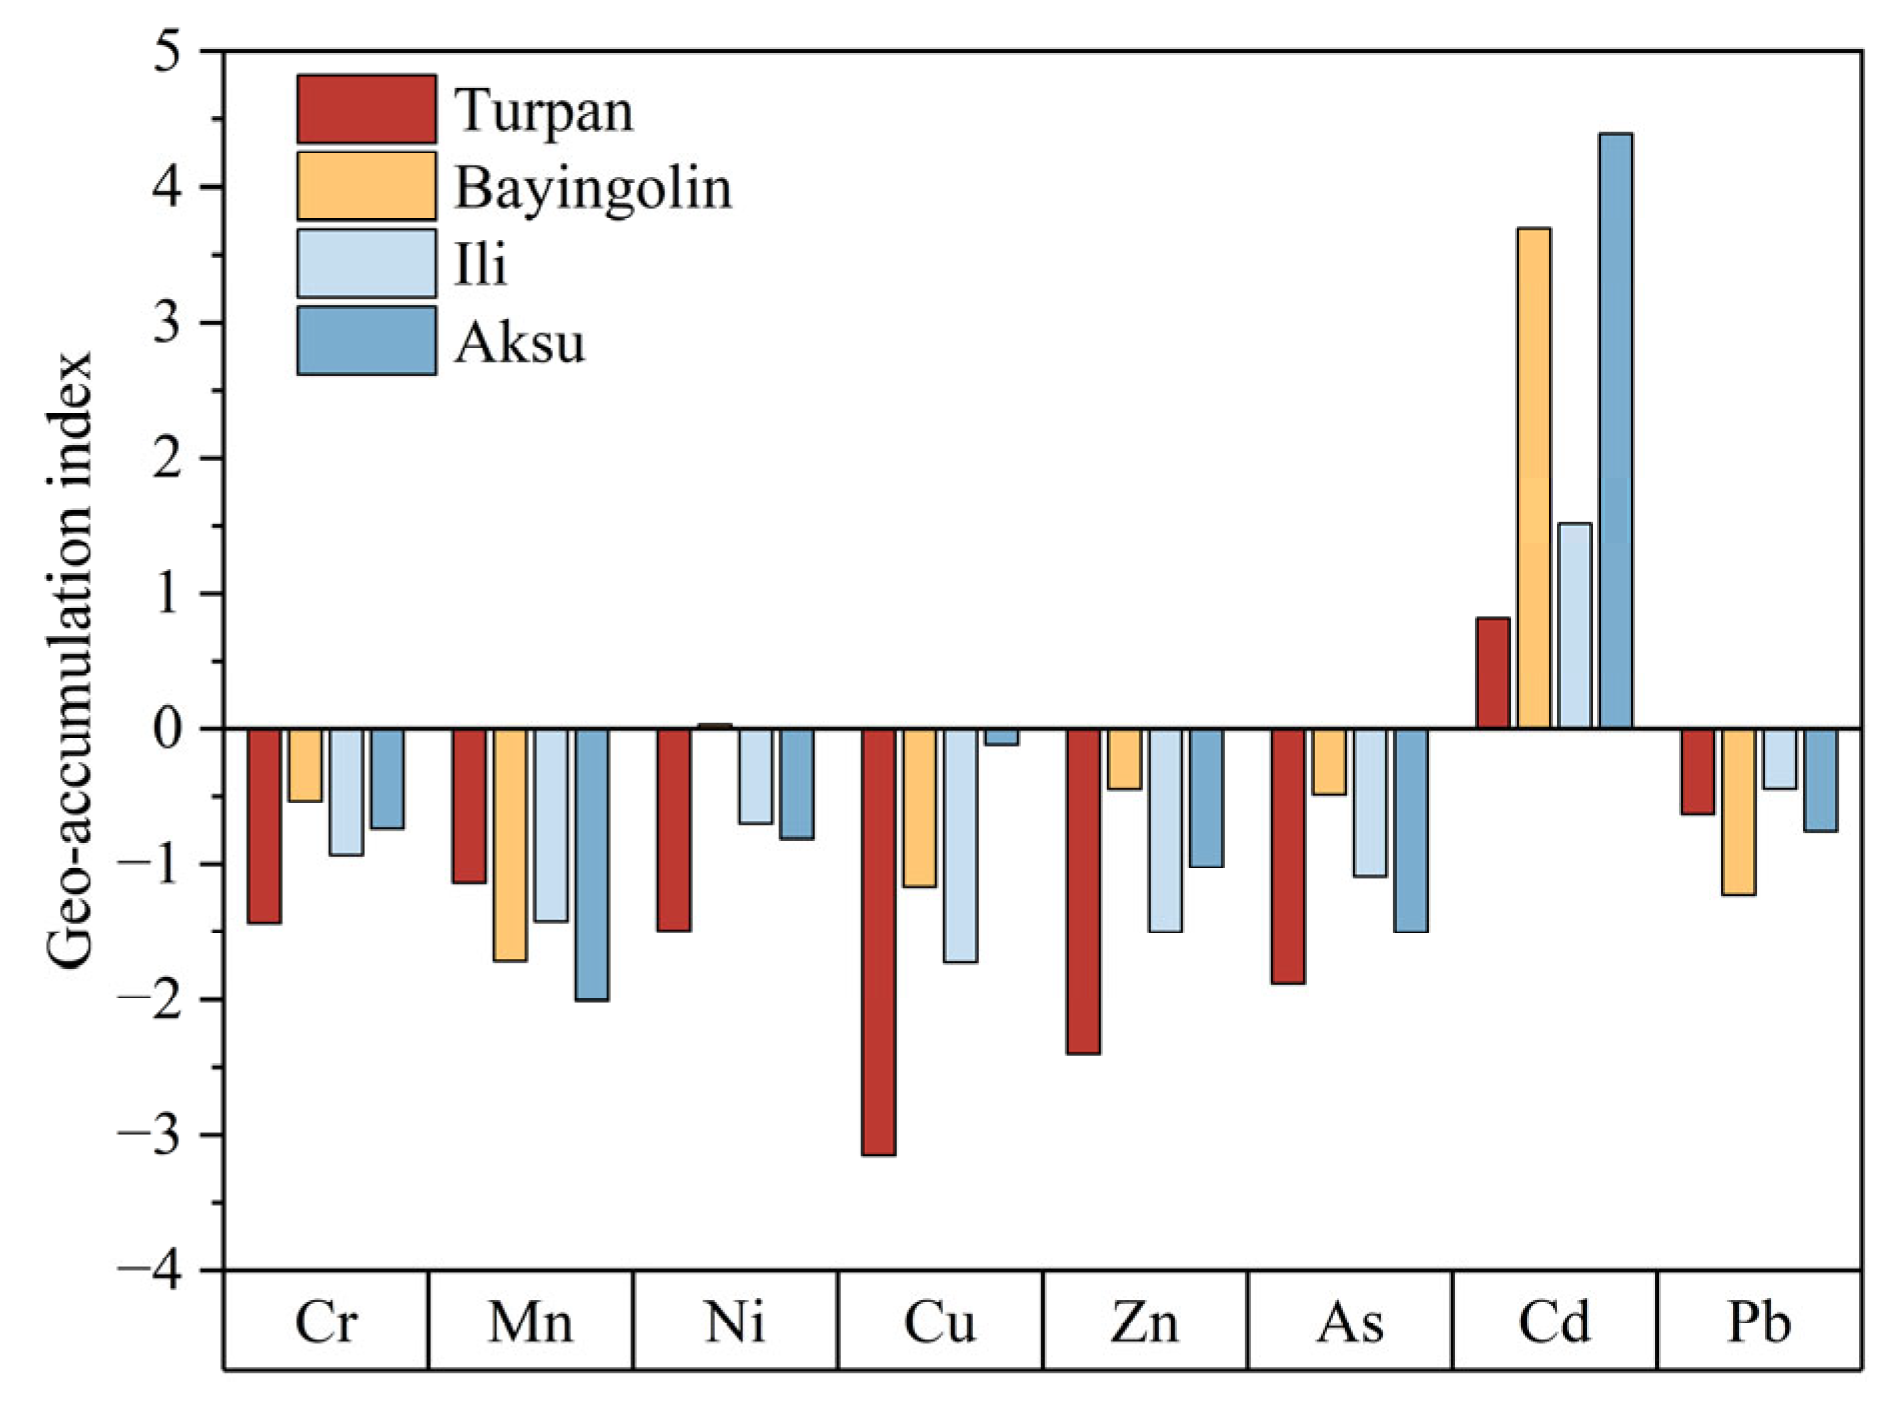
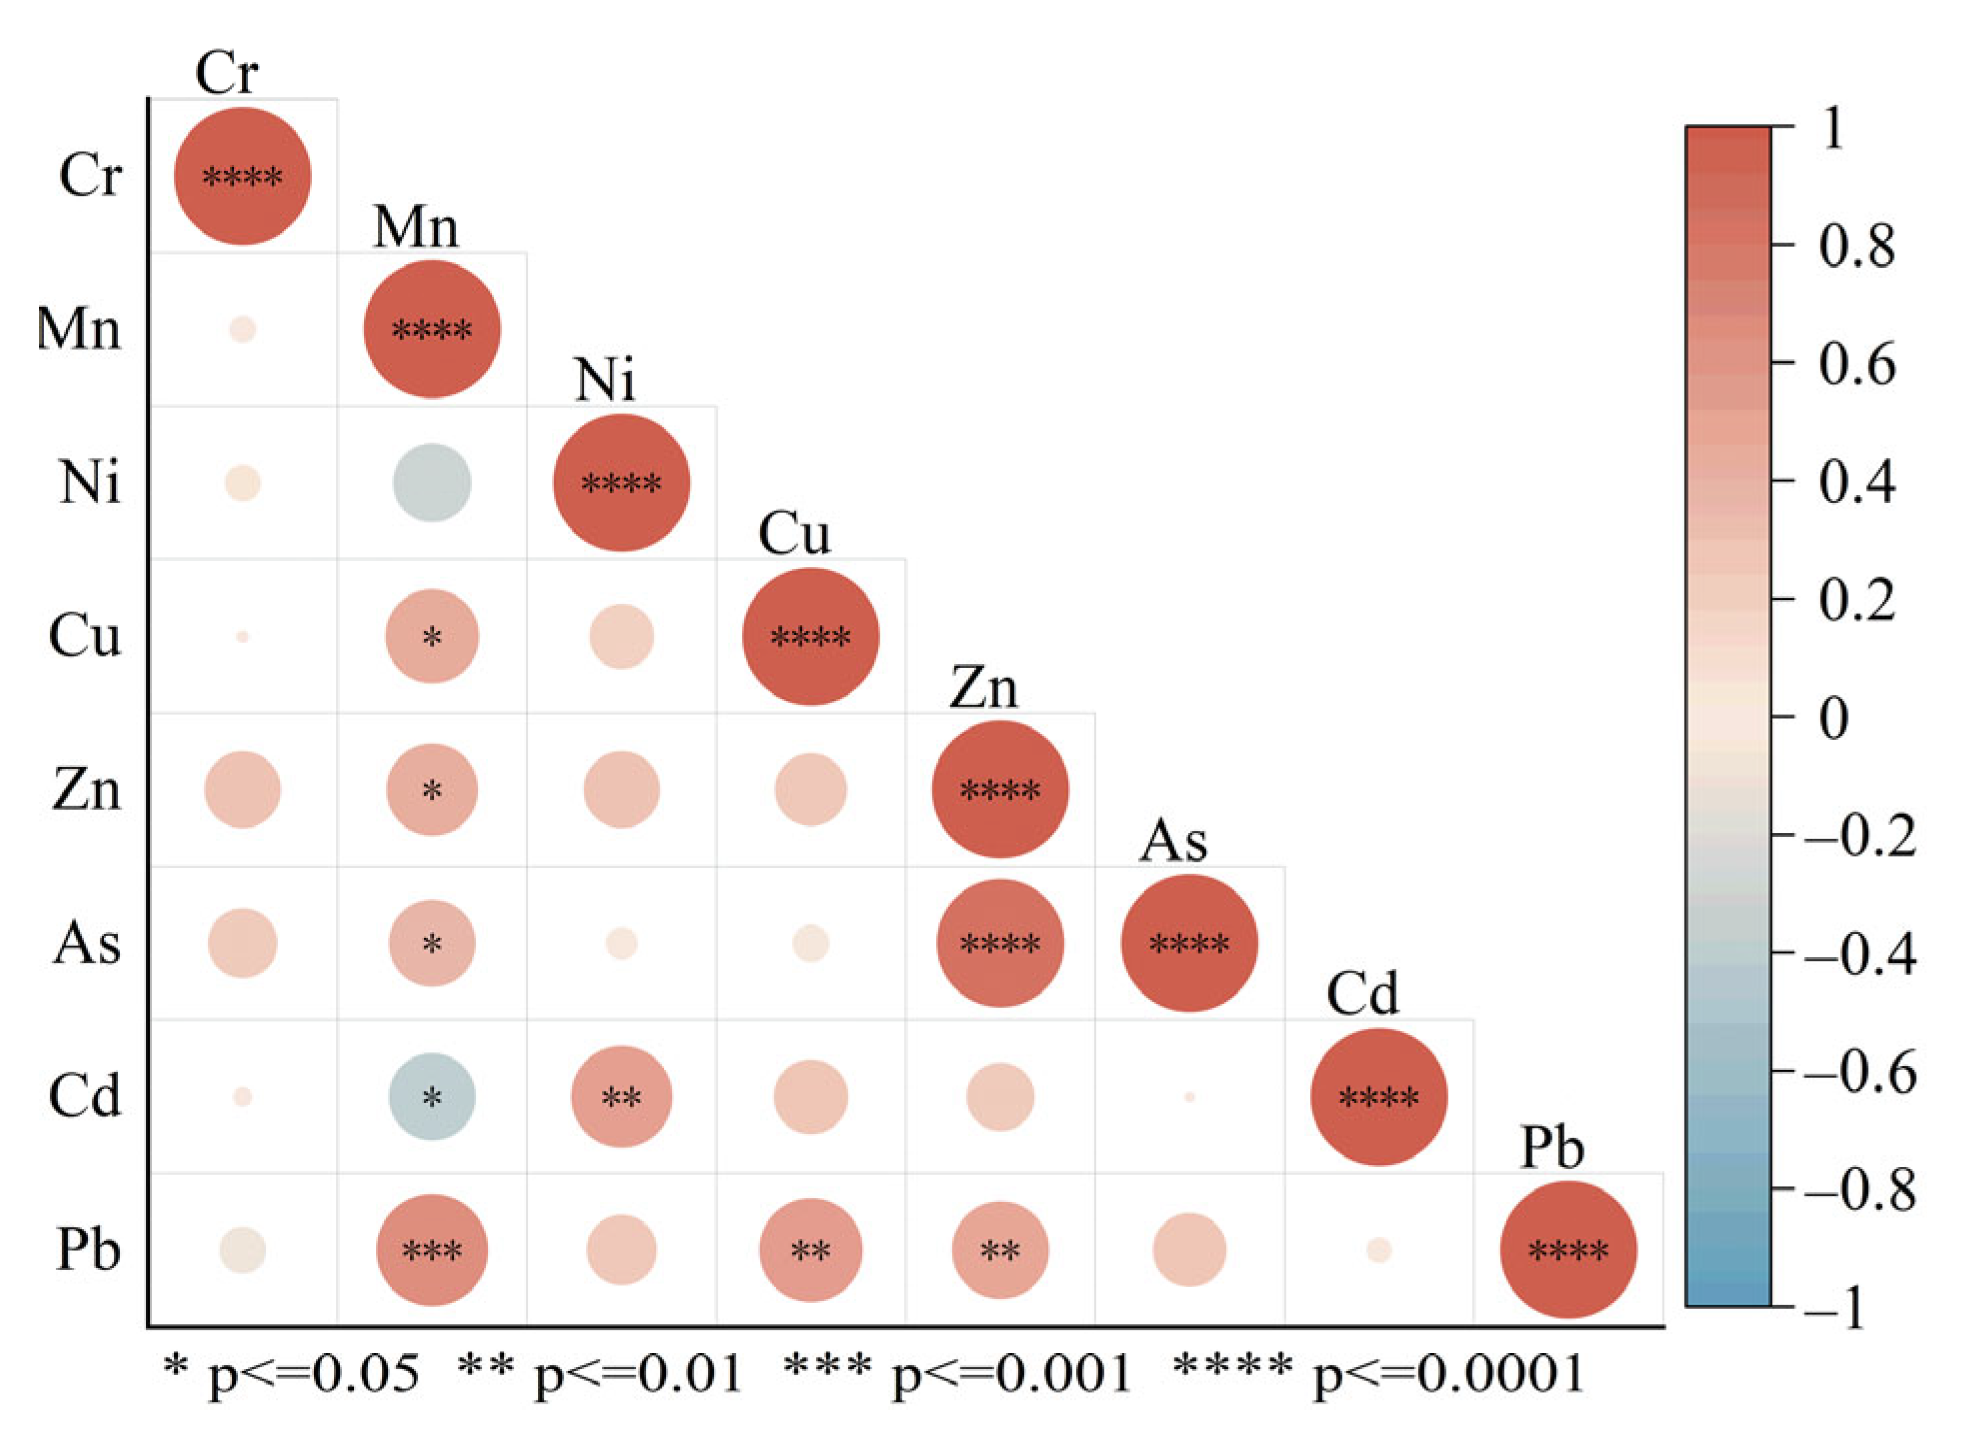
Igeo is shown in Figure 10 in mine soils, in which Cr, Mn, Ni, Cu, Zn, As, and Pb are all below the pollution threshold in the four regions. Ni, Cu, and Zn are significant regional variations, possibly related to the heterogeneity of their sources. At the same time, Pearson correlation analysis of eight heavy metal elements is presented in CTM (Figure 11). The results reveal an extremely significant positive correlation between Zn and As, while Pb and Mn show a statistically significant positive correlation. Additionally, Mn shows the negative correlations only with Ni and Cd while maintaining positive correlations with the other four elements.
Cd shows significant pollution characteristics, with Bazhou and Aksu reaching moderate pollution levels. Ni shows weak enrichment in Bazhou, but it remains within the background fluctuation range. The regional differentiation of As is most distinctive, with Ili differing from the other three regions. According to heavy metal source analysis theory [50,51], significant positive correlations between elements often indicate homologous origins or similar formation mechanisms. The strong correlation may have unique arsenic-zinc paragenetic mineralization or industrial pollution sources between As and Zn. Cr shows no significant correlation with any others, indicating that chromium distribution is controlled by independent geological processes. No significant association between Cd and Pb was observed, indicating distinct sources and migration pathways (Cd originates from sulfide oxidation, while Pb is more associated with anthropogenic activities).
In summary, heavy metal pollution is characterized primarily by regional enrichment of Cd in the study area, with its Igeo being 100 to 1000 times higher than other elements, possibly related to soil formation processes in arid regions. The establishment of a Cd pollution source identification technical system should be prioritized, with particular attention directed toward controlling input pathways such as mine tailings leaching.
A significant correlation between Cd and Ni (p < 0.01) suggests a common geological origin from mining-disturbed materials. However, their ecological risks differ substantially due to divergent geochemical behaviors. Ni exhibits low mobility, becoming immobilized in clays or precipitates, whereas Cd is readily released as mobile Cd2+ ions following sulfide oxidation.
The arid climate further amplifies Cd risk by inhibiting leaching and promoting its enrichment in surface soils through evaporation. Thus, although mining concurrently releases both elements, Cd’s high mobility combined with climatic conditions renders it the primary risk driver, necessitating prioritized management.

4.4. Limitations and Prospects

This study evaluated the characteristics and risks of heavy metal pollution in non-coal mine soils in the CTM of Xinjiang, China, but several limitations remain:
(1) While a large-scale region characterized by significant heterogeneity in geological background and mining activities was encompassed, the practical constraints of field sampling resulted in a limited spatial density of samples, which constrain the fine-scale delineation of spatial pollution distribution patterns. Future research could employ geostatistical methods to increase sampling grid density and incorporate remote sensing inversion technology to achieve multi-scale pollution pattern analysis, further refining the spatial resolution of the findings.
(2) Metal and non-metal mines were exclusively studied in this research, with coal mine samples deliberately excluded from the analysis. Considering Xinjiang’s abundant coal resources and the significant presence of elements such as As and Pb in lignite, subsequent research should include comparative studies of coal mining areas to improve the regional mining pollution database.
(3) While this study revealed the spatial differentiation characteristics of heavy metal pollution, it lacked quantitative source apportionment by techniques such as Positive Matrix Factorization or isotope tracing. This limitation hinders the determination of contribution rates from geological weathering and mining activities. Future research should integrate source apportionment, migration process analysis, and pollution prediction approaches to elucidate the dynamic processes of pollutant elements across environmental media.
(4) The Cd-As co-contamination pattern and significant enrichment of heavy metal(loid)s in underground mining areas show that remediation efforts should prioritize high-risk elements and regions. For example, in sites with severe As pollution, the application of a combined electrokinetic-chemical stabilization approach may be suitable, utilizing electric field-induced mobilization and amendments such as modified apatite to facilitate targeted migration and immobilization [52]. In sites with severe As pollution, methods such as soil washing (e.g., with EDTA) or chemical stabilization integrated with phytoremediation could be implemented to achieve efficient removal and long-term stabilization [53]. Based on the contamination assessment results presented in this study, future work should focus on the development of integrated bioremediation systems incorporating functional microorganisms and native hyperaccumulator plants for practical application.
(5) While ex situ methods like soil washing offer thorough cleanup, they are expensive due to high energy, water, and waste disposal costs, making them less suitable for vast mining areas like the CTM. Chemical stabilization and phytoremediation are more cost-effective and less disruptive, but their long-term stability and efficiency require continuous monitoring. Particularly for sites with extreme contamination (samplings 2-1, 4-2 with Cd exceeding 13 mg·kg−1), complete remediation is technically challenging and economically unviable. In such cases, a risk-control strategy, such as installing impermeable barriers and implementing strict land-use controls to prevent human exposure and pollutant migration, might be a more pragmatic and sustainable approach than complete decontamination.

5. Conclusions

(1) Cd-As-Cu-Ni is characterized by pollution in mine soils of the CTM, with Bazhou and Aksu identified as core pollution zones, reaching comprehensive pollution indices of 26.64 and 25.28, respectively. Cd exceeded standards in the entire region (Pi = 115), while As was enriched in the Bazhou iron mine (Pi = 67.20) and Ili gold mine (Pi = 19.73). Turpan had milder pollution but displayed localized Cd enrichment. Igeo shows that Cd has reached severe pollution levels (Igeo > 4) in both the Aksu copper mine and the Bazhou andalusite mine.
(2) Ei is dominated by Cd, with both the Bazhou andalusite mine (Ei = 3455.40) and Aksu copper mine (Ei = 3485.40) reaching extremely high ecological risk levels. Health risk values indicate that the CR of Cr and the NCR of As significantly exceed standards, with the CR of Cr requiring particular attention.
(3) Open-pit and underground mining methods have significant regulatory effects on heavy metal pollution characteristics. Soils in underground mines exhibit significantly higher Igeo for Cd (3.62) and Cu (1.85) compared to open-pit mines for Cd (2.15) and Cu (0.73).
(4) Metal mines have both higher Igeo and greater spread in Igeo for Cd and Cu, while non-metal mines are relatively lower and more uniform Igeo. Due to complex associated elements, metal mines (copper, iron) have higher Cd and As pollution risks than non-metal mines.
In summary, metal mines exhibit higher heavy metal contamination levels and greater spatial heterogeneity compared to non-metal mines. Cd is the predominant regional pollutant, and the establishment of a Cd pollution source identification technical system should be prioritized, with particular attention directed toward controlling input pathways such as mine tailings leaching.

Supplementary Materials

The following supporting information can be downloaded at: https://www.mdpi.com/article/10.3390/min15090986/s1, Table S1: Sampling points and coordinates of samplings in mine soils of the central Tianshan Mountains; Table S2: Background values of heavy metal concentration in Xinjiang of China; Table S3: Assessment methods and levels of heavy metal pollution indexes; Table S4: The single-factor pollution index and Nemerow comprehensive pollution index of mine soil in the central Tianshan Mountains; Table S5: Reference dose (RfD) and slope factor (SF)for eight heavy metals of Intergrated Risk Information System (IRIS); Table S6: The meaning of the values of each parameter in the exposure assessment and their reference values.

Author Contributions

K.G.: writing—review and editing, writing—original draft, software, methodology, data curation. Z.Z.: conceptualization, writing—review and editing, project administration, formal analysis, funding acquisition. G.L.: writing—review and editing, writing—original draft, software, conceptualization, funding acquisition. H.L.: writing—review and editing, software. Z.W.: writing—review and editing, methodology. Y.F.: writing—review and editing, formal analysis. W.W.: writing—review and editing, formal analysis. All authors have read and agreed to the published version of the manuscript.

Funding

This work was funded by the Third Xinjiang Scientific Expedition (2022xjkk1001), Xinjiang Tianchi Talents (Young Doctor), Higher Education Institutions of Xinjiang Education Department (XJEDU2024J036), the Key Research and Development Task Special Project of Xinjiang (2024B03017), the Distinguished Young Scholars Science Foundation of Xinjiang (2022D01E31), and the Tianshan Talents Development Program of Xinjiang (2022TSYCCX0037).

Data Availability Statement

Data will be made available upon request.

Conflicts of Interest

Yaokun Fu is an employee of China Coal Technology Engineering Group‌ Mining Research Institute. The paper reflects the views of the scientists and not the company.

References

  1. Chen, L.; Zhou, M.; Wang, J.; Zhang, Z.; Duan, C.; Wang, X.; Zhao, S.; Bai, X.; Li, Z.; Li, Z. A Global Meta-Analysis of Heavy Metal (Loid) S Pollution in Soils Near Copper Mines: Evaluation of Pollution Level and Probabilistic Health Risks. Sci. Total Environ. 2022, 835, 155441. [Google Scholar] [CrossRef]
  2. Chen, Z.; Yang, Y.; Zhou, L.; Hou, H.; Zhang, Y.; Liang, J.; Zhang, S. Ecological Restoration in Mining Areas in the Context of the Belt and Road Initiative: Capability and Challenges. Environ. Impact Assess. Rev. 2022, 95, 106767. [Google Scholar] [CrossRef]
  3. Acosta, J.A.; Faz, A.; Martínez-Martínez, S.; Zornoza, R.; Carmona, D.M.; Kabas, S. Multivariate Statistical and GIS-Based Approach to Evaluate Heavy Metal Behavior in Mine Sites for Future Reclamation. J. Geochem. Explor. 2011, 109, 8–17. [Google Scholar] [CrossRef]
  4. Liu, R.; Xu, Y.; Zhang, J.; Wang, W.; Elwardany, R.M. Effects of Heavy Metal Pollution On Farmland Soils and Crops: A Case Study of the Xiaoqinling Gold Belt, China. China Geol. 2020, 3, 402–410. [Google Scholar] [CrossRef]
  5. Ali, H.; Khan, E.; Ilahi, I. Environmental Chemistry and Ecotoxicology of Hazardous Heavy Metals: Environmental Persistence, Toxicity, and Bioaccumulation. J. Chem. 2019, 2019, 6730305. [Google Scholar] [CrossRef]
  6. Søndergaard, J.; Mosbech, A. Mining Pollution in Greenland-the Lesson Learned: A Review of 50 Years of Environmental Studies and Monitoring. Sci. Total Environ. 2022, 812, 152373. [Google Scholar] [CrossRef]
  7. Zhang, J.; Liu, Z.; Tian, B.; Li, J.; Luo, J.; Wang, X.; Ai, S.; Wang, X. Assessment of Soil Heavy Metal Pollution in Provinces of China Based On Different Soil Types: From Normalization to Soil Quality Criteria and Ecological Risk Assessment. J. Hazard. Mater. 2023, 441, 129891. [Google Scholar] [CrossRef]
  8. Zhao, F.; Ma, Y.; Zhu, Y.; Tang, Z.; McGrath, S.P. Soil Contamination in China: Current Status and Mitigation Strategies. Environ. Sci. Technol. 2015, 49, 750–759. [Google Scholar] [CrossRef] [PubMed]
  9. Qin, F.; Wei, C.; Zhong, S.; Huang, X.; Pang, W.; Jiang, X. Soil Heavy Metal (Loid) S and Risk Assessment in Vicinity of a Coal Mining Area from Southwest Guizhou, China. J. Cent. South Univ. 2016, 23, 2205–2213. [Google Scholar] [CrossRef]
  10. Zhang, Y.; Li, T.; Guo, Z.; Xie, H.; Hu, Z.; Ran, H.; Li, C.; Jiang, Z. Spatial Heterogeneity and Source Apportionment of Soil Metal (Loid) S in an Abandoned Lead/Zinc Smelter. J. Environ. Sci. 2023, 127, 519–529. [Google Scholar] [CrossRef]
  11. Teng, Y.; Wu, J.; Lu, S.; Wang, Y.; Jiao, X.; Song, L. Soil and Soil Environmental Quality Monitoring in China: A Review. Environ. Int. 2014, 69, 177–199. [Google Scholar] [CrossRef]
  12. Li, X.; Zhang, X.; Du, H.-R.; Cao, J.-B. An Analysis of Dynamic Econometric on the Impact of Mineral Resource Exploitation on the Region Development—Take Xinjiang as an Example. J. Nat. Resour. 2010, 25, 1823–1833. (In Chinese) [Google Scholar]
  13. Xiao, P.; Zhou, Y.; Li, X.; Xu, J.; Zhao, C. Assessment of Heavy Metals in Agricultural Land: A Literature Review Based on Bibliometric Analysis. Sustainability 2021, 13, 4559. [Google Scholar] [CrossRef]
  14. Jin, L.; Wenjing, L.; Yang, J.; Li, Y.; Yaning, F.; Tao, T.; Xiaomeng, L. Ecolcgical and Health Risk Assessment of Heavy Metals in Farmland Soil Around the Gold Mining Area in Tongguan of Shaanxi Province. Geol. China 2021, 48, 749–763. [Google Scholar] [CrossRef]
  15. Zhong, X.; Chen, Z.; Li, Y.; Ding, K.; Liu, W.; Liu, Y.; Yuan, Y.; Zhang, M.; Baker, A.J.; Yang, W. Factors Influencing Heavy Metal Availability and Risk Assessment of Soils at Typical Metal Mines in Eastern China. J. Hazard. Mater. 2020, 400, 123289. [Google Scholar] [CrossRef]
  16. Shi, J.; Zhao, D.; Ren, F.; Huang, L. Spatiotemporal Variation of Soil Heavy Metals in China: The Pollution Status and Risk Assessment. Sci. Total Environ. 2023, 871, 161768. [Google Scholar] [CrossRef] [PubMed]
  17. Zhang, Y.; Song, B.; Zhou, Z. Pollution Assessment and Source Apportionment of Heavy Metals in Soil From Lead–Zinc Mining Areas of South China. J. Environ. Chem. Eng. 2023, 11, 109320. [Google Scholar] [CrossRef]
  18. Hua, C.; Zhou, G.; Yin, X.; Wang, C.; Chi, B.; Cao, Y.; Wang, Y.; Zheng, Y.; Cheng, Z.; Li, R. Assessment of Heavy Metal in Coal Gangue: Distribution, Leaching Characteristic and Potential Ecological Risk. Environ. Sci. Pollut. Res. 2018, 25, 32321–32331. [Google Scholar] [CrossRef] [PubMed]
  19. Yao, F.; Bao, A.M.; Jiapaer, G.; Yin, J.; Li, C.; Zhang, G. Soil Heavy Metal Sources and Pollution Assessment in the Coalfield of East Junggar Basin in XinJiang. China Environ. Sci. 2013, 33, 1821–1828. (In Chinese) [Google Scholar]
  20. Li, C.; Zhang, G.S.; Yao, F.; Wang, Y.; Li, H.D. Assessment of Soil Heavy Metal Pollution in Area of Xinjiang Zhundong Wucaiwan Surface Coal Mine. Environ. Eng. 2014, 32, 142–146. [Google Scholar] [CrossRef]
  21. Liao, G.; Liao, D.; Li, Q. Heavy Metals Contamination Characteristics in Soil of Different Mining Activity Zones. Trans. Nonferrous Met. Soc. China 2008, 18, 207–211. [Google Scholar] [CrossRef]
  22. Li, X.; Tang, Z.; Chu, F.; Yang, L. Characteristics of Distribution and Chemical Speciation of Heavy Metals in Environmental Mediums Around Jinchang Mining City, Northwest China. Environ. Earth Sci. 2011, 64, 1667–1674. [Google Scholar] [CrossRef]
  23. Gao, Y.; Liu, H.; Liu, G. The Spatial Distribution and Accumulation Characteristics of Heavy Metals in Steppe Soils Around Three Mining Areas in Xilinhot in Inner Mongolia, China. Environ. Sci. Pollut. Res. 2017, 24, 25416–25430. [Google Scholar] [CrossRef]
  24. Yu, H.; Zahidi, I. Spatial and Temporal Variation of Vegetation Cover in the Main Mining Area of Qibaoshan Town, China: Potential Impacts From Mining Damage, Solid Waste Discharge and Land Reclamation. Sci. Total Environ. 2023, 859, 160392. [Google Scholar] [CrossRef]
  25. Zhang, W.; You, M.; Hu, Y. The Distribution and Accumulation Characteristics of Heavy Metals in Soil and Plant from H Uainan Coalfield, C Hina. Environ. Prog. Sustain. Energy 2016, 35, 1098–1104. [Google Scholar] [CrossRef]
  26. Zhang, X.; Yang, H.; Cui, Z. Evaluation and Analysis of Soil Migration and Distribution Characteristics of Heavy Metals in Iron Tailings. J. Clean. Prod. 2018, 172, 475–480. [Google Scholar] [CrossRef]
  27. Liu, J.; Li, R.; Liang, Y.; Liu, L.; Yin, F.; Tang, S.; He, L.; Zhang, Y. Soil Cadmium Prediction and Health Risk Assessment of an Oasis On the Eastern Edge of the Tarim Basin Based On Feature Optimization and Machine Learning. Huan Jing Ke Xue Huanjing Kexue 2024, 45, 4802–4811. [Google Scholar] [CrossRef]
  28. Zhao, K.; Zhang, L.; Dong, J.; Wu, J.; Ye, Z.; Zhao, W.; Ding, L.; Fu, W. Risk Assessment, Spatial Patterns and Source Apportionment of Soil Heavy Metals in a Typical Chinese Hickory Plantation Region of Southeastern China. Geoderma 2020, 360, 114011. [Google Scholar] [CrossRef]
  29. Hou, D.; O’Connor, D.; Nathanail, P.; Tian, L.; Ma, Y. Integrated GIS and Multivariate Statistical Analysis for Regional Scale Assessment of Heavy Metal Soil Contamination: A Critical Review. Environ. Pollut. 2017, 231, 1188–1200. [Google Scholar] [CrossRef] [PubMed]
  30. Ma, L.; Sun, J.; Yang, Z.; Wang, L. Heavy Metal Contamination of Agricultural Soils Affected by Mining Activities Around the Ganxi River in Chenzhou, Southern China. Environ. Monit. Assess. 2015, 187, 731. [Google Scholar] [CrossRef]
  31. Neeraj, A.; Hiranmai, R.Y.; Iqbal, K. Comprehensive Assessment of Pollution Indices, Sources Apportionment and Ecological Risk Mapping of Heavy Metals in Agricultural Soils of Raebareli District, Uttar Pradesh, India, Employing a GIS Approach. Land Degrad. Dev. 2023, 34, 173–195. [Google Scholar] [CrossRef]
  32. Wei, P.; Shao, T.; Wang, R.; Chen, Z.; Zhang, Z.; Xu, Z.; Zhu, Y.; Li, D.; Fu, L.; Wang, F. A Study On Heavy Metals in the Surface Soil of the Region Around the Qinghai Lake in Tibet Plateau: Pollution Risk Evaluation and Pollution Source Analysis. Water 2020, 12, 3277. [Google Scholar] [CrossRef]
  33. Carrión Paladines, V.; Calva, J.; Ochoa Pérez, T.; Ruiz, L.; López Rodríguez, F. Heavy Metal Contamination in Arenillas Ecological Reserve Soils: Correlation and Conservation Impact. Land Degrad. Dev. 2025, 36, 3454–3471. [Google Scholar] [CrossRef]
  34. Chen, Y.; Jiang, X.; Wang, Y.; Zhuang, D. Spatial Characteristics of Heavy Metal Pollution and the Potential Ecological Risk of a Typical Mining Area: A Case Study in China. Process Saf. Environ. Protect. 2018, 113, 204–219. [Google Scholar] [CrossRef]
  35. Akoto, R.; Anning, A.K. Heavy Metal Enrichment and Potential Ecological Risks From Different Solid Mine Wastes at a Mine Site in Ghana. Environ. Adv. 2021, 3, 100028. [Google Scholar] [CrossRef]
  36. Hakanson, L. An Ecological Risk Index for Aquatic Pollution Control. A Sedimentological Approach. Water Res. 1980, 14, 975–1001. [Google Scholar] [CrossRef]
  37. Wang, F.; Guan, Q.; Tian, J.; Lin, J.; Yang, Y.; Yang, L.; Pan, N. Contamination Characteristics, Source Apportionment, and Health Risk Assessment of Heavy Metals in Agricultural Soil in the Hexi Corridor. Catena 2020, 191, 104573. [Google Scholar] [CrossRef]
  38. Yang, Q.; Li, Z.; Lu, X.; Duan, Q.; Huang, L.; Bi, J. A Review of Soil Heavy Metal Pollution From Industrial and Agricultural Regions in China: Pollution and Risk Assessment. Sci. Total Environ. 2018, 642, 690–700. [Google Scholar] [CrossRef] [PubMed]
  39. Panqing, Y.; Abliz, A.; Xiaoli, S.; Aisaiduli, H. Human Health-Risk Assessment of Heavy Metal–Contaminated Soil Based On Monte Carlo Simulation. Sci. Rep. 2023, 13, 7033. [Google Scholar] [CrossRef]
  40. Wu, Y.; Li, X.; Yu, L.; Wang, T.; Wang, J.; Liu, T. Review of Soil Heavy Metal Pollution in China: Spatial Distribution, Primary Sources, and Remediation Alternatives. Resour. Conserv. Recycl. 2022, 181, 106261. [Google Scholar] [CrossRef]
  41. Cao, L.; Xiang, H.; Yang, P.; Zhang, Z.; He, C.; Lin, C.; Gao, Y.; Li, Y.; Bernhardt, T.M. Towards Sustainable and Efficient Land Development: Risk of Soil Heavy Metal (Loid) S in Abandoned Gold Mines with Short-Term Rehabilitation and Potential Value for Targeted Remediation. Land Degrad. Dev. 2022, 33, 3855–3869. [Google Scholar] [CrossRef]
  42. Long, X.; Liu, W.; Qiu, R. Research Progress and Prospects of Human Health Risk Assessment of Heavy Metal Pollution in Farmland Soils of China. Acta Pedol. Sin. 2024, 61, 1–13. [Google Scholar] [CrossRef]
  43. Peng, J.; Zhang, S.; Han, Y.; Bate, B.; Ke, H.; Chen, Y. Soil Heavy Metal Pollution of Industrial Legacies in China and Health Risk Assessment. Sci. Total Environ. 2022, 816, 151632. [Google Scholar] [CrossRef] [PubMed]
  44. Huang, J.; Wu, Y.; Sun, J.; Li, X.; Geng, X.; Zhao, M.; Sun, T.; Fan, Z. Health Risk Assessment of Heavy Metal (Loid) S in Park Soils of the Largest Megacity in China by Using Monte Carlo Simulation Coupled with Positive Matrix Factorization Model. J. Hazard. Mater. 2021, 415, 125629. [Google Scholar] [CrossRef]
  45. Yu, G.; Chen, F.; Zhang, H.; Wang, Z. Pollution and Health Risk Assessment of Heavy Metals in Soils of Guizhou, China. Ecosyst. Health Sustain. 2021, 7, 1859948. [Google Scholar] [CrossRef]
  46. Li, Y.; Xue, J.; Cai, J.; Zhang, Y.; Li, F.; Zha, X.; Fang, G. The Spatial Distribution and Influencing Factors of Heavy Metals in Soil in Xinjiang, China. Sustainability 2023, 15, 16379. [Google Scholar] [CrossRef]
  47. Yang, S.; Sun, L.; Sun, Y.; Song, K.; Qin, Q.; Zhu, Z.; Xue, Y. Towards an Integrated Health Risk Assessment Framework of Soil Heavy Metals Pollution: Theoretical Basis, Conceptual Model, and Perspectives. Environ. Pollut. 2023, 316, 120596. [Google Scholar] [CrossRef]
  48. Changyu, W.A.; Yongli, L.I.; Wenhui, Z.H.; Lei, M.A.; Zhen, L.U.; Haoyuan, H.U.; Xin, D.U.; Peng, B.I.; Qi, G.A. Determination of multiple elements in soils surrounding iron deposits from Guyang county, Baotou city, and health risk assessment. Rock Miner. Anal. 2022, 41, 476–487. [Google Scholar] [CrossRef]
  49. Zhang, H.; Zhang, F.; Song, J.; Tan, M.L.; Johnson, V.C. Pollutant Source, Ecological and Human Health Risks Assessment of Heavy Metals in Soils From Coal Mining Areas in Xinjiang, China. Environ. Res. 2021, 202, 111702. [Google Scholar] [CrossRef]
  50. Jiang, X.; Lu, W.X.; Zhao, H.Q.; Yang, Q.C.; Yang, Z.P. Potential Ecological Risk Assessment and Prediction of Soil Heavy-Metal Pollution Around Coal Gangue Dump. Nat. Hazards Earth Syst. Sci. 2014, 14, 1599–1610. [Google Scholar] [CrossRef]
  51. Komnitsas, K.; Modis, K. Soil Risk Assessment of as and Zn Contamination in a Coal Mining Region Using Geostatisretics. Sci. Total Environ. 2006, 371, 190–196. [Google Scholar] [CrossRef] [PubMed]
  52. Oh, S.J.; Irshad, M.K.; Kang, M.W.; Roh, H.; Jeon, Y.; Lee, S.S. In-Situ Physical and Chemical Remediation of Cd and Pb Contaminated Mine Soils Cultivated with Chinese Cabbage: A Three-Year Field Study. J. Hazard. Mater. 2023, 459, 132091. [Google Scholar] [CrossRef] [PubMed]
  53. Haghighizadeh, A.; Rajabi, O.; Nezarat, A.; Hajyani, Z.; Haghmohammadi, M.; Hedayatikhah, S.; Asl, S.D.; Beni, A.A. Comprehensive Analysis of Heavy Metal Soil Contamination in Mining Environments: Impacts, Monitoring Techniques, and Remediation Strategies. Arab. J. Chem. 2024, 17, 105777. [Google Scholar] [CrossRef]
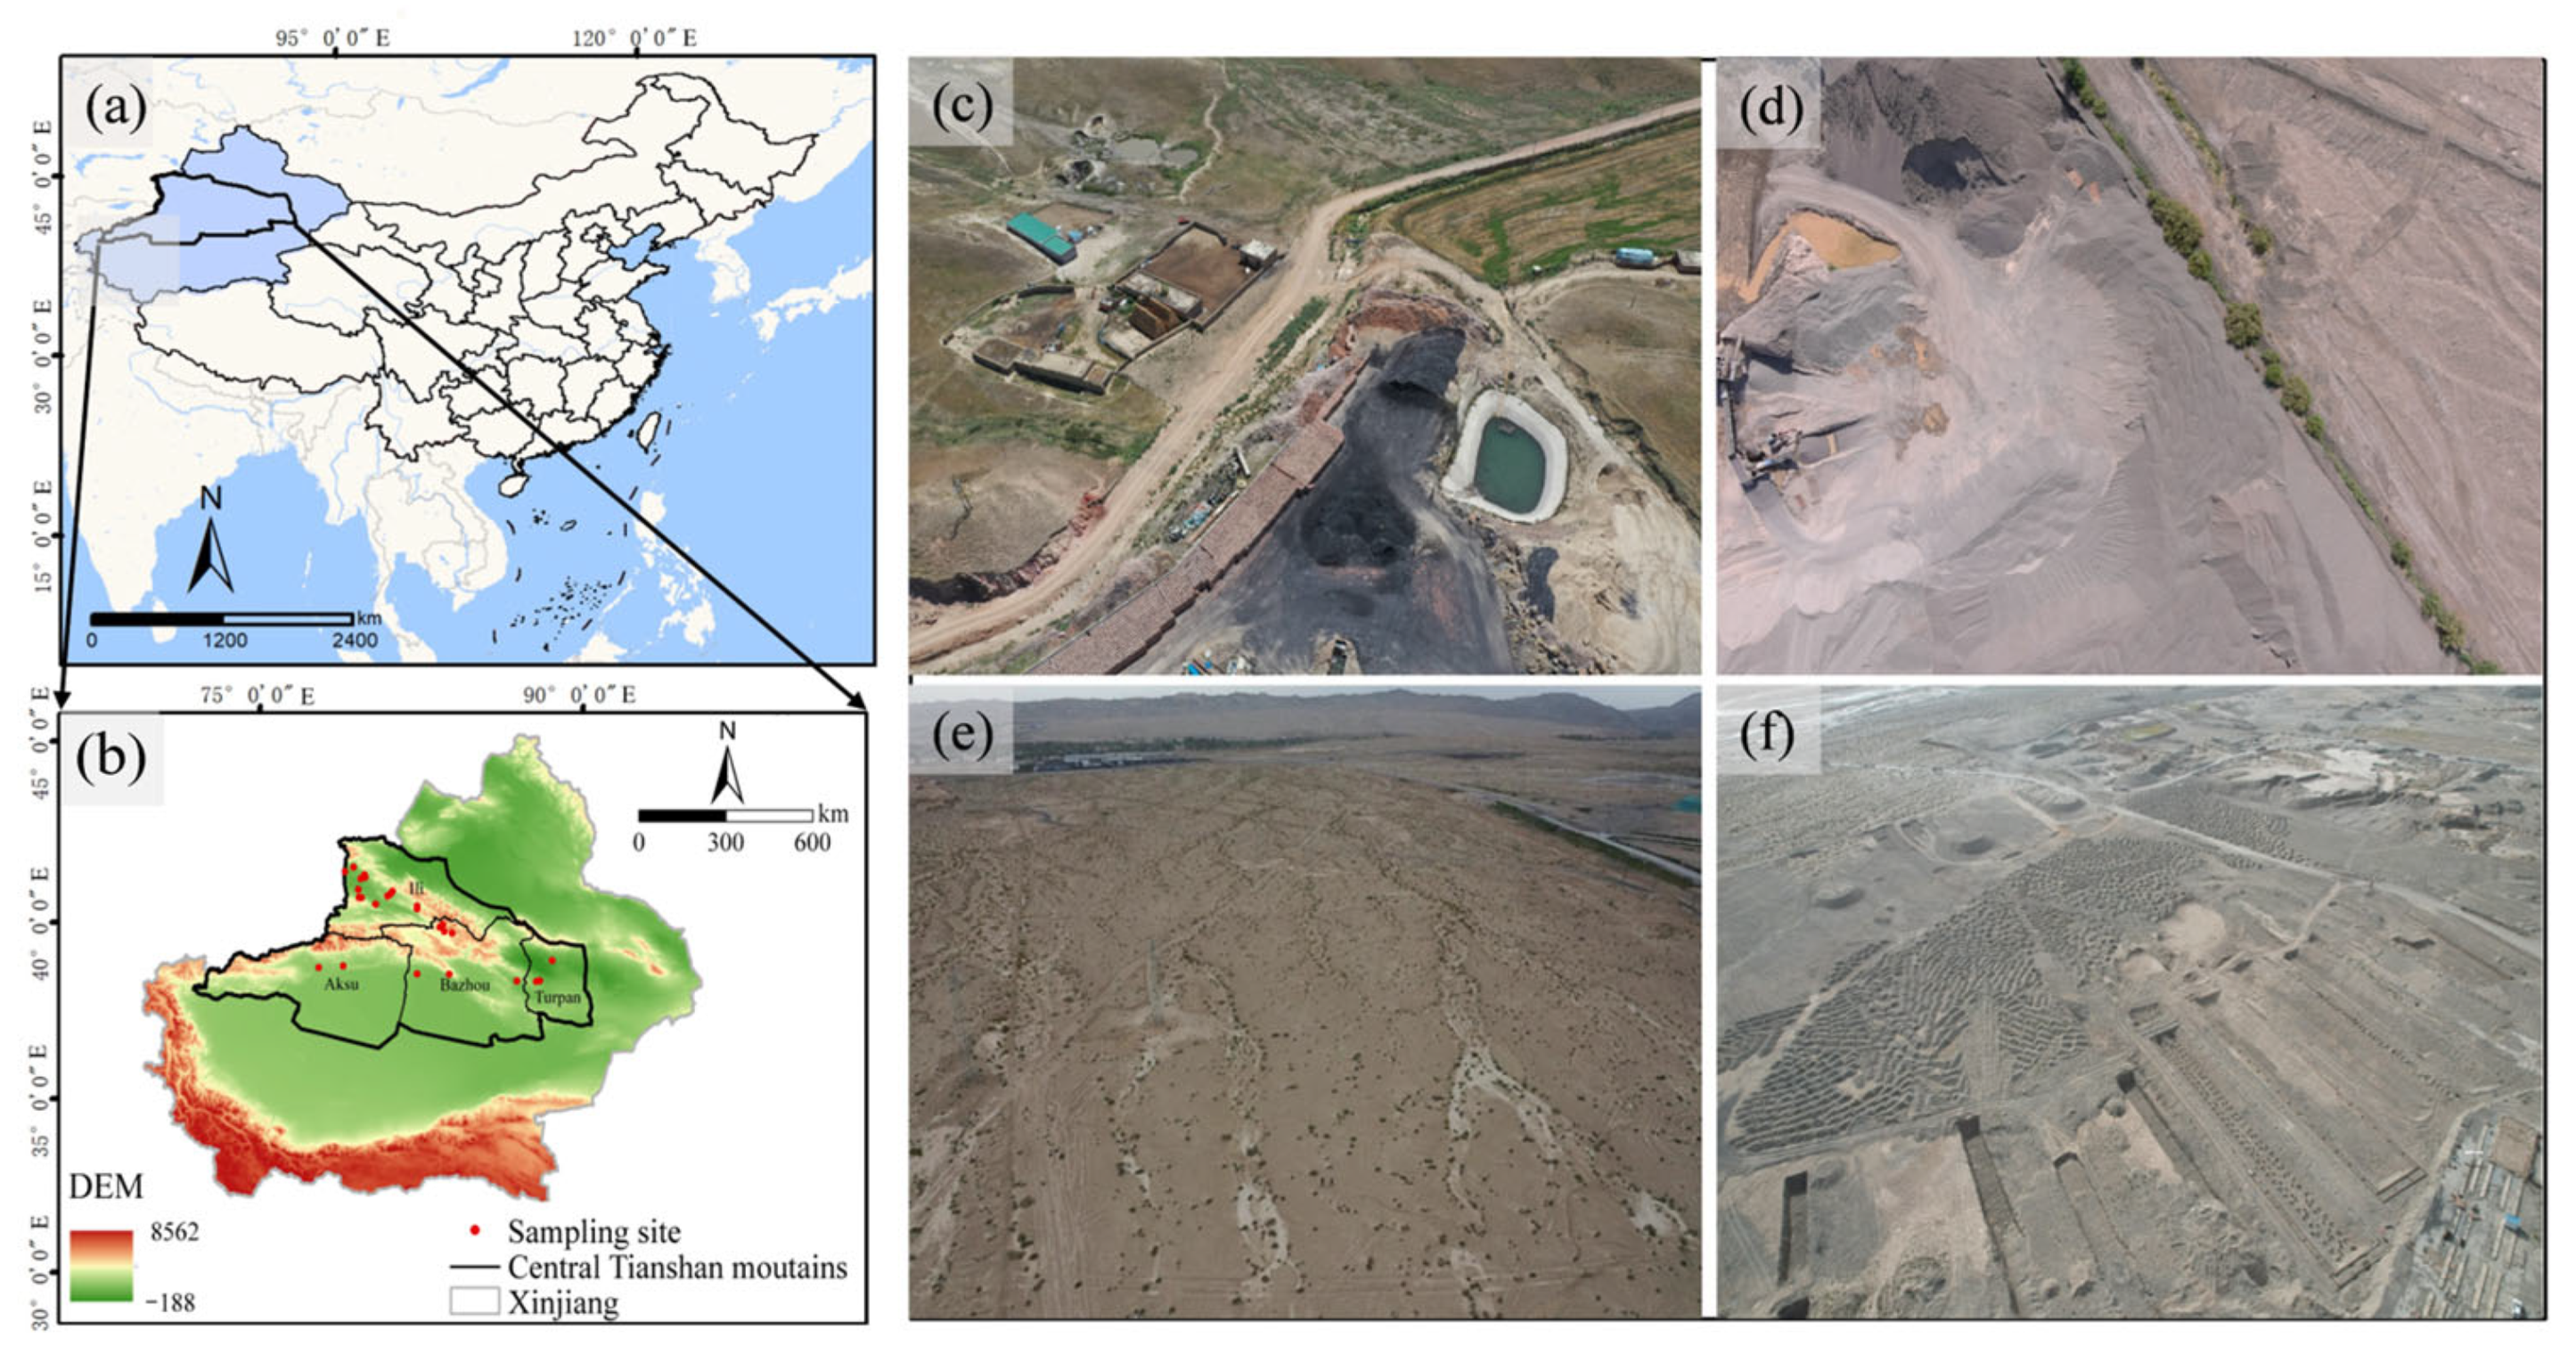
Figure 1. (a) The geographic location of the study area; (b) the topography and distribution of sampling points in the study area; (c) drone aerial photography of Huanneng Clay Mine in Kemeng Township, Nilka County, Ili; (d) drone aerial photography of Sand Mines in Lianmuqin Town, Shanshan County, Turpan; (e) drone aerial photography of Qinhua Coal Mine in Korla, Bayingol; (f) drone aerial photography of Salt Mine in Wensu County, Aksu.
Minerals 15 00986 g001
Figure 2. Mine soil sampling and profiles. (a) Soil sampling sites around the Ili Xiangshun Building Materials Cement Tuff Mine; (b) the spatial distribution of sampling points in the Aksu Salt Mine; (c) soil profile characterization near the Bazhou Kaihong Mining Area; (d) sampling layout surrounding the Turpan Xiaorequanzi Copper Mining Area.
Minerals 15 00986 g002
Figure 3. Single-factor pollution index in mine soils of the central Tianshan Mountains.
Minerals 15 00986 g003
Figure 4. The spatial distribution of the Nemerow comprehensive pollution index in the mining area of the central Tianshan Mountains.
Minerals 15 00986 g004
Figure 5. (a) A geo-accumulation index of heavy metal(loid)s in mine soils of the central Tianshan Mountains; (b) the distribution of the potential ecological risk index in mining areas of the central Tianshan Mountains.
Minerals 15 00986 g005
Figure 6. (a) The distribution of non-carcinogenic risks in mining areas in the central Tianshan Mountains; (b) the distribution of carcinogenic risk assessment results in mining areas in the central Tianshan Mountains.
Minerals 15 00986 g006
Figure 7. The evaluation of the geo-accumulation index under different mining methods.
Minerals 15 00986 g007
Figure 8. (a) The mean geo-accumulation index under different mining methods. (b) The mean geo-accumulation indices in different mine types.
Minerals 15 00986 g008
Figure 9. The overall distribution characteristics of heavy metal(loid)s in different mine types.
Minerals 15 00986 g009
Figure 10. The mean geo-accumulation indices of heavy metal(loid)s in different regions.
Minerals 15 00986 g010
Figure 11. Pearson correlation analysis between heavy metal(loid)s in mine soils.
Minerals 15 00986 g011
Table 1. The concentrations of heavy metals in the mine soils of the study area.
RegionsCodesHeavy Metal Concentration in Mine Soils (mg·kg−1)
CrMnNiCuZnAsCdPb
Turpan1-130.57454.0817.826.4123.394.930.3115.13
1-227.12481.6011.442.1414.452.910.4422.12
1-324.65467.8413.836.6822.026.610.2319.79
Mean27.45467.8414.365.0819.954.820.3319.01
Bazhou2-144.37172.0067.3023.5055.731.6813.8216.88
2-233.03350.8830.8666.2274.9914.782.6312.42
2-357.68227.0466.777.4857.104.142.356.60
2-462.61254.5640.9610.9552.985.492.4817.46
2-553.24928.8032.9823.76544.21752.643.6032.20
2-660.15192.6427.406.4141.9715.900.654.27
2-752.26474.7236.4429.1049.545.260.7513.58
Mean51.91371.5243.2423.92125.22114.273.7514.77
Ili3-142.40144.48634.14234.16180.946.1610.2427.35
3-234.02337.129.042.4019.264.590.4315.71
3-338.45378.4027.934.0124.777.840.2524.25
3-434.02419.6816.234.0119.264.820.3215.52
3-543.38378.4015.434.0120.644.930.2522.12
3-636.48426.5615.965.6123.395.260.2523.47
3-733.03674.2414.906.1422.029.860.3020.56
3-829.58460.9619.9513.6224.774.820.3226.97
3-937.47440.3213.834.5421.335.260.2422.50
3-1036.98419.6821.016.1421.335.150.2422.70
3-1150.291217.7629.79962.27190.588.510.6842.68
3-1252.75268.3218.8910.9548.167.50.7414.94
3-1355.71227.0442.568.8174.99220.980.5617.07
3-1428.59295.8421.2831.7752.297.062.5816.3
Mean39.51434.9164.3592.7553.1221.621.2422.30
Aksu4-160.64309.6027.139.3557.796.834.9117.85
4-223.17192.6416.76436.8139.903.7013.9415.71
Mean42.07215.57226.01226.7792.885.569.7020.30
Construction land standard3.00/150.002000.00/20.000.60400.00
Disclaimer/Publisher’s Note: The statements, opinions and data contained in all publications are solely those of the individual author(s) and contributor(s) and not of MDPI and/or the editor(s). MDPI and/or the editor(s) disclaim responsibility for any injury to people or property resulting from any ideas, methods, instructions or products referred to in the content.